1. Introduction
During the last years, incorporating sustainability into product design has attracted great interest across industries, driven by the urgent need to mitigate environmental impact and support long-term resource efficiency [
1]. This growing emphasis on sustainability has inspired the creation of various design frameworks focused on developing more eco-friendly products. However, even though early design stages have the greatest potential to influence the whole lifecycle of a product, sustainability practices during this stage have not yet become widespread. Many industries still struggle to integrate sustainability early enough in the design process, despite its clear benefits. Environmental issues have been at the center of the majority of design for sustainability (DfS) methods, such as eco-design [
2,
3,
4,
5]. These methods primarily aim to reduce negative environmental impacts, such as resource depletion and pollution. While eco-design is the precursor for reducing environmental impact, it often falls short on addressing broader sustainability aspects, such as economic feasibility and social impact [
6,
7]. Eco-design has been highlighted in aviation-related efforts like Clean Sky 2 and Clean Aviation [
8,
9], where the emphasis has been on reducing carbon emissions and improving fuel efficiency [
8,
9].
While industrial sectors such as building and automotive have recognized the necessity to introduce further sustainability considerations beyond environmental impact, including for example social aspects [
10,
11],the aviation industry has often overlooked these broader dimensions. This gap in consideration remains a key challenge in making the aviation sector more sustainable in a holistic manner. Studies in the aviation research community focusing on conceptual aircraft design have broadened their focus beyond environmental impact assessment to include cost considerations [
12,
13,
14]. These efforts reflect a growing awareness that cost efficiency is crucial for the long-term viability of sustainable aviation. However, particularly at the aircraft level, other factors, including social aspects, are rarely incorporated into the design process [
20].
At the aircraft component level, the majority of design efforts have concentrated on optimizing mechanical performance and weight reduction, which are recognized as vital for improving sustainability [
3,
15]. These objectives are driven by the need to enhance fuel efficiency and reduce emissions, both of which are important for environmental sustainability. Yet only a small percentage of studies have integrated and optimized simultaneous considerations like performance, weight, and costs [
16,
17,
18,
19], or costs and environmental factors [
20,
21]. While these studies contribute valuable insights, they often fail to address the full spectrum of sustainability, leaving social impacts and circular economy aspects largely unexamined. Social factors, when mentioned, are typically only suggested as a procedural step, without fully incorporating them into the design process [
22,
23]. Furthermore, circularity considerations, which are essential for minimizing resource consumption and waste generation, are rarely integrated into the design process. Moreover, when circularity is addressed, it is often narrowly defined in terms of the recyclability potential, rather than broader strategies such as product life extension, reuse, and remanufacturing [
24,
25,
26,
27].
To address these gaps and broaden the scope of sustainability in aircraft design, a more comprehensive approach is required—one that not only minimizes environmental impact but also results in competitive products aligned with holistic sustainability considerations beyond environmental factors. In this frame, the present study introduces an innovative methodology aiming to integrate sustainability practices into the early design stages of aircraft components, advancing previous research of the authors [
26,
28]. The scope is to facilitate a more holistic and sustainable approach, by attempting to quantify sustainability, while bridging the gap between theoretical sustainability methodologies and practical engineering applications. A framework is presented that includes five critical sustainability pillars; mechanical performance, costs, environmental impact, circular potential and social implications, and by using Multi-Criteria Decision Making (MCDM) approaches, a trade-off between these conflicting criteria is achieved. This trade-off is represented by a quantified metric of sustainability, referred to as the sustainability index, which helps assess the overall sustainability of the design and serves as a criterion for design and optimization. A typical aircraft component, namely a hat-stiffened panel, is used to demonstrate the application of the proposed methodology. In this context, multiple material configurations and geometrical modifications are examined, to evaluate the sustainability of design variants through their whole lifecycle and provide the ideal material selection and geometry of the component. Additionally, the impact of the use phase, linked to the type of fuel used, i.e. kerosene or hydrogen, is taken into account. The findings of this study intend to contribute to a paradigm shift within the aerospace industry, encouraging the adoption of sustainable design principles that extend beyond environmental concerns.
2. A Sustainability-Driven Design Methodology
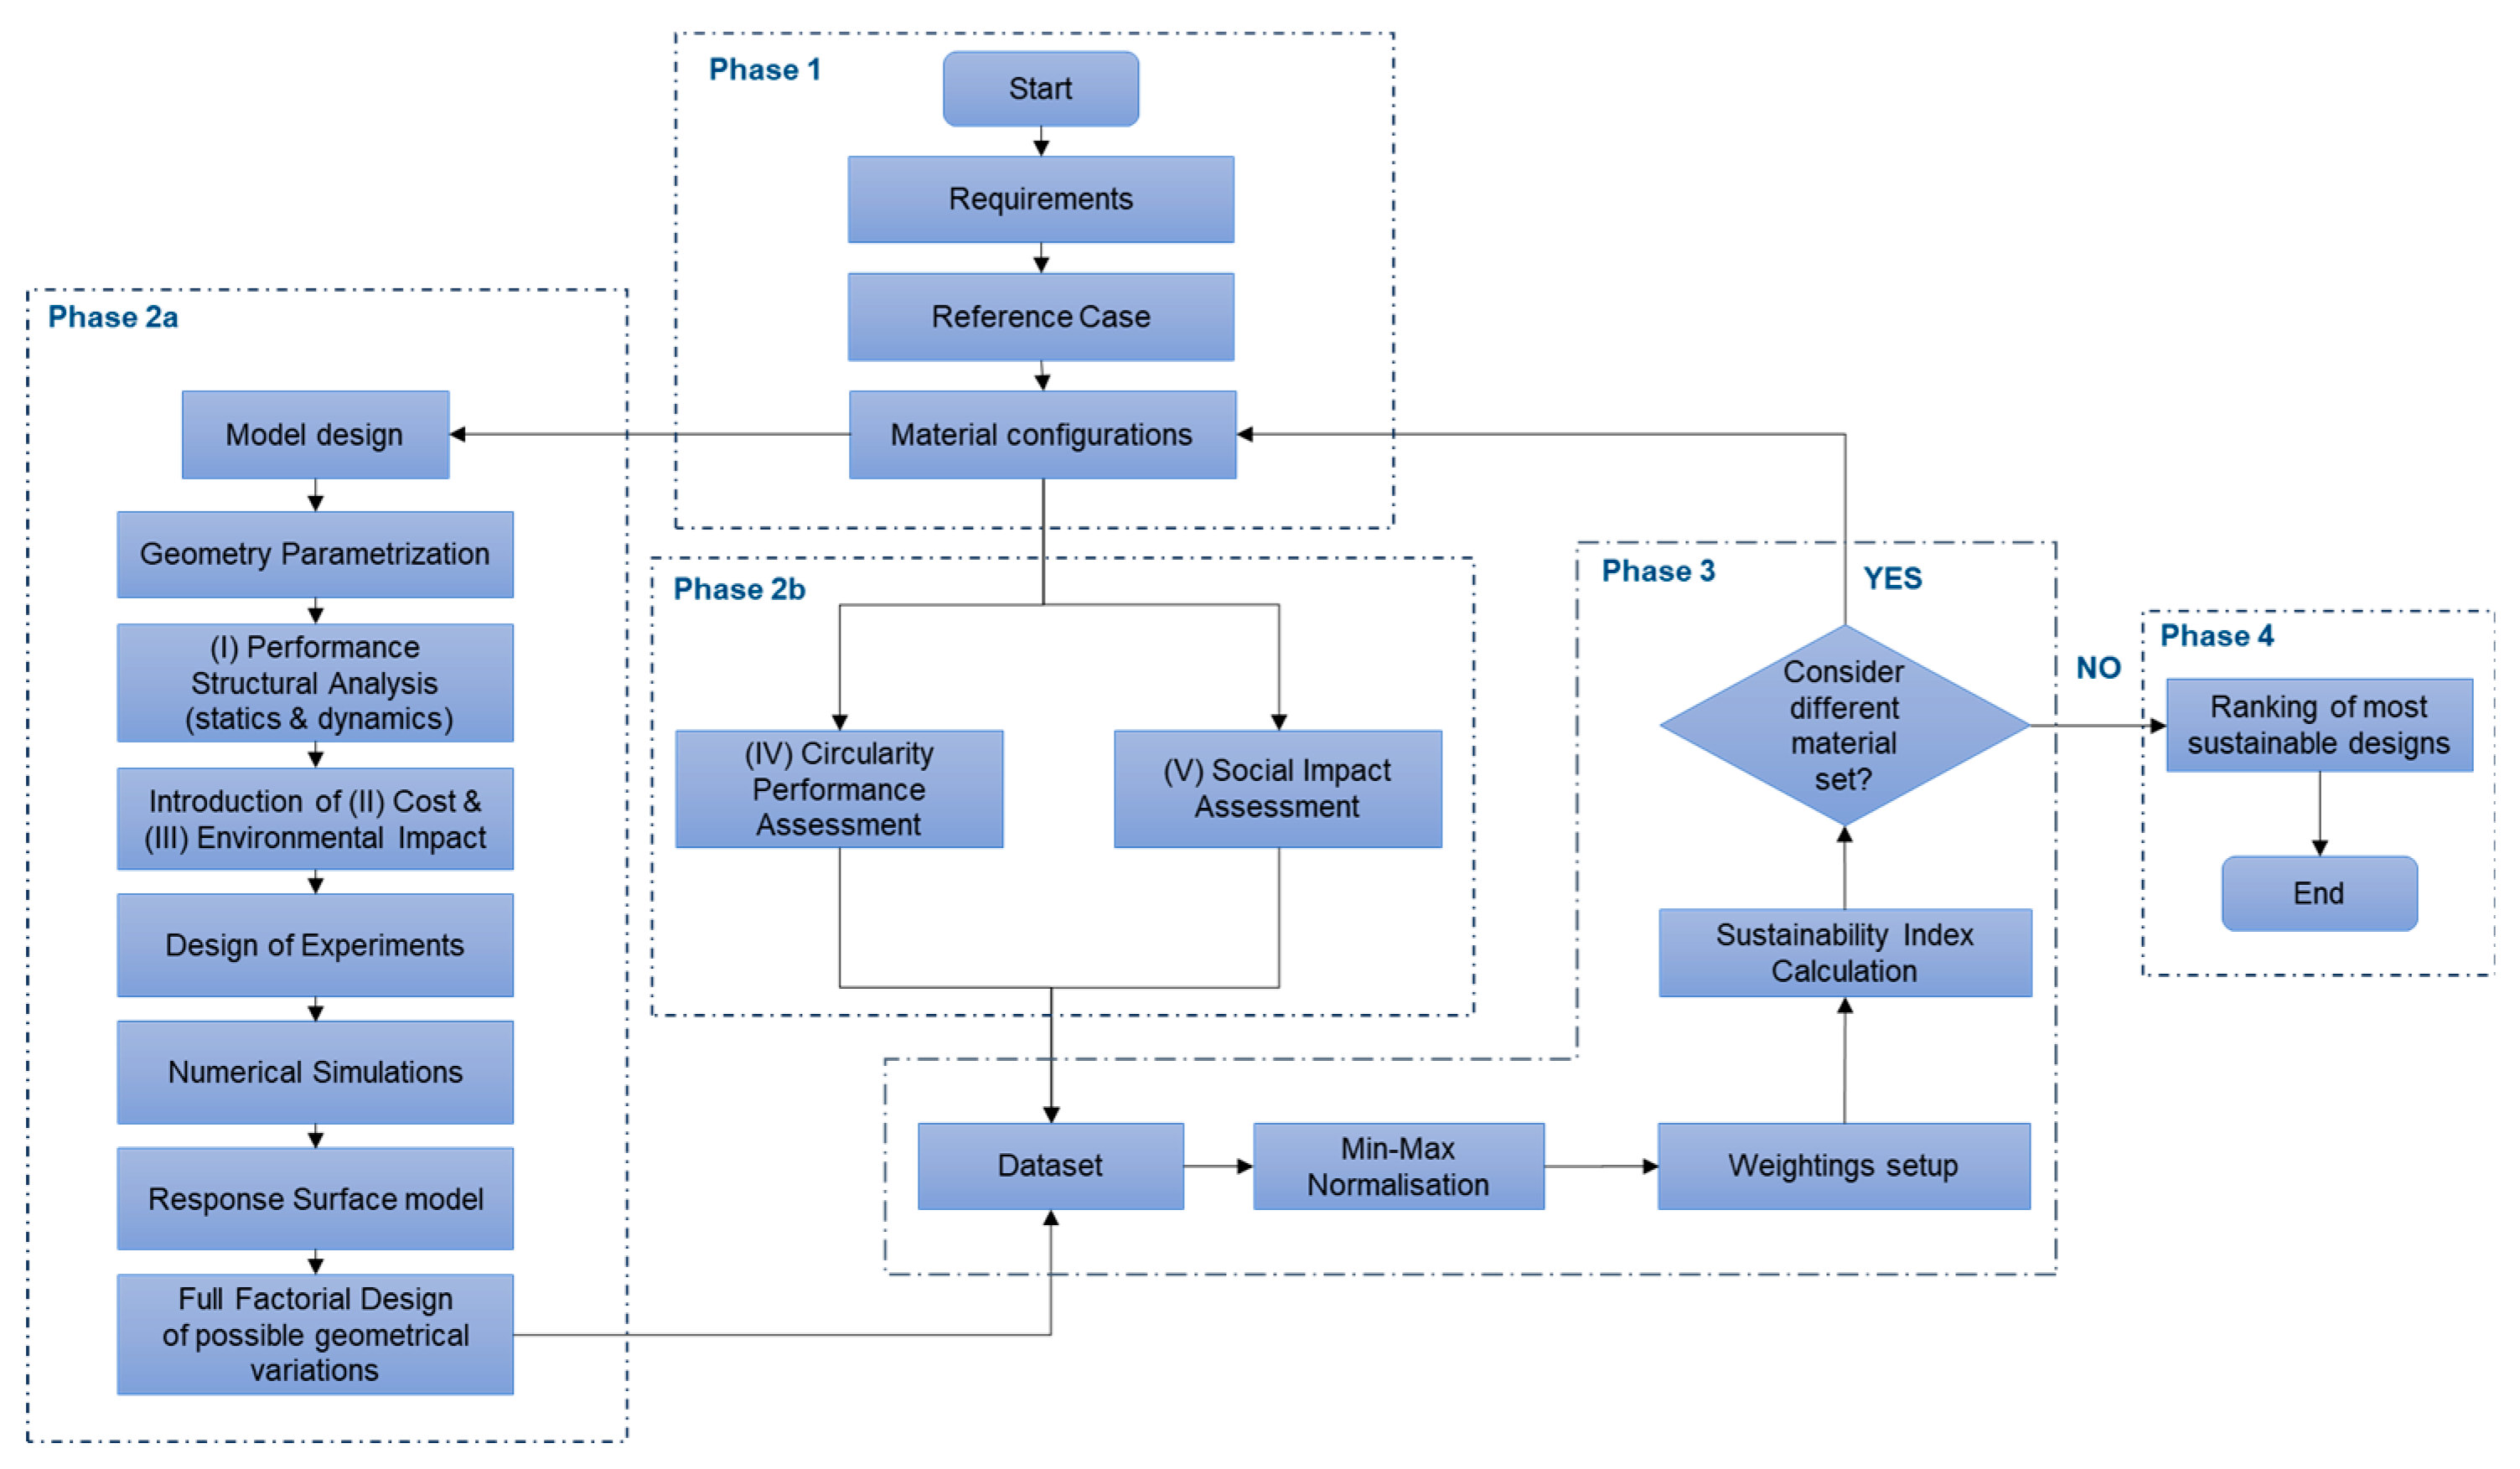
The simultaneous assessment of several sustainability-related criteria, including performance, costs, social impact, environmental impact, and circularity, is at the root of this methodology. In order to obtain the optimal sustainable solution among designs that may feature a variety of geometrical features and material combinations, these, potentially conflicting, criteria demand a fair trade-off, thus optimization techniques and Multi-Criteria Decision-Making (MCDM) approaches are employed. The flowchart of the proposed approach, depicted in
Figure 1, is separated into four distinct phases that are further discussed below. Phase 2 is split into two subphases, Phase 2a and Phase 2b, since the procedures are completed simultaneously.
In Phase 1, the procedure initiates with the identification of the requirements, the selection of the reference case geometry and materials of the aircraft component, along with the material configurations/combinations that will be further assessed. In addition, the boundary and loading conditions are established, along with the parametric design elements, such as constraints, design variables, and parameters that define the design domain.
Subsequently, in Phase 2a, the geometrical parameters to be optimized are selected, along with the mechanical performance output parameters, and the design space to be explored is defined. The design domain is initially explored by conducting a design of experiments. The evaluation of the geometrical variants follows, resulting in the creation of a response surface model. Subsequently, the design domain is re-examined using a full factorial design, taking into account the chosen constraints. This process yields specific optimal geometrical design variants, which are stored in a dataset. In this evaluation, the three pillars—mechanical performance, environmental impact, and cost—are considered, as they are relevant to the geometrical alterations. Mechanical performance metrics are directly derived from the analysis, while environmental impact and costs are indirectly determined, as they are dependent on the component’s mass.
Simultaneously, in Phase 2b, an assessment of the circularity performance and social impact of each material combination occurs, and the relevant data is added to the dataset. These two aspects are optimized separately since they are entirely reliant on the type of materials used and not on the geometrical characteristics of the design.
In Phase 3, a complete set of design alternatives, associated with various material combinations, is generated after investigating each potential material combination. Each sustainability-related criterion is normalized using the min-max normalization method. Then, using a weighted sum approach, specific weightings are assigned based on the evaluated importance of each metric, depending on the respective user, and a sustainability index is calculated.
In Phase 4, the design alternatives are evaluated to determine which one excels in sustainability. A ranking is generated, considering all five pillars with a weighted sum approach, and the user selects the optimal design variant(s) or variants based on their preferences.
2.1. Phase 1- Selection of Reference Case, Parameters and Design of Concepts
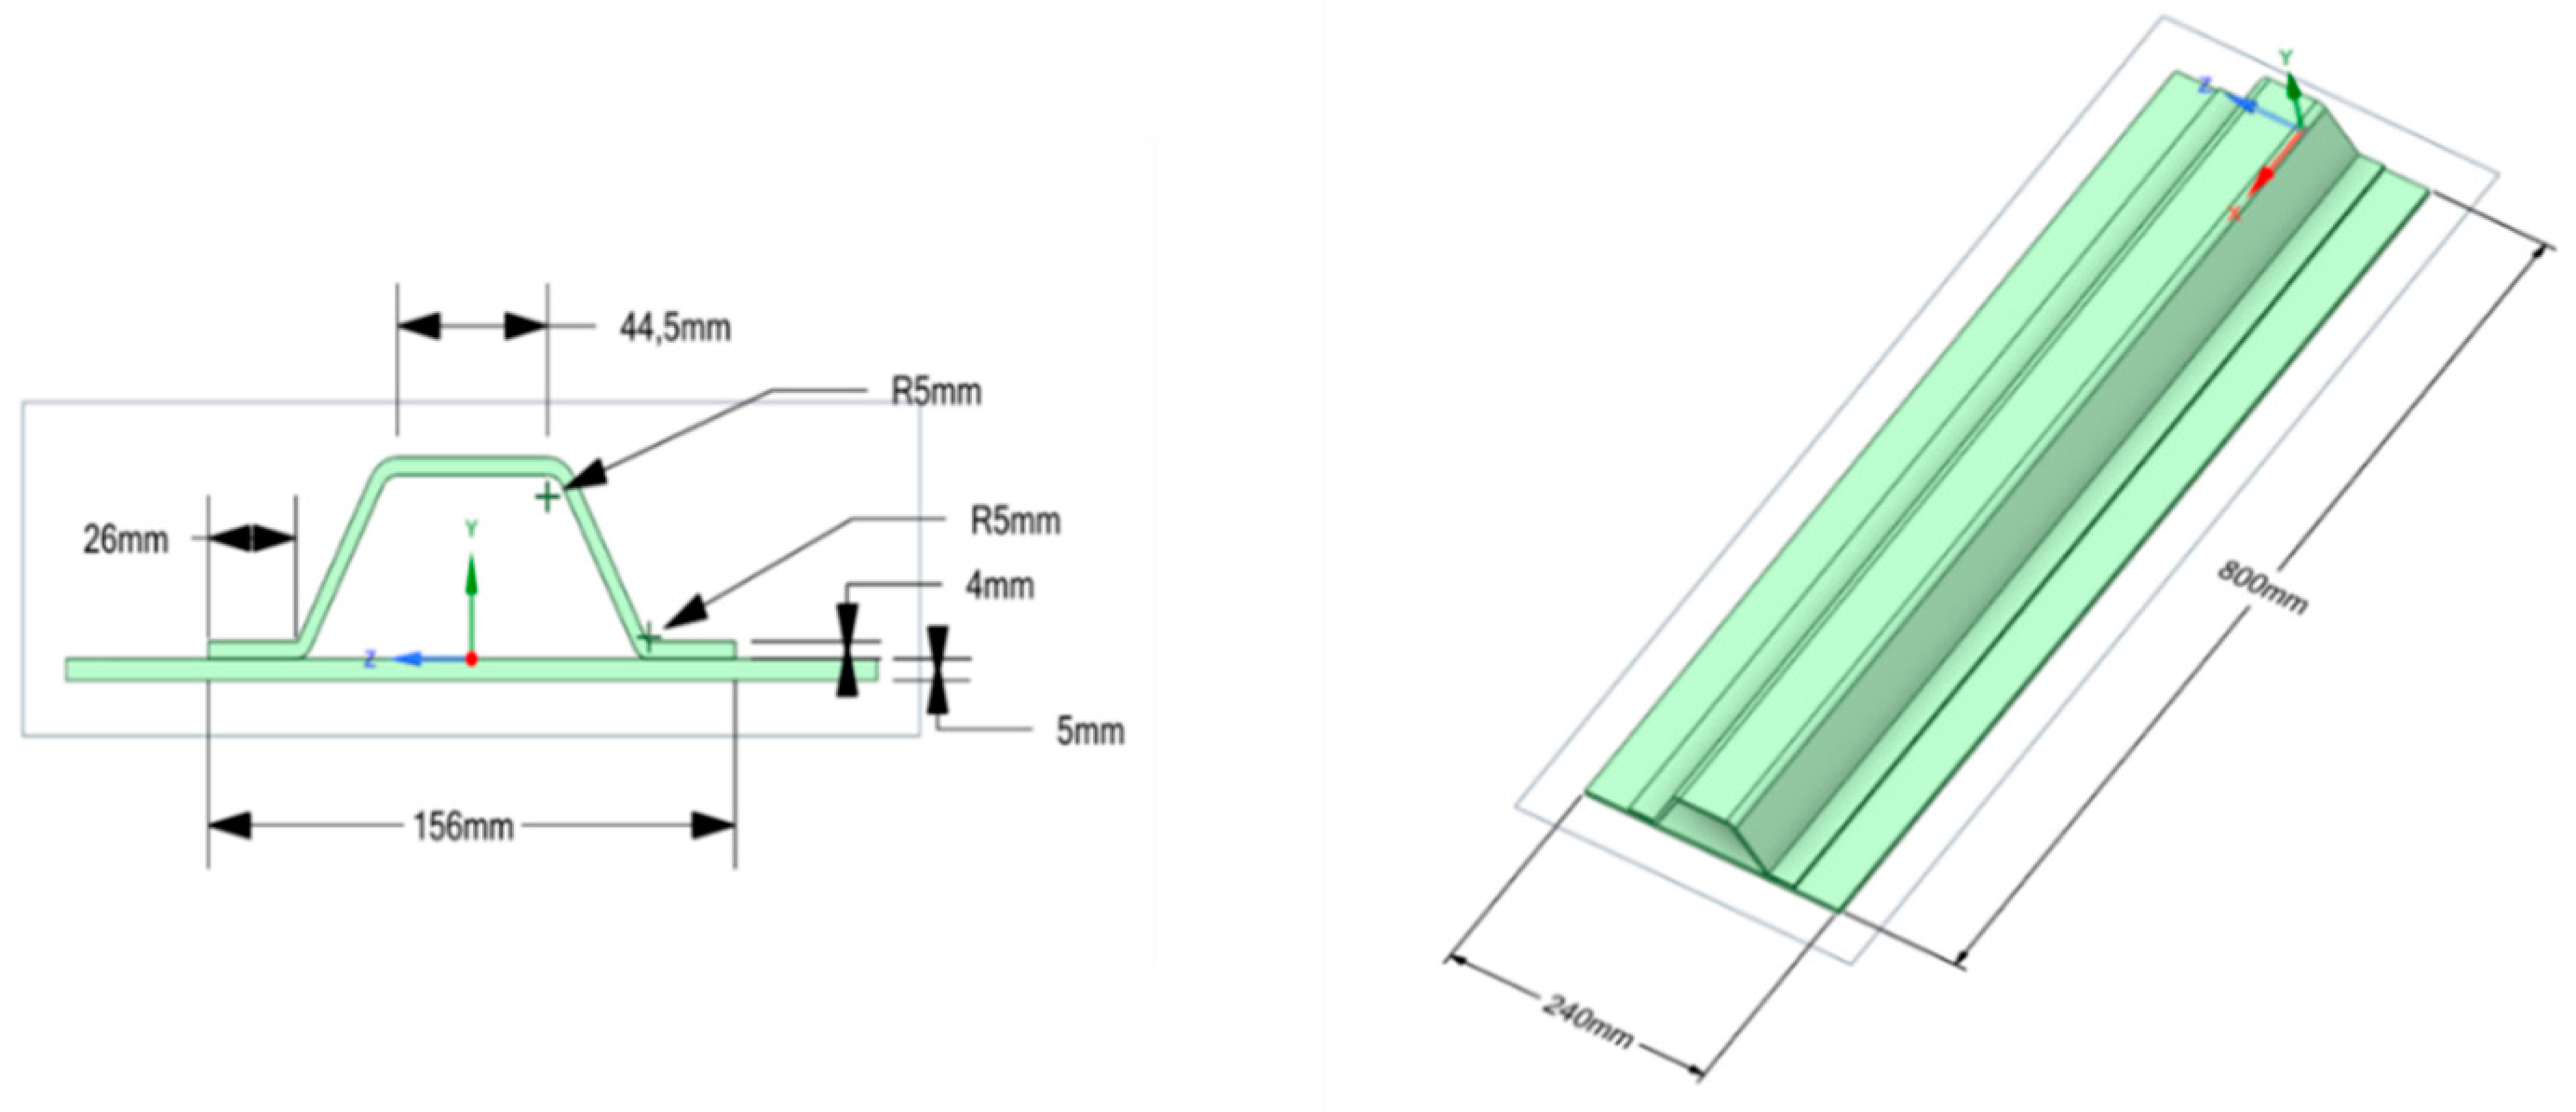
This phase involves defining the problem that needs to be addressed, specifying the geometry of the aircraft component, and designing each individual part. In the present study, a hat-stiffened panel is considered. The exact geometry is displayed in
Figure 2 [
29]. The upper part is the stiffener or stringer, while the lower part is the skin.
Subsequently, the materials to be used are evaluated, considering all potential options for constructing the component [
30].
Table 1 presents all possible material configurations used in this study. The stack-up of the composite materials is [0/45/-45/0/90/0]₂S, with a total of 24 plies of carbon fiber prepreg material used.
Moreover, a reference case is set for comparison reasons. The reference case is a hat-stiffened panel made of Aluminium 2024 T3, wrought, on both the skin and the stringer, displayed as No.1 configuration in
Table 1. The dimensions of the reference geometry are displayed in
Figure 2 [
29]. The thickness of the skin and stringer are 5 mm and 4 mm, respectively. The crown width, which represents the width of the top part of the stringer and is correlated with the distance between the skin's surface and the top of the stringer, is 44.5 mm. Additionally, the reference mass of the skin is 2.66 kg, and the reference mass of the stringer is 1.80 kg.
Consecutively, to provide a detailed and precise analysis, a set of boundaries and loading conditions suitable for the intended application are employed, along with the requirements of the application, the constraints, the design variables and the parameters. Structural requirements include warranting the structural integrity of the component, allowing geometrical dimension modifications, and focusing on retaining the safety factor between 1.15 and 1.5, minimizing total deformation, and maximizing mode 1 eigenfrequency. Furthermore, sustainability requirements are associated with minimizing the environmental footprint, the costs, the social impact, and maximizing the circular performance of the component. All requirements are described in
Table 2. The specific loading conditions are chosen to ensure that the reference material and geometrical configuration achieve a minimum safety factor value of 1.15.
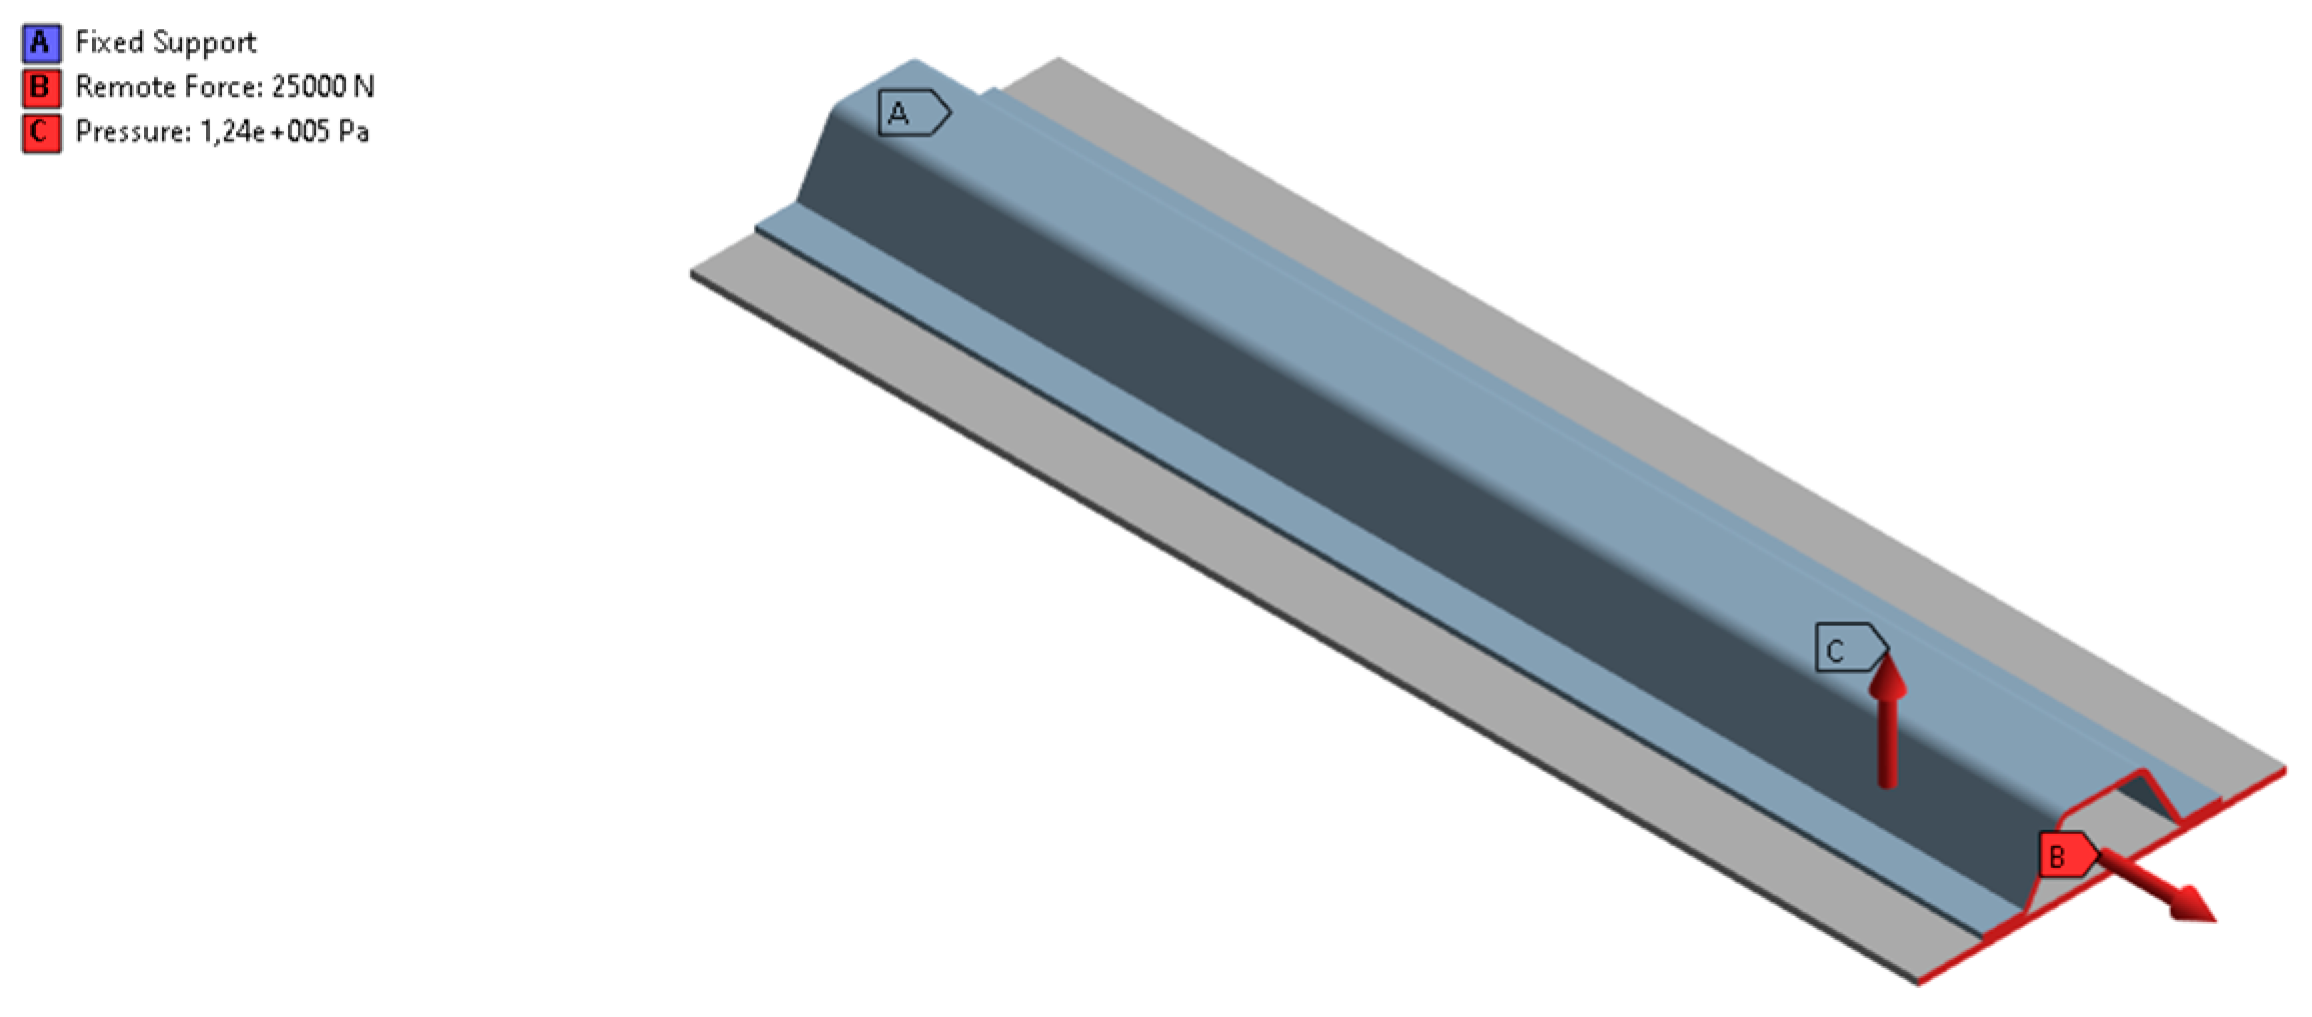
The boundary conditions involve applying fixed supports on the surfaces of one profile of the skin and stringer. The loading conditions include combined loads: a distributed tensile load applied to the surfaces of the opposite profile of the stringer and skin, and a distributed bending pressure load on the bottom surface of the skin. The applied tensile load has a magnitude of 25,000 N, and the pressure load is 124,000 Pa. Both the boundary and loading conditions are displayed in
Figure 3.
Afterwards, a parametric design approach is carried out to determine the optimal design points based on the factors outlined in
Table 2. The design variables comprise the thickness of the skin, the thickness of the stringer, and the crown width, while the design parameters include total deformation, mode 1 eigenfrequency, and the masses of the skin and stringer for each specific case.
For the development of the parametric simulation model, the finite element analysis software Ansys [
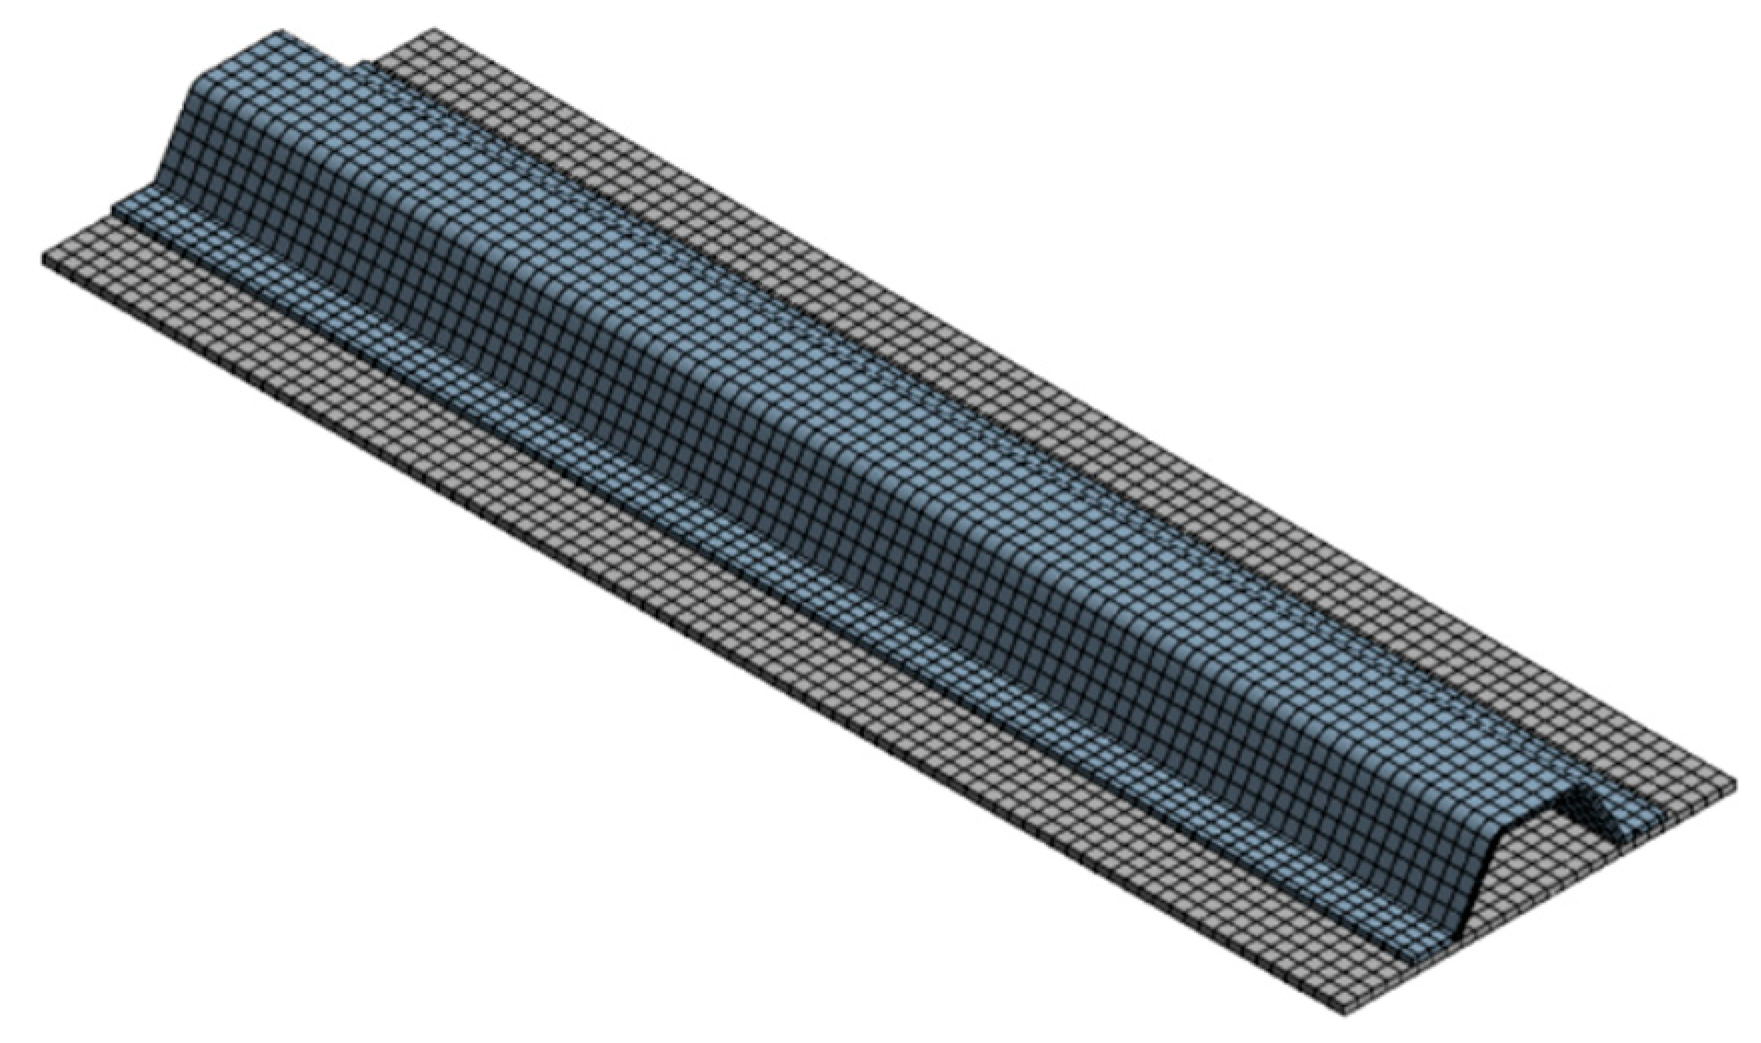
31] was used for the investigation of the static and dynamic behavior of different design variants. This process enables the creation of a finite element model with parameters defining the material type and thickness for each stiffener component. When metal materials are used, both the skin and the stringer are discretized using 2,403 Hexa/Prism finite elements of quadratic order, following the MultiZone method. In contrast, for composite materials, the skin and stringer are discretized with 4,806 Quad/Tri elements using the MultiZone Quad/Tri method. The finite element analysis for composite materials employs twice the number of elements because composite structures consist of laminas and require stackups with multiple ply orientations, where each stackup is discretized separately. A convergence study was performed to determine the optimal number of finite elements for this application. The mesh is uniform, free from inconsistencies or sharp angles, as shown in
Figure 4, which presents the mesh for the reference case.
2.1.1. Design Domain Investigation
A Design of Experiments (DOE) was conducted for each of the six material configurations using the Central Composite Design method, estimating several design points with varying geometrical configurations. Subsequently, a Response Surface Method (RSM) was applied, employing genetic aggregation algorithms to evaluate numerous geometric designs based on the pillars of performance, cost, and environmental impact within the designated experimental domain [
32,
33]. Each material configuration yielded a unique RSM model, including equations that related the input parameters to the outputs. These response surfaces were then introduced into the Simulink software [
34], as FMU files for simulation and model-based design purposes. Specific sampled geometrical designs were obtained and combined using a Matlab [
35] script to perform a full factorial design of experiments (FFDOE), creating multiple design variants. The constraint for the safety factor, which ensured compliance with mechanical performance rigidity requirements, limited the possible output design variants. Constraints and objective values were established during optimization to guide the process toward achieving the desired objectives.
2.2. Phase 2 – Definition of Sustainability Pillars
In the parametric design model, three of the five investigated pillars—mechanical performance, cost, and environmental impact—were defined by geometric design variations and material properties. Geometric modifications, such as the thickness of the skin and stringer and the crown width, regulated the mechanical performance parameters. Meanwhile, the masses of the skin and stringer, when multiplied by the appropriate coefficients, determined the cost and environmental impact parameters. The remaining pillars, Circularity and Social Impact, depend exclusively on the material properties.
2.2.1. Mechanical Performance Assessment
When assessing sustainability, the component's durability, structural integrity, and functional requirements must be non-negotiable. Therefore, specific constraints ensuring the structural rigidity of the component, along with operational requirements, need to be considered. The safety factor ensures that the structure remains intact under specific loading conditions. For configurations using metal materials, whether for the entire component or a specific part, the safety factor is calculated using the Von-Mises theory [
36]. In contrast, for cases where composite materials are used for a part or the whole hat-stiffened panel, two failure criteria are applied: the Maximum Stress Failure Criterion and Cuntze’s Failure Criterion [
37,
38].
The parameters of Total Deformation and Mode 1 Eigenfrequency represent the mechanical performance pillar and are evaluated during the static and dynamic analysis stages of the design. These parameters are specific to each design variant and are influenced by the component's dimensions and the loading conditions it experiences. Since the mechanical performance pillar (P) is defined by two parameters, it is calculated as the average of the normalized values of these parameters, as shown in Eq. (1):
Where
is the Performance Pillar,
is the normalized value of the total deformation, and
is the normalized value of the mode 1 eigenfrequency.
2.2.2. Costs Assessment
The whole processing chain has a direct impact on the cost of a manufactured component. Factors such as the cost of raw materials, the size and complexity of the part, the manufacturing processes involved, and the recyclability of the part all influence the final cost and should be carefully considered. Additionally, electricity and fuel consumption during manufacturing and/or recycling play a crucial role in determining both high compliance costs and opportunities for cost-efficient innovations, especially in the production of durable components [
39]. Therefore, the costs pillar of the holistic sustainability index includes the aforementioned factors in this study. It is important to note that the final cost of each part represents an average value, and only a primary process is considered for each material case. As indicated in Eq. (2), the Cost pillar is described as the sum of the cost coefficient multiplied by the mass of each individual part of a component. Each part is made from a single material, which determines both its weight and the corresponding cost coefficient. The part cost coefficient (cost) depends on the selected material and is partially obtained using the Part Cost Estimator Tool from Ansys Granta [
40].
Where i=1,…,.k is the number of parts for each component, m is the mass of the part/dependent on the material, and cost is the cost coefficient associated with the life cycle of specific material of the component.
Primary processes and disposal methods assumed for each of the four materials used in the design are displayed in
Table 3.
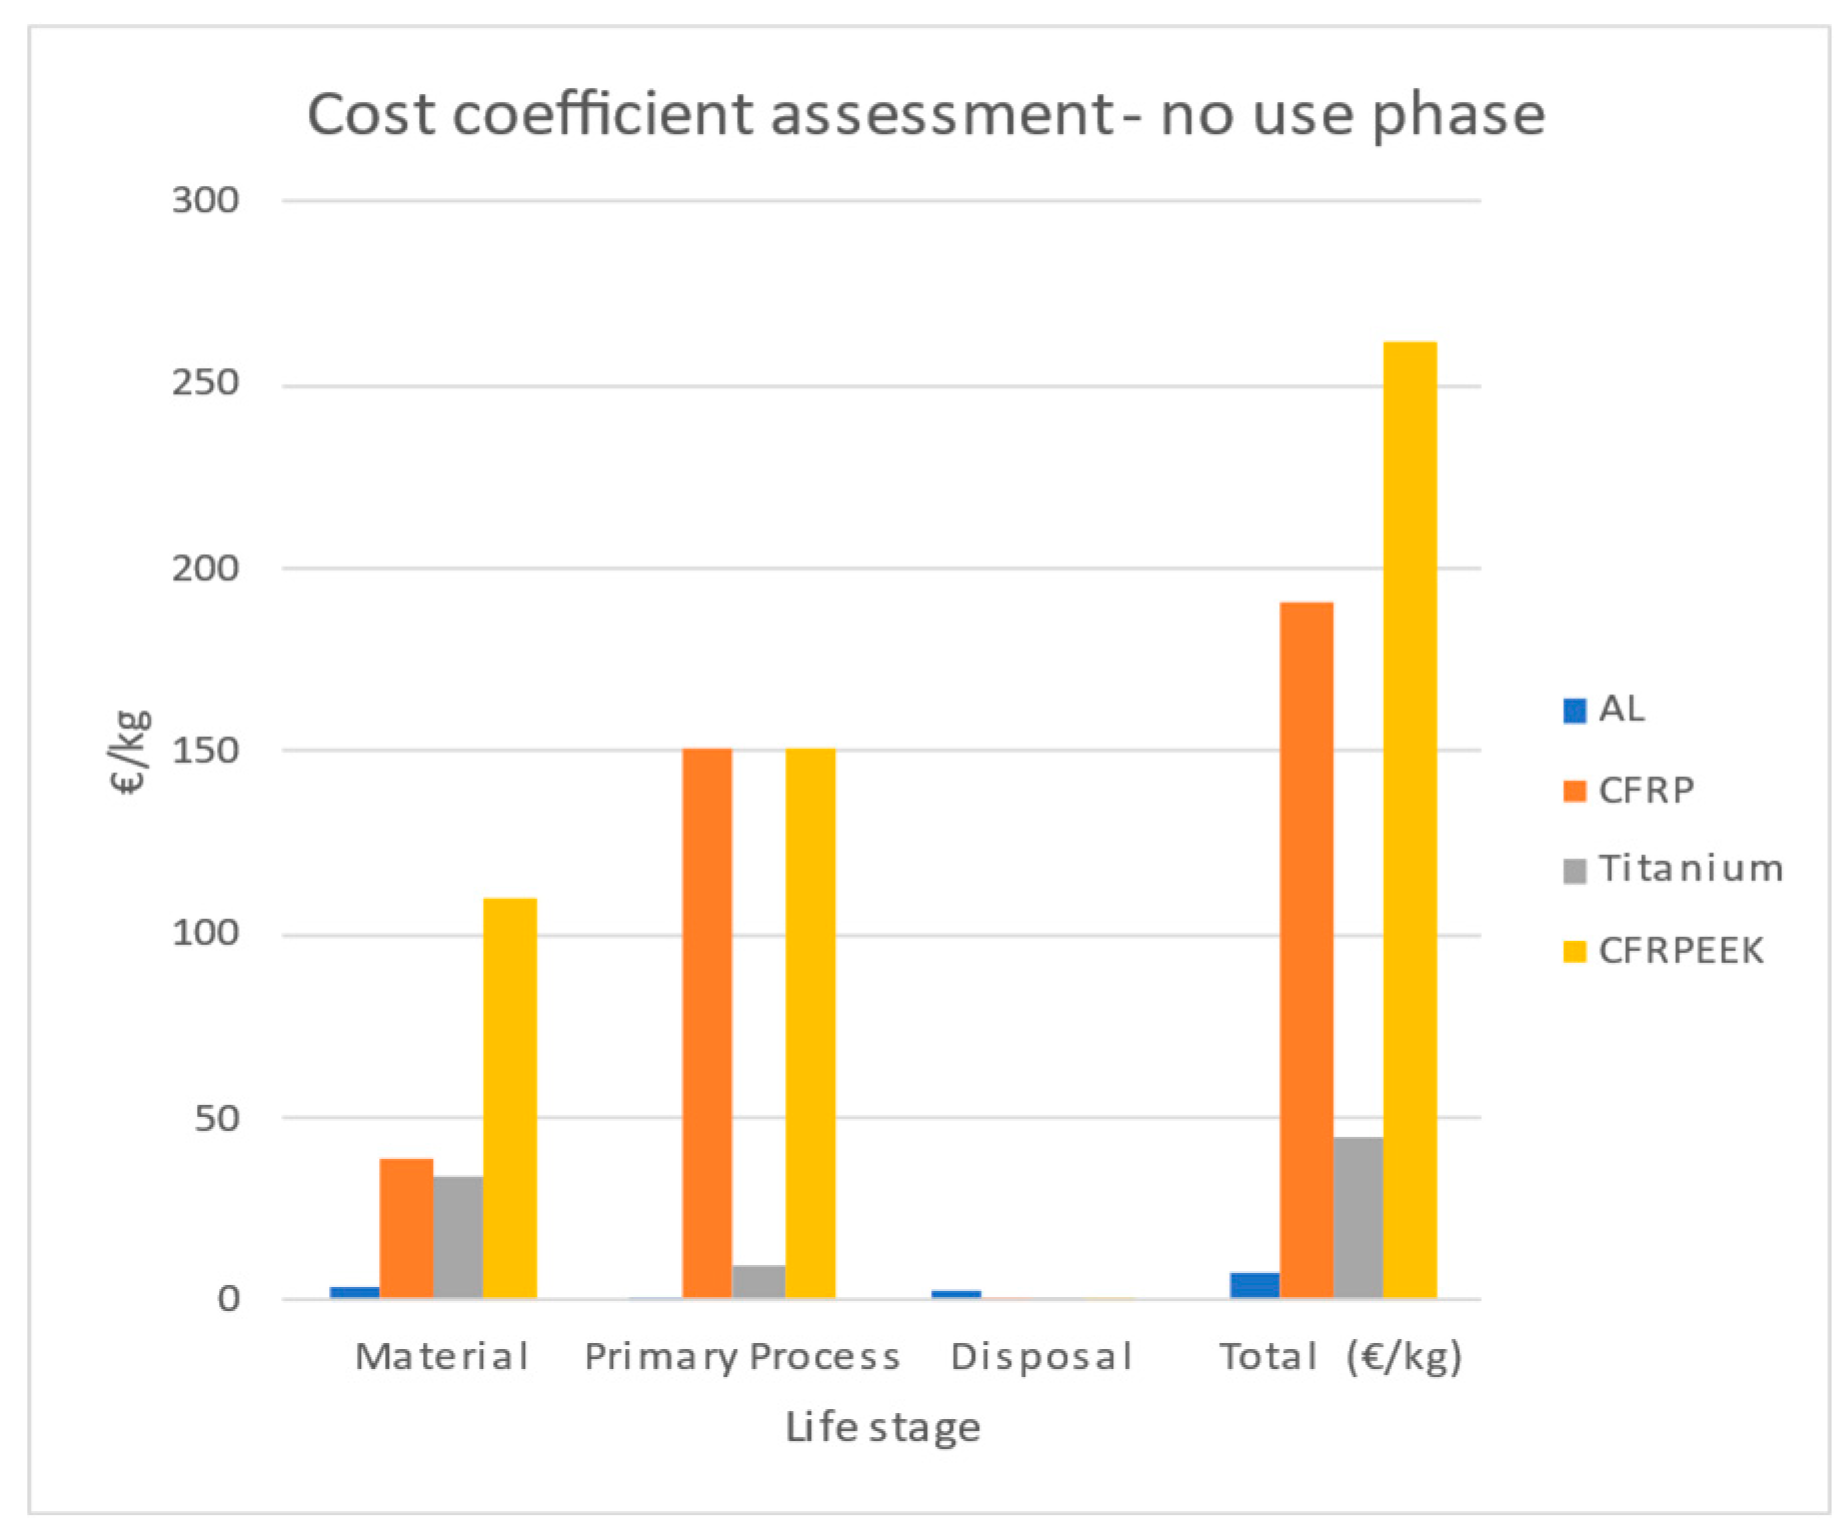
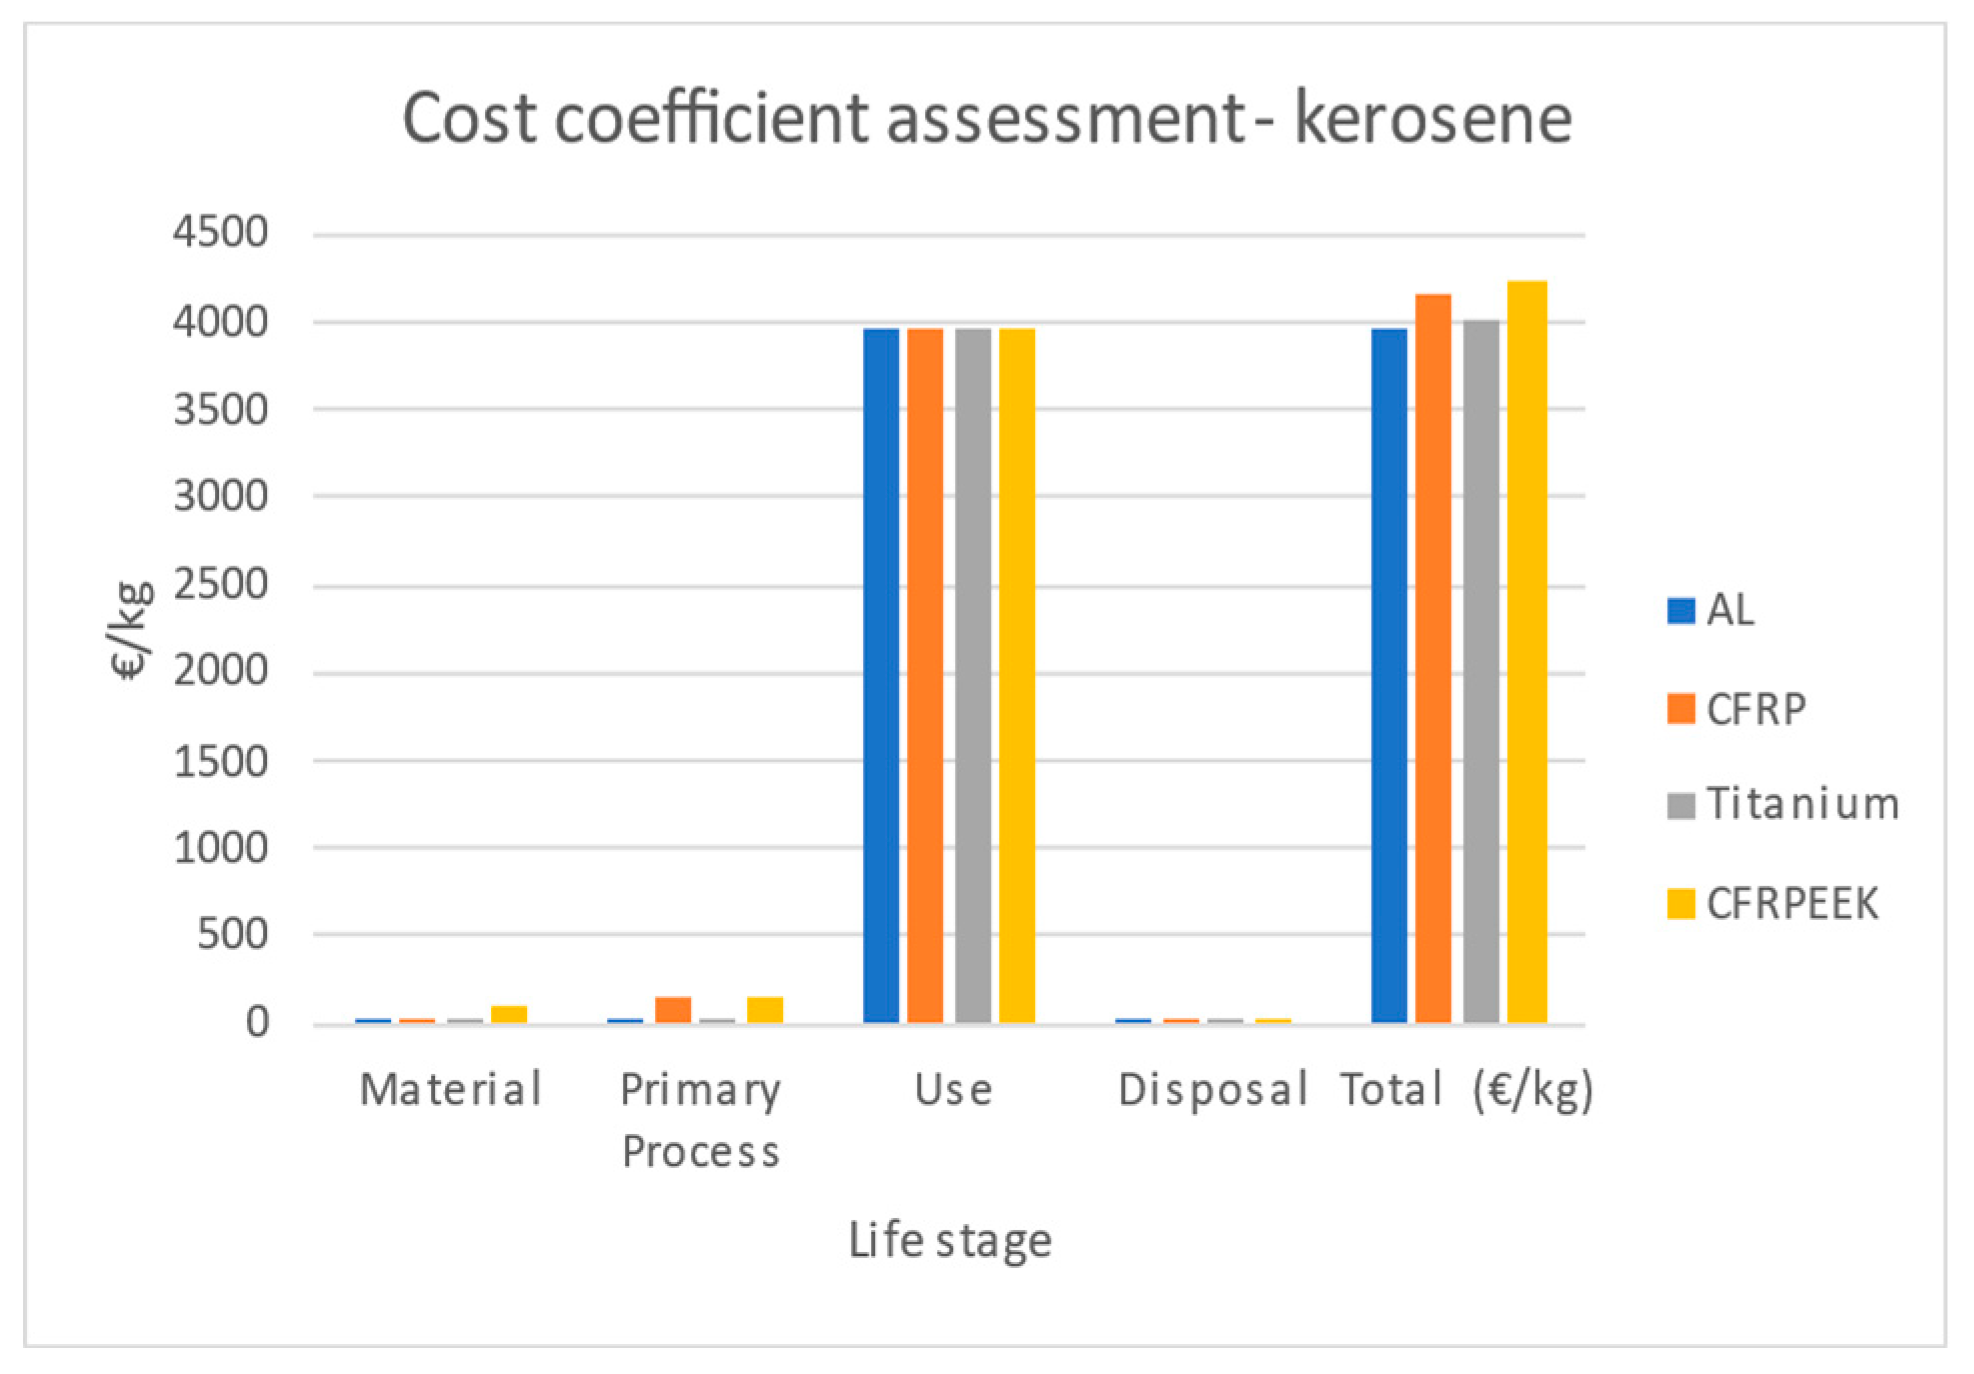
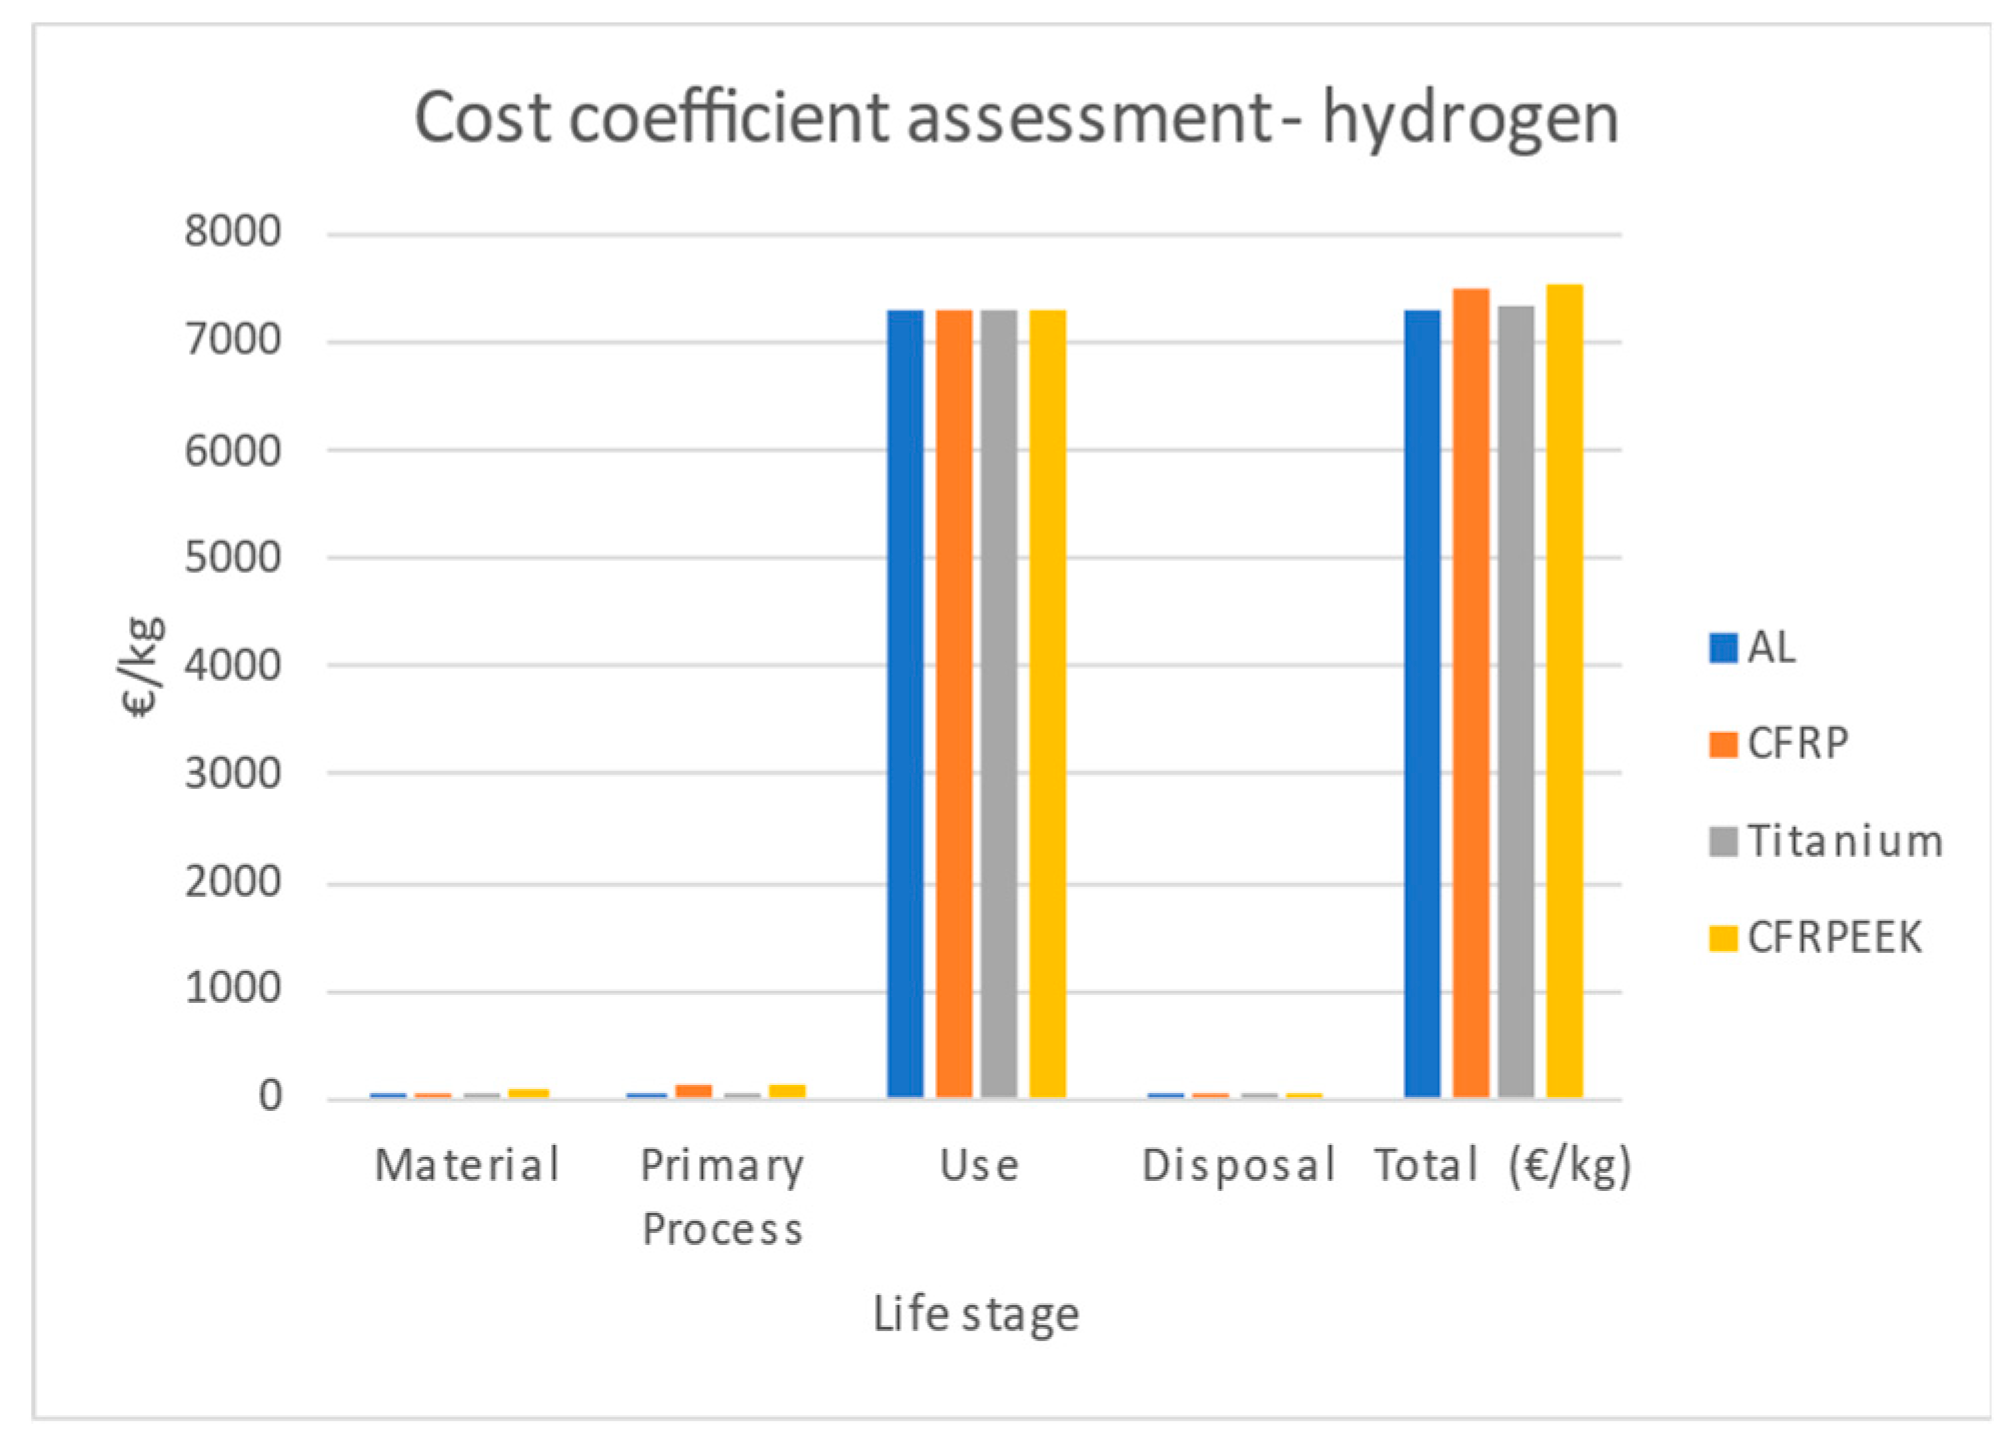
In addition, for the use phase, since the part is an aircraft component, it is necessary to calculate the aircraft's lifetime and account for fuel costs. The aircraft is assumed to be a short-haul model, operating 300 days per year, traveling a distance of 6,000 km per day, with a lifetime of 25 years. The fuel costs for Kerosene and Hydrogen are respectively 8809∙10^(-8) €/kgkm and 162∙10^(-6) €/kgkm [
41,
42,
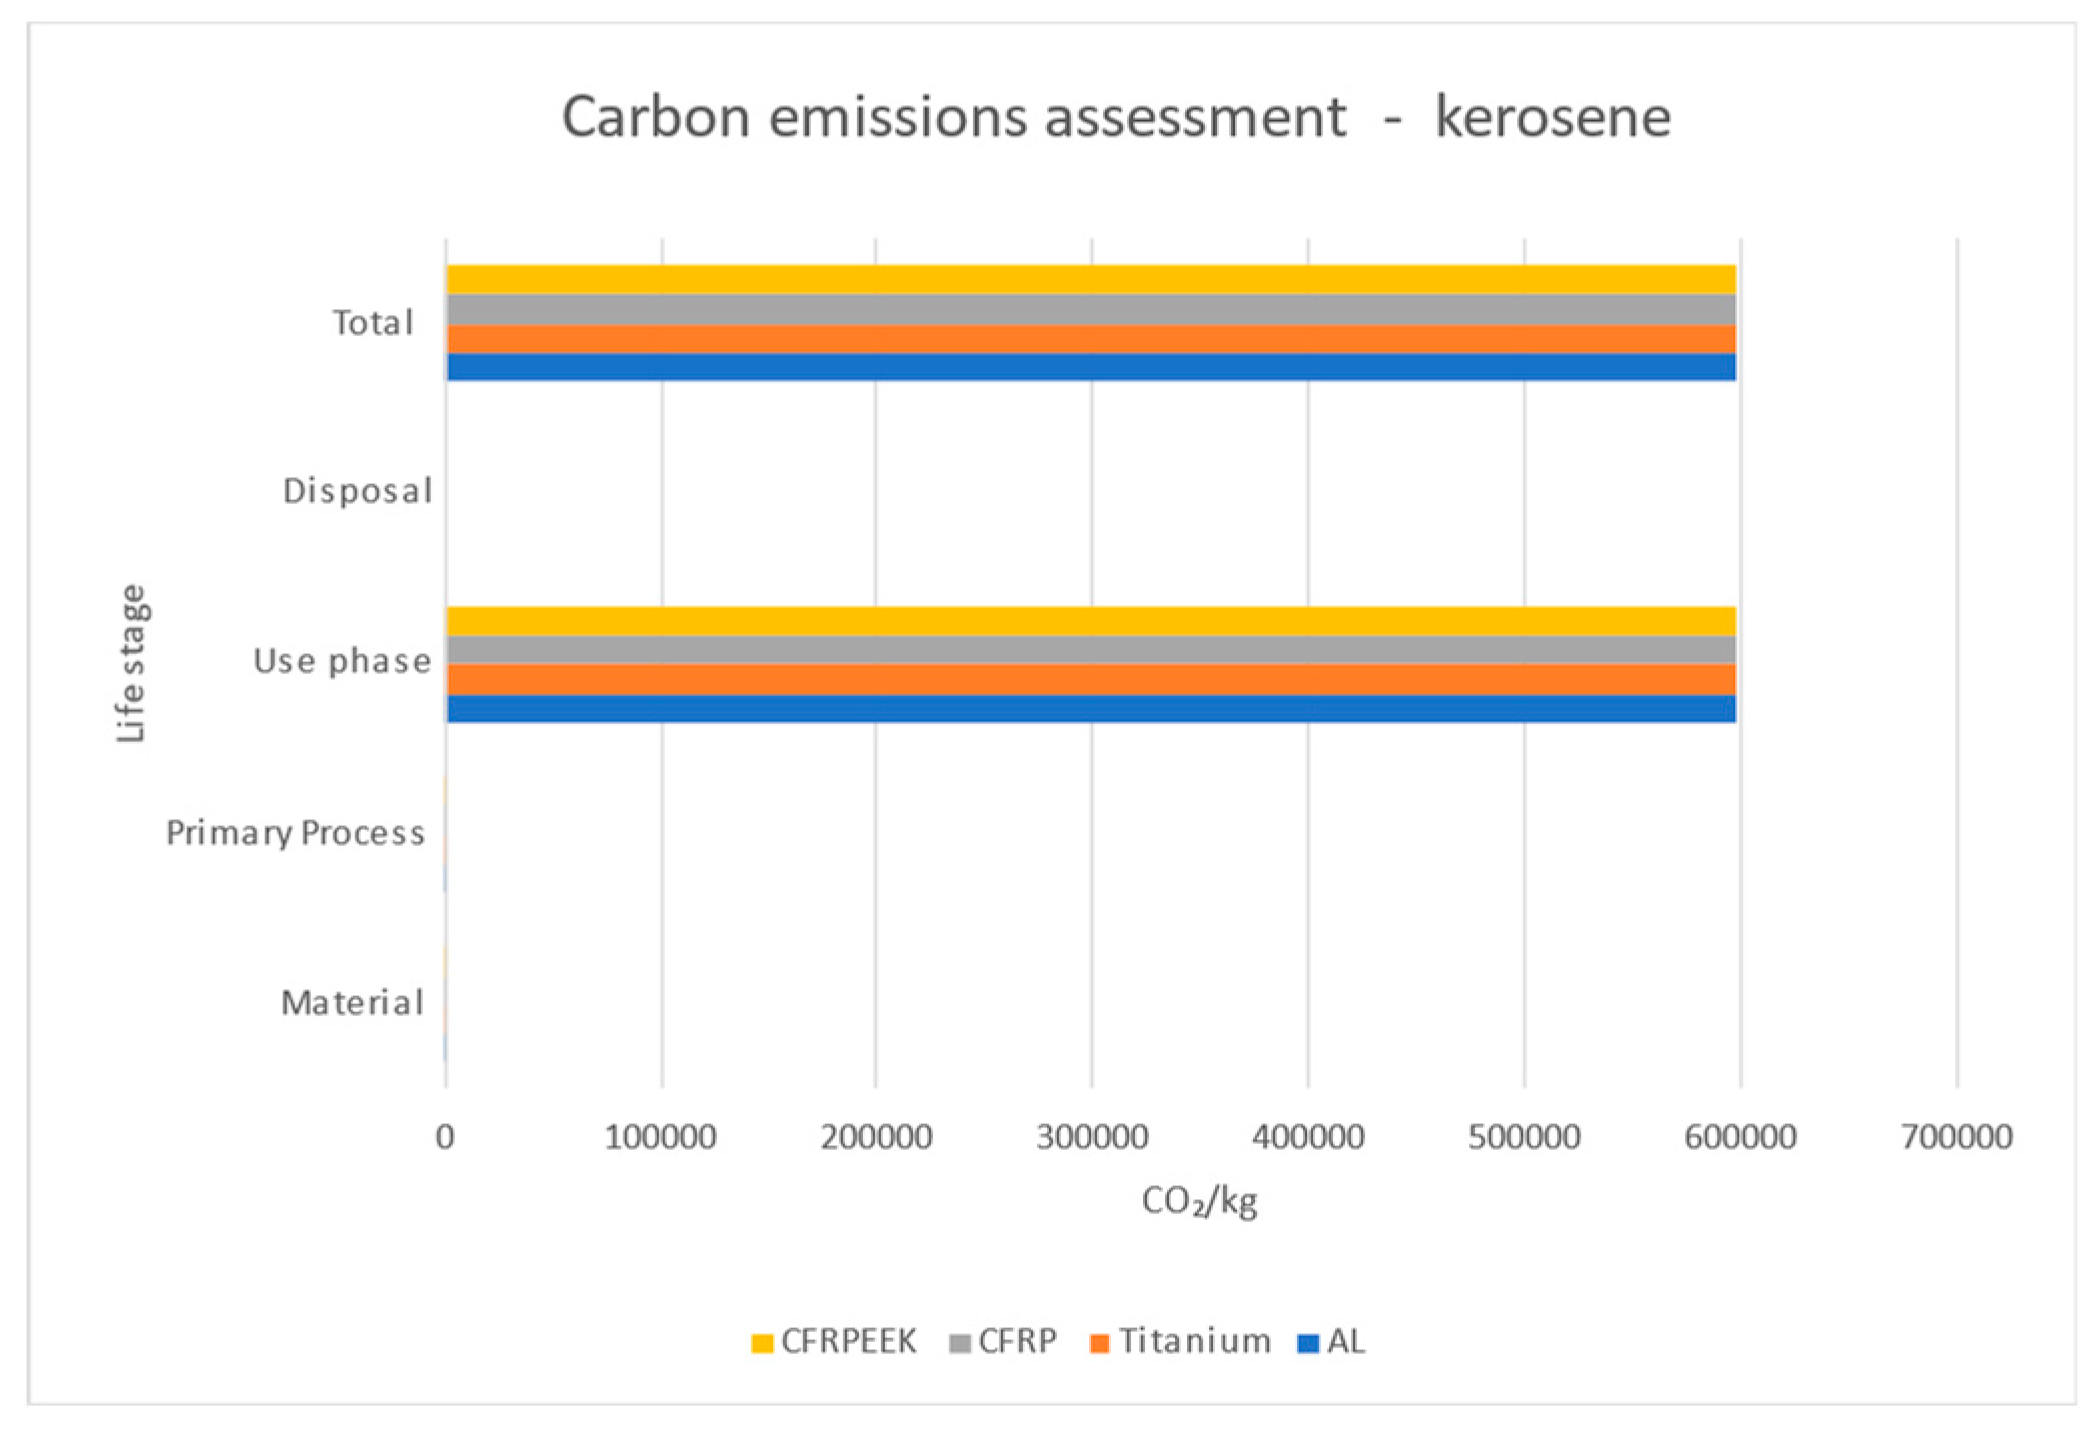
43]. Thus, the cost coefficient is calculated for each material based on the use phase scenario. The bar charts in
Figure 5,
Figure 6 and
Figure 7 demonstrate the impact of each life phase of the materials on the cost coefficient. When excluding the use phase, the cost impact of the primary manufacturing process is the most significant, followed by raw material costs and disposal costs. CRFRP thermoplastic exhibits the highest total costs, followed by CFRP thermoset. When accounting for the use phase, it becomes clear that this phase dominates the overall cost impact. Since, in the use phase, only the weight matters and not the material type, the use phase impact per kilogram is the same for all materials. However, when considering the other life phases, the total costs are comparable. The exact use phase costs, though, must be calculated based on the specific function and mechanical properties of the materials, a factor that is addressed in the subsequent sustainability analyses.
2.2.3. Environmental Impact Assessment
Carbon emissions have a significant impact on the environment. The increasing concentration of CO
2 in the earth’s atmosphere is considered the primary driving factor for the rise of global warming. The main source of carbon emissions is energy production, thus energy expenditure required for the life cycle of a product plays a major role in environmental impact. In this study, environmental impact is measured by a parameter that is obtained from the sum of each component parts’ mass (m), and the corresponding carbon dioxide emissions CO
2 over the course of each part’s material life cycle, as shown in Eq. (3). This assumption is made without loss of generality. Carbon dioxide emissions are calculated based on the global warming potential (GWP), initiated by IPCC [
44]. The procedure would not be altered by the inclusion of other types of emissions, such as methane CH
4, as long as they are reported as carbon dioxide equivalents in order to be comparable to the effects in global warming [
45]. The materials' phases of manufacture, transportation, use, and disposal are included in the carbon footprint assessment. If the material is used in a vehicle application, such as an aircraft, the fuel consumption over the vehicle's lifespan is also considered [
27,
46,
47,
48]. Specific assumptions were necessary to obtain characteristic estimates for the CO
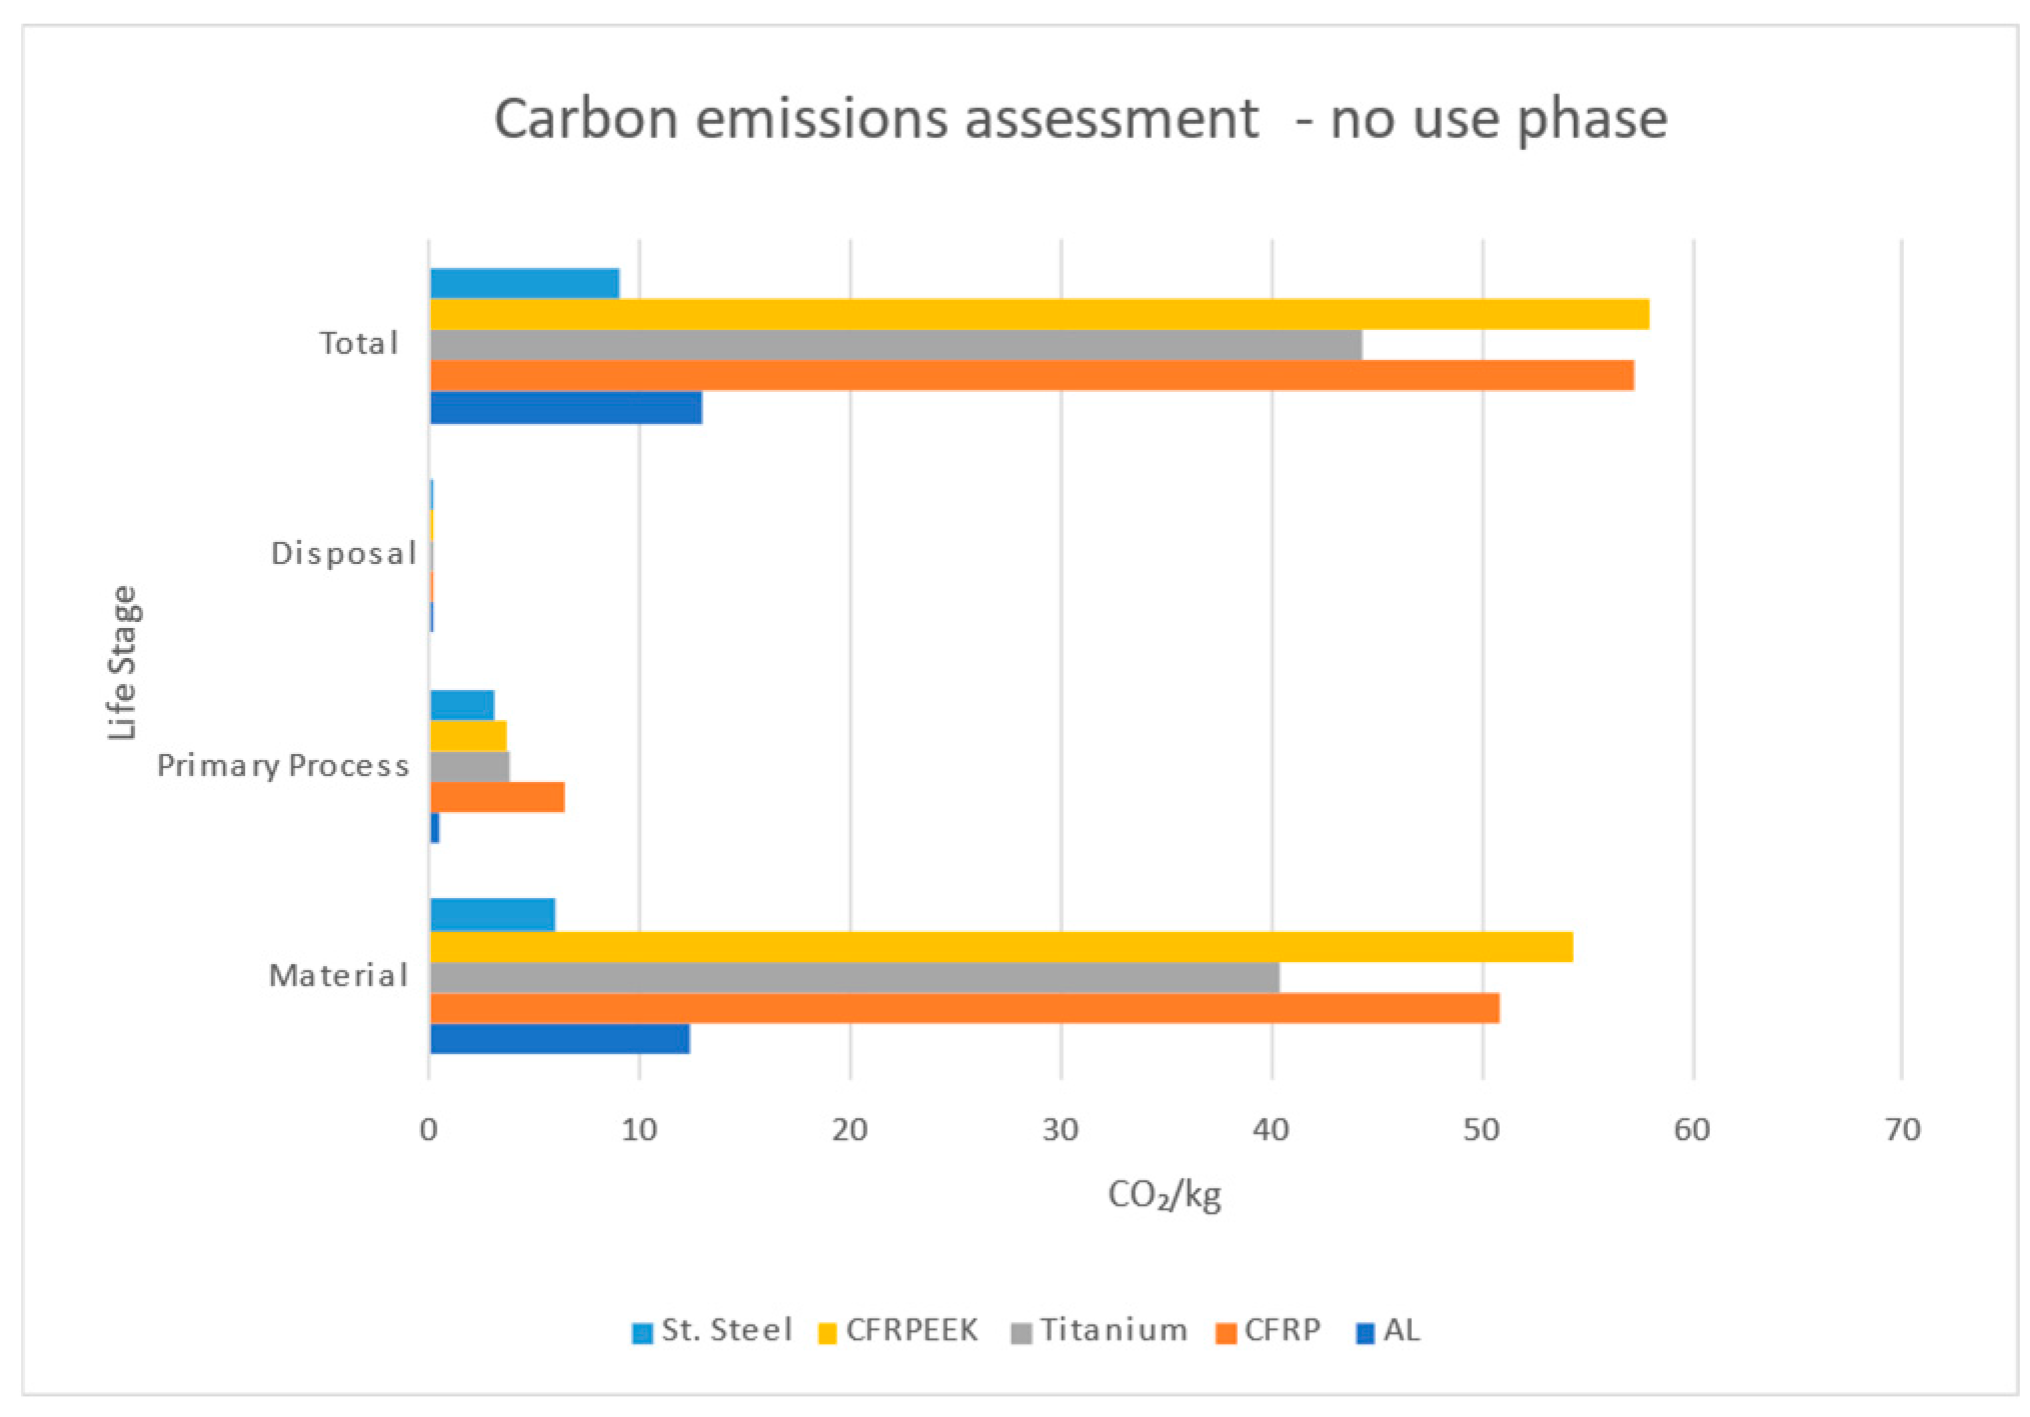
2 emissions coefficient of each part. Therefore, only virgin materials were used for these calculations, with each material undergoing only a primary process. The use phase was calculated based on the fuel used for a short-haul aircraft. The primary and disposal processes for each material were outlined in
Table 3, and the use phase was divided into three scenarios. The assessment was carried out using Ansys Granta’s Eco Audit Tool [
40].
Where n is the number of parts for each component, m is the mass of the material(s), and CO
2 represents the carbon dioxide emissions associated with the life cycle of the specific material of the component.
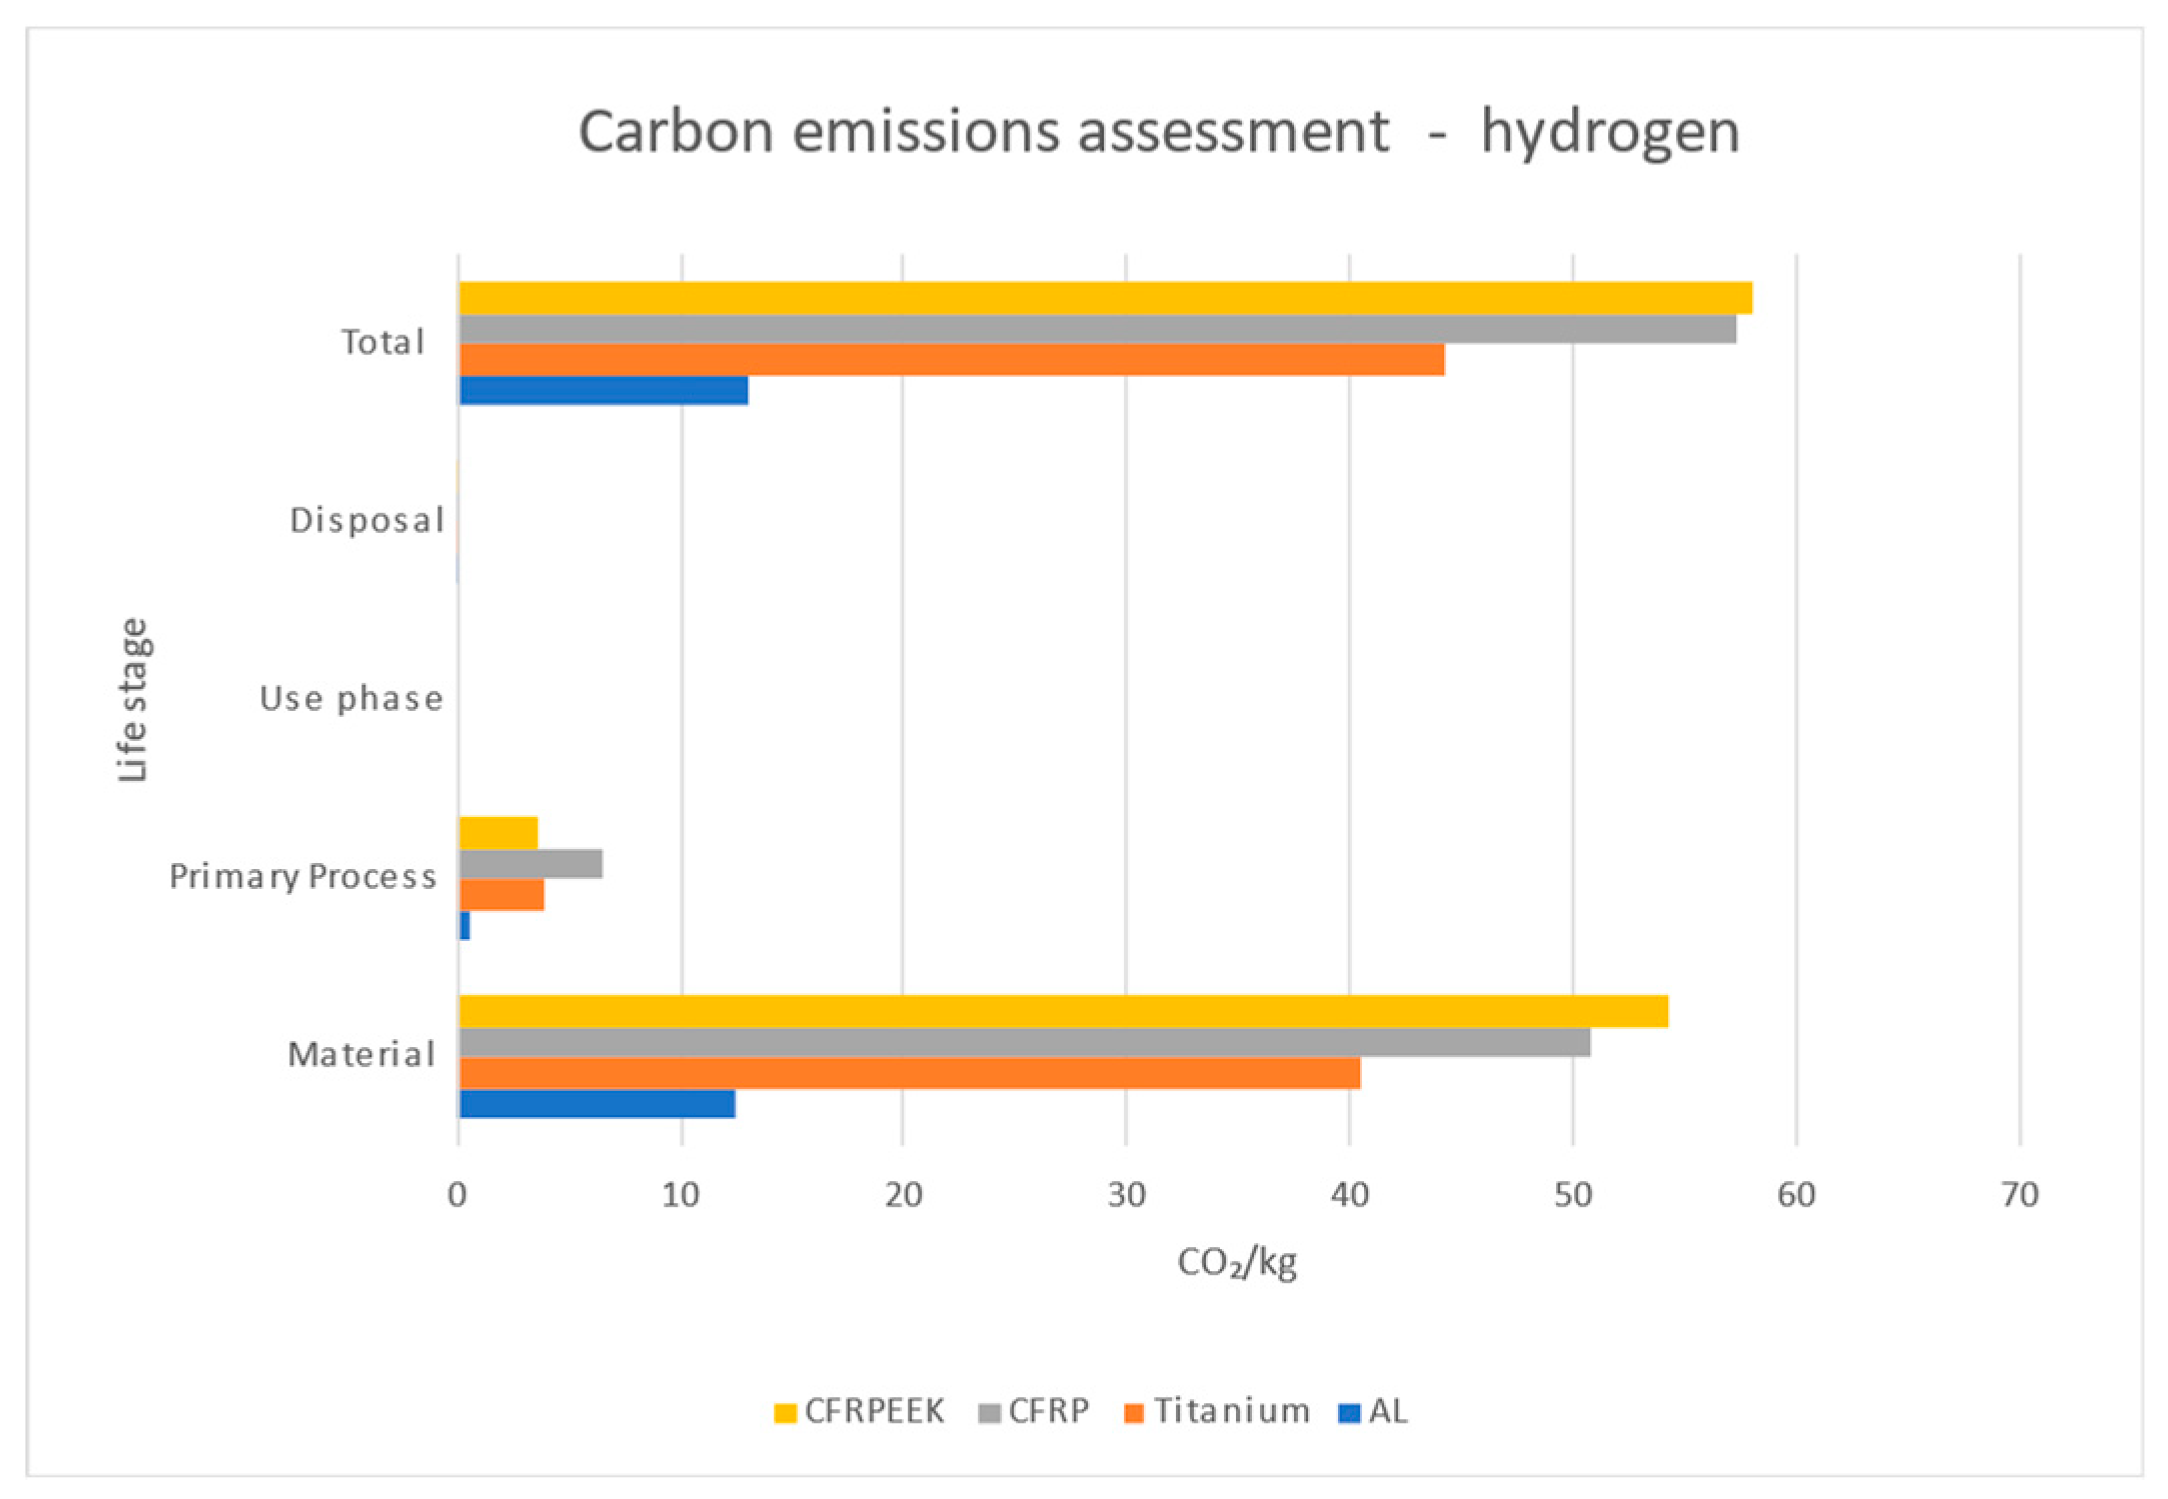
Figure 8,
Figure 9 and
Figure 10 showcase the CO
2 emissions coefficient assessment: excluding use phase, considering kerosene as the aircraft fuel, and considering hydrogen as the aircraft fuel, respectively.
As with costs, the material with the highest environmental impact is CFRP thermoplastic, followed closely by CFRP thermoset, and then titanium. The raw material production phase has the most significant environmental impact, followed by the primary manufacturing process. When accounting for the use phase, where kerosene is used, the use phase dominates the environmental impact, with the other life cycle phases being negligible in comparison. However, when hydrogen is considered as the fuel in the use phase, with zero CO2 emissions, the environmental impact from raw material production and manufacturing becomes the dominant factor. While CO2 is the most significant contributor to global warming, for completeness, the impact of NOx and contrails on global warming should also be considered, although the effect of contrails on climate change is still under investigation. In the subsequent sustainability assessment, the effect of the component's weight is also taken into account to ensure a realistic sustainability comparison.
2.2.4. Circularity Performance Assessment
Current circularity indicators focus on material recyclability and sustainability through methods such as reuse, repair/remanufacture, and waste management. However, defining metrics to measure a material's reuse and repair, without loss of generality, remains challenging [
49,
50]. A Circularity index that links a quality feature of the material under investigation, such as specific stiffness, to circularity is proposed. This index emphasizes the importance of preserving the quality of recycled materials to achieve a closed-loop circular design, where material properties are not degraded. Since the acceptable design of an aircraft structure must remain within the linear elastic region of the corresponding stress-strain curve, this method is justified for use in the aviation industry. The specific Circularity index, which rates materials according to their circularity, is based on the degree to which the specific stiffness of each virgin material has decreased compared to its recycled counterpart. It is important to note that this index is independent of the component's geometry but is dependent on the materials used for each part of the component. As a result, the circularity index is determined as follows in Eq. (4):
Where n is the number of parts for each component,
is referred to the initial material before recycling, recycled is referred to the recycled material and
is the penalty point, that is dependent on the volume fraction of the matrix of the material that cannot be recycled.
It is important to note that penalty points are only assigned to materials that cannot be recycled; otherwise, their value is 0. The specific characteristics of materials are derived from the Ansys Granta database [
31]. Metal materials are considered fully recyclable, resulting in minimal quality reduction. However, this is not the case for composite materials. To date, recycling composite materials require significant further research and development to achieve closed-loop recycling. Epoxy resin matrices, due to the cross-linking of polymer chains, cannot be recycled, as re-creating the bonds is inevitable once they are broken down [
51]. In this study, CFRP is produced with an epoxy resin matrix. As the matrix cannot be recycled and must be replaced to enable partial recycling of the CFRP, a penalty factor is applied. On the other hand, PEEK matrices are recyclable, as their thermoplastic molecular bonds allow them to be melted and reshaped without significant loss of quality. However, recycled unidirectional carbon fibers cannot retain their original shape and quality, and are typically chopped or milled for use in downcycled products [
51,
52].
Data about the Young’s modulus and density of recycled chopped carbon fibers were derived by [
53], where they are mentioned with the code name of Re500–P500-60. The carbon fibers were obtained from CFRP scraps with epoxy matrices, were recycled with the process of pyrolysis, were chopped and assumed to later on be cured with a compression molding procedure with either an epoxy matrix or a PEEK matrix and provide a Vf=40%. The virgin Vf of both CFRP and CF/PEEK are supposed to be 60%, while the manufacturing process was autoclave molding. The Young Modulus and therefore the specific stiffness of recycled chopped fiber composites is computed based on Nielsen equation aiming to predict the modulus of composites with discontinuous fibers [
54,
55]. In
Table 4, the quality reduction based on the difference between the specific stiffness of each original material and that of the same, but recycled material is shown.
2.2.5. Social Impact Assessment
A methodology for assessing the social impacts of products and solutions throughout their life cycle is known as Social Life Cycle Assessment (S-LCA). Social sustainability involves managing both the positive and negative effects on people (stakeholders), and the S-LCA framework adopts a stakeholder approach. It evaluates the potential impacts on various stakeholder groups throughout the product's entire life cycle, which includes stages such as material extraction, manufacturing, distribution, application, reuse, maintenance, and end-of-life (including recycling, downcycling, or disposal). The 17 Sustainable Development Goals (SDGs) established by the UN, such as eradicating poverty and hunger, ensuring high-quality and accessible education, promoting equitable and inclusive work, and more, align with the subcategories of the S-LCA. The five stakeholder groups, as outlined in Ansys Granta's database of comprehensive data for approximately 200 countries, are workers, consumers, the local community, society, and other value chain actors, following the UNEP-SETAC principles [
56]. Each social impact category in the Social Life Cycle Assessment (S-LCA) is linked to the 17 Sustainable Development Goals (SDGs) and follows the guidelines set by the UNEP-SETAC framework[
57]. The data for Social Life Cycle Assessment (S-LCA) can be obtained from both free and licensed databases that track social and socioeconomic risks and impacts, such as those from the United Nations, World Bank, and other reputable sources. The validity of the data is crucial when assessing social metrics to ensure accurate results. For each social impact category, countries are assigned a score on a normalized scale from zero (0) to one hundred (100), with 100 representing the best performance and 0 indicating the worst. To assess a product's Social Life Cycle, the life stages are linked to the countries involved, and social indicators for those nations are examined. One way to identify the countries associated with each stage of life is to track the locations of the companies' facilities that participate in those stages.
Based on the recommendations from UNEP/SETAC and utilizing the Ansys S-LCA tool [
58], this study proposes incorporating social impact considerations into the early stages of the design process. The goal is to determine, measure, and integrate the social impact of aeronautical components into the design approach. To facilitate the optimization of aircraft components for sustainability, with social impact as a key pillar, a Social Impact index is developed to be included in the sustainability assessment. This Social Impact index enables the rapid evaluation of social metrics during the early design phases. According to the S-LCA tool methodology, the user sets a threshold indicating the percentage value below the global average, where social hotspots emerge for each country. These hotspots highlight the social metrics associated with stakeholder categories where countries exhibit negative impacts. Subsequently, for the complete Life Cycle Assessment (LCA), a FFDOE (Full Factorial Design of Experiments) is conducted using MATLAB code [
35], considering the countries involved in each stage, to identify all possible combinations. Each country, based on the threshold assigned, receives a score corresponding to the sum of the social hotspots identified. From the FFDOE analysis, the best- and worst-case scenarios can be easily determined using the MATLAB script. As a result, the Social Impact index for each scenario of countries in a product's life cycle can be calculated, as shown in Eq. (5):
Where SOC represents the Social Impact Index, n is the number of stages in the life cycle of the product, and in each stage, the number of
is calculated based on the country involved in that stage. The index aggregates the social impacts from each life cycle phase to assess the overall social performance of the product.
Due to the lack of precise data on alliances between companies, product transportation, and their usage, assumptions are required to demonstrate the methodology. Specifically, the data used for these analyses are sampled, taking into account all potential trade relationships between countries involved in the product's life cycle. Research has been conducted to identify the countries where each material undergoes primary manufacturing, is processed into a component of the hat-stiffened panel for aviation applications, and is recycled or downcycled, with the assumption that none of the materials will end up in a landfill.
The social hotspots provide valuable qualitative insights into various scenarios within a product's life cycle. This study aimed to quantify this information and include it in the ranking of potential life cycle scenarios for a hat-stiffened panel, in order to integrate it into the social impact parameter of the sustainability index. A threshold of 50% was set, referring to categories where each country’s performance is 50% below the world average, thereby creating a Social Hotspot in that category. The total score for each scenario is the sum of the Social Hotspots across the five categories, as outlined in Eq. (5).
Table 5 and
Table 6 present the best- and worst-case scenarios for the reference case of the AL-AL configuration, showing the number of hotspots detected in each country for each life stage as an example.
2.3. Phase 3 - Integration of Holistic Sustainability in the Design Process
Using a multi-criteria decision-making (MCDM) approach, a quantified aggregated index was derived for each design choice in order to assess its sustainability and compare it to the alternative design choices. This index accounted for stakeholder priorities across the five sustainability pillars and potential trade-offs. It was first introduced by Fillipatos et al. in their previous publications [
28,
59]. The index was obtained using normalized data for the five pillars—Performance (P), Costs (C), Environmental Impact (E), Circularity Performance (CIRC), and Social Impact (SOC)—using the Min-Max method for normalization [
60]. These pillars were then aggregated using the Weighted Sum Method, where each pillar was multiplied by its respective weighting factor Ki, where i = P, C, E, CIRC, SOC, defined by the user, as per Eq. (6).
This holistic index evaluates the sustainability of a component design by allocating a value between zero (0) and one (1). A value of zero (0) represents the lowest sustainability within the specific dataset, while a value of one (1) indicates the highest possible sustainability. It is worth mentioning that sustainability, in this context, is comparable to a reference, so only degrees of sustainability can be discussed, rather than absolute measures. After normalization and weight selection, the calculation of the sustainability index for each design variant was performed. All pillars are normalized in a way to show optimal results when they are closer to one (1) as a score, meaning that certain pillars, such as the cost pillar, the environmental impact pillar, and the social impact pillar are inversely normalized. Following, the weighting factors were selected using the AHP technique, and three distinct scenarios were discussed. In the first scenario, weights were considered equal (Saaty scale numerical rating: 1), while in the second scenario, a demonstrated importance was assigned to the Cost Pillar (Saaty scale [
61] numerical rating: 7), and in the third scenario, the Environmental Impact Pillar was given priority.
3. Phase 4 – Ranking of Sustainable Design Concepts
For the ranking of sustainable design variants, a Matlab script was used to evaluate and compare various material configurations and their geometrical modifications. The objective was to identify the optimal configuration in terms of sustainability by utilizing Eq. (6) of the Sustainability Index (SI). The results could vary significantly based on different weighting factors and use phase cases. This study considered three scenarios: no use phase, kerosene use phase, and hydrogen use phase. Each scenario was analyzed independently.
3.1. Equal Weights Scenario
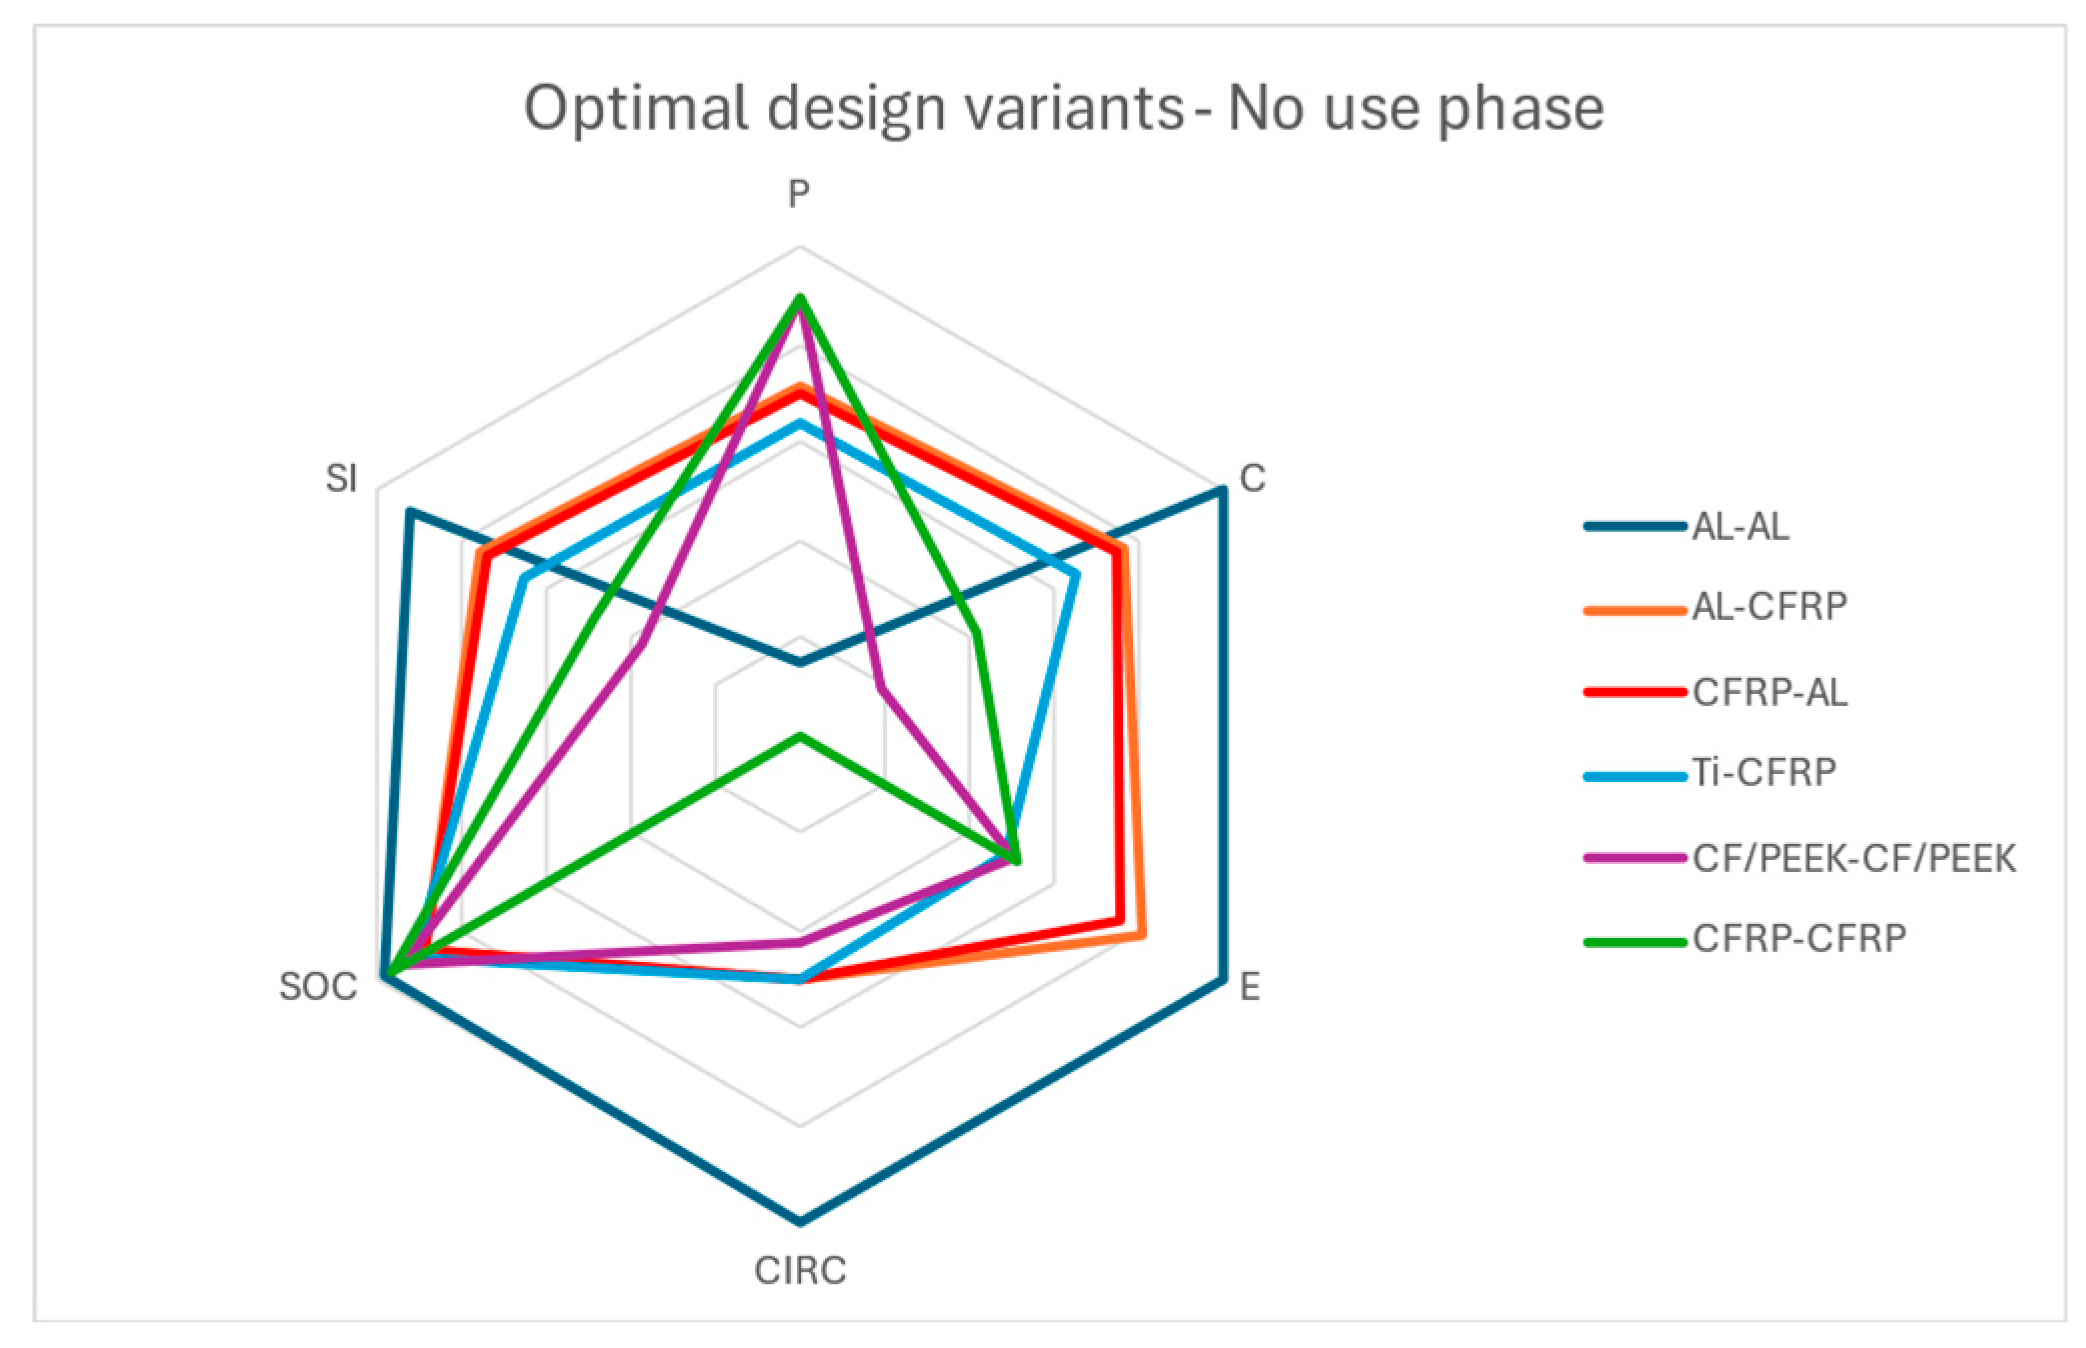
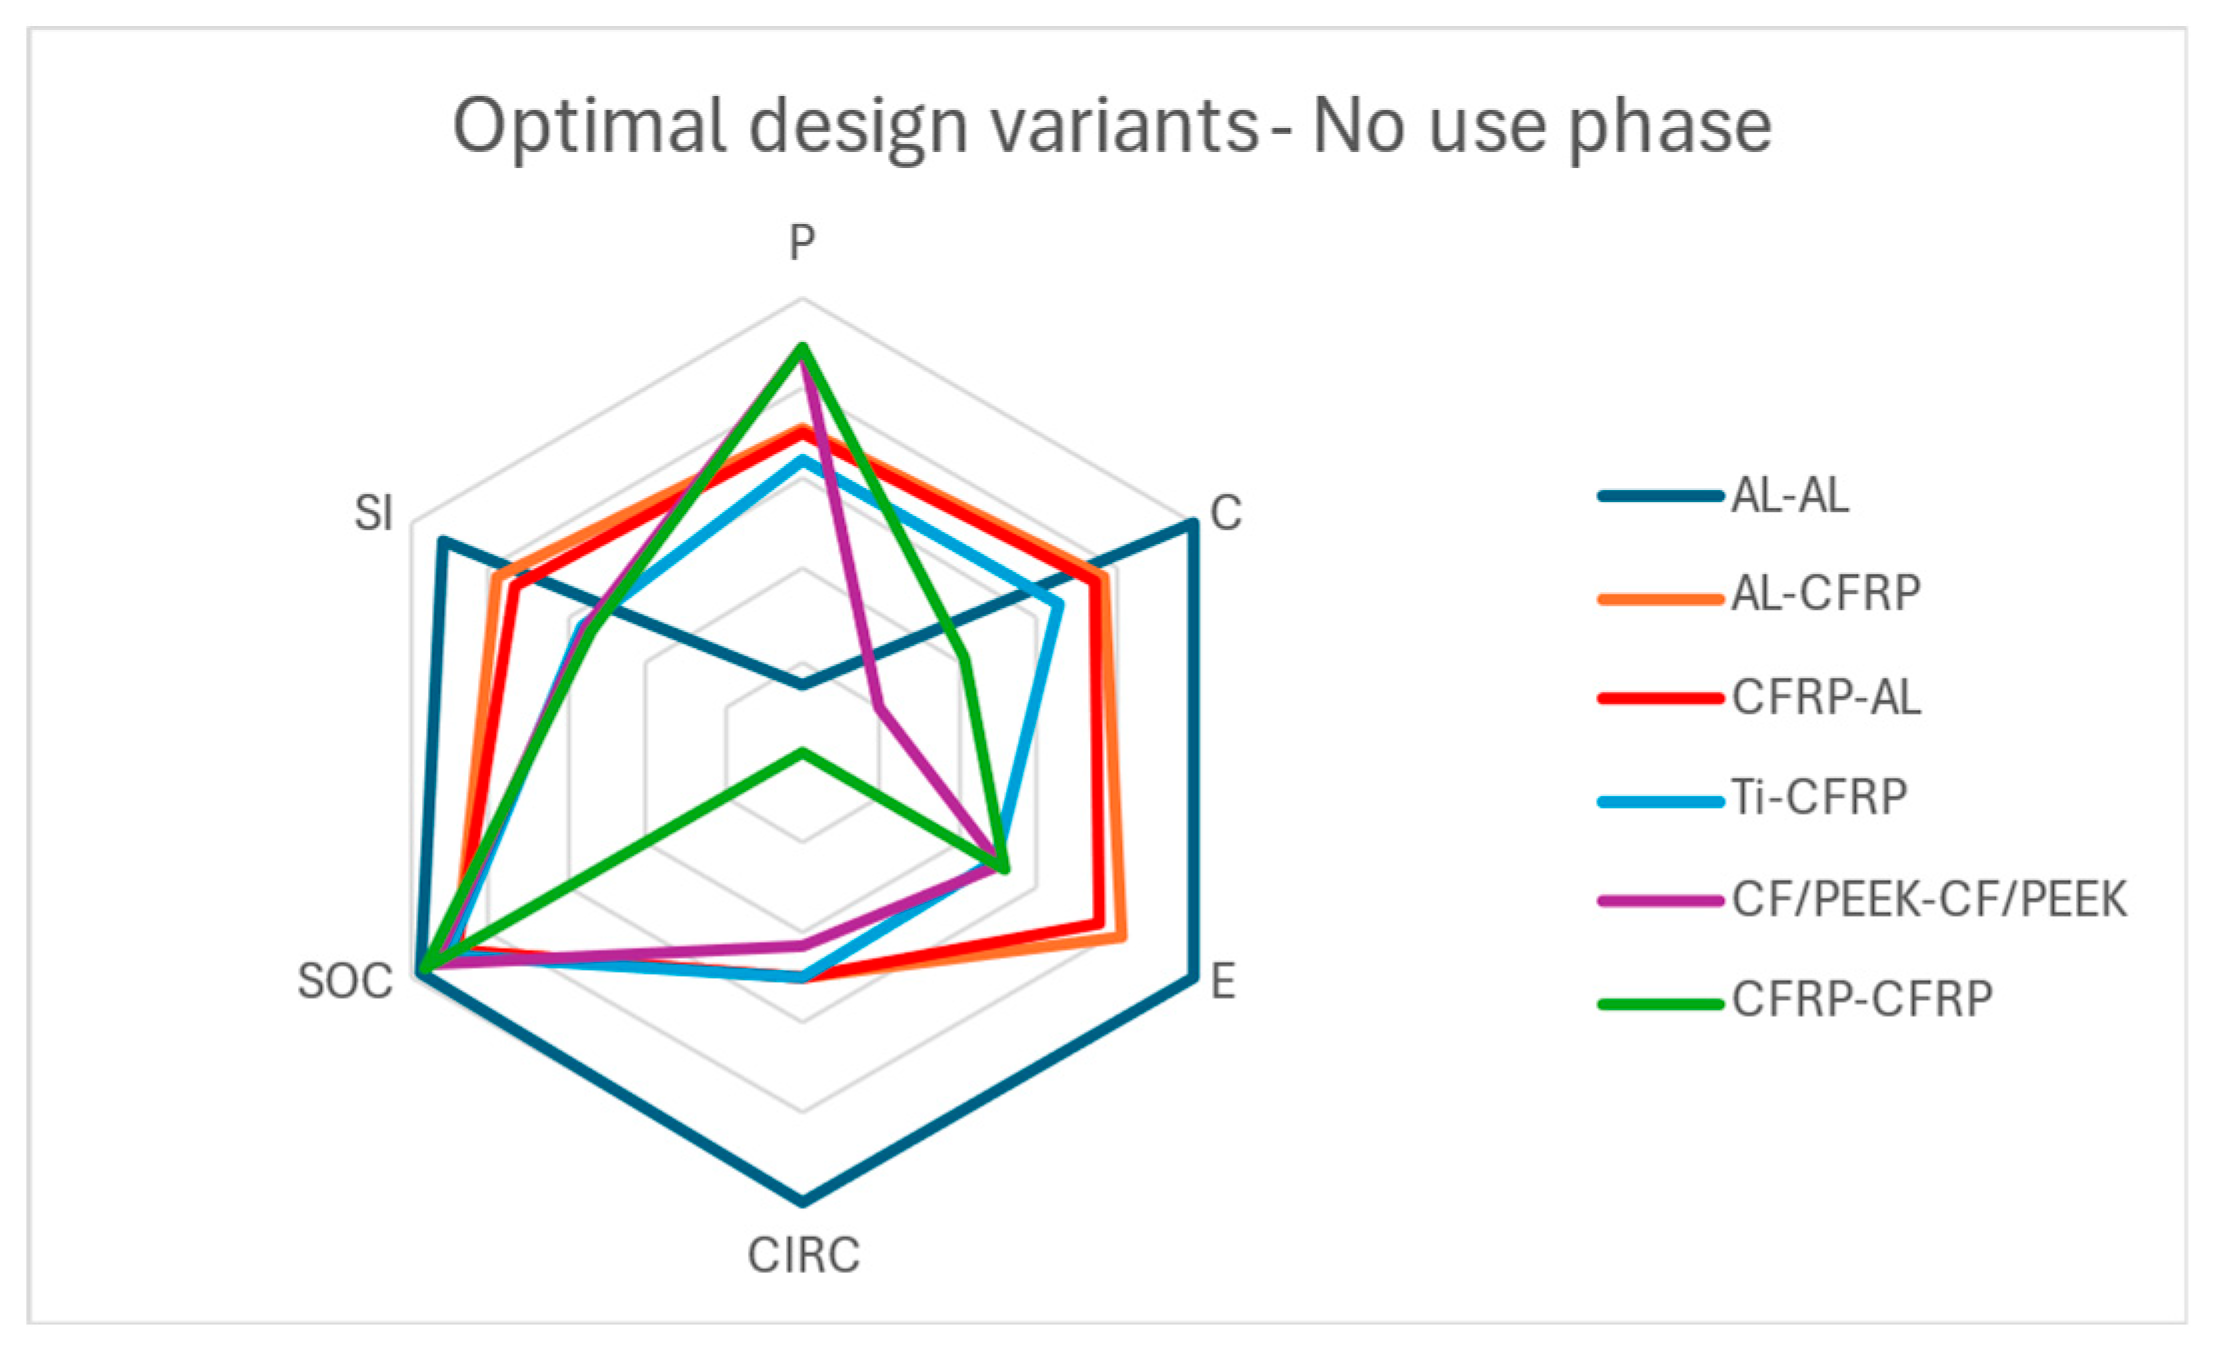
Table 7 shows the ranking of design configurations without the use phase, including the average values, standard deviation of geometrical variations, and the sustainability index for each material configuration. Equal weighting was assumed in this case. It is important to notice that the ranking aims to provide a set of sustainable design variants, rather than a sole optimal design variant, which allows more flexibility to the designer.
For the case excluding use phase, as displayed in
Table 7, the optimal material configuration is AL-AL, with a significantly higher sustainability index compared to the second in rank, AL-CFRP configuration. This configuration achieved a better balance across the five sustainability pillars. The thicknesses of both the skin and the stringer, as well as the crown width, do not deviate significantly from those of the reference case. The design configurations ranking second (AL-CFRP) and third (CFRP-AL) showed minimal variation in their sustainability indexes. However, the configurations ranking fourth (Ti-CFRP), fifth (CF/PEEK-CF/PEEK), and sixth (CFRP-CFRP) have nearly identical sustainability indexes, and certain design variants within these material configurations provide comparable results. The least optimal design configuration is CFRP-CFRP, which performs poorly in the circularity, cost, and environmental impact pillars. Although design variants that include composite materials are thicker than the metal ones in both the skin and the stringer, their masses are generally smaller. It is also noted that the optimal crown width for all material configurations is very similar to that of the reference case.
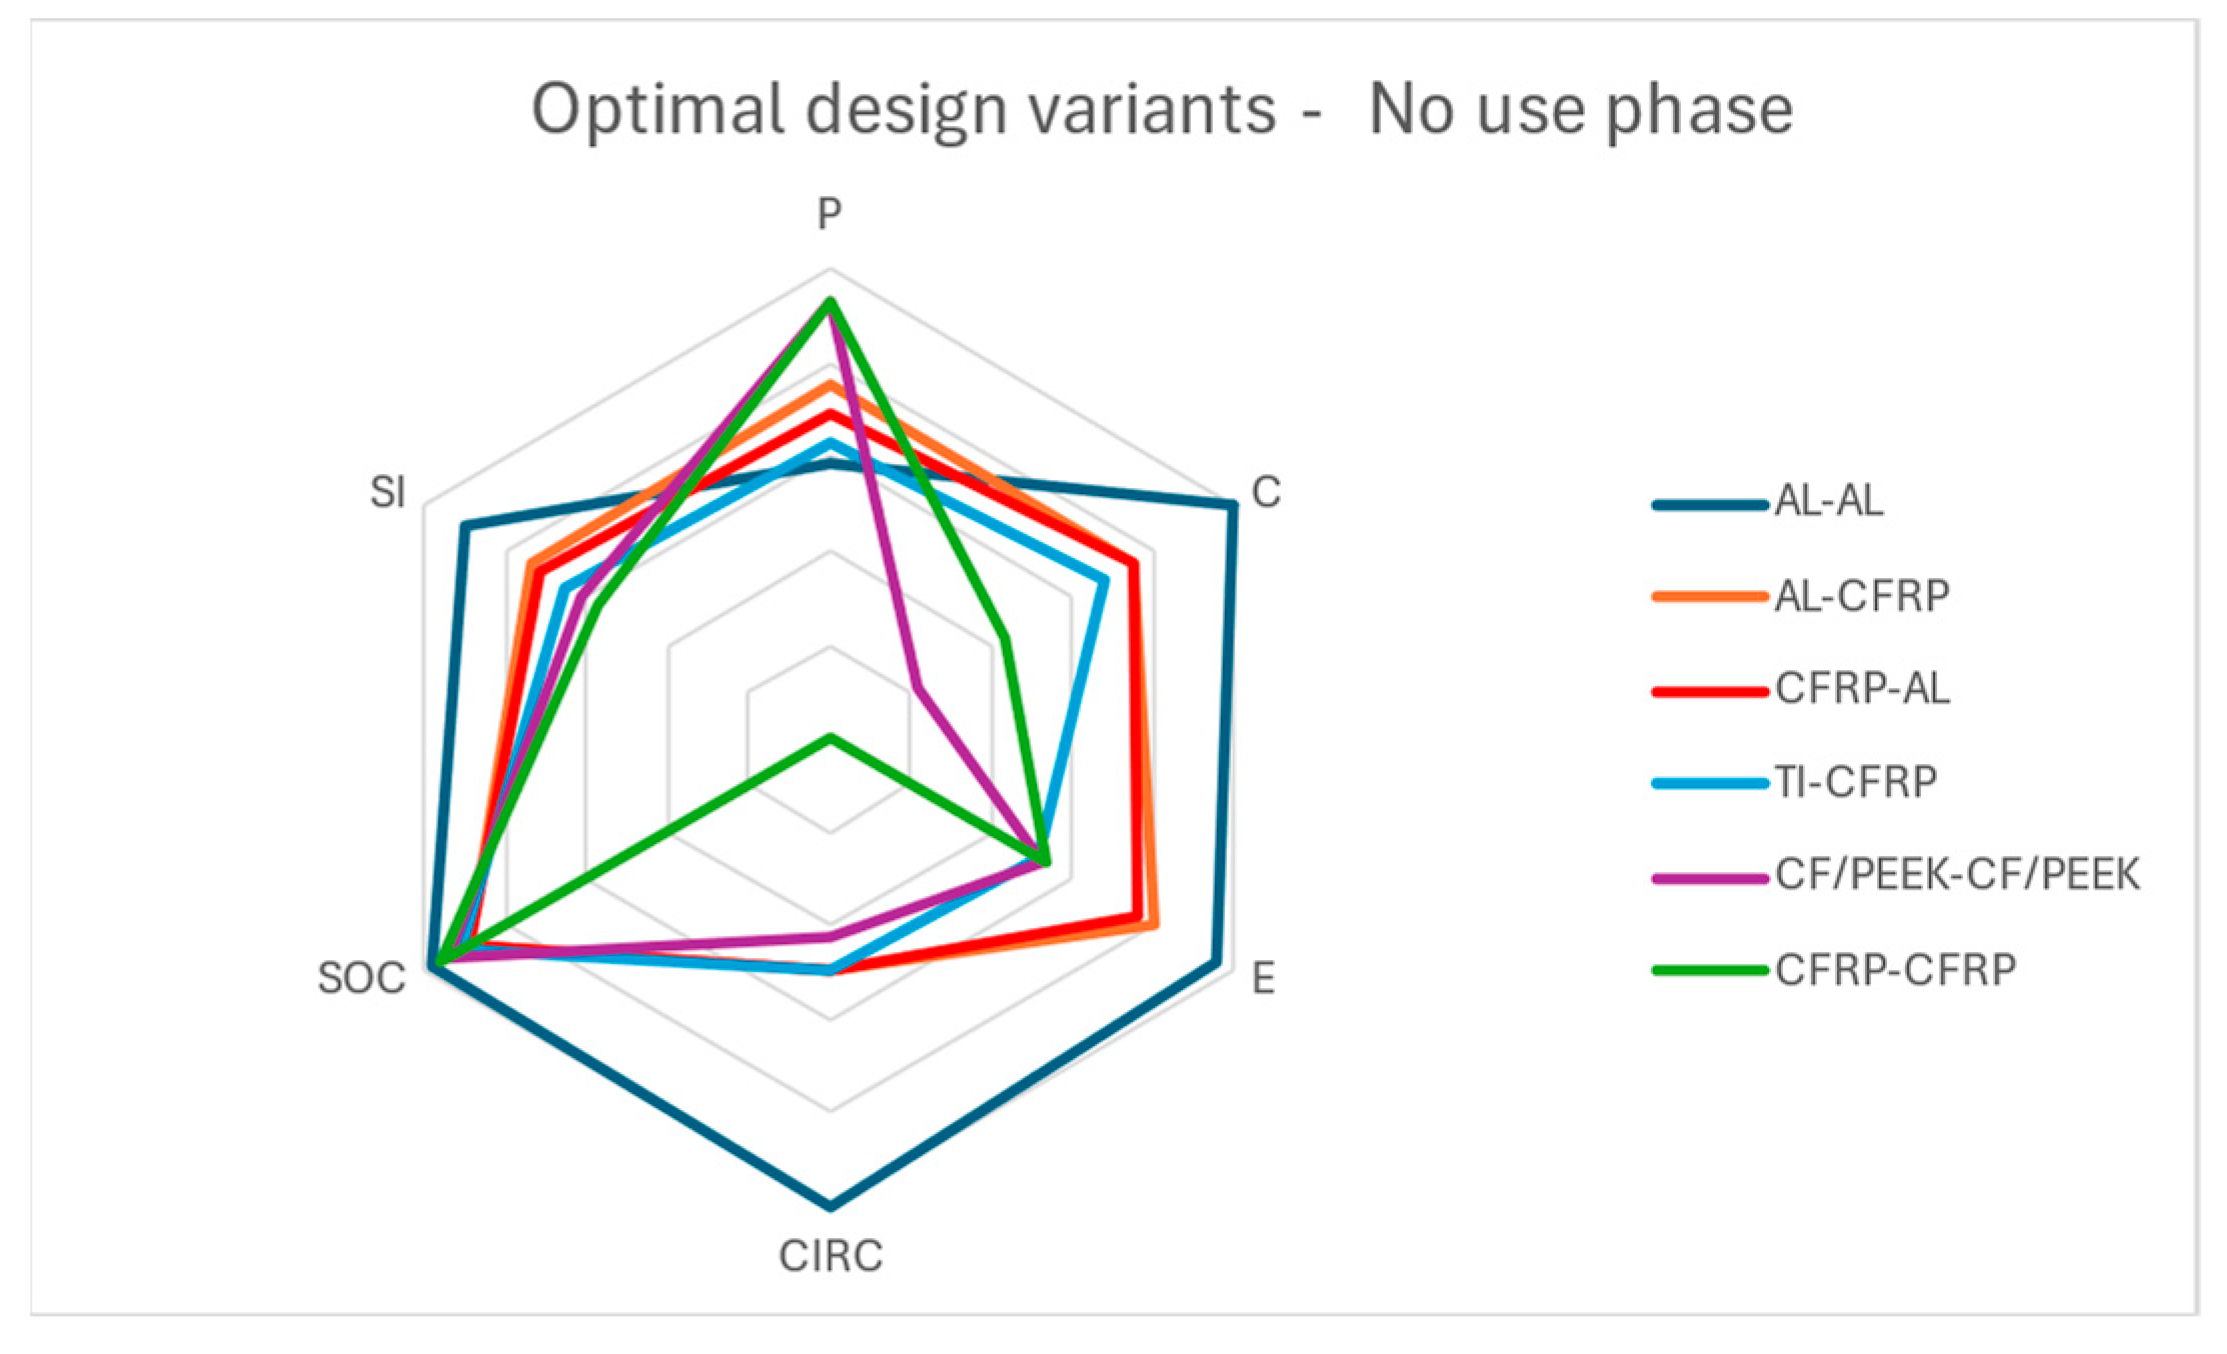
Figure 11 illustrates a radar chart including the optimal design variant for each material configuration for the no-use-phase and equal weights case.
As observed in
Figure 11, the optimal design variant for AL-AL, which ranks first overall, shows a perfect score on the pillars of cost, environental impact, circularity and social impact. CFRP-CFRP on the flip side showcases exceptional mechanical performance, however the rest pillars apart from the social impact pillar, perform poorly.
The same methodology was applied to the other two use phase cases. Since the dimensions of the hat-stiffened panel design are independent of the cost and environmental impact pillars influenced by the use phase, the design variant results remain consistent across all material configurations, as shown in
Table 6. Accordingly,
Table 8 and
Table 9 present the sustainability rankings for the kerosene-fueled and hydrogen-fueled use phase cases, including material configurations and their corresponding sustainability index values (average and standard deviation). Additionally,
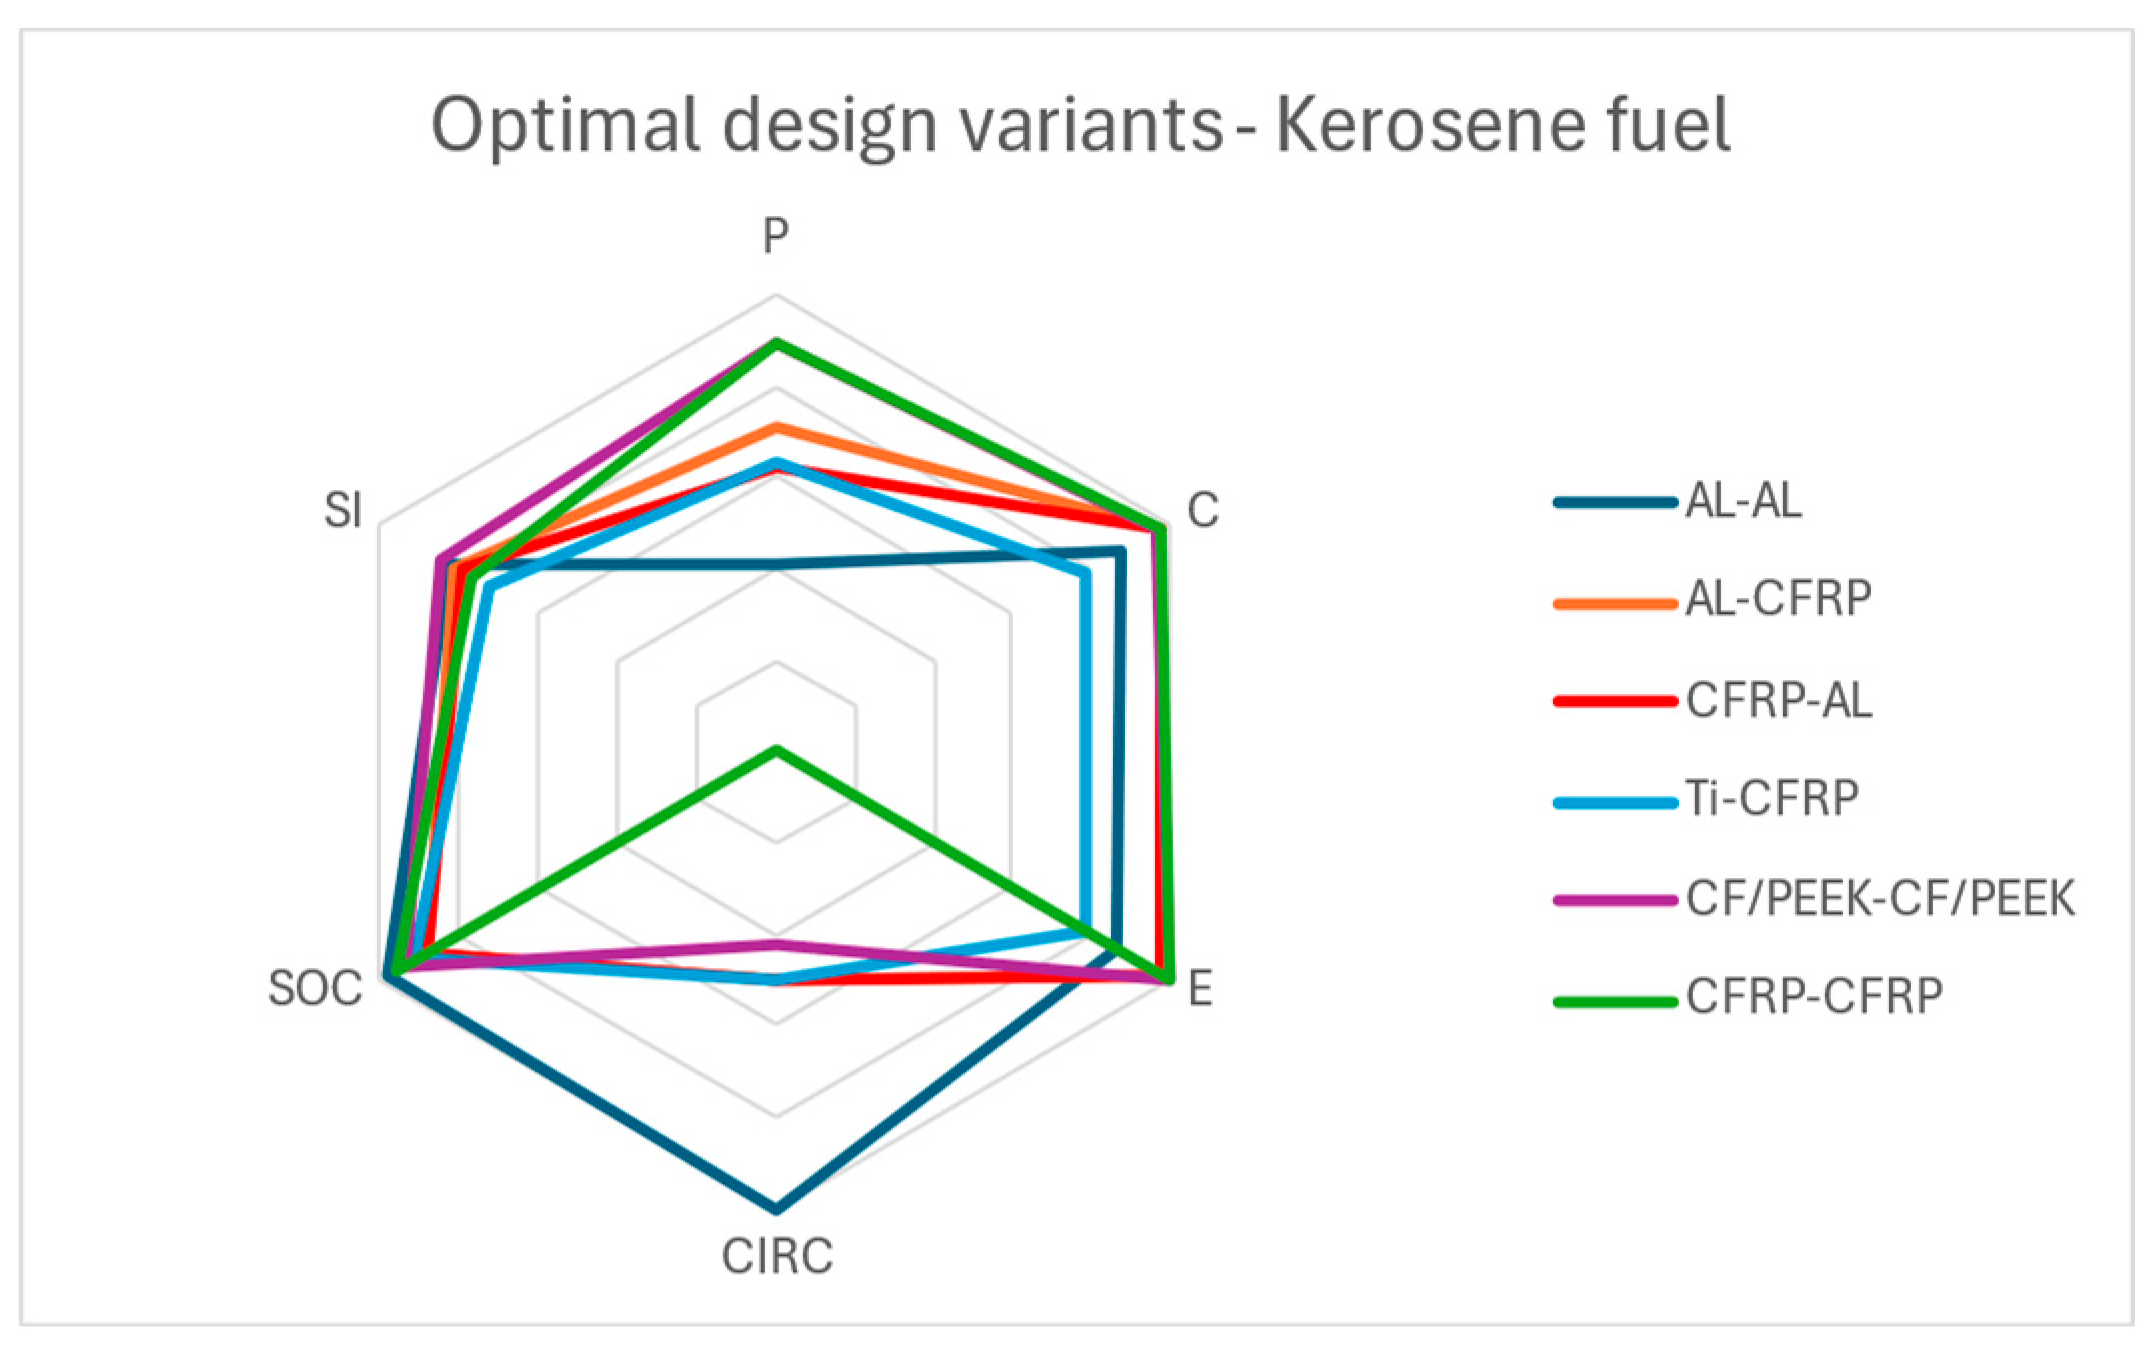
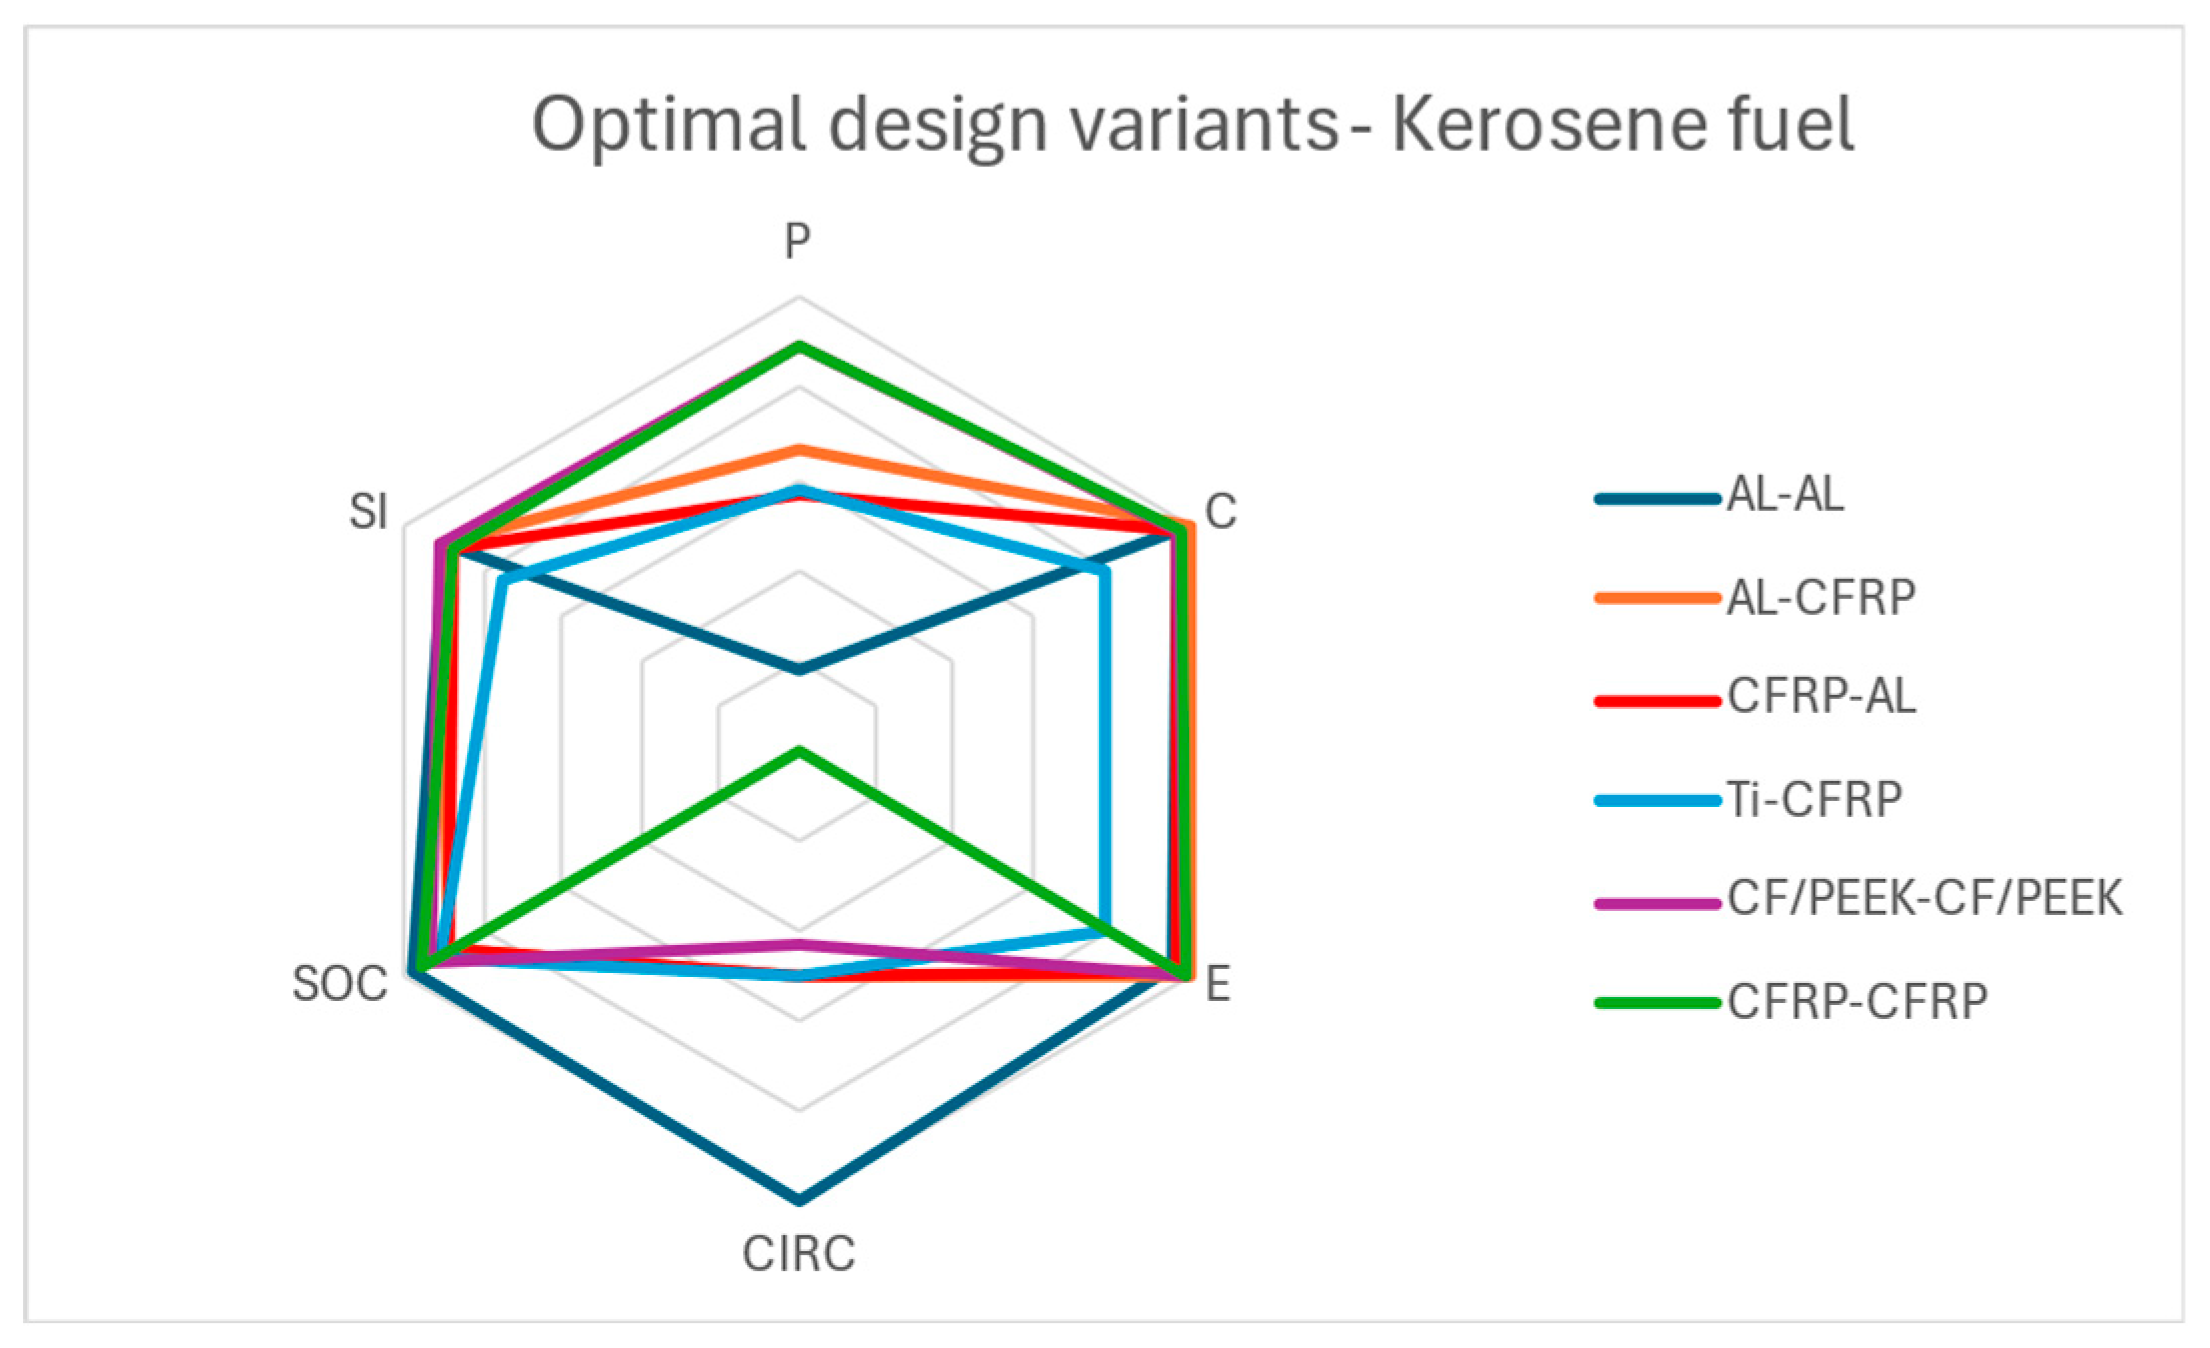
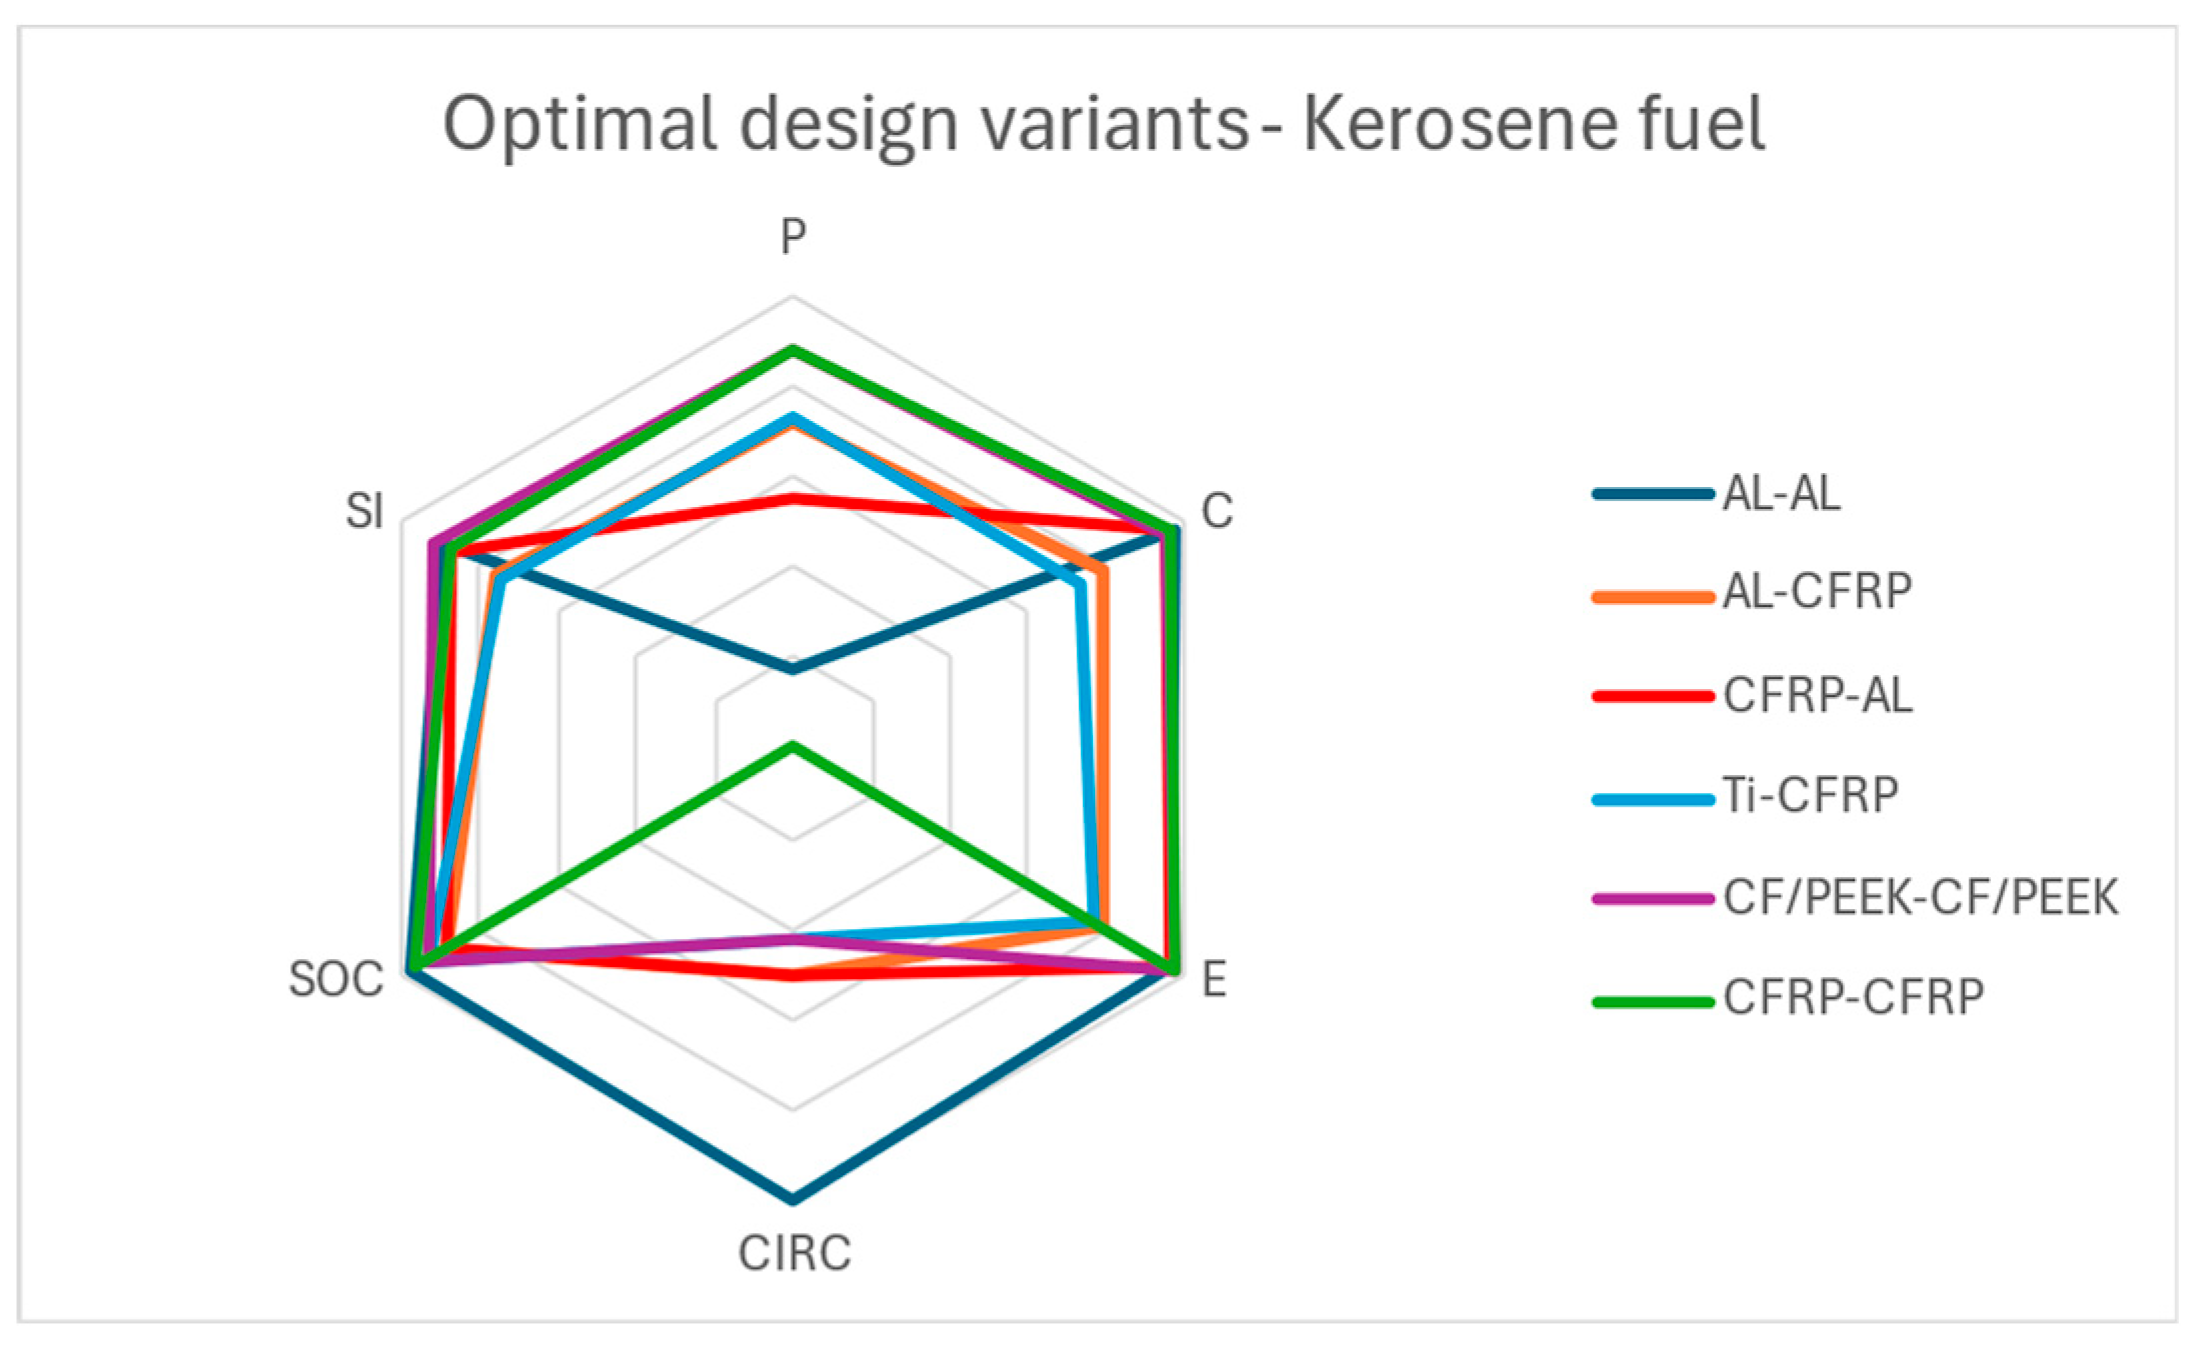
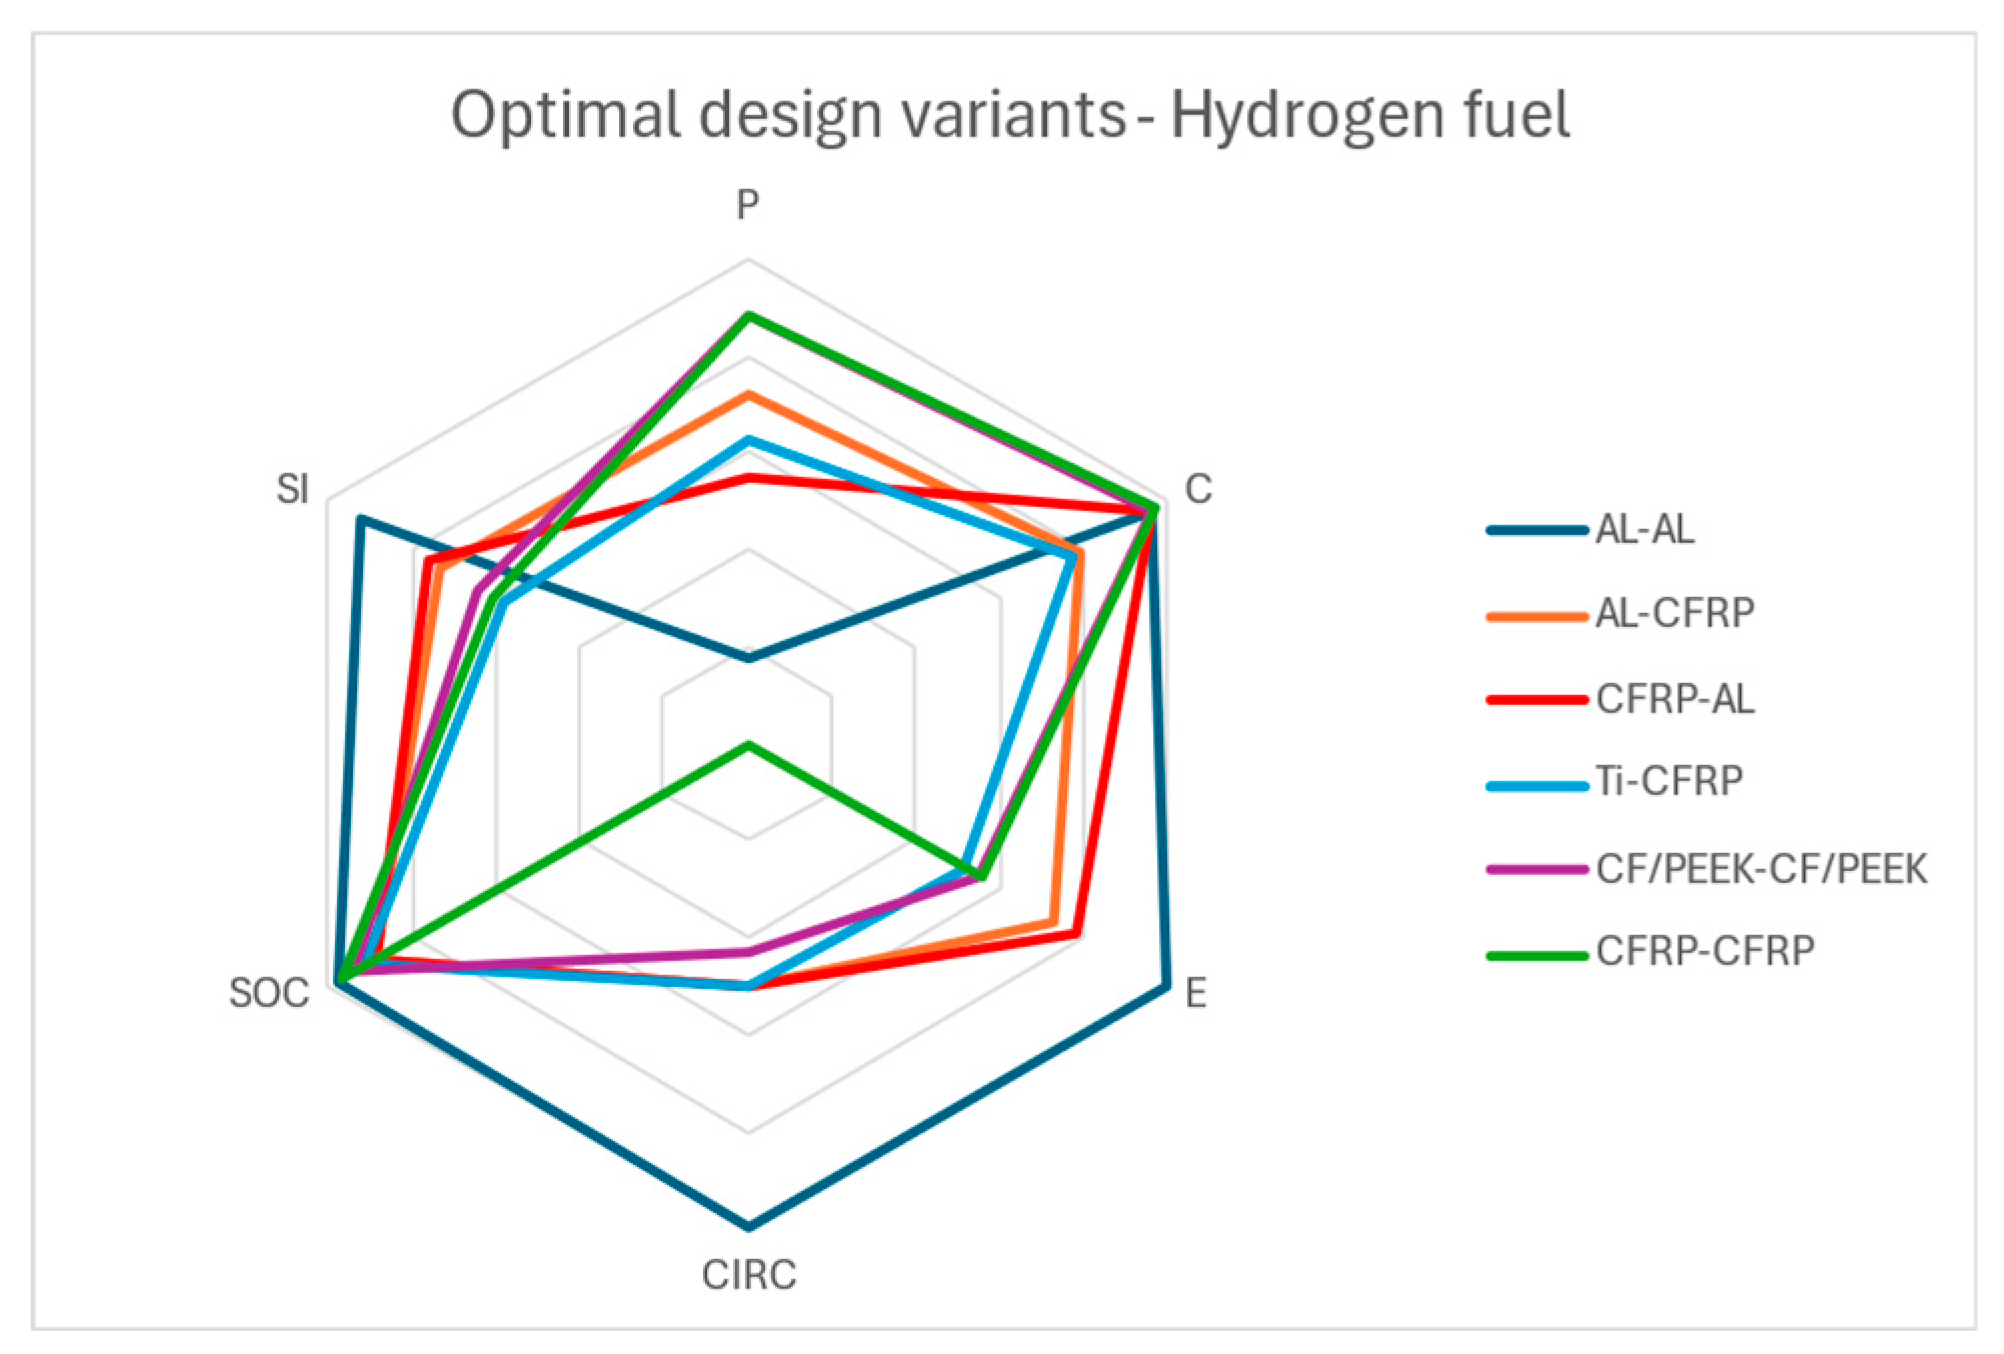
Figure 12 and
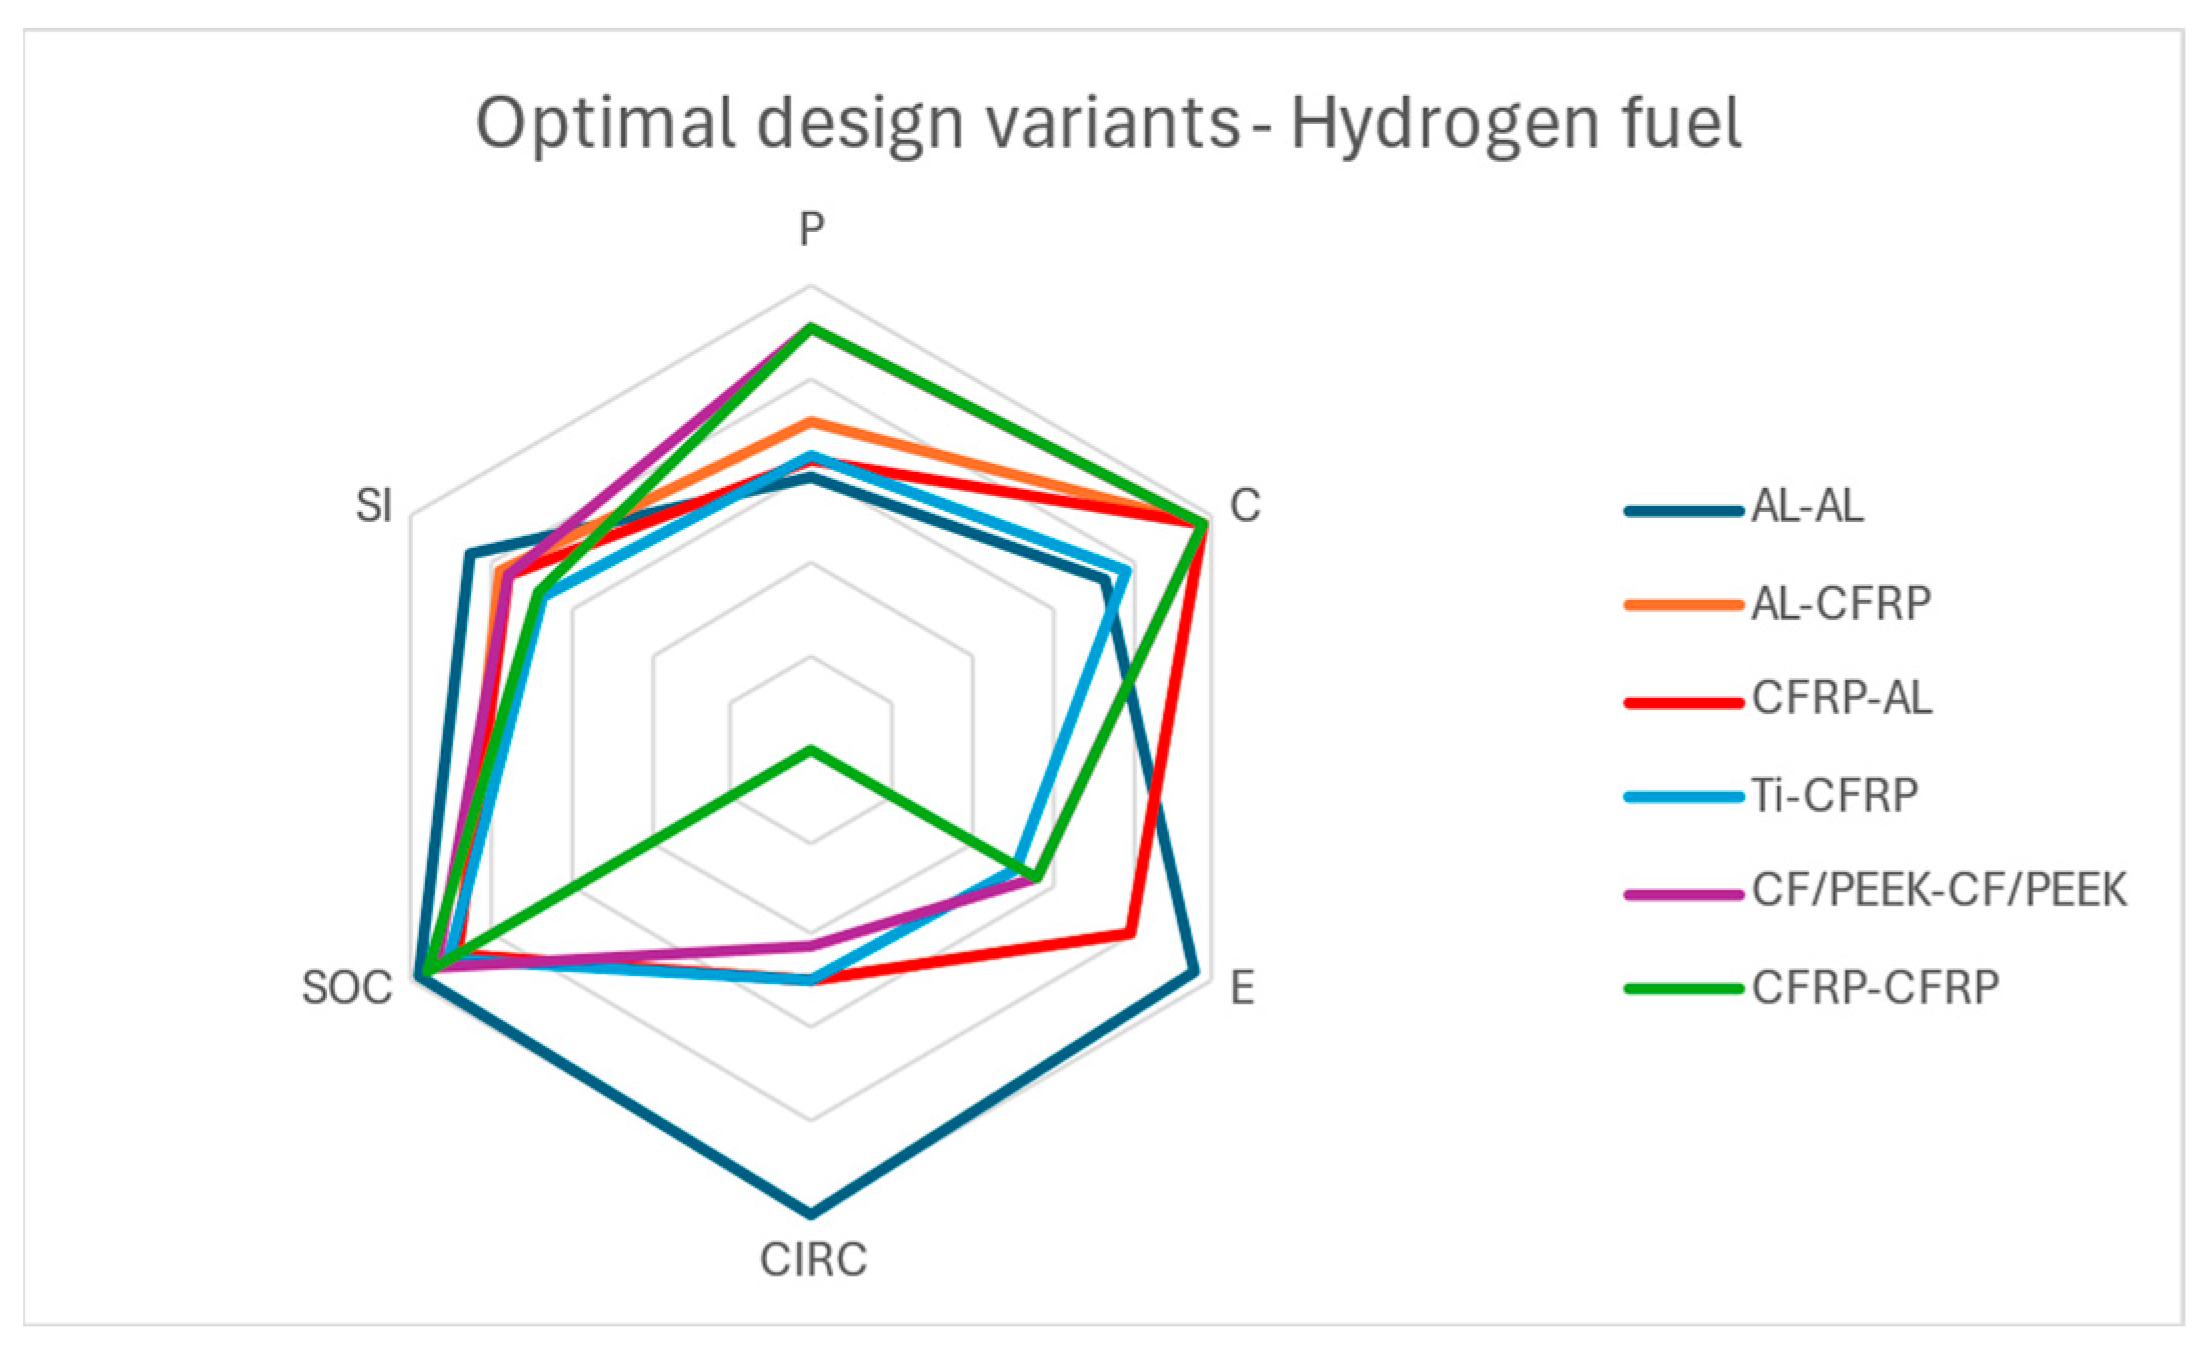
Figure 13 display radar charts highlighting the optimal design variant for each material configuration in the kerosene-fueled and hydrogen-fueled use phase cases.
In the case of the kerosene-fueled use phase, CF/PEEK-CF/PEEK is deemed the most sustainable option due to its strong performance across all pillars. It performs exceptionally well in the mechanical performance, cost, environmental impact, and social impact pillars, while showing average performance in the circularity pillar. AL-AL ranks third, and the least optimal material configuration is Ti-CFRP. These results differ from the no-use-phase case due to the significantly larger coefficients for cost and environmental impact. Consequently, variations in the cost and environmental impact pillars across the design configurations are more strongly influenced by the masses of the skin and stringer.
In
Figure 12, CF/PEEK-CF/PEEK, ranks first overall, demonstrating excellent performance across the pillars of mechanical performance, cost, environmental impact, and social impact. However, due to its inability to be fully recycled without a loss in mechanical properties, it exhibits only average circularity performance compared to the other configurations. In contrast, Ti-CFRP ranks last, performing at an average or below-average level across all pillars.
In the hydrogen-fueled use phase case (
Figure 13), AL-AL ranks first, while Ti-CFRP remains at the bottom. As also in other use phase cases, the masses of the skin and stringer play a significant role in the final ranking. However, since hydrogen is characterized by zero carbon emissions, the environmental impact coefficient remains the same as in the no-use phase case, significantly influencing the results in the environmental impact pillar.
The sustainability index was derived independently for each use phase case; therefore, it serves more as a qualitative metric for each design alternative within a specific use phase, rather than a comparative metric across all design alternatives of every use phase. As seen in
Figure 11,
Figure 12,
Figure 13, and
Table 7,
Table 8, and
Table 9, the optimal design configurations vary significantly. Across all use phase cases, AL-CFRP consistently ranks second, demonstrating strong performance across all pillars, regardless of the use phase.
3.2. Priority on Cost Pillar Scenario
Table 10,
Table 11 and
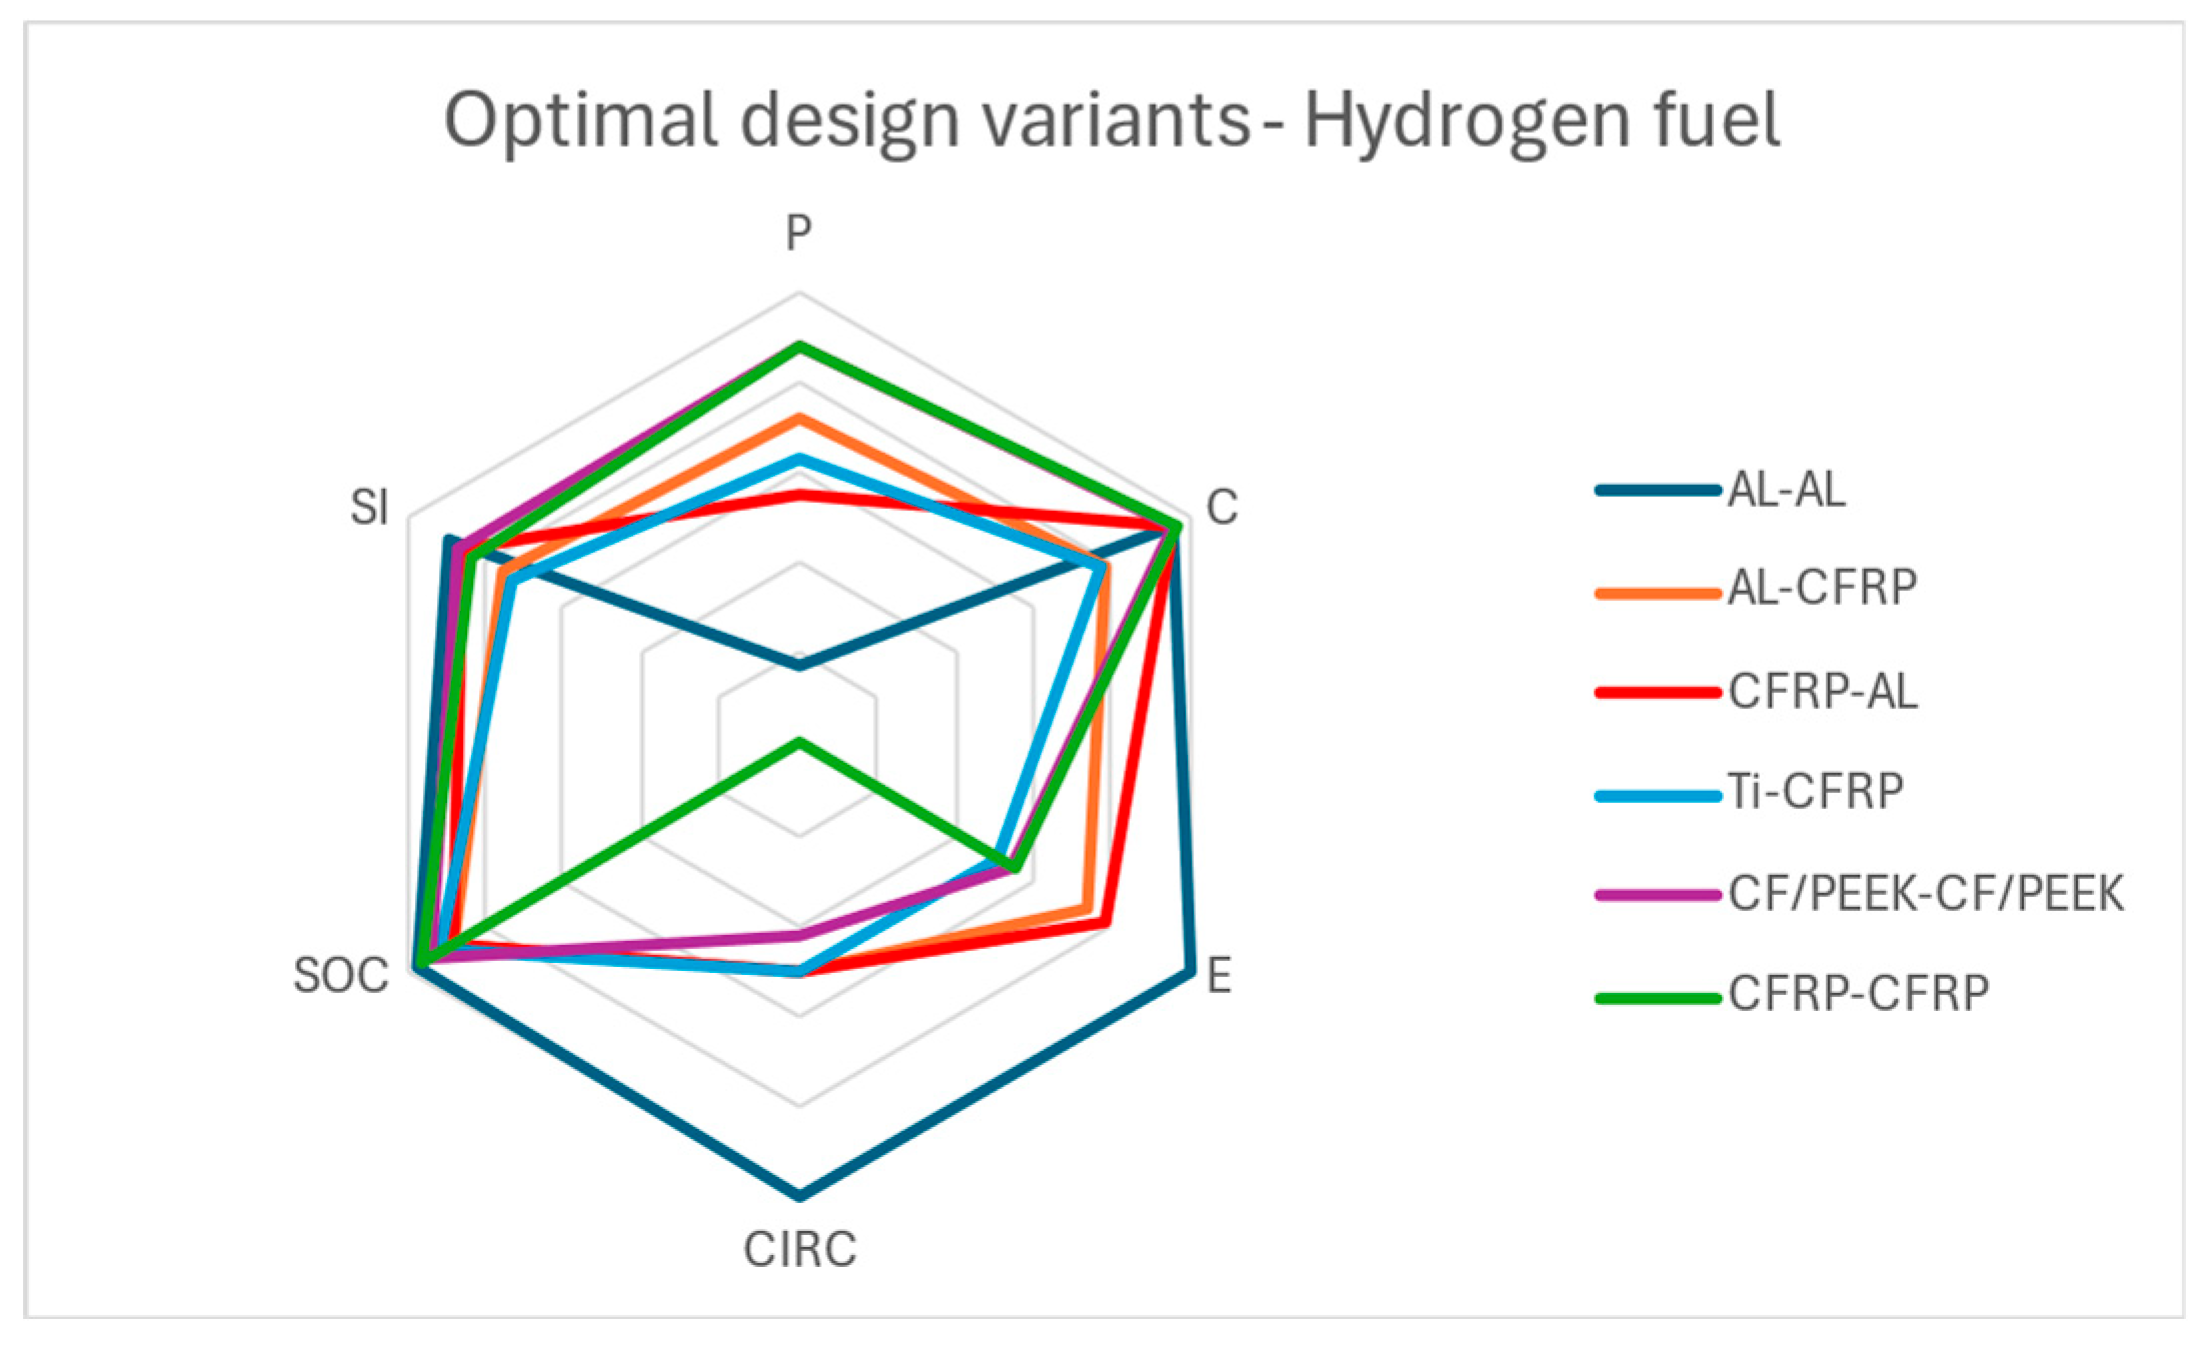
Table 12 below display the sustainability ranking for the three use phase cases, while
Figure 14,
Figure 15 and
Figure 16 showcase the radar charts of the most sustainable design variants for each material configuration when costs are prioritized over the other criteria. It is important to note that when priority is given to the cost pillar, the results are influenced accordingly. While the other pillars still affect the results, their impact is less significant. Similarly, when priority is given to the environmental impact pillar, the results are adjusted in accordance with this focus.
In the case of the no-use phase, as seen in
Table 10, AL-AL is deemed the most sustainable option due to its strong performance across all pillars. This configuration in this case achieves undoubtfully a better balance of all pillars compared to the rest. The least optimal material configuration was CF/PEEK-CF/PEEK and the sustainability index is much smaller. These results closely resemble those of the equal weights scenario.
As observed in
Figure 14, the optimal design variant for AL-AL, which ranks first overall, shows perfect score on the pillars of cost, environmental impact, circularity and social impact, however its mechanical performance is the worst overall. CF/PEEK-CF/PEEK on the flip side showcases exceptional mechanical performance, however the rest pillars apart from the social impact pillar, are performing poorly. It is of crucial importance to notice that the ranking is derived according to the sequence of configurations with regards to the cost pillar and is influenced less from the rest pillars.
In the case of the kerosene-fueled use phase, in
Table 11, it is apparent that CF/PEEK-CF/PEEK was deemed the most sustainable option due to its strong performance across all pillars, except for the circularity pillar where its performance was average. AL-AL is ranked fourth, alike the previous case, and the least optimal material configuration is Ti-CFRP. These results differ from the no-use-phase case because the coefficients for cost and environmental impact were orders of magnitude larger. As a result, the difference in the cost and environmental impact pillars between the design configurations was mainly influenced by the masses of the skin and stringer. By prioritizing cost-efficiency, no significant changes are noticed, compared to the equal weights scenario.
In
Figure 15, CF/PEEK-CF/PEEK, ranks first overall, having a great score on the pillars of mechanical performance, cost, environental impact, and social impact, however, it shows an average circularity performance compared to the rest configurations. On the contrary, Ti-CFRP ranked in the last position, performing average or poorly to all pillars.
In the hydrogen-fueled use phase case, CF/PEEK-CF/PEEK ranks first, while Ti-CFRP remains at the bottom. As in other use-phase scenarios, the masses of the skin and stringer play a significant role in the final ranking. However, the ranking is much different than the respective case of the equal weights scenario; thus, when focusing on cost effectiveness the influence is significant.
The ranking is determined heavily based on the performance in the cost pillar as displayed in
Figure 16. CF/PEEK-CF/PEEK ranks first, displaying great performance in almost all pillars and especially the cost pillar. Ti-CFRP is once again ranking in the last position.
As observed in the tables and charts above, AL-AL ranks first for the no-use-phase case, while CF/PEEK-CF/PEEK was ranked as the worst. However, for both use-phase cases—kerosene and hydrogen—CF/PEEK-CF/PEEK scored the highest. This occurred because, when the use phase was accounted for, the cost coefficient was primarily influenced by the fuel price per lifetime. As a result, the differences between material configurations in the cost coefficient were smaller, and the part mass ultimately determined the outcome in the cost pillar. In the no-use-phase case, however, the cost coefficient was more heavily dependent on the primary manufacturing process cost, which led to varying cost coefficient values across material configurations. Consequently, the cost pillar was influenced by both the masses of the parts and the cost coefficient.
As noted in
Section 2.2.2, the cost coefficient for AL-AL was much smaller than that for CF/PEEK-CF/PEEK in the no-use-phase case, but it became almost identical for the use-phase cases. Additionally, as discussed in
Section 3.1, both the skin and stringer design variants made from CF/PEEK-CF/PEEK were considerably lighter than their AL-AL counterparts.
3.3. Priority on Environmental Impact Scenario
The results from the sustainability assessment, when priority is given to the environmental impact of the configurations, are shown in
Table 13,
Table 14 and
Table 15 below. These tables display the sustainability ranking for the three use-phase cases, and
Figure 17,
Figure 18 and
Figure 19 present the radar charts of the most sustainable design variants for each material configuration.
In the case of the no-use phase, as seen in
Table 13, AL-AL is the most sustainable configuration due to its strong performance across all pillars and its elevated sustainability index. This configuration in this case achieves undoubtfully a better balance of all pillars compared to the rest. The least optimal material configuration was Ti-CFRP, due to its insufficient environmental impact performance and the sustainability index is much smaller.
As observed in
Figure 17, the optimal design variant for AL-AL, which ranks first overall, demonstrates a perfect score in the pillars of cost, environmental impact, circularity and social impact, however its mechanical performance is the worst overall. Ti-CFRP apparently has the weakest performance.
In the case of the kerosene-fueled use phase, in
Table 14, it is apparent that CF/PEEK-CF/PEEK was deemed the most sustainable option due to its strong performance across all pillars, except the circularity pillar where its performance was average. AL-AL is ranked fourth, alike the previous case, and the least optimal material configuration is Ti-CFRP. These results are almost the same as those of the cost priority scenario, which is expected.
In
Figure 18, CF/PEEK-CF/PEEK ranks first overall, presenting a great score on the pillars of mechanical performance, cost, environental impact, and social impact, however, it shows an average circularity performance compared to the rest configurations. On the contrary, Ti-CFRP ranked in the last position, performing average or poorly to all pillars. Kerosene use phase cases for the equal weights scenario (
Figure 12), for the cost priority scenario (
Figure 15) and fot the environmental impact priority scenario resemble, however, different design variants of each material configuration are shown as the ideal and their performance in all pillars might be quite different.
In the hydrogen-fueled use phase case, AL-AL ranks first, while Ti-CFRP remains at the bottom. As in the other use phase cases, the masses of the skin and stringer play a significant role in the final ranking. However, the ranking is much different than the respective case in the equal weights scenario; thus, when focusing on environmental impact the influence is significant.
The ranking is determined heavily based on the performance in the environmental impact pillar as displayed in
Figure 19. CF/PEEK-CF/PEEK ranks first, displaying great performance in almost all pillars and especially the cost pillar. Ti-CFRP is once again at the last position.
It is notable that for both the no-use phase and hydrogen-use phase cases, the sustainability ranking are almost identical, due to the zero carbon emissions that hydrogen produces as a fuel. The minor changes observed in the 4th and 5th positions of the ranking are attributed to the contribution of the cost pillar, as the cost coefficients differ between the no-use phase and hydrogen-use phase scenarios. Therefore, AL-AL remains the most sustainable material configuration for the no-use and hydrogen-use-phase scenarios, while CF/PEEK-CF/PEEK was the most sustainable for the kerosene-use-phase scenario. Ti-CFRP ranked as the least sustainable material configuration across all threes scenarios.
4. Conclusions
Nowadays, considerations in the design of aviation components, as well as in other engineering sectors, require a more holistic approach that prioritizes sustainability while maintaining product competitiveness. In the coming years, achieving both sustainability and competitiveness is expected to become a primary requirement in aviation. While minimizing environmental impact remains crucial, it is equally important to address additional factors, such as economic viability, social impact, and circular economy principles, in order to enhance market competitiveness and align with broader sustainability goals.
The present study explored a shift from an eco-driven to a sustainability-driven design approach for aircraft components by incorporating sustainability as a primary design driver in the initial design stages. This approach considered performance and safety requirements, environmental impacts, costs, social factors, and circular economy principles to ensure a balanced and holistic design. These aspects were rigorously quantified and optimized, with multi-criteria decision-making (MCDM) methods employed to prioritize variables effectively. A Sustainability Index was developed to assess the overall sustainability of design alternatives, and the most sustainable configurations were identified through optimization. The approach was demonstrated using a hat-stiffened panel, where diverse material combinations and geometric configurations were evaluated, showcasing how sustainability could be effectively integrated into the early stages of the design process.
The results for each configuration were presented as an average value with a standard deviation, which indicates that within this range, all alternative configurations can be considered equally sustainable. By acknowledging a range of equally viable solutions rather than a single optimal design, the study allows for greater adaptability in addressing real-world constraints and tailoring designs to meet project-specific needs. The results demonstrated a strong dependence on the type of fuel used and the weighting assigned to the pillars of sustainability, which are ultimately influenced by the user's specific priorities and needs. Specifically, when equal weighting was applied across the five pillars and the use-phase impact was excluded, the fully Aluminum component emerged as the most sustainable option. However, as the use phase cannot be disregarded, conclusions must be drawn with this phase included. When kerosene was used, the fully thermoplastic component proved to be the most sustainable choice, whereas under hydrogen usage, the fully aluminum component was the most sustainable, followed by the Aluminum-CFRP thermoset configuration. In scenarios where costs were prioritized, the fully aluminum component was the most sustainable option when the use phase was excluded. However, when considering kerosene, the fully thermoplastic component remained the most sustainable. Similarly, when hydrogen was used, the fully thermoplastic component also emerged as the most sustainable. Lastly, when environmental impact was given priority, the fully Aluminum component was again the most sustainable choice when the use phase was excluded. For kerosene scenarios, the fully thermoplastic component was the most sustainable, while for hydrogen scenarios, the fully aluminum component remained the most sustainable option.
In conclusion, this approach provides versatility, enabling users to quickly and effectively select the most suitable solution, including sustainability considerations, from the early design stages. It shows great promise for broader application in the aviation sector and beyond. To enhance the accuracy of sustainability evaluations, future research could focus on refining the Multi-Criteria Decision-Making (MCDM) process, and improving the quantification and integration of sustainability metrics. Additionally, the methodology’s adaptability could be further enhanced by tailoring it for application in other industries, such as energy, machine design, civil engineering, and automotive sectors. Greater stakeholder collaboration and alignment with regulatory frameworks could also facilitate the methodology’s adoption, leading to more comprehensive and widely applicable sustainability assessments. This would pave the way for more effective integration of sustainability principles across diverse fields and industries.
Conflicts of Interest
The authors declare no conflicts of interest.
References
- S. Ahmad, K. Y. Wong, M. L. Tseng, and W. P. Wong, “Sustainable product design and development: A review of tools, applications and research prospects,” Resour Conserv Recycl, vol. 132, pp. 49–61, 2018. https://doi.org/10.1016/j.resconrec.2018.01.020. [CrossRef]
- F. Ceschin and İ. Gaziulusoy, “Evolution of design for sustainability: From product design to design for system innovations and transitions,” Des Stud, vol. 47, Sep. 2016. https://doi.org/10.1016/j.destud.2016.09.002. [CrossRef]
- T. ; Achtelik and Tiwari, “Ecological lightweight design for sustainable composites: Need for application of frugal engineering principles Standard-Nutzungsbedingungen”. https://doi.org/10.15480/882.4772. [CrossRef]
- G. Parolin, A. T. Borges, L. C. C. Santos, and A. V Borille, “A tool for aircraft eco-design based on streamlined Life Cycle Assessment and Uncertainty Analysis,” Procedia CIRP, vol. 98, pp. 565–570, 2021. https://doi.org/10.1016/j.procir.2021.01.152. [CrossRef]
- S. Lazăr, D. Dobrotă, R.-E. Breaz, and S.-G. Racz, “Eco-Design of Polymer Matrix Composite Parts: A Review,” Polymers (Basel), vol. 15, no. 17, 2023. https://doi.org/10.3390/polym15173634. [CrossRef]
- K. Salah, “Environmental impact reduction of commercial aircraft around airports. Less noise and less fuel consumption,” European Transport Research Review, vol. 6, no. 1, pp. 71–84, 2014. https://doi.org/10.1007/s12544-013-0106-0. [CrossRef]
- N. Antoine and I. Kroo, “Aircraft Optimization for Minimal Environmental Impact,” J Aircr, vol. 41, Jul. 2004. https://doi.org/10.2514/1.71. [CrossRef]
- Fraunhofer ICT, “ Clean Sky.” Accessed: Nov. 20, 2024. Online.. Available: “https://www.ict.fraunhofer.de/en/projects/CleanSky.html#Clean-Sky-2-Eco-Design.
- Clean Aviation, “Eco-Design TA.” Accessed: Nov. 20, 2024. Online.. Available: https://www.clean-aviation.eu/.
- W. Wellbrock, D. Ludin, L. Röhrle, and W. Gerstlberger, “Sustainability in the automotive industry, importance of and impact on automobile interior – insights from an empirical survey,” International Journal of Corporate Social Responsibility, vol. 5, no. 1, p. 10, 2020. https://doi.org/10.1186/s40991-020-00057-z. [CrossRef]
- C. Llatas, B. Soust-Verdaguer, and A. Passer, “Implementing Life Cycle Sustainability Assessment during design stages in Building Information Modelling: From systematic literature review to a methodological approach,” Build Environ, vol. 182, p. 107164, 2020. https://doi.org/10.1016/j.buildenv.2020.107164. [CrossRef]
- Y. Wang, H. Yin, S. Zhang, and X. Yu, “Multi-objective optimization of aircraft design for emission and cost reductions,” Chinese Journal of Aeronautics, vol. 27, no. 1, pp. 52–58, 2014. https://doi.org/10.1016/j.cja.2013.12.008. [CrossRef]
- X. Chai, X. Yu, and Y. Wang, “Tradeoff Study between Cost and Environmental Impact of Aircraft Using Simultaneous Optimization of Airframe and Engine Cycle,” International Journal of Aerospace Engineering, vol. 2017, no. 1, p. 2468535, Jan. 2017. https://doi.org/10.1155/2017/2468535. [CrossRef]
- T. Mu and L. Tao, “Civil Aircraft Multi-Objective Design Optimization for Cost and Emission Reduction,” in Journal of Physics: Conference Series, Institute of Physics, 2023. https://doi.org/10.1088/1742-6596/2541/1/012034. [CrossRef]
- R. Vitali, O. Park, R. T. Haftka, B. V Sankar, and C. A. Rose, “Structural Optimization of a Hat-Stiffened Panel Using Response Surfaces,” J Aircr, vol. 39, no. 1, pp. 158–166, Jan. 2002. https://doi.org/10.2514/2.2910. [CrossRef]
- D. Munk and J. Miller, “Topology Optimization of Aircraft Components for Increased Sustainability,” AIAA Journal, pp. 1–16, Aug. 2021. https://doi.org/10.2514/1.J060259. [CrossRef]
- T. L. Htet, “Structural analysis and topology design optimization of load bearing elements of aircraft fuselage structure,” IOP Conf Ser Mater Sci Eng, vol. 709, no. 4, p. 044113, 2020. https://doi.org/10.1088/1757-899X/709/4/044113. [CrossRef]
- L. U. Hansen and P. Horst, “Multilevel optimization in aircraft structural design evaluation,” Comput Struct, vol. 86, no. 1, pp. 104–118, 2008. https://doi.org/10.1016/j.compstruc.2007.05.021. [CrossRef]
- J. Wong, L. Ryan, and I. Y. Kim, “Design optimization of aircraft landing gear assembly under dynamic loading,” Structural and Multidisciplinary Optimization, vol. 57, no. 3, pp. 1357–1375, 2018. https://doi.org/10.1007/s00158-017-1817-y. [CrossRef]
- E. A. Calado, M. Leite, and A. Silva, “Selecting composite materials considering cost and environmental impact in the early phases of aircraft structure design,” J Clean Prod, vol. 186, pp. 113–122, 2018. https://doi.org/10.1016/j.jclepro.2018.02.048. [CrossRef]
- E. A. Calado, M. Leite, and A. Silva, “Integrating life cycle assessment (LCA) and life cycle costing (LCC) in the early phases of aircraft structural design: an elevator case study,” Int J Life Cycle Assess, vol. 24, no. 12, pp. 2091–2110, 2019. https://doi.org/10.1007/s11367-019-01632-8. [CrossRef]
- Barke, C. Thies, S. P. Melo, F. Cerdas, C. Herrmann, and T. S. Spengler, “Socio-economic life cycle assessment of future aircraft systems,” Procedia CIRP, vol. 90, pp. 262–267, 2020. https://doi.org/10.1016/j.procir.2020.01.096. [CrossRef]
- S. Hoffenson, A. Forslund, and R. Söderberg, Sustainability-Driven Tolerancing and Design Optimization of an Aircraft Engine Component, vol. 12. 2013. https://doi.org/10.1115/IMECE2013-63520. [CrossRef]
- F. Di Maio and P. C. Rem, “A Robust Indicator for Promoting Circular Economy through Recycling,” J Environ Prot (Irvine, Calif), vol. 06, no. 10, pp. 1095–1104, 2015. https://doi.org/10.4236/jep.2015.610096. [CrossRef]
- D. N. Markatos and S. G. Pantelakis, “Assessment of the Impact of Material Selection on Aviation Sustainability, from a Circular Economy Perspective,” Aerospace, vol. 9, no. 2, 2022. https://doi.org/10.3390/aerospace9020052. [CrossRef]
- Filippatos et al., “Sustainability-Driven Design of Aircraft Composite Components,” Aerospace, vol. 11, no. 1, 2024. https://doi.org/10.3390/aerospace11010086. [CrossRef]
- Markatos Dionysios N., Katsiropoulos Christos V., Tserpes Konstantinos I., and Pantelakis Spiros G., “A holistic End-of-Life (EoL) Index for the quantitative impact assessment of CFRP waste recycling techniques,” Manufacturing Rev., vol. 8, p. 18, 2021. https://doi.org/10.1051/mfreview/2021016. [CrossRef]
- 3852; Filippatos, A. Theochari, S. Malefaki, D. N. Markatos, T. Kalampoukas, and S. G. Pantelakis, “A PROPOSAL TOWARDS A STEP CHANGE FROM ECO-DRIVEN TO SUSTAINABILITY-DRIVEN DESIGN OF AIRCRAFT COMPONENTS.” Online.. Available: https://www.researchgate.net/publication/385272877.
- E. Barkanov, “Optimal weight design of laminated composite panelswith different stiffeners under buckling loads,” in 27TH INTERNATIONAL CONGRESS OF THE AERONAUTICAL SCIENCES , 2010.
- R. Boyer, “Aircraft Materials,” Encyclopedia of Materials: Science and Technology, pp. 66–73, 2001.
- “Ansys® Workbench,” 2024, ANSYS, Inc: R2.
- B. Q. Trung, L. M. Duc, and B. T. M. Anh, “A Hybrid Approach Based on Genetic Algorithm with Ranking Aggregation for Feature Selection,” in Advances and Trends in Artificial Intelligence. Theory and Practices in Artificial Intelligence, H. Fujita, P. Fournier-Viger, M. Ali, and Y. Wang, Eds., Cham: Springer International Publishing, 2022, pp. 226–239.
- R. E. and C. G. B. Berger Paul D. and Maurer, “Introduction to Response-Surface Methodology,” in Experimental Design: With Application in Management, Engineering, and the Sciences., Cham: Springer International Publishing, 2018, pp. 533–584. https://doi.org/10.1007/978-3-319-64583-4_16. [CrossRef]
- S. Documentation, “Simulation and Model-Based Design,” 2023, MathWorks. Accessed: Nov. 20, 2024. Online.. Available: https://www.mathworks.com/products/simulink.html.
- The MathWorks Inc., “MATLAB version: 23.2 (R2023b),” 2023, Natick, Massachusetts, United States. Accessed: Nov. 20, 2024. Online.. Available: https://www.mathworks.com.
- P. D. Barsanescu and A. M. Comanici, “von Mises hypothesis revised,” Acta Mech, vol. 228, no. 2, pp. 433–446, 2017. https://doi.org/10.1007/s00707-016-1706-2. [CrossRef]
- J. Labuz and A. Zang, “Mohr–Coulomb Failure Criterion,” Rock Mech Rock Eng, vol. 45, Nov. 2012. https://doi.org/10.1007/s00603-012-0281-7. [CrossRef]
- M. Rezasefat, A. Gonzalez-Jimenez, M. Giglio, and A. Manes, “An evaluation of Cuntze and Puck inter fibre failure criteria in simulation of thin CFRP plates subjected to low velocity impact,” Compos Struct, vol. 278, p. 114654, 2021. https://doi.org/10.1016/j.compstruct.2021.114654. [CrossRef]
- “Electricity prices for household consumers - bi-annual data (from 2007 onwards),” 2024. Accessed: Nov. 20, 2024. Online.. Available: https://ec.europa.eu/eurostat/databrowser/explore/all/envir?lang=en&subtheme=nrg.nrg_price.nrg_pc&display=list&sort=category&extractionId=nrg_pc_204.
- “Ansys® Granta,” 2024, ANSYS, Inc: R2.
- Simple Flying Staff & Dr. Omar Memon, .“What’s The Minimum Distance For A Flight To Be Deemed A Long-Haul Service?” Accessed: Nov. 20, 2024. Online.. Available: https://simpleflying.com/long-haul-flight-minimum-distance-guide/#:~:text=UK%E2%80%99s%20law%20splits%20flights%20into%20three%20categories%3A%201,3%2C000%20kilometers%20%28for%20example%2C%20London%20to%20New%20York%29.
- “How Long Does a Commercial Aircraft Last?,” aviationfile. Accessed: Nov. 20, 2024. Online.. Available: https://www.aviationfile.com/how-long-does-a-commercial-aircraft-last/.
- Y. Bicer and I. Dincer, “Life cycle evaluation of hydrogen and other potential fuels for aircrafts,” Int J Hydrogen Energy, vol. 42, no. 16, pp. 10722–10738, 2017. https://doi.org/10.1016/j.ijhydene.2016.12.119. [CrossRef]
- “Ansys® Granta,” 2024, ANSYS, Inc: R2.
- “What are the sources of carbon dioxide in the atmosphere?” Accessed: Nov. 20, 2024. Online.. Available: https://www.csiro.au/en/research/environmental-impacts/climate-change/Climate-change-QA/Sources-of-CO2.
- C. Spreafico, “Prospective life cycle assessment of titanium powder atomization,” J Clean Prod, vol. 468, p. 143104, 2024. https://doi.org/10.1016/j.jclepro.2024.143104. [CrossRef]
- G. Olabi et al., “Green hydrogen: Pathways, roadmap, and role in achieving sustainable development goals,” Process Safety and Environmental Protection, vol. 177, pp. 664–687, 2023. https://doi.org/10.1016/j.psep.2023.06.069. [CrossRef]
- J. A. S. . Green, Aluminum recycling and processing for energy conservation and sustainability. ASM International, 2007.
- F. Di Maio and P. C. Rem, “A Robust Indicator for Promoting Circular Economy through Recycling,” J Environ Prot (Irvine, Calif), vol. 06, no. 10, pp. 1095–1104, 2015. https://doi.org/10.4236/jep.2015.610096. [CrossRef]
- De Pascale, R. Arbolino, K. Szopik-Depczyńska, M. Limosani, and G. Ioppolo, “A systematic review for measuring circular economy: The 61 indicators,” J Clean Prod, vol. 281, p. 124942, 2021. https://doi.org/10.1016/j.jclepro.2020.124942. [CrossRef]
- L. Giorgini et al., “Recovery of carbon fibers from cured and uncured carbon fiber reinforced composites wastes and their use as feedstock for a new composite production,” Polym Compos, vol. 36, no. 6, pp. 1084–1095, Jun. 2015. https://doi.org/10.1002/pc.23440. [CrossRef]
- M. Ateeq, “A state of art review on recycling and remanufacturing of the carbon fiber from carbon fiber polymer composite,” Composites Part C: Open Access, vol. 12, p. 100412, 2023. https://doi.org/10.1016/j.jcomc.2023.100412. [CrossRef]
- L. Giorgini et al., “Recovery of carbon fibers from cured and uncured carbon fiber reinforced composites wastes and their use as feedstock for a new composite production,” Polym Compos, vol. 36, no. 6, pp. 1084–1095, Jun. 2015. https://doi.org/10.1002/pc.23440. [CrossRef]
- L. E. Nielsen, Mechanical properties of polymer and composites, vol. 2. New York: Marcel Dekker, 1974.
- Y. Lu, A. C. Loos, M. W. Hyer, and R. C. Batra, “Mechanical Properties of Random Discontinuous Fiber Composites Manufactured from Wetlay Process,” 2002.
- “Guidelines for SOCIAL LIFE CYCLE ASSESSMENT OF PRODUCTS AND ORGANIZATIONS 2020.”.
- The United Nations, “The 17 Sustainable Development Goals,” Paris, 2015.
- Ansys®, “sLCA tool,” Oct. 2024, Ansys Inc.
- Filippatos et al., “Sustainability-Driven Design of Aircraft Composite Components,” Aerospace, vol. 11, no. 1, Jan. 2024. https://doi.org/10.3390/aerospace11010086. [CrossRef]
- “What is Normalization in Machine Learning? A Comprehensive Guide to Data Rescaling.” Accessed: Nov. 20, 2024. Online.. Available: https://www.datacamp.com/tutorial/normalization-in-machine-learning?dc_referrer=https%3A%2F%2Fwww.bing.com%2F.
- T. L. Saaty, “The analytic hierarchy process (AHP),” J Oper Res Soc, vol. 41, no. 11, pp. 1073–1076, 1980.
Figure 1.
Flowchart of methodology in which Phases 1-4 explain the procedure to integrate sustainability aspects in early design stages.
Figure 1.
Flowchart of methodology in which Phases 1-4 explain the procedure to integrate sustainability aspects in early design stages.
Figure 2.
Geometry and dimensions of hat stiffened panel.
Figure 2.
Geometry and dimensions of hat stiffened panel.
Figure 3.
Boundary and Loading conditions.
Figure 3.
Boundary and Loading conditions.
Figure 4.
Mesh of hat stiffened panel for Finite Element Analysis.
Figure 4.
Mesh of hat stiffened panel for Finite Element Analysis.
Figure 5.
Comparison of materials costs - no use phase case.
Figure 5.
Comparison of materials costs - no use phase case.
Figure 6.
Comparison of materials costs - kerosene fuel used.
Figure 6.
Comparison of materials costs - kerosene fuel used.
Figure 7.
Comparison of materials costs - hydrogen fuel used.
Figure 7.
Comparison of materials costs - hydrogen fuel used.
Figure 8.
Environmental impact comparison- no use phase case.
Figure 8.
Environmental impact comparison- no use phase case.
Figure 9.
Environmental impact comparison - kerosene fuel considered.
Figure 9.
Environmental impact comparison - kerosene fuel considered.
Figure 10.
Environmental impact comparison – hydrogen fuel considered.
Figure 10.
Environmental impact comparison – hydrogen fuel considered.
Figure 11.
Radar chart of optimal design variants of each material configuration-equal weights- no use phase.
Figure 11.
Radar chart of optimal design variants of each material configuration-equal weights- no use phase.
Figure 12.
Radar chart of optimal design variants of each material configuration -equal weights- kerosene use phase.
Figure 12.
Radar chart of optimal design variants of each material configuration -equal weights- kerosene use phase.
Figure 13.
Radar chart of optimal design variants of each material configuration-equal weights- hydrogen use phase.
Figure 13.
Radar chart of optimal design variants of each material configuration-equal weights- hydrogen use phase.
Figure 14.
Priority on Cost - Radar chart of optimal design variants of each material configuration- No use phase.
Figure 14.
Priority on Cost - Radar chart of optimal design variants of each material configuration- No use phase.
Figure 15.
Priority on Cost - Radar chart of optimal design variants of each material configuration- Kerosene use phase.
Figure 15.
Priority on Cost - Radar chart of optimal design variants of each material configuration- Kerosene use phase.
Figure 16.
Priority on Cost - Radar chart of optimal design variants of each material configuration- Hydrogen use phase.
Figure 16.
Priority on Cost - Radar chart of optimal design variants of each material configuration- Hydrogen use phase.
Figure 17.
Radar chart of optimal design variants of each material configuration- no use phase.
Figure 17.
Radar chart of optimal design variants of each material configuration- no use phase.
Figure 18.
Radar chart of optimal design variants of each material configuration- kerosene use phase.
Figure 18.
Radar chart of optimal design variants of each material configuration- kerosene use phase.
Figure 19.
Radar chart of optimal design variants of each material configuration- hydrogen-fueled use phase.
Figure 19.
Radar chart of optimal design variants of each material configuration- hydrogen-fueled use phase.
Table 1.
Material Configurations on skin and stringer components.
Table 1.
Material Configurations on skin and stringer components.
| |
Component Configurations |
| No. |
Skin |
Stringer |
| 1 |
Aluminium 2024 T3 |
Aluminium 2024 T3 |
| 2 |
Carbon Fiber Reinforced Composite (thermoset) |
Aluminium 2024 T3 |
| 3 |
Aluminium 2024 T3 |
Carbon Fiber Reinforced Plastic (thermoset) |
| 4 |
Carbon Fiber Reinforced Plastic (thermoset) |
Carbon Fiber Reinforced Plastic (thermoset) |
| 5 |
Ti-6Al-4V |
Carbon Fiber Reinforced Plastic (thermoset) |
| 6 |
Carbon Fiber Reinforced Thermoplastic
Polymer (PEEK) |
Carbon Fiber Reinforced Thermoplastic
Polymer (PEEK) |
Table 2.
Requirements and parametric design factors.
Table 2.
Requirements and parametric design factors.
| Requirements |
Parametric design |
| Structural |
Sustainability |
Constraints |
Variables |
Parameters |
The safety factor should be
between 1.15 and 1.5
No damage should occur
Minimization of total
deformation
Maximization of mode 1 eigenfrequency |
• Minimization of the
environ mental footprint
• Minimization of cost
• Minimization of social
impact
• Maximization of circularity |
Safety factor:
between 1.15 and 1.5 |
Thickness of skin:
3-8 mm
Thickness of stringer:
3-8 mm
Crown width:
35-55 mm |
Total deformation
Mode 1 eigenfrequency
Mass of skin
Mass of stringer |
Table 3.
Specific assumptions for the materials used.
Table 3.
Specific assumptions for the materials used.
| Material |
Primary Process |
Disposal |
| AL |
Hot metal extrusion |
Closed-loop recycling - smelting |
| Ti |
Powder extrusion |
Closed-loop recycling – electrode induction gas atomization scrap |
| CFRP |
Autoclave |
Downcycling – Pyrolysis (chopped recycled carbon fibers, disposal of resin matrix) |
| CF/PEEK |
Autoclave |
Downcycling – Pyrolysis (chopped recycled carbon fibers, recycling of PEEK matrix) |
Table 4.
Quality reduction of considered materials.
Table 4.
Quality reduction of considered materials.
| Material |
Quality Reduction |
| Al |
<1% |
| Ti |
<1% |
| CFRP |
18,38% |
| CF/PEEK |
27,78% |
Table 5.
Best case scenario for AL-AL.
Table 5.
Best case scenario for AL-AL.
| AL-AL |
Social Impact Categories |
Social count |
| Phases |
Countries |
Workers |
Consumers |
Society |
Local community |
Value Chain |
| Primary Process |
AUS |
0 |
1 |
3 |
0 |
0 |
4 |
| Manufacturing |
GER |
0 |
1 |
3 |
0 |
0 |
4 |
| Disposal |
TPE |
1 |
0 |
1 |
0 |
0 |
2 |
| Total score |
10 |
Table 6.
Worst case scenario for AL-AL.
Table 6.
Worst case scenario for AL-AL.
| AL-AL |
Social Impact Categories |
Social count |
| Phases |
Countries |
Workers |
Consumers |
Society |
Local community |
Value Chain |
| Primary Process |
BRA |
3 |
3 |
4 |
2 |
2 |
14 |
| Manufacturing |
ARG |
2 |
2 |
4 |
1 |
2 |
11 |
| Disposal |
IND |
6 |
2 |
6 |
4 |
2 |
20 |
| Total score |
45 |
Table 7.
Ranking of material configurations- no use phase.
Table 7.
Ranking of material configurations- no use phase.
| SUSTAINABILITY RANKING – EQUAL WEIGHTS – NO USE PHASE |
| Thickness skin (mm) |
Mass of skin
(kg) |
Thickness stringer (mm) |
Mass of stringer
(kg) |
Crown width (mm) |
| No.1: AL - AL , SI = 0.862 ± 0.019 |
| 4.49 ± 0.94 |
2.39 ± 0.51 |
4.38 ± 0.36 |
1.96 ± 0.15 |
44.98 ± 3.18 |
| No.2: AL - CFRP , SI = 0.709 ± 0.009 |
| 4.60 ± 0.93 |
2.44 ± 0.49 |
6.02 ± 0.52 |
1.45 ± 0.12 |
44.61 ± 3.11 |
| No.3: CFRP - AL , SI = 0.680 ± 0.014 |
| 6.00 ± 0.56 |
1.72 ± 0.16 |
5.53 ± 0.40 |
2.49 ± 0.17 |
43.96 ± 2.89 |
| No.4: Ti - CFRP , SI = 0.556 ± 0.035 |
| 4.52 ± 0.93 |
3.85 ± 0.79 |
5.90 ± 0.55 |
1.42 ± 0.13 |
44.89 ± 3.09 |
| No. 5: CF/PEEK - CF/PEEK , SI = 0.553 ± 0.026 |
| 6.47 ± 0.40 |
1.82 ± 0.13 |
6.38 ± 0.46 |
1.57 ± 0.09 |
42.76 ± 2.33 |
| No.6: CFRP - CFRP , SI = 0.536 ± 0.021 |
| 6.47 ± 0.40 |
1.82 ± 0.13 |
6.38 ± 0.46 |
1.57 ± 0.09 |
42.75 ± 2.31 |
Table 8.
Ranking of material configurations- kerosene.
Table 8.
Ranking of material configurations- kerosene.
Sustainability Ranking
Equal Weights
Kerosene |
Material Configuration |
Sustainability Index |
| 1 |
CF/PEEK-CF/PEEK |
0.764 ± 0.029 |
| 2 |
AL-CFRP |
0.727 ± 0.040 |
| 3 |
AL-AL |
0.711 ± 0.050 |
| 4 |
CFRP-CFRP |
0.696 ± 0.034 |
| 5 |
CFRP-AL |
0.638 ± 0.021 |
| 6 |
Ti-CFRP |
0.616 ± 0.086 |
Table 9.
Ranking of material configurations- hydrogen.
Table 9.
Ranking of material configurations- hydrogen.
Sustainability Ranking
Equal Weights
Hydrogen |
Material Configuration |
Sustainability Index |
| 1 |
AL-AL |
0.738 ± 0.021 |
| 2 |
AL-CFRP |
0.719 ± 0.018 |
| 3 |
CF/PEEK-CF/PEEK |
0.689 ± 0.029 |
| 4 |
CFRP-AL |
0.658 ± 0.022 |
| 5 |
CFRP-CFRP |
0.637 ± 0.031 |
| 6 |
Ti-CFRP |
0.572 ± 0.078 |
Table 10.
Priority on Cost - Ranking of material configurations- No use phase.
Table 10.
Priority on Cost - Ranking of material configurations- No use phase.
Sustainability Ranking –
Priority on Cost
No Use Phase |
Material Configuration |
Sustainability Index |
| 1 |
AL-AL |
0.933 ± 0.016 |
| 2 |
AL-CFRP |
0.716 ± 0.017 |
| 3 |
CFRP-AL |
0.701 ± 0.019 |
| 4 |
Ti-CFRP |
0.562 ± 0.038 |
| 5 |
CFRP-CFRP |
0.519 ± 0.109 |
| 6 |
CF/PEEK-CF/PEEK |
0.409 ± 0.131 |
Table 11.
Priority on Cost - Ranking of material configurations- use phase: Kerosene.
Table 11.
Priority on Cost - Ranking of material configurations- use phase: Kerosene.
Sustainability Ranking –
Priority on Cost
Use Phase: Kerosene |
Material Configuration |
Sustainability Index |
| 1 |
CF/PEEK-CF/PEEK |
0.813 ± 0.036 |
| 2 |
CFRP-CFRP |
0.786 ± 0.035 |
| 3 |
AL-CFRP |
0.720 ± 0.089 |
| 4 |
AL-AL |
0.688 ± 0.095 |
| 5 |
CFRP-AL |
0.677 ± 0.058 |
| 6 |
Ti-CFRP |
0.467 ± 0.145 |
Table 12.
Priority on Cost - Ranking of material configurations- use phase: Hydrogen.
Table 12.
Priority on Cost - Ranking of material configurations- use phase: Hydrogen.
Sustainability Ranking –
Priority on Cost
Use Phase: Hydrogen |
Material Configuration |
Sustainability Index |
| 1 |
CF/PEEK-CF/PEEK |
0.783 ± 0.034 |
| 2 |
CFRP-CFRP |
0.753 ± 0.034 |
| 3 |
AL-CFRP |
0.721 ± 0.080 |
| 4 |
AL-AL |
0.706 ± 0.085 |
| 5 |
CFRP-AL |
0.676 ± 0.054 |
| 6 |
Ti-CFRP |
0.453 ± 0.138 |
Table 13.
Ranking of material configurations- no use phase.
Table 13.
Ranking of material configurations- no use phase.
Sustainability Ranking –
Priority on Environmental Impact
No Use Phase |
Material Configuration |
Sustainability Index |
| 1 |
AL-AL |
0.905 ± 0.017 |
| 2 |
AL-CFRP |
0.723 ± 0.022 |
| 3 |
CFRP-AL |
0.706 ± 0.022 |
| 4 |
CFRP-CFRP |
0.554 ± 0.087 |
| 5 |
CF/PEEK-CF/PEEK |
0.472 ± 0.061 |
| 6 |
Ti-CFRP |
0.387 ± 0.084 |
Table 14.
Ranking of material configurations- use phase: kerosene.
Table 14.
Ranking of material configurations- use phase: kerosene.
Sustainability Ranking –
Priority on Environmental Impact
Use Phase: Kerosene |
Material Configuration |
Sustainability Index |
| 1 |
CF/PEEK-CF/PEEK |
0.831 ± 0.035 |
| 2 |
CFRP-CFRP |
0.796 ± 0.034 |
| 3 |
AL-CFRP |
0.720 ± 0.089 |
| 4 |
AL-AL |
0.682 ± 0.096 |
| 5 |
CFRP-AL |
0.675 ± 0.058 |
| 6 |
Ti-CFRP |
0.466 ± 0.145 |
Table 15.
Ranking of material configurations- use phase: hydrogen.
Table 15.
Ranking of material configurations- use phase: hydrogen.
Sustainability Ranking –
Priority on Environmental Impact
Use Phase: Hydrogen |
Material Configuration |
Sustainability Index |
| 1 |
AL-AL |
0.873 ± 0.025 |
| 2 |
AL-CFRP |
0.718 ± 0.029 |
| 3 |
CFRP-AL |
0.685 ± 0.028 |
| 4 |
CF/PEEK-CF/PEEK |
0.568 ± 0.029 |
| 5 |
CFRP-CFRP |
0.539 ± 0.029 |
| 6 |
Ti-CFRP |
0.379 ± 0.098 |
|
Disclaimer/Publisher’s Note: The statements, opinions and data contained in all publications are solely those of the individual author(s) and contributor(s) and not of MDPI and/or the editor(s). MDPI and/or the editor(s) disclaim responsibility for any injury to people or property resulting from any ideas, methods, instructions or products referred to in the content. |
© 2024 by the authors. Licensee MDPI, Basel, Switzerland. This article is an open access article distributed under the terms and conditions of the Creative Commons Attribution (CC BY) license (http://creativecommons.org/licenses/by/4.0/).