
Submitted:
20 December 2024
Posted:
23 December 2024
You are already at the latest version
Abstract
Objective: To describe resources, performance and care provided in pulmonology units in Spain, assessing their association with 30-day readmission for Chronic obstructive pul-monary disease (COPD) and in-hospital mortality. Methods: This survey was conducted on 116 responsible for the COPD pathway in Pneumology Units/Services from November 2022 to March 2023. Results: Of the 116 participating hospitals, 56% had a pulmonology service and 25.9% had pneumology section. The great majority were public and university hospitals. The number of beds allocated to pulmonology/100,000 inhabitants was 6.6 (3.1-9.2) and pulmonologist staffing was 3.3 (2.6-4.1) per-100,000 inhabitants. In 31.9% of pulmonology unit, there was Intermediate Care Unit dependiente (IMCU) and respiratory team for 24-hour emergency care in 30%, while only 9.5% had interventional pulmonology units. COPD rehabilitation programmes were offered in 58.6% of pulmonology units. The average rate of patients on ventilatory support in acute failure was 13.8 (9.2-25) per-100 discharges, with a 30-day COPD readmission rate of 14.9% with significant differences according to the level of complexity (p=0.041), with a mean length of stay of 8.72 (1.26) days. The overall in-hospital mortality in pulmonology units was 4.10 (1.18) per-100 admissions. In the adjusted model having a discharge support programme and interventions performed during admission (number of patients with ventilatory support) were predictors of a favourable outcome. Hospital stay was also maintained as a predictor of an unfavourable outcome. Conclusions: Knowledge of resources and outcomes in the COPD process will allow appropriate planning to improve the quality of care.
Keywords:
Hospital admission
; COPD
; resources
; health care policy
; health disparities
; health care quality
1. Introduction
Chronic obstructive pulmonary disease (COPD) represents one of the most prevalent causes for hospital admissions and medical consultations [1,2], posing significant social and economic burdens anticipated to rise in the coming years [3,4,5]. Patients with COPD frequently encounter exacerbation episodes necessitating hospitalization. Among those surviving hospitalization, readmission due to acute exacerbation shortly after discharge remains a critical, unresolved issue. The high readmission rates associated with COPD correlate with increased mortality risk and substantial financial strain. Therefore, the prevention and reduction of readmissions have been prioritized as crucial management strategies. Recent research has delved into readmission rates and post-discharge risk factors. Audit studies have highlighted varied outcomes in COPD management, contingent upon patient characteristics and the medical care received [6,7], as evidenced in numerous studies examining the influence of treatment regimens and hospital resources on hospital mortality and readmissions post-discharge for COPD exacerbation [8,9,10].
The European COPD Audit revealed significant variability in resourcing and care organization across European hospitals treating COPD exacerbations. While some studies suggest that better-resourced facilities provide superior care [11,12], greater resources in larger hospitals do not invariably guarantee improved access to or standards of care [13]. Hence, other aspects of the care process, such as units led by qualified staff and standardized management plans to reduce practice variability, are essential elements upon which the quality of clinical care is founded.
Clinical audits are essential tools for identifying deficiencies in care, thereby raising awareness of these issues and ultimately improving the quality of care. Since 2014, the Spanish Society of Pneumology and Thoracic Surgery (SEPAR) has spearheaded a process of auditing COPD care with the objective of using clinical audits as a mechanism for continuous quality improvement [7,14]. In 2015, the RECALAR project [15], funded by SEPAR, assessed the resources and organizational structure for respiratory disease care in the pulmonology units of Spanish National Health System hospitals. Currently, there is a paucity of information regarding the resources and organizational models for COPD care within pulmonology units. Against this backdrop, the COPD Observatory project was conceived with the aim of analyzing the resources, activities, and organizational models in COPD care within Spanish Pneumology Units/Services through a survey conducted by clinical managers. Additionally, the project seeks to examine the association of these factors with outcomes such as 30-day COPD readmission rates and overall in-hospital mortality in pulmonology units.
2. Materials and Methods
The COPD Observatory project was conceived as a cross-sectional survey assessing the resources and organization dedicated to COPD care, promoted by SEPAR. The Spanish Society of Pneumology and Thoracic Surgery extended an official invitation to participate in the study to all respiratory units within Spanish National Health System hospitals, as per the 2021 Registry of the Ministry of Health [16]. Out of 223 hospitals invited, 116 (52%) participated. The intended respondents for the survey were those responsible for the COPD pathway in Pneumology Units/Services. The fieldwork was conducted from November 2022 to March 2023, with the participating hospitals and investigators detailed in Appendix 1.
The project’s steering committee comprised 17 chest physicians experienced in COPD, representing each of the 17 regional respiratory societies in Spain. Database items were selected by the steering committee and discussed via email and in face-to-face meetings. The survey included distinct questions regarding hospital and respiratory unit resources. A detailed list of the survey items is provided in Supplementary Table S1. The sources of information included a survey of pulmonology units on resources, performance, and care, as well as an analysis of data on 30-day COPD readmissions and overall mortality in pulmonology units through the coding of discharge reports by hospital admission services. Data were remotely entered by each participating site into a centrally controlled server. The web tool offered a help service with explanatory text to facilitate survey question interpretation. Surveys were administered after identifying the centers and contact persons at the 116 participating sites. For additional quality control during data collection, all completed surveys were reviewed to identify any issues or inconsistencies.
Statistical Analysis
Qualitative variables are presented with their frequency distribution, while quantitative variables are summarized by their mean and standard deviation (SD). Quantitative variables exhibiting an asymmetric distribution are summarized using the median and interquartile range (IQR). For the comparison of qualitative variables, the χ2 test or Fisher's exact test was employed when necessary. Comparisons of means between two independent groups were conducted using Student's t-test if the variables followed a normal distribution, or the nonparametric Mann-Whitney U test for asymmetric variables. For comparing means across more than two independent groups, analysis of variance (ANOVA) was used, or the nonparametric Kruskal-Wallis test for asymmetric variables. To examine the correlation between quantitative variables, Pearson's correlation coefficient was utilized, or Spearman's correlation coefficient when appropriate.
A simple linear regression model was applied to explore the association between the number of total admissions per 100 discharges in 2022 and potential individually associated factors. Additionally, a multiple linear regression model was employed to study the association jointly. A significance level of 5% was accepted for all tests. Data processing and analysis were performed using IBM SPSS Statistics v.26 and R v.4.4.1 software.
3. Results
Hospital Resources
The characteristics of the participating hospitals, categorized by their level of complexity, are summarized in Table 1. The majority of the participating centers were public institutions, with approximately three-quarters identified as university or teaching hospitals. Notably, 56% of these hospitals had a dedicated pulmonology service, while 14.7% lacked an organizational structure for pulmonology. The distribution of participating centers across the various autonomous communities, based on the hospital's level of complexity and the type of organizational entity of the pulmonology unit, is depicted in Figure 1.
Respiratory Unit Resources
The resources of the respiratory units are summarized in Table 1. On average, pulmonology units had 6.6 beds (range 3.1-9.2) per 100,000 population. The median number of pulmonologists per 100,000 population was 3.3 (range 2.6-4.1), with variations between low complexity centers at 2.9 (range 2.3-3.9) and high complexity centers at 3.7 (range 3-4.6). A majority of high complexity centers had an Intermediate Care Unit (IMCU) (65%) and offered 24-hour urgent care staffed by pulmonology (69.8%). More than half of the centers (58.6%) had rehabilitation programs, with 54.4% offering both inpatient and home rehabilitation. A minority of centers (9.5%) provided endoscopic volume reduction techniques for COPD patients. Specialized COPD consultations were available in 52.6% of the units, follow-up and discharge support programs in 55.2%, immediate COPD care devices in 44%, a consultant specialist for the COPD process in 45.6%, nursing consultations in 38.8%, and smoking prevention consultations in 48.3%. These resources were more frequently available in tertiary or level III centers. Nonetheless, follow-up and support programs at discharge were also significantly present in lower complexity centers.
Respiratory Units Performance
The average number of hospital discharges from pulmonology units was 266.2 (range 186.8-399.2) per 100,000 population, with a mean length of stay of 8.72 (SD 1.26) days. The average rate of patients requiring ventilatory support for acute failure was 13.8 (range 9.2-25) per 100 discharges, with a 30-day COPD readmission rate of 14.9%, showing significant differences according to the hospital's level of complexity (p=0.041). Overall in-hospital mortality was 4.10 (SD 1.18) per 100 admissions to pulmonology units, with no significant differences based on the hospital's level of complexity. The average number of patients on home ventilation programs was 57.8 (range 20.3-100.5) per 100,000 population. The average rate of spirometries performed per month per 100,000 population was 121.4 (range 70-225.7), with notable variations between low complexity centers (170.5, range 95.8-320) and high complexity centers (141.7, range 77.7-230.7). The number of bronchoscopic procedures performed per year per 100,000 population was 164 (range 114.8-244.8). The organizational performance of the respiratory units is summarized in Table 2.
Factors Associated with Outcomes: Overall In-Hospital Mortality and 30-Day COPD Readmissions for COPD Exacerbations
Table 3 outlines the bivariate association between 30-day readmissions for COPD and variables related to hospital resources, organization, and interventions performed during admission and at discharge. Significant variables associated with a lower 30-day COPD readmission rate include having a follow-up and support program at discharge, immediate care, specialized COPD consultation, nursing consultation, and specialist consultants in the COPD process, hospital stay, and the number of patients receiving ventilatory support. Conversely, most resource and organization variables were not related to in-hospital mortality (Table 4), with a regression coefficient correlation of 0.622 between in-hospital mortality and the number of acutely ventilated patients per 100 discharges (Figure 2).
In the multivariable analysis of 30-day COPD readmissions (Supplementary Table S2), the adjusted model retained only outcome predictors linked to organization (having a follow-up and discharge support program) and interventions performed during admission (number of patients on ventilatory support), both predictors of favorable outcomes. Hospital stay was also identified as a predictor of unfavorable outcomes.
4. Discussion
This study provides a significant dataset from pulmonology units in Spain, detailing COPD resources, activities, and care models, as well as data on readmissions and mortality for patients hospitalized due to COPD exacerbations. It offers insights into potential interventions to enhance the quality of care during hospital admissions. Findings indicate that resources such as discharge support programs and interventions like increased ventilatory support at discharge are associated with a reduced risk of 30-day COPD readmissions, whereas a longer hospital stay predicts unfavorable outcomes, likely reflecting COPD or patient severity.
Despite existing COPD management guidelines, there are no recommendations for minimum resources or service organization to ensure optimal care. This study examines the variation in resource provision for COPD patient management across 116 pulmonology units in Spain, exploring the correlation between hospital size, resource provision, and outcomes such as 30-day readmission rates for COPD exacerbation and in-hospital mortality. It updates data on the organizational structure and functioning of Spanish pulmonology units since the RECALAR [15] document was published in 2017.
Our data reveal a distribution of pulmonology units in Spanish hospitals similar to that of 2017. Of the population assessed, over half (56%) have an institutional service designation, 25.9% are sections, and the remainder are part of internal medicine services. According to our analysis, Spain has 6.6 pulmonology beds per 100,000 inhabitants and an average of 3.3 pulmonologists per 100,000 inhabitants. These figures align closely with the 2017 survey data [15], considering the impact of the COVID-19 pandemic declared in 2020, which underscored deficiencies in respiratory care due to high morbidity and mortality. Evidence suggests that more specialists per bed correlate with reduced hospital mortality, shorter stays, and lower readmission rates, thus improving health system efficiency. The AUDIPOC Audit [12] also links a higher number of respiratory specialists per bed with lower COPD mortality. Additionally, our analysis shows minimal variation by hospital complexity level (2.9 pulmonologists/100,000 in level I or primary hospitals versus 3.7/100,000 in level III or tertiary centers). Optimal specialist allocation per bed and comprehensive activity consideration are crucial for effective, high-quality hospital care. These findings underscore the need for improvement, especially since most surveyed centers are public and university-affiliated.
Hospitalization due to COPD exacerbations is linked with high in-hospital mortality rates, which range between 2.5%-15%, varying based on patient characteristics and the research setting [16,17]. In our study, the overall in-hospital mortality in pulmonology units was 4.1% (SD 1.1%), lower in level I centers at 2.6% (SD 1.2%), and higher in high-complexity centers, averaging 4.2% (SD 1.1%). There were no significant differences in in-hospital mortality based on the complexity level of the centers or the resources of the pulmonology units. Systematic reviews and meta-analyses indicate that several characteristics of COPD patients and comorbidities significantly correlate with increased mortality [18]. A meta-analysis of over 60,000 COPD patients revealed that non-surviving patients had more hospitalizations in the previous year, longer hospital stays, greater dyspnea during hospitalization, and were more likely to require ventilatory support [19]. Data from the European AUDIPOC audit demonstrated that greater resources in larger hospitals did not necessarily guarantee better access to care. Despite having more resources, larger hospitals did not show a marked difference in guideline adherence, emphasizing that optimizing risk stratification upon admission for COPD exacerbation, diagnosing respiratory acidosis within the first hours of admission, and timely specialist respiratory care team involvement result in better patient outcomes [20].
In the European COPD Audit, ventilatory support was significantly associated with in-hospital mortality [12]. The reasons for delaying or not offering non-invasive ventilatory support may be influenced by the availability and access to intermediate respiratory care units, as initially noted by Roberts et al. [21] and corroborated by the European COPD audit data [13]. Hence, early access to specialists who can provide non-invasive support in controlled settings, such as Intermediate Care Units (IMCUs), and having a specialized team that allows for continuous monitoring and timely intervention in case of respiratory complications, is crucial for improving outcomes in critically ill patients. In the 2012 European audit, over one-third of the centers reported they could not treat all eligible patients throughout the year for both invasive and non-invasive ventilation [13,20]. In our study, intermediate respiratory care units attached to pulmonology units were present in 65% of high-complexity (level III) hospitals, with a median of 7 beds (range 6-8.7) and a nurse-to-bed ratio of 4 (range 4-6). Most of these IMCUs were established during the SARS-CoV-2 pandemic. Two-thirds of level III hospitals had 24-hour emergency care provided by pulmonologists. These units, being less costly than intensive care units, improve hospital efficiency by optimally utilizing resources for each level of care, thus allowing better patient flow. Studies have shown that intermediate respiratory care units reduce mortality in severe exacerbations of chronic respiratory disease by administering non-invasive ventilatory support to patients with respiratory failure, a treatment proven effective in avoiding intubation in many cases and reducing the risks associated with invasive ventilation [22]. The expansion of these units within pulmonology units in Spain reflects the increasing need for intermediate respiratory care and their essential role in the current hospital structure.
Ventilatory support for acidotic respiratory failure during COPD admission has been shown to be a protective factor against in-hospital mortality [23]. Our study indicates that a median of 13.8 (range 9.2-25) inpatients per 100 discharges in pulmonology units benefit from acute non-invasive ventilation, with a median of 88.2 patients on long-term non-invasive ventilation per 100,000 population. These figures have doubled compared to those reported in the RECALAR [15] report in 2017, which indicated 46 patients per 100,000 inhabitants on home ventilatory support. This data is also somewhat higher than the European average of 66 patients per 100,000 inhabitants [24]. Home ventilation for COPD has been shown to reduce the risk of COPD readmission, especially in patients with a history of respiratory acidosis and hypercapnia [25,26]. Despite the increased use of mechanical ventilation as home therapy, information on its prescription in COPD remains limited. Data from an international web survey of physicians prescribing long-term non-invasive supportive care therapy revealed that the prescription rate of home mechanical ventilation in COPD patients was 38.5% of all prescriptions [30]. However, there is significant variability in the frequency of home mechanical ventilation prescriptions for COPD across different countries and regions [27,28].
COPD has become one of the diseases with the highest rates of early readmission within 30 days. One in five patients requires rehospitalization within 30 days of discharge following an exacerbation admission [29]. A recent systematic review reported that the rate of readmissions for acute exacerbations of COPD ranged from 6% to 24% within 30 days of discharge, based on an analysis of 24 studies [30]. These measurements may be confounded by variations in metric generation. Additionally, study design, age stage, WHO region, and length of hospital stay have been identified as potential sources of readmission rate heterogeneity. In our study, the median 30-day COPD readmission rate was 14.9% (range 10.1% - 18.7%), lower in level I complexity centers (10.7%, range 8.2% - 15%) compared to level III high complexity centers with a median of 13.1% (range 8.6% - 16.7%). These “early readmissions” increase morbidity and mortality, as patients often do not recover their baseline lung function [31,32]. Additionally, readmissions after COPD hospitalization add to the economic burden, estimated to cost $13 billion and associated with poor outcomes [23]. The identification of factors associated with increased risk has been a major focus of research in recent years. Despite the heterogeneity of studies, the most frequently described predictive variables related to the patient include advanced age, comorbidities, low socioeconomic status, social situation, previous admissions, severity of illness, low adherence to treatment, need for home ventilation, and fragility [33,34]. Additionally, factors related to the health system, such as hospital stay, lack of a defined follow-up program, or poor health education, are also significant. Our observation indicated that longer hospital stays were associated with higher readmission rates, consistent with systematic reviews demonstrating that length of stay correlates with an increased risk of readmissions for COPD [33]. Also, our analysis found that the 30-day readmission rate was closely related to the availability of a follow-up and support program after the acute phase of the disease. Studies evaluating comprehensive programs that provide multidisciplinary care from hospital to home have shown mixed results [35,36]. Approximately 50% of these readmissions could be avoided, often resulting from a fragmented healthcare system that discharges patients prematurely, poorly plans follow-up care transitions, inadequately communicates discharge instructions, fails in family education about the disease, and lacks communication with outpatient physicians responsible for future care [37]. However, it is important to recognize that there is a subset of COPD patients who are frail, with associated social factors, lacking family support, and with multiple comorbidities. These ‘hospital-dependent patients’ represent a vulnerable population with chronic clinical conditions. Recent studies suggest that traditional resources or interventions have not effectively reduced readmissions in this high-risk group [38,39,40]. There is a pressing need to continue improving community health services for more vulnerable patients, focusing on care planning and research to identify the most vulnerable COPD patients early.
The main strength of this study lies in its provision of novel information and its extensive coverage. However, to accurately interpret our results, several considerations must be taken into account. The information sources are reported by unit managers and have not been independently verified. Nonetheless, previous research studies on this topic, such as the 2017 RECALAR survey [15], were conducted using the same methodology, enabling comparison with results from over five years ago. It is worth noting that data collection was performed via an electronic form with explanatory texts to minimize ambiguity and interpretation issues. Data on outcomes (mortality and 30-day readmissions for COPD) and activities performed by the pulmonology unit were gathered from the admission services of the centers after coding hospitalization reports. However, these measurements may vary due to differences in metric generation across centers, such as variations in the use of the International Classification of Diseases and different exclusion criteria, such as transfers to other hospitals, which limit comparisons between centers.
5. Conclusions
The COPD Observatory survey provides pertinent data on the structure, resources, and organization of care within pulmonology units in Spain, specifically concerning COPD care. This study has uncovered significant variations in resources and operations based on the level of complexity, highlighting a stagnation in the growth of human resources and an increased implementation of intermediate respiratory care units and discharge support programs in pulmonology units. These strategies aim to reduce in-hospital mortality and readmissions for COPD. This information offers the opportunity to implement interventions that will enhance the quality of care and outcomes for COPD patients.
Supplementary Materials
The following supporting information can be downloaded at the website of this paper posted on Preprints.org, Table S1: Hospital-related variables; Table S2: Determinants of in-hospital mortality.
Author Contributions
Conceptualization, methodology, investigation, writing—review and editing MCR, JLRH. Resources, supervision, project administration and funding acquisition MCR, PCR, JDM, CE, AFG, JAGG, RG, JHH, JLB, JMFG, EM, JJMG, APS, JAR, SSP. RSH did the statistical analysis. All authors contributed to data analysis, results interpretation, drafting and revising the paper, and agreed to be accountable for all aspects of the work. All authors have read and agreed to the published version of the manuscript.
Funding
this research received no external funding. This study has been promoted and sponsored by the Spanish Society of Pneumology and Thoracic Surgery (SEPAR). This work has received funding from AstraZeneca Spain that included logistical support for the meetings needed to develop this document. The funders had no role in the design of the study; in the collection, analyses, or interpretation of data; in the writing of the manuscript; or in the decision to publish the results.
Institutional Review Board Statement
The study was carried out according to the principles of the Declaration of Helsinki. Data confidentiality was ensured according to the Law of Data Protection 2018. The study was approved by the Ethics Committee of the Hospital Clínico San Carlos (Madrid, Spain; internal code 21/724-E), no written informed consent was considered necessary.
Informed Consent Statement
Not applicable.
Data Availability Statement
Dataset available on request from the authors.
Acknowledgments
The authors thank the centers that participated in COPD OBSERVATORY study and participants investigators (Appendix 1) and Dr José Luis López Campos as coordinator of the COPD Area of SEPAR for his support in this project.
Conflicts of Interest
MCR has received speaker fees from AstraZeneca, Bial, Chiesi, CSL Behring, GlaxoSmithKline, Menarini, Sanofi and Grifols, and consulting fees from GlaxoSmithKline and Bial. The funders had no role in the design of the study; in the collection, analyses, or interpretation of data; in the writing of the manuscript; or in the decision to publish the results. PCR has received speaker fees from AstraZeneca, Chiesi, GlaxoSmithKline, Sanofi, and consulting fees from GlaxoSmithKline and AstraZeneca. JDM has received honoraria and funding from AstraZeneca, BIAL, Boehringer, Chiesi, FAES, Gebro, GSK, Janssen, Menarini, MSD, Novartis, Pfizer, Roche, Sanofi, Teva, and Zambón. CE declares no conflict of interest. AFG declares no conflict of interest. JAGG declares no conflict of interest. RG declares that has received payments as a speaker or participant in consultancies, or financial support for participation in congresses: Astra-Zeneca, GSK, Novartis, FAES, Chiesi, Mundipharma, Menarini, TEVA, Grifols, Ferrer, Boehringer-Ingelheim, Rovi, Gebro y Zambón. JHH declares no conflict of interest. JLB declares no conflict of interest. JMFG has received fees and financing from (alphabetical order): AstraZeneca, Bial, Boehringer Ingelheim, Chiesi, Faes, Ferrer, Gebro Pharma, GlaxoSmithKline, Laboratories Esteve, Menarini, MundiPharma, Rovi, Novartis. EM declares no conflict of interest. JJMG declares no conflict of interest. APS declares no conflict of interest. JAR reports grants and personal fees from Aflofarm, GSK, Pfizer, Novartis AG, Menarini, personal fees and non-financial support from Boehringer Ingelheim, Astra-Zeneca, Gebro, Rovi, Sanofi-Regeneron outside the submitted work. SSP has received speaker fees from AstraZeneca, Chiesi, GlaxoSmithKline and Menarini. and consulting fees from GlaxoSmithKline, Sanofi, Grifols and Bial. RSH declares no conflict of interest. JLRH has received speaker fees from Bial, Boehringer Ingelheim, CSL Behring, GlaxoSmithKline, Chiesi, Astrazeneca, Zambon and Grifols, and consulting fees from Bial.
Abbreviations
The following abbreviations are used in this manuscript:
| IMCU | Intermediate Care Unit dependiente |
| COPD | Chronic obstructive pulmonary disease |
| SEPAR | Spanish Society of Pneumology and Thoracic Surgery |
Appendix
Appendix 1: Participants in COPD OBSERVATORY study.
References
- World Health Organization, Burden of chronic obstructive pulmonary disease. http:// https://www.who.int/europe/health-topics/chronic-obstructive-pulmonary-disease-copd. (accessed on 22 Nov 2024).
- López-Campos, J.L.; Tan, W.; Soriano, J.B. Global burden of COPD. Respirology 2016, 21, 14–23. [Google Scholar] [CrossRef] [PubMed]
- Soriano, J.B.; Kendrick, P.J.; Paulson, K.R.; Gupta, V.; Abrams, E.M.; Adedoyin, R.A.; Adhikari, T.B.; Advani, S.M.; Agrawal, A.; Ahmadian, E.; et al. Prevalence and attributable health burden of chronic respiratory diseases, 1990–2017: a systematic analysis for the Global Burden of Disease Study 2017. Lancet Respir. Med. 2020, 8, 585–596. [Google Scholar] [CrossRef]
- Iheanacho, I.; Zhang, S.; King, D.; Rizzo, M.; Ismaila, A.S. Economic Burden of Chronic Obstructive Pulmonary Disease (COPD): A Systematic Literature Review. Int. J. Chronic Obstr. Pulm. Dis. 2020, 15, 439–460. [Google Scholar] [CrossRef]
- Rehman, A.U.; Hassali, M.A.A.; Muhammad, S.A.; Shah, S.; Abbas, S.; Ali, I.A.B.H.; Salman, A. The economic burden of chronic obstructive pulmonary disease (COPD) in the USA, Europe, and Asia: results from a systematic review of the literature. Expert Rev. Pharmacoeconomics Outcomes Res. 2019, 20, 661–672. [Google Scholar] [CrossRef] [PubMed]
- On behalf of the EPOCONSUL Study; Rubio, M. C.; López-Campos, J.L.; Soler-Cataluña, J.J.; Navarrete, B.A.; Soriano, J.B.; González-Moro, J.M.R.; Ferrer, M.E.F.; Hermosa, J.L.R. Variability in adherence to clinical practice guidelines and recommendations in COPD outpatients: a multi-level, cross-sectional analysis of the EPOCONSUL study. Respir. Res. 2017, 18, 200. [Google Scholar] [CrossRef]
- Rubio, M.C.; López-Campos, J.L.; Miravitlles, M.; Cataluña, J.J.S.; Navarrete, B.A.; Ferrer, M.E.F.; Hermosa, J.L.R. Variations in Chronic Obstructive Pulmonary Disease Outpatient Care in Respiratory Clinics: Results From the 2021 EPOCONSUL Audit. Arch. De Bronc- 2023, 59, 295–304. [Google Scholar] [CrossRef]
- Roberts, C.M.; Barnes, S.; Lowe, D.; Pearson, M.G. Evidence for a link between mortality in acute COPD and hospital type and resources. Thorax 2003, 58, 947–949. [Google Scholar] [CrossRef]
- Pozo-Rodríguez, F.; López-Campos, J.L.; Álvarez-Martínez, C.J.; Castro-Acosta, A.; Agüero, R.; Hueto, J.; Hernández-Hernández, J.; Barrón, M.; Abraira, V.; Forte, A.; et al. Clinical Audit of COPD Patients Requiring Hospital Admissions in Spain: AUDIPOC Study. PLOS ONE 2012, 7, e42156. [Google Scholar] [CrossRef] [PubMed]
- Stukel, T.A.; Fisher, E.S.; Alter, D.A.; Guttmann, A.; Ko, D.T.; Fung, K.; Wodchis, W.P.; Baxter, N.N.; Earle, C.C.; Lee, D.S. Association of Hospital Spending Intensity With Mortality and Readmission Rates in Ontario Hospitals. JAMA 2012, 307, 1037–1045. [Google Scholar] [CrossRef]
- Romley, J.A.; Jena, A.B.; Goldman, D.P.; Gilman, B.M.; Hockenberry, J.M.; Adams, E.K.; Milstein, A.S.; Wilson, I.B.; Becker, E.R.; Hussey, P.S.; et al. Hospital Spending and Inpatient Mortality: Evidence From California: an observational study. Ann. Intern. Med. 2011, 154, 160. [Google Scholar] [CrossRef] [PubMed]
- Hartl, S.; Lopez-Campos, J.L.; Pozo-Rodriguez, F.; Castro-Acosta, A.; Studnicka, M.; Kaiser, B.; Roberts, C.M. Risk of death and readmission of hospital-admitted COPD exacerbations: European COPD Audit. Eur. Respir. J. 2016, 47, 113–121. [Google Scholar] [CrossRef] [PubMed]
- López-Campos, J.L.; Hartl, S.; Pozo-Rodriguez, F.; Roberts, C.M. Variability of hospital resources for acute care of COPD patients: the European COPD Audit. Eur. Respir. J. 2013, 43, 754–762. [Google Scholar] [CrossRef] [PubMed]
- Rubio, M.C.; Navarrete, B.A.; Soriano, J.B.; Soler-Cataluña, J.J.; González-Moro, J.-M.R.; Ferrer, M.E.F.; Lopez-Campos, J.L. Clinical audit of COPD in outpatient respiratory clinics in Spain: the EPOCONSUL study. Int. J. Chronic Obstr. Pulm. Dis. 2017, ume 12, 417–426. [Google Scholar] [CrossRef]
- Estudio RECALAR. Monografia Archivos de Bronconeumologia de la SEPAR. 2018;5:1-64.
- Patil, S.P.; Krishnan, J.A.; Lechtzin, N.; Diette, G.B. In-Hospital Mortality Following Acute Exacerbations of Chronic Obstructive Pulmonary Disease. Arch. Intern. Med. 2003, 163, 1180–1186. [Google Scholar] [CrossRef] [PubMed]
- Cao, Y.; Xing, Z.; Long, H.; Huang, Y.; Zeng, P.; Janssens, J.-P.; Guo, Y. Predictors of mortality in COPD exacerbation cases presenting to the respiratory intensive care unit. Respir. Res. 2021, 22, 77. [Google Scholar] [CrossRef]
- Singanayagam, A.; Schembri, S.; Chalmers, J.D. Predictors of Mortality in Hospitalized Adults with Acute Exacerbation of Chronic Obstructive Pulmonary Disease. A Systematic Review and Meta-analysis. Ann. Am. Thorac. Soc. 2013, 10, 81–89. [Google Scholar] [CrossRef] [PubMed]
- Waeijen-Smit, K.; Crutsen, M.; Keene, S.; Miravitlles, M.; Crisafulli, E.; Torres, A.; Mueller, C.; Schuetz, P.; Ringbæk, T.J.; Fabbian, F.; et al. Global mortality and readmission rates following COPD exacerbation-related hospitalisation: a meta-analysis of 65 945 individual patients. ERJ Open Res. 2024, 10. [Google Scholar] [CrossRef] [PubMed]
- López-Campos, J.L.; Hartl, S.; Pozo-Rodriguez, F.; Roberts, C.M. European COPD Audit: design, organisation of work and methodology. Eur. Respir. J. 2013, 41, 270–276. [Google Scholar] [CrossRef] [PubMed]
- Roberts, C.M.; Stone, R.A.; Buckingham, R.J.; Pursey, N.A.; Lowe, D. ; On behalf of the National Chronic Obstructive Pulmonary Disease Resources and Outcomes Project (NCROP) implementation group Acidosis, non-invasive ventilation and mortality in hospitalised COPD exacerbations. Thorax 2011, 66, 43–48. [Google Scholar] [CrossRef]
- Confalonieri, M.; Trevisan, R.; Demsar, M.; Lattuada, L.; Longo, C.; Cifaldi, R.; Jevnikar, M.; Santagiuliana, M.; Pelusi, L.; Pistelli, R. Opening of a Respiratory Intermediate Care Unit in a General Hospital: Impact on Mortality and Other Outcomes. Respiration 2015, 90, 235–242. [Google Scholar] [CrossRef]
- Lindenauer, P.K.; Dharmarajan, K.; Qin, L.; Lin, Z.; Gershon, A.S.; Krumholz, H.M. Risk Trajectories of Readmission and Death in the First Year after Hospitalization for Chronic Obstructive Pulmonary Disease. Am. J. Respir. Crit. Care Med. 2018, 197, 1009–1017. [Google Scholar] [CrossRef]
- Lloyd-Owen, S.J.; Donaldson, G.C.; Ambrosino, N.; Escarabill, J.; Farre, R.; Fauroux, B.; Robert, D.; Schoenhofer, B.; Simonds, A.K.; Wedzicha, J.A. Patterns of home mechanical ventilation use in Europe: results from the Eurovent survey. Eur. Respir. J. 2005, 25, 1025–1031. [Google Scholar] [CrossRef]
- Ergan, B.; Oczkowski, S.; Rochwerg, B.; Carlucci, A.; Chatwin, M.; Clini, E.; Elliott, M.; Gonzalez-Bermejo, J.; Hart, N.; Lujan, M.; et al. European Respiratory Society guidelines on long-term home non-invasive ventilation for management of COPD. Eur. Respir. J. 2019, 54, 1901003. [Google Scholar] [CrossRef] [PubMed]
- Macrea, M.; Oczkowski, S.; Rochwerg, B.; Branson, R.D.; Celli, B.; Coleman, J.M.; Hess, D.R.; Knight, S.L.; Ohar, J.A.; Orr, J.E.; et al. Long-Term Noninvasive Ventilation in Chronic Stable Hypercapnic Chronic Obstructive Pulmonary Disease. An Official American Thoracic Society Clinical Practice Guideline. Am. J. Respir. Crit. Care Med. 2020, 202, e74–e87. [Google Scholar] [CrossRef] [PubMed]
- Crimi, C.; Noto, A.; Princi, P.; Cuvelier, A.; Masa, J.F.; Simonds, A.; Elliott, M.W.; Wijkstra, P.; Windisch, W.; Nava, S. Domiciliary Non-invasive Ventilation in COPD: An International Survey of Indications and Practices. COPD: J. Chronic Obstr. Pulm. Dis. 2016, 13, 483–490. [Google Scholar] [CrossRef] [PubMed]
- Egea-Santaolalla, C.J.; Vives, E.C.; Lobato, S.D.; Mangado, N.G.; Tomé, M.L.; Andrés, O.M.S. Ventilación mecánica a domicilio. Open Respir. Arch. 2020, 2, 67–88. [Google Scholar] [CrossRef]
- Shams, I.; Ajorlou, S.; Yang, K. A predictive analytics approach to reducing 30-day avoidable readmissions among patients with heart failure, acute myocardial infarction, pneumonia, or COPD. Heal. Care Manag. Sci. 2015, 18, 19–34. [Google Scholar] [CrossRef] [PubMed]
- Ruan, H.; Zhang, H.; Wang, J.; Zhao, H.; Han, W.; Li, J. Readmission rate for acute exacerbation of chronic obstructive pulmonary disease: A systematic review and meta-analysis. Respir. Med. 2022, 206, 107090. [Google Scholar] [CrossRef] [PubMed]
- Donaldson, G.C.; Seemungal, T.A.R.; Bhowmik, A.; A Wedzicha, J. Relationship between exacerbation frequency and lung function decline in chronic obstructive pulmonary disease. Thorax 2002, 57, 847–852. [Google Scholar] [CrossRef] [PubMed]
- Soler-Cataluna, J.J.; Martínez-García, M. .; Sánchez, P.R.; Salcedo, E.; Navarro, M.; Ochando, R. Severe acute exacerbations and mortality in patients with chronic obstructive pulmonary disease. Thorax 2005, 60, 925–931. [Google Scholar] [CrossRef]
- Fernández-García, S.; Represas-Represas, C.; Ruano-Raviña, A.; Mouronte-Roibás, C.; Botana-Rial, M.; Ramos-Hernández, C.; Fernández-Villar, A. Social and clinical predictors of short- and long-term readmission after a severe exacerbation of copd. PLOS ONE 2020, 15, e0229257. [Google Scholar] [CrossRef] [PubMed]
- Bernabeu-Mora, R.; Valera-Novella, E.; Bernabeu-Serrano, E.T.; Soler-Cataluña, J.J.; Calle-Rubio, M.; Medina-Mirapeix, F. Five-Repetition Sit-to-Stand Test as Predictor of Mortality in High Risk COPD Patients. Arch. De Bronc-, 2024. [Google Scholar] [CrossRef]
- Bhatt, S.P.; Wells, J.M.; Iyer, A.S.; Kirkpatrick, D.P.; Parekh, T.M.; Leach, L.T.; Anderson, E.M.; Sanders, J.G.; Nichols, J.K.; Blackburn, C.C.; et al. Results of a Medicare Bundled Payments for Care Improvement Initiative for Chronic Obstructive Pulmonary Disease Readmissions. Ann. Am. Thorac. Soc. 2017, 14, 643–648. [Google Scholar] [CrossRef] [PubMed]
- Jennings, J.H.; Thavarajah, K.; Mendez, M.P.; Eichenhorn, M.; Kvale, P.; Yessayan, L. Predischarge Bundle for Patients With Acute Exacerbations of COPD to Reduce Readmissions and ED Visits. Chest 2015, 147, 1227–1234. [Google Scholar] [CrossRef] [PubMed]
- Chassin, M.R.; Loeb, J.M.; Schmaltz, S.P.; Wachter, R.M. Accountability Measures — Using Measurement to Promote Quality Improvement. New Engl. J. Med. 2010, 363, 683–688. [Google Scholar] [CrossRef] [PubMed]
- Auerbach, A.D.; Kripalani, S.; Vasilevskis, E.E.; Sehgal, N.; Lindenauer, P.K.; Metlay, J.P.; Fletcher, G.; Ruhnke, G.W.; Flanders, S.A.; Kim, C.; et al. Preventability and Causes of Readmissions in a National Cohort of General Medicine Patients. JAMA Intern. Med. 2016, 176, 484–493. [Google Scholar] [CrossRef] [PubMed]
- Finkelstein, A.; Zhou, A.; Taubman, S.; Doyle, J. Health Care Hotspotting — A Randomized, Controlled Trial. New Engl. J. Med. 2020, 382, 152–162. [Google Scholar] [CrossRef]
- Desai, N.R.; Ross, J.S.; Kwon, J.Y.; Herrin, J.; Dharmarajan, K.; Bernheim, S.M.; Krumholz, H.M.; Horwitz, L.I. Association Between Hospital Penalty Status Under the Hospital Readmission Reduction Program and Readmission Rates for Target and Nontarget Conditions. JAMA 2016, 316, 2647–2656. [Google Scholar] [CrossRef] [PubMed]
Figure 1.
A. Number of participating centres by Autonomous Communities according to level of complexity of hospital centre: level I or primary hospital (H.P); level II or secondary hospital (H.S); level III or tertiary hospital (H.T). Data are presented as numbers. Figure 1B. Number of participating centres by Autonomous Communities according to pneumology organisational entity: I (Institute or Area of Clinical Management); S.R (service); S.C (section); S.E: no entity. Data are presented as numbers.
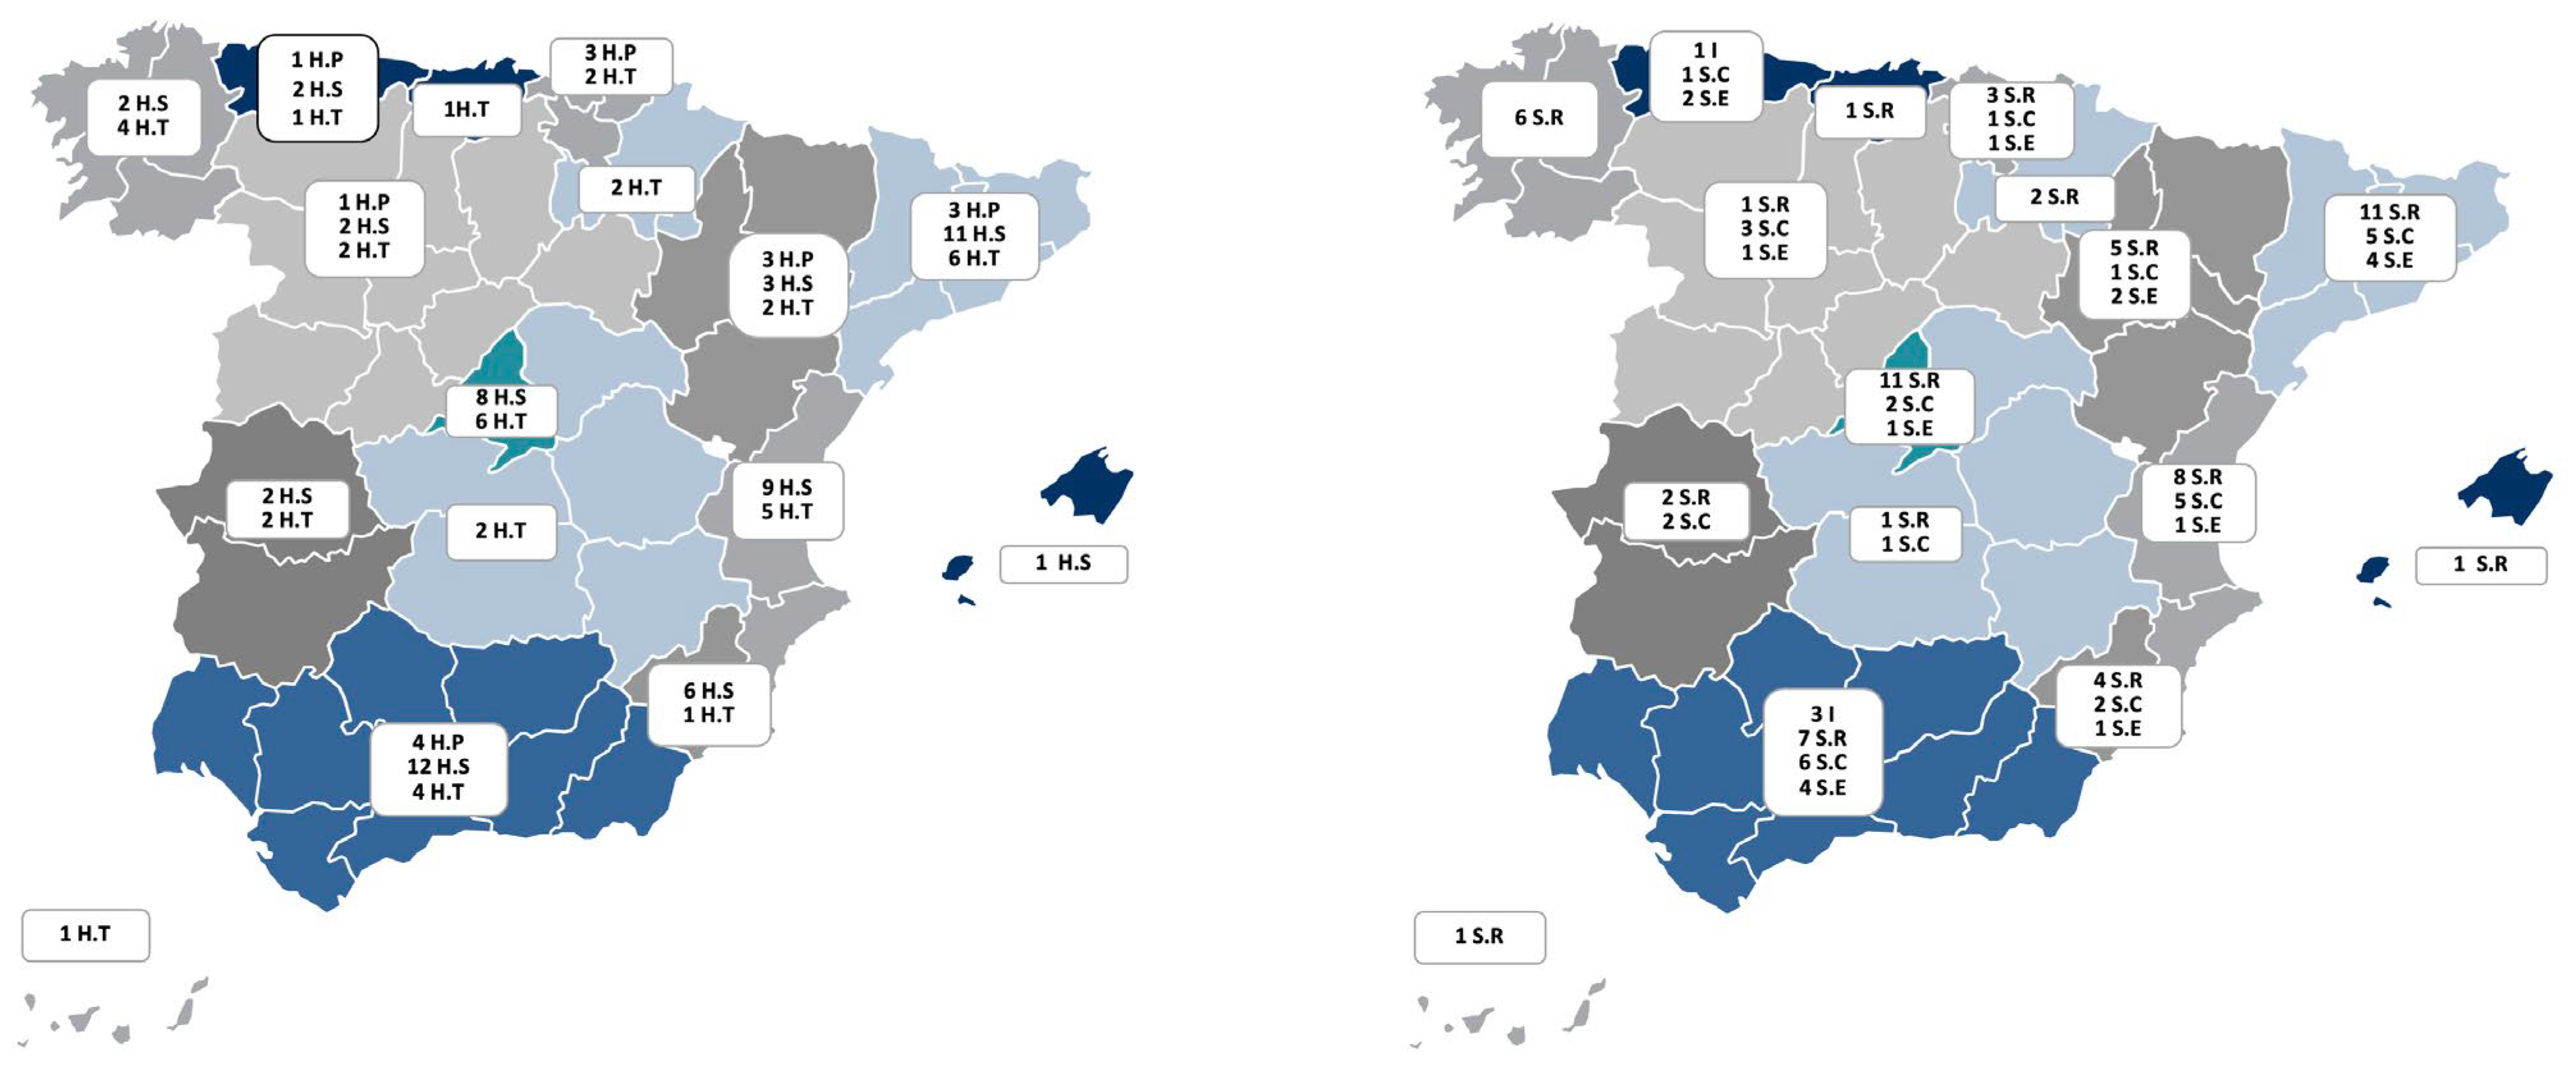
Figure 2.
Correlation between in-hospital mortality and the number of acutely ventilated patients per 100 discharges.
Figure 2.
Correlation between in-hospital mortality and the number of acutely ventilated patients per 100 discharges.
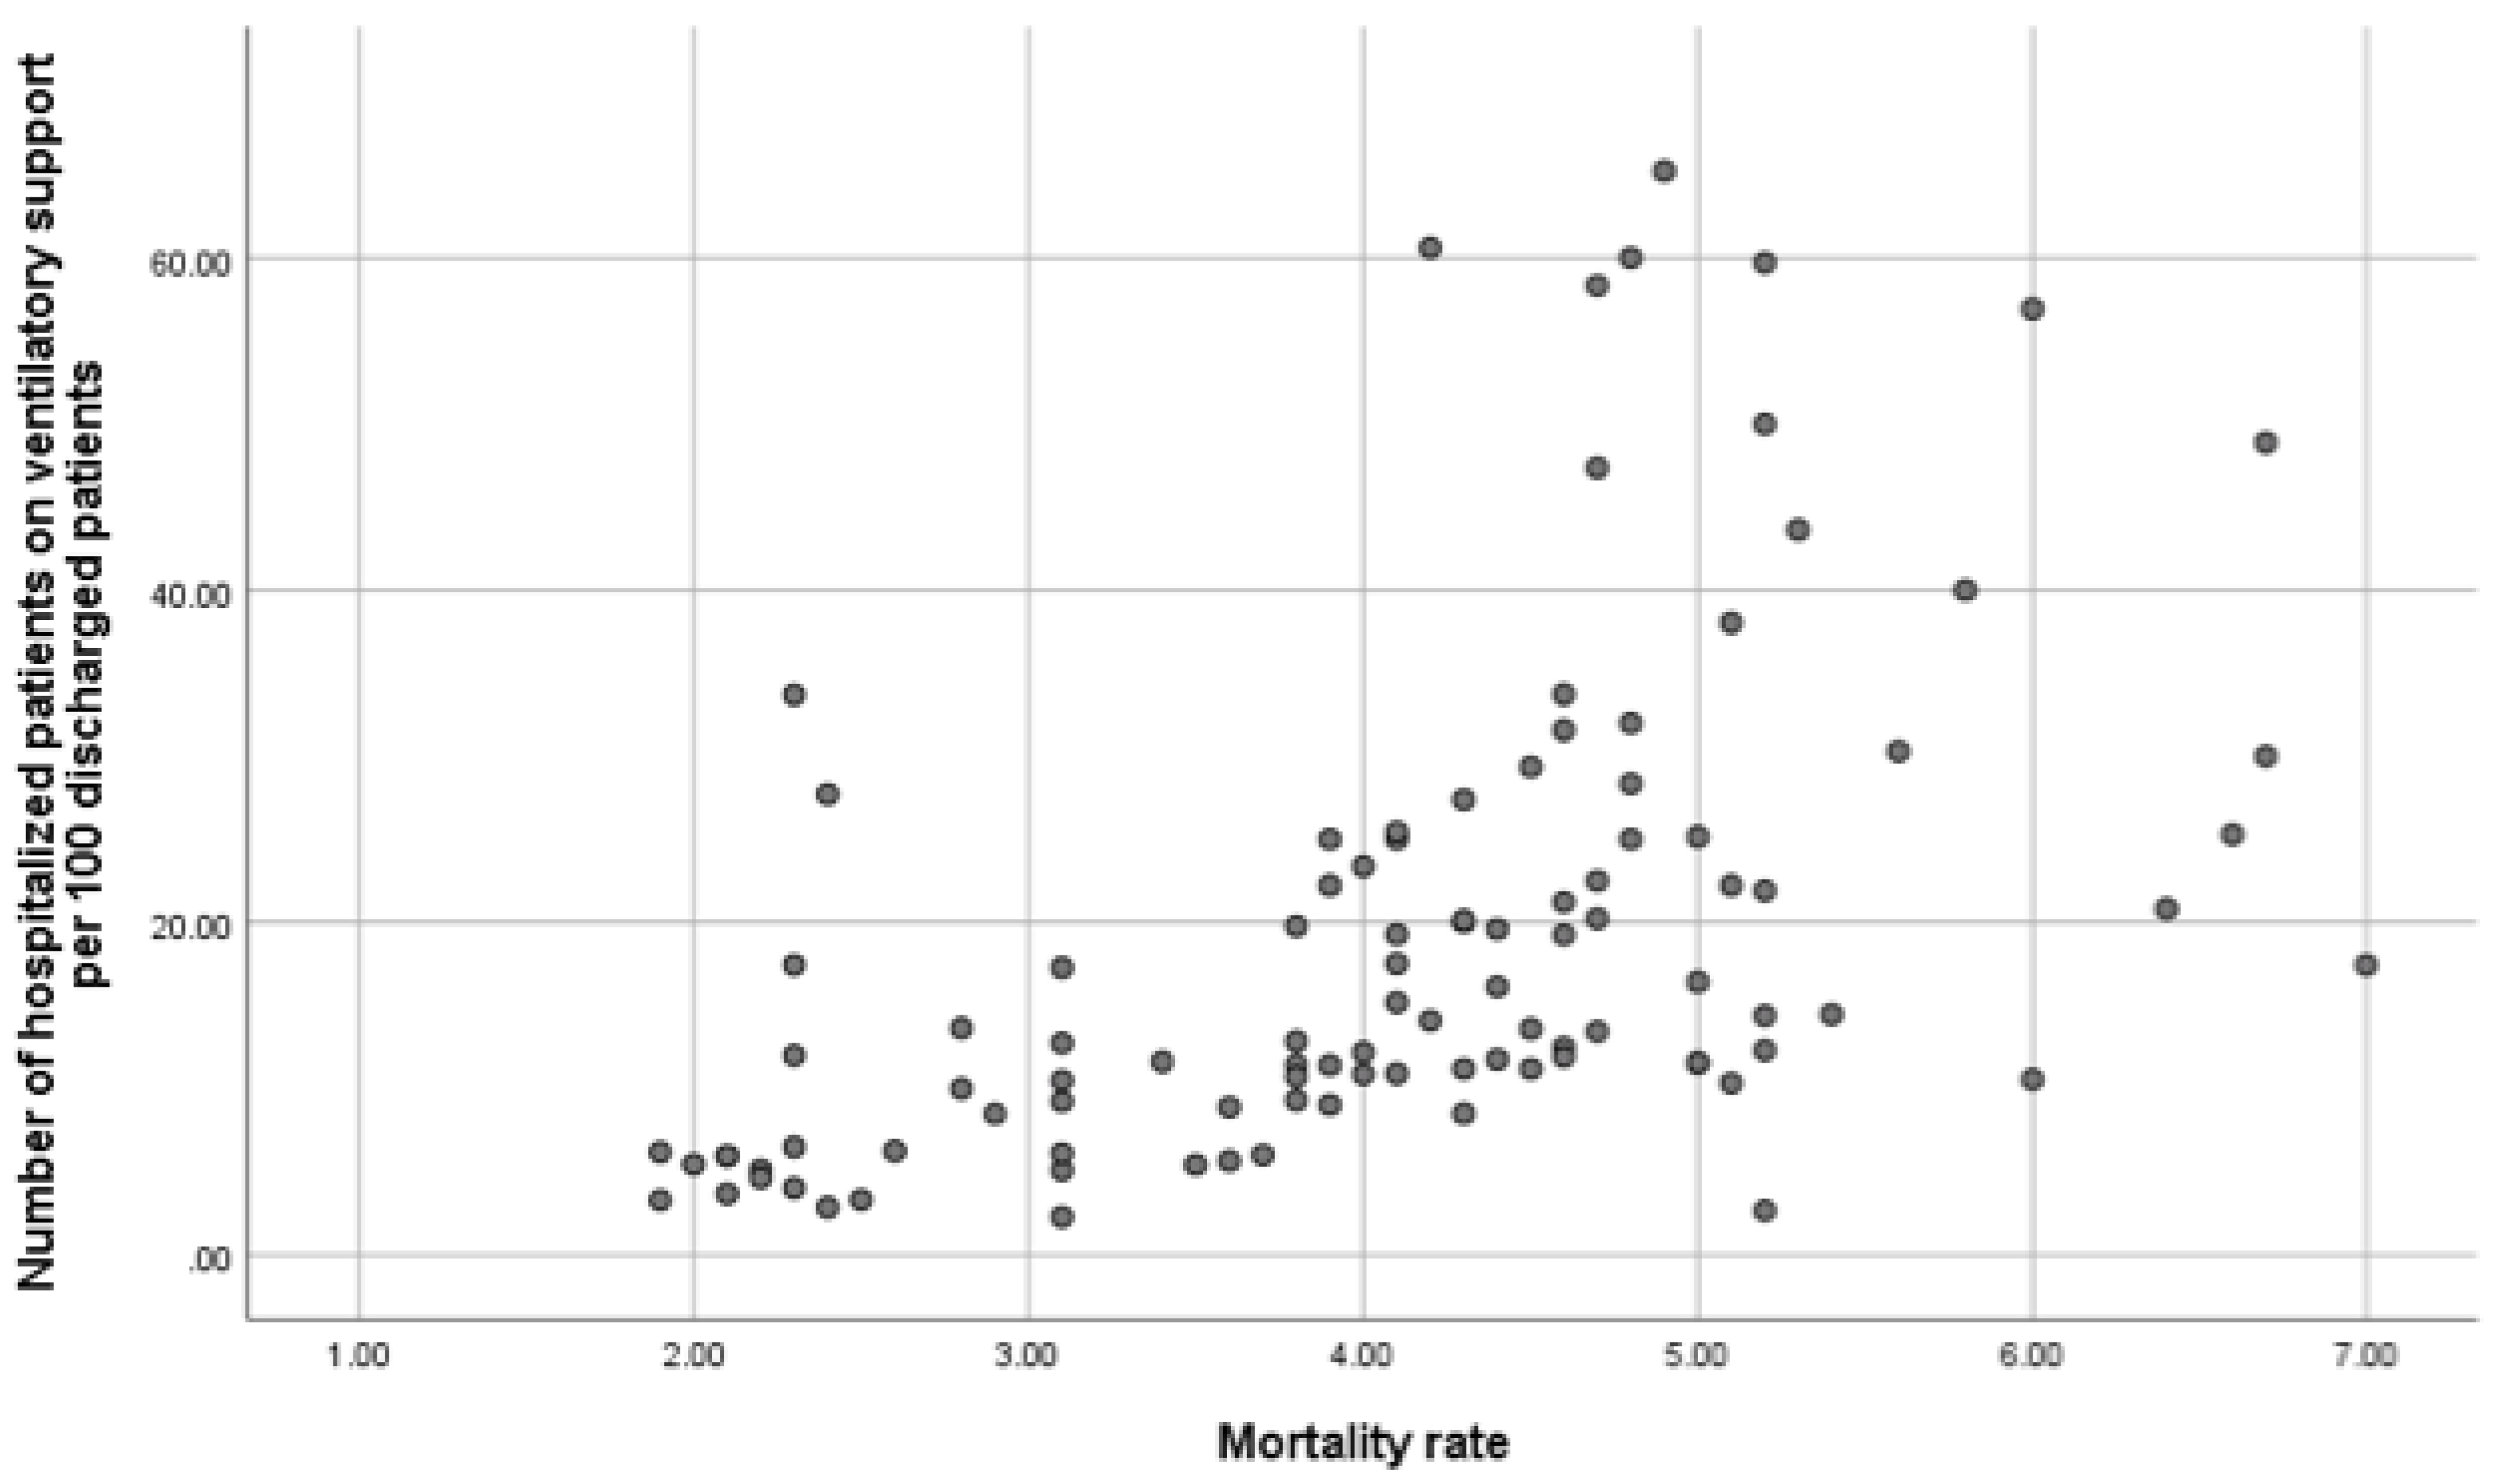

Table 1.
Characteristics of Participating Hospitals, Resources Available, and Care Provided in Units.
Table 1.
Characteristics of Participating Hospitals, Resources Available, and Care Provided in Units.
| Global | Level I | Level II | Level III | |
| Number of centers, n (%) | 116 | 15 (12.9) | 58 (50) | 43 (37.1) |
| Number of inhabitants of reference population, median (IQR) | 170000 (49560-303750) | 95000 (23750-138750) | 160000 (31552-282500) | 300000 (48000-437406) |
| Number of hospital beds per 100.000 inhabitans, median (IQR) | 157 (125-230.3) |
146.4 (100-189.7) |
147 (114.8-221.8) |
175.3 (134.8-248) |
| University Hospital, n (%) | 89 (76.7) | 3 (20) | 44 (75.9) | 42 (97.7) |
| Public hospital, n (%) | 113 (97.4) | 14 (93.3) | 58 (100) | 41 (95.3) |
| Institutional denomination of the pneumology service or unit, n (%) Institute Service Section No organizational entity |
4 (3.4) 65 (56) 30 (25.9) 17 (14.7) |
3 (20) 3 (20) 9 (60) |
2 (3.4) 25 (43.1) 23 (39.7) 8 (13.8) |
2 (4.7) 37 (86) 4 (9.3) 0 |
| Number of pulmonologists/100.000 inhabitants, median (IQR) | 3.3 (2.6-4.1) | 2.9 (2.3-3.9) | 3 (2.4-4) | 3.7 (3-4.6) |
| Number of resident interns in pulmonology, median (IQR) | 0 (2-4) | 0 (0-0) | 0 (0-4) | 6 (4-8) |
| Number of pneumology beds per 100.000 inhabitans, median (IQR) | 6.6 (3.1-9.2) | 0 (0-5.9) | 6.2 (0-9.5) | 7.5 (5.5-9.6) |
| Number of pneumology beds with telemetry, median (IQR) | 0 (0-6) | 0 | 0 (0-4) | 6 (0-8) |
| Intermediate Care Unit (IMCU) managed by pulmonology, n (%) | 37 (31.9) | 0 | 9 (15.5) | 28 (65.1) |
| Number of beds IMCU, median (IQR) | 6 (4-8) | 0 | 5.1 (4-6.5) | 7 (6-8.7) |
| Ratio of nurses to beds in IMCU*, median (IQR) | 4 (4-6) | - | 5.1 (4-5) | 5 (4-6) |
| 24-hour emergency care provided by pulmonology, n (%) Presencial |
35 (30.2) 26 (74.3) |
0 | 5 (8.6) 5 (100) |
30 (69.8) 21 (70) |
| Pulmonary rehabilitation program for COPD n (%) Type of program - Hospital - Community-based Mixed |
68 (58.6) 27 (39.7) 4 (5.9) 37 (54.4) |
4 (26.7) 4 (100) |
33 (56.9) 15 (45.5) 1 (3) 17 (51.5) |
31 (73.8) 12 (38.7) 3 (9.7) 16 (51.6) |
| Exercise test with oxygen uptake, n (%) | 47 (40.5) | 2 (13.3) | 12 (20.7) | 33 (76.7) |
| Bronchoscopy unit, n (%) High complexity Offer volume reduction techniques, n (%) |
39 (33.6) 11 (9.5) |
0 0 |
6 (10.3) 0 |
19 (44.2) 11 (25.6) |
| Diagnostic tests for alpha 1 antitrypsin deficiency (AATD), n (%) AATD Genotyping Sequencing |
61 (52.6) 16 (13.8) |
9 (60) 2 (13.3) |
23 (39.7) 2 (3.4) |
29 (67.4) 12 (27.9) |
| Consulting pulmonologist, n (%) | 67 (57.8) | 11 (73.3) | 34 (58.6) | 22 (51.2) |
| Therapeutic education program, n (%) | 40 (34.5) | 3 (75) | 14 (87.5) | 23 (95.8) |
| Discharge follow-up and support program, n (%) | 64 (55.2) | 9 (60) | 28 (50) | 27 (64.3) |
| Consulting specialist for the COPD, n (%) | 53 (45.6) | 5 (35.7) | 20 (35.1) | 28 (65.1) |
| COPD process protocols written, n (%) | 42 (36.2) | 0 | 15 (60) | 27 (77.1) |
| Unscheduled consultation for immediate COPD care, n (%) | 51 (44) | 5 (33.3) | 22 (37.9) | 24 (55.8) |
| Specialized COPD consultation, n (%) Accredited Time allocated to consultation (minutes), median (IQR) First consultation Review consultation |
61 (52.6) 18 (30) 30 (20-30) 15 (15-20) |
1 (6.7) 30 (30-30) 20 (20-20) |
25 (43.1) 4 (16) 20 (20-30) 15 (15-17) |
35 (81.4) 14 (40) 30 (20-30) 15 (15-20) |
| Nurse consultation for COPD care, n (%) | 45 (38.8) | 4 (26.7) | 16 (27.6) | 25 (58.1) |
| Specialized smoking consultation, n (%) | 56 (48.3) | 5 (33.3) | 19 (32.8) | 32 (74.4) |
Footnote of Table 1: Data are represented as absolute (relative) frequencies or median (IQR: interquartile range); Abbreviations: IMCU: Intermediate Care Unit; *Number of beds assigned per nurse. Hospital complexity level I (primary hospital); Hospital complexity level II (secondary hospital); Hospital complexity level III (tertiary hospital); AATD: Alpha 1 antitrypsin deficiency.
Table 2.
Organizational performance of respiratory units.
| Global | Level I | Level II | Level III | |
| Number discharges per pneumology unit/100,000 inhabitants, median (IQR) | 266.2 (186.8-399.2) | 218.3 (99.3-402.1) | 250 (304.2-841.2) | 294 (193.3-417.8) |
| Average length of stay (days), m (SD) | 8.72 (1.26) | 7.82 (1.17) | 8.85 (1.24) | 8.70 (1.26) |
| Number of 30-day readmissions for COPD /100 discharges *, median (IQR) | 14.9 (10.1-18.7) | 10.7 (8.2-15) | 15.5 (12.1-19.4) | 13.1 (8.6-16.7) |
| Number of patients on acute noninvasive ventilatory support per year/ 100 discharges, median (IQR) | 13.8 (9.2-25) | 6.2 (5.4-20) | 13.8 (9.2-25) | 14.4 (10.5-25.4) |
| In-hospital mortality #, m (SD) | 4.10 (1.18) | 2.6 (1.23) | 4.09 (1.14) | 4.27 (1.17) |
| Number of spirometries performed per month, median (IQR) | 303 (160-450) | 160 (100-280) | 222.5 (135-400) | 580 (350-845) |
| Number of spirometries per month/100,000 population, median (IQR) | 121.4 (70-225.7) | 170.5 (95.8-320) | 104.2 (60.8-159) | 141.7 (77.7-230.7) |
| Number of diffusion tests performed per month, median (IQR) | 40 (100-175) | 10 (0-40) | 78 (40-135) | 200 (110-300) |
| Number of lung volume measurements performed per month, median (IQR) | 20 (45-115) | 1 (0-25) | 40 (20-90) | 100 (35-150) |
| Number of 6 minutes walking test per month, median (IQR) | 27 (13-51) | 15 (10-25) | 22 (12-45) | 50 (30-100) |
| Number of patients in home ventilation programme, median (IQR) | 150 (48.7-282) | 70 (25-150) | 145.2 (29-205) | 260 (92-385) |
| Number of patients on home ventilation/100.00 inhabitant, median (IQR) | 57.8 (20.3 – 100.5) | 51.8 (15.1 – 115.4) | 49.3 (14.5 – 95.2) | 74.3 (25.8 – 99.6) |
| Number of bronchoscopic procedures per year, median (IQR) | 468 (210-750) | 86 (50-200) | 321 (200-500) | 763 (550-1177) |
| Number of bronchoscopic per year/100,000 inhabitants, median (IQR) | 164 (114.8-244.8) | 94.9 (67.9-156.8) | 156.2 (112.5-233.3) | 210.8 (153.5-274) |
| Number of patients undergoing endoscopic volume reduction per year, median (IQR) | 5 (4-17) | 5 (4-18) | ||
| Number of patients diagnosed with AATD per year median (IQR) | 5 (2-20) | 4 (2.7-10) | 5 (2-13.5) | 14.5 (3.25-50) |
| Number of patients diagnosed with severe AATD per year, median (IQR) | 2 (1-5) | 1 (0-2) | 2 (0-3) | 4 (1-10) |
| Number of patients on augmentation therapy for AATD per year, median (IQR) | 2 (0-4) | 1 (0-1) | 2 (0-3) | 3 (1-7) |
Footnote of Table 2: Data are represented as median (IQR: interquartile range); Hospital complexity level I (primary hospital); Hospital complexity level II (secondary hospital); Hospital complexity level III (tertiary hospital); * Number of 30-day readmissions/100 discharges of COPD of the respiratory units; # Mortality: number of exits/100 admissions to pneumology Ward. Abbreviations: AATD: Alpha 1 antitrypsin deficiency.
Table 3.
Determinants of 30-day readmission rates in patients with Chronic Obstructive Pulmonary Disease (COPD).
Table 3.
Determinants of 30-day readmission rates in patients with Chronic Obstructive Pulmonary Disease (COPD).
| 30-day readmissions for COPD* | p-value# | β coefficient (IC95%) | p-value# | Regression Coefficientsα | |
| Hospital complexity, m (IQR) Level I or primary hospital Level II or secondary hospital Level III or tertiary hospital |
10.7 (8.2-15.0) 15.5 (12.1-19.4) 13.1 (8.6-16.7) |
0.041 |
2.036 (-2.524- 6.596) -0.441 (-5.059- 4.177) |
0.378 0.850 |
|
| Availability of specialized consultation COPD, m (SD) Not Yes |
16.2 (5.3) 13.2 (5.2) |
0.006 |
-2.932 (-4.984 -0.881) |
0.006 |
|
| Availability of immediate attention, m (SD) Not Yes |
16.3 (5.1) 12.5 (5.1) |
<0.001 |
-3.805 (-5.792 -1.818) |
<0.001 |
|
| Availability of post-discharge follow-up program, m (SD) Not Yes |
17.7 (5.1) 12.1 (4.3) |
<0.001 |
-5.624 (-7.492 -3.756) |
<0.001 |
|
| Specialist COPD consultant available, m (SD) Not Yes |
15.9 (5.3) 13 (5.2) |
0.007 |
-2.865 ( -4.927 -0.802) |
0.007 |
|
| COPD nurse's office available, m (SD) Not Yes |
16.2 (5.3) 12.0 (4.5) |
<0.001 |
-4.260 (-6.266 -2.253) |
<0.001 |
|
| In-hospital stay | 1.789 ( 1.023 2.556) | <0.001 | 0.418 | ||
| Number of acutely ventilated patients per 100 discharges | 0.131 (0.063 0.199) | <0.001 | 0.348 | ||
| Availability of IMCU, m (SD) Not Yes |
15.5 (5.5) 13.3 (5) |
0.054 | |||
| To have written protocols in COPD, m (SD) Not Yes |
13.6 (5.8) 13 (5) |
0.693 | |||
| Have a respiratory rehabilitation program, m (SD) Not Yes |
15.5 (5.7) 13.9 (5.2) |
0.146 | |||
| To have 24-hour emergency care provided by pulmonology, m (SD) Not Yes |
14.9 (5.7) 13.9 (4.8) |
0.381 | |||
| Number of discharges per 100,000 inhabitants | -0.342 | ||||
| Number of pulmonologists per 100,000 inhabitants | -0.209 |
Footnote of Table 3: Data are represented as mean (standard deviation) or median (IQR: interquartile range); *Number of 30-day readmissions/100 discharges of COPD of the respiratory units; #T Student o Kruskal-Wallis; α Coeficiente de correlación Rho de Spearman. Abbreviations: IMCU: Intermediate Care Unit.
Table 4.
Multivariate Analysis of 30-Day Readmissions in COPD Patients.
| VARIABLE | β coefficient | Lower 95% IC | Upper 95% IC |
| Availability of immediate attention | -1.17680 | -3.2926682466 | 0.9390732 |
| Availability Therapeutic education program for the COPD | -1.06925 | -3.2966721762 | 1.1581651 |
| Availability Specialized COPD consultation | -0.27570 | -2.4957277620 | 1.9443309 |
| Average length of stay | 1.21028 | 0.4459950155 | 1.9745690 |
| Availability Consulting specialist for the COPD | -1.00004 | -3.2838274923 | 1.2837502 |
| Number of patients on acute noninvasive ventilatory support per year/ 100 discharges | 0.07243 | 0.0065636954 | 0.1383044 |
| Availability of post-discharge follow-up program | -3.89691 | -5.8584889147 | -1.9353364 |
Disclaimer/Publisher’s Note: The statements, opinions and data contained in all publications are solely those of the individual author(s) and contributor(s) and not of MDPI and/or the editor(s). MDPI and/or the editor(s) disclaim responsibility for any injury to people or property resulting from any ideas, methods, instructions or products referred to in the content. |
© 2024 by the authors. Licensee MDPI, Basel, Switzerland. This article is an open access article distributed under the terms and conditions of the Creative Commons Attribution (CC BY) license (http://creativecommons.org/licenses/by/4.0/).
Copyright: This open access article is published under a Creative Commons CC BY 4.0 license, which permit the free download, distribution, and reuse, provided that the author and preprint are cited in any reuse.


