
Submitted:
26 April 2024
Posted:
26 April 2024
You are already at the latest version
Abstract
Background/Objectives: Community-acquired pneumonia (CAP) is a common emergency presentation in Australia, with the choice of admitting specialty unit often influenced by pneumonia severity and comorbidities. However, it remains unclear whether there are between-specialty differences in patient characteristics and outcomes. We sought to address this issue by investigating the characteristics and outcomes of CAP patients admitted to General Medicine (GM) versus Respiratory units.Methods: This retrospective observational study utilised data from the two largest metropolitan hospitals in South Australia, encompassing all non-COVID-19-related CAP admissions throughout 2021 to 2023. Hospital length of stay (LOS), in-patient and 30-day mortality, and 30-day readmission rates were assessed by propensity-score-matching (PSM) with using 14 variables.Results: Of the 3,004 cases of non-COVID-19 CAP admitted across the two hospitals during the study period, 2,673 (71.8%) were admitted under GM units and 331 (9.1%) under Respiratory units. GM patients were, on average, a decade older, presented with a significantly higher burden of comorbidities, exhibited a greater prevalence of frailty and had higher pneumonia severity compared to those admitted under a Respiratory unit, (P
Keywords:
Community-acquired pneumonia
; Length of Hospital Stay
; Mortality
; Respiratory Unit
; General Medicine Unit
; Readmissions
1. Introduction
The Community-acquired pneumonia (CAP) is a common presentation to emergency departments, often leading to hospitalisation for patients with moderate to severe illness. Research indicates that CAP contributes to approximately 2% of all emergency hospitalisations in Australia [1]. The decision to admit patients with CAP typically rests with emergency department physicians, who weigh factors such as the severity of pneumonia, existing comorbidities, and resource availability to determine whether admission under General Medicine (GM) or Respiratory units is most appropriate [2] .
Individual Australian hospitals have established guidelines for care of CAP patients, which priortise admissions under Respiratory units for severe cases, aiming to optimise patient outcomes [3,4]. In general, frail older patients and those with complex co-morbidity are more likely to be admitted under a GM unit than under a Respiratory unit [2]. However, real-world practice may deviate from these guidelines due to various factors such as presentation ambiguity, bed availability, or individual physician discretion, resulting in patients with severe illness also being admitted under GM units.
The clinical outcomes of CAP patients can vary significantly depending on multiple factors, including the severity of pneumonia [5]. Even after adjusting for these factors, studies have observed differences in clinical outcomes such as length of hospital stay (LOS), suggesting potential variations in the quality of care across different sites and between GM and specialist services within the same site [6,7].
Limited evidence exists regarding the characteristics and outcomes of CAP patients admitted under generalist versus respiratory care. Some studies have suggested comparable outcomes [2,8], while others [9] have indicated potential benefits, such as reduced mortality and shorter LOS, associated with admission to Respiratory units. These benefits may stem from expedited antibiotic initiation, use of adjunctive therapies such as corticosteroids and early use of fibre optic bronchoscopy which can aid in early pathogen detection [9].
However, previous research [2,9] has not consistently accounted for other critical factors such as pneumonia severity [5] or frailty status [7], which are known to influence clinical outcomes among patients with CAP. Therefore, we sought to address this gap by examining the characteristics and outcomes of CAP patients discharged from two distinct specialist services: GM and Respiratory, considering severity of illness and frailty status in the analysis. This approach should provide a more comprehensive understanding of the impact of different units’ specialist care on CAP outcomes, aiding in the refinement of clinical practices and resource allocation strategies.
2. Materials and Methods
This retrospective cohort study encompassed all emergency admissions for CAP at the two largest tertiary hospitals in Adelaide, South Australia–Flinders Medical Centre (FMC) and Royal Adelaide Hospital (RAH), spanning from January 1st, 2021, to December 31st, 2023. CAP admissions were captured using the the International Classification of Diseases, 10th Revision, Australian Modification (ICD-10-AM) diagnostic codes (J12-18.9) [10]. Patients with hospital acquired pneumonia (HAP) - when pneumonia was acquired >48 hours of hospital admission as well as those who tested positive for severe acute respiratory syndrome coronavirus 2 (SARS-CoV-2) on viral polymerase chain reaction (PCR) were excluded. Ethical approval for this study was obtained from both the Southern Adelaide Human Clinical Research Ethics Committee (SA HREC) and the Central Adelaide Human Research Ethics Committee.
Patient and clinical data were retrieved from the Electronic Medical Records (EMR) of the two hospitals. Pneumonia severity was evaluated using the CURB-65 score [11] on admission, computed from parameters including confusion, Urea concentrations >7mmol/L, respiratory rate >30/min, blood pressure (systolic <90 mmHg and/or diastolic <65 mmHg), and age >65 years. Frailty status was determined utilising the Hospital Frailty Risk Score (HFRS) [12], which uses a score ≥5 to classify patients as frail. Various co-morbidities [13,14] which can influence outcomes among patients with CAP were identified including chronic lung disease (chronic obstructive lung disease, (COPD), bronchial asthma, bronchiectasis and interstitial lung disease (ILD)), coronary artery disease (CAD), chronic kidney disease (CKD) and history of cancer. Comorbidity burden was quantified using the Charlson Comorbidity Index (CCI) [15]. Nutritional status of patients was assessed using the Malnutrition Universal Risk Score (MUST), which use a cut-off score ≥1 to classify patients as malnourished [16]. Furthermore, routine blood investigations on admission, such as haemoglobin, white blood cell (WBC) count, C-reactive protein (CRP), albumin, creatinine, and international normalized ratio (INR), were extracted. Patients who had medical emergency response team (MET) calls and those who required admission to the intensive care unit (ICU) were determined. In addition, we retrieved data for patients who required high-flow oxygen (HFOT) (defined as need for 100% humidified oxygen at a flow rate of up to 60/L/min), non-invasive ventilation (NIV), mechanical ventilation, and vasopressor support during hospitalisation.
2.1. Outcomes
Outcome measures included length of hospital stay (LOS) adjusted for in-hospital mortality, in-hospital mortality, 30-day mortality from admission, and 30-day readmission rate after discharge.
2.2. Statistical Analysis
Statistical analyses involved assessing variables for normality via histogram visualisation. Continuous variables underwent evaluation using t-tests or rank-sum tests, while categorical variables were analysed using Chi-square statistics.
2.3. Propensity Score Methods
Propensity score matching (PSM) was used to mitigate potential confounding variables between patients treated under GM vs. Respiratory units. A multivariable logistic regression model was developed based on confounding variables showing an association with a p-value of <0.20 in univariate analyses, with patients receiving treatment under Respiratory units used as an exposure variable and hospital LOS as an outcome variable. Fourteen variables were included in this model, with matching performed at a 1:1 ratio on propensity scores utilising nearest neighbourhood matching [17].These variables included: age, sex, CCI, CURB-65 scores, HFRS, MUST scores, haemoglobin, CRP, albumin, creatinine, presence of chronic lung disease, cancer history, CAD and CKD. The balance of characteristics between the cohorts was assessed using standardised mean differences (SMD), with SMD >10% considered as significant between the two groups[18]. In addition, propensity score distribution was visually inspected pre and post-matching by plotting a distribution curve.
Differences in outcomes between the two speciality units were assessed using the average treatment effect in the treated (ATET) with determination of odds ratios (OR) with corresponding 95% confidence intervals (CI).
2.4. Sensitivity Analysis
We validated PSM results using the inverse probability of treatment weighting (IPTW) [19], with ORs computed along with robust standard errors (SE) and corresponding 95% CIs.
A significance threshold of p<0.05 was applied for all tests, and Stata software version 18.0 was used for all statistical analyses (StataCorp LLC, College Station TX, USA).
3. Results
3.1. Patient Characteristics
Over the three-year period, 3004 cases of non-COVID-CAP were admitted at the two hospitals. Of these, 2673 (71.8%) were managed under the GM units and 331 (9.1%) were treated under Respiratory units. Patients admitted under GM were, on average, a decade older, presented with a significantly higher burden of comorbidities, and exhibited a greater prevalence of frailty (p<0.05) compared to those admitted under Respiratory units (Table 1). Although pneumonia severity, as assessed by CURB-65 scores, was higher among GM-admitted patients, the Respiratory units managed a greater proportion of smokers and individuals with chronic lung disease (p<0.05). Conversely, GM-admitted patients showed a higher prevalence of CAD and CKD (P value<0.05). Notably, patients managed by the Respiratory team had higher albumin concentrations and a greater likelihood of bacterial aetiology on culture results compared to those under GM care (p<0.05) (Table 1). Patients admitted under Respiratory units also had a higher likelihood of admission to the ICU and were more likely to receive HFOT, NIV and vasopressor support when compared to GM (P<0.05) (Table 1).
3.2. Outcomes
3.2.1. Unadjusted Analysis
Unadjusted analysis revealed a 1.8 days shorter median LOS among GM-admitted patients (5.9 vs 4.1 days, p<0.001) (Table 2). In-hospital mortality rates were comparable, but 30-day mortality was significantly higher in the older and frailer GM cohort compared to the Respiratory unit cohort (13% vs 9.1%, p=0.041). Other outcomes were similar between the two groups (Table 2).
3.3. PSM
Utilising 14 variables, PSM yielded 222 well-matched pairs with a SMD <10% (Figure 1 and Table 3). Assessment of Average Treatment Effect on the Treated (ATET) indicated that patients managed by Respiratory units were more likely to experience a significantly longer LOS compared to GM (adjusted odds ratio [aOR] 19.36, 95% CI 4.42-84.60, p<0.001). No significant differences were observed in in-hospital mortality (aOR 1.01, 95% CI 0.97-1.06, p=0.456) or 30-day mortality (aOR 1.01, 95% CI 0.96-1.07, p=0.521) between the two groups. Other clinical outcomes were also comparable (Table 4).
3.4. Sensitivity Analysis
Sensitivity analysis (Table 4) corroborated the aforementioned findings. Median LOS was significantly higher among patients managed by Respiratory units compared to GM (aOR 17.30, Robust SE 0.71, 95% CI 4.24-70.59, p<0.001), while other clinical outcomes exhibited no substantial disparities between the two groups (Table 5).
4. Discussion
This study suggests that most of patients presenting with non-COVID-19 CAP to two largest South Australian metropolitan hospitals were admitted to a GM unit. Notably, patients admitted under the GM service were generally older, had multiple comorbidities, and exhibited greater frailty and pneumonia severity compared to those admitted under the Respiratory service. PSM analysis revealed a significantly shorter hospital LOS for CAP patients admitted under GM compared to those admitted under Respiratory, however, other clinical outcomes were similar between the two units.
In-hospital mortality and readmission rates are regarded as better indicators of quality of in-hospital care while LOS is more likely reflective of efficiency of care [2]. The current study indicates that LOS was 1.8 days shorter for patients who were admitted under GM when compared to the respiratory team. Our findings align with a previous Australian study [2] conducted in the pre-COVID-19 era, which reported a median LOS 1.5 days shorter under GM than Respiratory for 9775 emergency CAP hospitalisations over 5 years. Importantly, our study extends this knowledge by adjusting for pneumonia severity and frailty status which are significant determinants of in-hospital LOS [20,21]. The significantly shorter LOS under GM in our study could potentially be attributed to enhanced utilisation of allied health services, focusing on early mobilisation and efficient hospital-at-home services [22,23].
Previous research has demonstrated that complications during hospitalisation and ICU admissions are associated with an extended LOS in CAP patients [20]. The increased frequency of ICU admissions among patients under the Respiratory unit compared to GM in this study (21.7% vs. 5.8%, p<0.001), may have also contributed to the longer LOS observed in this group.
Our findings suggest that the care provided to non-COVID-19 CAP patients admitted under GM units was more efficient compared to those admitted under Respiratory units. Consistent with previous studies [2,8] our results indicate that there was no compromise in the quality of care for GM patients, as evidenced by comparable in-hospital mortality and 30-day readmission rates between the two units. Prior research has demonstrated that a shorter LOS for CAP patients is associated with reduced healthcare costs [24]. Additionally, more patients are likely to return to their usual activities or work within 14 days following hospital discharge when LOS is minimised [25]. Therefore, the observed efficiency in GM units may not only improve patient outcomes but also contribute to cost savings for the health service and a faster return to functional status for the patient.
Contrary to our findings, several studies have reported better clinical outcomes for patients admitted under specialty services compared to generalist care. For instance, a prospective observational study by Pothirat et al. [26] involving 208 patients hospitalised with an acute exacerbation of COPD found that respiratory physicians were more likely to adhere to guideline-directed therapy. Patients under their care experienced fewer severe adverse events, had a shorter LOS, and incurred lower costs compared to those under generalist care (p<0.05). However, no significant difference in in-hospital mortality was observed between the groups. Similarly, a study by Jong et al. [27] focusing on hospitalised heart failure patients revealed that those treated by cardiologists had a lower one-year risk of death (28.5% vs. 31.5%, P<0.05) and composite risk of death and readmission (54.7% vs. 58.1%, P<0.05) compared to non-cardiologists.
A major limitation of these earlier studies is the lack of adjustment for frailty and illness severity, significant determinants of clinical outcomes in hospitalised patients [28]. Additionally, previous studies did not utilise robust statistical procedures such as PSM. Moreover, the term "specialty care" was not clearly defined, contrasting this speciality care with that offered by general practitioners (GPs) or family physicians who may have different qualifications and discharge planning skills compared to general internal medicine physicians similar to those represented in the present study [29].
5. Limitations
Our study has several limitations that warrant consideration. Firstly, we were unable to ascertain the type and duration of antimicrobial treatment for CAP or determine any differences in adherence to guideline-concordant antibiotic treatment between the two specialties. Secondly, the exclusion of COVID-19 positive patients limits our ability to quantify the influence of the COVID-19 pandemic on CAP outcomes. Lastly, this was not a study where patients were prospectively randomised to either the Respiratory or the GM units. Therefore, the inherent biases present in the admission processes at either or both hospitals (beyond age, comorbidity, frailty etc) cannot be excluded.
6. Conclusions
In conclusion, our study suggests that majority of hospitalised CAP patients are admitted under GM care, and those admitted under this care model despite being older and more frail, had a shorter LOS without significant differences in other clinical outcomes. However, there is a need for future prospective clinical studies to validate our findings and explore the potential benefits and limitations of different care models in the management of CAP.
Author Contributions
Conceptualization, Y.S. and C.T.; methodology, Y.S., R.S. and C.H.; software, Y.S.; validation, Y.S., R.S. and C.H.; formal analysis, Y.S.; resources, C.H.; data curation, C.H.; writing—original draft preparation, Y.S.; writing—review and editing, Y.S., A.M. and C.T.; supervision, C.T.; project administration, Y.S. All authors have read and agreed to the published version of the manuscript.
Funding
This research received no external funding.
Institutional Review Board Statement
The study was conducted in accordance with the Declaration of Helsinki and approved by the Southern Adelaide Human Clinical Research Ethics Committee and the Central Adelaide Clinical Research Ethics Committee (no. 231.23 and date of approval 8 December 2023).
Informed Consent Statement
Patient consent was waived due to retrospective design of this study.
Data Availability Statement
Data for this study can be obtained from the corresponding author upon reasonable request, subject to approval by the ethics committee.
References
- Tsirgiotis, E.; Ruffin, R. Community acquired pneumonia. A perspective for general practice. Aust. Fam. Physician 2000, 29, 639–645. [Google Scholar] [PubMed]
- Horwood, C.M.; Hakendorf, P.; Thompson, C.H. Comparison of specialist and generalist care. Aust. Health Rev. 2018, 42, 579–583. [Google Scholar] [CrossRef] [PubMed]
- Robert, L.; Mark, V.; Moayed, A.; Nivashen, A.; Vinod, R.; Sophie, P.; Mohamed, E.W.; Rusheng, C. Antimicrobial prescribing and outcomes of community-acquired pneumonia in Australian hospitalized patients: a cross-sectional study. J. Int. Med. Res. 2021, 49, 3000605211058366. [Google Scholar] [CrossRef] [PubMed]
- SA Health. Community Acquired Pneumonia (Adults) Clinical Guideline 2021. (Accessed 19 January 2024).
- Surme, S.; Balkan, I.; Bayramlar, O.F.; Kara Ali, R.; Mete, B.; Tabak, F.; Saltoğlu, N. Predictors of Long-term Outcomes in the Older Adults with Community-Acquired Pneumonia. J Infect Dev Ctries 2021, 15, 1910–1916. [Google Scholar] [CrossRef] [PubMed]
- Laing, R.; Coles, C.; Chambers, S.; Frampton, C.; Jennings, L.; Karalus, N.; Mills, G.; Town, G.I. Community-acquired pneumonia: influence of management practices on length of hospital stay. Intern. Med. J. 2004, 34, 91–97. [Google Scholar] [CrossRef] [PubMed]
- Zhao, L.H.; Chen, J.; Zhu, R.X. The relationship between frailty and community-acquired pneumonia in older patients. Aging Clin. Exp. Res. 2023, 35, 349–355. [Google Scholar] [CrossRef] [PubMed]
- Kenzaka, T.; Kumabe, A.; Mabuchi, M.; Goda, K.; Yahata, S. A comparison of pneumonia care quality between general physicians and pulmonologists. J Gen Fam Med 2018, 19, 160–165. [Google Scholar] [CrossRef]
- Confalonieri, M.; Trevisan, R.; Demsar, M.; Lattuada, L.; Longo, C.; Cifaldi, R.; Jevnikar, M.; Santagiuliana, M.; Pelusi, L.; Pistelli, R. Opening of a respiratory intermediate care unit in a general hospital: impact on mortality and other outcomes. Respiration 2015, 90, 235–242. [Google Scholar] [CrossRef] [PubMed]
- Independent Health and Aged Care Pricing Authority (IHACPA). Chronicle of The International Statistical Classification of Diseases and Related Health Problems, Tenth Revision, Australian Modification (ICD-10-AM) First Edition to Eleventh Edition. 2019.
- Chalmers, J.D.; Mandal, P.; Singanayagam, A.; Akram, A.R.; Choudhury, G.; Short, P.M.; Hill, A.T. Severity assessment tools to guide ICU admission in community-acquired pneumonia: systematic review and meta-analysis. Intensive Care Med. 2011, 37, 1409–1420. [Google Scholar] [CrossRef]
- Sharma, Y.; Horwood, C.; Hakendorf, P.; Shahi, R.; Thompson, C. External Validation of the Hospital Frailty-Risk Score in Predicting Clinical Outcomes in Older Heart-Failure Patients in Australia. J Clin Med 2022, 11. [Google Scholar] [CrossRef]
- Campling, J.; Jones, D.; Chalmers, J.; Jiang, Q.; Vyse, A.; Madhava, H.; Ellsbury, G.; Rabe, A.; Slack, M. Clinical and financial burden of hospitalised community-acquired pneumonia in patients with selected underlying comorbidities in England. BMJ Open Respir Res 2020, 7. [Google Scholar] [CrossRef] [PubMed]
- Blanc, E.; Chaize, G.; Fievez, S.; Féger, C.; Herquelot, E.; Vainchtock, A.; Timsit, J.F.; Gaillat, J. The impact of comorbidities and their stacking on short- and long-term prognosis of patients over 50 with community-acquired pneumonia. BMC Infect. Dis. 2021, 21, 949. [Google Scholar] [CrossRef] [PubMed]
- Murray, S.B.; Bates, D.W.; Ngo, L.; Ufberg, J.W.; Shapiro, N.I. Charlson Index is associated with one-year mortality in emergency department patients with suspected infection. Acad. Emerg. Med. 2006, 13, 530–536. [Google Scholar] [CrossRef] [PubMed]
- Sharma, Y.; Thompson, C.; Kaambwa, B.; Shahi, R.; Miller, M. Validity of the Malnutrition Universal Screening Tool (MUST) in Australian hospitalized acutely unwell elderly patients. Asia Pac. J. Clin. Nutr. 2017, 26, 994–1000. [Google Scholar] [CrossRef] [PubMed]
- Austin, P.C. Optimal caliper widths for propensity-score matching when estimating differences in means and differences in proportions in observational studies. Pharm. Stat. 2011, 10, 150–161. [Google Scholar] [CrossRef] [PubMed]
- Austin, P.C. Balance diagnostics for comparing the distribution of baseline covariates between treatment groups in propensity-score matched samples. Stat. Med. 2009, 28, 3083–3107. [Google Scholar] [CrossRef] [PubMed]
- Austin, P.C.; Stuart, E.A. The performance of inverse probability of treatment weighting and full matching on the propensity score in the presence of model misspecification when estimating the effect of treatment on survival outcomes. Stat. Methods Med. Res. 2017, 26, 1654–1670. [Google Scholar] [CrossRef] [PubMed]
- Cabre, M.; Bolivar, I.; Pera, G.; Pallares, R. Factors influencing length of hospital stay in community-acquired pneumonia: a study in 27 community hospitals. Epidemiol. Infect. 2004, 132, 821–829. [Google Scholar] [CrossRef]
- Zhao, H.; Tu, J.; She, Q.; Li, M.; Wang, K.; Zhao, W.; Huang, P.; Chen, B.; Wu, J. Prognostic significance of frailty in hospitalized elderly patients with community-acquired pneumonia: a retrospective cohort study. BMC Geriatr. 2023, 23, 308. [Google Scholar] [CrossRef]
- O'Mahony, S.; Mazur, E.; Charney, P.; Wang, Y.; Fine, J. Use of multidisciplinary rounds to simultaneously improve quality outcomes, enhance resident education, and shorten length of stay. J. Gen. Intern. Med. 2007, 22, 1073–1079. [Google Scholar] [CrossRef]
- Hecimovic, A.; Matijasevic, V.; Frost, S.A. Characteristics and outcomes of patients receiving Hospital at Home Services in the South West of Sydney. BMC Health Serv. Res. 2020, 20, 1090. [Google Scholar] [CrossRef] [PubMed]
- Fine, M.J.; Pratt, H.M.; Obrosky, D.S.; Lave, J.R.; McIntosh, L.J.; Singer, D.E.; Coley, C.M.; Kapoor, W.N. Relation between length of hospital stay and costs of care for patients with community-acquired pneumonia. Am. J. Med. 2000, 109, 378–385. [Google Scholar] [CrossRef] [PubMed]
- McCormick, D.; Fine, M.J.; Coley, C.M.; Marrie, T.J.; Lave, J.R.; Obrosky, D.S.; Kapoor, W.N.; Singer, D.E. Variation in length of hospital stay in patients with community-acquired pneumonia: are shorter stays associated with worse medical outcomes? Am. J. Med. 1999, 107, 5–12. [Google Scholar] [CrossRef] [PubMed]
- Pothirat, C.; Liwsrisakun, C.; Bumroongkit, C.; Deesomchok, A.; Theerakittikul, T.; Limsukon, A. Comparative study on health care utilization and hospital outcomes of severe acute exacerbation of chronic obstructive pulmonary disease managed by pulmonologists vs internists. Int. J. Chron. Obstruct. Pulmon. Dis. 2015, 10, 759–766. [Google Scholar] [CrossRef] [PubMed]
- Jong, P.; Gong, Y.; Liu, P.P.; Austin, P.C.; Lee, D.S.; Tu, J.V. Care and outcomes of patients newly hospitalized for heart failure in the community treated by cardiologists compared with other specialists. Circulation 2003, 108, 184–191. [Google Scholar] [CrossRef]
- Sharma, Y.; Horwood, C.; Hakendorf, P.; Thompson, C. Trends in Frailty and Use of Evidence-Based Pharmacotherapy for Heart Failure in Australian Hospitalised Patients: An Observational Study. J Clin Med 2021, 10. [Google Scholar] [CrossRef]
- Internal Medicine Society of Australia and New Zealand (IMSANZ). IMSANZ position statement March 2010. Provision of acute undifferentiated general medicine consultant services. Requirements for training, credentialling and continous professional development. 2010. Available online: http://www.imsanz.org.au/documents/item/415 (accessed on 26 March 2024).
Figure 1.
Distribution curve before and after propensity score matching.
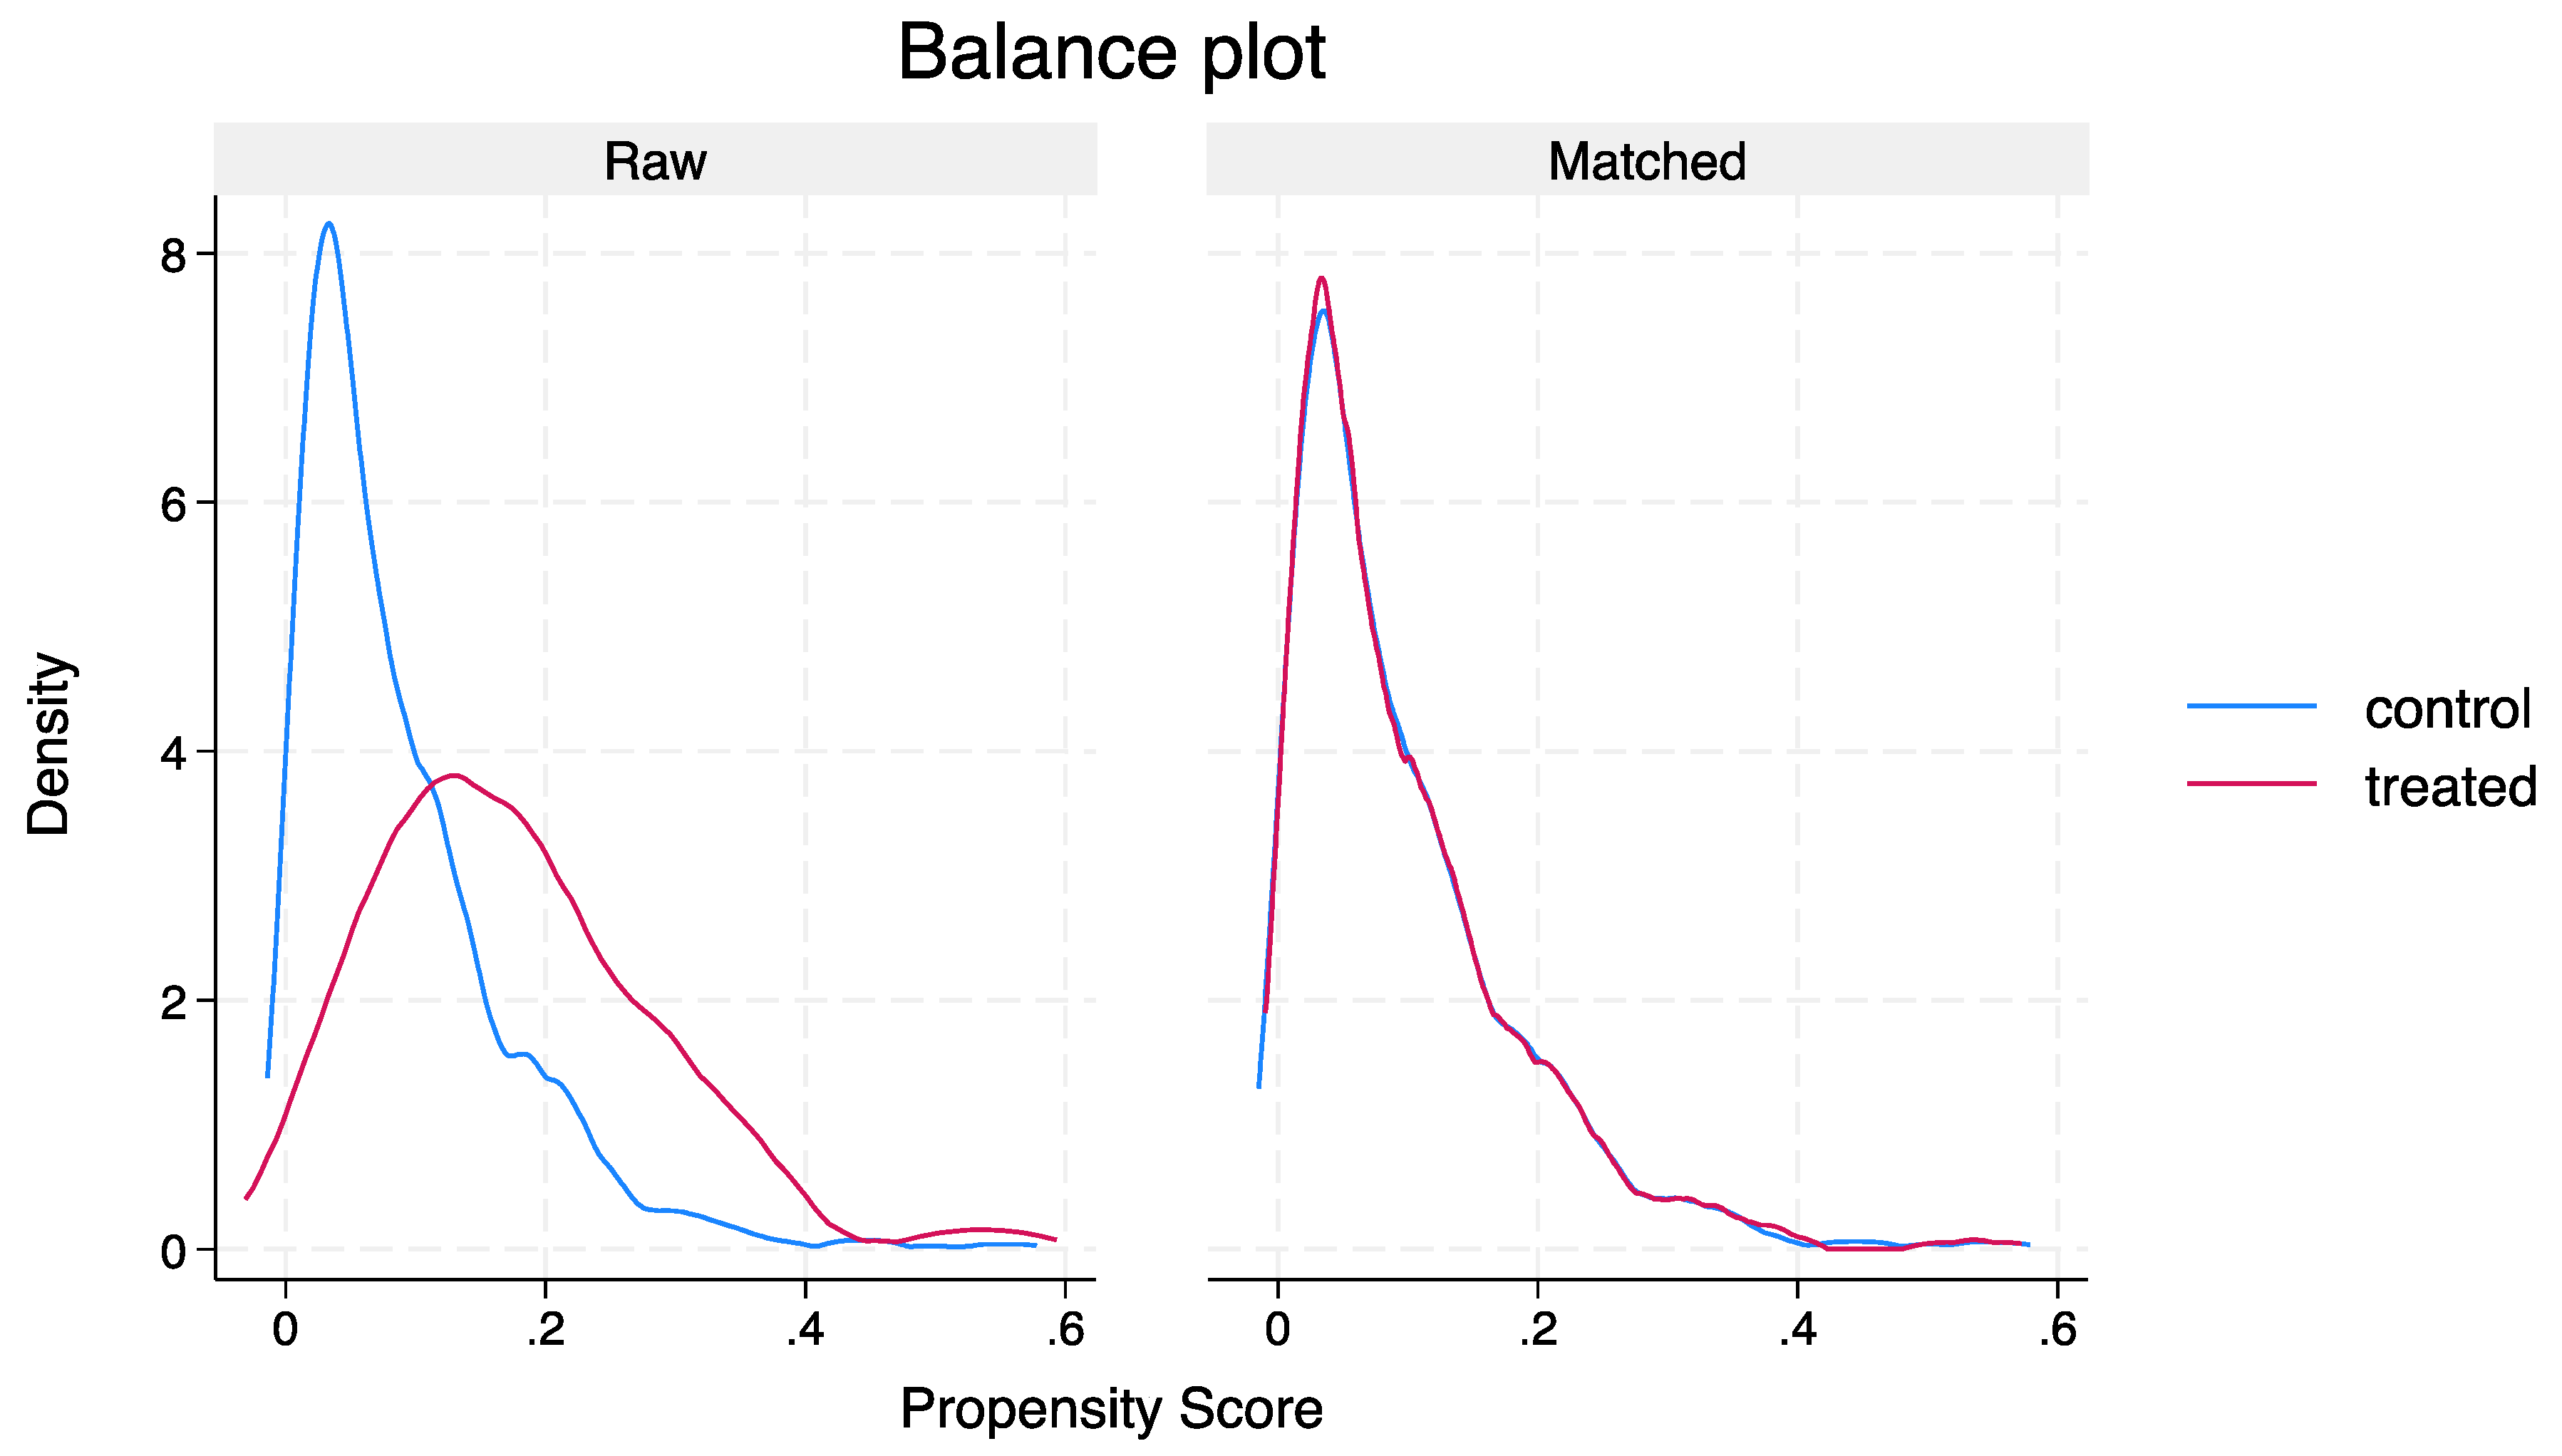

Table 1.
Characteristics of non-COVID-19 Community acquired pneumonia patients admitted under two specialities.
Table 1.
Characteristics of non-COVID-19 Community acquired pneumonia patients admitted under two specialities.
| Total | General Medicine | Respiratory | P value | |
|---|---|---|---|---|
| No (%) | 3004 | 2673 (71.8) | 331 (9.1) | |
| Age years, mean (SD) | 73.4 (17.4) | 74.5 (17.1) | 64.2 (17.6) | <0.001 |
| Sex male n (%) | 1646 (54.8) | 1454 (54.4) | 192 (58.0) | 0.213 |
| CCI mean (SD) | 2.3 (2.7) | 2.4 (2.8) | 1.9 (2.3) | 0.002 |
| CURB-65 mean (SD) | 1.8 (1.1) | 1.8 (1.1) | 1.4 (1.1) | <0.001 |
| HFRS mean (SD) | 5.4 (4.8) | 5.5 (4.9) | 4.0 (3.8) | <0.001 |
| MUST score mean (SD) | 0.6 (1.1) | 0.7 (1.1) | 0.6 (1.2) | 0.872 |
| Chronic lung disease n (%) | 1109 (36.9) | 943 (35.3) | 166 (50.2) | <0.001 |
| CAD n (%) | 269 (8.9) | 250 (9.4) | 19 (5.7) | 0.03 |
| CKD n (%) | 427 (14.2) | 404 (15.1) | 23 (6.9) | <0.001 |
| Cancer n (%) | 354 (11.8) | 304 (11.4) | 50 (15.1) | 0.050 |
| Smokers n (%) | 145 (4.8) | 114 (4.3) | 31 (9.4) | <0.001 |
| Alcohol n (%) | 165 (5.5) | 148 (5.5) | 17 (5.1) | 0.763 |
| Positive bacterial culture n (%) | 326 (10.9) | 247 (9.2) | 79 (23.9) | <0.001 |
| Haemoglobin g/L mean (SD) | 120.6 (20.4) | 120.5 (20.5) | 120.9 (19.9) | 0.739 |
| WBC X 109/L mean (SD) | 12.8 (7.5) | 12.8 (7.5) | 12.9 (6.9) | 0.816 |
| CRP mg/L mean (SD) | 109.5 (104.3) | 108.4 (102.4) | 118.8 (119.1) | <0.096 |
| Creatinine mmol/L mean (SD) | 102.8 (75.3) | 104.7 (77.8) | 87.2 (47.7) | <0.001 |
| Albumin g/L mean (SD) | 29.6 (5.5) | 29.7 (5.5) | 28.5 (5.8) | <0.001 |
| INR mean (SD) | 1.4 (0.7) | 1.4 (0.7) | 1.3 (0.6) | 0.352 |
| MET calls n (%) | 432 (14.4) | 376 (14.1) | 56 (16.9) | 0.163 |
| ICU admission n (%) | 138 (4.6) | 94 (3.5) | 44 (13.3) | <0.001 |
| ICU Length of stay in hrs median IQR | 74.5 (44, 140.5) | 75 (41, 134) | 75.5 (53, 148.5) | 0.394 |
| High flow oxygen n (%) | 68 (2.3) | 41 (1.5) | 27 (8.2) | <0.001 |
| NIV n (%) | 33 (1.1) | 13 (0.5) | 20 (6.0) | <0.001 |
| Mechanical ventilation n (%) | 14 (0.5) | 13 (0.5) | 1 (0.3) | 0.642 |
| Vasopressor support n (%) | 113 (3.8) | 90 (3.4) | 23 (6.9) | <0.001 |
COVID-19, coronavirus disease; SD, standard deviation; CCI, Charlson comorbidity index; CURB65, (pneumonia severity score calculated from following parameters: confusion, urea levels >7mmol/L, respiratory rate ≥30/min, blood pressure systolic <90mm Hg or diastolic <60mm Hg , and age ≥65 years); HFRS, hospital frailty risk score MUST, malnutrition universal screening tool; CAD, coronary artery disease; CKD, chronic kidney disease; WBC, white cell count; CRP, C-reactive protein; INR, international normalised ration.
Table 2.
Outcomes of non-COVID-19 Community acquired pneumonia patients admitted under two speciality units.
Table 2.
Outcomes of non-COVID-19 Community acquired pneumonia patients admitted under two speciality units.
| Outcome | Overall | General Medicine | Respiratory | P value |
|---|---|---|---|---|
| No (%) | 3004 | 2673 (78.9) | 331 (11.1) | |
| Length of stay, median IQR | 3.9 (2, 7) | 4.1 (2.5, 7.1) | 5.9 (3.5, 9) | <0.001 |
| In-hospital mortality n (%) | 215 (7.2) | 199 (7.4) | 16 (4.8) | 0.082 |
| 30-day mortality n (%) | 378 (12.6) | 348 (13.0) | 30 (9.1) | 0.041 |
| 30-day readmissions median IQR | 481 (16.0) | 428 (16.0) | 53 (16.1) | 0.100 |
COVID-19, corona virus disease; IQR, interquartile range.
Table 3.
Standardised mean differences and variance ratios in raw and matched pairs.
| Standardised mean differences | Variance ratio | |||
|---|---|---|---|---|
| Variable | Raw | Matched | Raw | Matched |
| Age | -0.56 | -0.09 | 1.11 | 0.88 |
| Sex | 0.05 | -0.08 | 0.99 | 1.01 |
| CCI | -0.22 | 0.76 | 0.75 | 1.28 |
| CURB-65 | -0.54 | 0.01 | 0.86 | 0.96 |
| MUST_score | -0.04 | -0.06 | 1.01 | 0.84 |
| HFRS | -0.53 | -.03 | 0.47 | 0.69 |
| Haemoglobin | 0.07 | -0.06 | 0.99 | 1.26 |
| CRP | -0.12 | 0.10 | 0.97 | 1.52 |
| Creatinine | -0.31 | 0.08 | 0.03 | 0.58 |
| Albumin | -0.11 | 0.01 | 1.35 | 1.71 |
| Chronic lung disease | 0.35 | 0.09 | 1.07 | 0.94 |
| Cancer | 0.02 | 0.04 | 1.07 | 1.10 |
| CAD | -0.11 | -0.08 | 0.70 | 0.54 |
| CKD | -0.26 | -0.03 | 0.51 | 0.94 |
CCI, Charlson comorbidity index; CURB-65, calculated from (Confusion, urea >7 mmol/L, Respiratory rate >30/min, Blood pressure >90mmHg or diastolic <65mmHg, Age >65 years); MUST, Malnutrition universal screening tool; CRP, C-reactive protein; CAD, coronary artery disease; CKD, chronic kidney disease.
Table 4.
CAP outcomes if admitted under Respiratory team compared to General Medicine after propensity score matching.
Table 4.
CAP outcomes if admitted under Respiratory team compared to General Medicine after propensity score matching.
| Outcome | Odds ratio* | 95% CI | P value |
|---|---|---|---|
| LOS | 19.36 | 4.42-84.60 | <0.001 |
| In hospital mortality | 1.01 | 0.97-1.06 | 0.456 |
| 30-day mortality | 1.01 | 0.96-1.07 | 0.521 |
| 30-day readmissions | 0.99 | 0.89-1.09 | 0.851 |
*Odds ratio displaying average treatment effect on treated (ATET); CI, confidence interval;.
Table 5.
CAP outcomes if admitted under Respiratory team compared to General Medicine after inverse probability weighting.
Table 5.
CAP outcomes if admitted under Respiratory team compared to General Medicine after inverse probability weighting.
| Outcome | Odds ratio* | Robust SE | 95% CI | P value |
|---|---|---|---|---|
| LOS | 17.30 | 0.71 | 4.24-70.59 | <0.001 |
| In hospital mortality | 1.00 | 0.02 | 0.96-1.04 | 0.775 |
| 30-day mortality | 0.97 | 0.11 | 0.95-1.04 | 0.076 |
| 30-day readmissions | 0.96 | 0.04 | 0.89-1.25 | 0.370 |
*Odds ratio displaying average treatment effect on treated (ATET); SE, standard error; CI, confidence interval.
Disclaimer/Publisher’s Note: The statements, opinions and data contained in all publications are solely those of the individual author(s) and contributor(s) and not of MDPI and/or the editor(s). MDPI and/or the editor(s) disclaim responsibility for any injury to people or property resulting from any ideas, methods, instructions or products referred to in the content. |
© 2024 by the authors. Licensee MDPI, Basel, Switzerland. This article is an open access article distributed under the terms and conditions of the Creative Commons Attribution (CC BY) license (http://creativecommons.org/licenses/by/4.0/).
Copyright: This open access article is published under a Creative Commons CC BY 4.0 license, which permit the free download, distribution, and reuse, provided that the author and preprint are cited in any reuse.


