
Submitted:
22 December 2024
Posted:
23 December 2024
You are already at the latest version
Abstract
In this study, we aim at assessing an alternative method for purification of Fc-fusion proteins that does not rely on chromatographic media or ligands. Recombinant human acetylcholinesterase, fused to the Fc-domain of human IgG1 (henceforth, AChE-Fc), was purified with precipitated aromatic complexes composed of the bathophenanthroline (henceforth, batho) chelator with either Zn2+ or Cu2+ ions (i.e., [(batho)3:Zn2+] or [(batho)3:Cu2+]) in the presence of polyethylene glycol 6000 (PEG-6000). In a three-step purification process conducted at pH 7, AChE-Fc was captured by the aromatic complexes (Step 1); unbound or weakly bound protein impurities were removed with 20 mM NaCl (Step 2); and AChE-Fc was then extracted at pH 7 (Step 3) using 100 mM Na citrate buffer in 250 mM NaCl. Purified AChE-Fc was monomeric (as determined by dynamic light scattering (DLS) and Native-PAGE); and it's secondary structure was maintained (by far UV circular dichroism (CD) spectroscopy). However, full enzymatic activity was only preserved with the [(batho)3:Zn2+] complex. Interaction between AChE-Fc and [(batho)3:Zn2+] led to ~83-88% overall protein yield. Process upscaling by 30-fold required only proportional increase in the amounts of [(batho)3:Zn2+] and PEG-6000. Efficient (95-97%) chelator recycling was achieved by recrystallization. Chelator leaching into purified AchE-Fc was estimated to be ~0.3% relative to the total amount used. Taken together, this novel procedure has the potential to provide an economical and practical avenue for industrial purification of Fc-fusion proteins.
Keywords:
Fc-fusion proteins
; Non-chromatographic purification
; Alternative to Protein A
1. Introduction
Fc-fusion proteins, first introduced in 1989 [1] are recombinant products of the Fc-domain of immunogobulin G (IgG), conjugated to a ligand. Such products may be highly diverse. A wide range of ligands are used and commonly include receptor extracellular domains [2], active peptides [3], enzymes [4,5] or cytokine traps [6]. Generally, Fc-fusion proteins are obtained by conjugating the C-terminus of the ligand to the N-terminal of the flexible hinge region in the Fc-domain. This fusion strategy is employed since the resulting products are stabilized by the strong interaction between homodimeric Fc CH2-CH3 domains of IgG [7,8]. The motivation behind the use of Fc-fusion proteins in medicine is due to the observation that many potentially therapeutic proteins or peptides exhibit a short serum half-life (t½) which frequently reduces their practical usefulness. The short serum t½ is generally the direct result of degradation by endogenous peptidases or rapid renal clearance. [9] For example, efficient secretion through the kidneys is observed for macromolecules having a molecular weight <60 KDa. [10] Fusing ligands to the Fc-domain of an IgG circumvents these difficulties by increasing the size of the fusion product. Since the molecular weight of the IgG Fc-domain is ~50 KDa [11], it leads to constructs that can exceed the kidney filtration cutoff (60-70 KDa) [12,13] which in turn, lengthens the Fc-fusion-protein circulation time. [14,15] This is accomplished by binding to the neonatal Fc receptor (FcRn) in a pH-mediated recycling process [16,17]. The specific interaction protects Fc-fusion proteins from being degraded by lysosomes [18] and accordingly, their serum t½ increases in parallel with the therapeutic effect [19,20]. Inclusion of the Fc-domain provides several additional advantages: (a) interaction with Fc-receptors located on immune cells. This property expands the medicinal use of Fc-fusion proteins to oncology as well as vaccine production. [21] (b) increasing avidity and potency. As Fc-fusion proteins are generally homodimers, they can be polymerized into homodimer-hexamers by engineering disulfide-bonds between the constant heavy domains (CH2-CH3) in the Fc-domain along with the use of an extension of 18 amino acids, called a tailpiece, derived from the C-terminus of immunoglobulin M (IgM) [22]). These, in turn, increase the number of binding sites, and hence, avidity [20]; (c) increasing the stability and solubility of lipophilic ligands or receptors [8,23]; (d) improving the expression level and secretion rate of target constructs [24].
The medicinal success of Fc-fusion proteins is similar to that of intact IgG's and is best reflected in global statistics showing that out of the ~13-16 FDA approved Fc-fusion proteins (as of 2020 [7]), five are "blockbuster"s [25]. Since mAbs and Fc-fusion proteins represent the largest category of biopharmaceuticals [26], they require efficient industrial-scale production that could provide high purity products for clinical use [27]. With respect to purification, many of the same isolation methods developed for antibody purification are used for Fc-fusion proteins [27] and fall into two major categories: chromatographic and non-chromatographic.
Non-chromatographic methods may include precipitation [28], aqueous two-phase partitioning [29] and crystallization [30], but none of these have been extensively employed for Fc-fusion proteins [26]. However, affinity based chromatographic methods that include the bacterial protein, Protein A (i.e., Protein A affinity chromatography), is primarily utilized during the capturing step [31]. This is commonly followed by ion exchange chromatography for final polishing [27]. The popularity of Protein A chromatography derives from (a) high binding affinity [32] and selectivity of the ligand toward the Fc domain via helices 1 and 2 in the three tightly packed, alpha-helical bundles present in each of the five homologous domains of Protein A [33,34,35]. This translates to high process yields for different antibody subclasses (up to 99%, [31]) and purity within a single chromatographic step [26,36]. (b) the tolerance of the ligand towards acidic pH (used during the elution step), or denaturants, e.g., urea, guanidinium hydrochloride, or NaOH, applied during column sanitation [37,38]; and (c) the ability to fabricate polymeric resins with high binding capacity towards target mAbs and Fc-fusion proteins [39,40].
Nevertheless, chromatographic media in which Protein A is covalently immobilized in polymethacrylate, agarose or glass beads [39,40,41], suffer from two drawbacks: (i) limited flow rate caused by back pressure generated due to diffusion into the pores of the polymeric beads; and (ii) the requirement to filter samples prior to their loading on the column in order to minimize column clogging [26]. Overcoming these shortcomings has been attempted with approaches that do not rely on polymeric beads, including monolithic affinity chromatogaphy [36,42] and specially designed membranes [43]. Though both strategies contribute to high flow rates and lower back pressures, to the best of our knowledge, they do not show sufficient binding capacity towards antibodies and Fc-fusion proteins, currently rendering these protocols impractical for industrial scale use [31,44,45].
In this study, we aim at assessing an alternative method for purification of Fc-fusion proteins that does not rely on chromatographic media or ligands. Instead, aromatic [metal:chelator] complexes are used, composed of the commercially available bathophenanthroline chelator (henceforth, batho) and either Zn2+ or Cu2+ ions as [(batho)3:Zn2+] or [(batho)2:Cu2+]. PEG-6000 is also present. Such complexes have recently demonstrated their ability to purify human lactoferrin [46], most likely via cation-π interactions generated between the positively charged side-chains of Arg and Lys amino acids of the protein and the electron cloud of the aromatic chelator. Accordingly, we have tested the ability of the above complexes to purify a recombinant homodimer, Fc-fusion-protein comprising the Fc-domain of human IgG1 fused to human acetylcholinesterase (AChE) (i.e., AChE-Fc). This enzyme functions as a highly efficient bioscavenger for organophosphate nerve agents and, once fused to the Fc-domain, demonstrates an extention of its serum t½ from minutes to 4 days (in mice) and hence, may be a practical and valuable prophylactic agent [5]. The encouraging pharmacokinetic properties of AChE-Fc, combined with its efficient neutralizing capabilty against diverse nerve agents and ease of production (i.e., overexpression and purification), has suggested that this fusion-protein may represent a next-generation organophosphate bioscavenger. Our report aims at demonstrating the efficiency with which AChE-Fc may be isolated and purified in the absence of any chromatographic step or ligand.
2. Materials and Methods
2.1. Materials
Sodium chloride (Sigma, S7653), bathophenanthroline (GFS chemicals, C038446), zinc chloride (Sigma, 208086), copper (II) sulfate pentahydrate (Sigma, 209198), polyethylene glycol-6000 (PEG-6000) (Sigma, 81260), sodium citrate tribasic dihydrate (Sigma, S4641), PBS (Bio-Lab, 162323G500), bovine serum albumin (BSA) (Sigma, 10775835001), 5,5-dithio-bis-(2-nitrobenzoic acid) (DTNB) (Sigma, D8130), sodium phosphate (Sigma, S9763), acetylthiocholine iodide (ATC) (Sigma, O1480).
2.2. Methods
2.2.1 Preparation of 0.2M bathophenanthroline:DMSO:HCl (batho:DMSO:HCl) solution. Into 90 μL of dimethyl sulfoxide (DMSO) and 10 μL of 25% HCl, 6.64 mg of bathophenanthroline are added and vortexed for 5 min until total dissolution is observed. The whole procedure is conducted at 25oC.
2.2.2. Purification of AChE-Fc with [(Batho)3:Zn2+] or [(Batho)2:Cu2+] Complexes.
Step 1: Complex formation: Addition of 0.95 μL of [batho:DMSO:HCl] to 24 μL of 4 mM ZnCl2 (or 4 mM CuSO4) in 20 mM NaCl was followed by 5 minutes incubation at 25°C; 2.5 μL of 5M NaCl were then added and further incubated for 5 minutes at 25°C. Centrifugation (21,000 x g, 5 min at 19°C) was applied, the supernatant discarded , and the pellet was washed once with 50 μL of cold 20 mM NaCl. Centrifugation was repeated (21,000 x g, 5 minutes at 10°C) and the resulting pellet was used for AChE-Fc capture. Step 2: AChE-Fc capture: Freshly prepared [metal:chelator] complexes were resuspended with 150 μL of overexpressed AChE-Fc (0.4 mg/mL, by enzymatic activity) plus impurities, 37 μL of 0.5 M Na citrate (pH 7) and 187 μL of 30% w/v of PEG-6000 in DDW. Following 20 minutes incubation at 10°C and centrifugation (21,000 x g, 5 minutes at 10°C) the supernatant was discarded and the pellet was briefly washed with 100 μL of cold 20 mM NaCl. Step 3: AChE-Fc extraction: Washed pellets were resuspended in 200 μL of 100 mM Na citrate (pH 7) and 250 mM of NaCl and incubated 30 minutes at 10°C. Centrifugation followed (21,000 x g, 5 minutes, 10°C) and aliquots from the supernatant were analyzed by SDS-PAGE.
2.2.3. Dynamic Light Scattering (DLS)
AChE-Fc purified by [(batho)3:Zn2+] or [(batho)2:Cu2+] complexes or by Protein A chromatography (representing the control [C] sample) were dialyzed against phosphate buffered saline (PBS) and diluted to 0.2 mg/mL. Samples were centrifuged (21,000 x g, 10 minutes at 10°C) prior to analysis and the intensity-weighted particle size distribution of AChE-Fc was determined using the auto correlation spectroscopy protocol of the Nanophox instrument (Sympatec GmbH, Clausthal-Zellerfeld, Germany).
2.2.4. Circular Dichroism (CD) Spectroscopy
Samples containing purified AChE-Fc were first dialyzed in PBS and then further diluted with PBS to 0.05 mg/mL. Analysis was performed using a Chirascan CD spectrometer (Applied Photophysics). CD spectra report ellipticity (θ), proportional to the difference in absorbance of left and right circularly polarized light [θ = 3300° (AL-AR)] as a function of wavelength. A quartz cell of path length 0.1 cm was used for the measurements. The CD spectra were recorded with 2 nm bandwidth resolution in 1 nm steps at 25°C. Collected CD spectra were corrected for baseline distortion by subtracting a reference spectrum of the corresponding buffer solution.
2.2.5. Native PAGE
AChE-Fc samples, purified either by Protein A chromatography or via the [(batho)3:Zn2+] or [(batho)2:Cu2+] complexes, were applied to a 10% native gel, prepared according to the protocol of Trudel and Asselin [47].
2.2.6. Batho Recrystallization and Quantitation
At the end of the purification protocol (as described above), pellets were incubated at 80°C for an hour with 0.5 mL of a mixture comprising DDW/CH3OH (4:1, v/v) that included 250 mM of EDTA at pH 8. A brief centrifugation (4°C, RCF = 21,000, 5 minutes) and pellet washing with 0.5 mL DDW led to the appearance of colorless microcrystals. These were subsequently dissolved in methanol. Following addition of 4 mM FeCl2 in 20 mM NaCl, the specific absorption of [(batho)3:Fe2+] at 533 nm [48] was measured. Control samples representing 100% recycling yield, were prepared by mixing an identical amount of batho used for the purification protocol with the same volume of the 4 mM FeCl2 in 20 mM NaCl as described above. Quantitation of the red [(batho)3:Fe2+] complex was performed with a Jasco V-750 spectrophotometer.
2.2.7. AChE-Fc Activity
Enzymatic activity was determined according to Ellman et al., [49] in the presence of AChE-Fc substrate buffer comprising 0.1 mg/mL bovine serum albumin (BSA), 0.3 mM 5,5-dithio-bis-(2-nitrobenzoic acid) (DTNB), 50 mM NaPi, pH 8.0 and 0.5 mM acetylthiocholine iodide (ATC) (Figure 1). Measurements were performed at 27°C using the Thermomax ABS Plus microplate reader (Molecular Devices). Samples containing an identical amount (as determined by the ND-1000 Nanodrop, Thermo-Scientific) of either the control [C] AChE-Fc - purified via Protein A chromatography or AChE-Fc, isolated with either of the aromatic [metal:chelator] complexes as described in Section 2.2.2, were dialyzed against phosphate buffered saline (PBS) and used to generate a series of dilutions from which the optical density at λmax = 405 nm was determined following 5 minutes of incubation.
2.2.8. Leaching Assessment
Pellets comprising [(batho)3:Zn2+] or [(batho)2:Cu2+] were prepared as described above, washed with 100 μL of 20 mM NaCl and then dissolved in 200 μL methanol. Aliquots from the fully dissolved complexes were diluted with methanol and intensity at 280 nm was measured with a UV-Vis (Jasco V-750) spectrophotometer. The values obtained, with a known dilution factor, represented the total amount (i.e., 100%) of the [metal:chelator] complexes initially present in the system and prior to the capturing-step. The protocol was repeated in the presence of 100 mM Na Citrate (pH 7), 250 mM NaCl.
2.2.9. Scanning Electron Microscopy (SEM)
Freshly prepared and precipitated [(batho)3:Zn2+] or [(batho)2:Cu2+] complex samples in 20 mM NaCl were loaded onto a carbon-coated copper grid Type -B (200 mesh) and dried overnight in a desiccator at 25°C. Images were obtained using the UHR-MAIA3 TESCAN SEM with an In-Beam SE detector at HV 25 kV and magnification, 500 kX.
3. Results and Discussion
The focus on two different bathophenanthroline (batho) complexes (i.e., [(batho)3:Zn2+] or [(batho)2:Cu2+]) (Figure 2) was motivated by our intention to study whether the metal coordination-number can affect process yield and/or purity. Since Zn2+ [50] and Cu2+ [51] form [1:3] and [1:2] complexes, respectively, with batho, and Zn2+ is less toxic than Cu2+ [52], they seemed to present suitable models. The use of batho as the preferred chelator derives from a previous study demonstrating its superiority with respect to the purity of the recovered target protein when compared to other hydrophobic chelators [46] combined with its ability to be recycled rapidly, and essentially quantitatively, by recrystallization [53].
3.1. Precipitation of the Metal-Chelator Complexes
Both [(batho)3:Zn2+] and [(batho)2:Cu2+]) precipitated upon addition of 0.5M NaCl. Scanning electrion microscopy (SEM) showed that these precipitates do not contain crystals; rather they consist of micron sized, entangled and porous meshes, independent of the metal used (Figure 2). They share some morphological resemblance to the matrix of monolithic chromatography [42]. Interestingly, cation identity (i.e., Zn2+ or Cu2+) had no marked effect on the the morphology of the resulting precipitates. Incubation at 10°C of the overexpressed human AChE-Fc plus cellular impurities with either of the resuspended complexes led to quantitative capture when 50 mM NaCitrate (pH 7) was used as buffer whereas other buffers tested (e.g., Tris or NaPi at the same pH) were less efficient (data not shown). Target extraction from the precipitated complexes was achieved at 10°C with 100 mM NaCitrate (pH 7) in 250 mM NaCl. Under these conditions, a relatively pure target was recovered (>95%, by SDS-PAGE) (Figure 3, A-B, lanes 3-6). Band migration of the Fc-fusion protein under denaturing and reducing conditions was very similar to that observed earlier [5] and process reproducibility was high; no significant change in target band intensity was observed in four independent purification trials performed on four different days (Figure 3, A-B, lanes 3-6). Thus, the aromatic chelator complexes demonstrated their ability to purify a Fc-fusion protein in the absence of a specific chromatographic ligand.
3.2. The Role of PEG 6000
We found that in addition to the required presence of batho, metal cation and NaCitrate buffer (pH 7), the presence of 15% w/v PEG-6000 is also essential, as at 13% w/v, a reduction in overall process yield was already observed and at 9% w/v, only trace amounts of the target fusion protein were recovered (Figure S1, lanes 4 and 6). This requirement may derive from the inherent property of polyethylene glycols (PEGs) as osmotically active polymers, promoting molecular crowding with parallel preservation of enzymatic activity. [54,55,56,57] We therefore suggest that the presence of 15% w/v PEG-6000 during the capturing step brings the fusion proteins into close proximity with the porous, entangled meshes of the precipitated aromatic complexes, that, in turn, promote binding between the two.
3.3. Aggregational State of the Recovered Fc-AChE
Given that biopharmaceuticals must exhibit monodispersity in order to be approved by the FDA, it was essential to assess whether the purified Fc-fusion protein is not aggregated [58]. We therefore performed dynamic light scattering (DLS) measurements that are commonly employed to assess protein hydrodynamic size distributions [59,60]. The results showed that the hydrodynamic particle size (43 nm) of the pure AChE-Fc that served as the control sample (isolated with Protein A chromatography), was essentially identical to the particle sizes (42 nm or 40 nm) of AChE-Fc that had been subjected to purification by either the [(batho)3:Zn2+] or [(batho)2:Cu2+]) complex, respectively (Figure 4, A).
To further validate protein monodispersity, the purified Fc-fusion protein was analyzed by native polyacrylamide gel electrophoresis (Native-PAGE). For Native-PAGE, neither detergent (i.e., sodium dodecyl sulfate, SDS) nor reducing agents (e.g., β-mercaptoethanol) are present. Under these non-denaturing and non-reducing conditions, we found that all protein samples, including the control sample, migrated a distance on the gel consistent with molecular weight in the range of 180-220 KDa (Figure 4, B lanes 2-4). These results indicated that all three samples contain a homogenous population of proteins regardless of the purification strategy used (i.e., Protein A chromatography or aromatic [metal:chelator] complexes + PEG-6000). We attribute these findings to the mild purification conditions to which AChE-Fc is exposed during the capturing and extraction steps (i.e., pH 7, 10°C), that avoid exposure to harsh acidic conditions that may promote antibody aggregation [61].
3.4. Enzymatic Activity
Preservation of enzymatic activity provides important verification of the native state of an enzyme. The enzymatic activity of acetylcholinesterase prior to, and following, protein purification was compared using Ellman's assay [62] (Figure 1). While the use of the [(batho)3:Zn2+] complex fully preserved catalytic activity when compared to the target purified via Protein A chromatography, the analogous [(batho)2:Cu2+] complex reduced enzymatic activity by ~50% (Figure 5A). As the only difference between the aromatic complexes is cation identity, this implies that Cu2+ ions are responsible for the reduction in enzymatic activity. We may suggest a possible explanation: the much lower binding affinity of the 1,10-phenenthroline moiety to Cu2+ (log Keq=10.69) vs. Zn2+ (log Keq=24.3) at 25°C [63] translates to a greater concentration of free Cu2+ ions in solution. These, in turn, bind non-specifically to side chains of acetylcholinesterase, thereby affecting its activity. Preservation of enzymatic activity was consistent with circular dichroism (CD) spectroscopy. CD is a widely used, non-invasive analytical tool capable of assessing secondary structural alterations in proteins [64]. The positive ellipticity peak maximum at 205 nm and the negative peak centered at 218 nm were both displayed by the control [C] sample (containing Fc-AChE purified with Protein A) and by the recovered target purified with either of the [metal:chelator] complexes, thereby indicating no significant alteration in protein secondary structure (Figure 5, B). Importantly, the 218 nm peak is characteristic of an anti-parallel, β-pleated sheet, which is the dominant antibody secondary structural motif [65]. Here, the source is likely the Fc-domain of the target, while AChE is characterized by an α/β-hydrolase fold consisting of a central β-sheet packed between two layers of α-helices [66].
Differences in peak heights relative to the [C] sample, may be attributed to differences in protein concentration during analysis as the proportionality of the maximum and minimum peak values are maintained in all three samples (Figure 5, B).
3.5. Binding Interactions and Process Yield
Since full preservation of enzymatic activity was observed only with the [(batho)3:Zn2+] complex, we proceeded to focus on this complex and used the Ellman's colorimetric assay as a tool for quantitating process yield (Figure 1). We found that (i) 98% of the Fc-AChE molcules bind to the [(batho)3:Zn2+] complex during the capturing-step; (ii) ~5% are lost during the washing-step and (iii) and an overall yield of 83% is obtained at the end of the process following the extraction-step. The fact that 98% of the Fc-fusion protein molecules are bound to the aromatic [(batho)3:Zn2+] complex during the capturing-step suggests the existence of high binding affinity between the two. This observation initiated an attempt to identify the nature of the interactions responsible for such tight binding. We approached this objective by introducing free amino acid monomers during the capturing-step or during the extraction step. The presence of different amino acids might compete with side-chains of the Fc-fusion protein for (1) binding to the aromatic [(batho)3:Zn2+] complex or (2) for being extracted from the precipitate into the supernatant, and by so doing, reveal the type of associated interactions. Competition on protein binding or extraction would translate into lower overall process yield that could be quantitated by SDS-PAGE. Gels and analyses are presented in the Supplementary Material, Figure S2. The overall surface charge of IgG is almost neutral at pH 7, while AChE surface charge is heavily negative. We tentatively suggest that it is the Fc domain, rather than AChE, that is more likely to form chelation interactions during the capturing step with the [(batho)3:Zn2+] amphiphilic complex. We attribute this behavior to an excess of imidazole (His) and carboxylate (Glu) side chains as well as the participation of Fc in a large number of Van der Waals (induced dipole-dipole) interactions due to the Val and Pro residues.
3.6. Binding Capacity
The maximal binding capacity of the [(batho)3:Zn2+] complex for the Fc-AChE target was studied by repeating the purification process with a constant amount of [(batho)3:Zn2+] accompanied by step-wise increase of the target fusion protein (Figure S3). Purity was essentially preserved when the amount of impure AChE-Fc was doubled (Figure S3, lane 3 vs. lane 4), but at larger volumes, a small decrease in purity of AChE-Fc was observed, perhaps due to the larger amount of impurities present in the system without parallel increase of the [(batho)3:Zn2+] complex (Figure S3, lane 3 vs. lanes 5-6). Process yields however, improved from 82% to 95% and 98% when the volume of the target protein plus impurities was increased from 150 µL (as described in the Methods section) to 300 µL and 450 µL, respectively, and decreased when 600 µL were present (Figure S3, lanes 3 to 6). Since 300 µL of a sample of AChE-Fc + impurities contain 120 µgr of the target (by enzymatic activity) and requires ~65 µgr of batho to reach a relatively pure Fc-fusion protein (Figure S3, lane 4), we conclude that 1 gram of AChE-Fc can be isolated with ~0.55 gram of batho. Under these working conditions, the molar ratio between batho (MW = 332) and AChE-Fc (MW ~240 KDa) is ~375:1, respectively. These findings are encouraging as they show that a limited mass of chelator is required to efficiently purify a much larger mass of AChE-Fc.
3.7. Process Upscaling
The impact of reaction volume on process efficiency was also evaluated. We found that a 30-fold increase from 0.375 mL to 11 mL required only proportional increase of the [(batho)3:Zn2+] complex and PEG-6000 (Figure 6). As no reagent adjustments were needed, it may represent a good starting point for further process upscaling.
3.8. Chelator Recycling
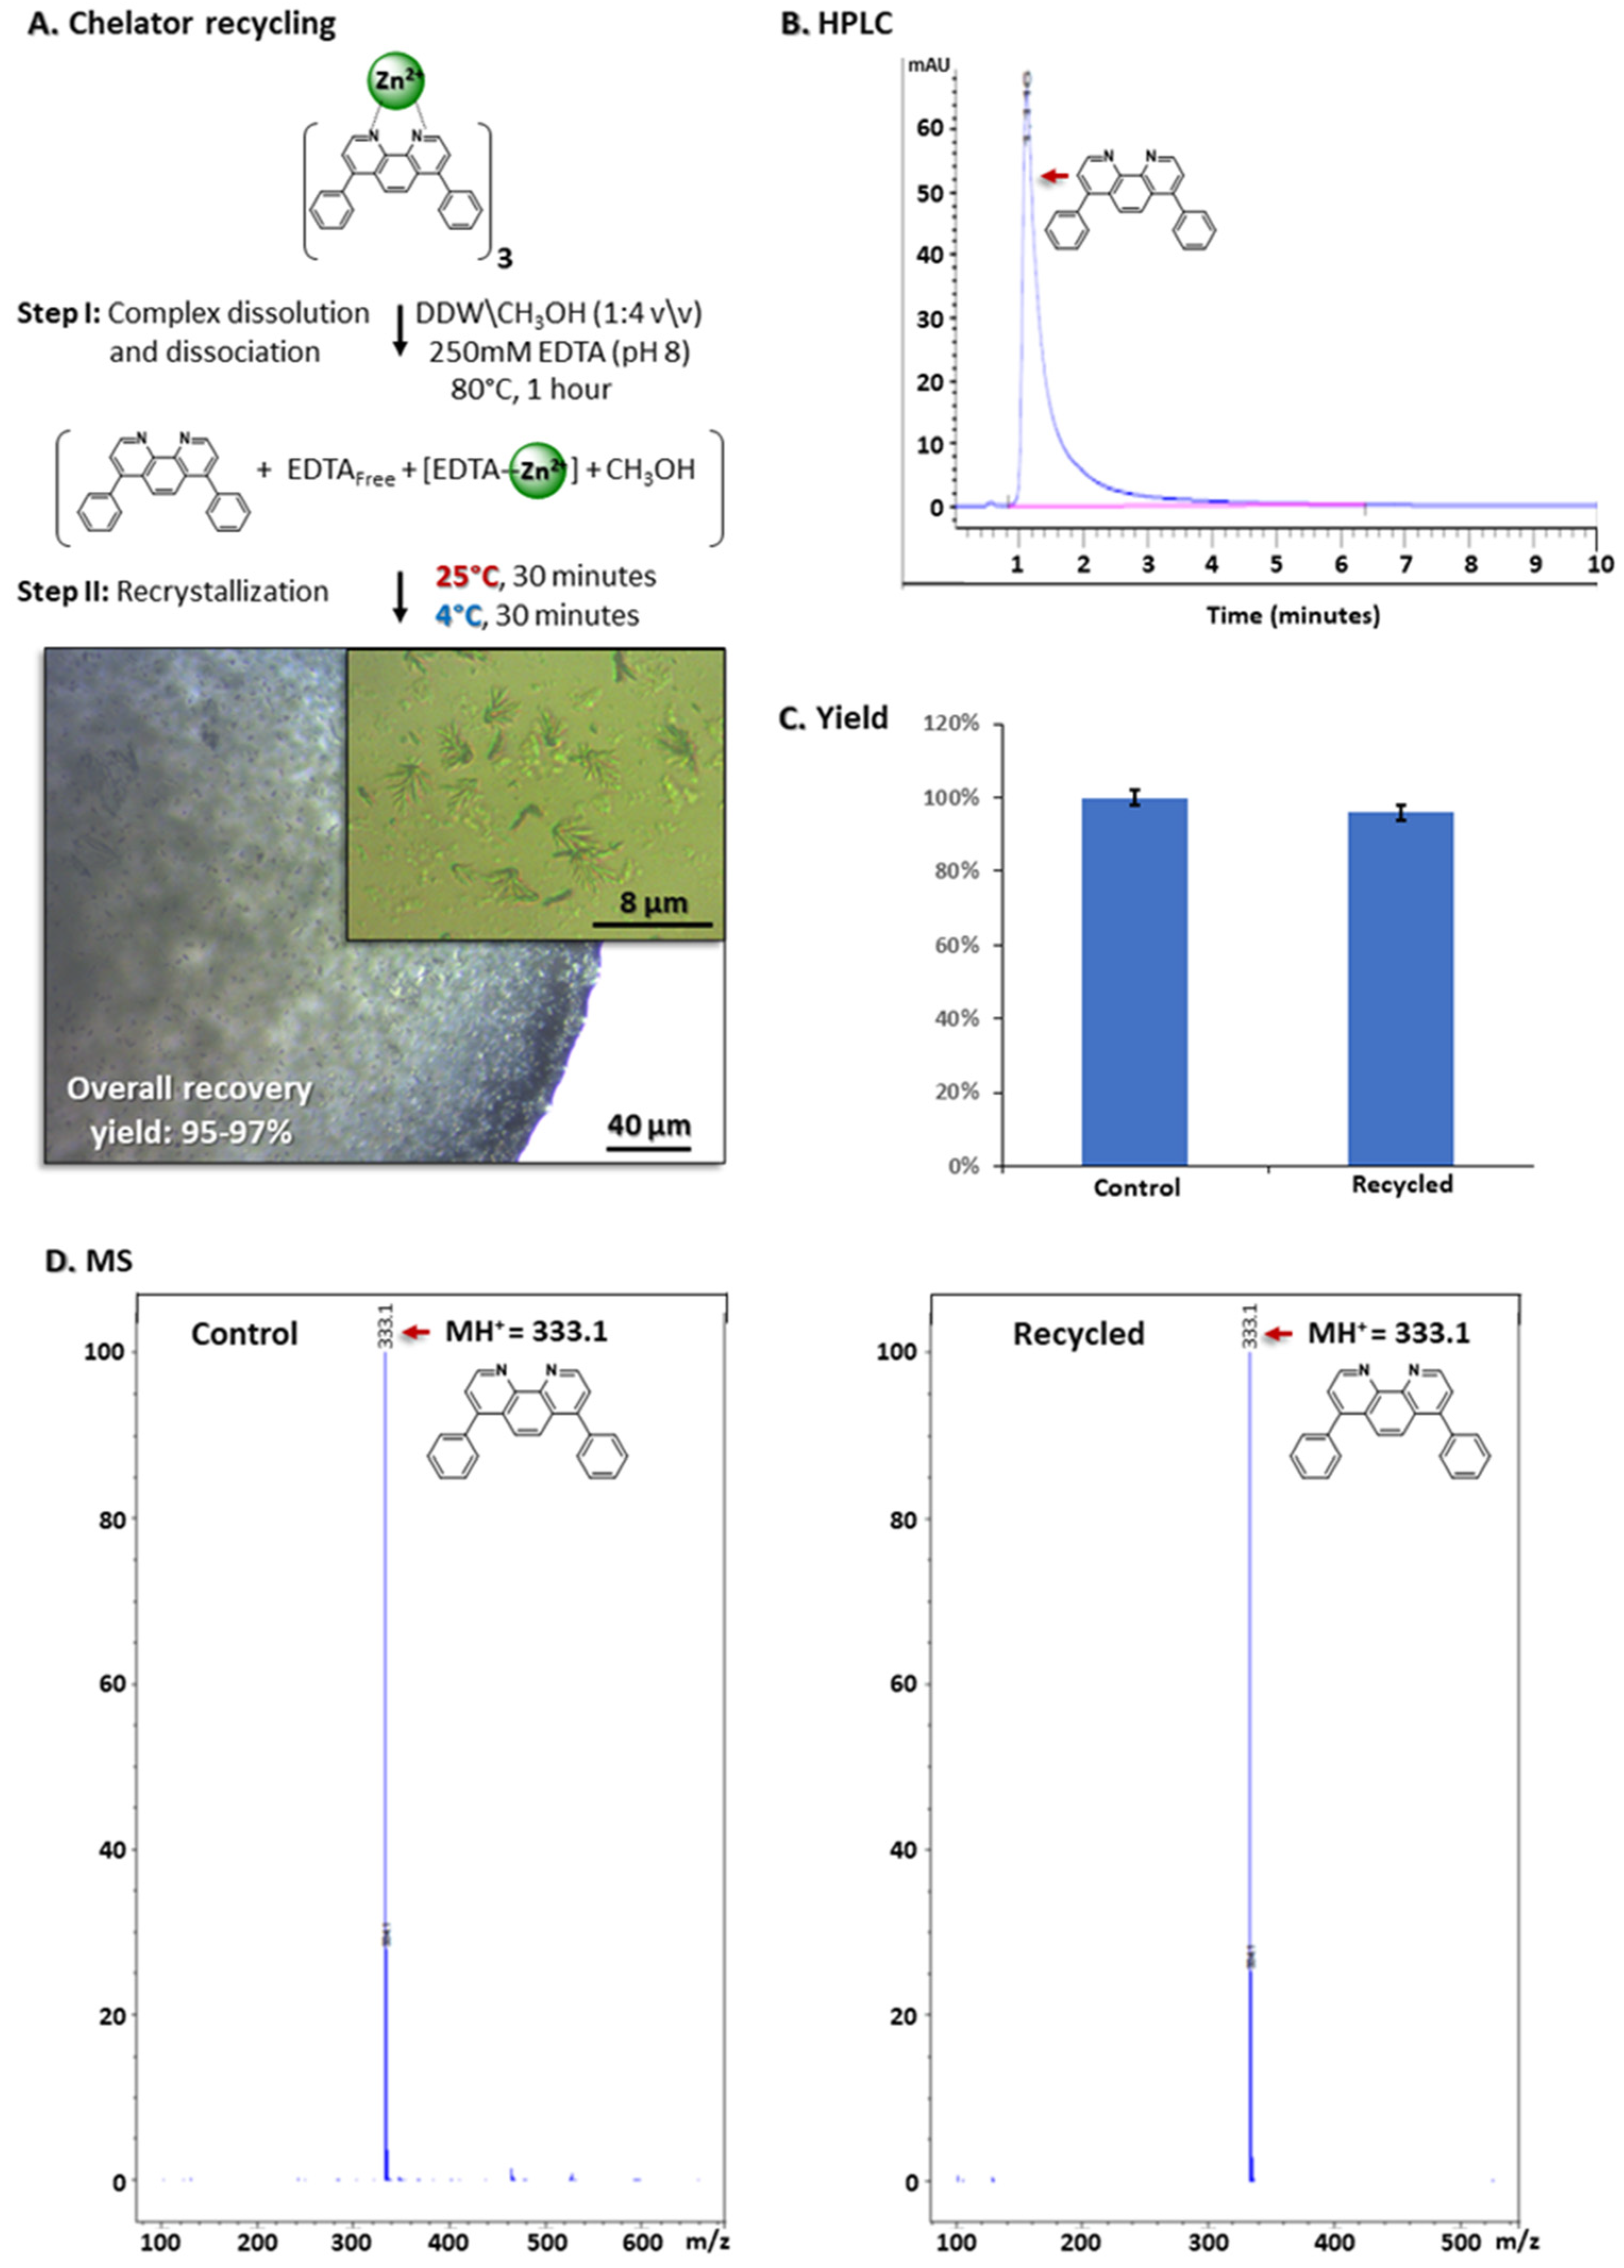
With respect to process economics, recycling the hydrophobic chelator was considered to be essential as it represents ~85% of all raw material costs. We therefore aimed at developing a rapid, non-chromatographic, cost-effective and simple-to-implement protocol for chelator recycling. We exploited the extremely low water-solubility of the batho chelator combined with its fully aromatic structure. These two properties suggested that it would rapidly crystallize from aqueous media due to its highly hydrophobic nature and ability to form π-π interactions acting as stable nucleation centers to support rapid crystal growth. Accordingly, the pellets that remained at the end of the purification process were incubated for an hour at 80°C with 0.5 mL of a mixture containing DDW/CH3OH (4:1, v/v) that included 250 mM EDTA, pH 8 (Figure 7, A).
These conditions were expected to dissolve the [(batho)3:Zn2+] complex, as previously demonstrated for the analogous [(batho)3:Fe2+] complex, [53]. This allowed the excess EDTA molecules to compete with batho for Zn2+ binding and to suppress reforming of the [(batho)3:Zn2+] complex. Indeed, colorless crystals were observed following gradual cooling of the medium from 80°C to 4°C and washing of the resulting pellet with DDW (Figure 7, A). Mass-spectrometry (Figure 7, B) and HPLC analysis indicated that the micro-crystals are composed of 97% pure batho (Figure 7, B-C), a similar purity level to that determined for pristine, commercial batho crystals. Recycling yield was found to be close to quantitative (95-97%). These values are obtained by measuring the specific absorption of the [(batho)3:Fe2+] at 533 nm [48] after dissolving the entire amount of recycled chelator with methanol, adding 4 mM FeCl2 in 20 mM NaCl and comparing the measured OD values to those obtained from the total quantity of batho present initially in the system (Figure 7,D).
3.9. Chelator Leaching
Since batho is aromatic, we quantitated chelator leaching by its absorption at 280 nm under extraction conditions of 100 mM NaCitrate, 250 mM NaCl, pH 7. Freshly precipitated [(batho)3:Zn2+] complex was prepared as described in the Methods section and assessment of chelator leaching was determined under standard extraction conditions. Batho leaching was found to be insignificant and dependent on temperature. Chelator leaching at 10°C and at 25°C was in the range of 0.27-0.33% and 0.31-0.38% respectively, relative to the total amount of chelator present. This section may be divided by subheadings. It should provide a concise and precise description of the experimental results, their interpretation, as well as the experimental conclusions that can be drawn.
4. Conclusions
A Fc-fusion protein, AChE-Fc, was efficiently purified under mild conditions - neutral pH, 10°C - without the necessity for a chromatographic step, specific ligand or resin. We used a precipitated aromatic chelator[(batho)3:Zn2+] complex combined with PEG-6000. Preservation of enzymatic activity of the fusion partner, was combined with high binding capacity of the [(batho)3:Zn2+] complex. The maintenance of process yield and purity even upon 30-fold increase in reaction volume suggests that the purification process studied may be readily applied to other Fc-fusion proteins and, in particular, to those that are acid-labile. Purification is rapid - less than one hour, while requiring mass fraction chelator of one-half relative to the amount of the target Fc-fusion protein. Chelator leaching into the purified protein target is estimated to be only ~0.27% relative to the total amount of chelator present. There was no loss of yield or purity upon a 30-fold increase in process volume and only proportional increase in reagents was required. The large pore sizes of the precipitated [(batho)3:Zn2+] complex (20-80 nm) should allow rapid diffusion of large Fc-fusion proteins similar to that achieved with porous monolithic affinity chromatography supports. Efficient chelator recycling is achieved by a rapid and cost-effective crystallization protocol. All these positive attributes suggest that the procedure described above has the potential to provide an economical and practical avenue for industrial purification of Fc-fusion proteins.
Supplementary Materials
The following supporting information can be downloaded at the website of this paper posted on Preprints.org, Figures S1-S3.
Author Contributions
T.J.W - Conceptualization, validation, data curation, methodology; R.A - Validation, methodology, data curation; O.K – Data curation; E.W – Writing, review and editing; O.M – Writing, review and editing; G.P - Conceptualization, supervision and writing the original draft.
Funding
This research received no external funding
Data Availability Statement
The data presented in this study are available on request from the corresponding author.
Acknowledgments
We wish to express our gratitude to Efi Makdasi, for fruitful discussions and support and to Eyal Epstein for providing AChE-Fc-containing cell culture supernatant. The authors thanks Ariel University and the Israel Institute for Biological research, for their support.
Conflicts of Interest
Patent application for the usage of AChE-Fc was filed by the Israel Institute for Biological Research. O.M. is an Editorial Board Member of Antibodies. None of the authors declared any additional competing interests.
References
- Capon, D.J., et al., Designing CD4 immunoadhesins for AIDS therapy. Nature, 1989. 337(6207): p. 525-31. [CrossRef]
- Sokolowska-Wedzina, A., et al., Efficient production and purification of extracellular domain of human FGFR-Fc fusion proteins from Chinese hamster ovary cells. Protein Expression and Purification, 2014. 99: p. 50-57. [CrossRef]
- Ning, L., et al., Molecular Design of Peptide-Fc Fusion Drugs. Curr Drug Metab, 2019. 20(3): p. 203-208. [CrossRef]
- Dwyer, M.A., et al., Expression and Characterization of a DNase I-Fc Fusion Enzyme*. Journal of Biological Chemistry, 1999. 274(14): p. 9738-9743. [CrossRef]
- Noy-Porat, T., et al., Acetylcholinesterase-Fc Fusion Protein (AChE-Fc): A Novel Potential Organophosphate Bioscavenger with Extended Plasma Half-Life. Bioconjug Chem, 2015. 26(8): p. 1753-8. [CrossRef]
- Jazayeri, J.A. and G.J. Carroll, Fc-Based Cytokines. BioDrugs, 2008. 22(1): p. 11-26.
- Duivelshof, B.L., et al., Therapeutic Fc-fusion proteins: Current analytical strategies. J Sep Sci, 2021. 44(1): p. 35-62. [CrossRef]
- Zhang, J., et al., Fusion partners as a tool for the expression of difficult proteins in mammalian cells. Curr Pharm Biotechnol, 2010. 11(3): p. 241-5. [CrossRef]
- Sato, A.K., et al., Therapeutic peptides: technological advances driving peptides into development. Curr Opin Biotechnol, 2006. 17(6): p. 638-42. [CrossRef]
- Meibohm, B. and H. Zhou, Characterizing the impact of renal impairment on the clinical pharmacology of biologics. J Clin Pharmacol, 2012. 52(1 Suppl): p. 54s-62s. [CrossRef]
- Nardella, F.A. and D.C. Teller, Fc intermediate (Fci), a papain-generated fragment of human IgG, intermediate in charge, molecular weight and cleavage between the Fc and Fc' fragments of IgG. Mol Immunol, 1985. 22(6): p. 705-13. [CrossRef]
- Jevsevar, S., M. Kunstelj, and V.G. Porekar, PEGylation of therapeutic proteins. Biotechnol J, 2010. 5(1): p. 113-28. [CrossRef]
- Meibohm, B. and H. Zhou, Characterizing the Impact of Renal Impairment on the Clinical Pharmacology of Biologics. The Journal of Clinical Pharmacology, 2012. 52(S1): p. 54S-62S. [CrossRef]
- Ko, S., et al., An Fc variant with two mutations confers prolonged serum half-life and enhanced effector functions on IgG antibodies. Experimental & Molecular Medicine, 2022. 54(11): p. 1850-1861. [CrossRef]
- Kontermann, R.E., Strategies for extended serum half-life of protein therapeutics. Curr Opin Biotechnol, 2011. 22(6): p. 868-76. [CrossRef]
- Rath, T., et al., Fc-fusion proteins and FcRn: structural insights for longer-lasting and more effective therapeutics. Crit Rev Biotechnol, 2015. 35(2): p. 235-54. [CrossRef]
- Roopenian, D.C. and S. Akilesh, FcRn: the neonatal Fc receptor comes of age. Nat Rev Immunol, 2007. 7(9): p. 715-25. [CrossRef]
- Weflen, A.W., et al., Multivalent immune complexes divert FcRn to lysosomes by exclusion from recycling sorting tubules. Mol Biol Cell, 2013. 24(15): p. 2398-405. [CrossRef]
- Strohl, W.R., Fusion Proteins for Half-Life Extension of Biologics as a Strategy to Make Biobetters. BioDrugs, 2015. 29(4): p. 215-39. [CrossRef]
- Czajkowsky, D.M., et al., Fc-fusion proteins: new developments and future perspectives. EMBO Mol Med, 2012. 4(10): p. 1015-28. [CrossRef]
- Nimmerjahn, F. and J.V. Ravetch, Fcgamma receptors as regulators of immune responses. Nat Rev Immunol, 2008. 8(1): p. 34-47.
- Mekhaiel, D.N., et al., Polymeric human Fc-fusion proteins with modified effector functions. Sci Rep, 2011. 1: p. 124. [CrossRef]
- Carter, P.J., Introduction to current and future protein therapeutics: a protein engineering perspective. Exp Cell Res, 2011. 317(9): p. 1261-9. [CrossRef]
- Chen, X., J.L. Zaro, and W.C. Shen, Fusion protein linkers: property, design and functionality. Adv Drug Deliv Rev, 2013. 65(10): p. 1357-69. [CrossRef]
- Strohl, W.R., Current progress in innovative engineered antibodies. Protein Cell, 2018. 9(1): p. 86-120. [CrossRef]
- Kanje, S., et al., Chapter 2 - Engineering of Protein A for improved purification of antibodies and Fc-fused proteins, in Approaches to the Purification, Analysis and Characterization of Antibody-Based Therapeutics, A. Matte, Editor. 2020, Elsevier. p. 35-54.
- Roque, A.C., C.S. Silva, and M.A. Taipa, Affinity-based methodologies and ligands for antibody purification: advances and perspectives. J Chromatogr A, 2007. 1160(1-2): p. 44-55. [CrossRef]
- Tscheliessnig, A., et al., Ethanol precipitation for purification of recombinant antibodies. J Biotechnol, 2014. 188: p. 17-28. [CrossRef]
- Mao, L.N., et al., Downstream antibody purification using aqueous two-phase extraction. Biotechnol Prog, 2010. 26(6): p. 1662-70. [CrossRef]
- Smejkal, B., et al., Fast and scalable purification of a therapeutic full-length antibody based on process crystallization. Biotechnol Bioeng, 2013. 110(9): p. 2452-61. [CrossRef]
- Bolton, G.R. and K.K. Mehta, The role of more than 40 years of improvement in protein A chromatography in the growth of the therapeutic antibody industry. Biotechnol Prog, 2016. 32(5): p. 1193-1202. [CrossRef]
- Hober, S., K. Nord, and M. Linhult, Protein A chromatography for antibody purification. J Chromatogr B Analyt Technol Biomed Life Sci, 2007. 848(1): p. 40-7. [CrossRef]
- Deisenhofer, J., Crystallographic refinement and atomic models of a human Fc fragment and its complex with fragment B of protein A from Staphylococcus aureus at 2.9- and 2.8-A resolution. Biochemistry, 1981. 20(9): p. 2361-70.
- Tashiro, M. and G.T. Montelione, Structures of bacterial immunoglobulin-binding domains and their complexes with immunoglobulins. Curr Opin Struct Biol, 1995. 5(4): p. 471-81. [CrossRef]
- Tashiro, M., et al., High-resolution solution NMR structure of the Z domain of staphylococcal protein A. J Mol Biol, 1997. 272(4): p. 573-90. [CrossRef]
- Gagnon, P., Technology trends in antibody purification. J Chromatogr A, 2012. 1221: p. 57-70. [CrossRef]
- Hale, G., et al., Repeated cleaning of protein A affinity column with sodium hydroxide. J Immunol Methods, 1994. 171(1): p. 15-21. [CrossRef]
- Shukla, A.A. and P. Hinckley, Host cell protein clearance during protein A chromatography: development of an improved column wash step. Biotechnol Prog, 2008. 24(5): p. 1115-21. [CrossRef]
- Pabst, T.M., J. Thai, and A.K. Hunter, Evaluation of recent Protein A stationary phase innovations for capture of biotherapeutics. J Chromatogr A, 2018. 1554: p. 45-60. [CrossRef]
- Liu, Z., S.S. Mostafa, and A.A. Shukla, A comparison of protein A chromatographic stationary phases: performance characteristics for monoclonal antibody purification. Biotechnol Appl Biochem, 2015. 62(1): p. 37-47. [CrossRef]
- Hahn, R., R. Schlegel, and A. Jungbauer, Comparison of protein A affinity sorbents. J Chromatogr B Analyt Technol Biomed Life Sci, 2003. 790(1-2): p. 35-51.
- Pfaunmiller, E.L., et al., Affinity monolith chromatography: a review of principles and recent analytical applications. Anal Bioanal Chem, 2013. 405(7): p. 2133-45. [CrossRef]
- Boi, C., Membrane adsorbers as purification tools for monoclonal antibody purification. J Chromatogr B Analyt Technol Biomed Life Sci, 2007. 848(1): p. 19-27. [CrossRef]
- Farid, S.S., Process economics of industrial monoclonal antibody manufacture. J Chromatogr B Analyt Technol Biomed Life Sci, 2007. 848(1): p. 8-18. [CrossRef]
- Love, J.C., K.R. Love, and P.W. Barone, Enabling global access to high-quality biopharmaceuticals. Current Opinion in Chemical Engineering, 2013. 2(4): p. 383-390. [CrossRef]
- Withanage, T.J., et al., The [(bathophenanthroline)(3):Fe(2+)] complex as an aromatic non-polymeric medium for purification of human lactoferrin. J Chromatogr A, 2024. 1732: p. 465218. [CrossRef]
- Trudel, J. and A. Asselin, Protein purification for microsequencing by sequential native and denaturing polyacrylamide gel electrophoresis: application to one chitinase. Anal Biochem, 1994. 221(1): p. 214-6. [CrossRef]
- Smith, G.L., et al., Complexation of ferrous ions by ferrozine, 2,2'-bipyridine and 1,10-phenanthroline: Implication for the quantification of iron in biological systems. J Inorg Biochem, 2021. 220: p. 111460. [CrossRef]
- Ellman, G.L., et al., A new and rapid colorimetric determination of acetylcholinesterase activity. Biochem Pharmacol, 1961. 7: p. 88-95. [CrossRef]
- O'Laughlin, J.W., Separation of cationic metal chelates of 1,10-phenanthroline by liquid chromatography. Analytical Chemistry, 1982. 54(2): p. 178-181. [CrossRef]
- Ng, N.S., et al., The antimicrobial efficacy and DNA binding activity of the copper(II) complexes of 3,4,7,8-tetramethyl-1,10-phenanthroline, 4,7-diphenyl-1,10-phenanthroline and 1,2-diaminocyclohexane. J Inorg Biochem, 2016. 162: p. 62-72.
- Hellawell, J.M., Biological indicators of freshwater pollution and environmental management. 2012: Springer Science & Business Media. [CrossRef]
- Dhandapani, G., et al., Nonionic detergent micelle aggregates: An economical alternative to protein A chromatography. N Biotechnol, 2021. 61: p. 90-98. [CrossRef]
- Lavery, P.E. and S.C. Kowalczykowski, Enhancement of recA protein-promoted DNA strand exchange activity by volume-occupying agents. J Biol Chem, 1992. 267(13): p. 9307-14. [CrossRef]
- Wang, X., et al., Polyethylene Glycol Crowder’s Effect on Enzyme Aggregation, Thermal Stability, and Residual Catalytic Activity. Langmuir, 2021. 37(28): p. 8474-8485.
- Jiang, M. and Z. Guo, Effects of Macromolecular Crowding on the Intrinsic Catalytic Efficiency and Structure of Enterobactin-Specific Isochorismate Synthase. Journal of the American Chemical Society, 2007. 129(4): p. 730-731. [CrossRef]
- Aoki, K., et al., A quantitative model of ERK MAP kinase phosphorylation in crowded media. Sci Rep, 2013. 3: p. 1541. [CrossRef]
- Khodabandehloo, A. and D.D.Y. Chen, Particle Sizing Methods for The Detection of Protein Aggregates in Biopharmaceuticals. Bioanalysis, 2017. 9(3): p. 313-326. [CrossRef]
- Nobbmann, U., et al., Dynamic light scattering as a relative tool for assessing the molecular integrity and stability of monoclonal antibodies. Biotechnol Genet Eng Rev, 2007. 24: p. 117-28. [CrossRef]
- Conner, C.G., et al., An accelerated antibody aggregation test based on time sequenced dynamic light scattering. Colloids and Surfaces A: Physicochemical and Engineering Aspects, 2022. 653: p. 129833.
- Paul, A.J., K. Schwab, and F. Hesse, Direct analysis of mAb aggregates in mammalian cell culture supernatant. BMC Biotechnol, 2014. 14: p. 99. [CrossRef]
- Eyer, P., et al., Molar absorption coefficients for the reduced Ellman reagent: reassessment. Analytical Biochemistry, 2003. 312(2): p. 224-227. [CrossRef]
- Smith, R.M. and A.E. Martell, Critical stability constants: volume 2: amines. 1975: Springer.
- Greenfield, N.J., Using circular dichroism spectra to estimate protein secondary structure. Nat Protoc, 2006. 1(6): p. 2876-90. [CrossRef]
- Tetin, S.Y., F.G. Prendergast, and S.Y. Venyaminov, Accuracy of protein secondary structure determination from circular dichroism spectra based on immunoglobulin examples. Analytical Biochemistry, 2003. 321(2): p. 183-187. [CrossRef]
- Sussman, J.L., et al., Atomic structure of acetylcholinesterase from Torpedo californica: a prototypic acetylcholine-binding protein. Science, 1991. 253(5022): p. 872-9.
- Ellman, G.L., Tissue sulfhydryl groups. Archives of Biochemistry and Biophysics, 1959. 82(1): p. 70-77.
Figure 1.
Ellman's activity assay [67] as applied to the Fc-AChE target sample.
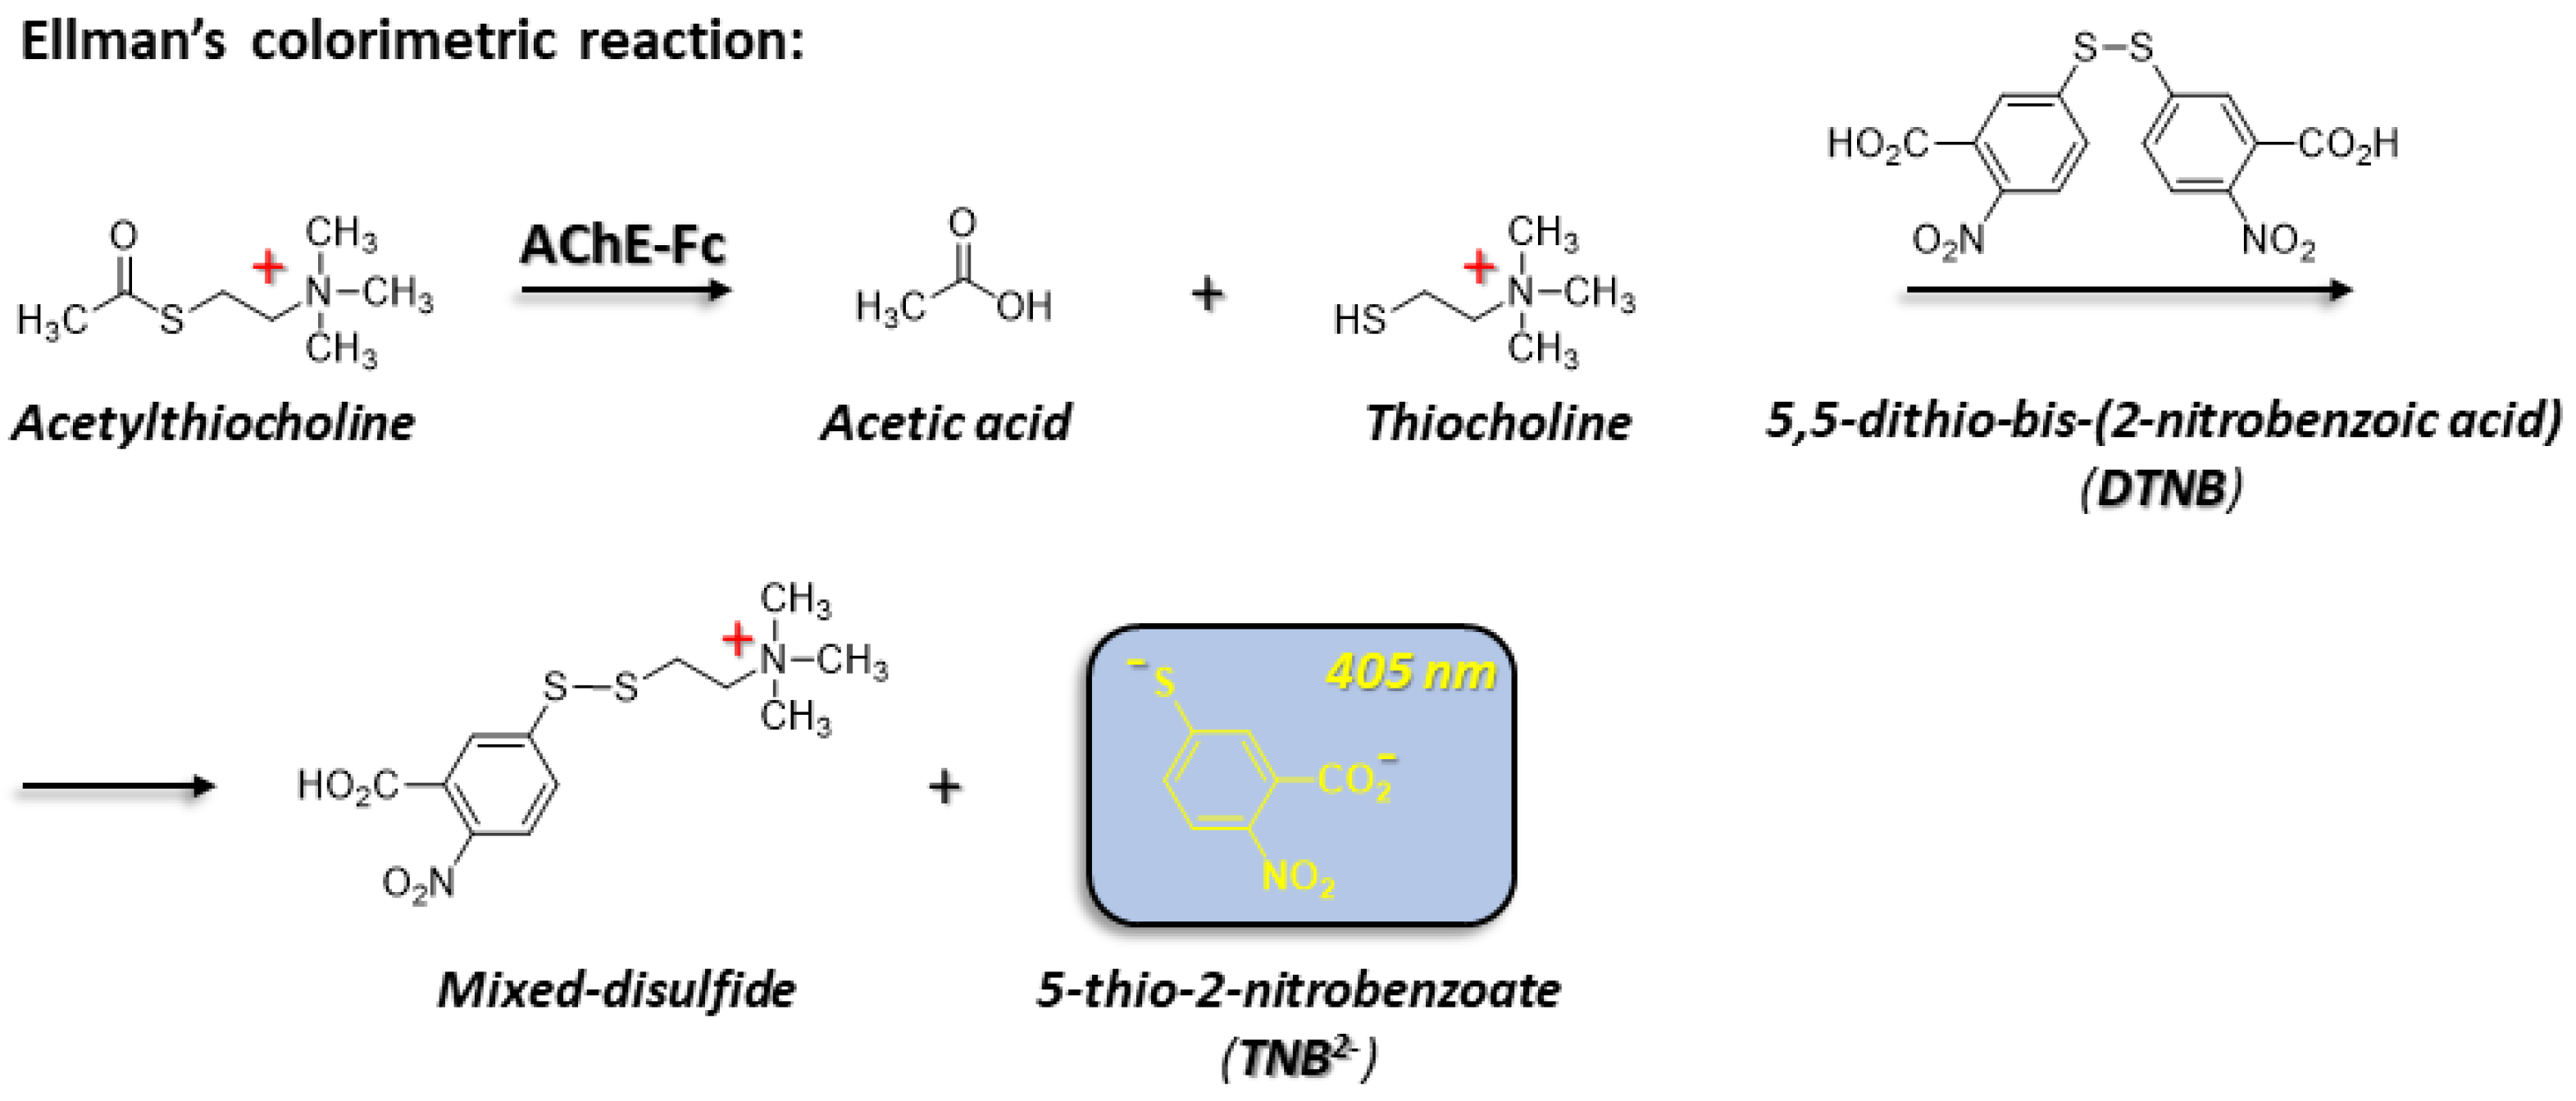
Figure 2.
Illustration of a three-step purification protocol for AChE-Fc using [(batho):cation] complexes and 15% w/v PEG-6000. The aromatic, chelator complexes are rapidly precipitated by 0.5M NaCl and then washed with 20 mM NaCl. In scanning electron microscope (SEM) imaging, the sedimented complexes appear as porous, irregular meshes. The overexpressed AChE-Fc fusion-protein is captured at pH 7 by the washed pellet and 15%w/v PEG-6000 (Step 1). Weakly bound proteins are removed with 20 mM NaCl (Step 2) and the fusion-protein is extracted after 30 minutes incubation at 10°C in the presence of 100 mM Na citrate (pH 7) and 250 mM NaCl (Step 3).
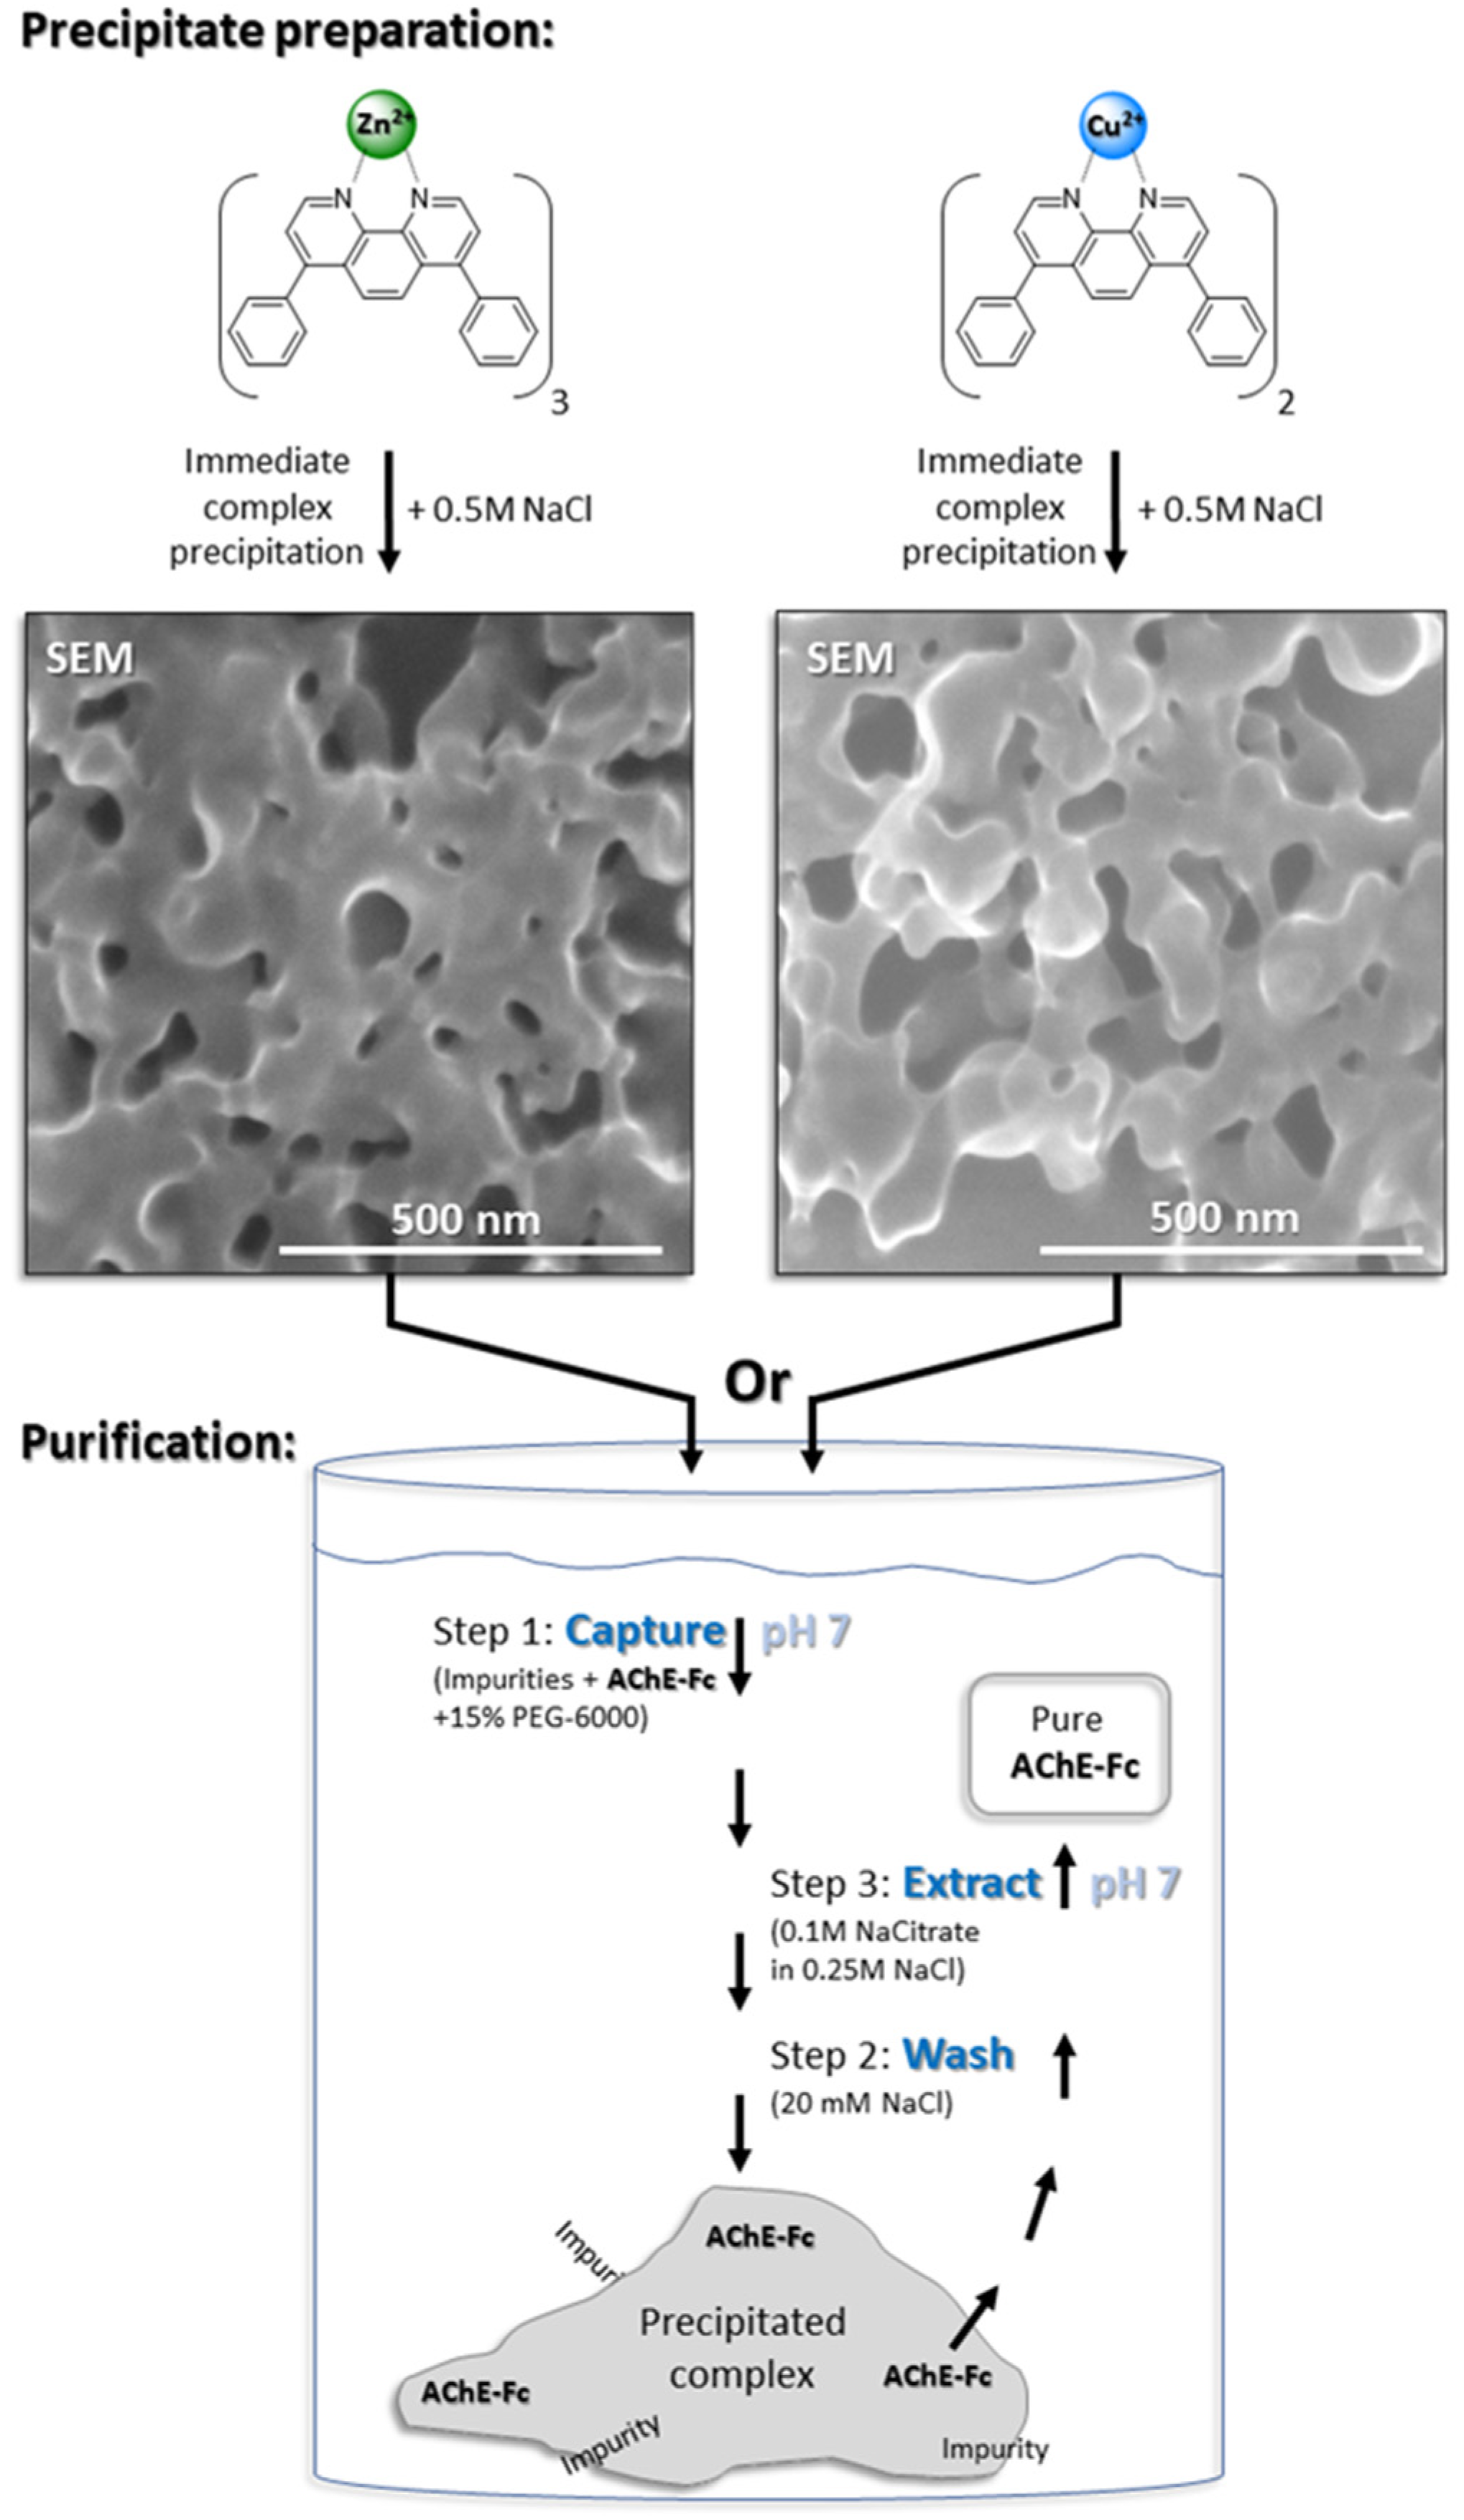
Figure 3.
SDS-PAGE gels (with -mercaptoethanol) of AChE-Fc homodimers with aromatic [(batho)3:Zn2+] or [(batho)2:Cu2+] complexes and 15% w/v PEG-6000. A. Lane 1: Molecular weight markers; lane 2: total amount of recombinant human AChE-Fc plus impurities, prepared according to ref [5], and added to each purification trial; lanes 3-6: recovered AChE-Fc: the capture and washing steps (as described in the Methods section), followed by extraction at 10°C for 30 minutes in the presence of 100 mM Na citrate (pH 7) and 250 mM NaCl. B. As in A, but with Cu2+ ions. Gels are Coomassie stained.
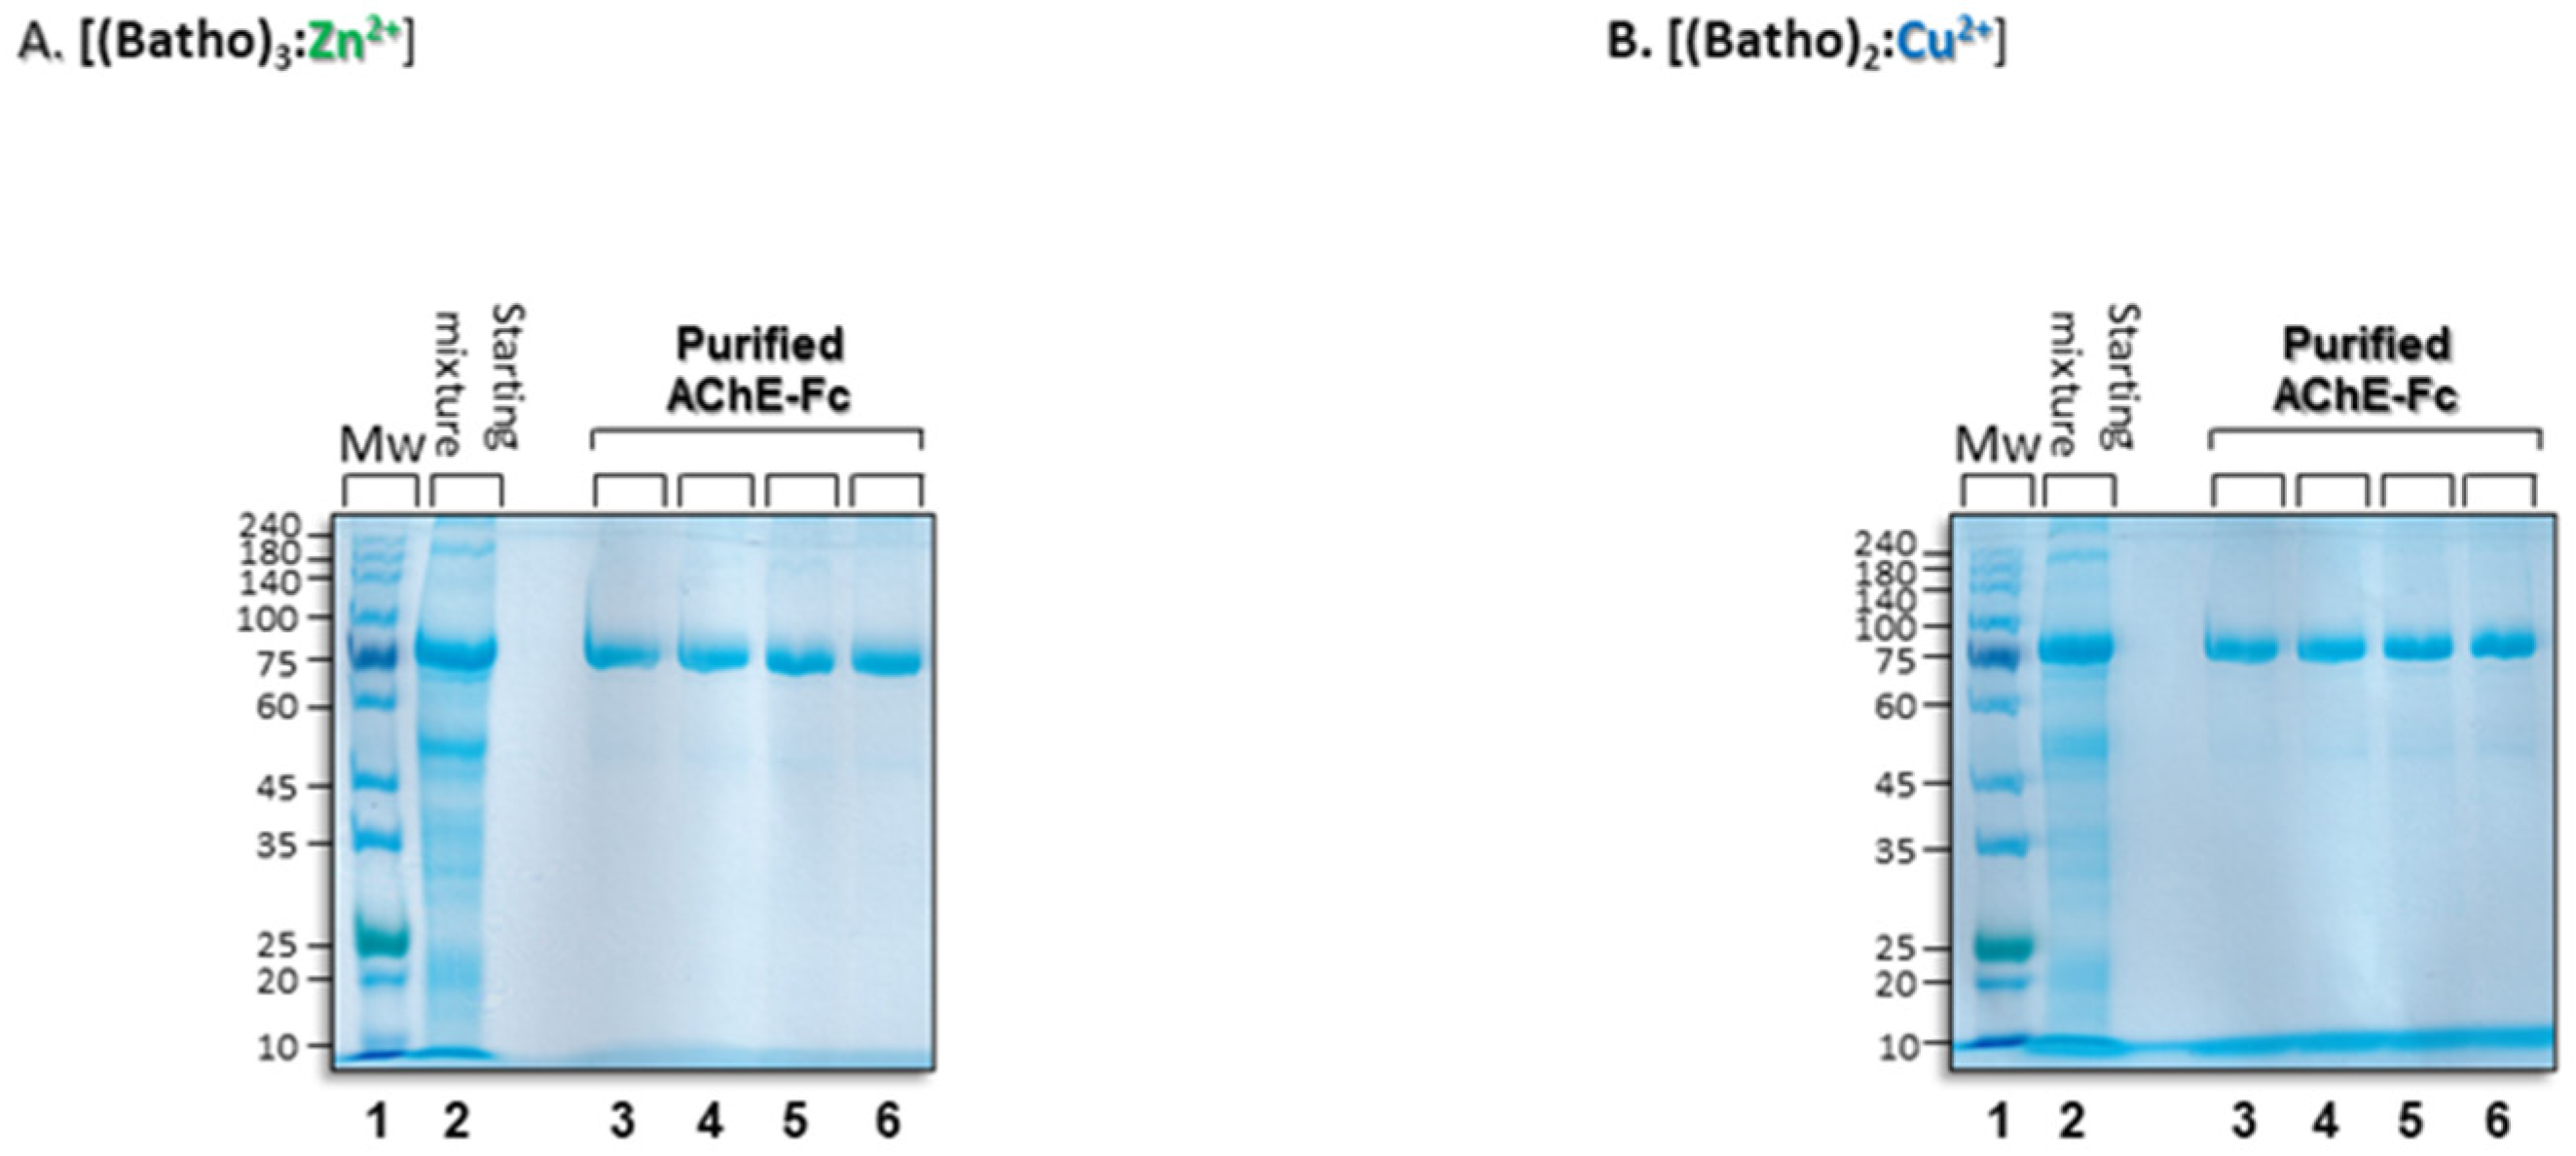
Figure 4.
Dynamic light scattering (DLS). A. Particle size distribution of human AChE-Fc purified with aggregates composed of either [(batho)3:Zn2+] or [(batho)2:Cu2+] complexes (as described in the Methods section) or with Protein A chromatography [C]. In all cases, purified human AChE-Fc was diluted with PBS to 0.1 mg/mL and analyzed at 25°C. B. Native PAGE gel electrophoresis. Lane 1: Molecular weight markers; lane 2: AChE-Fc (5 µgr) purified by Protein A chromatography; Lanes 3-4: AChE-Fc (5 µgr) purified by [(batho)3:Zn2+] or [(batho)2:Cu2+] complexes, respectively, as described in the Experimental section. Gels are Coomassie stained.
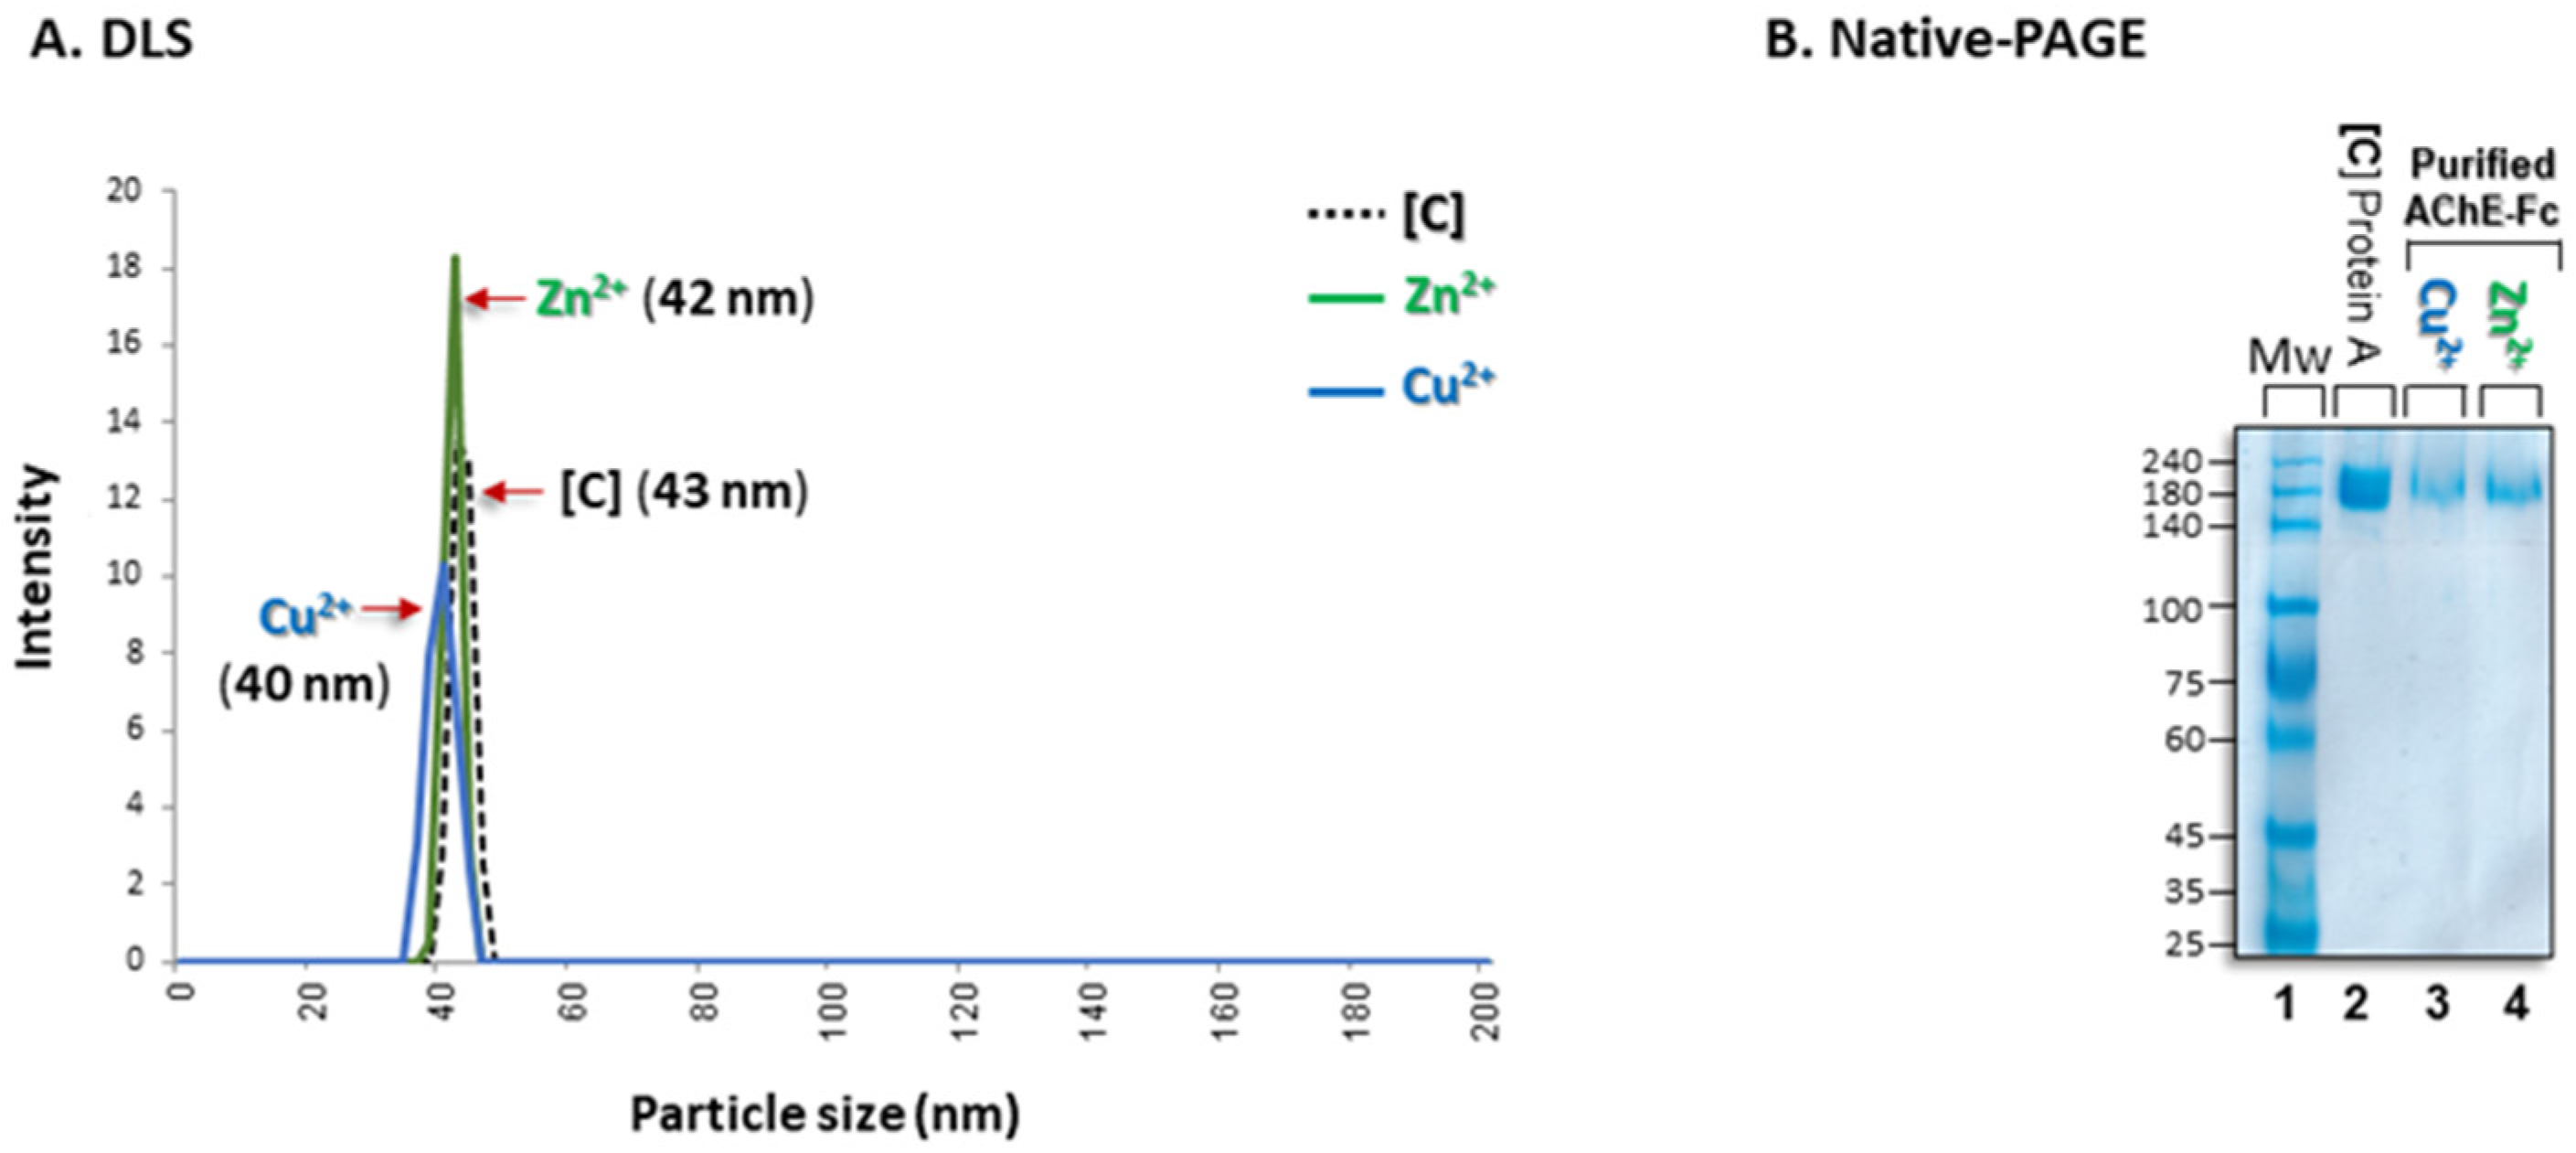
Figure 5.
Figure 5: A. Acetylcholinesterase activity measured by Ellman's activity assay (see Figure 1) obtained with AChE-Fc purified via Protein A chromatography [C] (black line and symbol), [(batho)3:Zn2+] (green line and symbol) or [(batho)2:Cu2+] (blue line and symbol). Points are average ± STD. B. Circular dichroism (CD) analysis. Far UV CD spectra of AChE-Fc purified by Protein A chromatography [C] (black dotted line) is compared to AChE-Fc isolated with either the [(batho)3:Zn2+] complex (green line) or [(batho)2:Cu2+] complex (blue line). All protein samples were diluted with PBS to 0.02 mg/mL.
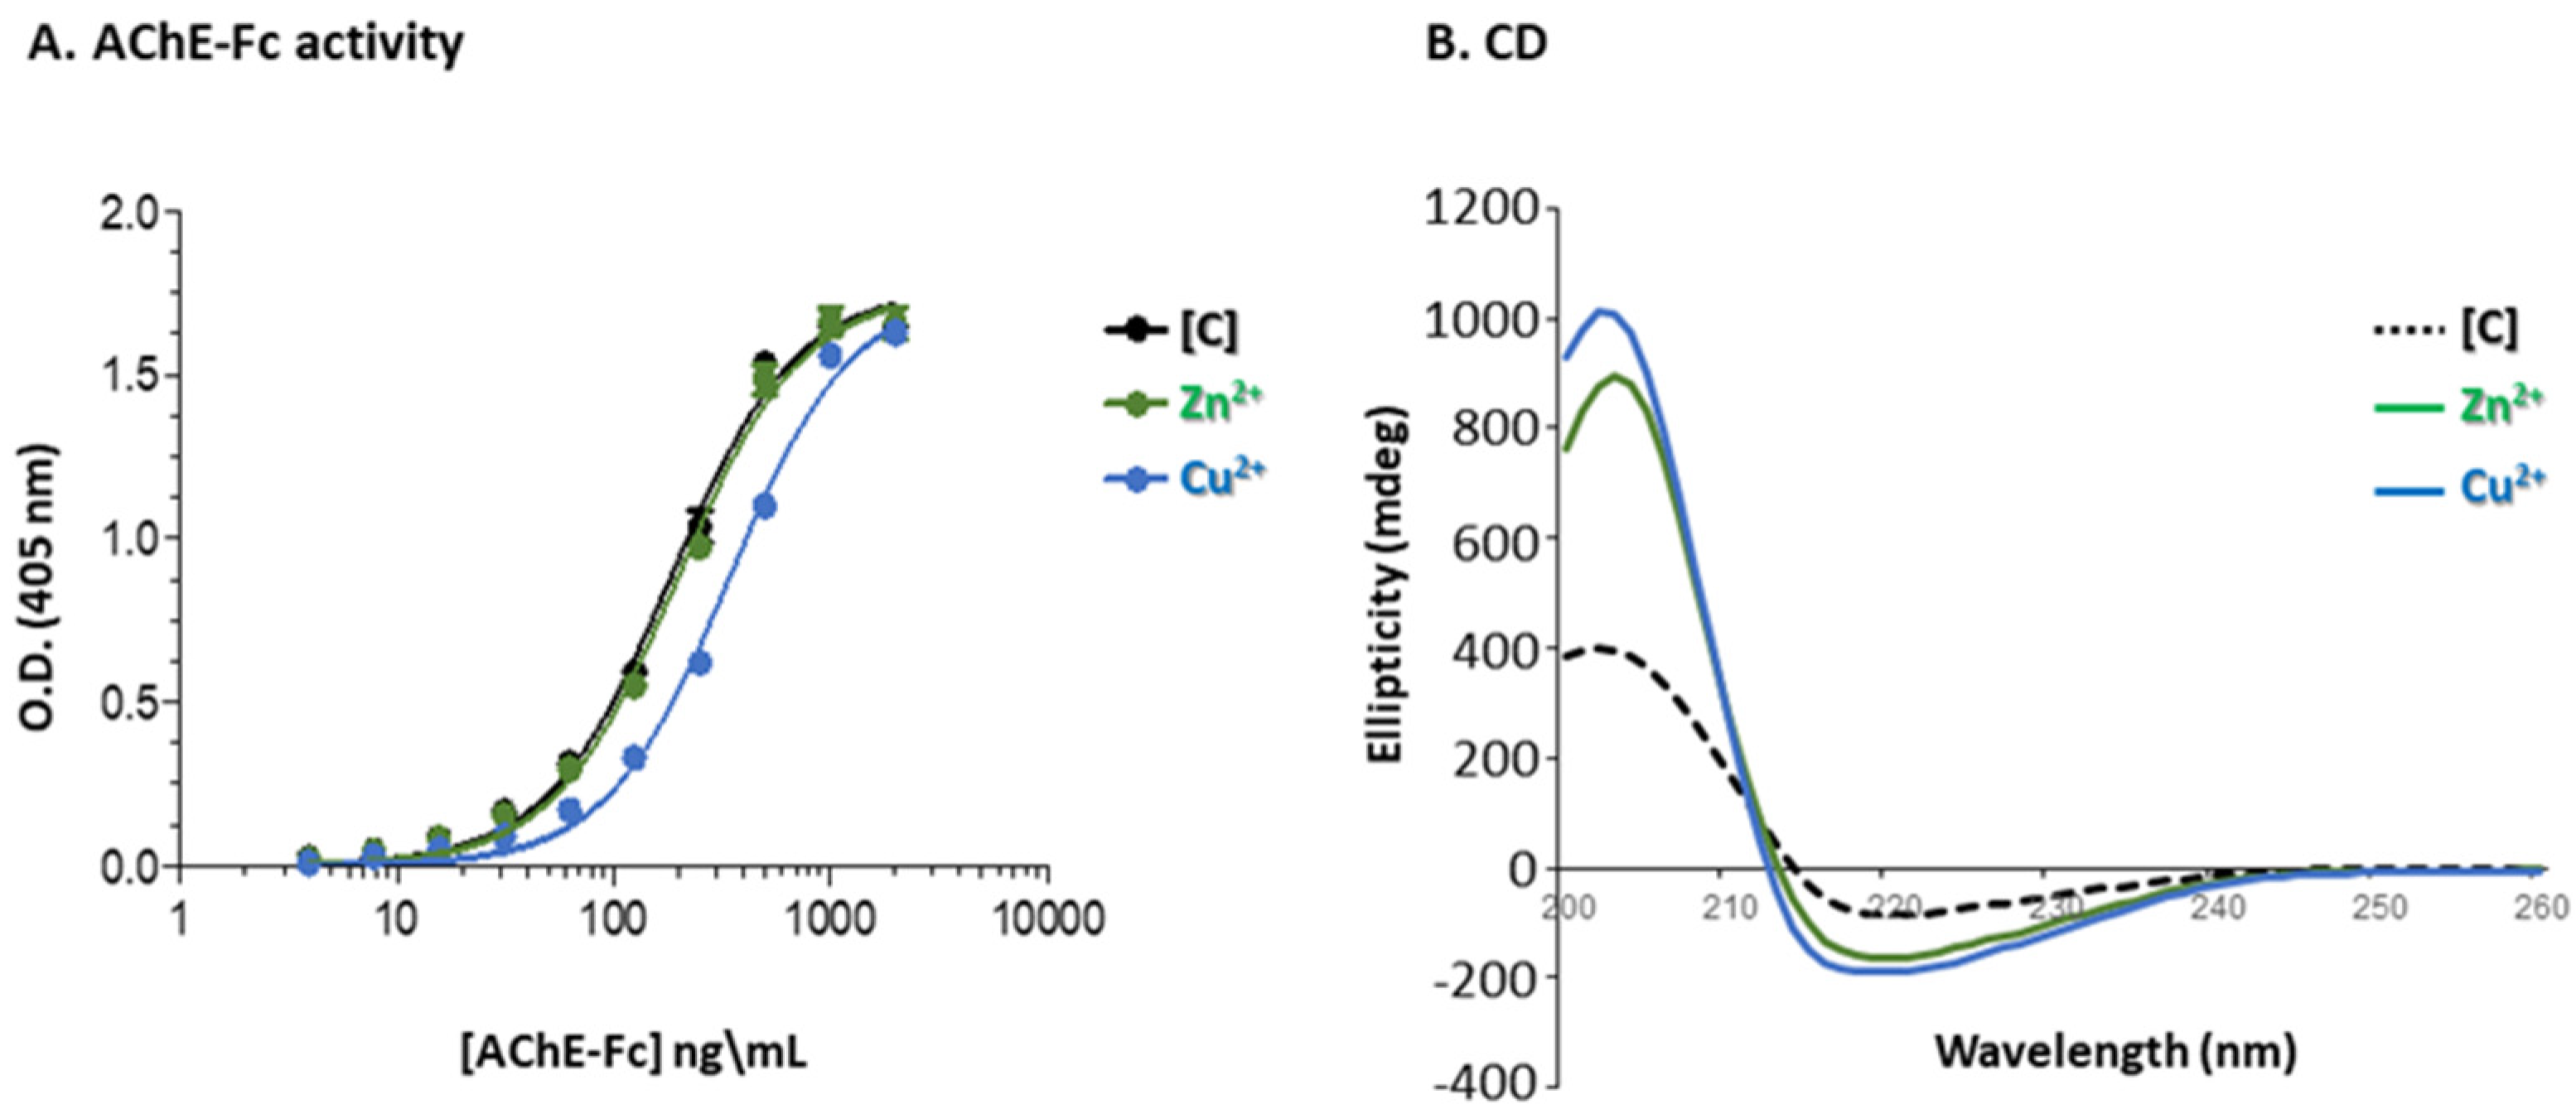
Figure 6.
Process efficiency as a function of purification volume using the [(batho)3:Zn2+] complex. Process yields were determined by densitometry using ImageJ (NIH) and are based on at least three independent experiments (STD = ± 2-4.3%) conducted on different days.
Figure 6.
Process efficiency as a function of purification volume using the [(batho)3:Zn2+] complex. Process yields were determined by densitometry using ImageJ (NIH) and are based on at least three independent experiments (STD = ± 2-4.3%) conducted on different days.
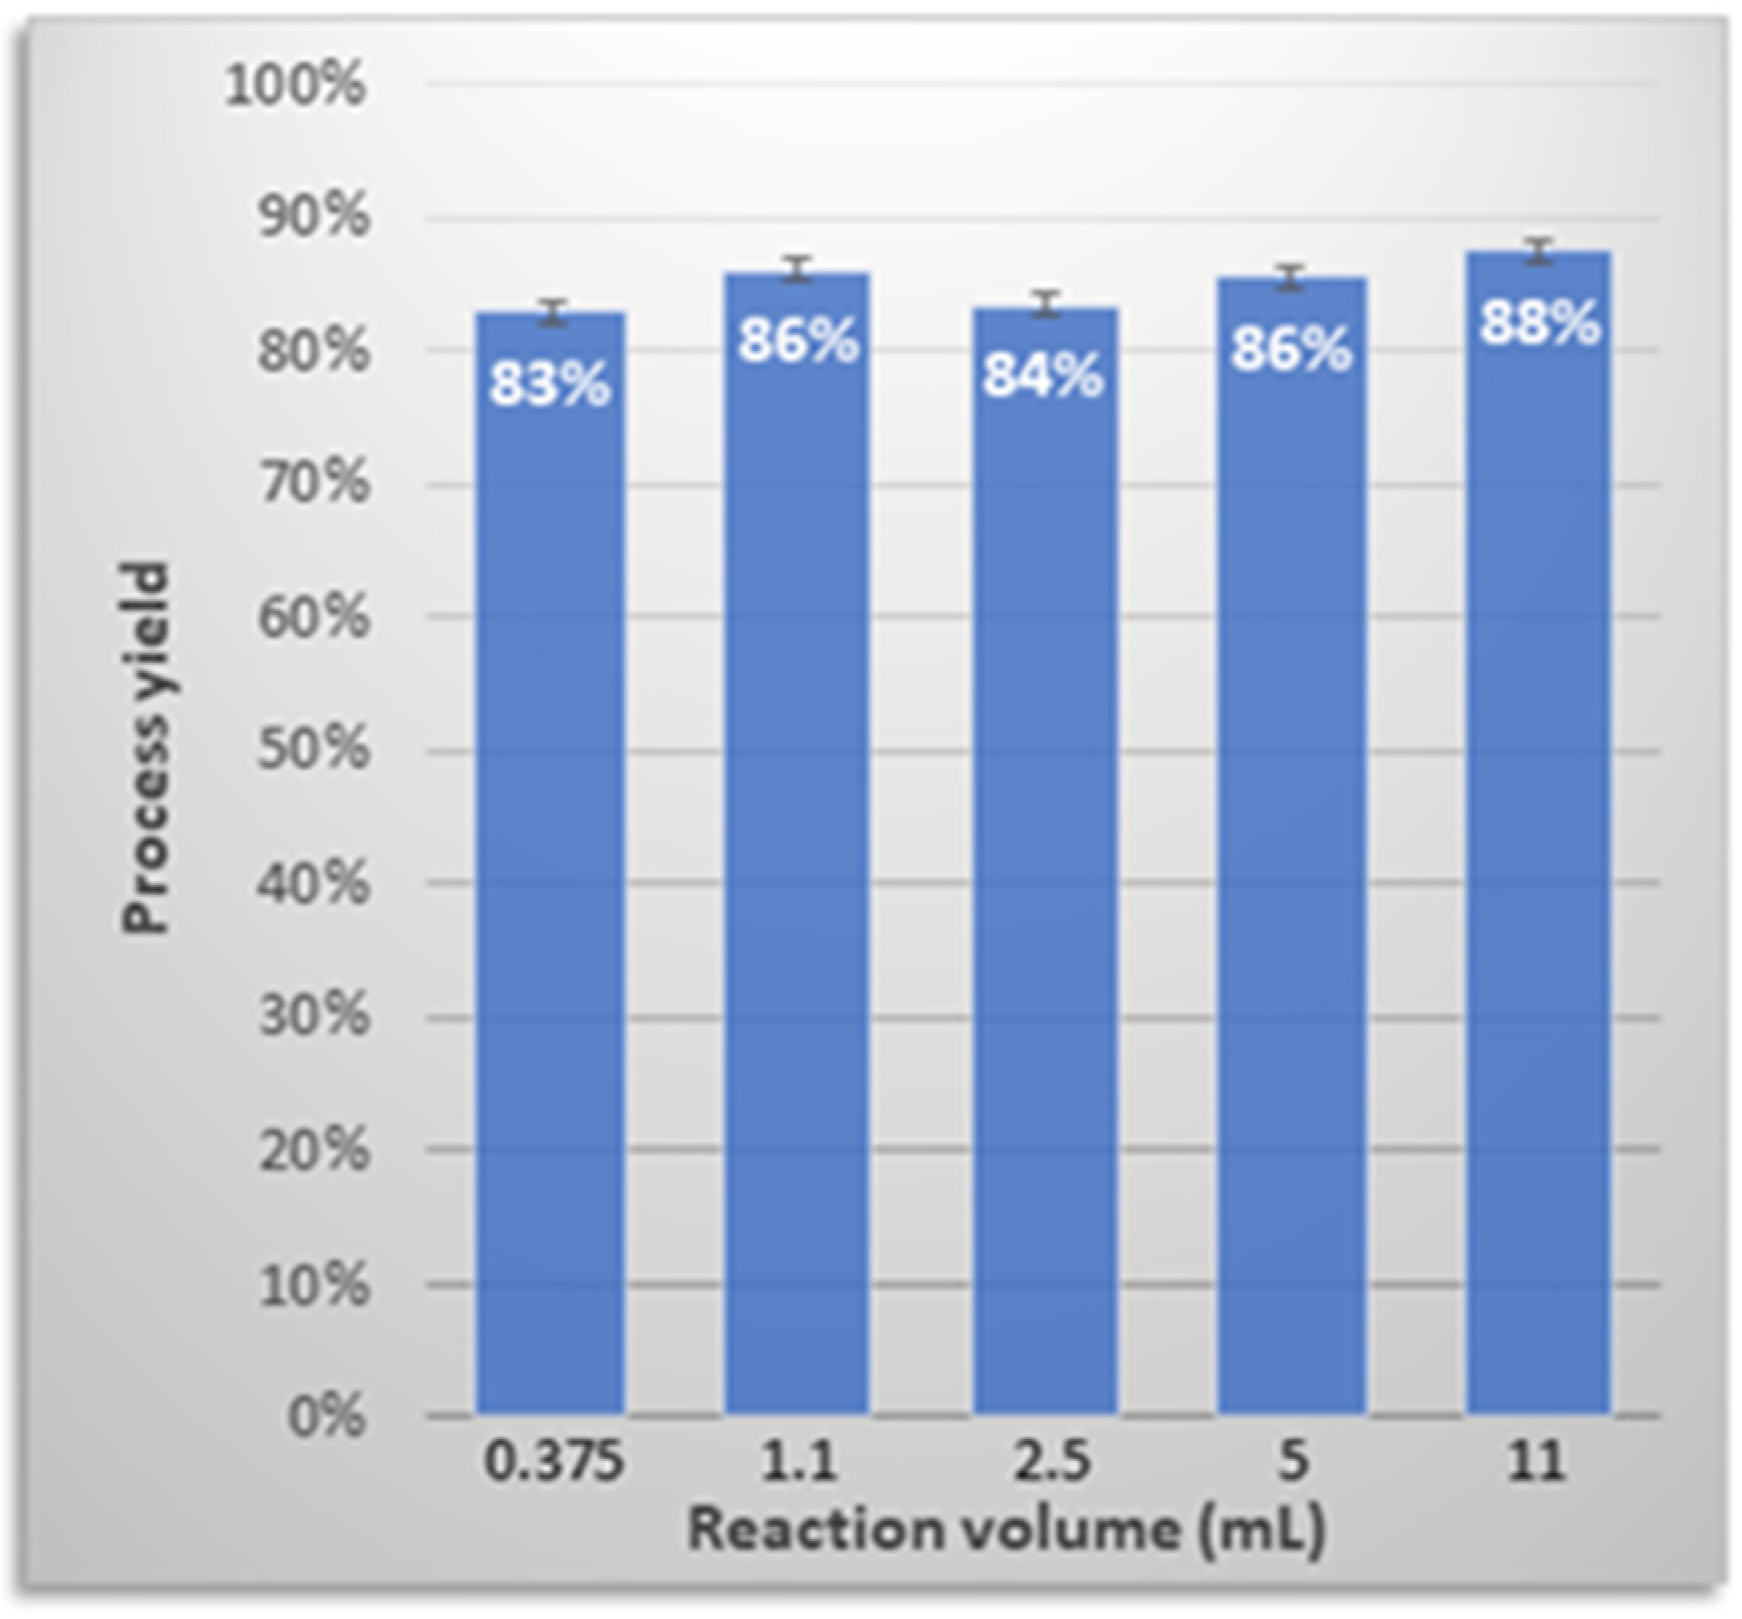
Figure 7.
Batho recycling via recrystallization. A. Illustration of the process leading to microcrystals of the recycled chelator from its complex with zinc ions (i.e., [(batho)3:Zn2+] at the end of the purification protocol. Pellets containing the [(batho)3:Zn2+] complex, were dissolved in DDW/methanol (4:1 v/v) containing 250 mM EDTA (pH 8), 25oC and incubated for 1 hour in an open Eppendorf tube to allow slow evaporation of methanol. Further incubation at temperatures indicated was followed by centrifugation for 5 min at 4oC, relative centrifugal force (RCF) = 21,000. The supernatant was then discarded. The resulting pellet was washed twice with DDW; centrifugation for 5min at 4°C was then applied, (RCF = 21,000). Light microscopy images of the recycled microcrystals are shown. B. HPLC analysis. C. Process yield calculated by specific absorption of the recycled chelator with Fe2+ at 533 nm (as described in the Methods section), of 3-4 replicates (STD = ± 0.3%). D. Mass spectrometry of the pure, commercial chelator [C] and the recycled chelator.
Disclaimer/Publisher’s Note: The statements, opinions and data contained in all publications are solely those of the individual author(s) and contributor(s) and not of MDPI and/or the editor(s). MDPI and/or the editor(s) disclaim responsibility for any injury to people or property resulting from any ideas, methods, instructions or products referred to in the content. |
© 2024 by the authors. Licensee MDPI, Basel, Switzerland. This article is an open access article distributed under the terms and conditions of the Creative Commons Attribution (CC BY) license (http://creativecommons.org/licenses/by/4.0/).
Copyright: This open access article is published under a Creative Commons CC BY 4.0 license, which permit the free download, distribution, and reuse, provided that the author and preprint are cited in any reuse.


