
Submitted:
18 March 2025
Posted:
18 March 2025
You are already at the latest version
Abstract
Pharmaceutical companies are aware of the ongoing effort to satisfy the increasing global demand for therapeutic grade monoclonal antibodies (mAbs), an especially difficult challenge for poor and developing countries. We present a simple, economical, single-step purification approach at neutral pH for polyclonal human IgG (hIgG) that does not require expensive ligands, chromatography columns, polymers, nor membranes. Instead, porous precipitates of commercial, recyclable aromatic [bathophenanthroline:cation] complexes were found to efficiently capture impurity proteins from CHO cells or E. coli lysate while maintaining the majority of the highly concentrated hIgG (5-15 mg/mL) in the supernatant. [(batho)3:Zn2+] complexes were the most promising, resulting in hIgG with purity ≈95%, by SDS-PAGE. This purified hIgG is monomeric (by dynamic light scattering, DLS) and preserves native secondary structure (by far UV circular dichroism spectroscopy, CD). Process yield is >90% (by densitometry) and is maintained after a 100-fold increase in the reaction volume that required only proportional increase in reagents. While Protein A chromatographic columns, the industry gold standard, have limited binding capacity, are costly and require familiarity with column maintenance, we are attempting, by our efforts, to help produce a more efficient, simple and economical purification platform.
Keywords:
Antibody purification
; non chromatographic
; ligand free
; alternative to Protein A
1. Introduction
Antibodies are increasingly being exploited as biological pharmaceuticals, as well as diagnostic tools [1,2,3]. The majority of antibodies currently in clinical use belong to the immunoglobulin G isotype (IgG) and their contribution to global health is best reflected in the increasing number of new therapies that are antibody-based [4,5]. The world-wide consumption of hundreds of kilograms of specific monoclonal antibodies per year explains the growing need for improving the efficiency at which antibodies are manufactured on an industrial scale [6]. Accordingly, intense effort has been directed during the past few decades towards increasing the expression level of IgG antibodies (i.e., upstream processing). This objective has required optimization of cell lines, media and bioreactor conditions and has been translated into high cell culture IgG titers that may reach 5-13 g/L [7,8,9,10] and even 25 g/L [11,12].
However, the high antibody concentration in cell culture broths poses a major challenge for antibody purification. This challenge derives from the need to capture the majority of the IgG population within a single chromatographic step, while the antibody concentration may in fact exceed the binding capacity of the particular chromatographic column in use. Moreover, at high IgG titer, clarification techniques responsible for preventing large particles, cell debris and whole cell impurities from entering the column become more difficult and , accordingly, the cost of antibody production is increased [13]. These challenges and the unavoidable requirement for one or two additional polishing-steps needed to exclude residual amounts of impurities (e.g., host cell proteins, DNA and viruses [14]), is estimated to represent ~ 50% of the overall production costs [15] and to make IgG downstream processing the bottleneck for industrial-scale production [10,16].
IgG's are generally purified via column chromatography and a ligand called Protein A. Protein A is a 42 KDa staphylococcus aureus bacterial protein [17] that binds to the crystallizable (Fc) domain of diverse IgG's with high affinity (Kd ~2 x 10⁻⁹ M) [18] and specificity [19], thereby excluding viruses, host cell proteins (HCP) and DNA [20,21,22]. The removal of these impurities is efficient, as the generally observed levels of HCPs are < 100 ppm and that of host cell DNA is < 10 pico/gr/dose [23]. These unique properties of Protein A translate into high process yields (≥95%) and purity levels (>98%) within a single chromatographic step [24,25] and explains why Protein A chromatography has become the gold-standard technology in antibody purification. However, being a chromatographic technique, it relies on immobilizing the ligand on polymeric resins, which in turn introduces several technical challenges (e.g., ligand-leaching [14,24]; ligand-deamidation [26]; acidic pH-induced antibody aggregation [27,28,29] . Perhaps the current major challenge for biotechnology is to find a practical avenue in which industrial-scale Protein A columns will capture the majority of antibodies present in highly concentrated bioreactors [7,8,9,10]. Such an objective requires the development of Protein A resins with (a) high binding capacity; (b) high-flow rates; as well as (c) stability after multiple reuse cycles (100-200) that would not be affected significantly during column cleaning and sanitation (conducted at high pH i.e., 0.1-0.5 M NaOH) at the end of each purification cycle and still reach process cost-effectiveness [30]. In this regard, we note that several non-chromatographic strategies for antibody purification have been studied with the intention of replacing Protein A columns but, to the best of our knowledge, none of these technologies is considered to be a practical alternative to Protein A chromatography [31,32,33,34,35].
To address the above challenge, we recently described a non-chromatographic, ligand-free antibody purification approach exploiting non-ionic surfactant micelles specifically conjugated to each other by [metal:chelator] amphiphilic complexes [36,37,38,39]. These conjugated micellar-aggregates efficiently purified polyclonal human IgG (hIgG), concentration 15-25 mg/mL [36], in two sequential steps: hIgG was first captured by the conjugated micelles in the presence of osmotically active PEG6000 (while more hydrophilic impurities were rejected) and were then extracted from the micelles without parallel coextraction of impurities [36]. Thus, purification required the initial binding of hIgG to the micellar aggregate. In the current study, we have sought to simplify the general protocol and have therefore removed the surfactant and polyethylene glycol (PEG) components. Hence, purification cannot rely on antibody binding to conjugated-micelles in the presence of an osmotically active polymer (i.e., PEG). Consequently, in this report we assess the possibility of separation of impurities from highly concentrated hIgG samples (15 mg/mL) with the use of precipitated [metal:chelator] complexes that serve as the "purification-tool". This purification tool is composed of the aromatic chelator - bathophenanthroline (batho) - bound to either Zn2+, Fe2+ or Cu2+ (Figure 1A). An illustration of the proposed strategy is shown in Figure 1B.
2. Experimental
2.1. Materials
Sodium chloride (Sigma, S7653), bathophenanthroline (GFS chemicals, C038446), zinc chloride (Sigma, 208086), copper (II) sulfate pentahydrate (Sigma, 209198), FeCl2 (Sigma,450936), Protein A HP Spin-TrapTM (GE, 2809031-32). E. coli lysate was provided by the Israel Structural Proteomics Center (Weizmann Institute of science); impurity proteins from Chinese hamster ovary (CHO) cells were provided by the Institute of Biological Research (IIBR); human polyclonal IgG (Lee Biosciences, 340-21, 95% pure). PEG 6000 (Sigma Aldrich, average MW 6000, cat # 8.07491). All reagents were analytical grade.
2.2. Methods
2.2.1. Preparation of 200 mM Bathophenanthroline:DMSO:HCl Solution
Into 90 μL of dimethyl sulfoxide (DMSO) and 10 μL of 25% HCl, 6.64 mg of bathophenanthroline were added and vortexed for 5 minutes at 25 oC until total dissolution was observed.
2.2.2. Polyclonal IgG Purification. Step I: Preparation of [(batho)x:cationy] Complexes
Each of the three complexes was generated by mixing equal volumes of medium A and B as follows. Medium A was prepared by the addition of 1 μL of the amphiphilic chelator bathophenanthroline to 25 μL of medium B comprising 4 mM ZnCl2, 4 mM CuSO4 · 5H2O or 4 mM FeCl2 in 20 mM NaCl. The mixture was vigorously vortexed, incubated for 5 minutes at 25°C, followed by the addition of 3.5 μL 5 M NaCl. After an additional 5 minutes incubation at 25°C, centrifugation was applied (21,000xg, 5 minutes at 19°C) and the supernatant was removed. The resulting pellet was washed with 50 μL of cold 20 mM NaCl. Centrifugation followed (21,000xg, 5 minutes at 10°C). Step II: Impurity capture: Each of the freshly prepared [bathophenanthroline:cation] complex precipitates was resuspended in 100 μL of a mixture of 15 mg/ml polyclonal human IgG, 50 mM sodium phosphate (pH 7.0) and either 0.6 mg/mL of E. coli cell lysate or 0.16 mg/mL of CHO cell-excreted proteins. The suspension was vigorously vortexed for 2 minutes and incubated at 10°C for 30 minutes. A short spin was applied (21,000xg, 5 minutes at 10 °C) and the supernatant composition was analyzed by SDS-PAGE. PEG 6000 was not present.
2.2.3. SDS-PAGE Electrophoresis
SDS-PAGE was run on a 10% polyacrylamide gel in the presence of a reducing agent (b-mercapto-ethanol.)
2.2.4. Binding Capacity of the [(batho)3: Zn2+] Complex for Impurity Proteins
Freshly prepared [(batho)3:Zn2+] complex precipitates were resuspended in 100 μL containing either 0.25, 0.5, 0.75 or 1 mg/mL E. coli cell lysate or 1 mg/mL CHO cell-excreted proteins. Following vigorous vortexing for 2 minutes, the suspension was incubated at 10°C for 30 minutes. A brief spin followed (21,000xg, 5 minutes, 10°C) and the supernatant was analyzed by SDS-PAGE.
2.2.5. Bradford Assay of Impurity Proteins
A Bradford assay was used to prepare a calibration curve for protein concentration based on bovine serum albumin (BSA). The assay is run via serial dilutions of BSA in DDW (i.e., 0.1, 0.2, 0.4, 0.6, 0.8 and 1.0 mg/mL). Samples (50 µL) of either E. coli lysate or CHO-cell excreted proteins were mixed with 1 mL of the: "Bradford reagent" containing 10 mg Coomassie Brilliant Blue G-250; 5 mL ethanol; 1 mL 32% hydrochloric acid and 94 mL deionized water and incubated for 5 minutes. Optical density (OD) was measured at 595 nm on a Jasco V-750 spectrophotometer and compared to the BSA calibration curve.
2.2.6. Scanning Electron Microscope Imaging
Freshly prepared [(batho)3: Zn2+], [(batho)3:Fe2+] and [(batho)2:Cu2+] complexes were precipitated as described above. The resulting pellets were resuspended in 50 µL of DDW and samples for SEM were prepared by dipping a grid into the suspension and drying overnight at 25°C in a vacuum desiccator. Images of the zinc and copper complexes were obtained using the UHR-MAIA3 TESCAN scanning electron microscope) with an In-Beam SE and STEM Bright detectors at HV 25 kV and magnification X 400K. For the iron complex, the lower resolution Analyze mode at HV 5kV and magnification X 40K was used. This change was necessitated due to the strongly ferromagnetic properties of Fe2+ which could damage or contaminate the electromagnetic coil element of the microscope and/or the detector.
2.2.7. Dynamic Light Scattering (DLS)
Polyclonal hIgG, purified via each of the three [metal:chelator] complexes studied, was compared to hIgG purified on a Protein A chromatographic column (see section 2.2.9), and to untreated commercial (purity ≥ 95%) hIgG. Samples were diluted with phosphate buffered saline (PBS) to 0.5 mg/mL (pH 7.4) and centrifuged at 21,000 x g for 10 minutes at 10°C prior to analysis. The intensity-weighted particle size distribution of hIgG was determined using the auto correlation spectroscopy protocol of the Nanophox instrument (Sympatec GmbH, Clausthal-Zellerfeld, Germany).
2.2.8. Circular Dichroism (CD) Spectrocopy
Polyclonal hIgG, purified via each of the three [metal:chelator] complexes studied, was compared to hIgG, purified via a Protein A chromatographic column, and to untreated commercial (purity ≥95%) hIgG. All samples were diluted with 50 mM sodium phosphate (pH 7) to 0.05 mg/mL and analyzed with a Chirascan CD spectrometer (Applied Photophysics). CD spectra report ellipticity (θ), proportional to the difference in absorbance of left and right circularly polarized light [θ = 3300° (AL−AR)] as a function of wavelength. A quartz cell of path length 0.1 cm was used for the measurements. The CD spectra were recorded with 1 nm bandwidth resolution in 1 nm steps at 20°C and corrected for baseline distortion by subtracting a reference spectrum of the corresponding buffer solution.
2.2.9. hIgG Purification on a Protein A HP Spin-TrapTM Column
Polyclonal hIgG in a background of CHO cell impurity proteins was purified on a HP Spin-TrapTM column. The mixture (400 µL) contained 64 µl CHO cell impurity proteins (0.5-1 mg/mL) and hIgG at a final concentration of 5-15 mg/mL in 20 mM sodium phosphate (pH 7.0). After 4 minutes of incubation at 25°C with gentle mixing, centrifugation (30 seconds at 100 x g) was applied. The Protein A column was then washed twice with 400 µl of the binding-buffer supplied by the column manufacturer. Following a further 4 minutes of incubation, hIgG was eluted in the presence of 100 mM gly (pH 2.7) at 25°C with gentle mixing. The elution step was repeated twice. The elution fractions were then combined and centrifuged for 30 seconds at 10 oC at 100xg prior to SDS-PAGE gel loading.
3. Results and Discussion
We have recently reported that human lactoferrin, which is highly positively charged, binds efficiently to precipitated [(batho)3:Fe2+] fully aromatic complexes and have suggested that binding occurs via [cation:π] interactions [40]. Similar efficient binding to the aromatic complex precipitate was observed for an Fc-fusion protein where the protein involved was acetylcholinesterase, and the origin of the Fc moiety was IgG1 [41]. However, acetylcholinesterase presents a strongly negative surface charge [42] which would not be conducive to interaction with the π cloud of the aromatic complex. Rather, the more likely active player in binding was thought to be the Fc component of the fusion protein. [43] We were therefore motivated to investigate whether the precipitated [(batho)3:Fe2+] aromatic complex might be used to efficiently separate intact polyclonal hIgG from mixtures with protein impurities. If so, such an optimized protocol could expedite and simplify antibody production in a cost-effective manner. Accordingly, three aromatic [(batho):cation] complexes were investigated, i.e., [(batho)3:Fe2+] [44], [(batho)3:Zn2+] [45] and [(batho)2:Cu2+] [46]).
3.1. Complex Precipitation: Morphology
Each of the three complexes was precipitated wtih high salt (0.5 M NaCl) prior to incubation with a mixture of polyclonal hIgG and cellular impurities. Scanning electron microscopy (SEM) imaging revealed that precipitated [(batho)3:Zn2+] , [(batho)3:Fe2+] and [(batho)2:Cu2+] complexes are highly porous, non-crystalline materials with a broad distribution of pore sizes, on the order of several hundred nanometers (Figure 1A).
3.2. Comparison of Process Yield for Different Divalent Cations
Although recombinant monoclonal antibodies (mAbs) for therapeutic use are commonly produced in Chinese hamster ovarian cells (CHO cells) [47,48], expression in E. coli is currently becoming a realistic alternative [49]. The efficiency of impurity removal from both of these cell-derived backgrounds was tested by performing "spike-experiments" in which a known amount of the target is mixed with contaminants; process yield and purity are then quantitated on SDS-PAGE gel electrophoresis (Figure 2A–F). The concentration of hIgG was maintained at 15 mg/mL, a higher antibody titer than commonly observed (<10 mg/mL) [50]. Under these working conditions we found that all three aromatic complexes, independent of the cation used, removed protein impurities excreted by CHO cells as well as those that derive from the lysate of E. coli cells. This led to an IgG purity level similar to that of the commercial control (~95% purity by HPLC) (Figure 2, lane 3 in A–F). However, process yield was clearly dependent on the cation used. The highest yield from both contamination backgrounds was observed with the [(batho)3:Zn2+] complex (avg. 88% and 94% in E. coli and CHO cells, respectively), and the lowest efficiency with the [(batho)2:Cu2+] complex (avg. 76% and 72% in E. coli and CHO cells, respectively) (Figure 2A,B,E,F). The [(batho)3:Fe2+] complex exhibited a different behavior. It was highly efficient in the presence of bacterial lysate proteins but performed poorly with excreted CHO cell proteins (avg. 96% and 61% in E. coli and CHO cells, respectively) (Figure 2C,D). The reason for this is still not clear. One possible, if partial, explanation is the absence of complex post-translational modifications, such as N-linked glycosylation in the CH2 domain of the Fc moiety, in E. coli. To produce complex biologics such as mAbs, mammalian cell lines became the hosts of choice despite obvious problems due to glycan heterogeneity, lengthy and costly production processes, and the need for viral clearance. Glycosylation was thought to be necessary for improved biophysical properties and serum stability of antibodies in addition to their Fc-mediated effector functions. However, comparison of glycosylated versus non-glycosylated antibodies, made either in mammalian cell lines or in E. coli, demonstrated nearly identical properties in vitro and in vivo, including serum half-life (t1/2), except for effector functions. [21,30,31] Done In the near future, non-glycosylated antibodies could become the default format of therapeutics where various effector functions are either unnecessary or detrimental. With all complexes, process reproduciblity was demonstrated by repeating the purification protocol at least 4 times on different days (Figure 2A–F, lanes 4-7).
3.3. Binding Capacity for Protein Impurities of [(batho)3:Zn2+] Aromatic complexes
The optimal amount of [(batho)3:Zn2+] aromatic complexes for binding protein impurities was found to be an important parameter that required strict adjustment to the hIgG concentration. Ideal working conditions would favor maximal impurity binding in parallel with minimal hIgG capture. hIgG would therefore remain in the supernatant. Focussing on the more consistantly efficient [(batho)3:Zn2+] complex (cf. section 3.2), protein impurities deriving from either CHO cells or E. coli are captured (Figure S1). We found that limiting hIgG concentration to 5-15 mg/ml along with impurity concentration 0.5-1 mg/mL gives an optimal molar ratio IgG:batho of 0.0033 mmole:0.0002 mmole to 0.01 mmole:0.0002 mmole.
3.4. Native, Non-Aggregated State of hIgG
The aggregational state of the hIgG remaining in the supernatant following impurity capture by the precipitated complexes was studied with dynamic light scattering (DLS) (Figure 3A,C,E left hand side). A single peak representing particle sizes ranging bewteen 9-11 nm were observed with all three aromatic chelators. These values were in agreement with the control sample in which a 95% pure commercial hIgG was not subjected to any purification as well as the hIgG that was purified with a Protein A column (see section 3.6) This range of diameters is also consistant with our previous studies [39,51,52]. Since no additional peaks were observed, we conclude that the purified hIgG is monomeric. This finding may not be surprising when considering the fact that conditions were designed to supress hIgG binding to the aromatic complexes. Thus, the postulated minimal interaction between hIgG and the aromatic complexes should not affect signifincanly the antibodies secondary structure. This question was studied with circular dichroism (CD) being a powerful, non-invasive and and quantiative analytic tool to assess structural alterations in antibodies [53], and proteins in general [54], under different enviromental conditions.
3.5. Comparison of Aromatic Complex Purification and Protein A Chromatography
We compared the [(batho)3:Zn2+] purification capability with that of a Protein A column (Figure 4). Process performance was evaluted at two hIgG concentrations: 5 mg/mL and 15 mg/mL. The 5 mg/mL sample presents ideal conditions for the Protein A column and indeed the recovery yields of hIgG were very high (94-96% by densitometry) (Figure 4, A lanes 7-9) while the [(batho)3:Zn2+] protocol, calibrated for 15 mg/mL IgG , led to lower efficiency (84-88% by densitometry) (Figure 4, A lanes 4-6). We attribute this to the presence of excess aromatic complexes relative to the number of hIgG in the system. However, at 15 mg/mL IgG, where the [(batho)3:Zn2+] protocol had been optimized, process efficiency improved to 94-96% yield (Figure 4, B lanes 4-6) while that of the Protein A column was in the 70% range (Figure 4, B lanes 6-9). The latter result was not unexpected; the concentration of antibodies exceeded the binding capacity of the Protein A column. As far as purity was concerned, we found that the Protein A column led to slightly purer hIgG relative to that achieved with the [(batho)3:Zn2+] complex (Figure 4, A-B lanes 4-6 vs. 7-9). This difference can be understood when considering the fact that Protein A is a highly specific ligand for the Fc moiety of IgG, whereas our protocol is based on non-specific interactions. These encouraging findings (i.e., high yield and purity) with concentrated antibody samples (15 mg/mL) imply that commonly employed Protein A column chromatography could be replaced by a non-chromatographic, ligand-free step thereby reducing both the cost and time for antibody downstream processing.
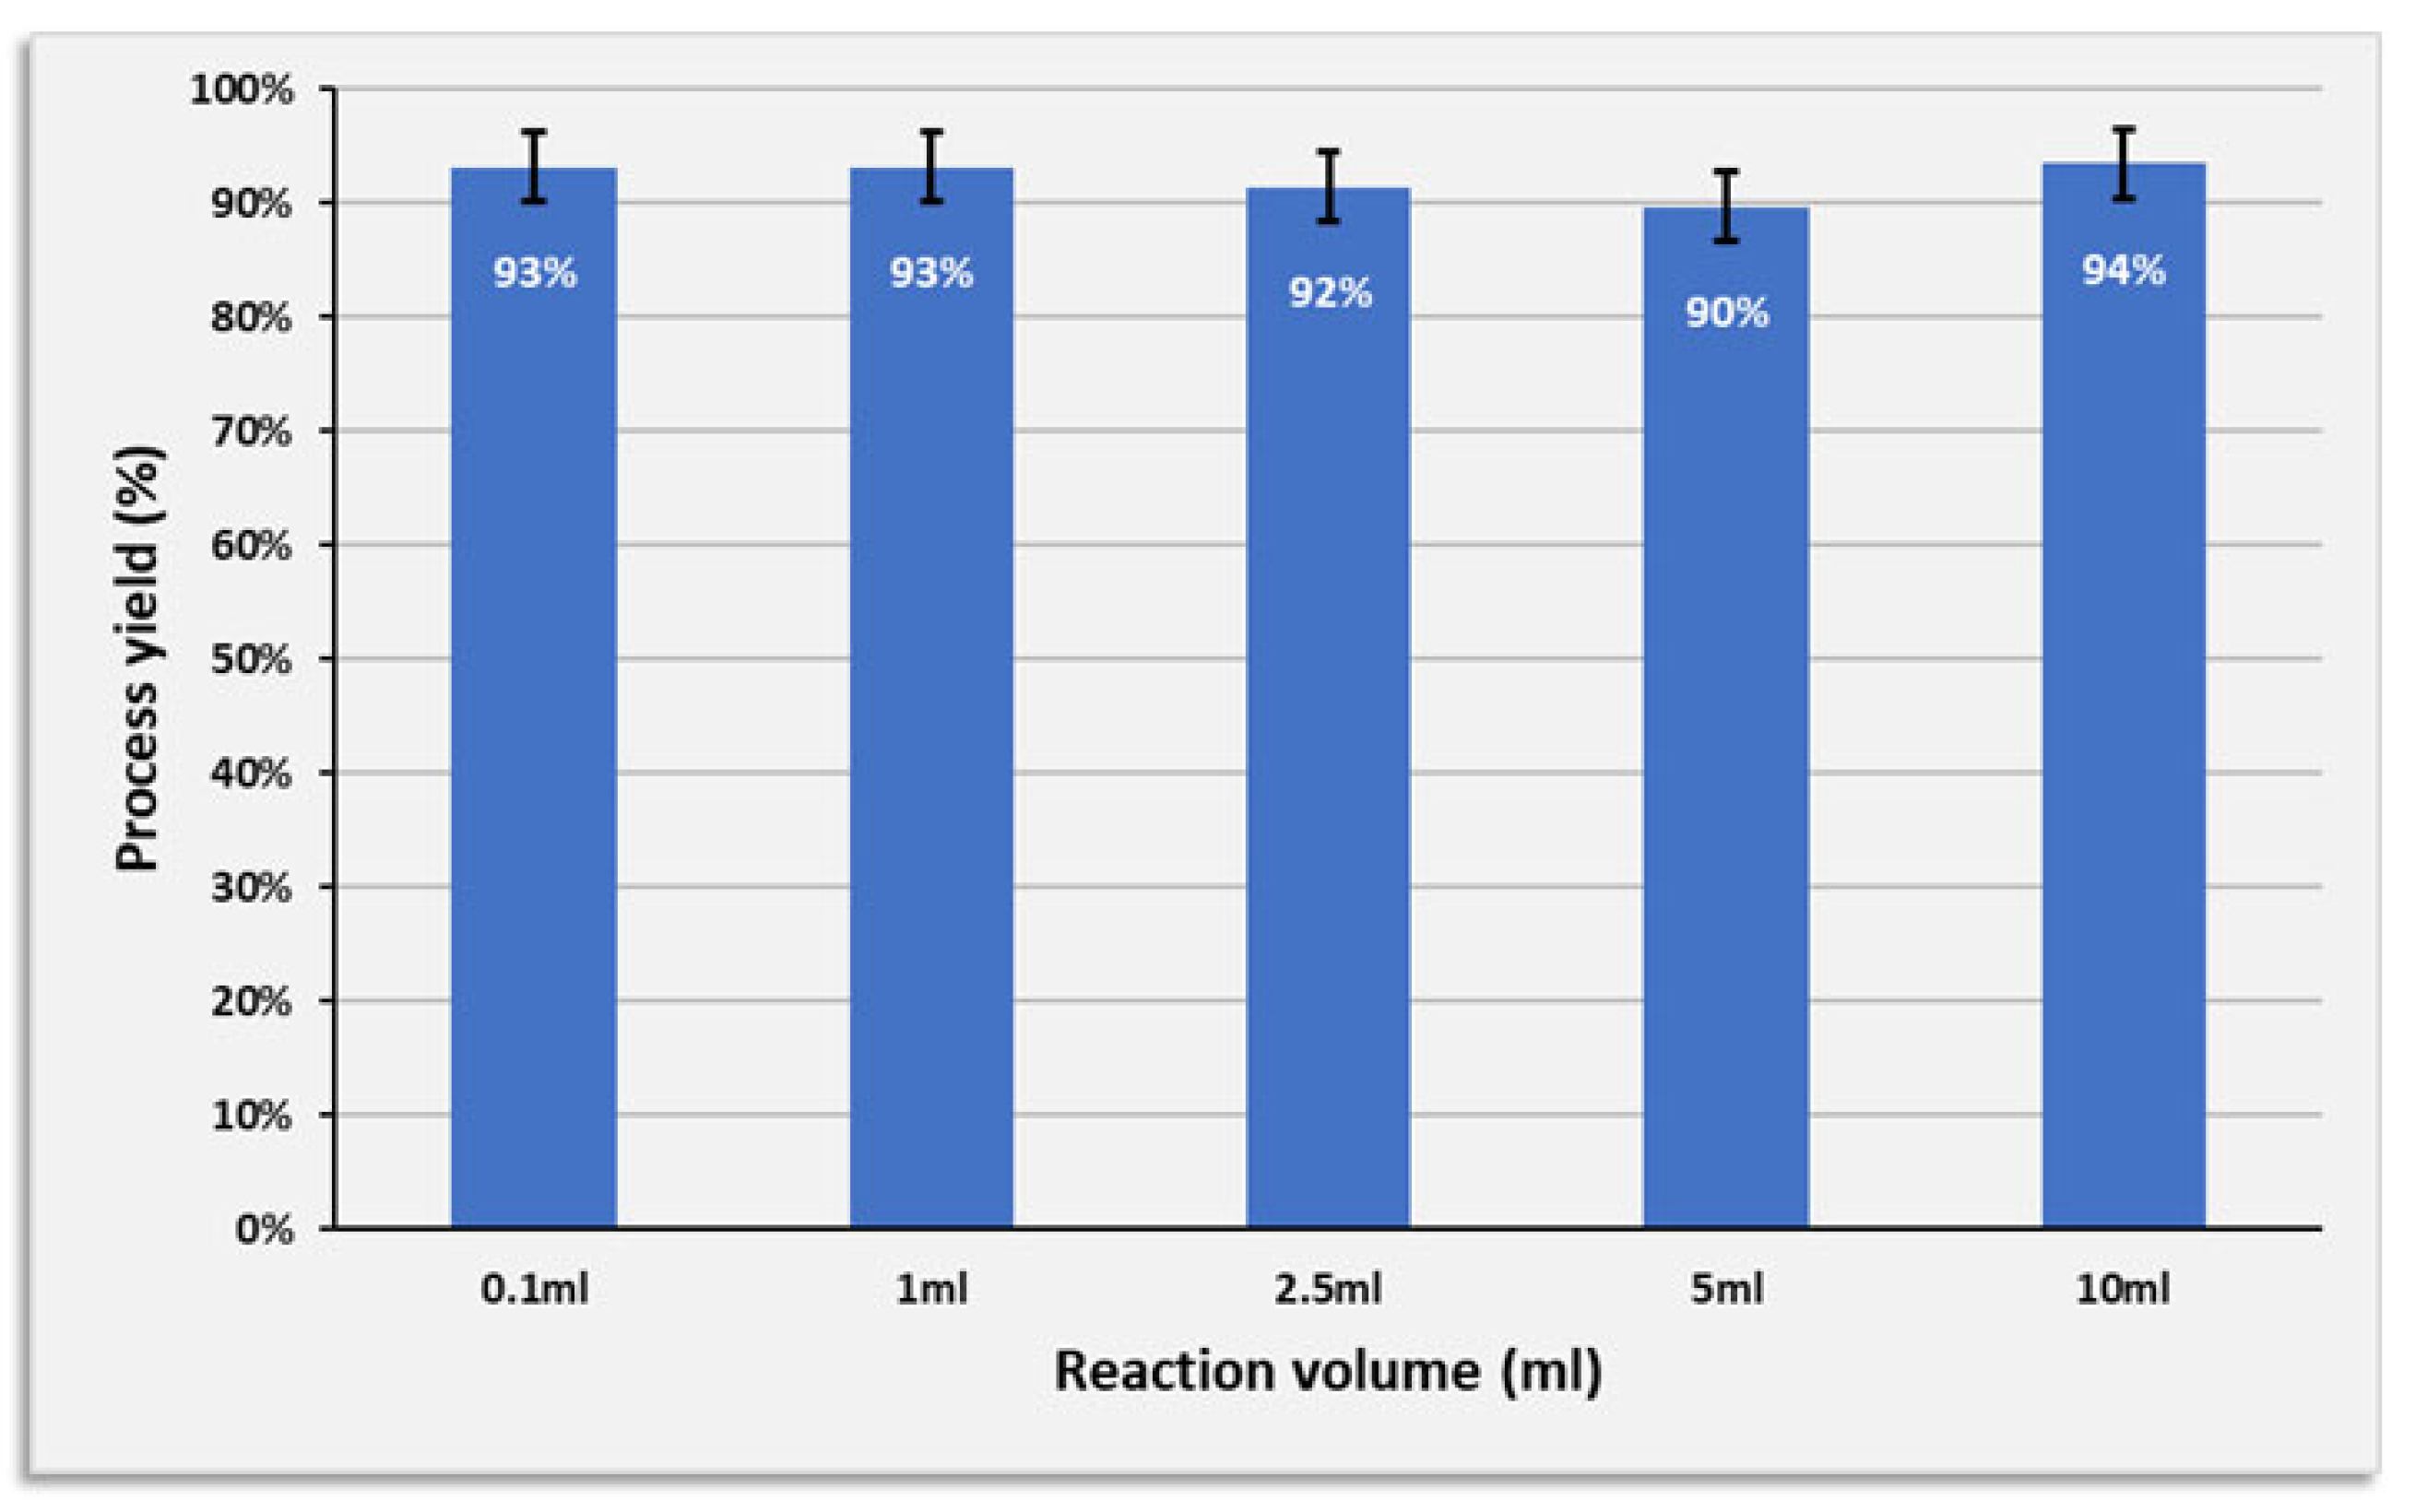
3.6. Increasing the Reaction Volume
To represent a reasonable starting point for large-scale production, it was essential to demonstrate process efficency with larger purification volumes. Therefore, the basic laboratory protocol , applied on the 0.1 mL scale, was increased 10, 25, 50 and 100 fold. We observed that only proportional reagent adjustments were required in order to maintain high levels of process yield (Figure 5) and purity ( data not shown). Although 10 mL is far from the production scale (5000-25,000 L) used by most biopharmaceutical companies [55], these results were nevertheless encouraging.
4. Conclusions
We have presented a simple, economical, single-step purification procedure at neutral pH for polyclonal human IgG (hIgG) antibody molecules that does not require expensive ligands, chromatography columns, polymers, nor membranes. Instead, the active media consist of porous precipitates of commercial, recyclable aromatic [bathophenanthroline:cation] complexes. The [(batho)3:Zn2+] complexes were found to efficiently capture impurity proteins ( concentration ≤ 1mg/ml) from CHO cells or E. coli lysate while the majority of the hIgG (concentration 5-15 mg/mL) antibody molecules remained in the supernatant. The fact that process efficiency was observed at such high IgG concentrations (15 mg/mL) implies that our purification platform can indeed serve current, and perhaps even future, high upstream IgG titers. We note, however, that this approach is necessarily limited to cell culture working conditions in which the concentration of the target antibody exceeds that of the impurity protein background by more than a factor of 10 correct and that of the chelator by at least a factor of 15.
References
- Jain, E. and A. Kumar, Upstream processes in antibody production: evaluation of critical parameters. Biotechnol Adv, 2008. 26(1): p. 46-72.
- Shukla, A.A. and J. Thömmes, Recent advances in large-scale production of monoclonal antibodies and related proteins. Trends Biotechnol, 2010. 28(5): p. 253-61.
- Elvin, J.G., R.G. Couston, and C.F. van der Walle, Therapeutic antibodies: market considerations, disease targets and bioprocessing. Int J Pharm, 2013. 440(1): p. 83-98.
- Khanal, O. and A.M. Lenhoff, Developments and opportunities in continuous biopharmaceutical manufacturing. mAbs, 2021. 13(1): p. 1903664.
- Kaplon, H., et al., Antibodies to watch in 2022. MAbs, 2022. 14(1): p. 2014296.
- Ghose, S., B. Hubbard, and S.M. Cramer, Binding capacity differences for antibodies and Fc-fusion proteins on protein A chromatographic materials. Biotechnol Bioeng, 2007. 96(4): p. 768-79.
- Kelley, B., Industrialization of mAb production technology: the bioprocessing industry at a crossroads. MAbs, 2009. 1(5): p. 443-52.
- Li, F., et al., Cell culture processes for monoclonal antibody production. MAbs, 2010. 2(5): p. 466-79.
- Huang, Y.M., et al., Maximizing productivity of CHO cell-based fed-batch culture using chemically defined media conditions and typical manufacturing equipment. Biotechnol Prog, 2010. 26(5): p. 1400-10.
- Natarajan, V. and A.L. Zydney, Protein A chromatography at high titers. Biotechnol Bioeng, 2013. 110(9): p. 2445-51.
- Chon, J.H. and G. Zarbis-Papastoitsis, Advances in the production and downstream processing of antibodies. N Biotechnol, 2011. 28(5): p. 458-63.
- Butler, M. and A. Meneses-Acosta, Recent advances in technology supporting biopharmaceutical production from mammalian cells. Appl Microbiol Biotechnol, 2012. 96(4): p. 885-94.
- Yavorsky, D.P., et al., The clarification of bioreactor cell cultures for biopharmaceuticals. Pharmaceutical technology, 2003. 27: p. 62-76.
- Liu, H.F., et al., Recovery and purification process development for monoclonal antibody production. MAbs, 2010. 2(5): p. 480-99.
- Gavara, P.R., et al., Chromatographic Characterization and Process Performance of Column-Packed Anion Exchange Fibrous Adsorbents for High Throughput and High Capacity Bioseparations. Processes, 2015. 3(1): p. 204-221.
- Yang, W.C., et al., Concentrated fed-batch cell culture increases manufacturing capacity without additional volumetric capacity. Journal of Biotechnology, 2016. 217: p. 1-11.
- Wang, M., G. Buist, and J.M. van Dijl, Staphylococcus aureus cell wall maintenance - the multifaceted roles of peptidoglycan hydrolases in bacterial growth, fitness, and virulence. FEMS Microbiol Rev, 2022. 46(5).
- Vidarsson, G., G. Dekkers, and T. Rispens, IgG subclasses and allotypes: from structure to effector functions. Front Immunol, 2014. 5: p. 520.
- DeLano, W.L., et al., Convergent solutions to binding at a protein-protein interface. Science, 2000. 287(5456): p. 1279-83.
- Follman, D.K. and R.L. Fahrner, Factorial screening of antibody purification processes using three chromatography steps without protein A. J Chromatogr A, 2004. 1024(1-2): p. 79-85.
- Valdés, R., et al., Chromatographic removal combined with heat, acid and chaotropic inactivation of four model viruses. J Biotechnol, 2002. 96(3): p. 251-8.
- Brorson, K., et al., Identification of protein A media performance attributes that can be monitored as surrogates for retrovirus clearance during extended re-use. J Chromatogr A, 2003. 989(1): p. 155-63.
- Butler, M.D., B. Kluck, and T. Bentley, DNA spike studies for demonstrating improved clearance on chromatographic media. J Chromatogr A, 2009. 1216(41): p. 6938-45.
- Tarrant, R.D., et al., Host cell protein adsorption characteristics during protein A chromatography. Biotechnol Prog, 2012. 28(4): p. 1037-44.
- Shukla, A.A. and P. Hinckley, Host cell protein clearance during protein A chromatography: development of an improved column wash step. Biotechnol Prog, 2008. 24(5): p. 1115-21.
- Linhult, M., et al., Improving the tolerance of a protein a analogue to repeated alkaline exposures using a bypass mutagenesis approach. Proteins, 2004. 55(2): p. 407-16.
- Hari, S.B., et al., Acid-induced aggregation of human monoclonal IgG1 and IgG2: molecular mechanism and the effect of solution composition. Biochemistry, 2010. 49(43): p. 9328-38.
- Bansal, R., S. Gupta, and A.S. Rathore, Analytical Platform for Monitoring Aggregation of Monoclonal Antibody Therapeutics. Pharm Res, 2019. 36(11): p. 152.
- Paul, A.J., K. Schwab, and F. Hesse, Direct analysis of mAb aggregates in mammalian cell culture supernatant. BMC Biotechnol, 2014. 14: p. 99.
- Zhang, J., et al., Maximizing the functional lifetime of Protein A resins. Biotechnol Prog, 2017. 33(3): p. 708-715.
- McDonald, P., et al., Selective antibody precipitation using polyelectrolytes: a novel approach to the purification of monoclonal antibodies. Biotechnol Bioeng, 2009. 102(4): p. 1141-51.
- Azevedo, A.M., et al., Chromatography-free recovery of biopharmaceuticals through aqueous two-phase processing. Trends Biotechnol, 2009. 27(4): p. 240-7.
- Mao, L.N., et al., Downstream antibody purification using aqueous two-phase extraction. Biotechnol Prog, 2010. 26(6): p. 1662-70.
- van Reis, R. and A. Zydney, Bioprocess membrane technology. Journal of Membrane Science, 2007. 297(1–2): p. 16-50.
- Zheng, X., et al., Enrichment of IgG and HRP glycoprotein by dipeptide-based polymeric material. Talanta, 2022. 241: p. 123223.
- Dhandapani, G., E. Wachtel, and G. Patchornik, Conjugated surfactant micelles: A non-denaturing purification platform for concentrated human immunoglobulin G. Nano Select, 2023. 4(6): p. 386-394.
- Withanage, T.J., et al., Conjugated Nonionic Detergent Micelles: An Efficient Purification Platform for Dimeric Human Immunoglobulin A. ACS Med Chem Lett, 2024. 15(6): p. 979-986.
- Dhandapani, G., et al., Conjugated detergent micelles as a platform for IgM purification. Biotechnol Bioeng, 2022. 119(7): p. 1997-2003.
- Dhandapani, G., et al., A general platform for antibody purification utilizing engineered-micelles. MAbs, 2019. 11(3): p. 583-592.
- Withanage, T.J., et al., The [(bathophenanthroline)(3):Fe(2+)] complex as an aromatic non-polymeric medium for purification of human lactoferrin. J Chromatogr A, 2024. 1732: p. 465218.
- Noy-Porat, T., et al., Acetylcholinesterase-Fc Fusion Protein (AChE-Fc): A Novel Potential Organophosphate Bioscavenger with Extended Plasma Half-Life. Bioconjug Chem, 2015. 26(8): p. 1753-8.
- Shafferman, A., et al., Electrostatic attraction by surface charge does not contribute to the catalytic efficiency of acetylcholinesterase. Embo j, 1994. 13(15): p. 3448-55.
- Dhandapani, G., et al., Purification of antibody fragments via interaction with detergent micellar aggregates. Sci Rep, 2021. 11(1): p. 11697.
- Perry, R.D. and C.L.S. Clemente, Determination of iron with bathophenanthroline following an improved procedure for reduction of iron(III) ions. Analyst, 1977. 102(1211): p. 114-119.
- O'Laughlin, J.W., Separation of cationic metal chelates of 1,10-phenanthroline by liquid chromatography. Analytical Chemistry, 1982. 54(2): p. 178-181.
- Ng, N.S., et al., The antimicrobial efficacy and DNA binding activity of the copper(II) complexes of 3,4,7,8-tetramethyl-1,10-phenanthroline, 4,7-diphenyl-1,10-phenanthroline and 1,2-diaminocyclohexane. J Inorg Biochem, 2016. 162: p. 62-72.
- Zhang, J.H., et al., Strategies and Considerations for Improving Recombinant Antibody Production and Quality in Chinese Hamster Ovary Cells. Front Bioeng Biotechnol, 2022. 10: p. 856049.
- Kelley, B., Developing therapeutic monoclonal antibodies at pandemic pace. Nature Biotechnology, 2020. 38(5): p. 540-545.
- Rashid, M.H., Full-length recombinant antibodies from Escherichia coli: production, characterization, effector function (Fc) engineering, and clinical evaluation. MAbs, 2022. 14(1): p. 2111748.
- Cain, P., et al., Impact of IgG subclass on monoclonal antibody developability. mAbs, 2023. 15(1): p. 2191302.
- Dhandapani, G., et al., Role of amphiphilic [metal:chelator] complexes in a non-chromatographic antibody purification platform. J Chromatogr B Analyt Technol Biomed Life Sci, 2019. 1133: p. 121830.
- Dhandapani, G., et al., Nonionic detergent micelle aggregates: An economical alternative to protein A chromatography. N Biotechnol, 2021. 61: p. 90-98.
- Bruque, M.G., et al., Analysis of the Structure of 14 Therapeutic Antibodies Using Circular Dichroism Spectroscopy. Analytical Chemistry, 2024. 96(38): p. 15151-15159.
- Greenfield, N.J., Using circular dichroism spectra to estimate protein secondary structure. Nat Protoc, 2006. 1(6): p. 2876-90.
- Buyel, J.F., R.M. Twyman, and R. Fischer, Very-large-scale production of antibodies in plants: The biologization of manufacturing. Biotechnology Advances, 2017. 35(4): p. 458-465.
Figure 1.
A. Chemical structure of the aromatic [metal:chelator] complexes and the morphology of their precipitates upon addition of 0.5M NaCl, as imaged by SEM. Insets show colored pellets of precipitated complexes. B. Cartoon illustration of the purification protocol for highly concentrated (15mg/ml) human IgG (hIgG). 30 minutes incubation in 50 mM NaPi at 10°C of polyclonal hIgG plus E coli. lysate or proteins secreted from CHO cells and mixed with the washed aromatic precipitate, leads to the capture of most of the protein impurities. The majority of the hIgG molecules remain in the supernatant. The mass ratio (in mg/mL) [hIgG:total impurity proteins] is 30:1 or 93:1 with E. coli lysate or CHO cell proteins, respectively. Cartoon is not to scale.
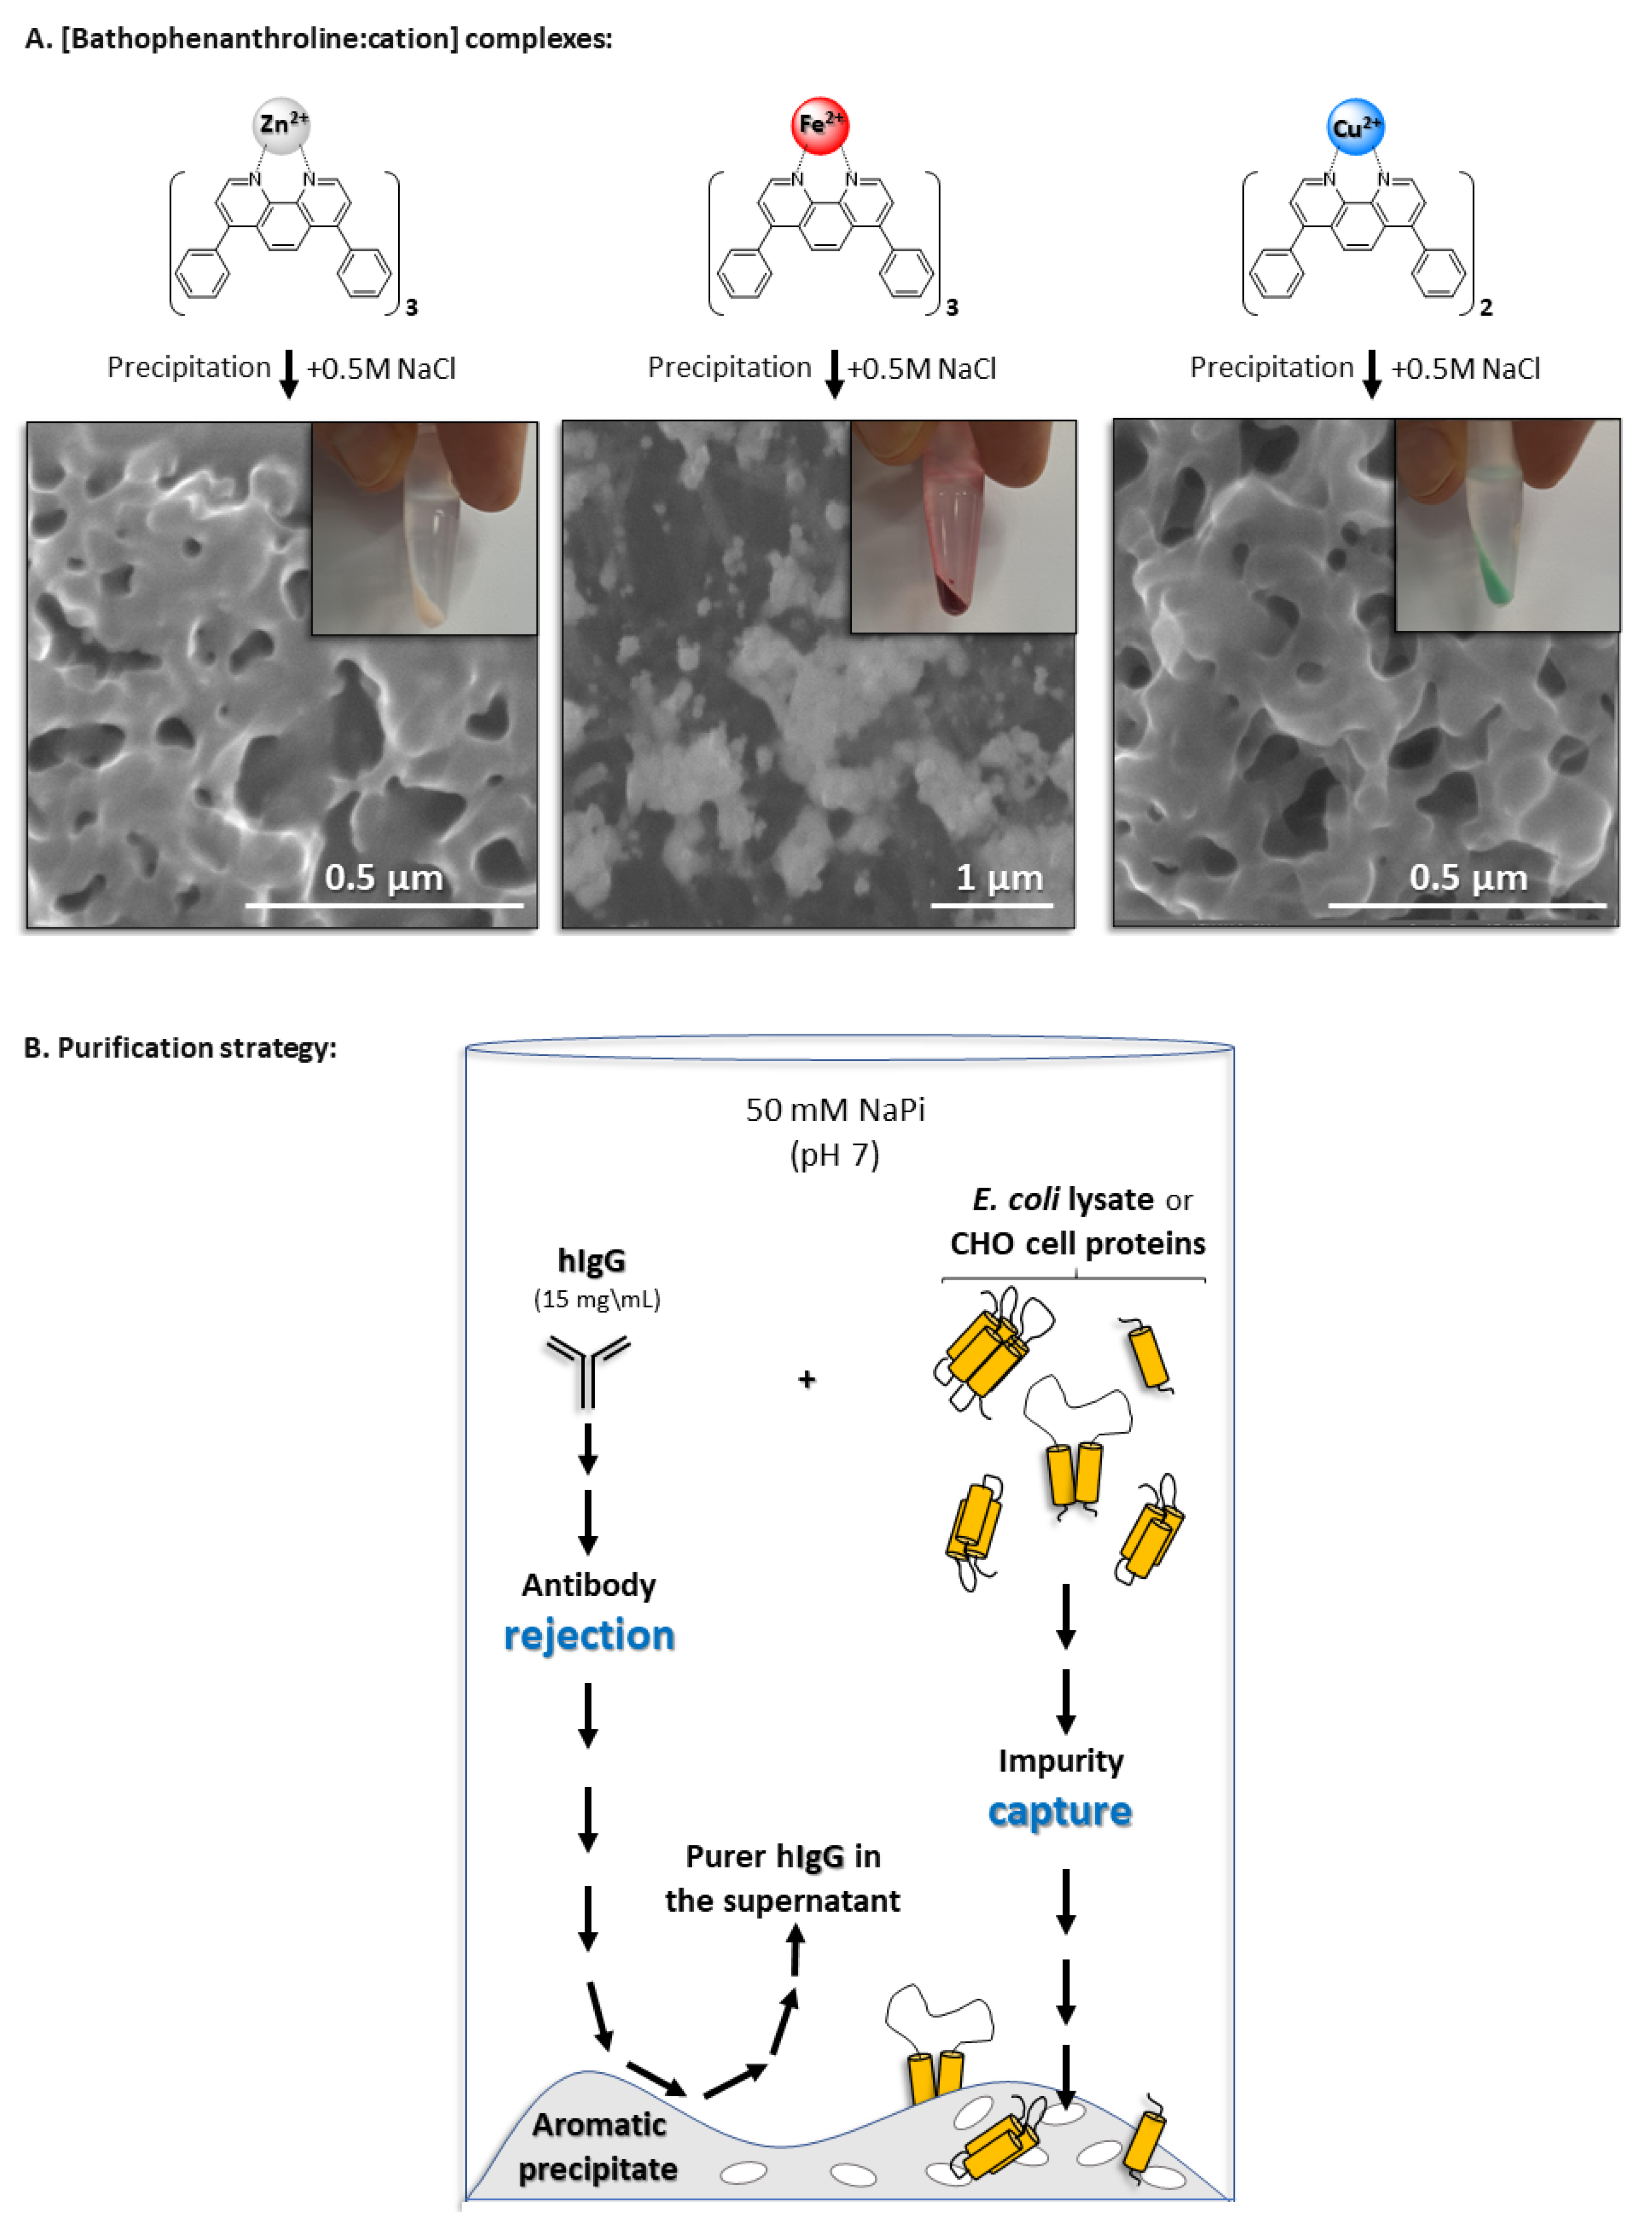
Figure 2.
SDS polyacrylamide gels with b-mercaptoethanol reveal hIgG purification process efficiency using zinc (A-B), iron (C-D) or copper (E-F) divalent cations in the presence of the relevant impurity protein background. In all gels: Lane 1: molecular weight markers; Lane 2: total amount added of the artificial contamination background; Lane 3: total amount of commercial polyclonal hIgG (≥95% purity by HPLC) [C] added to each of the purification trials; Lanes 4-7: recovered hIgG after incubation for 30 minutes at 10°C in 50 mM NaPi (pH 7). Each lane represents an independent purification trial performed on a different day. Process yields were determined by comparing the intensity of the bands representing the total amount of commercial hIgG [C] added to each purification trial (lane 3) to the hIgG present in the supernatant after impurity protein removal. Quantitation is performed using ImageJ (NIH). Red arrows labelled "Heavy" or "Light" show the migration of the reduced heavy and light chains of the hIgG population. Gels are Coomassie stained.
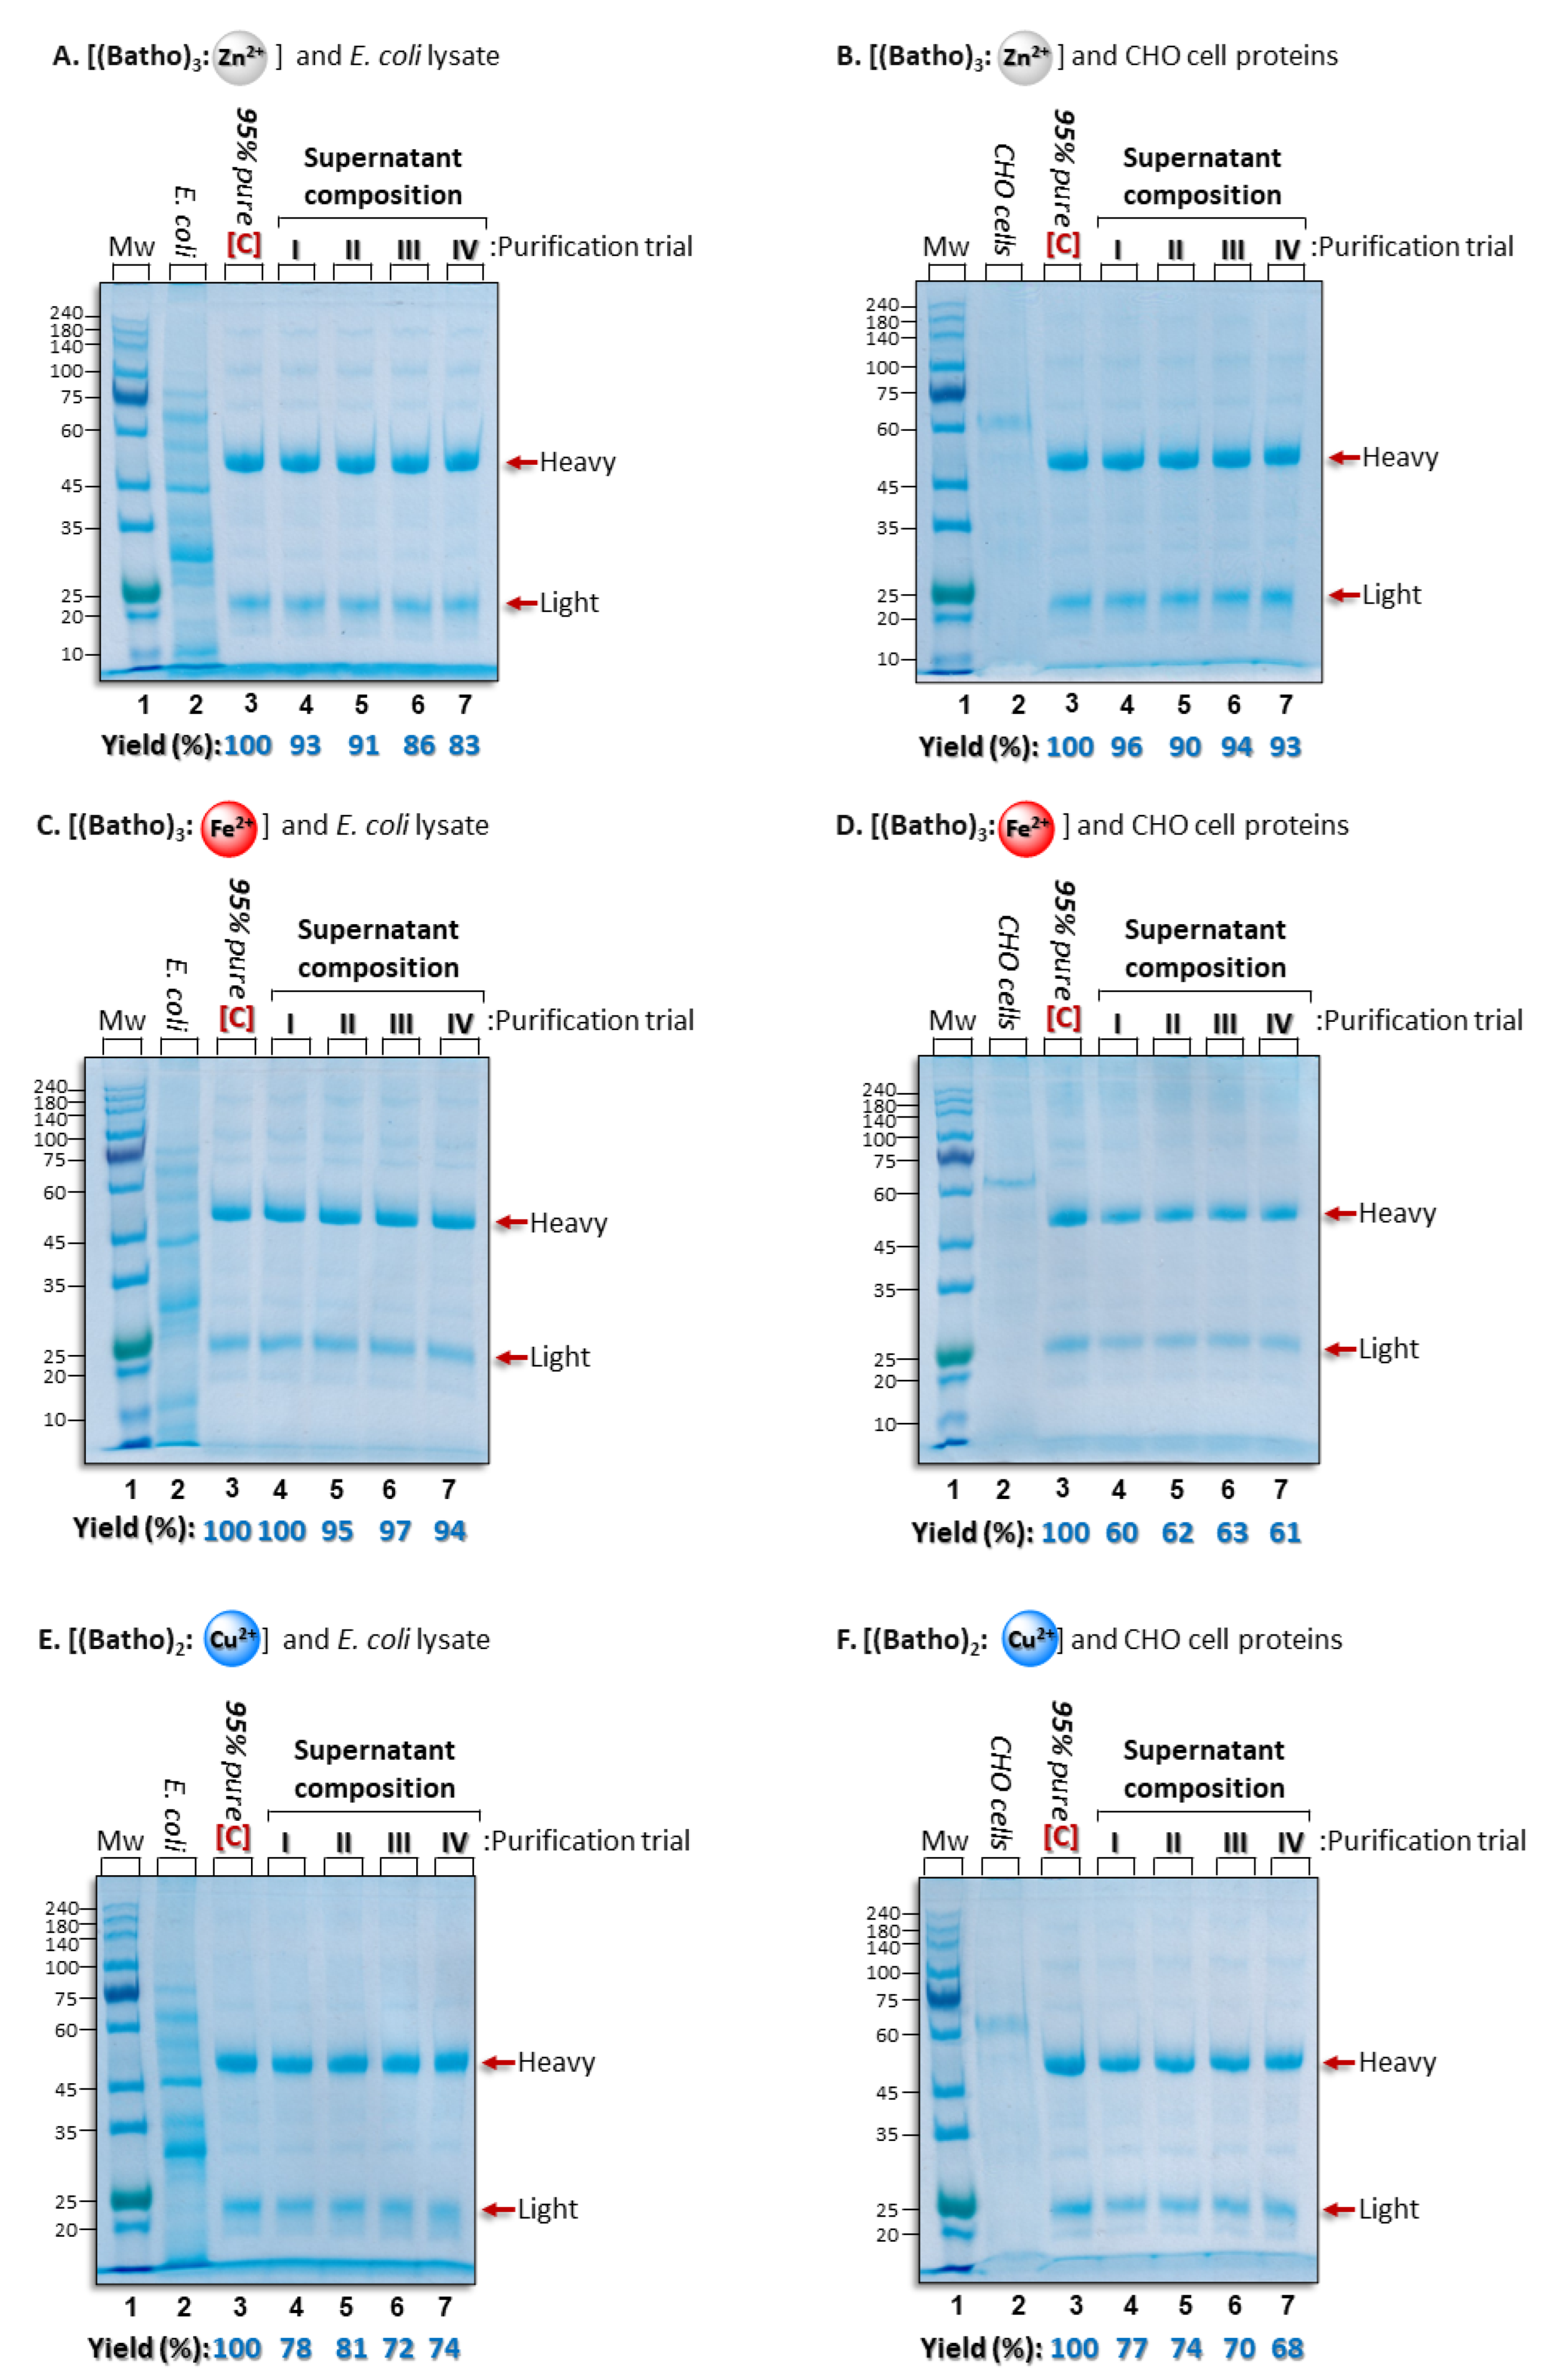
Figure 3.
A, C and E: Hydrodynamic particle size distribution, as determined by dynamic light scattering (DLS), of purified, polyclonal hIgG, diluted with PBS (pH7.4) to 0.5 mg/mL and analyzed at 25°C. Legend: purified with the aromatic complex (dotted purple line) ; purified on a Protein A column (red/orange line) ; or commercial, as-received hIgG (purity by HPLC, 95%) that had not been exposed to any additional purification protocol (black line). B, D and F: Protein secondary structure as determined by far UV circular dichroism (CD) spectroscopy. Sample identification as in panels A, C and E but at hIgG concentration of 0.05 mg/mL in 50 mM NaPi, 25oC.
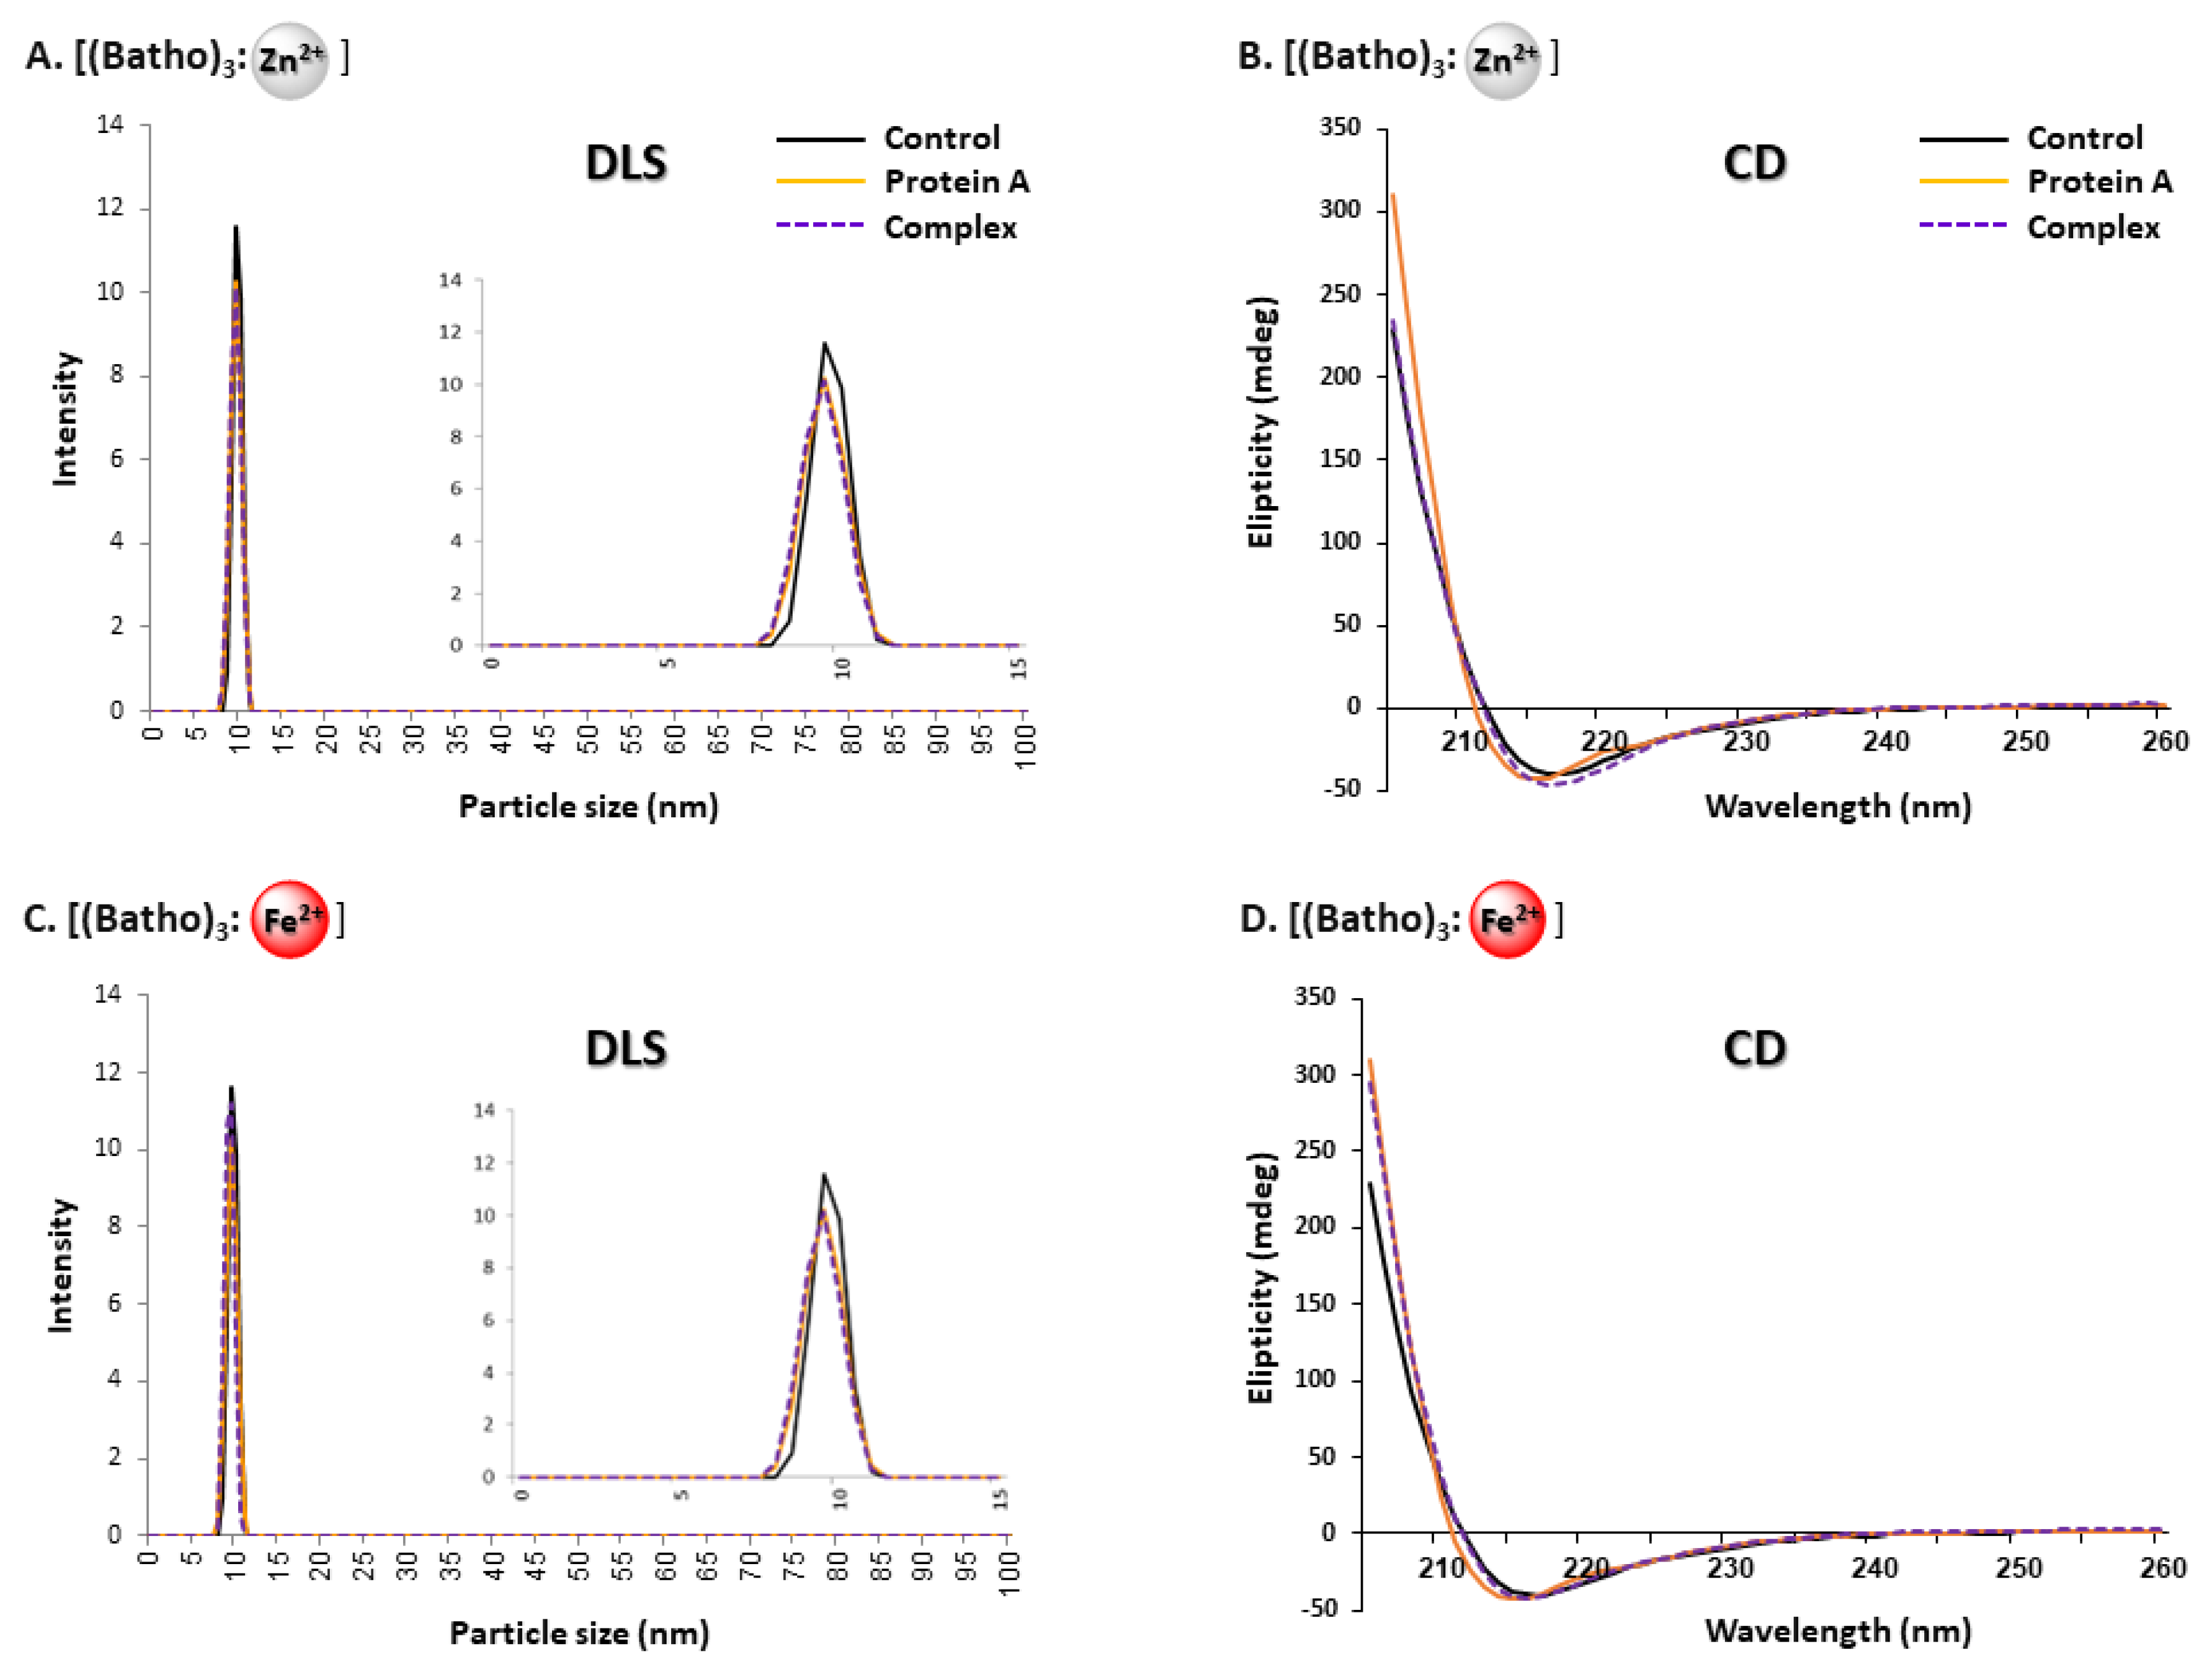

Figure 4.
SDS polyacrylamide gels with b-mercaptoethanol allow comparison of polyclonal hIgG purification efficiency via the [(batho)3:Zn2+] complex or with a Protein A column at antibody concentrations of either 5 mg/ml (panel A) or 15 mg/ml (panel B). A. Lane 1: Molecular weight markers; lane 2: total amount of CHO cell-extruded impurity proteins to be mixed with 5 mg/ml commercial polyclonal hIgG ([C]; lane 3) and added to each of the purification trials; lanes 4-6 and 7-9: Recovered hIgG via the [(batho)3:Zn2+] complex or eluted from a Protein A column (as described in the Experimental section). B. As in A, but concentration 15 mg/ml hIgG. Three independent purification trials were conducted on different days. Gels are Coomassie stained. Process yields were determined by comparing the intensity of the bands representing the total amount of commercial hIgG [C] added to each purification trial (lane 3) to the intensity of the bands following each purification trial.
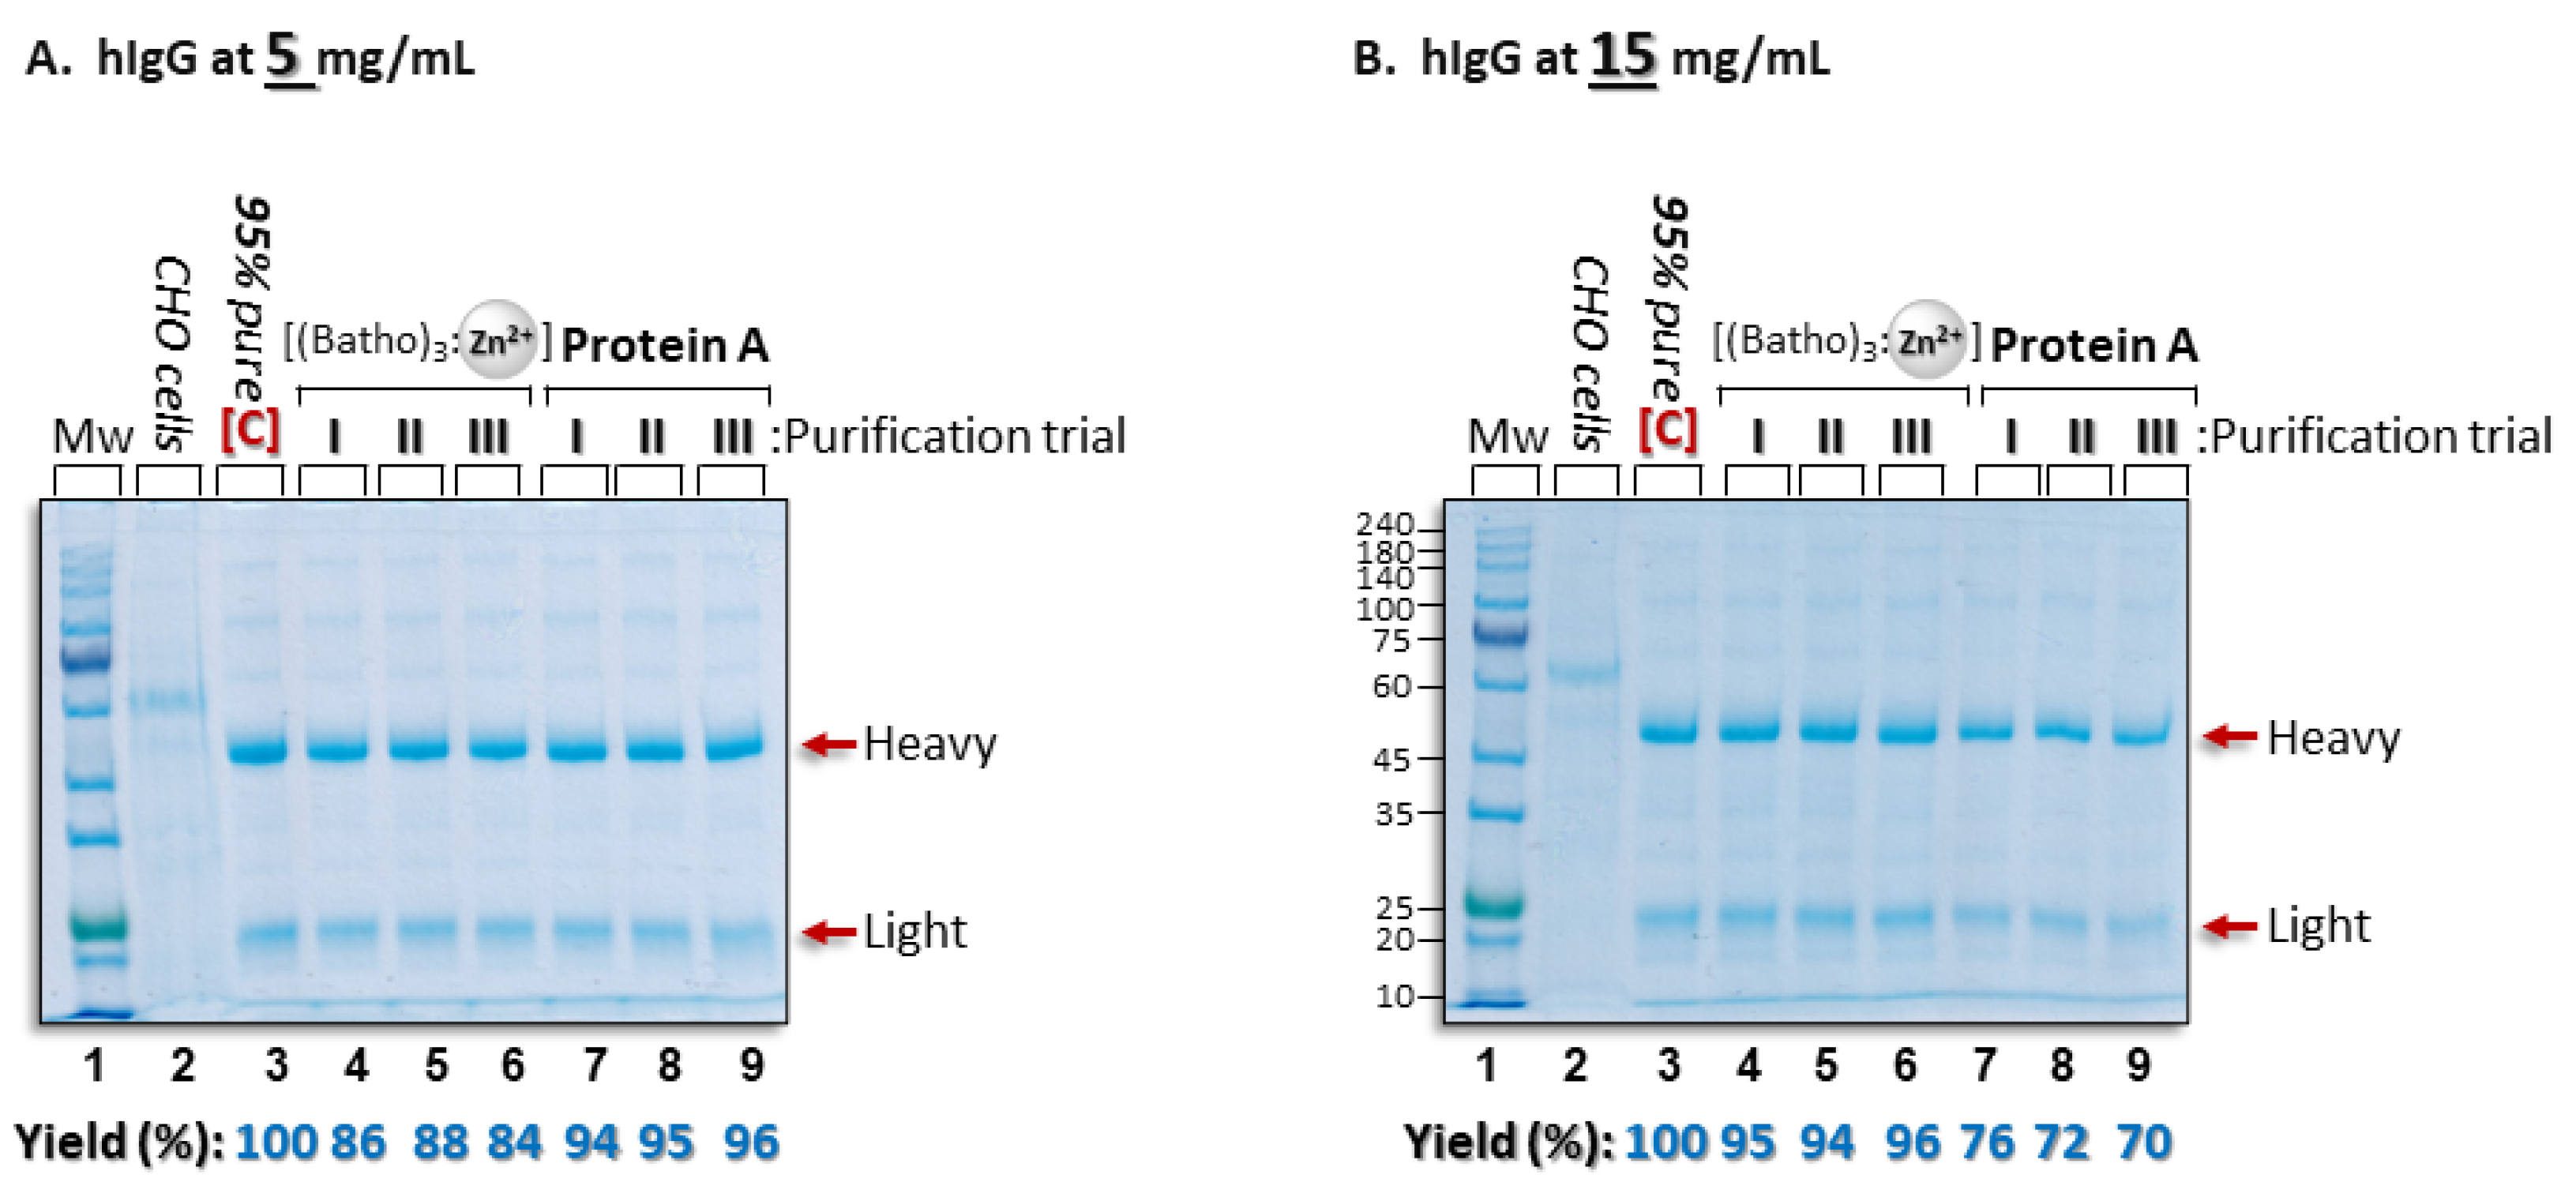
Figure 5.
Process upscaling. The purification protocol for 15 mg/ml hIgG, in the presence of CHO cell- secreted proteins, was applied to increasing reaction volumes while raising proportionally all required reagents as described in the Experimental section. Standard deviations based on triplicate measurements ranged from 1.5-4%. hIgG purity was not affected by increase in reaction volume. (data not shown).
Disclaimer/Publisher’s Note: The statements, opinions and data contained in all publications are solely those of the individual author(s) and contributor(s) and not of MDPI and/or the editor(s). MDPI and/or the editor(s) disclaim responsibility for any injury to people or property resulting from any ideas, methods, instructions or products referred to in the content. |
© 2025 by the authors. Licensee MDPI, Basel, Switzerland. This article is an open access article distributed under the terms and conditions of the Creative Commons Attribution (CC BY) license (http://creativecommons.org/licenses/by/4.0/).
Copyright: This open access article is published under a Creative Commons CC BY 4.0 license, which permit the free download, distribution, and reuse, provided that the author and preprint are cited in any reuse.


