
Submitted:
22 December 2024
Posted:
23 December 2024
You are already at the latest version
Abstract
Erosion is a significant environmental challenge in Serbia, shaped by natural and human factors. Pronounced relief, fragile geological substrate, a developed hydrographic network, and a cli-mate characterized by uneven distribution of precipitation throughout the year, make this area prone to activating erosion processes and flash floods whenever there is a significant disruption in ecological balance, whether due to the removal of vegetation cover or inadequate land use. Researchers have recorded approximately 11,500 torrents in Serbia, most of which were activat-ed during the 19th century, a period of significant social and political change, as well as inten-sive deforestation and irrational exploitation of natural resources. By the mid-19th century, the effects of land degradation were impossible to ignore. As the adequate assessment of soil ero-sion intensity is the initial step in developing a prevention and protection strategy and the type and scope of anti-erosion works and measures, this article presents the path that the anti-erosion field in Serbia has taken, from the initial observations of erosion processes through the first at-tempts to create the Barren Land Cadastre and Torrent Cadaster to the creation of Erosion Poten-tial Method (EPM), the first Erosion Map of SR Serbia in 1971 and the application of Geographic Information System (GIS) technologies in the XXI century.
Keywords:
soil erosion
; water erosion
; environmental degradation
; land use changes
; Erosion Potential Method
; mapping
; GIS
1. Introduction
Soil erosion is one of the most widespread and severe forms of degradation, directly affecting the disruption of natural soil functions [1,2]. It reduces agricultural productivity, degrades ecosystem functions, decreases biodiversity, and increases hydrogeological risks that result in infrastructure damage, loss of life, and displacement of human populations [3]. The direct consequences of erosion processes are reflected in reducing organic matter content, infiltration capacity, and production potential. Indirect consequences include lowering groundwater levels, sediment deposition (in watercourses and lower parts of catchments), increased CO2 emissions, impacts on climate change, and triggering flash floods and infrastructure damage. The type and intensity of erosion are determined by a combination of the area’s biophysical characteristics and anthropogenic activities [1,2].
Scientists have recently begun considering soil a non-renewable resource, as its loss and degradation cannot be compensated during a human lifetime. All current research shows that soil erosion rates are much higher than the rate of its formation [1,2]. Proper soil management aims to maintain erosion intensity at or below the natural rate of new soil formation [4].
According to the Global Assessment of Soil Degradation (GLASOD), the total global area of severely degraded land amounts to 305 × 10⁶ hectares, of which 224 × 10⁶ hectares result from water erosion [5]. Economic activities contribute to active changes in land use on 60% of the terrestrial surface [6], while 33% of the land is already degraded, and over 90% could become degraded by 2050. In some areas, the productivity of eroded land is irrecoverable, even with extensive use of fertilizers and other fossil energy inputs. According to some studies, 10 × 10⁶ hectares of arable land are abandoned yearly due to soil erosion [7,8,9].
Currently, erosion processes of various destruction categories are present on 86.4% of Serbia’s territory, with severe and excessive erosion processes affecting 35% [10,11,12,13]. The mean annual production of eroded material amounts to 37.25 million m³, or 487.85 m³/km², 4.88 times higher than normal (geological) erosion [14,15].
As the adequate assessment of soil erosion intensity is the initial step in developing a prevention and protection strategy and the type and scope of anti-erosion works and measures, this article aims to present the long journey that the anti-erosion field in Serbia has taken from observational recording of erosion processes to the application of the most modern methods and models for detection and categorization of these processes. It will present the emergence of awareness about the dangers and intensity of erosion processes, along with the chronology of efforts to document them—from the earliest investigative methods to the application of modern techniques—with a special focus on the genesis of the Erosion Potential Method (EPM) and its role in creating the first erosion map of the Republic of Serbia.
2. Materials and Methods
Serbia is located in the central part of the Balkan Peninsula, covering an area of 88,361 km². Its territory includes the vast plains of Vojvodina in the north and a hilly, mountainous area in the south, with the rivers Danube and Sava forming a natural boundary between these two regions [16] (Figure 1).
Erosion is a significant environmental challenge in Serbia, shaped by natural and human factors. Pronounced relief, fragile geological substrate, a developed hydrographic network, and a climate characterized by uneven distribution of precipitation throughout the year make this area prone to activating erosion processes and flash floods whenever there is a significant disruption in ecological balance, whether due to the removal of vegetation cover or inadequate land use [17,18,19].
The country’s diverse geography and history have created a complex landscape where erosion processes are activated by a combination of natural characteristics and anthropogenic activities. Understanding these processes is essential for developing effective strategies to manage erosion and protect Serbia’s natural resources [19].
Due to specific historical circumstances, including the final fall of the Serbian medieval state under Ottoman rule in 1459 and centuries of stagnation marked by uprisings and wars, it is possible to obtain a clearer picture of soil conditions in Serbia only from the mid-19th century, following the restoration of Serbian statehood. Earlier periods can only be reconstructed based on the limited number of preserved documents from the Medieval era and accounts of Western travelers [19].
Evidence of land degradation due to deforestation—associated with mining activities in the mid-13th century can be found in certain provisions of Emperor Dušan's Code (1349), as well as on the barren areas formed in the Kopaonik region and other serpentine and limestone massifs [19,20,21]. Accounts by medieval travelers describe Serbia as a densely forested country with minimal agricultural activity. Writers such as Willelmus Tyrensis (1130–1186), Niketas Choniates (1155–1215), Guillaume Adam (d. 1341), and Matteo Villani (1283–1363) depict the region as predominantly forested [19,22,23]. This condition seemingly persisted throughout Ottoman rule. Travelers like Benedict Curipeschitz von Obernburg (1491–1531) and Stephanus Gerlachius (1546–1612) describe the region as desolate and sparsely populated [19,22]. Similar impressions are found in the records of Lady Mary Wortley Montagu (1689–1762) and the Memoirs of Prota Mateja Nenadović (1777–1854). Adam von Weingarten (1788–1831), Otto Ferdinand Dubislav von Pirch (1799–1832), Alexander William Kinglake (1809–1891), and Alphonse de Lamartine (1790–1869) all characterized Serbia as an expanse of untouched forest, with Lamartine comparing Serbian forests to those of North America, synonymous at the time with wild and untamed nature [19,24,25,26,27,28]. However, significant ecological disruptions began to occur after Serbia’s liberation from Ottoman rule. The 19th century brought rapid changes, including deforestation and soil degradation. The destructive effects of erosion became evident during the late 19th century, as flash floods caused frequent and severe damage [19,27,29,30]. These events forced the emerging Serbian state to recognize the importance of addressing erosion and land degradation. The first steps included developing legal regulations to protect forests and establishing trained forestry experts. By the early 20th century, Serbia began implementing organized erosion control measures, laying the groundwork for a systematic approach to managing this critical environmental issue.
To develop an effective anti-erosion and flood control strategy, it is essential to understand the magnitude of the issues and their potential destructive impacts. Establishing methods for documenting erosion processes has become a crucial aspect of anti-erosion initiatives. In presenting that development, this study utilized a multi-disciplinary approach that combined historical analysis, cartographic interpretation, and modern geographic information technologies.
The methodological framework relied on a factographic approach based on collecting and systematizing materials, forming an informational basis consisting of historical, cartographic, and ecological data, then using an analytical approach for interpreting those sources. Historical data were systematically described and categorized, providing a chronological overview of the development of methods for recording erosion processes.
A comparative analysis was conducted to evaluate the spatial and quantitative parameters of the first Erosion Map of Serbia (1983), created using Lazarević’s modified EPM method, and the Erosion Map of the Republic of Serbia (2020), developed using the original EPM method and implementation of Geographic Information System (GIS) technologies, enabling the digital representation of real spatial environments.
3. Results and Discussion
3.1. Causes and Consequences of Erosion Processes on the Territory of the Republic of Serbia
In Serbia, researchers have recorded approximately 11,500 torrents on basins ranging from a few hectares to several hundred square kilometers. Between 1950 and 2018, flash floods claimed over 130 human lives and caused material damage exceeding 12 billion euros [31]. The main torrent areas in Serbia are the basins of the West Morava, Ibar, Lim, South Morava, Toplica, Nišava, and Timok rivers, and, to a lesser extent, the Kolubara and Drina rivers [17,18]. Most of these torrents were activated during the 19th century, a period of significant social and political change, as well as intensive deforestation and irrational exploitation of natural resources. The isolated and largely sedentary Serbian population believed that Serbia’s forests were inexhaustible, continuing to exploit them freely and without restriction, as during the Ottoman occupation, even though the area had become much more densely populated. From the end of the First Serbian Uprising (1804) to the end of the 19th century, Serbia’s population increased over six times through immigration and high natural growth rates [19,32]. Between 1820 and 1910, Serbia’s population growth rate was the highest in the Balkans, averaging 1.55% annually [19,28,32]. This demographic pressure necessitated land clearance for agricultural production and, later, for trade and the beginning of industrial development in the second half of the 19th century [19,23,32].
In the 19th century, agriculture began to take precedence over livestock farming, which had dominated for centuries, a trend that continued through the 20th century. In 1867, arable land and meadows occupied 15% of Serbia’s land area, while a century later, about 62% of Serbia’s territory was used for agriculture [27,28]. People initially cultivated land in non-forested areas, but exhaustion of these lands by the first half of the 19th century prompted them to clear forests even in areas unsuitable for agriculture [19,33].
Agricultural production methods were primitive. Farmers did not practice crop rotation or fallowing. The earliest record of fallowing dates back to 1897 and shows that farmers used it on only 3.3% of arable land. As soon as farmers noticed reduced soil fertility, they would clear and burn a nearby forest area, converting it to arable land [19,28].
Serbia’s autonomy within the Ottoman Empire in 1830 and the official abolition of feudalism in 1833 paved the way for legal reforms that enabled private land ownership and dismantled the Ottoman economic system based on the timar (Ottoman feudal land system, where a spahi (horseman) received land from the Sultan as a reward for military service, enjoying its income and administering it locally without owning it, as all land belonged to the state). However, private ownership was recognized only for arable land, while forests remained public property. Ownership rights and forest management became significant political issues no one wanted to address. Turbulent political events, state administrative instability, and the entire governance system in the second half of the 19th century prevented the enforcement of even the laws then in place. Within fifty years, four rulers, two regencies, three constitutional changes, several coups, one rebellion, and three wars affected the country [19,27].
By the mid-19th century, the effects of land degradation were impossible to ignore [34]. Josif Pančić (1814–1888) was the first to highlight severe ecological imbalances, particularly on the serpentine bases of bare steep slopes, and the dangers of flash floods threatening such areas [18,19,27]. Erosion was determined in all deforested areas of Serbia. Mountain regions became torrent-prone, and residents could expect flash floods every spring and autumn. Large rivers also began to flood more frequently due to the influence of numerous activated torrents. Notable floods occurred in 1840, 1864, 1869, 1871, 1874, and 1896 [19,27,29,30].
3.2. First Attempts to Officially Record the Degree of Land Degradation in Serbia
Confronted with the consequences of erosion processes, the Economic Department of the Ministry of Finance in 1872 requested all local authorities to compile a list of barren areas that needed to be enclosed, preserved, and reforested [23]. The creation of the Barren Land Cadastre is considered the first attempt to record erosion processes in Serbia. Although the Cadastre was not yet completed by 1901, the Forestry Department of the Ministry of National Economy, based on the work done up to that point, prohibited using over 30,000 hectares of barren land Šaekićand thinned forests [34].
The Forest Law of 1929 stipulated that the Barren Land Cadastre be completed by 1940. The team completed most of the fieldwork by the deadline, but all collected materials were lost during World War II [34].
In the post-war period, anti-erosion efforts focused on managing torrents that disrupted rail and road traffic, shifting attention from the Barren Land Cadastre to creating the Torrent Cadastre. Work on this Cadastre began in 1950, with the forestry service and the Institute for Water Management of the People’s Republic of Serbia jointly conducting the survey [12]. When the first survey results were published (1955), the process was still ongoing, with plans for annual, successive updates. Table 1 shows the results of the organized data collected up to that point.
Preliminary results showed that erosion affected nearly 67% of forests and forest lands and 33% of agricultural land, rendering approximately 10,000 hectares unfit for agricultural production each year due to its destructive effects [17].
3.2.1. Weaknesses of the Initial Torrent Cadastres
In 1955, as awareness of the scale and severity of erosion processes in PR Serbia grew, the Academic Council of the FPR Yugoslavia initiated the “First Conference on the Scientific Basis of Erosion Control” in Belgrade, with a strong focus on creating Torrent Cadastres [35,36].
Following this, experts developed numerous torrent cadastres across the FPR and later SFR Yugoslavia, covering entire basins and even some republics (e.g., SR Montenegro). However, these cadastres exhibited significant shortcomings due to heterogeneity, subjectivity among field teams, and the varying interests of the organizations involved. Scientifically, the crucial flaw lay in the imprecise definition of what constituted a torrent and the insufficiently objective criteria for its classification, which allowed for differing interpretations, leading to unreliable results [35].
Experts established an inter-republic commission to clarify the definition of a torrent. Since many streams lacked flow monitoring data to determine water regimes, researchers identified torrents primarily through local population surveys and assessments of erosion status within catchments and streambeds. The inter-republic commission concluded that a torrent catchment must be affected by erosion processes of at least Category I, II, or, less frequently, III intensity, as per Prof. Gavrilović’s classification [10]. If a catchment was subject to severe erosion, it was assumed to have a torrent regime, regardless of streambed conditions or sediment amounts. Ultimately, the commission determined that previous failures in forming reliable torrent cadastres stemmed from the lack of foundational data to provide the basic parameters for their creation. Thus, they agreed that developing an Erosion Map was a prerequisite for producing a representative Torrent Cadastre [35].
Additionally, they concluded that the Erosion Map would have invaluable professional significance, serving as a primary resource for future planning and construction of various water management, hydroelectric, and land improvement systems, as well as infrastructure projects like roads, urban areas, industrial facilities, and more [37,38].
3.3. Creation of the First Erosion Map of the Socialist Republic of Serbia (1966-1971)
In 1966, the Institute for Forestry and Wood Industry of SR Serbia [39,40] began creating the first erosion map of the Republic of Serbia, completing it in the spring of 1971.
The Department of Erosion and Reclamation was established within the institute a year before researching fundamental issues in erosion and participating in the work on the map [41]. They conducted field mapping using topographic maps at a scale of 1:100,000, processing the data on maps at a scale of 1:50,000, and presented the final version in 1971 on a map with a scale of 1:200,000. A single field team completed the four-year fieldwork to minimize subjective factors and potential errors [42]. Over the following decade and additional field research, they modified the map, and the Institute for Forestry and Wood Industry in Belgrade published it in 1983.
3.3.1. The Erosion Potential Method
Researchers used two methods for mapping erosion phenomena: qualitative and quantitative. While the first group produced maps for entire countries or parts of them, including the USA, USSR, Bulgaria, Hungary, Czechoslovakia, and others, the second group, based on dimensioned parameters, was less commonly used and mainly applied to smaller areas [5]. However, the advantage of quantitative methods is evident as they display both the quality of the phenomenon and the amount of soil loss per unit area per year. Therefore, researchers created the first erosion map of SR Serbia using the quantitative Erosion Potential Method (EPM), also known as the Gavrilović Method [43] (Figure 2).
This method resulted from research in 1954 under Professor Slobodan Gavrilović at the “Jaroslav Černi” Institute for Water Management [43]. Developed for application across the entire territory of the SFR Yugoslavia, the method had to accommodate all climatic variations in the area [10,44]. Thus, sample catchments were established in several regions of Yugoslavia, differing by parameters such as climate, geology, soil, terrain, and visible erosion processes [45]. In addition to erosion, researchers at hydrometric profiles in these sample catchments observed water runoff and sediment transport. After years of measurements on torrential streams of the Southern, Western, and Great Morava Rivers, the Ibar, Timok, and Vardar Rivers, erosion sediment characteristics were determined [10,45]. Simultaneously, researchers of the “Jaroslav Černi” Institute developed original experimental equipment to help them study erosion intensity under controlled laboratory conditions. They conducted experiments on different soil types, “bombarded” with the rain of varying intensities, drop sizes, and under different temperatures [45]. Simultaneously, researchers of the Department of Erosion and Reclamation laboratory at the Faculty of Forestry tested erosion intensity on undisturbed samples [16,43].
These field and laboratory studies enabled the creation of the EPM, which quickly became a standard method and tool for all engineering challenges related to erosion and torrents, including preparing technical documentation, water management foundations, and studies [46].
The initial version of the method included the following modules:
- Quantitative erosion classification (1954);
- Quantitative sediment regime (1955);
- Torrent classification (1956);
- Optimization of methods for calculating the volume of anti-erosion works (1958) [10].
- The method was further refined with new modules:
- EPM Phase I (1966);
- EPM Phase II (1968);
- EPM Phase III (1986);
- Erosion area identification (1998);
- Method for active flood control on unmanaged watercourses (1998);
Since erosion is a spatial phenomenon, it is represented on a map according to a classification based on an analytically calculated erosion coefficient (Z), which depends not on climatic characteristics but on the characteristics of the soil, vegetation cover, terrain, and the visibility of erosion processes. The erosion coefficient (Z) is obtained from the following expression [10,44]:
Z – Erosion coefficient
Y – soil erodibility coefficient (soil resistance to erosion)
X.a – Catchment area management coefficient
φ – Numerical equivalent of visible and clearly expressed erosion processes
Imean – the mean slope of the investigated catchment area [m/m]
Wyear – Total production of erosion material in the catchment area [m3∙year−1]
T – Temperature coefficient of the area
Hyear – Mean annual precipitation [mm]
π – Ludolph’s number (Archimedes’ constant) – 3.14159
Z – Erosion coefficient
A – Catchment area [km²]
Prof. Gavrilović categorized erosion processes according to the erosion coefficient Z. The values typically range from 0.1 to 1.5 or higher, indicating a spectrum from well-preserved catchment areas minimally affected by erosion to those extremely degraded due to soil erosion. Z values can fall outside these limits only in exceptional cases [10]. Based on the dominant erosion type and the erosion coefficient Z values, 13 categories are determined (Table 2).
3.3.1.1. Soil Resistance to Erosion Coefficient (Y)
The coefficient Y represents the reciprocal value of the soil’s resistance to erosion and depends on the geological substrate, climate, and pedological characteristics (Table 3).
Researchers at the Department of Erosion and Reclamation Laboratory at the Faculty of Forestry in Belgrade dimensioned the values of the coefficient Y. These values refer to the reciprocal resistance of soil formations and rocks to the effect of “soil bombardment by raindrops” and their resistance to the removal of soil particles by flowing water and aeolian erosion [10,44,47].
3.3.1.2. Catchment Area Management Coefficient (X∙a)
The catchment area management coefficient refers to the protection of soil from atmospheric influences in natural conditions (vegetation) (coefficient X) or artificially created conditions, i.e., the application of anti-erosion technical, biotechnical, and biological works on the catchment area or erosion area (coefficient a). These are two coefficients, and their product ranges from 0.01 for protected soil to 1.0 for completely bare, unprotected, and unmanaged land (Table 4).
3.3.1.3. Visible and Clearly Expressed Erosion Processes Coefficient (ϕ)
The coefficient ϕ represents the numerical equivalent of visible and clearly expressed erosion processes in a catchment area or region (Table 5).
According to the original version of the EPM [10], the coefficient ϕ is determined directly in the field. This parameter is the only one in the EPM with a subjective component, which is why some authors [48] classify it as a semi-quantitative indicator. To overcome this drawback, some authors have determined the value of ϕ using multispectral satellite imagery and specific spectral channels obtained through remote sensing [49,50,51].
3.3.1.4. Mean Slope of the Terrain in a Catchment Area
The mean slope of the terrain reflects the impact of topographical characteristics, determined by using the square root of the mean catchment slope, i.e., the erosion area or soil parcel. A correctly generated erosion map and the representative value of the erosion coefficient form the basis for further calculations of erosion production, transport, and sediment structure [44].
3.3.2. Lazarević’s Modification of the Erosion Potential Method
During his work on the Erosion Map, Professor Lazarević introduced certain modifications to Gavrilović’s method. The most significant changes were related to calculating the erosion coefficient Z, with the observation that the most reliable value of the mean slope can be determined from a topographic map.
Table 6 shows the value of the erosion coefficient Z, according to Lazarević, which increases the number of categories based on the values of the erosion coefficients to 12, including a new category — sediment accumulation. The following tables present the input parameter coefficient values according to the original method’s modified version [44].
3.3.2.1. Soil Erodibility Coefficient (Y)
Lazarević classifies the values of the Y coefficient into seven categories (Table 7).
The first two categories relate to the skeletal content of the soil, while the remaining five focus on the geological substrate. In contrast, Gavrilović (Table 4) analyzes soil type and geological substrate together within the same category. One critique of this classification is the qualification of sands as a more resistant type of rock compared to “soil” (without further elaboration on which types and conditions of soil) since the previous measurements have produced opposite results [44,52].
3.3.2.2. Catchment Area Management Coefficient (X∙a)
3.3.2.3. Visible and Clearly Expressed Erosion Process Coefficient (X∙a)
The values of the ϕ coefficient according to Lazarević (Table 9) and the original values from Gavrilović (Table 5) are divided into six and ten categories, respectively.
The original intent of this coefficient was related to the percentage of eroded surfaces, expressed by a maximum coefficient value of 1 (100%). In Lazarević’s approach, this coefficient’s values increase to 1.5. Moreover, Lazarević introduces a new “erosion category” with a coefficient value of 0 for accumulation areas (e.g., alluvial plains) where sediment deposition occurs, which aligns with the geographic perception of geomorphological processes. This interpretation does not consider that deposited sediment continues downstream with the first occurrence of large waters, and alluvial plains can also be viewed as sources of erosion material. Some authors argue that this modification of the EPM with the ϕ coefficient inadequately addresses the erosion and sediment transport process “since sediment accumulation in alluvial valleys is only a temporary phase in sediment transport from the source to the mouth” [44,52].
3.4. Application of GIS Technologies in Creating the Erosion Map of Serbia (2020)
In contrast to the traditional approach, which relied on field-based cartography, modern methods employ Geographic Information System (GIS) technologies. GIS enables the representation of real spatial environments in digital form, specifically through data-bases designed for computer processing. One of the numerous advantages of GIS is its ability to extract relevant information about the complex relationships among factors involved in dynamic spatial processes. It allows proper systematization, analysis, and visualization of all relevant spatial data [44,53].
This modern approach to creating erosion maps was applied in 2020 during the development of the “Draft Spatial Plan of the Republic of Serbia (2021–2035),” specifically in the thematic booklet titled “Emergencies, Natural Disasters (Protection and Safety of People and Property—Erosion, Floods, Landslides, Earthquakes, War Destruction, and Technological Accidents)” (Figure 3).
The basis for the erosion map was the original method by Professor Slobodan Gavrilović – EPM, without the modifications introduced by Lazarević. Over the decades since the creation of the first erosion map, Gavrilović’s EPM has become the most commonly used quantitative model in Serbia and the former Yugoslavia. With some modifications, it has also been applied in several European countries and globally. Numerous studies have confirmed the scientific verification of the EPM model [54]. Research on eleven selected methods and models for assessing soil erosion has characterized the EPM model as the most quantitative among all regional models discussed [48,55]. In contrast to the acceptance of Gavrilović’s method on regional and global levels, evidenced by the number of scientific papers and projects in which it has been used, Lazarević’s modifications have not found broader application in the scientific community or engineering design practice. Also, Lazarević’s modifications have never been used in new remote sensing methods and machine learning algorithms applied to scientific and technical aspects of the original EPM [44].
Since the logic of EPM is based on forming relatively homogeneous spatial units in the study area, catchment area, or erosion parcel, for which the erosion coefficient Z is determined, the representative value of the erosion coefficient is the weighted arithmetic mean of the selected units. This approach aligns with the logic of GIS, where the basic unit of the two-dimensional space is the pixel, in Gavrilović’s approach, corresponds to the primary examined entity [44,56]. Based on this relationship, Gavrilović’s algorithm can be applied to an elementary surface (pixel) and a set of pixels, i.e., a raster [44,56,57,58]. This way, a corresponding data-base is created, and a digital map is generated, carrying information at the pixel and raster levels. Therefore, specific “themes” in raster format represent components of the formula used to calculate the erosion coefficient Z, which, through raster algebra, explicitly influences the spatial distribution of Z [44,59]
Due to the dynamics of developing the Spatial Plan, short timeframes, limited financial resources, incomplete data-bases, and the need to create an erosion map that would similarly treat the entire territory of the Republic of Serbia, the team utilized available global and regional data-bases. It conducted the land cover inventory using the 2018 Corine Land Cover data-base [60], obtained information on soil characteristics from the European Soil Data-base [61], with a scale of 1:1,000,000 and used the SRTM (Shuttle Radar Topography Mission) 2021 Digital Elevation Model (DEM) for the analysis of topographic parameters. The resolution of the digital elevation model is three arc seconds in geographic projection (WGS84 datum), approximately corresponding to 90x60 meters in the projected Gauss-Krüger Mercator projection. Given that input data had varying spatial resolutions (from 90 to 500 meters), homogenization was ensured by applying interpolation methods to the output resolution of 500 meters to minimize loss of detail. This method of homogenizing datasets is standard and has been applied in similar research in the European Union. For instance, researchers from the Joint Research Centre (JRC) have used the RUSLE2015 method with quantified and verified input data with varying spatial resolutions (ranging from 25 to 1000 meters) [44,62].
3.4.1. The Comparison Between 1983 and 2020 Erosion Maps
The comparison of spatial and quantitative parameters between the erosion maps created using the original version of the EPM (2020) and the modified method by Lazarević (1983) reveals significant differences. Between 1983 and 2020, changes occurred in the areas covered by different erosion categories. They can be attributed to demographic and socio-economic shifts over nearly half a century, which have influenced the intensity of mechanical water erosion and changes in land use patterns. Additionally, advancements in the use of Geographic Information Systems (GIS) over this period have significantly increased the accuracy of erosion mapping [44].
The updated erosion maps mirror the shift in methodology from a traditional approach (Lazarević’s modification) to the modern GIS-based method (Gavrilović’s original EPM) and reflect technological improvements and changes in land use, conservation practices, and environmental awareness.
Table 10. compares the erosion conditions shown on the 1983 map created using Lazarević’s
modified EPM and the 2020 map created using the original EPM. It reflects the differences in the intensity and distribution of erosion across Serbia during these two periods and how socio-economic,
demographic, and technological advancements have contributed to changes in erosion patterns. The differences in erosion classification between the two maps can be attributed to improvements in data
quality, mapping techniques (such as GIS), and changing land-use practices and environmental factors over nearly four decades.
Only the modified EPM recognizes Sediment Accumulation as a category. Since the 2020 erosion map was created based on the original EPM, this category was not identified [44].
4. Conclusion
Socio-political and economic circumstances influenced the high intensity of deforestation during the 19th century, which resulted in the activation of erosion processes, flash floods, and slow anti-erosion actions. A basis for precisely recording the intensity and distribution of erosion processes is necessary to organize this successfully. The first attempt at this, a decision to create a Bare Land Cadastre, was made in 1872 but was not realized even nearly 70 years later, and during World War II, all collected data were destroyed. The exact circumstances, political instability, and financial scarcity affected the spontaneous execution of anti-erosion works and the focus on quick and short-term solutions. Relying almost exclusively on construction-technical works and sidelining biological works, whose effects are much slower, resulted in abandoning the creation of the Bare Land Cadastre and redirecting attention to the creation of the Flood Cadastre.
During the 1950s, the anti-erosion field had significant scientific and infrastructural development. During this period, many flood cadastres were created, ranging from the national to the local government level; however, their analysis showed subjectivity and insufficient precision. Experts of the inter-republic commission decided to implement a significant project to create the first Erosion Map of SR Serbia, which lasted from 1966 to 1971, and some additional modifications until its final publication in 1983. The foundation was based on the quantitative method of Prof. Slobodan Gavrilović – EPM, which underwent modifications by Prof. Radenko Lazarović, who led the project.
The credibility and objectivity of the Erosion Map of SR Serbia depend on the stability of variable parameters, primarily the land use method. The 1983 erosion map fixed the field conditions that, with minor oscillations, persisted from the 1930s until the map’s creation. Therefore, it is a representation of that period. However, given the turbulent social and economic dynamics that are continuously occurring, it becomes outdated and represents the past state.
The technological and informational advances of recent decades have left a mark on numerous disciplines that address space as a physical dimension, including the issue of mapping erosion processes. In earlier periods, spatial data processing was predominantly based on analog maps and field research, while in the modern context, mapping erosion processes rely on computer technology and remote sensing. This approach led to the creation of the 2020 Erosion Map, developed for the needs of the “Draft Spatial Plan of the Republic of Serbia (2021-2035),” specifically the annex (thematic volume) titled: “Emergencies, Natural Disasters (Protection and Safety of People and Goods – Erosion, Floods and Flash Floods, Earthquakes, War Destruction) and Technological Accidents.” The original version of the EPM (according to Prof. Slobodan Gavrilović) has been globally applied in creating complex models, scientific research activities, and national engineering practices in recent decades. Therefore, the spatial and quantitative parameters of the erosion map were created using the original version of the EPM, along with the application of modern models.
References
- European Commission, 2006. Thematic strategy for soil protection. Available online: https://eur-lex.europa.eu/EN/legal-content/summary/thematic-strategy-for-soil-protection.html (accessed on 3 December 2024).
- Commission of the European Communities, 2006. Proposal for a directive of the European Parliament and the Council establishing a framework for the protection of soil and amending Directive 2004/35/EC. Available online: https://eur-lex.europa.eu/legal-content/EN/TXT/?uri=CELEX:52006PC0232 (accessed on 3 December 2024).
- fao.org. Available online: https://fao.org/about/meetings/soil-erosion-symposium/key-messages/en (accessed on 3 December 2024).
- news.un.org. Available online: https://news.un.org/en/story/2019/12/1052831 (accessed on 3 December 2024).
- Hegde, R.; Natarajan, R.; Naidu, L.G.K.; Sarkar, D. Soil Degradation (ed. Danilo Godone and Silvia Atanchi) Soil Erosion Issues in Agriculture. 2011. InTech, Rijeka, Croatia.
- Grčić, M. Geography of Cultures and Civilizations. 2014. University of Belgrade – Faculty of Geography. Belgrade. Serbia (in Serbian).
- Pimentel, D. 2006. Soil erosion: A food and environmental threat. Environ. Dev. Sustain. 2006, 8, 119–137. [Google Scholar] [CrossRef]
- Shikangalah, R.N.; Jeltsch, F.; Blaum, N.; Mueller, E.N. A review on urban soil water erosion. J. Stud. Soc. Sci. Humanit. 2016, 5, 163–178. [Google Scholar]
- Polovina, S.; Radić, B.; Ristić, R.; Kovačević, J.; Milčanović, V.; Živanović, N. Soil Erosion Assessment and Prediction in Urban Landscapes: A New G2 Model Approach. Appl. Sci. 2021, 11, 4154. [Google Scholar] [CrossRef]
- Gavrilović, S. , Engineering of torrential flows and erosion, Izgradnja journal, special edition, Belgrade, Serbia, 1972. (in Serbian).
- Ristić, R.; Radić, B.; Nikić, Z.; Trivan, G.; Vasiljević, N.; Dragičević, S.; Živković, N.; Radosavljević, Z. Erosion Control and Protection from Torrential Floods in Serbia – Spatial Aspects. Spatium 2011, 25, 1–6. [Google Scholar] [CrossRef]
- Ristić, R.; Kostadinov, S.; Abolmasov, B.; Dragičević, S.; Trivan, G.; Radić, B.; Trifunović, M.; Radosavljević, Z. Torrential Floods and Town and Country Planning in Serbia. Nat. Hazards Earth Syst. Sci. 2012, 12, 23–35. [Google Scholar] [CrossRef]
- Petrović, A.; Kostadinov, S.; Dragićević, S. The Inventory and Characterization of Torrential Flood Phenomenon in Serbia. Pol. J. Environ. Stud. 2014, 23, 823–830. [Google Scholar]
- IWRMJČ (Institute for Water Resources Management “Jaroslav Černi”) Water Resources Management Basic Plan of Serbia, Ministry of Agriculture, Forestry and Water Resources Management, 2001. Belgrade, Serbia.
- Ristić, R.; Kostadinov, S.; Radić, B.; Trivan, G.; Nikić, Z. Torrential Floods in Serbia – Man-Made and Natural Hazards. In Proceedings of the 12th Congress INTERPRAEVENT, Grenoble, France (23-26 April 2012). [Google Scholar]
- Kostadinov, S. Erosion and torrent control in Serbia: a hundred years of experience. In Proceedings of the International Conference: Erosion and Torrent Control as a Factor in Sustainable River Basin Management, Faculty of Forestry, Belgrade, Serbia (25-28 September 2007). [Google Scholar]
- Đekić, R. Soil erosion in Serbia as an economic-social problem. In Scientific foundations of the combat against erosion. First conference. Kolarac People’s University, Publishing Department, Belgrade, Yugoslavia, 1955, pp. 63-96. (in Serbian).
- Petrović, D. The distribution of torrents and erosion in the People’s Republic of Serbia. In Scientific foundations of the combat against erosion. First conference. Kolarac People’s University, Publishing Department, Belgrade, Yugoslavia, 1955, pp. 281-288. (in Serbian).
- Malušević, I. Deforestation and land degradation after the restoration of Serbian statehood in the 19th century. Erozija. 2023, 49, 61–77. (in Serbian). [Google Scholar]
- Kallay, B. History of the Serbs. Bookseller and Publisher Petar Ćurčić, Printed at the State Printing House, Belgrade, Serbia, 1882 (in Serbian).
- Šarkić, S. Can We Talk of Environmental Protection in Medieval Serbia? Proceedings of the Faculty of Law. 2014, 18, 45–52. (in Serbian). [Google Scholar]
- Krstić, O. The State and Prospective Development of Agriculture in the Grdelica Gorge and Vranje Valley. Institute of Agricultural Economics. Belgrade, Yugoslavia, 1958 (in Serbian).
- Stojanović, Lj. Development of Forestry Practices and Theories. In Forestry and Wood Processing in Serbia Through the Ages (ed. Sreten Nikolić, Ana Tonić), Association of Engineers and Technicians of Forestry and Wood Industry of Serbia, Belgrade. 1992, pp.42-47 (in Serbian).
- Nikolajević, S. Lady Montagu about Serbia. Fatherland, Literature, Science, Social Life. 1875, 1, 276–296. (in Serbian). [Google Scholar]
- Ćorović, V. History of the Serbs. BIGZ. Belgrade, Yugoslavia, 1989 (in Serbian).
- Kućančanin, S.; Rokvić, V.; Martinović, S. Hunting Through the Centuries In Forestry and Wood Processing in Serbia Through the Ages (ed. Sreten Nikolić, Ana Tonić), Association of Engineers and Technicians of Forestry and Wood Industry of Serbia, Belgrade. 1992, pp. 121-138 (in Serbian).
- Simeunović, D. Causes of Forest Disappearance in Serbia in the 19th century. Cooperative Books, Belgrade, Yugoslavia, 1957 (in Serbian).
- Palairet, M. The Balkan economies c. 1800-1914. Cambridge University Press, UK, 1997. ISBN: 9780521580519.
- Jevtić, Lj.; Kostadinov, S.; Zlatić, M.; Vučićević, D.; Milojević, V. Torrent management and erosion control In Forestry and Wood Processing in Serbia Through the Ages (ed. Sreten Nikolić, Ana Tonić), Association of Engineers and Technicians of Forestry and Wood Industry of Serbia, Belgrade. 1992, pp. 245-270 (in Serbian).
- Samardžić, M.; Bešlin, M. Deforestation of the Principality of Serbia, 1830-1878: Overview. Geogr. Pannon., 2017, 21, 1–8. [Google Scholar] [CrossRef]
- Ristić, R.; Milčanović, V.; Malušević, I.; Polovina, S. Torrential Floods and Erosion as Dominant Factors of Land Degradation in Serbia – Prevention and Protection Concept. In Degradation and Protection of Soil. University of Belgrade - Faculty of Forestry, Belgrade, Serbia, 2016. ISBN 978-86-7299-242-7. (in Serbian).
- Nikolić, D.; Rakočević, V. Legislation in the field of forestry. In Forestry and Wood Processing in Serbia Through the Ages (ed. Sreten Nikolić, Ana Tonić), Association of Engineers and Technicians of Forestry and Wood Industry of Serbia, Belgrade. 1992, pp.159-181. (in Serbian).
- Kralj, M. The consequences of deforestation in the second half of the 19th century. Matica Srp. J. Hist. 2019, 100, 43–55. (in Serbian). [Google Scholar]
- Dražić, M. 1992. Reforestation in Serbia. In Forestry and Wood Processing in Serbia Through the Ages (ed. Sreten Nikolić, Ana Tonić), Association of Engineers and Technicians of Forestry and Wood Industry of Serbia, Belgrade. 1992, pp.48-68 (in Ser-bian).
- Lazarević, R. Contribution to the discussion on the torrent cadastre and erosion mapping. Erosion, 1971, 2, 1–8, (in Serbi-an). [Google Scholar]
- Petković, V. On the 25th anniversary of soil erosion control in the Grdelica Gorge and Vranjska Valley. Erosion, 1978, 9, 95–105. (in Serbian). [Google Scholar]
- Lazarević, R. Report of the working group. Erosion, 1973, 4, 37–41. (in Serbian). [Google Scholar]
- Lazarević, R. VI professional excursion of Yugoslav experts for soil erosion control and torrent management. Erosion, 1974, 5, 43–51. (in Serbian). [Google Scholar]
- Lazarević, R. Soil Erosion Map of SR Serbia 1:500,000-Interpretation, Institute for Forestry and Wood Industry, Belgrade, Serbia, 1983. (in Serbian).
- Lazarević, R. A new procedure for determining erosion coefficients (Z). Erosion, 1985, 13, 53–60. (in Serbian). [Google Scholar]
- Milićević, S; Lazarević, R. Twenty years of the Erosion and Land Reclamation Department. Erosion, 1985, 13, 121–123. (in Serbian). [Google Scholar]
- Lazarević, R. Erosion in Serbia. Želnid, Belgrade, Serbia. 2009 (in Serbian).
- Lazarević, R. Scientific research work and problems in erosion and torrent management. Symposium on erosion problems in Serbia. Republic Chamber of Commerce of SFR Serbia, Department for Water Management, Torrent Management and Erosion Control, Institute for Forestry and Wood Industry, Belgrade, 1967 (in Serbian).
- Ristić, R.; Radić, B.; Polovina, S.; Nešković, P.; Malušević, I.; Milčanović, V. Modern and Traditional Approaches to Modeling Land Degradation Processes Caused by Water Erosion. In Assessment of Land Degradation – Methods and Models S. Belanović Simić (Ed.), University of Belgrade - Faculty of Forestry, Serbian Society for Soil Studies, Soil and Environment Commission, Belgrade, Serbia, 2022, pp.209-236 (in Serbian).
- Stefanović, M.; Gavrilović, Z.; Bajčetić, R. Local Communities and Challenges of Torrential Floods– Manual for local communities and civil Society organizations. Organization for Security and Cooperation in Europe, Mission to Serbia, 2014.
- Blinkov, I.; Kostadinov, S.; Marinov, I.T. Comparison of erosion and erosion control works in Macedonia, Serbia, and Bulgaria. Int. Soil Water Conserv. Res. 2013, 1, 15–28. [Google Scholar] [CrossRef]
- Gavrilović, S. Proposal for the classification of torrential flows to prepare the water management plan of Yugoslavia. "Jaroslav Černi" Belgrade, Serbia, 1968 (in Serbian).
- De Vente, J.; Poesen, J. Predicting Soil Erosion and Sediment Yield at the Basin Scale: Scale Issues and Semi-Quantitative Models. Earth. Sci. Rev. 2005, 71, 95–125. [Google Scholar] [CrossRef]
- Chaaouan, J.; Faleh, A.; Sadiki, A.; Mesrar, H. Télédétection, SIG et modélisation de l'érosion hydrique dans le bassin ver-sant de l'oued Amzaz, Rif Central. Rev. Francaise de Photogramm. et de Teledetection, 2013, 203, 19–25. [Google Scholar]
- Milevski, I. An approach of GIS based assessment of soil erosion rate on country level in the case of Macedonia. In Proceedings of the International Scientific Conference GEOBALCANICA, Skopje, Republic of Macedonia, 5-7 June 2015. [Google Scholar]
- Durlević, U.; Novković, I.; Samardžić, I.; Ćurić, V.; Batoćanin, N.; Valjarević, A.; Lukić, T. Multi-Hazard Susceptibility Assessment: Case Study – Municipality of Štrpce (Southern Serbia). Open Geosci 2021, 13, 1414–1431. [Google Scholar] [CrossRef]
- Gavrilović, Z. 1989. Application of the “Erosion Potential” method for determining the torrential flow degree as a basis for defining its danger and the scope of measures for protection from flash floods. In Proceedings of the Conference Flash floods-causes and consequences, JUSOP ’89, Kopaonik, Yugoslavia, 19-21 December 1989 (in Serbian).
- Polovina, S.; Radić, B.; Ristić, R.; Milčanović, V. Spatial and Temporal Analysis of Natural Resource Degradation in the Li-kodra River Catchment. Bull. Fac. For. 2016, 114, 169–188. (in Serbian). [Google Scholar] [CrossRef]
- Gocić, M.; Dragićević, S.; Radivojević, A.; Martić Bursać, N.; Stričević, Lj.; Đorđević, M. Changes in Soil Erosion Intensity Caused by Land Use and Demographic Changes in the Jablanica River Basin, Serbia. Agriculture. 2020, 10, 345. [Google Scholar] [CrossRef]
- Manojlović, S.; Sibinović, M.; Srejić, T.; Novković, I.; Milošević, M.V.; Gatarić, D.; Cerović, I.; Batoćanin, N. Factors Controlling the Change of Soil Erosion Intensity in Mountain Catchments in Serbia. Front. Environ. Sci. 2022, 10, 888901. [Google Scholar] [CrossRef]
- Mitasova, H.; Barton, M.; Ullah, I.; Hofierka, J.; Harmon, R.S. GIS-Based Soil Erosion Modeling. In Treatise on Geomorphology, Dr Michael P. Bishop (ed.), Elsevier Inc: Amsterdam, Netherlands, 2013; Volume 3, pp. 228–258. [CrossRef]
- Globevnik, L.; Holjević, D.; Petkovček, G.; Rubinić, J. Applicability of the Gavrilović method in erosion calculation using spatial data manipulation techniques, Erosion Prediction in Ungauged Basins: Integrating Methods and Techniques (Proceedings of symposium HS01 held during IUGO2003 at Sapporo, July 2003). IAHS Publ. 2003, 279, pp.224–233. [Google Scholar]
- Emmanouloudis, D.; Christou, O.; and Filippidis, E. Quantitative estimation of degradation in the Aliakmon river basin using GIS. Erosion Prediction in Ungauged Basins: Integrating Methods and Techniques (Proceedings of symposium HS01 held during IU-GO2003 at Sapporo, July 2003). IAHS Publ. 2003, 279, pp.234–240. [Google Scholar]
- Radić, B. Erosion as a Factor of Landscape Degradation in Ski Resorts of Serbia. Doctoral dissertation, Faculty of Forestry, University of Belgrade, 2014. COBBIS: 513342620 (in Serbian).
- European Environmental Agency, 2017. Updated CLC illustrated nomenclature guidelines, Vienna, Austria. Available at: https://land.copernicus.eu/content/corine-land-cover-nomenclature-guidelines/docs/pdf/CLC2018_Nomenclature_illustrated_guide_20190510.pdf. (accessed on 3 December 2024).
- Joint Research Centre, European Soil Data Centre (ESDAC). European Soil Database v2.0. (vector and attribute data) Available at: https://esdac.jrc.ec.europa.eu/content/european-soil-database-v20-vector-and-attribute-data. (accessed on 3 December 2024).
- Panagos, P.; Borrelli, P.; Poesen, J.; Ballabio, C.; Lugato, E.; Meusburger, K; Montanarella, L. ; Alewell, C. The new assessment of soil loss by water erosion in Europe. Environ. Sci. Policy 2015, 54, 438–447, European Commission, 2006. Thematic strategy for soil protection. Available online: https://eur-lex.europa.eu/EN/legal-content/summary/thematic-strategy-for-soil-protection.html (accessed on 3 December 2024). [CrossRef]
Figure 1.
Position and topography of the Republic of Serbia.
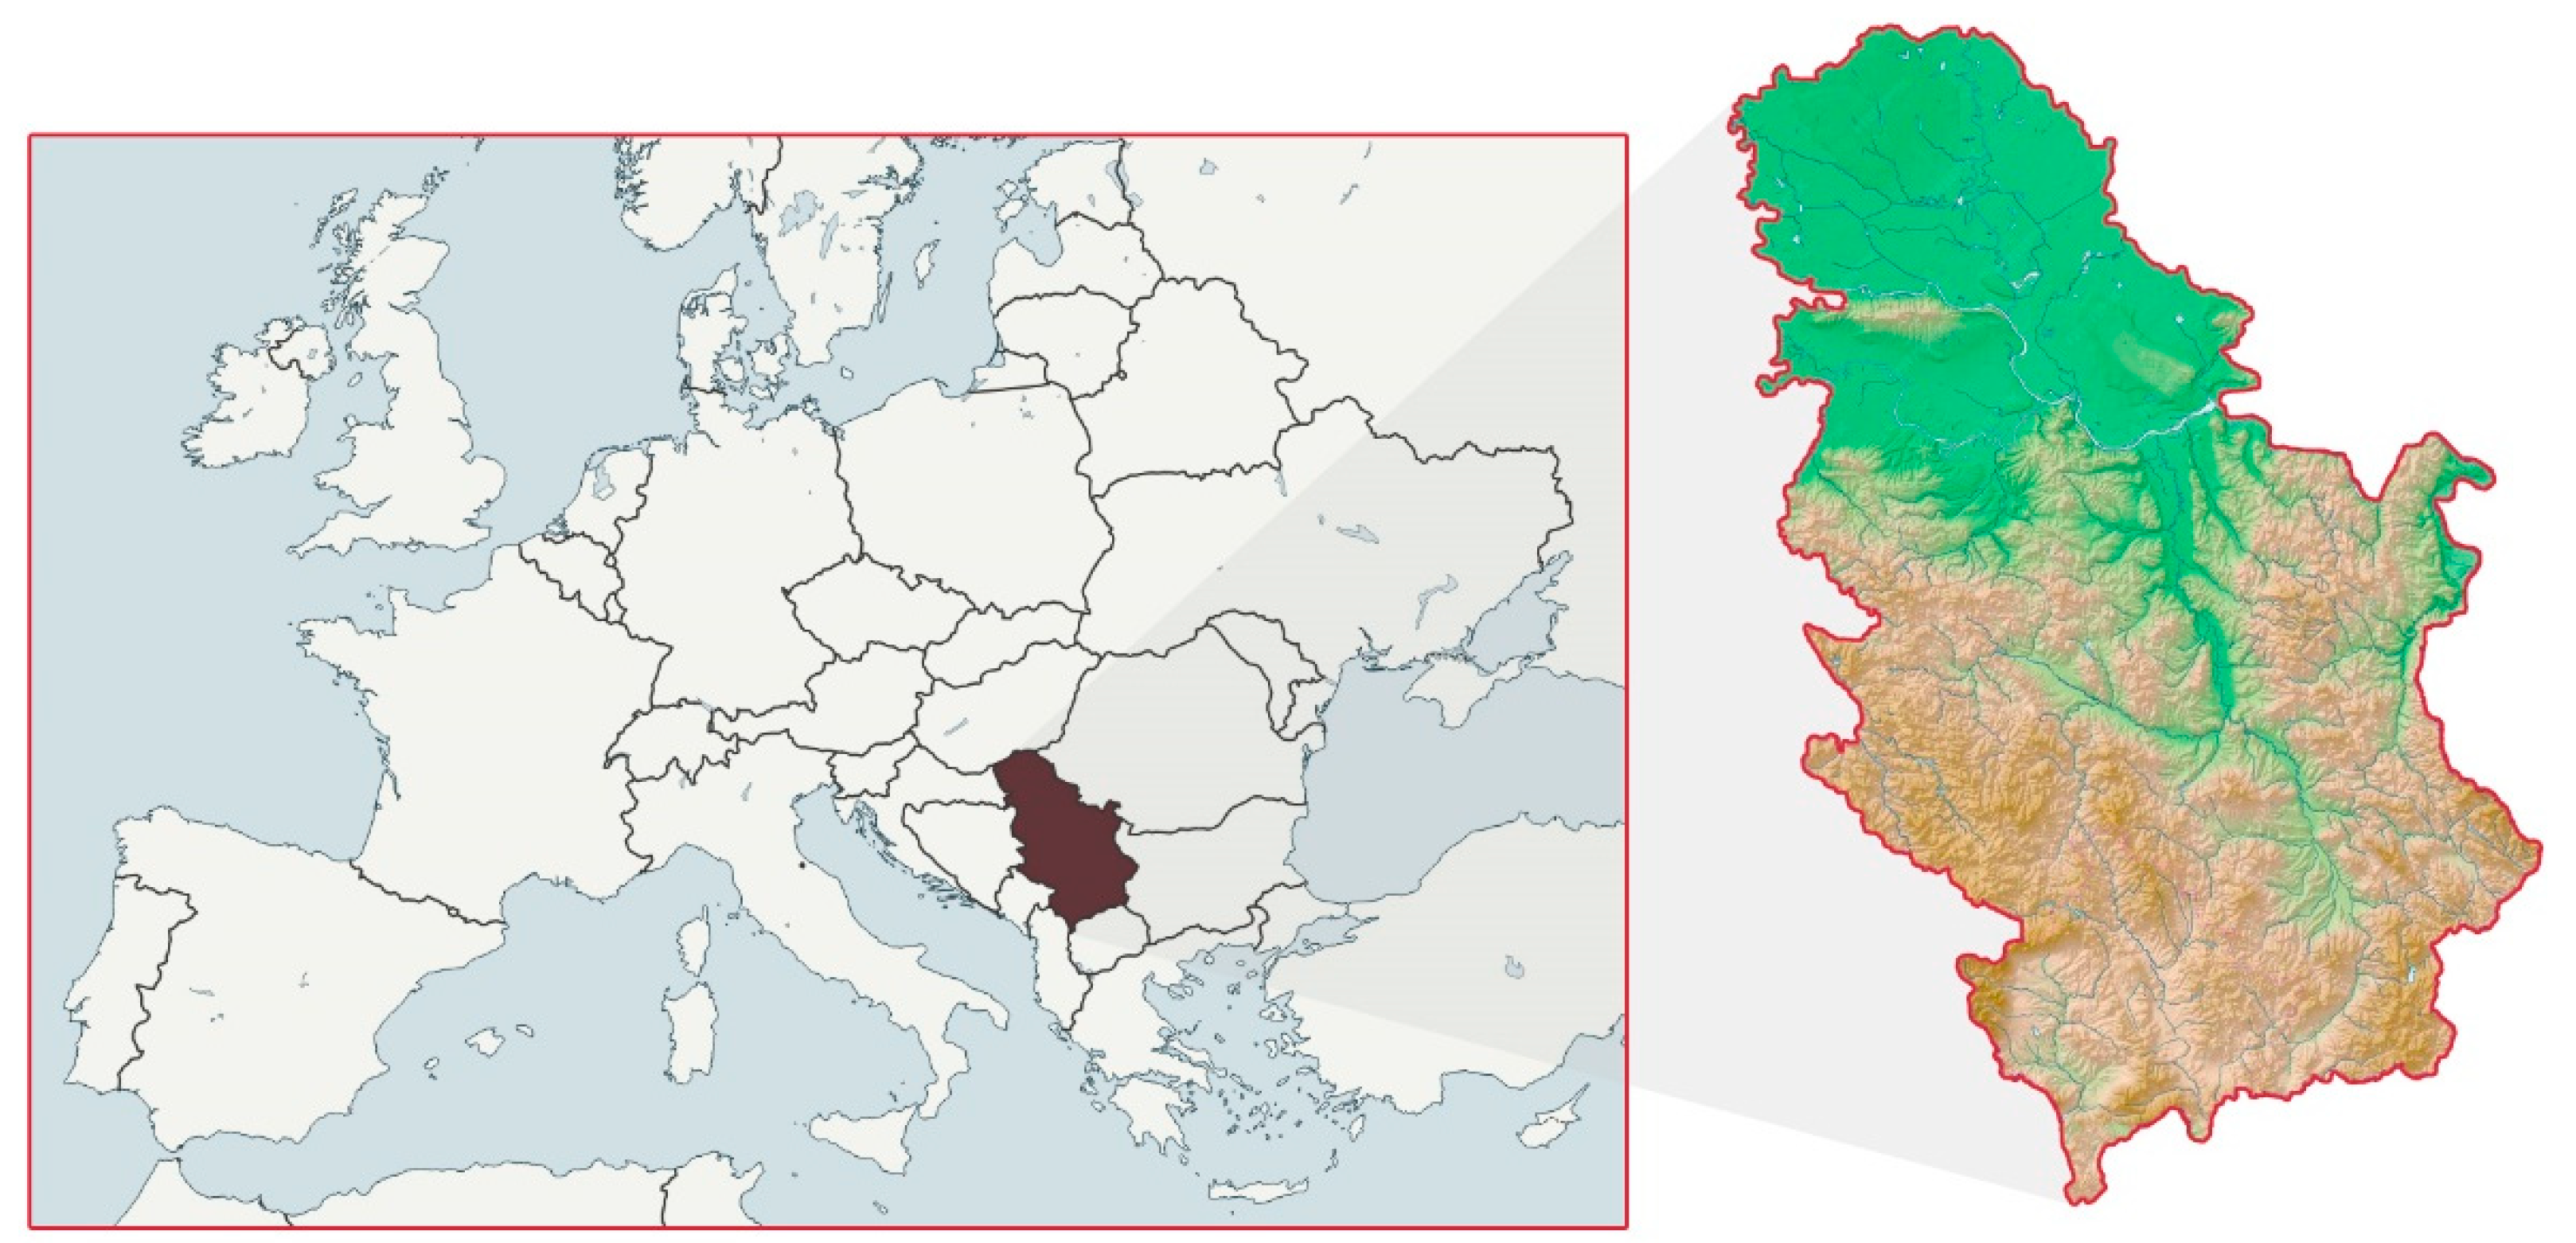
Figure 2.
Erosion Map of the Republic of Serbia from 1983, using the EPM modified by Lazarević (Ristić et al., 2022).
Figure 2.
Erosion Map of the Republic of Serbia from 1983, using the EPM modified by Lazarević (Ristić et al., 2022).
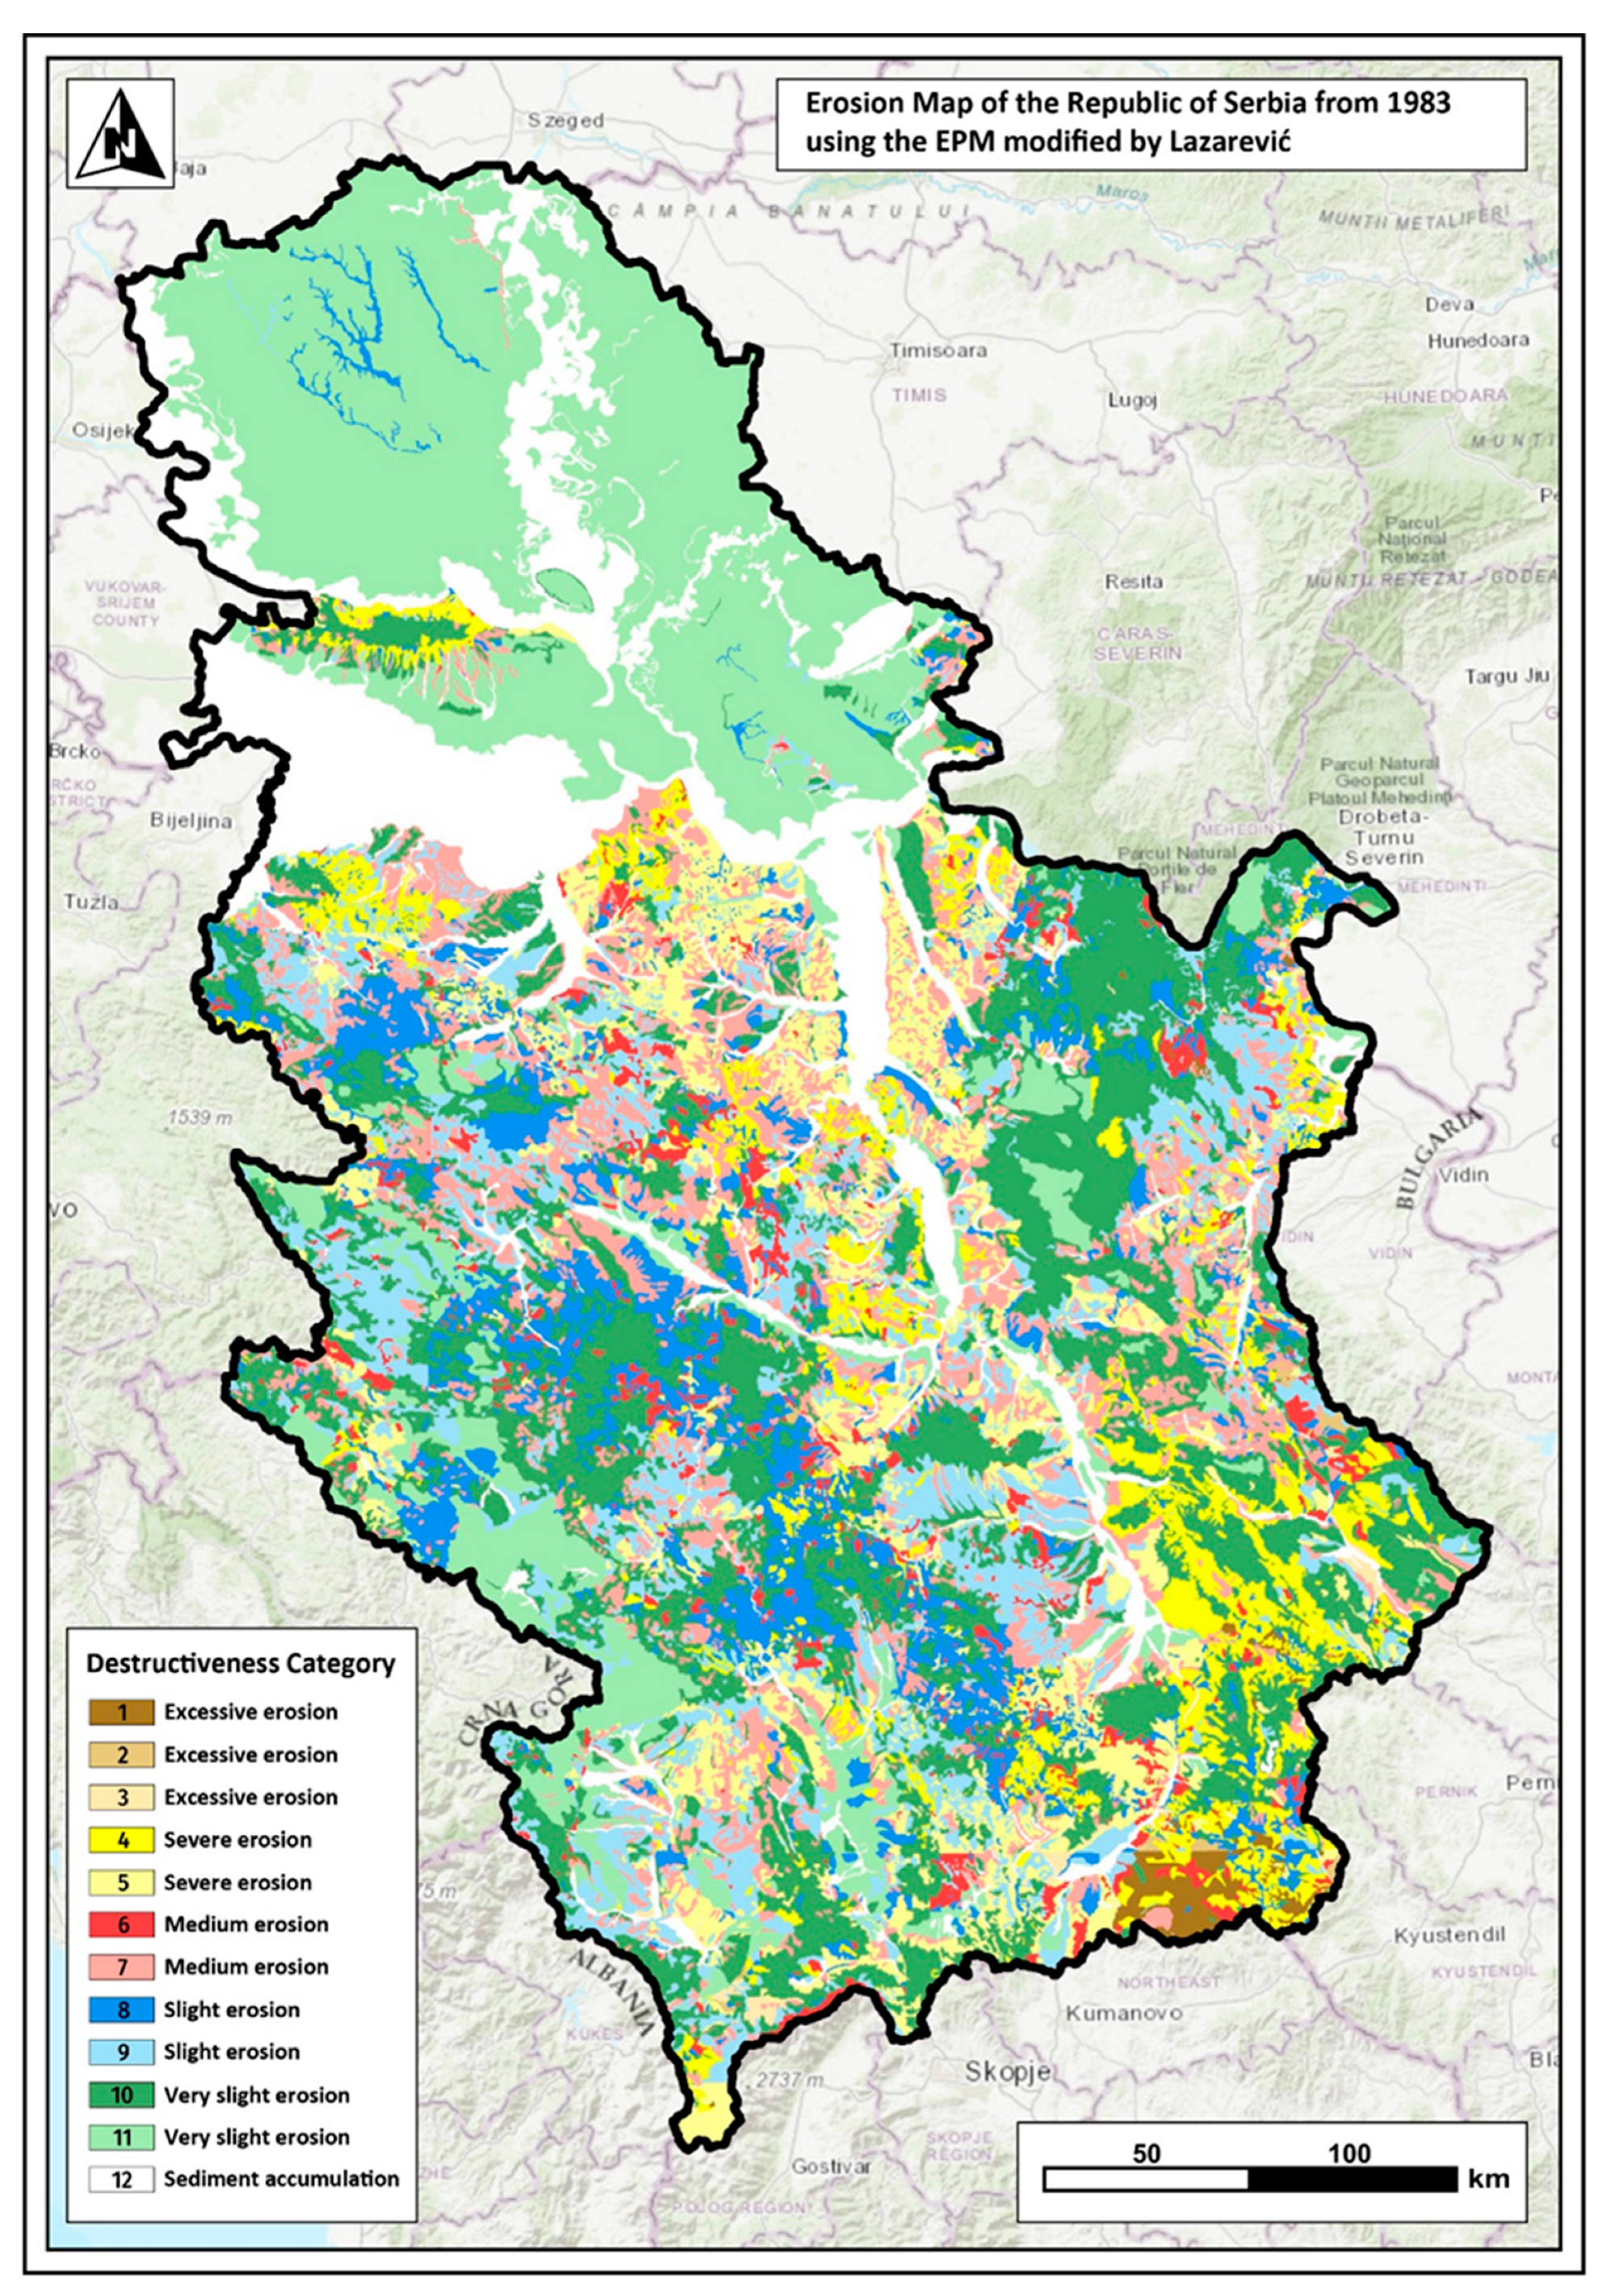
Figure 3.
Erosion Map of the Republic of Serbia from 2020, using the original EPM by Gavrilović (Ristić et al., 2022).
Figure 3.
Erosion Map of the Republic of Serbia from 2020, using the original EPM by Gavrilović (Ristić et al., 2022).
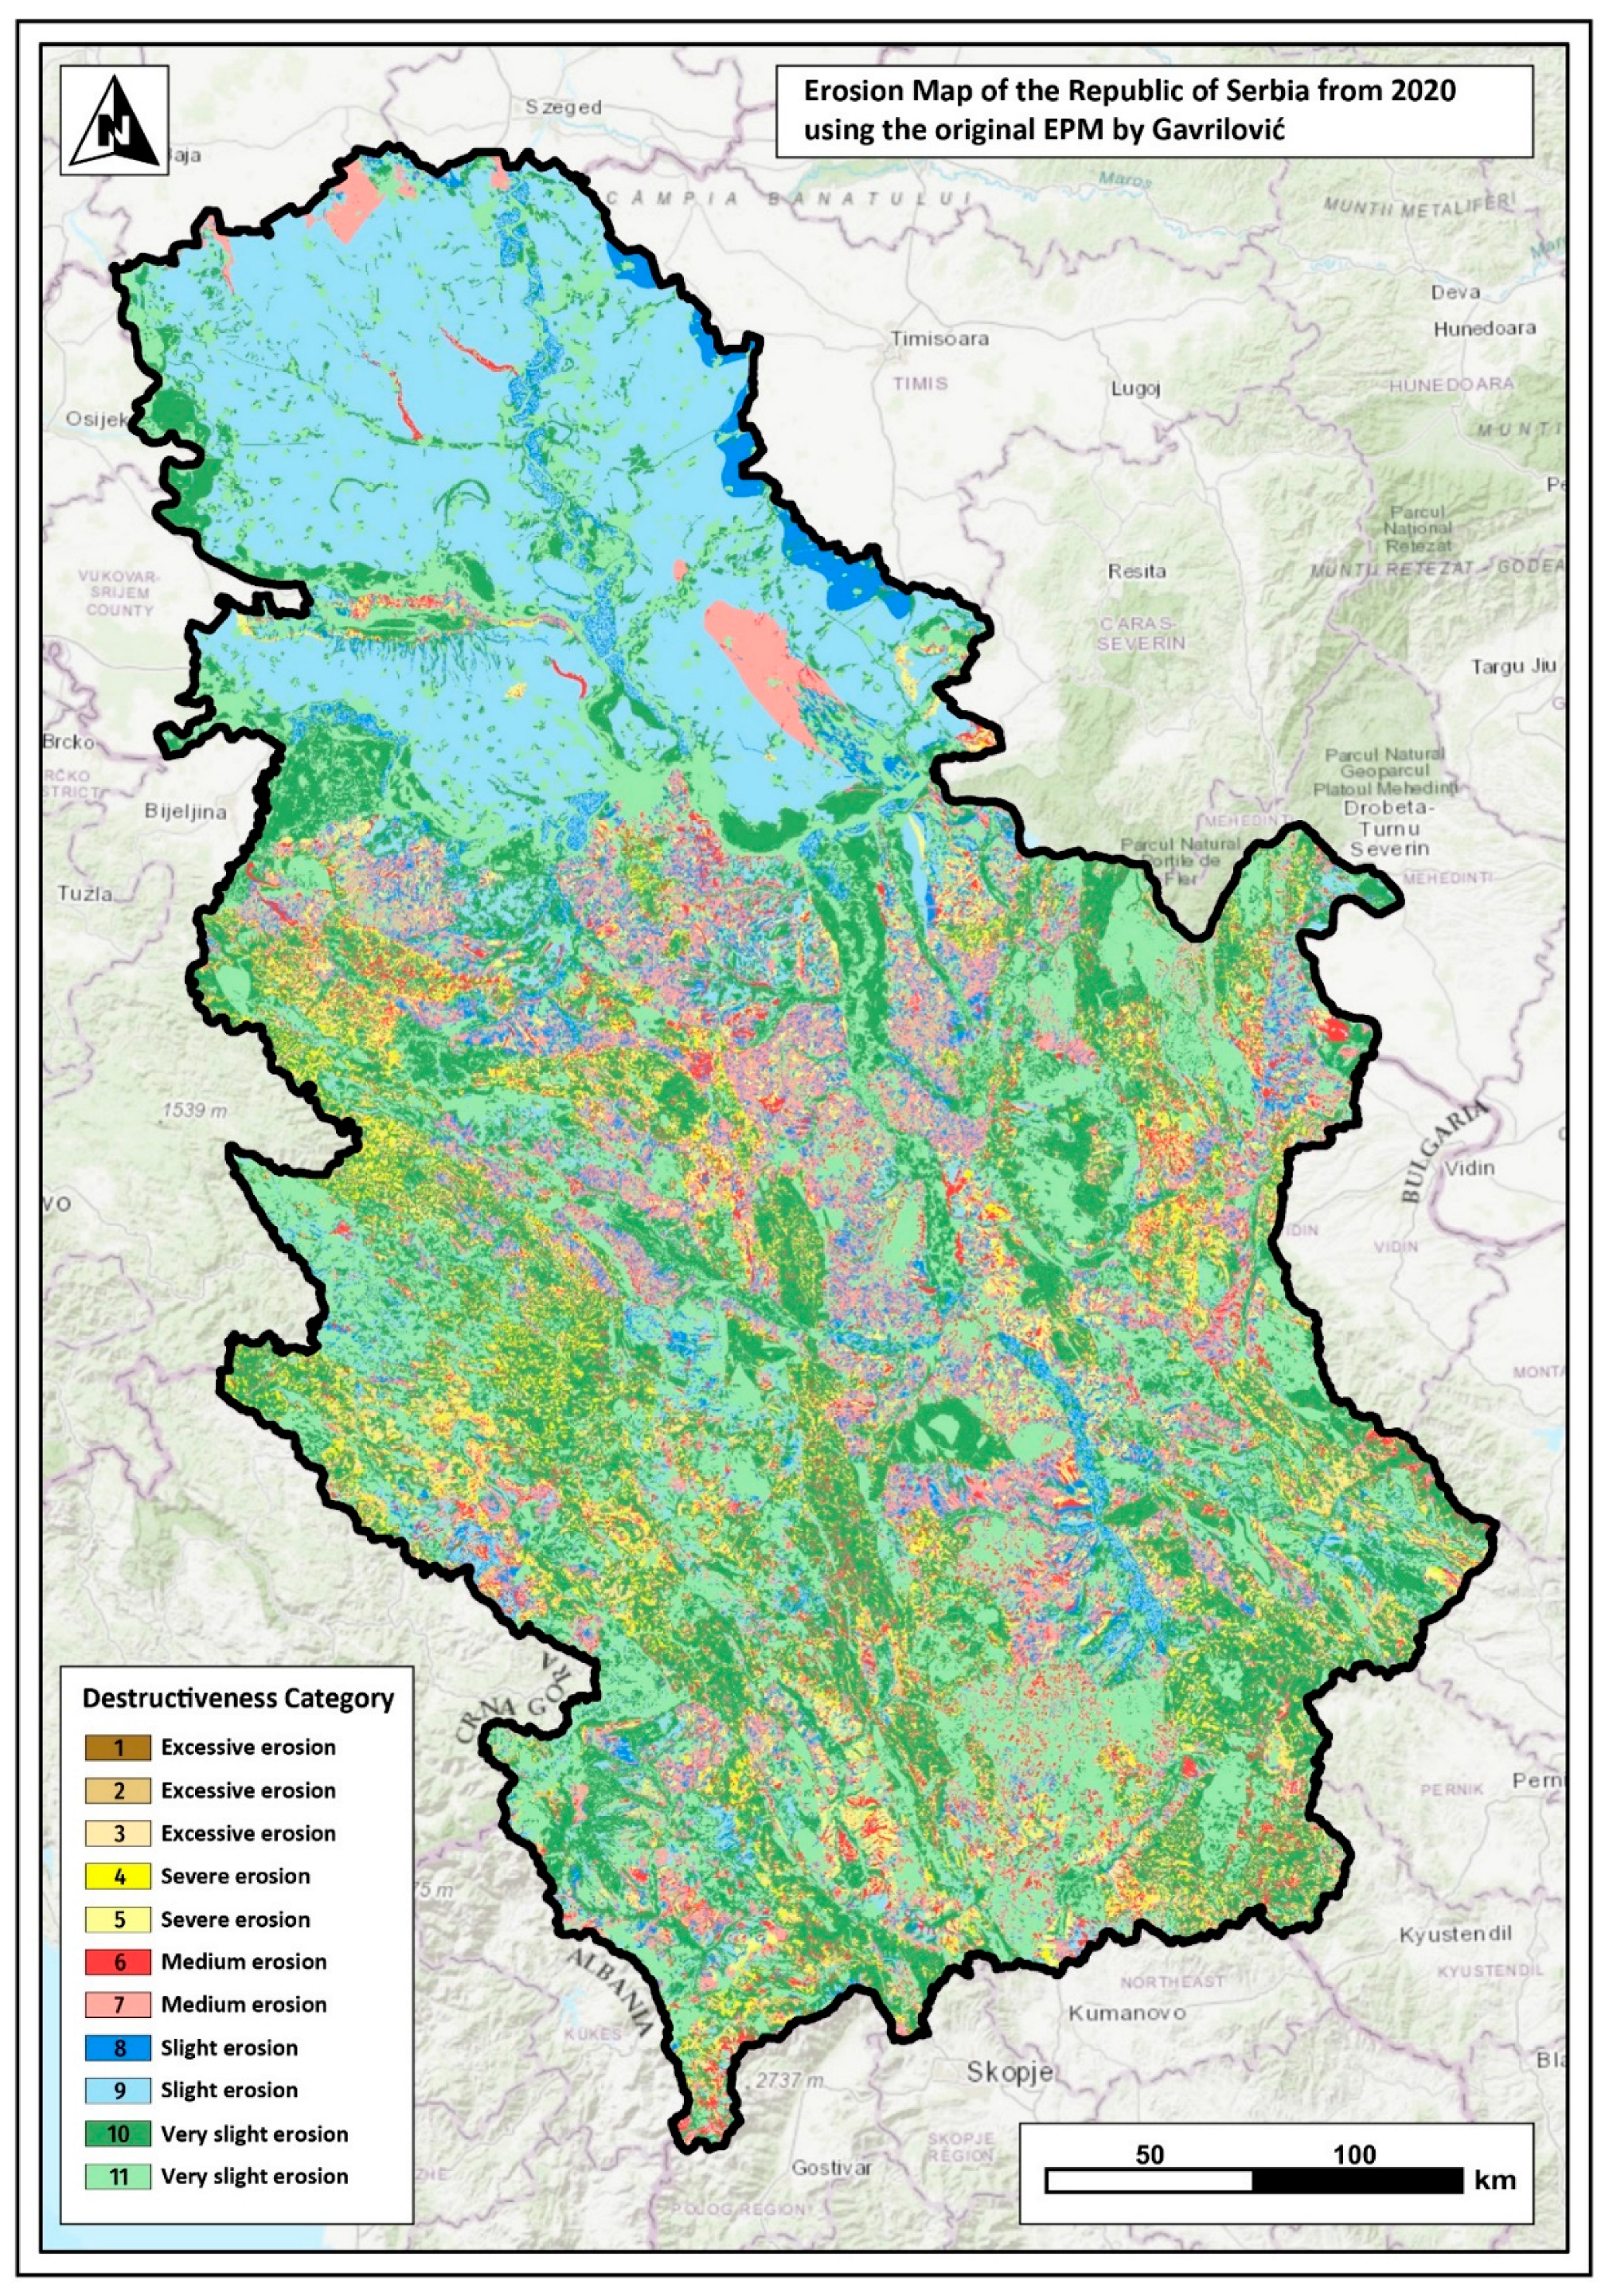

Table 1.
Distribution of Torrent Streams by Basin, According to the 1955 Torrent Cadastre.
| River Basin | Number of Torrential Streams |
Total Length of Main Streams (km) | Total Area Under Erosion (km²) | |
|---|---|---|---|---|
| Drina | 120 | 307 | 830 | |
| Lim | 111 | 309 | 487 | |
| W. Morava | 61 | 196 | 316 | |
| Skrapež | 19 | 100 | 139 | |
| Đetinja | 19 | 73 | 156 | |
| Ibar | 81 | 302 | 475 | |
| S. Morava | 220 | 1.55 | 2 | |
| Toplica | 156 | 899 | 175 | |
| Kolubara | 80 | 200 | 350 | |
| Timok | 72 | 250 | 920 | |
| Total: | 939 | 4.186 | 5.848 |
(Source: Petrović, 1955).
Table 2.
Erosion Coefficient Z Values According to Gavrilović.
| Category of Destructiveness (Erosivity) | Strength of Erosion Processes | Dominant Type of Erosion | Erosion Coefficient Z | Mean Value of Z |
|---|---|---|---|---|
| I | Excessive Erosion | Deep | > 1,51 | 1,25 |
| Mixed | 1,21-1,50 | |||
| Surface | 1,01-1,20 | |||
| Severe Erosion | Deep | 0,91-1,00 | 0,85 | |
| II | Mixed | 0,81-0,90 | ||
| Surface | 0,71-0,80 | |||
| Medium Erosion | Deep | 0,61-0,70 | 0,55 | |
| III | Mixed | 0,51-0,60 | ||
| Surface | 0,41-0,50 | |||
| Slight Erosion | Deep | 0,31-0,40 | 0,30 | |
| IV | Mixed | 0,25-0,30 | ||
| Surface | 0,20-0,24 | |||
| V | Very Slight Erosion | Traces of Erosion | 0,01-0,19 or less | 0,10 |
Source: Gavrilović, 1972.
Table 3.
Values of the Y Coefficient.
| Soil Types and Other Substrates | Mean Y Coefficient | |
|---|---|---|
| 1 | Sands, gravel, and loose soils | 2,0 |
| 2 | Loess, tuffs, saline marshes, steppe soils, etc. | 1,6 |
| 3 | Disintegrated limestones and marls | 1,2 |
| 4 | Serpentines, red sandstones, flysch deposits | 1,1 |
| 5 | Podzol soils and alike, decomposed shales, mica-schists, gneiss slates, clay slates | 1,0 |
| 6 | Core limestones, red rocks, and humus-silicate soils | 0,9 |
| 7 | Cambisol and mountain soils | 0,8 |
| 8 | Vertisol, humogley, and wetlands | 0,6 |
| 9 | Chernozem and alluvial soils of good structure | 0,5 |
| 10 | Bare, compact eruptives (volcanic origin) | 0,25 |
Source: Gavrilović, 1972.
Table 4.
Value of the Expression X∙a.
| Conditions Affecting the Value of Coefficient X∙a | X.a | |
|---|---|---|
| 1. Catchment area or region before implementation of anti-erosion measures | ||
| 1 | Completely bare, uncultivable land (bare land) | 1,0 |
| 2 | Arable land with plowing up or downhill | 0,9 |
| 3 | Orchards and vineyards without ground vegetation | 0,7 |
| 4 | Mountain pastures and drylands | 0,6 |
| 5 | Meadows, fields, and similar agricultural crops | 0,4 |
| 6 | Degraded forests and thickets with eroded soil | 0,6 |
| 7 | Forests or thickets with good structure and vegetation | 0,05 |
| 2. Catchment area or region after implementation of anti-erosion measures | ||
| 1 | Plows with contour direction | 0,63 |
| 2 | Arable land well-cared for and protected by mulching | 0,54 |
| 3 | Contour strip cultivation with crop rotation (fields) | 0,45 |
| 4 | Contour orchards and vineyards | 0,315 |
| 5 | Terracing of arable land, terraces, and tiers | 0,36 |
| 6 | Grassland restoration and pastures and drylands reclamation | 0,3 |
| 7 | Creation of medium-density contour ditches | 0,24 |
| 8 | Construction of contour trenches of medium density, retardation waterways, and micro-accumulations | 0,27 |
| 9 | Basic afforestation in pits or strips | 0,2 |
| 10 | Afforestation with the construction of tiers | 0,1 |
| 11 | Channel regulation, dam construction, and channelization | 0,7 |
Source: Gavrilović, 1972.
Table 5.
Values of the Coefficient ϕ.
| Conditions Affecting the Value of Coefficient ϕ | The mean value of ϕ | |
|---|---|---|
| 1 | Catchment area completely under gully erosion and primordial processes (deepening, incision, slumps) | 1,0 |
| 2 | About 80 % of the catchment area is under furrow and gully erosion | 0,9 |
| 3 | About 50 % of the catchment area is under furrow and gully erosion | 0,8 |
| 4 | The entire catchment area is subject to surface erosion: disintegrated debris from embankments, some furrows, and gullies, as well as strong karst erosion | 0,7 |
| 5 | The entire catchment area is under surface erosion but without furrows and gullies (deep processes) and the like | 0,6 |
| 6 | Land with 50 % of the area covered by surface erosion, while the rest of the catchment area is preserved | 0,5 |
| 7 | Land with 20 % of the area covered by surface erosion, while 80 % of the catchment area is preserved | 0,3 |
| 8 | The soil in the catchment area has no visible signs of erosion, but there are minor slips and slides in watercourses | 0,2 |
| 9 | Catchment area without visible signs of erosion, but mostly under arable land | 0,15 |
| 10 | An area without visible signs of erosion, both in the catchment area and in the watercourses, but predominantly under forests and perennial vegetation (meadows, pastures, etc.) | 0,1 |
Source: Gavrilović, 1972.
Table 6.
Erosion Coefficient Z According to Lazarević.
| Destructiveness Category (Erosivity) | Strength of Erosion Processes | Erosion Coefficient Z |
|---|---|---|
| 1 | Excessive erosion | 1,41–1,50 |
| 2 | Excessive erosion | 1,21–1,40 |
| 3 | Excessive erosion | 1,01–1,20 |
| 4 | Severe erosion | 0,86–1,00 |
| 5 | Severe erosion | 0,71–0,85 |
| 6 | Medium erosion | 0,56–0,70 |
| 7 | Medium erosion | 0,41–0,55 |
| 8 | Slight erosion | 0,31–0,40 |
| 9 | Slight erosion | 0,21–0,30 |
| 10 | Very slight erosion | 0,11–,020 |
| 11 | Very slight erosion | < 0,11–0,10 |
| 12 | Sediment accumulation | 0 |
Source: Lazarević, 1983.
Table 7.
Soil Erodibility Coefficient Y.
| No. | Soil Type - Rock | Value of Y |
|---|---|---|
| 1 | Soil | 1,0–0,8 |
| 2 | Skeletal and skeletonized soil | 0,7 |
| 3 | Impermeable and non-resistant rocks (slates, flysch, clay) | 0,6 |
| 4 | Permeable and non-resistant rocks (sand, gravel, loess) | 0,5 |
| 5 | Semi-permeable rocks | 0,4 |
| 6 | Impermeable and resistant rocks (volcanic rocks) | 0,25 |
| 7 | Permeable and resistant rocks (limestone, dolomite) | 0,1 |
Source: Lazarević, 1983
Table 8.
Protection Coefficient of Soil from Atmospheric Influence and Erosion X.
| No. | Land Use Method | Value of X |
|---|---|---|
| 1 | Area without vegetation cover | 1,0 |
| 2 | Fields with plowing along and across the slope, vineyards | 0,9 |
| 3 | Fields with plowing along contour lines | 0,8 |
| 4 | Multi-field crop rotation | 0,6 |
| 5 | Degraded pastures | 0,4 |
| 6 | Degraded forests | 0,3 |
| 7 | Meadows | 0,2 |
| 8 | Well-established forests | 0,1 |
Source: Lazarević, 1983
Table 9.
Visible Erosion Processes Coefficient ϕ.
| No. | Erosion Process State | Mean Value of Coefficient ϕ |
|---|---|---|
| 1 | Areas are deeply eroded by ravines, water divides, and furrows, cut into eluviated and deluviated deposits or very weathered non-resistant rocks; such areas cannot be used without specific anti-erosion measures, and riverbeds are dominated by sediment accumulation. | 1,01–1,50 |
| 2 | Firm surface and hidden linear erosion on slopes above 10°; degraded forests and pastures with individual water divides and furrows; riverbeds dominated by sediment accumulation. | 1,00–0,71 |
| 3 | Areas under plowing on slopes of 5–10° (ϕ=0.5); degraded pastures and forests with damaged cover; barren lands on resistant impermeable rocks (ϕ=0.3); watercourses erode and cut into the land. | 0,70–0,41 |
| 4 | Weak erosion in forests with weaker cover, on poorer meadows and pastures, on slopes up to 10° (ϕ=0.25); forests and meadows on slopes 10–30° (ϕ=0.2); forests and meadows on the lower part of the slope; fields on slopes 3–5°; riverbeds dominated by deep erosion. | 0,40–0,21 |
| 5 | Latent erosion; well-established forests with good ground cover occupying the ridge areas; good meadows and pastures on slopes up to 10°; extensive plains with slopes less than 3°; carbonaceous rocks (bare karst or with preserved vegetation); deep erosion in riverbeds. | 0,20–0,10 и мање |
| 6 | Sediment accumulation on alluvial plains, at narrow areas between slopes and embankments, behind protective barriers, etc.; closed karst. | 0 |
Source: Lazarević, 1983
Table 10.
Comparison of Erosion Status on the 1983 and 2020 Maps.
| Erosion Category | 1983 | 2020 | ||
|---|---|---|---|---|
| km2 | % | km2 | % | |
| Excessive Erosion | 905.71 | 1.02 | 2696.39 | 3.05 |
| Strong Erosion | 12073.17 | 13.64 | 6703.15 | 7.57 |
| Medium Erosion | 11052.73 | 12.49 | 10443.81 | 11.8 |
| Weak Erosion | 15266.36 | 17.25 | 22326.73 | 25.23 |
| Very Weak Erosion | 37113.82 | 41.94 | 46327.46 | 52.35 |
| Sediment Accumulation | 12085.71 | 13.66 | / | / |
Disclaimer/Publisher’s Note: The statements, opinions and data contained in all publications are solely those of the individual author(s) and contributor(s) and not of MDPI and/or the editor(s). MDPI and/or the editor(s) disclaim responsibility for any injury to people or property resulting from any ideas, methods, instructions or products referred to in the content. |
© 2024 by the authors. Licensee MDPI, Basel, Switzerland. This article is an open access article distributed under the terms and conditions of the Creative Commons Attribution (CC BY) license (http://creativecommons.org/licenses/by/4.0/).
Copyright: This open access article is published under a Creative Commons CC BY 4.0 license, which permit the free download, distribution, and reuse, provided that the author and preprint are cited in any reuse.


