
Submitted:
21 December 2024
Posted:
23 December 2024
You are already at the latest version
Abstract
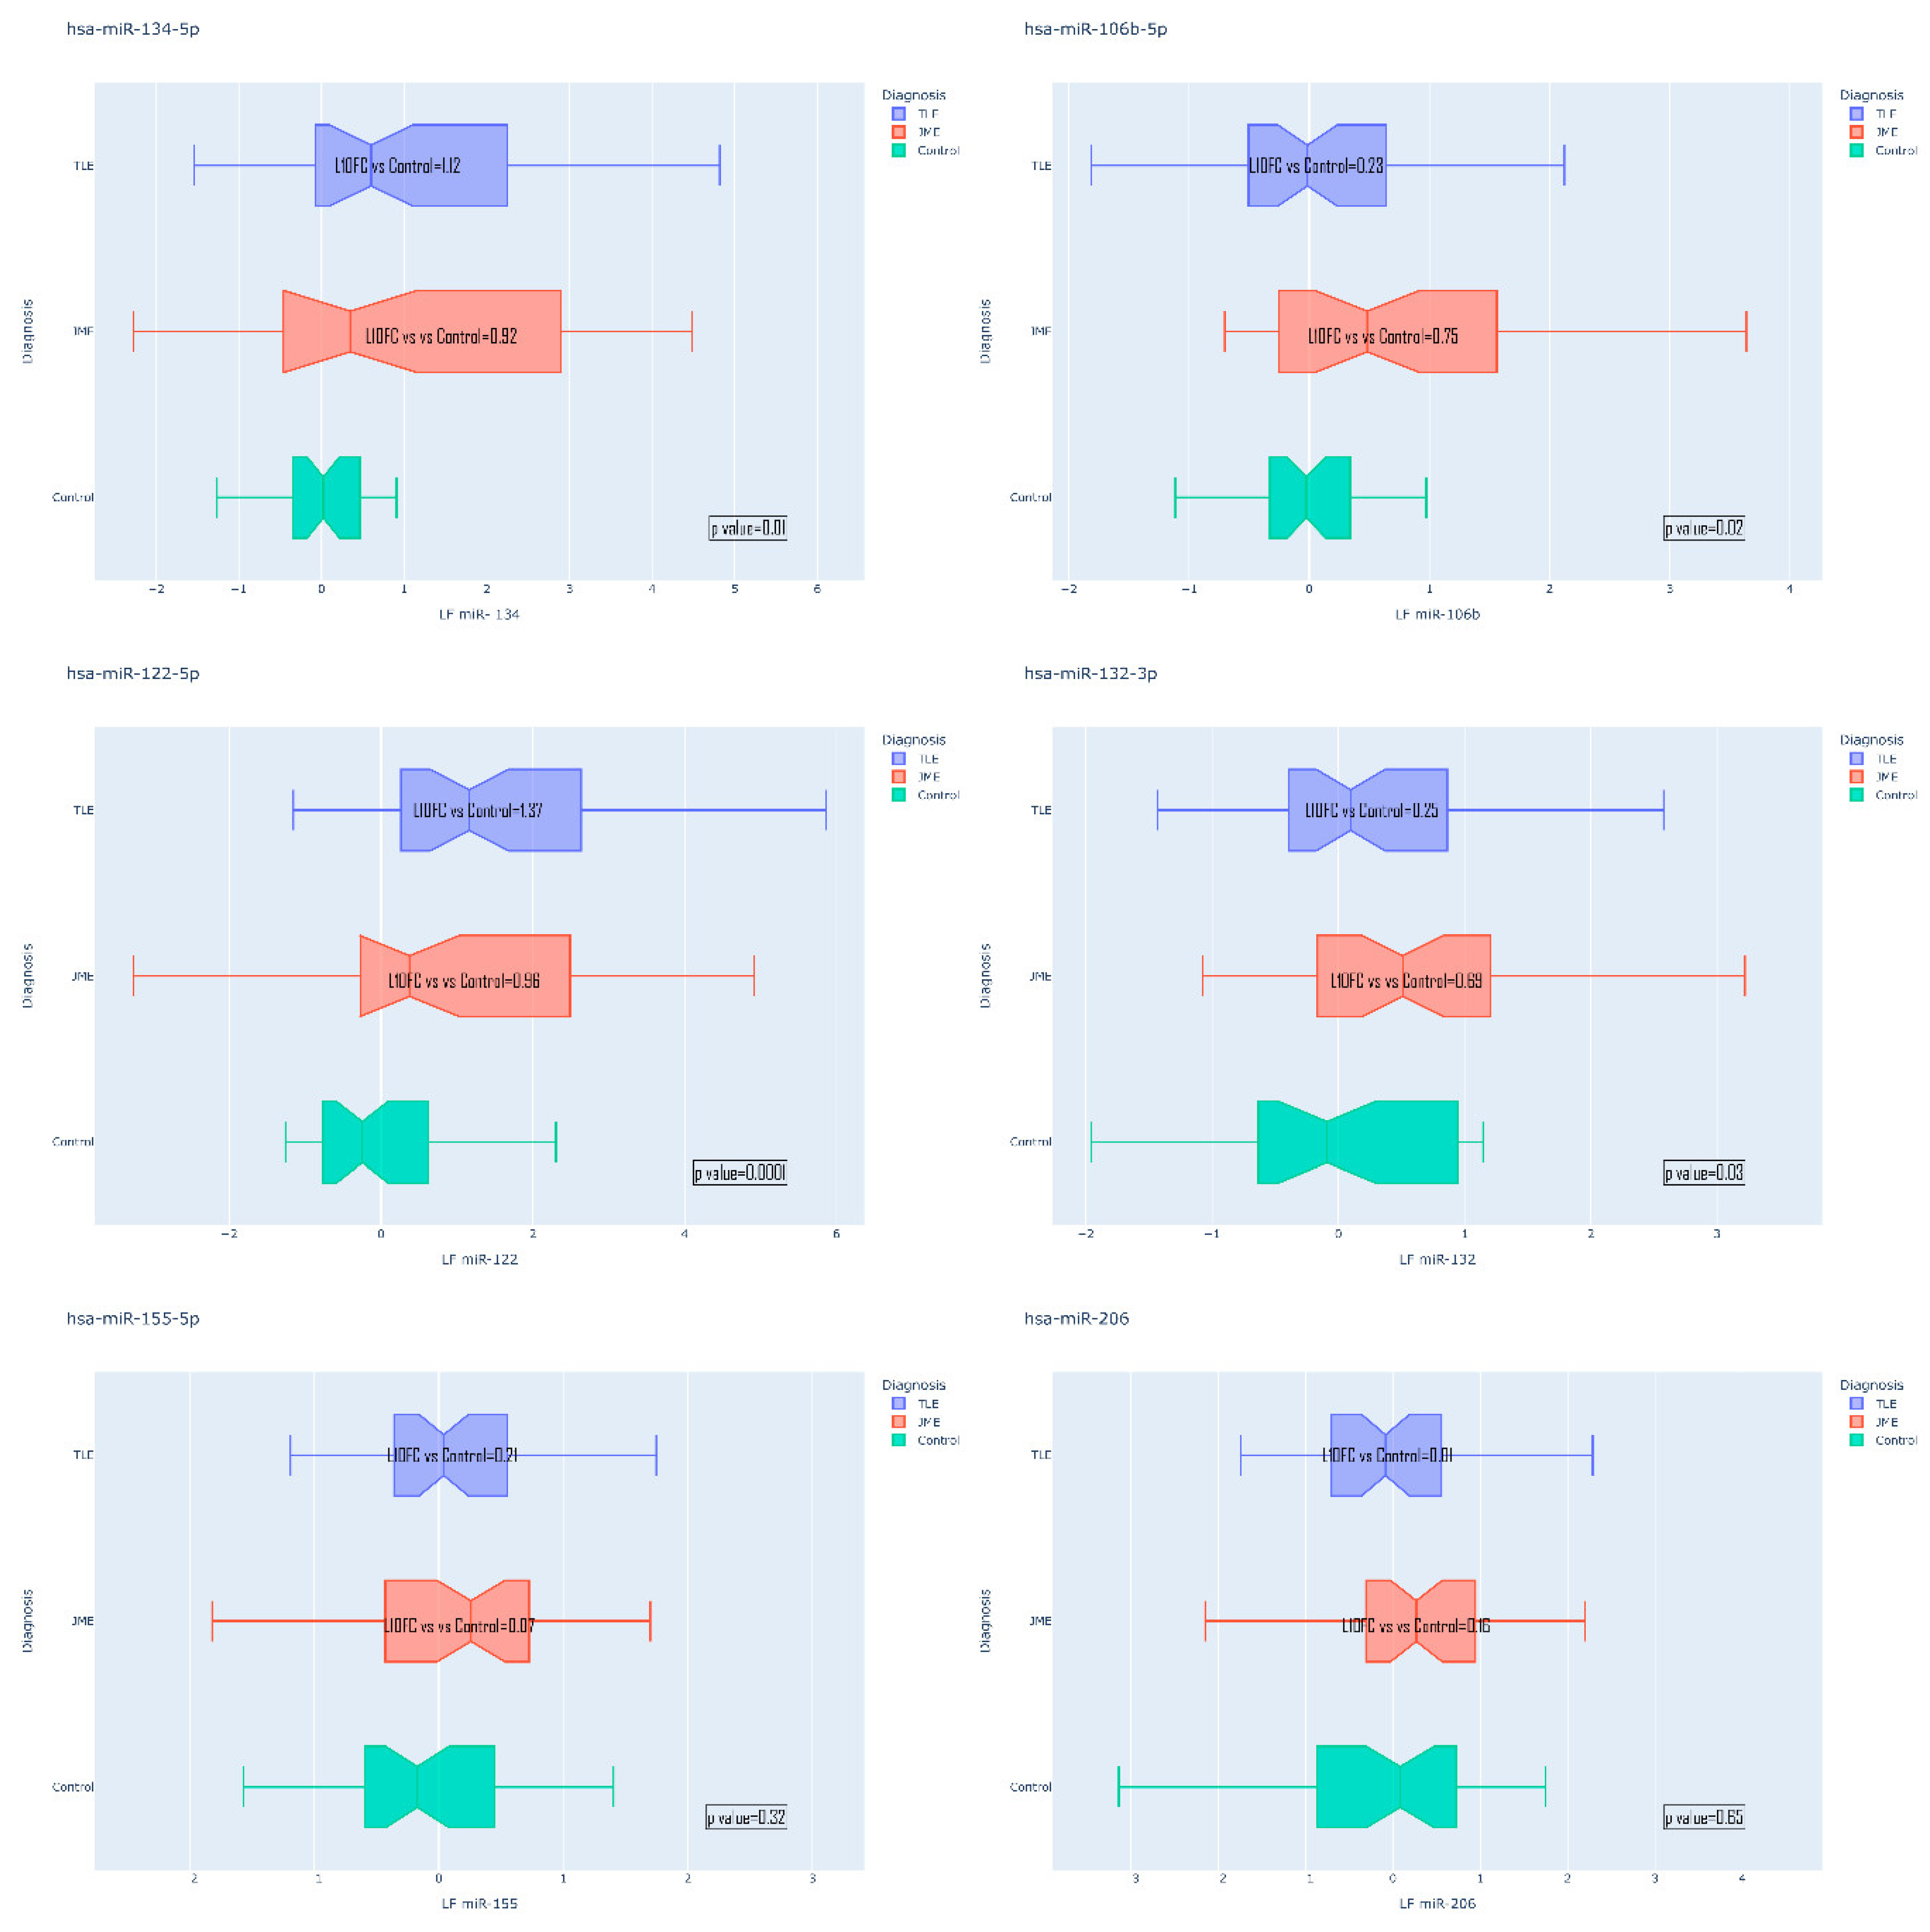
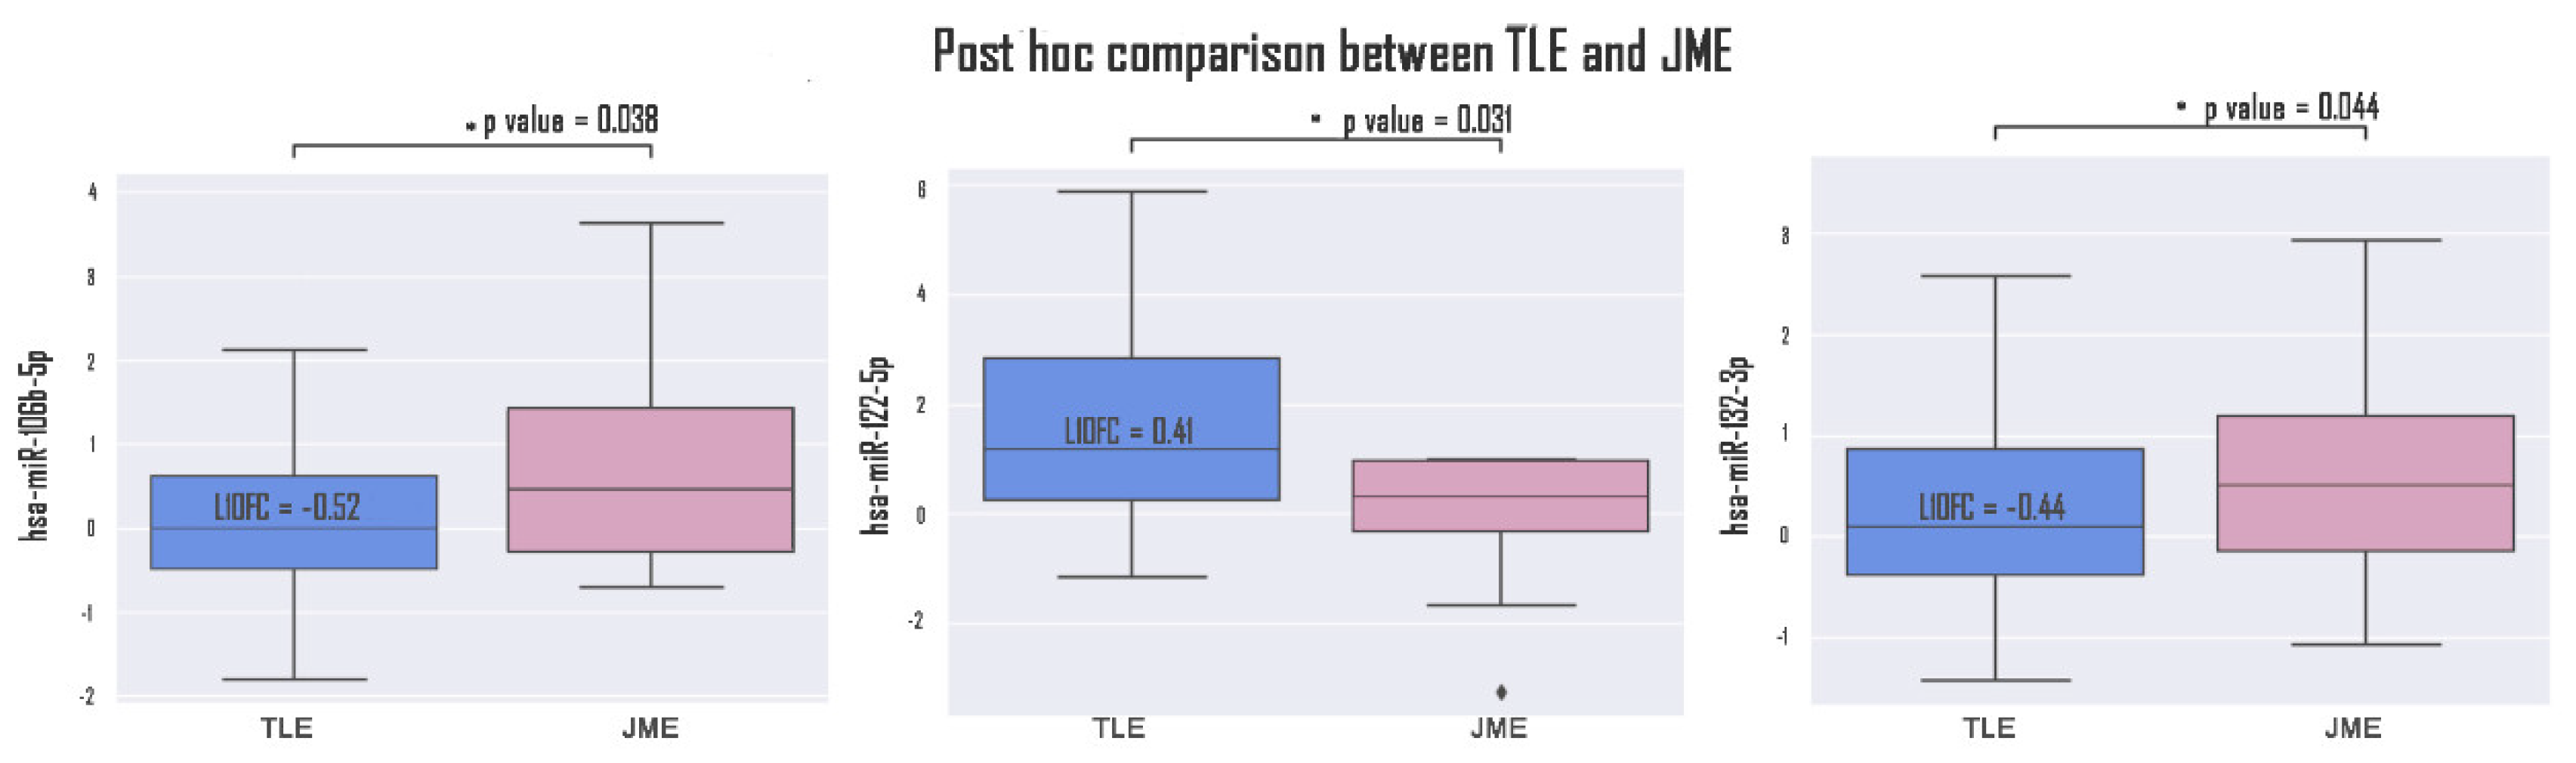
Epilepsy is a group of disorders characterized by a cluster of clinical and EEG signs leading to the formation of abnormal synchronous excitation of neurons in the brain. Epilepsy is one of the most common neurological disorders worldwide. Epilepsy is characterized by aberrant expression patterns, both at the level of matrix transcripts and at the level of regulatory RNA sequences. Aberrant expression of a number of microRNAs can mark a particular epileptic syndrome, which will improve the quality of differential diagnosis. In this work, the expression profile of six microRNAs was analyzed: hsa-miR-106b-5p, hsa-miR-134-5p, hsa-miR-122-5p, hsa-miR-132-3p, hsa-miR-155-5p, hsa-miR-206-5p in the blood plasma of patients suffering from temporal lobe epilepsy TLE (n=52), juvenile myoclonic epilepsy JME (n=42) in comparison with healthy volunteers. The expression analysis was carried out using RT-PCR, mathematical processing of the data was carried out according to the Livak method. A statistically significant change in the expression of hsa-miR-106b-5p, hsa-miR-134-5p, hsa-miR-122-5p, hsa-miR-132-3p was found. An increase in the expression of hsa-miR-134-5p and hsa-miR-122-5p was registered in the group of patients with TLE compared to the control, as well as an increase in the expression of hsa-miR-132-3p and hsa-miR-106b-5p in the JME group compared to the control. hsa-miR-122-5p, 106b-5p, 132-3p are also able to discriminate TLE from JME. Additionally, a number of microRNAs are able to discriminate patients with drug-resistant and drug-sensitive forms of epilepsy from the control, as well as patients with hippocampal sclerosis and patients without hippocampal sclerosis from the control. Our data allow us to propose these microRNAs as plasma biomarkers of various epileptic syndromes.
Keywords:
1. Introduction
2. Materials and Methods
2.1. Ethical Considerations and Patient Recruitment
2.2. RNA Isolation and RT-PCR
2.3. Data Analysis
3. Results
4. Discussion
5. Conclusion
Author Contributions
Funding
Institutional Review Board Statement
Informed Consent Statement
Data Availability Statement
Conflicts of Interest
References
- Wirrell, E.; Tinuper, P.; Perucca, E.; Moshé, S.L. Introduction to the Epilepsy Syndrome Papers. Epilepsia 2022, 63, 1330–1332. [Google Scholar] [CrossRef] [PubMed]
- Epilepsy. Available online: https://www.who.int/news-room/fact-sheets/detail/epilepsy (accessed on 22 October 2024).
- Wirrell, E.C.; Nabbout, R.; Scheffer, I.E.; Alsaadi, T.; Bogacz, A.; French, J.A.; Hirsch, E.; Jain, S.; Kaneko, S.; Riney, K.; et al. Methodology for Classification and Definition of Epilepsy Syndromes with List of Syndromes: Report of the ILAE Task Force on Nosology and Definitions. Epilepsia 2022, 63, 1333–1348. [Google Scholar] [CrossRef] [PubMed]
- Eeg-Olofsson, O.; Petersén, I.; Selldén, U. The Development of the Electroencephalogram in Normal Children from the Age of 1 through 15 Years. Paroxysmal Activity. Neuropadiatrie 1971, 2, 375–404. [Google Scholar] [CrossRef]
- Cavazzuti, G.B.; Cappella, L.; Nalin, A. Longitudinal Study of Epileptiform EEG Patterns in Normal Children. Epilepsia 1980, 21, 43–55. [Google Scholar] [CrossRef]
- Seneviratne, U.; Cook, M.; D’Souza, W. Focal Abnormalities in Idiopathic Generalized Epilepsy: A Critical Review of the Literature. Epilepsia 2014, 55, 1157–1169. [Google Scholar] [CrossRef]
- Elshetihy, A.; Nergiz, L.; Cloppenborg, T.; Woermann, F.G.; Müffelmann, B.; Bien, C.G. A Complex Case with Generalized Epilepsy, Probable Focal Seizures, and Functional Seizures. Epilepsy Behav Rep 2024, 27, 100684. [Google Scholar] [CrossRef] [PubMed]
- Devinsky, O.; Elder, C.; Sivathamboo, S.; Scheffer, I.E.; Koepp, M.J. Idiopathic Generalized Epilepsy Misunderstandings, Challenges, and Opportunities. Neurology 2023, 102. [Google Scholar]
- Tang, S.; Yuan, K.; Chen, L. Molecular Biomarkers, Network Biomarkers, and Dynamic Network Biomarkers for Diagnosis and Prediction of Rare Diseases. Fundamental Research 2022, 2, 894–902. [Google Scholar] [CrossRef] [PubMed]
- Natalia, A.; Zhang, L.; Sundah, N.R.; Zhang, Y.; Shao, H. Analytical Device Miniaturization for the Detection of Circulating Biomarkers. Nature Reviews Bioengineering 2023 1:7 2023, 1, 481–498. [Google Scholar] [CrossRef]
- van Vliet, E.A.; Aronica, E.; Gorter, J.A. Blood–Brain Barrier Dysfunction, Seizures and Epilepsy. Semin Cell Dev Biol 2015, 38, 26–34. [Google Scholar] [CrossRef]
- Kiani, L. Blood–Brain Barrier Disruption Following Seizures. Nature Reviews Neurology 2023 19:4 2023, 19, 196–196. [Google Scholar] [CrossRef]
- Panina, Y.S.; Timechko, E.E.; Usoltseva, A.A.; Yakovleva, K.D.; Kantimirova, E.A.; Dmitrenko, D. V. Biomarkers of Drug Resistance in Temporal Lobe Epilepsy in Adults. Metabolites 2023, 13. [Google Scholar] [CrossRef] [PubMed]
- Walker, L.E.; Frigerio, F.; Ravizza, T.; Ricci, E.; Tse, K.; Jenkins, R.E.; Sills, G.J.; Jorgensen, A.; Porcu, L.; Thippeswamy, T.; et al. Molecular Isoforms of High-Mobility Group Box 1 Are Mechanistic Biomarkers for Epilepsy. J Clin Invest 2017, 127, 2118–2132. [Google Scholar] [CrossRef]
- Shpak, A.A.; Guekht, A.B.; Druzhkova, T.A.; Rider, F.K.; Gulyaeva, N. V. Brain-Derived Neurotrophic Factor in Blood Serum and Lacrimal Fluid of Patients with Focal Epilepsy. Epilepsy Res 2021, 176, 106707. [Google Scholar] [CrossRef]
- Hong, Z.; Li, W.; Qu, B.; Zou, X.; Chen, J.; Sander, J.W.; Zhou, D. Serum Brain-Derived Neurotrophic Factor Levels in Epilepsy. Eur J Neurol 2014, 21, 57–64. [Google Scholar] [CrossRef] [PubMed]
- Costa, A.M.; Lo Barco, T.; Spezia, E.; Conti, V.; Roli, L.; Marini, L.; Minghetti, S.; Caramaschi, E.; Pietrangelo, L.; Pecoraro, L.; et al. Prospective Evaluation of Ghrelin and Des-Acyl Ghrelin Plasma Levels in Children with Newly Diagnosed Epilepsy: Evidence for Reduced Ghrelin-to-Des-Acyl Ghrelin Ratio in Generalized Epilepsies. J Pers Med 2022, 12. [Google Scholar] [CrossRef]
- Hanin, A.; Denis, J.A.; Frazzini, V.; Cousyn, L.; Imbert-Bismut, F.; Rucheton, B.; Bonnefont-Rousselot, D.; Marois, C.; Lambrecq, V.; Demeret, S. Neuron Specific Enolase, S100-Beta Protein and Progranulin as Diagnostic Biomarkers of Status Epilepticus. epilepticus. Journal of Neurology 2022. [CrossRef]
- Liang, K.G.; Mu, R.Z.; Liu, Y.; Jiang, D.; Jia, T.T.; Huang, Y.J. Increased Serum S100B Levels in Patients with Epilepsy: A Systematic Review and Meta-Analysis Study. Front Neurosci 2019, 13, 456. [Google Scholar] [CrossRef] [PubMed]
- Banote, R.K.; Akel, S.; Zelano, J. Blood Biomarkers in Epilepsy. Acta Neurol Scand 2022, 146, 362. [Google Scholar] [CrossRef] [PubMed]
- O’Brien, J.; Hayder, H.; Zayed, Y.; Peng, C. Overview of MicroRNA Biogenesis, Mechanisms of Actions, and Circulation. Front Endocrinol (Lausanne) 2018, 9, 402. [Google Scholar] [CrossRef]
- Jovičić, A.; Roshan, R.; Moisoi, N.; Pradervand, S.; Moser, R.; Pillai, B.; Luthi-Carter, R. Comprehensive Expression Analyses of Neural Cell-Type-Specific MiRNAs Identify New Determinants of the Specification and Maintenance of Neuronal Phenotypes. J Neurosci 2013, 33, 5127–5137. [Google Scholar] [CrossRef] [PubMed]
- Lu, J.; Zhou, N.; Yang, P.; Deng, L.; Liu, G. MicroRNA-27a-3p Downregulation Inhibits Inflammatory Response and Hippocampal Neuronal Cell Apoptosis by Upregulating Mitogen-Activated Protein Kinase 4 (MAP2K4) Expression in Epilepsy: In Vivo and In Vitro Studies. Med Sci Monit 2019, 25, 8499–8508. [Google Scholar] [CrossRef] [PubMed]
- Li, T.R.; Jia, Y.J.; Ma, C.; Qiu, W.Y.; Wang, Q.; Shao, X.Q.; Lv, R.J. The Role of the MicroRNA-146a/Complement Factor H/Interleukin-1β-Mediated Inflammatory Loop Circuit in the Perpetuate Inflammation of Chronic Temporal Lobe Epilepsy. Dis Model Mech 2018, 11. [Google Scholar] [CrossRef]
- Wang, J.; Zhao, J. MicroRNA Dysregulation in Epilepsy: From Pathogenetic Involvement to Diagnostic Biomarker and Therapeutic Agent Development. Front Mol Neurosci 2021, 14, 650372. [Google Scholar] [CrossRef] [PubMed]
- Zheng, X.H.; Cui, C.; Zhou, X.X.; Zeng, Y.X.; Jia, W.H. Centrifugation: An Important Pre-Analytic Procedure That Influences Plasma MicroRNA Quantification during Blood Processing. Chin J Cancer 2013, 32, 667. [Google Scholar] [CrossRef] [PubMed]
- Livak, K.J.; Schmittgen, T.D. Analysis of Relative Gene Expression Data Using Real-Time Quantitative PCR and the 2−ΔΔCT Method. Methods 2001, 25, 402–408. [Google Scholar] [CrossRef] [PubMed]
- Rice, J.; Roberts, H.; Rai, S.N.; Galandiuk, S. Housekeeping Genes for Studies of Plasma MicroRNA: A Need for More Precise Standardization. Surgery 2015, 158, 1345–1351. [Google Scholar] [CrossRef] [PubMed]
- Avansini, S.H.; De Sousa Lima, B.P.; Secolin, R.; Santos, M.L.; Coan, A.C.; Vieira, A.S.; Torres, F.R.; Carvalho, B.S.; Alvim, M.K.M.; Morita, M.E.; et al. MicroRNA Hsa-MiR-134 Is a Circulating Biomarker for Mesial Temporal Lobe Epilepsy. PLoS One 2017, 12, e0173060. [Google Scholar] [CrossRef]
- Peng, J.; Omran, A.; Ashhab, M.U.; Kong, H.; Gan, N.; He, F.; Yin, F. Expression Patterns of MiR-124, MiR-134, MiR-132, and MiR-21 in an Immature Rat Model and Children with Mesial Temporal Lobe Epilepsy. J Mol Neurosci 2013, 50, 291–297. [Google Scholar] [CrossRef]
- Reschke, C.R.; Silva, L.F.A.; Norwood, B.A.; Senthilkumar, K.; Morris, G.; Sanz-Rodriguez, A.; Conroy, R.M.; Costard, L.; Neubert, V.; Bauer, S.; et al. Potent Anti-Seizure Effects of Locked Nucleic Acid Antagomirs Targeting MiR-134 in Multiple Mouse and Rat Models of Epilepsy. Mol Ther Nucleic Acids 2016, 6, 45. [Google Scholar] [CrossRef] [PubMed]
- Wood, H. Silencing of MiR-134 Suppresses Seizures in Mice. Nature Reviews Neurology 2012 8:8 2012, 8, 413–413. [Google Scholar] [CrossRef]
- Jimenez-Mateos, E.M.; Engel, T.; Merino-Serrais, P.; McKiernan, R.C.; Tanaka, K.; Mouri, G.; Sano, T.; O’Tuathaigh, C.; Waddington, J.L.; Prenter, S.; et al. Silencing MicroRNA-134 Produces Neuroprotective and Prolonged Seizure-Suppressive Effects. Nat Med 2012, 18, 1087. [Google Scholar] [CrossRef] [PubMed]
- Schratt, G.M.; Tuebing, F.; Nigh, E.A.; Kane, C.G.; Sabatini, M.E.; Kiebler, M.; Greenberg, M.E. A Brain-Specific MicroRNA Regulates Dendritic Spine Development. Nature 2006, 439, 283–289. [Google Scholar] [CrossRef]
- Gao, X.; Guo, M.; Meng, D.; Sun, F.; Guan, L.; Cui, Y.; Zhao, Y.; Wang, X.; Gu, X.; Sun, J.; et al. Silencing MicroRNA-134 Alleviates Hippocampal Damage and Occurrence of Spontaneous Seizures After Intraventricular Kainic Acid-Induced Status Epilepticus in Rats. Front Cell Neurosci 2019, 13, 145. [Google Scholar] [CrossRef]
- Leontariti, M.; Avgeris, M.; Katsarou, M.S.; Drakoulis, N.; Siatouni, A.; Verentzioti, A.; Alexoudi, A.; Fytraki, A.; Patrikelis, P.; Vassilacopoulou, D.; et al. Circulating MiR-146a and MiR-134 in Predicting Drug-Resistant Epilepsy in Patients with Focal Impaired Awareness Seizures. Epilepsia 2020, 61, 959–970. [Google Scholar] [CrossRef] [PubMed]
- Wang, G.; Liu, Y.; Zhu, X.; Lin, K.; Li, M.; Wu, Z.; Zhang, R.; Zheng, Q.; Li, D.; An, T. Knockdown of MiRNA-134-5p Rescues Dendritic Deficits by Promoting AMPK-Mediated Mitophagy in a Mouse Model of Depression. Neuropharmacology 2022, 214, 109154. [Google Scholar] [CrossRef] [PubMed]
- Leontariti, M.; Avgeris, M.; Katsarou, M.S.; Drakoulis, N.; Siatouni, A.; Verentzioti, A.; Alexoudi, A.; Fytraki, A.; Patrikelis, P.; Vassilacopoulou, D.; et al. Circulating MiR-146a and MiR-134 in Predicting Drug-Resistant Epilepsy in Patients with Focal Impaired Awareness Seizures. Epilepsia 2020, 61, 959–970. [Google Scholar] [CrossRef]
- Avansini, S.H.; De Sousa Lima, B.P.; Secolin, R.; Santos, M.L.; Coan, A.C.; Vieira, A.S.; Torres, F.R.; Carvalho, B.S.; Alvim, M.K.M.; Morita, M.E.; et al. MicroRNA Hsa-MiR-134 Is a Circulating Biomarker for Mesial Temporal Lobe Epilepsy. PLoS One 2017, 12, e0173060. [Google Scholar] [CrossRef]
- Wang, J.; Yu, J.T.; Tan, L.; Tian, Y.; Ma, J.; Tan, C.C.; Wang, H.F.; Liu, Y.; Tan, M.S.; Jiang, T.; et al. Genome-Wide Circulating MicroRNA Expression Profiling Indicates Biomarkers for Epilepsy. Sci Rep 2015, 5. [Google Scholar] [CrossRef]
- Shen, C.H.; Zhang, Y.X.; Zheng, Y.; Yang, F.; Hu, Y.; Xu, S.; Yan, S.Q.; Ding, Y.; Guo, Y.; Ding, M.P. Expression of Plasma MicroRNA-145-5p and Its Correlation with Clinical Features in Patients with Refractory Epilepsy. Epilepsy Res 2019, 154, 21–25. [Google Scholar] [CrossRef] [PubMed]
- Sun, J.; Cheng, W.; Liu, L.; Tao, S.; Xia, Z.; Qi, L.; Huang, M. Identification of Serum MiRNAs Differentially Expressed in Human Epilepsy at Seizure Onset and Post-Seizure. Mol Med Rep 2016, 14, 5318–5324. [Google Scholar] [CrossRef]
- Moustafa, M.; Abokrysha, N.T.; Eldesoukey, N.A.; Amin, D.G.; Mounir, N.; Labib, D.M. Role of Circulating MiR 194-5p, MiR 106b, and MiR 146a as Potential Biomarkers for Epilepsy: A Case-Control Study. Egyptian Journal of Neurology, Psychiatry and Neurosurgery 2020, 56, 1–8. [Google Scholar] [CrossRef]
- Wang, H.; Liu, J.; Zong, Y.; Xu, Y.; Deng, W.; Zhu, H.; Liu, Y.; Ma, C.; Huang, L.; Zhang, L.; et al. MiR-106b Aberrantly Expressed in a Double Transgenic Mouse Model for Alzheimer’s Disease Targets TGF-β Type II Receptor. Brain Res 2010, 1357, 166–174. [Google Scholar] [CrossRef] [PubMed]
- Wang, J.; Tan, L.; Tan, L.; Tian, Y.; Ma, J.; Tan, C.C.; Wang, H.F.; Liu, Y.; Tan, M.S.; Jiang, T.; et al. Circulating MicroRNAs Are Promising Novel Biomarkers for Drug-Resistant Epilepsy. Sci Rep 2015, 5. [Google Scholar] [CrossRef] [PubMed]
- Yu, Y.; Li, P.; Chen, M.; Zhan, W.; Zhu, T.; Min, L.; Liu, H.; Lv, B. MiR-122 Overexpression Alleviates Oxygen–Glucose Deprivation-Induced Neuronal Injury by Targeting SPLA2-IIA. Frontiers in Neurology 2024, 15, 1395833. [Google Scholar] [CrossRef] [PubMed]
- Stanzione, R.; Bianchi, F.; Cotugno, M.; Marchitti, S.; Forte, M.; Busceti, C.; Ryskalin, L.; Fornai, F.; Volpe, M.; Rubattu, S. A Decrease of Brain MicroRNA-122 Level Is an Early Marker of Cerebrovascular Disease in the Stroke-Prone Spontaneously Hypertensive Rat. Oxid Med Cell Longev 2017, 2017, 1206420. [Google Scholar] [CrossRef] [PubMed]
- Song, C.; Li, S.; Mai, Y.; Li, L.; Dai, G.; Zhou, Y.; Liang, X.; Zou, O.M.; Wang, Y.; Zhou, L.; et al. Dysregulated Expression of MiR-140 and MiR-122 Compromised Microglial Chemotaxis and Led to Reduced Restriction of AD Pathology. J Neuroinflammation 2024, 21, 1–19. [Google Scholar] [CrossRef]
- Guo, D.; Ma, J.; Li, T.; Yan, L. Up-Regulation of MiR-122 Protects against Neuronal Cell Death in Ischemic Stroke through the Heat Shock Protein 70-Dependent NF-ΚB Pathway by Targeting FOXO3. Exp Cell Res 2018, 369, 34–42. [Google Scholar] [CrossRef] [PubMed]
- Yu, N.; Tian, W.; Liu, C.; Zhang, P.; Zhao, Y.; Nan, C.; Jin, Q.; Li, X.; Liu, Y. MiR-122-5p Promotes Peripheral and Central Nervous System Inflammation in a Mouse Model of Intracerebral Hemorrhage via Disruption of the MLLT1/PI3K/AKT Signaling. Neurochem Res 2023, 48, 3665–3682. [Google Scholar] [CrossRef] [PubMed]
- Li, W.; Wu, J.; Zeng, Y.; Zheng, W. Neuroinflammation in Epileptogenesis: From Pathophysiology to Therapeutic Strategies. Front Immunol 2023, 14, 1269241. [Google Scholar] [CrossRef]
- Korotkov, A.; Broekaart, D.W.M.; Banchaewa, L.; Pustjens, B.; van Scheppingen, J.; Anink, J.J.; Baayen, J.C.; Idema, S.; Gorter, J.A.; van Vliet, E.A.; et al. MicroRNA-132 Is Overexpressed in Glia in Temporal Lobe Epilepsy and Reduces the Expression of Pro-epileptogenic Factors in Human Cultured Astrocytes. Glia 2019, 68, 60. [Google Scholar] [CrossRef]
- Huang, Y.; Guo, J.; Wang, Q.; Chen, Y. MicroRNA-132 Silencing Decreases the Spontaneous Recurrent Seizures. Int J Clin Exp Med 2014, 7, 1639. [Google Scholar] [PubMed]
- Tak, A.Y.; Tak, N.; Uslu, F.I.; Yucesan, E. Diagnostic Panel of Three Genetic Biomarkers Based on Artificial Neural Network for Patients With Idiopathic Generalized Epilepsy. Acta Neurol Scand 2024, 2024, 8853018. [Google Scholar] [CrossRef]
- Xie, G.; Chen, H.; He, C.; Hu, S.; Xiao, X.; Luo, Q. The Dysregulation of MiRNAs in Epilepsy and Their Regulatory Role in Inflammation and Apoptosis. Funct Integr Genomics 2023, 23. [Google Scholar] [CrossRef] [PubMed]
- Ghafouri-Fard, S.; Hussen, B.M.; Abak, A.; Taheri, M.; Jalili Khoshnoud, R. Aberrant Expression of MiRNAs in Epilepsy. Mol Biol Rep 2022, 49, 5057–5074. [Google Scholar] [CrossRef] [PubMed]
- Martins-Ferreira, R.; Chaves, J.; Carvalho, C.; Bettencourt, A.; Chorão, R.; Freitas, J.; Samões, R.; Boleixa, D.; Lopes, J.; Ramalheira, J.; et al. Circulating MicroRNAs as Potential Biomarkers for Genetic Generalized Epilepsies: A Three MicroRNA Panel. Eur J Neurol 2020, 27, 660–666. [Google Scholar] [CrossRef]
- Wu, Z.; Liu, Y.; Huang, J.; Huang, Y.; Fan, L. MiR-206 Inhibits Epilepsy and Seizure-Induced Brain Injury by Targeting CCL2. Cytotechnology 2019, 71, 809. [Google Scholar] [CrossRef] [PubMed]
- Duan, W.; Chen, Y.; Wang, X.R. MicroRNA-155 Contributes to the Occurrence of Epilepsy through the PI3K/Akt/MTOR Signaling Pathway. Int J Mol Med 2018, 42, 1577–1584. [Google Scholar] [CrossRef] [PubMed]
- Çarman, K.B.; Tekin, H.G.; Çavuşoğlu, D.; Yarar, C.; Kaplan, E.; Karademir, C.N.; Arslantaş, D. Evaluation of MicroRNAs in Pediatric Epilepsy. Turkish Archives of Pediatrics 2023, 58, 429. [Google Scholar] [CrossRef]
- Huang, L.G.; Zou, J.; Lu, Q.C. Silencing Rno-MiR-155-5p in Rat Temporal Lobe Epilepsy Model Reduces Pathophysiological Features and Cell Apoptosis by Activating Sestrin-3. Brain Res 2018, 1689, 109–122. [Google Scholar] [CrossRef] [PubMed]

| Variable | Group | P value | ||
| TLE | JME | Control | ||
| Gender | ||||
| Males: n, % | 27 50.94% |
15 35.71% |
14 34.15% |
χ2 0.179 |
| Females: n, % | 26 49.06% |
27 64.29% |
27 65.85% |
|
| Age | ||||
| Young age (<40): n, % | 44 81.48% |
40 95.24% |
33 80.49% |
χ2 0.094 |
| Middle age (>40): n, % | 10 18.52% |
2 4.76% |
8 19.51% |
|
| Disease duration | ||||
| >10 years | 29 54.72% |
18 45.00% |
χ2 0.509 |
|
| 5-10 years | 14 26.42% |
15 37.50% |
||
| <5 years | 10 18.87% |
7 17.50% |
||
| Age of onset | 21 [15; 30] | 15.5 [13; 17] | U test 0.003 |
|
| Disease duration | 13 [7; 21] | 10 [5; 16.75] | U test 0.193 |
|
| NHS-3 | 12 [7.25; 17.75] | 16 [10; 19.5] | U test 0.411 |
|
| HADS (anxiety) | 5 [4; 9] | 7 [5; 9] | U test 0.224 |
|
| HADS (depression) | 4 [2; 7] | 5 [2; 9.75] | U test 0.238 |
|
| AEDS amount | 2 [1; 3] | 2 [1; 3] | U test 0.173 |
|
| microRNA | Feature | P value TLE | P value JME | |
| 134-5p | Serial course | Not serial course | 0.829 | 0.986 |
| 106b-5p | 0.674 | 0.408 | ||
| 122-5p | 0.578 | 0.396 | ||
| 132-5p | 0.369 | 0.928 | ||
| 155-5p | 0.169 | 0.102 | ||
| 206-5p | 0.215 | 0.59 | ||
| Not compensated | Compensated | |||
| 134-5p | 0.29 | 0.967 | ||
| 106b-5p | 0.523 | 0.77 | ||
| 122-5p | 0.218 | 0.897 | ||
| 132-5p | 0.42 | 0.089 | ||
| 155-5p | 0.773 | 0.152 | ||
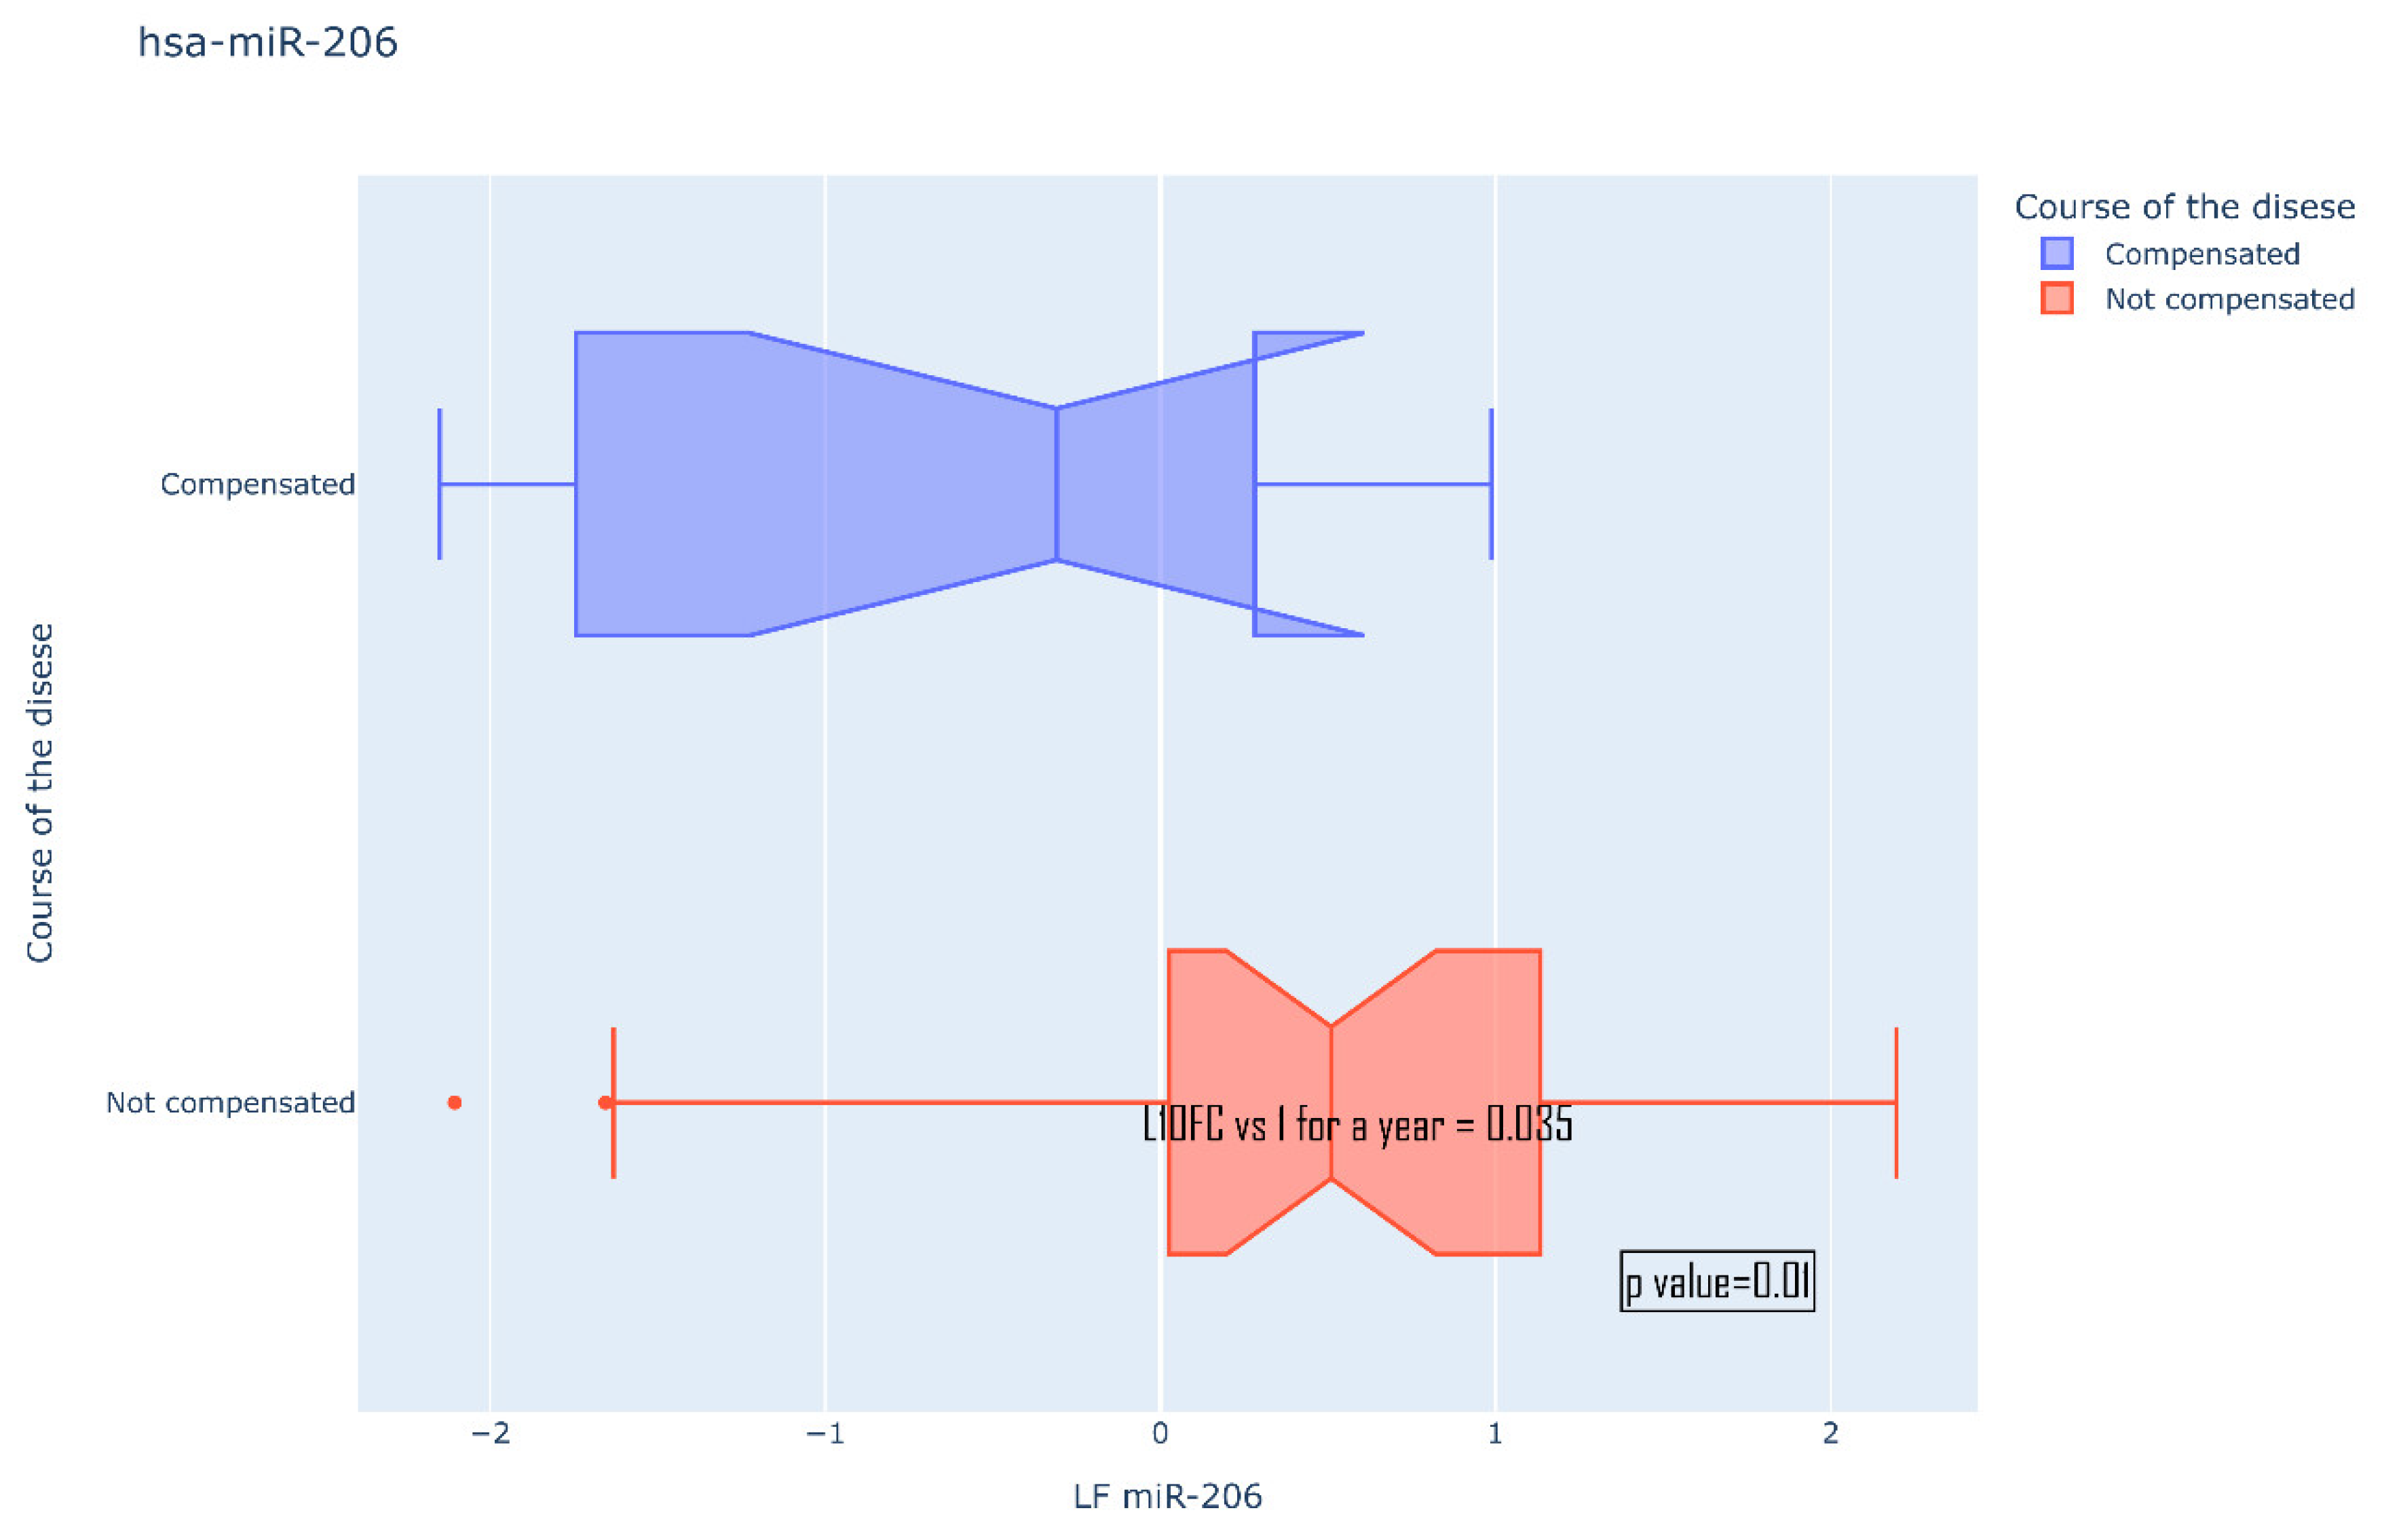
| 206-5p | 0.726 | 0.0104 ** | ||
| BTCS/GTCS (>4 for a year/ 1-4 for a year/ 1 for a year) |
||||
| 134-5p | 0.253 | 0.313 | ||
| 106b-5p | 0.272 | 0.946 | ||
| 122-5p | 0.129 | 0.734 | ||
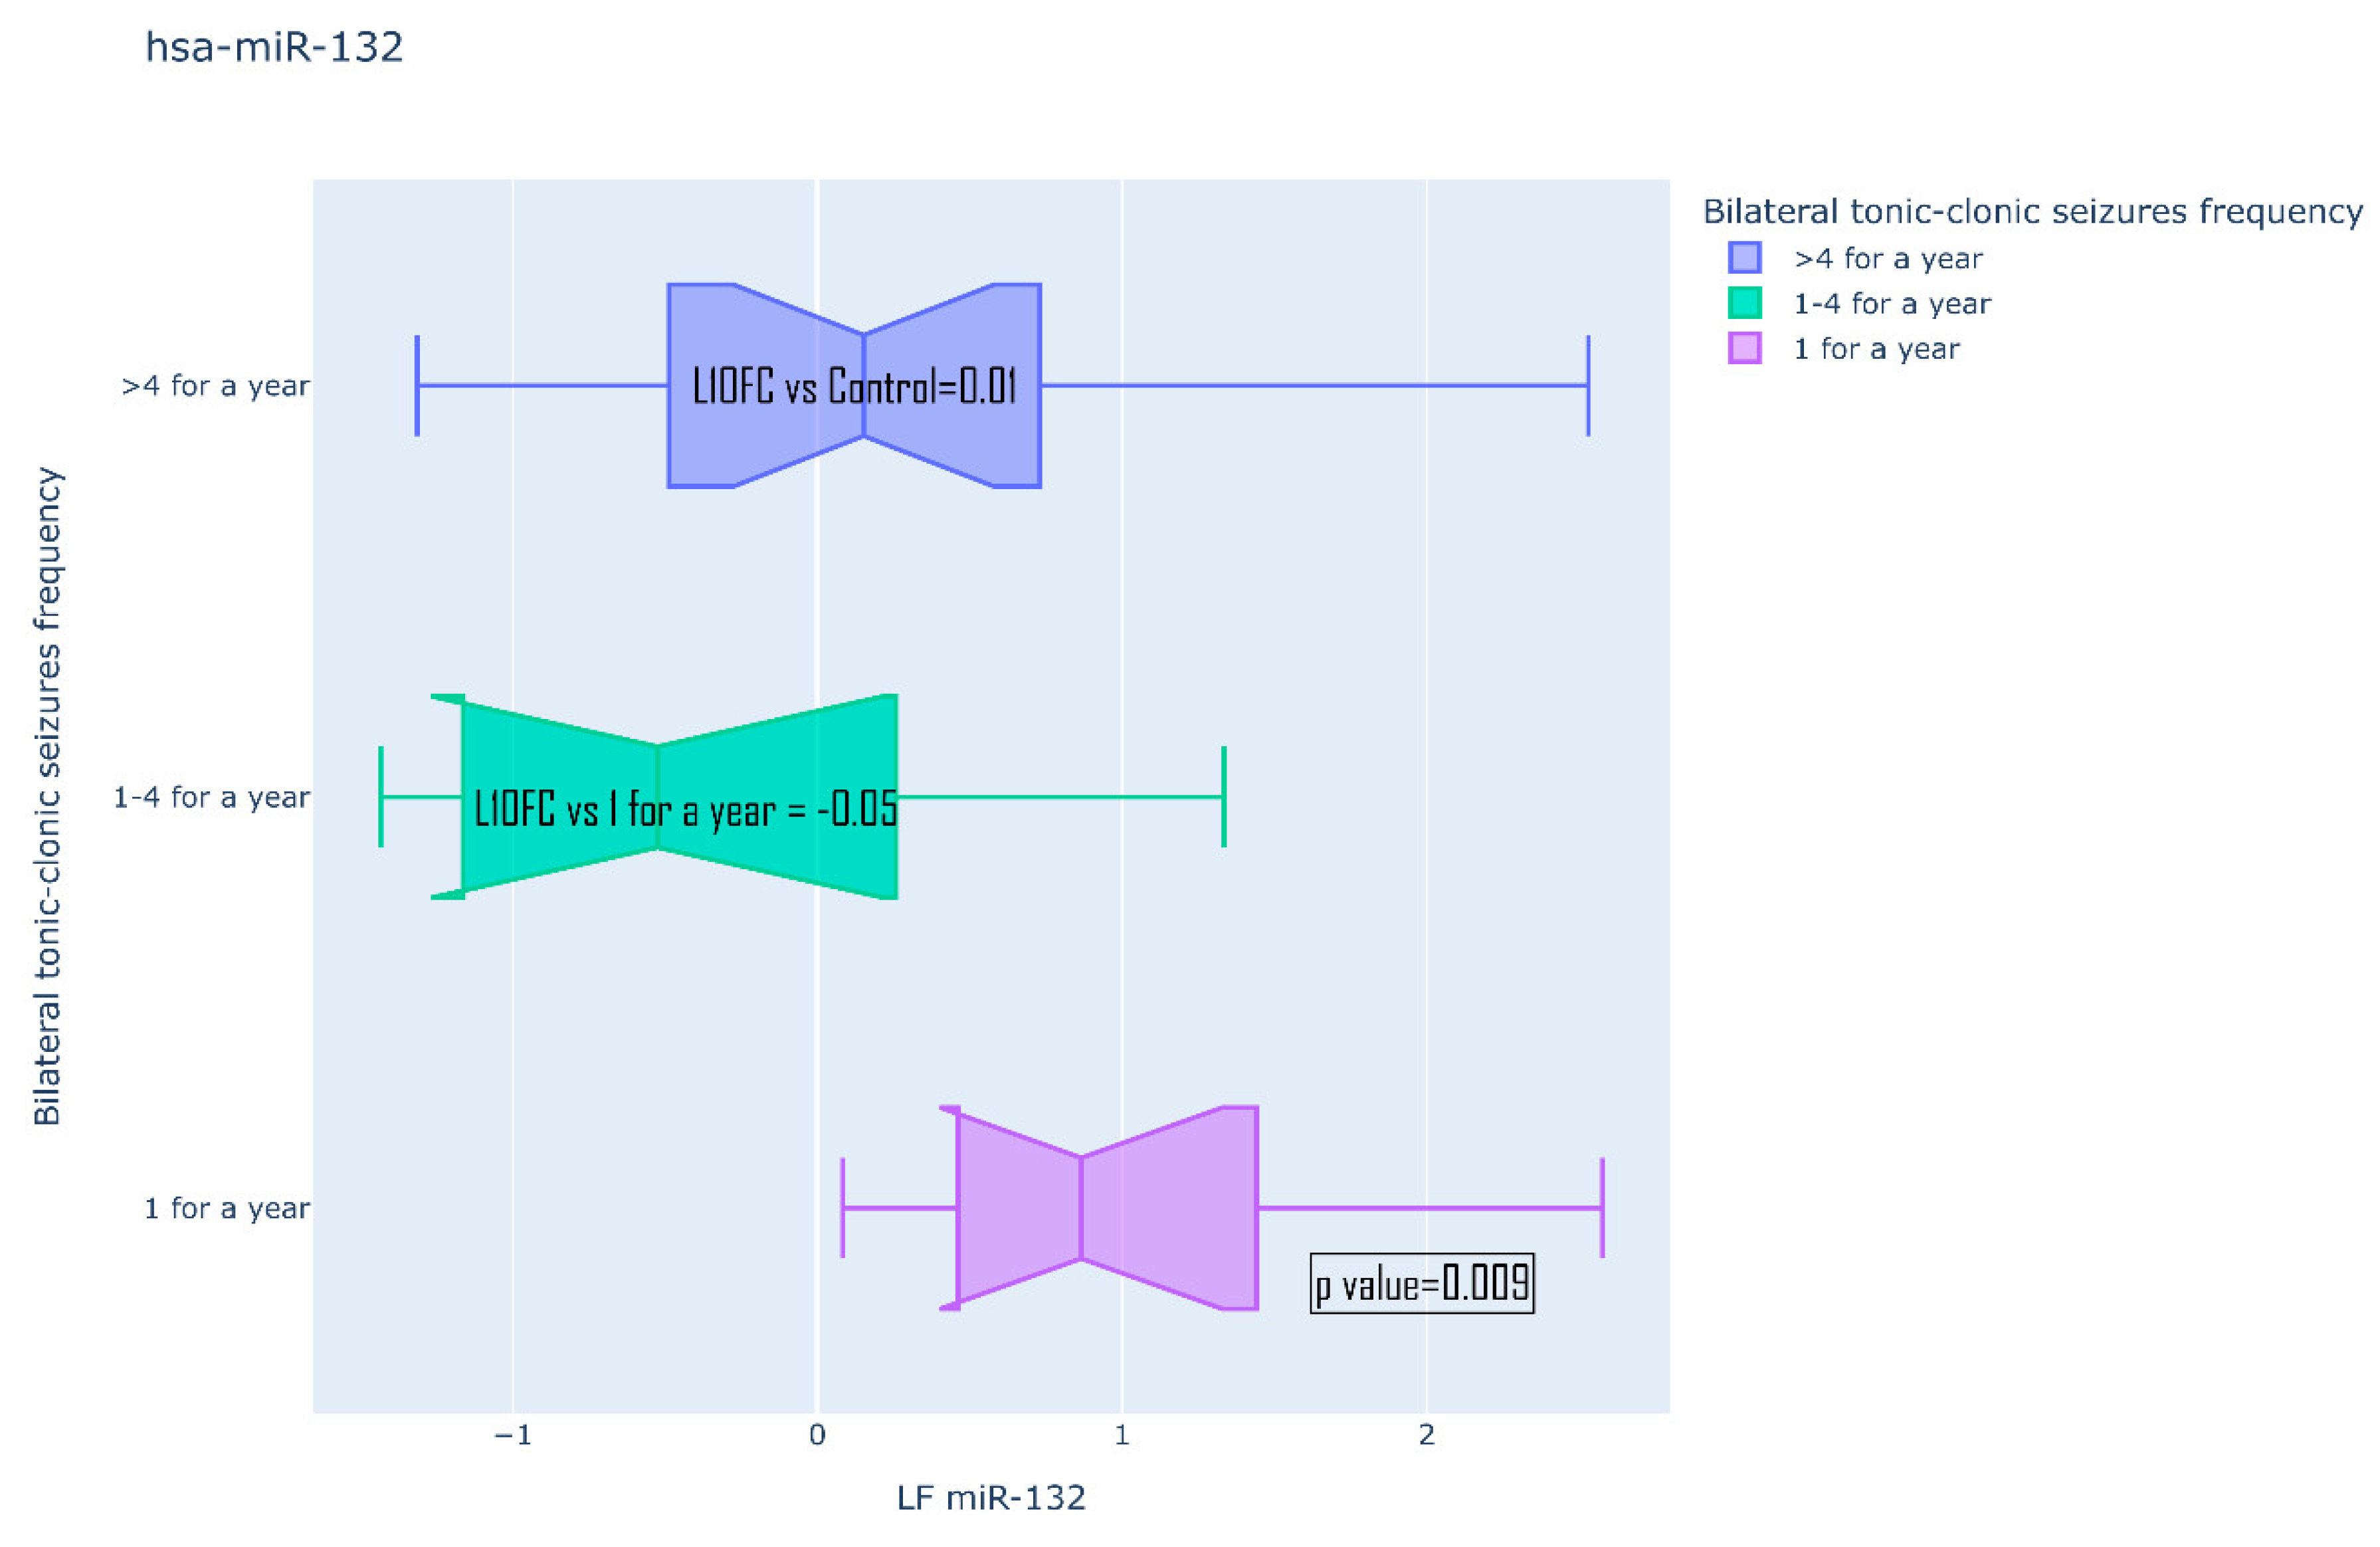
| 132-5p | 0.009 | 0.459 | ||
| 155-5p | 0.431 | 0.946 | ||
| 206-5p | 0.165 | 0.459 | ||
Disclaimer/Publisher’s Note: The statements, opinions and data contained in all publications are solely those of the individual author(s) and contributor(s) and not of MDPI and/or the editor(s). MDPI and/or the editor(s) disclaim responsibility for any injury to people or property resulting from any ideas, methods, instructions or products referred to in the content. |
© 2024 by the authors. Licensee MDPI, Basel, Switzerland. This article is an open access article distributed under the terms and conditions of the Creative Commons Attribution (CC BY) license (http://creativecommons.org/licenses/by/4.0/).


