
Submitted:
23 November 2024
Posted:
25 November 2024
You are already at the latest version
Abstract
Background: Dysregulation of microRNAs (miRNAs) has been detected in patients with gastric cancer (GC), which inspired the use of miRNAs as a novel biomarker for GC. In this study, we investigated the previously reported miRNA dysfunction in cancer tissues as a potential plasma biomarker for GC using quantitative reverse transcriptase polymerase chain reaction (RT-PCR).Methods: The published miRNA abnormalities were searched in the microRNA Cancer Association Database. Plasma samples were collected from patients with GC (n=26) and controls (n=17). The sensitivity and specificity of polyadenylation RT-PCR (PA-RT) and stem-loop RT-PCR (SL-RT) were compared. Statistical comparisons between patients with GC and controls were performed to identify miRNA biomarkers, and correlation analyses between the threshold cycle (Ct) values of miRNAs and various blood biochemical parameters were performed to elucidate the confounding factors. Results: mir-17, mir-21, mir-31, mir-99b, mir-222, and U6 were selected. PA-RT showed greater sensitivity and lower specificity than SL-RT (PA-RT vs. SL-RT, mean Ct: 19.6 vs. 29.2; coefficient of variation: 0.42 vs. 0.10). We adopted SL-RT owing to its higher specificity and found that only mir-222 was significantly upregulated in patients with GC (GC vs. control, miRNA expression: 15.4 vs. 5.27, P=0.0098). We found that mir-31 and mir-99b were correlated with blood urea nitrogen levels, whereas mir-21 was correlated with neutrophil counts.Conclusion: Only plasma mir-222 was confirmed to be dysregulated in patients with GC, irrespective of biochemical parameters.
Keywords:
Micro RNAs
; Gastric cancer
; mir-222
Introduction
Gastric cancer (GC) is the fifth most common type of cancer and the fourth leading cause of cancer-related deaths worldwide [1]. The recently published Japanese nationwide statistics for the 5-year net survival outcomes of GC are 70%, which are comparable to those of colon cancer 5-year net survival outcome. However, among more advanced GCs, such as stage III and IV disease, the survival rates are 40% and 5%, respectively, indicating that GC is a difficult-to-treat cancer. Nevertheless, treatment outcomes have gradually improved in recent years with the development of a wide range of chemotherapeutic options [2, 3]. Complete surgical resection following an early diagnosis remains the most effective therapy for GC. Therefore, developing reliable and practical biomarkers that enable the early detection of GC is highly desirable. Recently, circulating microRNAs (miRNAs) have emerged as novel early cancer detection biomarkers for a range of cancers [4].
miRNAs are noncoding RNAs consisting of approximately 22 nucleotide bases that direct the post-transcriptional repression of messenger RNA (mRNA) targets to modify the protein expression in cells. Approximately 2000 human miRNAs have been registered and the estimated miRNA targets exceed 60% of the total human mRNA [5].
The repression of mRNA by miRNAs involves multiple biosynthetic steps and complex molecular machinery. First, miRNAs are transcribed by RNA polymerase II as longer precursor RNAs called “pri-miRNAs.” Each pri-miRNA has at least one hairpin structure that is recognized by the Drosha/DGCR8 complex with RNA endonuclease activity. Drosha cuts pri-miRNAs to liberate stem-loop RNAs of approximately 60 nucleotide bases called “pre-miRNAs” [6]. These pre-miRNAs are exported from the nucleus to the cytoplasm via exportin 5 and RAN-GTP [7].
In the cytoplasm, dicers with RNA endonuclease dissect pre-miRNAs to generate duplex miRNAs, and the duplex miRNA is loaded onto an Argonaute protein (AGO) with assistance from the chaperone protein HSC70/HSP90 along with ATP expenditure [8]. Following duplex loading, AGO relaxes back to its original conformation and forces the expulsion of a single miRNA strand to form a mature silencing complex [9].
AGO loading and miRNA target recognition is primarily through Watson–Crick pairing between the miRNA “seed” (miRNA of 2–7 nucleotides) and sites within the 3’ untranslated regions (3’UTRs) of target mRNAs [10]. AGO recruits TNRC6, which interacts with the mRNA poly(A) associated with the poly(A)-binding protein, and recruits deadenylase complexes (PAN2-PAN3 and CCR4-NOT complexes), leading to mRNA destabilization [11].
Differences in miRNA expression have a great impact on cancer cell proliferation, differentiation, and metastasis and immune response. Interestingly, recent studies have shown that oncogenic K-Ras suppresses the expression of a broad range of miRNAs and increases the expression of its target mRNAs in colon cancer mouse models. This result provides a critical perspective that a single oncogene can influence the cancer phenotype not only by gene expression through signal transduction but also by a global change in the miRNA quantity [12]. Furthermore, global miRNA expression profiles of cancer tissues can be used to differentiate other types of cancers, indicating that each cancer has a unique miRNA expression profile [13]. These studies suggest that miRNAs add complexity to cancer biology, and understanding the function of miRNAs in cancer pathology is required.
Tumor-derived miRNAs have been hypothesized to enter the patient’s circulatory system and are detected in human plasma. Therefore, circulating miRNAs are expected to be the next-generation tumor biomarkers for cancer detection. Circulating miRNAs can successfully discriminate between cancers and non-cancers with high accuracy [14, 15]. In line with this, several miRNA types have been shown to be differentially expressed in the serum of patients with GC [16].
A recent study evaluated the serum miRNA data from Japanese patients with cancer using machine learning and demonstrated that the dysregulation of miRNA profiles could identify various cancer types, irrespective of the disease stage [17]. However, because of the small size of miRNAs and the sequence similarity between them, measuring miRNAs using microarrays is problematic for cross-hybridization. For a large-scale assessment using microarray platforms, the identified dysregulated miRNAs must be verified by quantitative reverse transcriptase polymerase chain reaction (qRT-PCR), which is more sensitive and accurate than microarrays [18,19,20].
However, detecting plasma miRNAs is difficult because their concentration is lower than that in the tissue. Therefore, miRNA abnormalities assessed in cancer tissues do not warrant abnormalities in the plasma. Owing to their scarcity in plasma, the reliable and accurate analysis of miRNAs is a major issue. Owing to its high sensitivity and specificity, qRT-PCR is the gold standard method for measuring miRNAs in plasma. However, the qRT-PCR results for plasma can be compromised by sample handling [21] and are influenced by the different qRT-PCR methods applied [22].
In this study, we compared two major qRT-PCR methods (polyadenylation and stem-loop RT-PCR) to assess the reliability of their miRNA measurements. Next, we analyzed the influences of biochemical parameters and blood cell counts on the qRT-PCR results. Finally, we confirmed the previously reported miRNA abnormalities using GC tissues in the plasma samples to identify reliable plasma miRNA biomarkers for GC.
Materials and methods
miRNA selection from the microRNA Cancer Association Database
The published miRNA abnormalities were searched in the microRNA Cancer Association Database (http://mircancer.ecu.edu). The terms “Esophageal,” “Gastric,” and “Colon” were used to search for the reported miRNA abnormalities for each cancer type. We chose mir-21 and mir-31 as miRNA abnormalities specific to esophageal, gastric, and colon cancers; mir-99b as an miRNA abnormality specific to esophageal cancer; and mir-17 and mir-222 as miRNA abnormalities specific to GC [23]. Some studies reported that mir-21 expression was upregulated in GC tissues, whereas others reported that mir-31 was downregulated [24]. We also included the U6 small nuclear RNA (U6 snRNA) as an internal control.
Sample preparation
miRNAs were prospectively purified from blood samples collected from patients visiting the hospital between April 2024 and June 2024. A total of 44 blood samples from patients with GC were extracted into an ethylenediaminetetraacetic acid-coated tube and stored at 4 ℃ for 2–4 h until plasma separation. The tube was centrifuged at 1750×g for 2 min at 4 ℃ to separate the plasma, which was stored at -80 ℃ until miRNA purification. The miRNA was purified from 300 μL of plasma using the Nucleospin miRNA Plasma kit (Marcherey-Nagel, Duren, Germany) according to the manufacturer’s instructions. This study was approved by the Institutional Review Board of Toho University (approval number: S22033), and informed consent was obtained from all participants. This study protocol adhered to the principles outlined in Helsinki Declaration of 1964 and later version. The blood samples were also used to measure the biochemical parameters (albumin, alkaline phosphatase [ALP], alanine aminotransferase [ALT], aspartate aminotransferase [AST], blood urea nitrogen [BUN], creatinine, C-reactive protein [CRP], lactate dehydrogenase [LDH], and γ-glutamyl transpeptidase [γGTP]) and blood cell counts (white blood cells [WBCs], neutrophils, lymphocytes, monocytes, eosinophils, red blood cells [RBCs], and platelets). Tumor characteristics, such as the histological classification, depth of tumor invasion, lymph node metastasis, and distant metastasis, were determined using the Japanese Classification of Gastric Carcinoma [25].
miRNA quantification using polyadenylation RT-PCR
The miRNA was quantified via polyadenylation RT-PCR using Mir-XTM miRNA First-Strand Synthesis and TB GreenⓇ qRT-PCR (Takara Bio USA Inc., Mountain View, USA). For this, 2.0 μL of purified miRNA, 2.5 μL of imRQ buffer (2×), and 0.5 μL of mRQ enzyme were mixed to obtain a 5.0-μL reaction mixture. The reaction mixture was incubated in a PCR reaction tube for 60 min at 37 ℃, 30 min at 85 ℃, and 5 min at 85 ℃ and subsequently held at 4 ℃. Real-time PCR was performed using the StepOne Plus Real-Time PCR System (Thermo Fisher Scientific K.K, Japan) . The 12.5-μL PCR reaction mixture contained 1 μL of the RT product, 6.25 μL of the TB Green Advantage Premix (2×), 0.25 μL of ROX dye (50×), 0.25 μL of the miRNA specific primer (10 μM), 0.25 μL of the mRQ3’ primer (10 μM), and 4.5 μL of nuclease-free distilled water. The reaction mixtures were incubated in a 96-well plate (MicroAmp Fast 96-well reaction plate [0.1 μL at 95 ℃ for 10 s, followed by 40 cycles at 95 ℃ for 5 s and at 60 ℃ for 20 s. Each sample was run in triplicates. The specific primer for measuring 99b-5p [5’CACCCGTAGAACCGACCTTGCG] was synthesized using FASMAC (Kanagawa, Japan). The primer for U6 was amplified using the Mir-XTM miRNA First-Strand Synthesis kit.
miRNA quantification using stem-loop RT-PCR
miRNAs were quantified via stem-loop RT-PCR using TaqMan miRNA assays (Applied Biosystems, Foster City, CA, USA). A 7.5-μL reaction mixture was prepared by mixing 2.5 μL of purified miRNA, 0.5 μL of 10-mM dNTPs, 0.25 μL of MultiScribeTM RT, 0.75 μL of 10× RT buffer, 0.10 μL of RNA inhibitor, 1.5 μL of 5× stem-loop RT primers (designed to specific miRNA targets), and 1.6 μL nuclease-free distilled water. The reaction mixture was incubated in a PCR reaction tube for 30 min at 16 ℃, 30 min at 42 ℃, and 5 min at 85 ℃ and subsequently held at 4 ℃. Real-time PCR was performed using the standard TaqMan PCR kit with the StepOne Plus Real-Time PCR SystemThe 10-μL PCR reaction mixture contained 1 μL of the RT product, 1× TaqMan Universal PCR master mix, and 1× TaqMan miRNA primer. Reaction mixtures were incubated in a 96-well plate (MicroAmp Fast 96-well reaction plate [0.1 nL]) at 95 ℃ for 20 s, followed by 40 cycles at 95 ℃ for 1 s and 60 ℃ for 20 s. Each sample was run in triplicates. The purchased TaqMan miRNA assays were U6 snRNA (assay ID 001973), has-miR-17-5p (assay ID 002308), has-miR-21-5p (assay ID 000397), has-miR-99b-5p (assay ID 000436), and has-miR-222-3p (assay ID 002276) [26]. The threshold cycle (Ct) was used as the surrogate miRNA in the PCR. To calculate relative miRNA expression levels, the global standardization Ct(stand.) value was calculated by adding all miRNA values divided by the total sample number (N=88; Ct(stand.)=27.01). The relative miRNA expression was calculated as follows: relative miRNA expression = 2 exp – (Ct-Ct(stand.)).
Statistical analysis
All statistical analyses were performed using the R project (version 2.3-0) with EZR on the R commander (version 1.35). Continuous variables are expressed as means ± standard deviation (SD) or medians with interquartile ranges, whereas categorical variables are expressed as numbers and percentages. The samples were obtained from patients who were divided into two groups: those with GC who did not undergo resection (GC group) and controls who underwent GC resection (control [CN] group). Parametric data were compared between the groups using the unpaired Student’s t-test, whereas nonparametric data were analyzed using the Mann–Whitney U test. Categorical variables were compared using the chi-square test. Correlation analysis was performed by calculating Pearson’s correlation coefficients between the variables. Statistical significance was defined as a two-sided p-value of <0.05.
Results
Search for potential plasma miRNA biomarkers for GC using a web application
We searched for miRNA biomarker candidates using an interactive web application called “miRCancerDB,” which was established using the Cancer Genomic Atlas data [27]. Overall, 66, 285, and 90 miRNAs were found to be dysregulated in esophageal, gastric, and colon cancers, respectively (Figure 1). Among them, 11, 185, and 13 miRNAs had miRNA abnormalities specific to esophageal, gastric, and colon cancers, respectively. We selected mir-99b as an esophageal cancer-specific biomarker and mir-17 and mir-222 as GC-specific biomarkers. A total of 28 miRNAs were identified as common dysfunctional miRNAs for the three cancer types, of which we selected mir-21 and mir-31 (Figure 1).
Comparison of variability between polyadenylation and stem-loop RT-PCR for miRNA quantification
mir-99b and U6 snRNA miRNA levels were measured by polyadenylation RT-PCR using 13 samples, and their relative Ct values were 24.3±10.8 and 15.0±6.11, respectively. The coefficients of variation (CV) were 0.44 and 0.41, respectively. Next, miRNA levels were measured by stem-loop RT-PCR using 43 samples. Their Ct values were 28.3±3.03 and 30.1±2.96, respectively, and CVs were 0.11 and 0.09, respectively. The mean Ct values for polyadenylation and stem-loop RT-PCRs were 19.6 and 29.2, respectively, indicating that polyadenylation RT-PCR had higher sensitivity than stem-loop RT-PCR. The mean CV for polyadenylation RT-PCR was 0.42 and that for stem-loop RT-PCR was 0.10, indicating that stem-loop RT-PCR had higher specificity than polyadenylation RT-PCR. Based on these results, we adopted stem-loop RT-PCR for further study (Table 1).
qRT-PCR, quantitative reverse transcription polymerase chain reaction.
Higher plasma mir-222 expression is noted in patients with advanced tumor characteristics and a lower nutritional status
miRNAs quantified using Ct values were compared between the GC and CN groups (n = 26 vs. 17). Only the mir-222 expression significantly differed between the groups (GC vs. CN: 23.6±2.92 vs. 25.8±3.37; P=0.0269). A comparison of relative miRNA expressions showed that mir-222 and U6 expressions significantly differed between the GC and CN groups (mir-222: 15.4 [7.79–45.0] vs. 5.27 [0.22–9.15], P=0.0098; U6: 0.19 [0.084–0.454] vs. 0085 [0.0066–0.182], P=0.0447). The least expressed miRNA was mir-31 (relative expression: ~0.01), and the most abundantly expressed miRNAs were mir-17 and mir-31, (relative expression: ~30). Furthermore, we compared the demographic data and tumor characteristics between the groups. The patient’s age, sex ratio, weight, and height were comparable between the GC and CN groups (age: 70±11.5 vs. 72.9±11.5 years, P=0.562; female/male: 15 [57.7%]/11 [42.3%] vs. 9 [52.9%]/8 [47.1%], P=1.00; weight: 47.9±8.8 vs. 50.7±5.6 kg, P=0.259; and height: 155±8.0 vs. 159±6.6 cm, P=0.17). Although the tumor pathology was similar, comprising a high rate of tubular adenocarcinoma (GC vs. CN, poorly differentiated/signet cell-type/tubular adenocarcinoma: 5 [19.2%]/4 [45.4%]/17 [65.4%] vs. 4 [23.5%]/0 [0%]/13 [76.5%], P=0.236), the tumor characteristics significantly differed between the groups. Patients in the GC group had a higher number of invasive tumors (GC vs. CN, T1/T2/T3/T4: 0 [0%]/0 [0%]/14 [53.8%]/12 [46.2%] vs. 7 [41.2%]/3 [17.6%]/5 [2.94%]/5 [29.4%]/2 [11.8%], P<0.01), multiple lymph node metastases (N0/N1/N2/N3: 14 [53.8%]/0 [0%]/2 [7.7%]/10 [38.5%]vs. 7 [41.2%]/2 [11.8%]/6 [35.3%]/2 [11.8%], P=0.02,), and higher rates of distant metastasis (M0/M1: 5 [19.2%]/21 [80.8%] vs. 15 [88.2%]/2 [11.8%], P<0.01) than those in the CN group. Moreover, lesions in the GC group tended to be more proximal than those in the CN group (Esophageal junction (EGJ)/ Upper (U)/ Middle (M) / Lower (L): 12 [46.2%]/2 [7.7%]/7 [26.9%]/5 [19.2%] vs. 5 [29.4%]/1 [5.9%]/1 [5.9%]/10 [58.8%], P=0.04; Table 2). A comparison of biochemical parameters and blood cell counts showed that albumin levels and lymphocyte and platelet counts significantly differed between the groups (GC vs. CN, albumin: 3.3 [3.1–3.7] vs. 3.8 [3.6–3.8], P<0.01; lymphocytes: 970 [816–1243] vs. 1871 [1367–2262], P<0.01; platelets: 24.1 [13.1–28.3] vs. 31.9 [17.2–33.6], P=0.03). Other parameters such as ALP, GPT, AST, BUN, creatinine, CRP, LDH, and γ-GTP and neutrophil, monocyte, eosinophil, and RBC counts were comparable between the groups (Table 3).
Plasma miRNA correlation analysis
The miRNA mutual correlation analysis showed that the Ct value of mir-17 was positively correlated with those of mir-21 and mir-99b (r=0.748 and 0.728, respectively). The Ct value of mir-21 was positively correlated with those of mir-17, mir-99b, and mir-222 (r=0.748, 0.842, and 0.794, respectively). The Ct value of mir-31 was correlated with those of other miRNAs and that of mir-99b was positively correlated with those of mir-17, mir-21, and mir-222 (r=0.728, 0.842, and 0.702, respectively). The Ct value of mir-222 was strongly correlated with those of mir-21, mir-99b, and U6 (r=0.794, 0.702, and 0.704, respectively). The Ct value of U6 was strongly correlated with that of mir-222 (r=0.704). The Ct values of mir-17, mir-21, mir-99b, and mir-222 correlated with each other. However, the Ct value of mir-31 did not correlate with those of other miRNAs. Ct values of U6 and mir-222 correlated with each other. In addition, the correlation analysis of miRNA Ct values against biochemical parameters showed that the Ct value of mir-31 and BUN levels were weakly correlated (r=0.334, P=0.0285) and that the Ct value of mir-99b and BUN or creatinine levels were weakly correlated (r=0.355, p=0.195 and r=0.311, p=0.0424, respectively). Additionally, a correlation analysis of miRNA Ct values against blood cell counts was performed. Ct values of mir-17, mir-21, and mir-99b were negatively correlated with platelet counts (r=-0.387, p=0.00103; r=-0.350, p=0.0213; and r=-0.344, p=0.0237, respectively). The Ct value of mir-21 was negatively correlated with the total WBC and neutrophil counts (r=-0.382, p=0.0115 and r=-0.380, p=0.012, respectively; Figure 2).
Discussion
Most of the previous miRNA abnormalities associated with GC were elucidated by researchers using microarray chips by comparing relatively small cancer and normal tissue samples [28]. Therefore, abnormal plasma miRNA levels, which must be diluted from the cancer tissue, should be confirmed to realize circulating miRNAs as clinical biomarkers. In this study, we first searched for potential GC miRNA biomarkers using the miRCancer database, which provides comprehensive data on miRNA expression in various cancers in humans. This database was automatically extracted from PubMed, and text-mining techniques were utilized for information collection. Finally, we chose mir-21 and mir-31 as common miRNA abnormalities specific to esophageal, gastric, and colon cancers; mir-99b as an esophageal cancer-specific miRNA abnormality; and mir-17 and mir-222 as GC-specific miRNA abnormalities with no obvious intentions. Multiple measurements are required for the clinical use of miRNAs as biomarkers; therefore, we performed two qRT-PCR methods suitable for measuring the miRNA quantity in plasma owing to their low cost and convenience [23].
We first compared the sensitivity and specificity of polyadenylation and stem-loop RT-PCRs. Consistent with that reported in a previous study, polyadenylation RT-PCR showed greater sensitivity than stem-loop RT-PCR in terms of smaller Ct values for mir-99b and U6 [29]. Conversely, the accuracy of polyadenylation RT-PCR was lower than that of stem-loop RT-PCR method in terms of higher CV values. The stem-loop RT-PCR method includes additional nucleic-acid target paring to detect RT products in the PCR phase, which is realized using TaqMan probes (dual-labeled probes with a fluorophore at the 5’ end and quenchers at the 3’ end). This unique characteristic could explain its higher specificity to detect miRNAs. Because miRNAs are short in length and similar in base composition, stem-loop RT-PCR with high specificity is an idealistic and reliable miRNA detection method.
U6 is commonly used as an endogenous internal control to normalize miRNA expression in different samples. However, plasma U6 levels vary under certain conditions and are not suitable as internal controls for plasma miRNA measurements [30]. Therefore, we applied global normalization, which was calculated using all analyzed miRNA samples, to measure the relative plasma miRNA expression. We found that mir-31, mir-99b, and U6 levels were relatively low (relative expression, <1) in plasma, whereas mir-17, mir-21, and mir-222 levels were high (relative expression, 5–45). Therefore, high plasma miRNA levels are required to ensure a highly sensitive detection of an miRNA biomarker for GC. To fulfill this requirement, mir-17, mir-21, and mir-222 can be considered as potential biomarkers for GC.
This study revealed a higher plasma mi-222 expression in patients with GC. The upregulation of circulating mir-222 has been reported in previous studies, and mir-222 is thought to be an oncogenic miRNA [31, 32, 33]. Our findings successfully recapture the previously reported mir-222 dysregulation. The mir-222 targets, such as the reversion-inducing cysteine-rich protein with Kazal motifs [33], WEE1 [34], homeodomain interacting protein kinase 2 [35], vestigial-like family member 4 [36], and PTEN [37], modulate the proliferation, invasion, metastasis, and apoptosis of GC cells. Interestingly, using miRDB to predict the mir-222 target, 619 targets for mir-222-3p and 601 targets for mir-222-5p were found. According to this in silico study, most mir-222 targets and their effects on GC have not been studied [38].
We found that the Ct values of mir-17, mir-21, and mir-99b were negatively correlated with platelet counts, indicating that their expressions were positively correlated with platelet counts. Consistent with this finding, one study showed that residual platelets in the plasma increase extracellular miRNA levels, and one freeze/thaw cycle of plasma dramatically increases extracellular miRNA levels by inducing miRNA release from the platelets. This study indicates the importance of remaining platelets as a miRNA source and their meticulous removal from plasma before performing miRNA measurements [39]. By contrast, Ct values of mir-31, mir-222, and U6 were not correlated with platelet counts, suggesting that these miRNAs were less influenced by residual platelets in the plasma. Because of its lower influence on platelet contamination, mir-222 is considered a suitable plasma tumor marker for GC.
In the context of plasma miRNA contamination, the effect of hemolysis should also be considered. High concentrations of several miRNAs were found in RBCs [40]. Despite the lack of a correlation between the Ct values of the analyzed miRNAs and RBC counts, mir-16 is one of the most abundant miRNAs in RBCs, and several studies have shown that its expression increases with the degree of hemolysis [41]. This result and those reported in previous studies suggest that miRNAs released from RBCs during sample handling could be an obstacle to accurate miRNA measurement. Therefore, contamination-indicating miRNAs such as mir-17, mir-21, and mir-99b for platelet degradation and mir-16 for RBC hemolysis must be included to accurately measure miRNA biomarkers. As we could not differentiate miRNAs from blood cells and cancer cells, it is practical to choose those miRNAs that are only released from the cancer tissue as cancer biomarkers.
In addition to platelets, mir-21 expression was correlated with neutrophil counts. Neutrophils, similar to platelets and RBCs, are a source of miRNAs, and specific miRNAs produced from neutrophils have been previously reported to function as regulators of inflammation [42]. mir-21 expression is associated with inflammatory diseases such as chronic obstructive pulmonary disease [43] and asthma [44] and with GC progression [45]. In this study, we could not confirm mir-21 as a plasma biomarker for GC. However, as mir-21 expression increases with the neutrophil count, the possible role of mir-21 in inflammation and GC progression must be investigated in future studies.
This study has several limitations. First, we did not compare plasma mir-222 expression levels in the same patient; the plasma extracted from the samples of the same patient before and after surgery was not compared. Second, other biochemical parameters that could not be measured may have affected mir-222 expression levels. Third, we could not confirm the origin of mir-222 and other miRNAs. The origin of the miRNAs could only be presumed based on previous research.
In conclusion, we successfully used stem-loop RT-PCR to measure plasma miRNA levels with high specificity in Japanese patients with GC. We reconfirmed the upregulation of mir-222 in the plasma samples of patients with GC, which was previously identified in tissue samples. Furthermore, mir-222 expression was independent of plasma platelet contamination, which is critical for clinical practice. Therefore, mir-222 can be considered a s
Human rights and statement and informed consent
All procedures followed were in accordance with the ethical standards of the responsible committee on human experimentation and the Helsinki Declaration of 1964 and later versions. Informed consent for inclusion in the study or equivalent was obtained from all patients.
Author Contributions
Conceptualization: Kotaro Wakamatsu, Methodology: Kotaro Wakamatsu and Atsushi Maruyama, Formal analysis and investigation: Kotaro Wakamatsu, Writing-original draft preparation: Kotaro Wakamatsu, Writing-review and editing: Atsushi Maruyama and Shinichi Okazumi, Funding acquition; all authors, Resources: Shinichi Okazumi, Supervision: Atsuhi Maruyama.
Funding
This work was supported by JSPS KAKENHI, Grant Number JP24H00791 and Johnson & Johnson K.K through J & J Medical Research Grant program.
Data availability statement
The data that support the finding of this study are available on request from the corresponding author. The data are not publicly available due to their containing information that could compromise the privacy of research participants
Conflicts of Interest
The authors declare that they have no conflict of interest.
References
- Bray F, Laversanne M, Sung H, Ferlay J, Siegel R, et al. Global cancer statistics 2022: GLOBOCAN estimates of incidence and mortality worldwide for 36 caners in 185 countries. CA Cancer J Clin. 2024, 71, 209–249. [Google Scholar]
- Higashi T, Kurokawa. Incidence, mortality, survival and treatment statics of cancers in digestive organs-Japanese cancer statistics 2024. Ann Gastroenterol Surg. 2024, 00, 1–8.
- Alsina M, Arrazubi V, Diez M, Tabernero J. Current development in gastric cancer from molecular profiling to treat strategy. Nat Rev Gastroenterol Hepatol. 2023, 20, 155–170. [Google Scholar] [CrossRef]
- Lan H, Lu H, Wang X, Jin H. Micro RNA as potential biomarkers in cancer: opportunities and challenges. BioMed Res Int. 2015, 2015, 125094. [Google Scholar]
- Friedman RC, Farh KKH, Burge CB, Bartel DP. Most mammalian mRNAs are conserved targets of microRNAs. Genome Res. 2009, 19, 92–105. [Google Scholar] [CrossRef]
- Lee Y, Ahn C, Han J, Choi H, Kim J, Yim J, et al. The nuclear RNase III Drosha initiates microRNA processing. Nature. 2003, 425, 415–419. [Google Scholar] [CrossRef] [PubMed]
- Yi R, Qin Y, Macara IG, Cullen BR. Exportin-5 mediated the nuclear export of pre-microRNAs and short hairpin RNAs. Genes Dev. 2003, 17, 3011–3016. [Google Scholar] [CrossRef] [PubMed]
- Iwasaki S, Kobayashi M, Yoda M, Sakaguchi Y, Katsuma S, Suzuki T, et al. Hsc70/Hsp90 chaperon machinery mediates ATP-dependent RISC loading of small RNA duplexes. Mol Cell. 2010, 39, 292–299. [Google Scholar] [CrossRef]
- Kamata T, Tomari Y, Making RISC. Making RISC. Trends Biochem Sci. 2010, 35, 368–376. [Google Scholar] [CrossRef]
- Bartel, DP. MicroRNAs: target recognition and regulatory functions. Cell 2009, 136, 215–233. [Google Scholar] [CrossRef]
- Chen CYA, Shyu AB. Mechanism of deadenylating-dependent decay. Wiley Interdiscip Rev RNA. 2011, 2, 167–183. [Google Scholar] [CrossRef]
- Shui B, Beyett TS, Chen Z, Li X, La Rocca GL, Gazlay WM, et al. Oncogenic K-Ras Suppresses global miRNA function. Mol Cell. 2023, 83, 2509–2523.e13. [Google Scholar] [CrossRef]
- Lu J, Getz G, Miska EA, Alvarez-Saavedra E, Lamb J, Peck D, et al. MicroRNA expression profiles classify human cancers. Nature. 2005, 435, 834–838. [Google Scholar] [CrossRef]
- Yokoi A, Matsuzaki J, Yamamoto Y, Yoneoka Y, Takahashi K, Shimizu H, et al. Integrated extracellular microRNA profiling for ovarian cancer screening. Nat Commun. 2018, 9, 4319. [Google Scholar] [CrossRef]
- Asano N, Matsuzaki J, Ichikawa M, Kawauchi J, Takizawa S, Aoki Y, et al. A serum microRNA classifier for the diagnosis of sarcomas of various histological subtypes. Nat Commun. 2019, 10, 1299. [Google Scholar] [CrossRef]
- Kawaguchi T, Komatsu S, Ichikawa D, Tsujiura M, Takeshita H, Hirajima S, et al. Circulating microRNAs: a next-generation clinical biomarker for digestive system cancers. Int J Mol Sci. 2016, 17, 1459. [Google Scholar] [CrossRef]
- Matsuzaki J, Kato K, Oono K, Tsuchiya N, Sudo K, Shimomura A, et al. Prediction of tissue-of-origin of early-stage cancers using serum miRNomes. JNCI Cancer Spectr. 2023; 7.
- Chen Y, Gelfond JAL, McManus LM, Shireman PK. Reproducibility of quantitative RT-PCR array in miRNA expression profiling and comparison with maicroarray analysis. BMC Genomics. 2009, 10, 407. [Google Scholar]
- Parervand S, Weber J, Lemoine F, Consales F, Paillusson A, Dupasquir M, et al. Concordance among digital gene expression, microarray, and qPCR when measuring different expression of microRNAs. Bio Tech. 2010, 48, 219–222. [Google Scholar]
- Jensen SG, Lamy P, Rasmussen MH, Ostenfeld MS, Dyrskjøt L, Orntoft TF, et al. Evaluation of the commercial global miRNA expression profiling platforms for detection of less abundant miRNAs. BMC Genomics. 2011, 12, 435. [Google Scholar]
- Dellett M, Simpson DA. Considerations for optimization of microRNA PCR assays for molecular diagnosis. Expert Rev Mol Diagn. 2016, 16, 407–414. [Google Scholar] [CrossRef]
- Mou G, Wang K, Xu D, Zhou G. Evaluation of three RT-qPCR-based miRNA detection methods using seven rise miRNA. Biosci Biotechnol Biochem. 2013, 77, 1349–1353. [Google Scholar] [CrossRef] [PubMed]
- Xie B, Ding Q, Han H, Wu D. miRCancer: a microRNA-cancer association database constructed by text mining on literature. Bioinformatics. 2013, 29, 638–644. [Google Scholar] [CrossRef]
- Wang QX, Zhu YQ, Zhang H, Xiao J. Altered MiRNA expression in gastric cancer: a systemic review and meta analysis. Cell Physiol Biochem. 2015, 35, 933–944. [Google Scholar] [CrossRef] [PubMed]
- Japanese Gastric Cancer Association. Japanese classification of gastric carcinoma. 3rd English ed. 2011, 14, 101–112.
- Livak KJ, Schmittgen TD. Analysis of relative gene expression data using real-time quantitative PCR and the 2(-DeltaDelta C(T)) method. Methods 2001, 25, 402–408. [Google Scholar] [CrossRef]
- Ahmed M, Nguyen H, Lai T, Kim DR. miRCancerdb: a database for correlation analysis between microRNA and gene expression in cancer. BMC Res Notes. 2018, 11, 103. [Google Scholar]
- Wang QX, Zhu YQ, Zhang H, Xiao J. Altered MiRNA Expression in Gastric Cancer: a systemic Review and Meta Analysis. Cell Physiol Biochem. 2015, 35, 933–944. [Google Scholar] [CrossRef]
- Mou G, Wang K, Xu D, Zhou G. Evaluation of three RT-qPCR-based miRNA detection methods using seven rice miRNAs. Biosci Biotechnol Biochem. 2013, 77, 1349–1353. [Google Scholar] [CrossRef]
- Xiang M, Zeng Y, Yang R, Xu H, Chen Z, Zhong J, et al. U6 is not a suitable endogenous control for the quantification of circulating microRNAs. Biochem Biophys Resl Commun. 214, 210–214.
- Emami SS, Nekouian R, Akbari A, Faraji A, Abbasi V, Agah S. Evaluation of circulating miR-21 andmiR-222 as diagnostic biomarkers for gastric cancer. J Cancer Res Ther. 2019, 15, 115–119. [Google Scholar] [CrossRef]
- Fu Z, Qian F, Yang X, Jiang H, Chen Y, Liu S. Circulating miR-222 in plasma and its potential diagnostic and prognostic value in gastric cancer. Med Oncol. 2014, 31, 164. [Google Scholar] [CrossRef]
- Liu W, Song N, Yao H, Zhao L, Liu H, Li G. miR-221 and mir-222 simultaneously target RECK and regulate growth and invasion of gastric cancer cells. Med Sci Monit. 2015, 21, 2718–2725. [Google Scholar] [CrossRef] [PubMed]
- Feng Y, Wang C, Shi T, Liu W, Liu H, Zhu B, et al. Enhancer of zeste homolog 2 exerts functions in gastric cancer development via modulating microRNA-222-3p methylation and WEE1 expression. Chem Biol Drug Des. 2022, 100, 320–333. [Google Scholar] [CrossRef] [PubMed]
- Tan X, Tang H, Bi J, Li N, Jia Y. MicroRNA-222-3p associated with Helicobacter pylori targets HIPK2 to promote cell proliferation, invasion, and inhibits apoptosis in gastric cancer. J Cell Biochem. 2018, 119, 5153–5162. [Google Scholar] [CrossRef] [PubMed]
- Li N, Yu N, Wang J, Xi H, Lu W, Xu H, et al. miR-222/VGLL4/YAP-TEAD1 regulatory loop promotes proliferation and invasion of gastric cancer cells. Am J Cancer Res. 2015, 5, 1158–1168. [Google Scholar]
- Chun-zhi Z, Lei H, An-Ling Z, Yan-Chao F, Xiao Y, Guang-Xiu W, et al. MicroRNA-221 and microRNA-222 regulate gastric carcinoma cell proliferation and radioresistance by targeting PTEN. BMC Cancer. 2010, 10, 367. [Google Scholar]
- Chen Y, Wang X. miRDB: an online database for prediction of functional microRNA targets. Nucleic Acids Res. 2020; 48, D127–D131.
- Adam JM, Warren DG, Salim SH, Yi ANK, Sheena T, Kim R, et al. Platelets confound the measurement of extracellular miRNA in achieved plasma. Sci Rep. 2016, 6, 1. [Google Scholar]
- Myklebust MP, Rosenlund B, Gjengstø P, Bercea BS, Karlsdottir Á, Brydøy M, et al. Quantitative PCR measurement of miR-371a-3p and miR-372-p is influenced by hemolysis. Front Genet. 2019, 10, 463. [Google Scholar] [CrossRef]
- Merkerova M, Belickova M, Bruchova H. Differential expression of microRNA in hematopoietic cell lineages. Eur J Haematol. 2008, 81, 304–310. [Google Scholar] [CrossRef]
- Garley M, Nowak K, Jabłońska E. Neutrophil microRNAs. Biol Rev Camb Philos Soc. 2024, 99, 864–877. [Google Scholar] [CrossRef]
- Kim RY, Sunkara KP, Bracke KR, Jarnicki AG, Donovan C, Hsu AC, et al. A microRNA21-mediated SATB1/S100A9/NF-kB axis promotes chronic obstructive pulmonary disease pathogenesis. Sci Transl Med. 2021, 13, eaav7223. [CrossRef]
- Kim RY, Horvat JC, Pinkerton JW, Starkey MR, Essilfie AT, Mayall JR, et al. MicroRNA-21 drives severe, steroid- insensitive experimental asthma by amplifying phosphoinositide 3 kinase mediated suppression of histone deacetylase 2. J Allergy Clin Immunol. 2017, 139, 519–532.
- Bahareh FF, Kimia V, Mobina F, Shirin Y, Mohammed B, Reza M. NJ Life Sci. 2023, 316, 121340.
Figure 1.
Venn diagram of the dysregulation of microRNAs (miRNAs). We searched the miRNA Cancer Association Database to identify miRNA abnormalities associated with gastric (GC), esophageal (EC), and colon cancers (CC). We found 285, 90, and 64 miRNA abnormalities in GC, CC, and EC, respectively. Overall, 185, 11, and 13 miRNA abnormalities are specific to GC, EC, and CC, respectively, and 28 miRNAs are dysfunctional in all three cancers.
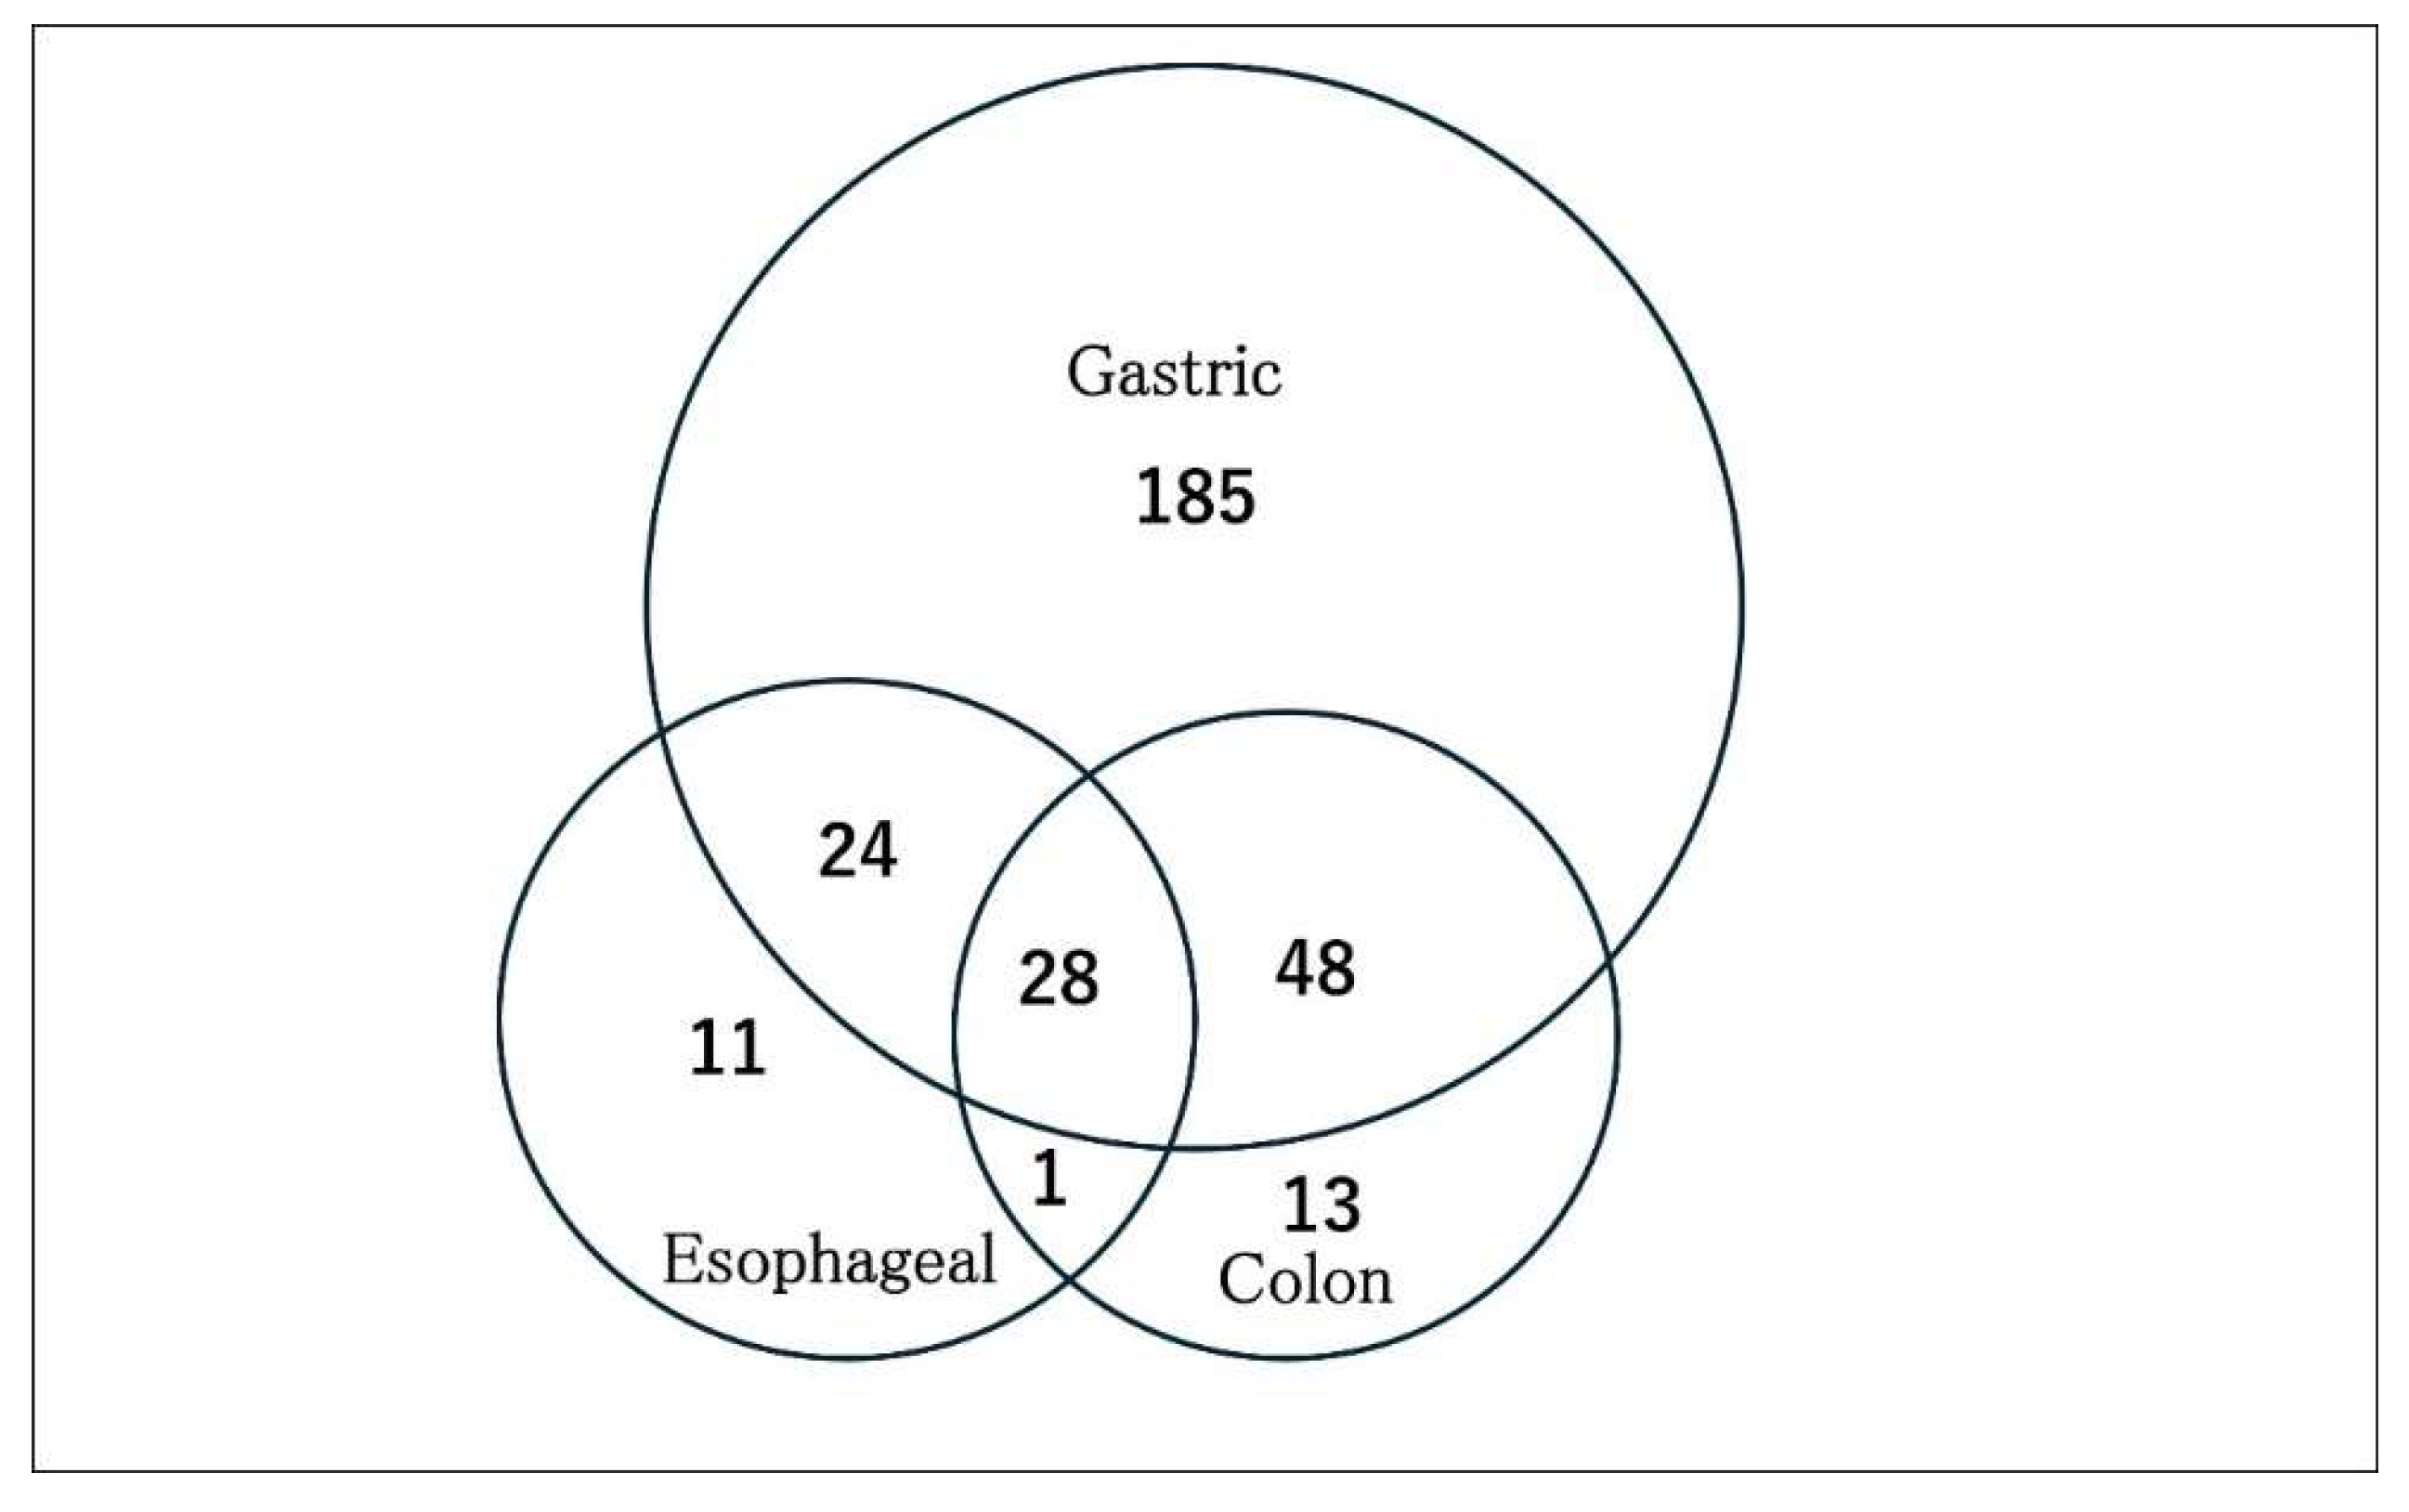
Figure 2.
MicroRNA (miRNA) correlation analysis. (a) MiRNA mutual correlation analysis is performed, and the correlation coefficient (r) is determined. Numbers marked by Light-yellow indicates a strong correlation (r>0.70). (b) A correlation analysis between the biochemical parameters and cell counts is performed, and the correlation coefficients are determined. The asterisk (*) indicates a significant correlation (P<0.05).
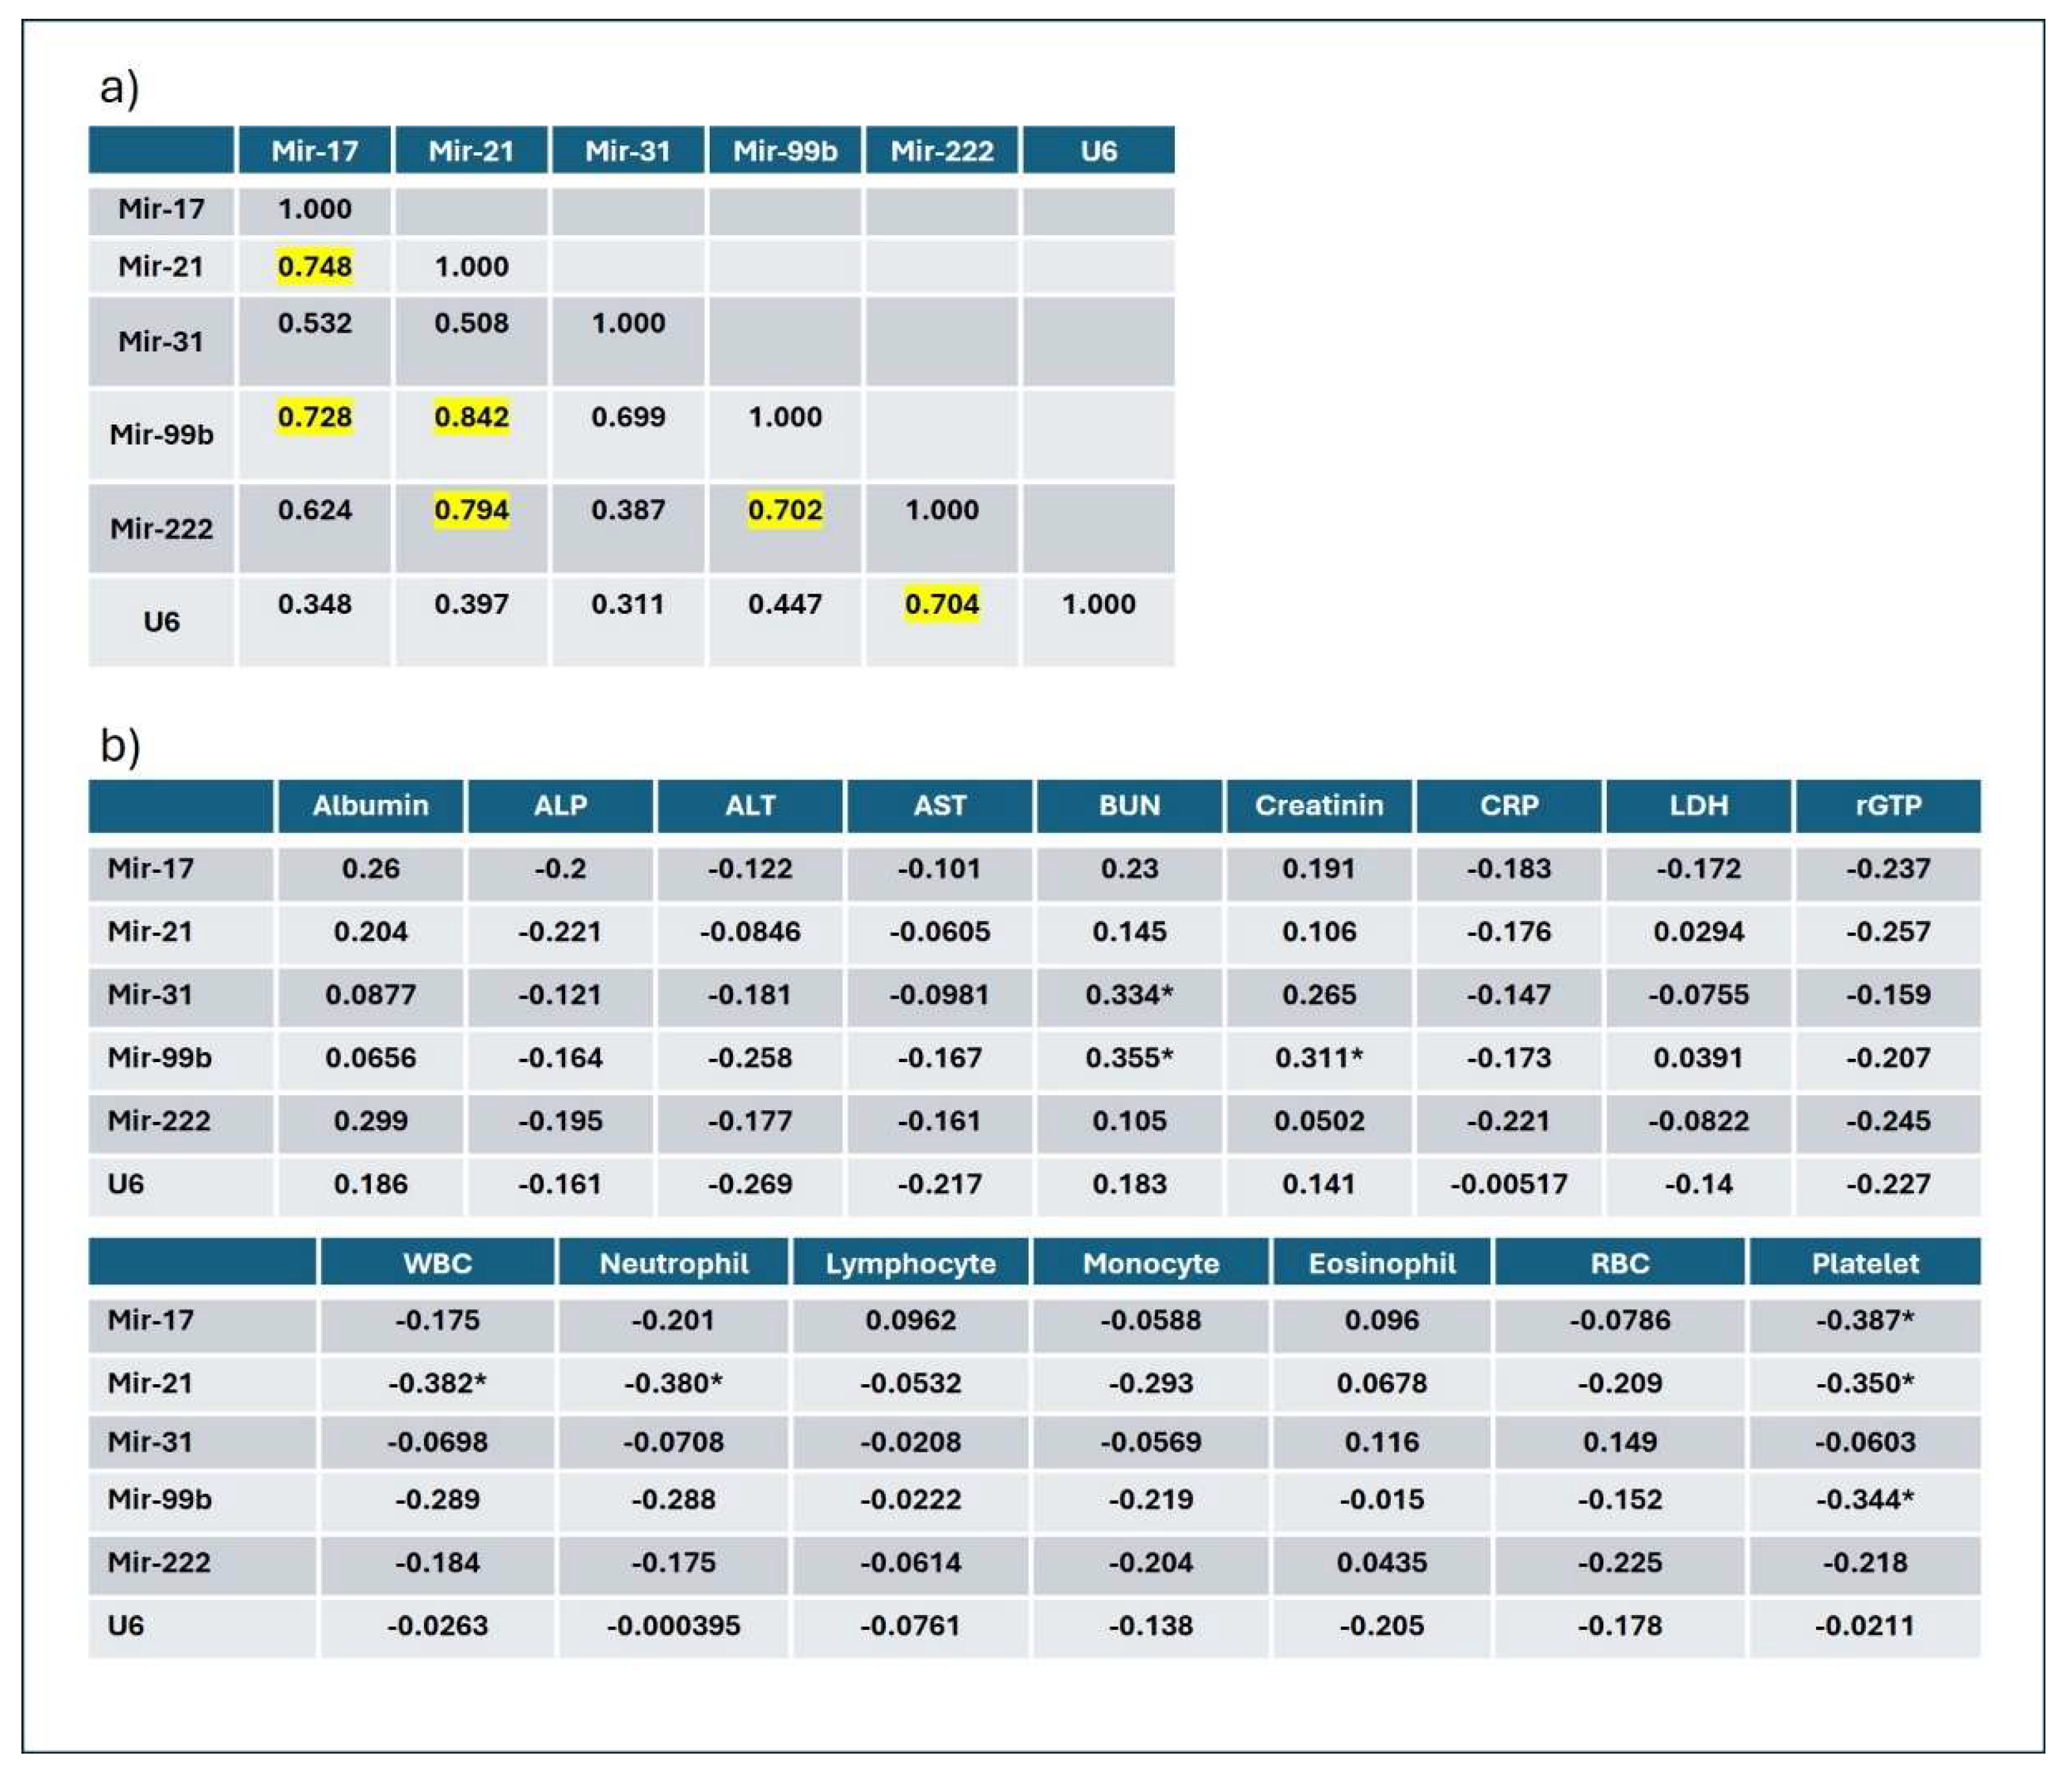

Table 1.
Comparison between polyadenylation and stem-loop qRT-PCR methods.
| Polyadenylation RT-PCR | |||
|---|---|---|---|
| n=13 | Ct | SD | CV |
| mir-99b | 24.3 | 10.8 | 0.44 |
| U6 | 15 | 6.11 | 0.41 |
| Mean | 19.6 | 8.45 | 0.42 |
| Stem-loop RT-PCR | |||
| n=43 | Ct | SD | CV |
| mir-99b | 28.3 | 3.03 | 0.11 |
| U6 | 30.1 | 2.96 | 0.09 |
| Mean | 29.2 | 2.99 | 0.10 |
The mir-99 and U6 levels are measured in 13 samples using polyadenylation RT-PCR and in 43 samples using stem-loop RT-PCR. The threshold cycle (Ct) values, standard deviations (SD), and coefficients of variation (CV) and their means are indicated in the table.
Table 2.
Comparisons of miRNA expressions and tumor characteristics between the GC and CN groups.
| GC (n=26) | CN (n=17) | P-value | |
|---|---|---|---|
| Micro RNAs | |||
| Cta | |||
| mir-17 | 22.8±3.93 | 22.7±3.95 | 0.92 |
| mir-21 | 22.1±2.91 | 23.3±3.72 | 0.21 |
| mir-31 | 33.7±1.75 | 34.1±2.13 | 0.46 |
| mir-99b | 28.0±3.03 | 28.8±3.06 | 0.38 |
| mir-222 | 23.6±2.92 | 25.8±3.37 | 0.02* |
| U6 | 29.4±2.30 | 31.1±3.57 | 0.05 |
| Relative expression | |||
| mir-17 | 34.2 [7.17–125] | 40 [0.93–146] | 0.82 |
| mir-21 | 45.5 [23.5–10] | 23.9 [0.86–112] | 0.36 |
| mir-31 | 0.01 [0.003–0.017] | 0.008 [0.002–0.011] | 0.39 |
| mir-99b | 1.02 [0.20–2.25] | 0.30 [0.055–0.668] | 0.26 |
| mir-222 | 15.4 [7.79–45.0] | 5.27 [0.22–9.15] | <0.01** |
| U6 | 0.19 [0.084–0.454] | 0.085 [0.0066–0.182] | 0.04* |
| Tumor characteristicsc | |||
| Pathology | |||
| Poorly differentiated | 5 (19.2%) | 4 (23.5%) | |
| Signet cell-type | 4 (15.4%) | 0 (0%) | |
| Tubular | 17 (65.4%) | 13 (76.5%) | 0.23 |
| Tumor thickness | |||
| T1 | 0 (0%) | 7 (41.2%) | |
| T2 | 0 (0%) | 3 (17.6%) | |
| T3 | 14 (53.8%) | 5 (29.4%) | |
| T4 | 12 (46.2%) | 2 (11/8%) | <0.01** |
| Lymph node metastasis | |||
| N0 | 14 (53.8%) | 7 (41.2%) | |
| N1 | 0 (0%) | 2 (11.8%) | |
| N2 | 2 (7.7%) | 6 (35.3%) | |
| N3 | 10 (38.5%) | 2 (11.8%) | 0.02* |
| Distant metastasis | |||
| M0 | 5 (19.2%) | 15 (88.2%) | |
| M1 | 21 (80.8%) | 2 (11.8%) | <0.01** |
| Tumor location | |||
| EGJ | 12 (46.2%) | 5 (29.4%) | |
| U | 2 (7.7%) | 1 (5.9%) | |
| M | 7 (26.9%) | 1 (5.9%) | |
| L | 5 (19.2%) | 10 (58.8%) | 0.04* |
For statistical comparisons among patients in the gastric cancer (GC) and control (CN) groups, plasma miRNA levels are expressed as threshold cycle (Ct) values and relative expression levels, which are calculated using global standardization Ct values (Ct(stand.) = 27.0). Ct values are expressed as means ± standard deviation (SD). Relative expression levels are expressed as medians [interquartile range]. Tumor characteristics are described according to the Japanese Classification of Gastric Carcinoma (expressed in numbers [%]). aStudent’s t-test, bMann–Whitney U test, and cChi-square test are used. U, upper portion; M, middle portion; L, lower portion; EGJ, esophagogastric junction of the stomach. The P-values marked with * (<0.05) and ** (<0.01) are significant.
Table 3.
Comparisons of biochemical parameters and blood cell counts between the GC and CN groups.
| GC (n=26) | CN (n=17) | P-values | |
|---|---|---|---|
| Biochemical parameters | |||
| Albumin (g/dL) | 3.3 [3.1–3.7] | 3.8 [3.6–3.8] | <0.01** |
| ALP (U/L) | 86.5 [70.5–129] | 80 [70–88] | 0.48 |
| ALT (IU/L) | 22 [13.5–39] | 13 [12.0–21] | 0.25 |
| AST (IU/L) | 31.5 [17.2–41.2] | 20 [15–30] | 0.06 |
| BUN (mg/dL) | 15.1 [13.3–18.0] | 16.9 [15.1–17.7] | 0.54 |
| Creatinine (mg/dL) | 0.77 [0.65–0.83] | 0.69 [0.55–0.81] | 0.12 |
| CRP (mg/dL) | 0.095 [0.03–0.33] | 0.05 [0.02–0.59] | 0.63 |
| LDH (U/L) | 186 [152–213] | 177 [170–194] | 0.81 |
| γGTP (IU/L) | 23.5 [15.2–77] | 29.0 [16–31] | 0.58 |
| Blood cells | |||
| WBCs (/μL) | 4235 [3577–5937] | 5180 [3900–5660] | 0.42 |
| Neutrophils (/μL) | 2812 [2166–4086] | 2159 [1883–3615] | 0.21 |
| Lymphocytes (/μL) | 970 [816–1243] | 1871 [1367–2262] | <0.01** |
| Monocytes (/μL) | 334 [248–394] | 308 [249–331] | 0.63 |
| Eosinophils (/μL) | 145 [105–236] | 129 [89–180] | 0.34 |
| RBCs (/μL) | 355 [341–371] | 0.18 | |
| Platelets (/μL) | 24.1 [13.1–28.3] | 31.9 [17.2–33.6] | 0.03* |
Statistical comparisons (Mann–Whitney U test) of the biochemical parameters and blood cell counts are performed between the gastric cancer (GC) and control (CN) groups. Values are expressed as medians [interquartile range]. ALP, alkaline phosphatase; ALT, alanine aminotransferase; AST, aspartate aminotransferase; BUN, blood urea nitrogen; CRP, C-reactive protein; LDH, lactate dehydrogenase; γGTP, γ-glutamyl transpeptidase; WBC, white blood cell; RBC, red blood cell. P-values marked with * (<0.03) and ** (<0.01) are significant.
Disclaimer/Publisher’s Note: The statements, opinions and data contained in all publications are solely those of the individual author(s) and contributor(s) and not of MDPI and/or the editor(s). MDPI and/or the editor(s) disclaim responsibility for any injury to people or property resulting from any ideas, methods, instructions or products referred to in the content. |
© 2024 by the authors. Licensee MDPI, Basel, Switzerland. This article is an open access article distributed under the terms and conditions of the Creative Commons Attribution (CC BY) license (http://creativecommons.org/licenses/by/4.0/).
Copyright: This open access article is published under a Creative Commons CC BY 4.0 license, which permit the free download, distribution, and reuse, provided that the author and preprint are cited in any reuse.


