
Submitted:
20 December 2024
Posted:
20 December 2024
You are already at the latest version
Abstract
L-Carnosine (Car) is an endogenous dipeptide with high potential for drug discovery approaches in neurogenerative diseases, whereas TAT1 is a small arginine-rich peptide derived from the HIV-1 trans-activator protein (TAT) known to stimulate proteasome activity. Three isomeric peptides were synthetised by adding the Car moiety to the TAT1 sequence at the C- and N-termini and in the middle of the peptide sequence. High-resolution and energy-resolved CID MS/MS experiments were performed to differentiate the three isomeric peptides. At first glance, the obtained MS/MS spectra showed a high degree of similarity between the peptides. A wealth of low-intensity fragment ions peaks resulting mainly from arginine-specific neutral losses, which are useless for structural elucidation, or peaks that cannot be easily assigned were observed. Energetic study was also non-conclusive with that respect. However, Principal Component Analysis (PCA) showed that the three peptides could be clearly distinguished when the entire MS/MS spectra were considered rather than just the intensity of the precursor ions peak. Interestingly, the PCA loadings revealed the characteristic fragment ions of each peptide (although with smaller intensities) providing hints on consecutive fragmentation patterns. Some of these specific peaks could also be assigned to scrambling during fragmentation. These results demonstrate the potential of PCA as a simple chemometric tool for semi-automated peak identification in complex MS/MS spectra.
Keywords:
isomeric peptides
; carnosine
; TAT1
; high-resolution mass spectrometry
; Principal Component Analysis
; MS/MS
; energy-resolved mass spectrometry
1. Introduction
Carnosine is a dipeptide found in high concentrations in muscle and brain tissues, where it plays a critical role in numerous biological processes.[1,2,3] Known for its strong antioxidant properties, carnosine protects cells from oxidative damage and glycation, both of which are implicated in ageing and chronic diseases.[4,5,6,7,8,9] It also aids glucose metabolism, with potential benefits in managing type 2 diabetes [10], and supports cognitive health by shielding neurons from oxidative stress.[3,5,11,12] In addition, carnosine enhances cellular energy metabolism[1,13], modulates nitric oxide (NO) pathways[14], and acts as a chelator of metals.[15,16] These diverse properties make carnosine a valuable candidate for various biomedical applications.[1,17,18]
However, carnosine’s clinical use is constrained by its rapid enzymatic degradation.[13,19,20] In human serum, the enzyme carnosinase hydrolyses carnosine into beta-alanine and histidine, significantly lowering its bioavailability and therapeutic efficacy. To overcome this limitation, researchers have investigated structural modifications to carnosine to enhance its stability and resistance to enzymatic breakdown. One promising strategy involves conjugating carnosine with organic molecules, producing derivatives or analogues that preserve its biological functions while being less susceptible to carnosinase degradation.[13,19,20]
TAT1, an arginine-rich cell-penetrating peptide (CPP) derived from the transactivator of transcription (TAT) protein of HIV-1, is known for its ability to efficiently traverse cellular membranes.[21,22,23] This property facilitates the intracellular delivery of diverse therapeutic molecules, ranging from small compounds to nucleic acids, proteins, and even liposomes, regardless of their size or physicochemical characteristics. Owing to this versatility, TAT1 has become a valuable tool in drug delivery and biomedical research.
The combination of TAT1 with carnosine presents an intriguing possibility. While carnosine’s biological functions, such as its antioxidant properties and metabolic regulation, are well-documented, its therapeutic application is limited by low bioavailability due to enzymatic degradation. TAT1’s ability to enhance cellular uptake could potentially improve carnosine delivery, mitigating this limitation and expanding its applicability.[24,25,26]
In this context, the TAT1 sequence was modified to incorporate carnosine at three distinct positions, resulting in three isomeric peptides.[24,25] In the first sequence, Car-TAT1, carnosine is attached at the N-terminal position. In the second, T-Car-T, carnosine is inserted in the middle of the sequence. Finally, in TAT1-Car, carnosine is positioned at the C-terminal end. The original TAT1 peptide and carnosine, along with the three modified isomeric peptides, are presented in Figure 1.
These TAT1-carnosine peptides were successfully characterised using quantum dots. [24,26] The fluorescent properties of the quantum dots were influenced by the position of carnosine within the peptide sequence, demonstrating their potential application for the quantification of mixtures of isomeric peptides. Additionally, Time-of-Flight Secondary Ion Mass Spectrometry (ToF-SIMS) was employed to differentiate the three isomeric TAT1-carnosine peptides.[25] However, under the high-energy conditions of ToF-SIMS, specific structural information was largely lost due to non-specific fragmentation. This resulted in fragment ions predominantly associated with individual amino acids rather than sequence-specific peptides. Despite this limitation, Partial Least Squares Discriminant Analysis (PLS-DA) successfully differentiated the three peptides. Variations in fragmentation patterns, particularly in fragment ions abundances, facilitated the discrimination of these isomeric peptides.[25]
Tandem mass spectrometry (MS/MS) is a powerful tool for distinguishing between isomers, provided that each isomer generates fragment ions specific to its structure.[27,28] However, in certain cases, isomers cannot be differentiated through straightforward visual inspection of their MS/MS spectra. Consequently, alternative MS strategies have been developed to address this challenge, including the kinetic method[29,30], Ion Mobility Mass Spectrometry (IM-MS) [31,32,33,34,35], and energy-resolved mass spectrometry (ER MS)[30,36,37,38,39,40,41,42,43,44,45,46,47].
In ER MS, collision-induced dissociation (CID) experiments are conducted at multiple excitation voltages to generate MS/MS spectra that reveal differences in fragmentation behaviour. Bartolucci et al. successfully utilised ER MS data with multilinear regression models to quantify co-eluted isomers.[41,42,44,45,46,47,48] Additionally, Memboeuf et al. demonstrated that ER MS, particularly through Survival Yield (SY) plots, can be leveraged for structural analysis of isobaric compounds [39,49], quantification of isomeric and isobaric mixtures[49,50,51,52,53], and the elimination of isobaric interferences in LC-MS.[40,54]
The objective of this study is to evaluate whether the position of carnosine within the peptide sequence can be differentiated using CID tandem mass spectrometry, eventually using ER MS strategy. First, the MS/MS spectra obtained in high resolution were analysed visually, followed by ER MS analysis using SY plots and the breakdown curves of the predominant fragment ions. Subsequently, principal component analysis (PCA) was employed as a chemometric tool to differentiate the three peptides and identify specific fragment ions associated with the position of carnosine. Finally, MS/MS spectra are discussed in light of PCA analysis, including both conventional fragmentation[55] and scrambling.[56]
2. Results and Discussion
2.1. Energy-Resolved Mass Spectrometry and Break Down Curves of TAT1-Carnosine Peptides
High resolution ER MS experiments were conducted by measuring the MS/MS spectra of doubly protonated TAT1-Carnosine peptides. The precursor ion selected for fragmentation was the doubly protonated adduct [M + 2H]2⁺, with m/z = 895.04. MS/MS spectra were acquired at acceleration voltages ranging from 20 V to 42 V.
Figure 2 presents the high-resolution MS/MS spectra of the three isomeric TAT1-Carnosine peptides at 36 V. At this voltage, the precursor ion remains the most abundant ion for all three peptides. The MS/MS spectra of the three peptides exhibit high similarity. The most abundant peaks, found between m/z 800 and m/z 900, are common to the three isomers and include ions at m/z 886.52, 874.03, 865.51, and 857.00.
Figure 3 illustrates the high-resolution MS/MS spectrum of Car-TAT1, focusing on the m/z range of 800–900. The most intense peaks can be attributed to neutral losses, primarily associated with the presence of arginine. These involve molecules such as ammonia (NH₃), water (H₂O), carbodiimide (CH₂N₂), and guanidine (CH₅N₃). Since the peptides are doubly charged, the masses of these neutral losses are halved. For example, the loss of ammonia corresponds to Δm/z = -17.0265/2 ≈ -8.51, the loss of water to Δm/z = -18.0105/2 ≈ -9.01, the loss of carbodiimide to Δm/z = -42.0218/2 ≈ -21.01, and the loss of guanidine to Δm/z = -59.0483/2 ≈ -29.52. The same fragment ions were also observed for TAT1-Car and T-Car-T.
Figure 3 also reveals that the 0.5 m/z difference between certain peaks corresponds to the loss of H₂O rather than NH₃, further confirming that these are doubly charged ions. Carbodiimides and guanidines are derived from the termini of arginine side chains. The spectra indicate that fragmentation involves consecutive neutral losses, meaning that these molecules are lost multiple times, resulting in the observation of a large number of fragment ions across a wide spectral range. However, the detected ions provide no structural information, appear virtually identical, and are highly intense for each peptide. Consequently, they do not allow for differentiation among the peptides. Since the three peptides are isomers, the inability to distinguish them highlights the challenge in resolving isomeric structures based solely on the visual inspection of these MS/MS spectra.
To differentiate the three isomeric peptides, we employed energy-resolved mass spectrometry (ER MS), focusing specifically on Survival Yield (SY) curves and breakdown collision curves of the most abundant fragment ions.
The Survival Yield (SY) was calculated at each excitation voltage as the ratio of the precursor ions peak intensity to the Total Ion Current (TIC) [39,49,50,51,52,53]:
where Iprecursor is the intensity of the precursor ions peak, and Ifragment is the intensity of each fragment ions peak obtained from the MS/MS experiment.
SY curves were generated by plotting SY values against the acceleration voltage (see Figure 4). The resulting curves show a high degree of overlap, making it impossible to differentiate between TAT1-Car and T-Car-T. However, Car-TAT1 exhibits a slightly lower SY across the voltage range, allowing for a very subtle distinction from the other two peptides.
To further distinguish between the three isomeric peptides, breakdown curves of the major fragment ions were plotted for m/z 886.52, 874.03, 865.51, and 857.00 (Figure 5). The abundance of each fragment ion was calculated similarly to the SY, as the intensity of the fragment ions peak divided by TIC, and plotted against the acceleration voltage to generate the breakdown curve. In this case, T-Car-T exhibited lower fragmentation of the major fragment ions, which aligns with its slightly higher SY compared to the other two peptides. Among the fragment ions, m/z 857 shows the greatest differentiation between the three peptides. However, this fragment ion is not selective and cannot be uniquely attributed to any specific peptide. To enhance differentiation and identify specific fragment ions, Principal Component Analysis (PCA) was applied, providing additional insights into the structural distinctions among the three peptides.
2.2. Principal Component Analysis for the Differentiation of TAT1-Carnosine Peptides
Principal Component Analysis (PCA) is a powerful statistical technique used to reduce the dimensionality of complex datasets while preserving the most relevant information. By transforming the original variables into a set of orthogonal components, PCA identifies patterns and highlights subtle differences within the data [57]. In this study, the variables correspond to the m/z values from the MS/MS spectra, and PCA facilitates the differentiation of the three isomeric peptides.
The scores represent the projection of the peptides onto the principal components, revealing clustering or separation in the data. The loadings indicate the contribution of each variable (m/z) to the principal components, providing insight into which peaks are most responsible for differentiation. Additionally, the biplot combines scores and loadings into a single visualisation, illustrating the relationship between peptides and the contributing peaks. In this context, the biplot directly links specific peaks to particular peptides, offering a deeper understanding of the structural differences between the isomers.
PCA was applied to the full MS/MS spectra acquired at 36 V, covering the m/z range from 100 to 900. At this voltage, the Survival Yield (SY) was approximately 0.2 (Figure 4), indicating a high degree of fragmentation and the potential to identify specific fragment ions beyond those resulting from neutral losses.
Prior to PCA, each MS/MS spectrum was normalised to TIC and centered. The results of the PCA are presented in Figure 6. The score plot (Figure 6a) shows that PC1, which explains 52.05% of the variance, separates T-Car-T from TAT1-Car and Car-TAT1. This differentiation in PC1 is primarily driven by peaks at m/z 886.53, 865.52, 874.03, and 857, as revealed in the loading plot (Figure 6b). These peaks exhibit positive loadings and are more intense in TAT1-Car and Car-TAT1 than in T-Car-T. However, as shown in Figure 5, the corresponding fragment ions, resulting from neutral losses, are not specific to any peptide.
In contrast, T-Car-T is characterised by peaks with strongly negative loadings in PC1, particularly the peak at m/z 843.02. This fragment ion is clearly associated with T-Car-T, as shown in the biplot (Figure 5d). The breakdown curve for this fragment ion (Figure 7b) demonstrates its specificity to T-Car-T, as no intensity is observed for the MS/MS spectra of TAT1-Car or Car-TAT1. This absence underscores its utility as diagnostic fragment ions peak for T-Car-T.
PC2, which explains 47.95% of the variance, differentiates TAT1-Car from Car-TAT1, a distinction not achieved by PC1. The loadings plot highlights two key fragment ions contributing to this separation: m/z 826.51 for TAT1-Car and m/z 773.47 for Car-TAT1. Both fragment ions are clearly associated with their respective peptides, as shown in the biplot (Figure 6d), where their proximity to the corresponding scores illustrates their specificity.
Notably, m/z 843.02, 826.51, and 773.47 were identified as specific to T-Car-T, TAT1-Car, and Car-TAT1, respectively, leveraging the loading values to reveal unique markers for each peptide. Figure 7 highlights these specific peaks, underscoring the utility of PCA in uncovering structural differences that are not easily identified through visual inspection of MS/MS spectra.
The higher loadings of PC1 are predominantly associated with neutral losses, which do not provide structural information. Analysis of the loadings line plot (Figure 6c) indicates that the most significant contributions to the PCA occur in the m/z range of 600–900. However, the region between m/z 800 and 900 primarily reflects neutral losses, which are non-specific and lack structural relevance. To focus only on specific peaks that provide structural information, we performed also PCA on a reduced section of the MS/MS spectrum, specifically from m/z 600 to m/z 800. This approach excludes the influence of neutral losses and enhances the structural interpretability of the results.
The results of this focused PCA are presented in Figure 8. The line plot of the loadings (Figure 8c) indicates that the most contributing peaks are concentrated at m/z values above 700. The loading plot and biplot (Figure 8b,d) reveal distinct patterns. Some peaks are highly correlated and diagnostic of a specific peptide. For example, Car-TAT1 displays characteristic peaks that are highly correlated at m/z values 773.47, 764.95, 752.46, and 743.95. Similarly, T-Car-T exhibits correlated peaks at m/z values 772.98, 764.47, 751.88, and 743.46.
In contrast, peaks related to TAT1-Car are less correlated. The most representative peak for TAT1-Car is m/z 796.98, along with other less correlated fragment ions, such as m/z 788.47 and 775.98. Additionally, some peaks originate from at least two peptides, making them less selective. For instance, peaks at m/z 787.98 and 779.47 or at m/z 782.52, are associated with more than one peptide.
Moving forward, we will investigate the peaks identified in the biplot as characteristic of each peptide to better understand their potential for distinguishing between peptides.
2.3. Specific Fragment Ions for CAR-TAT1 Identified by PCA
The loading plot of PC1 vs PC2 in Figure 8b highlights that certain fragment ions (m/z 793.95, 764.96, 752.46, 743.95, and 735.43) are strongly correlated. This is evident from the alignment of their loading vectors, which form small angles with one another, resulting in a correlation coefficient close to 1. Although the magnitudes of their loadings vary, their similar vector directions underscore the high correlation between these fragment ions.
Figure 9 highlights the peaks with the highest loadings associated with Car-TAT1. These loadings represent three of the highly correlated peaks: m/z 764.96, 752.46, and 743.95. Interestingly, all these peaks are specific to Car-TAT1, demonstrating that the information contained in the loadings allows the identification of specific peaks.
Furthermore, the loadings provide additional valuable information: their magnitudes reflect the abundance of the fragment ions. Higher loading magnitudes correspond to greater fragment ions abundances, enhancing the sensitivity for detecting Car-TAT1. This relationship is confirmed in the breakdown curves shown in Figure 9. The highest loading was observed for m/z 764.96, which also exhibited the greatest abundance, whereas m/z 743.95 displayed a lower loading and a corresponding decrease in abundance in the breakdown curve.
The MS/MS spectrum shown in Figure 10c confirms that the correlation observed with the aligned loading vectors is logical, as all the identified fragment ions correspond to neutral losses from the same doubly charged ion [y12]2+. However, Figure 10c also shows that [y12]2⁺ itself is barely detected. This suggests that losses of several units of H₂O and NH₃ occur prior to the separation of carnosine and TAT1, which explains the very low intensity observed for m/z 790.99.
Additionally, a peak at m/z 209.10 (Figure 10b) was identified as [b2]⁺, associated with [y12]⁺ likely due to a charge separation fragmentation process. This observation further supports the cleavage site between the histidine of carnosine and the glycine of TAT1 (Figure 10a).
Overall, the loadings demonstrate their ability to identify specific fragmentation patterns for Car-TAT1. Furthermore, as previously observed in the breakdown curves, the MS/MS spectrum (Figure 10c) reaffirms that the loading magnitude is proportional to the fragment abundance. Specifically, m/z 773.47 has the highest loading and also the greatest abundance. This peak is followed by m/z 752.46 and 765.50, which show slightly lower abundances and are almost overlapping in the biplot. The peak m/z 743.95 exhibits a lower loading and correspondingly lower abundance, as shown in Figure 10c. This trend is further confirmed with peaks m/z 735.43 and 756.45, which also display lower abundances and lower loadings. Figure 10c illustrates that all these peaks are formed through neutral losses from [y12]2⁺, showing that the correlation of the loadings is due to a consecutive fragmentation pattern.
2.4. Specific Fragment Ions for T-Car-T Identified by PCA
Figure 11 highlights the fragment ions with the highest loadings associated with T-Car-T: m/z 772.98, 764.47, and 751.98. These peaks are specific to T-Car-T, as they are not observed for Car-TAT1 or TAT1-Car. The loadings corresponding to these peaks are strongly correlated, as evidenced by the alignment of their loadings vector, indicating a correlation coefficient close to one (Figure 8b,d).
This observation suggests a consecutive fragmentation pattern, similar to that previously noted for Car-TAT1. Specifically, from m/z 772.98, the neutral loss of ammonia results in the consecutive peak m/z 764.47, while the loss of guanidine from m/z 772.98 results in the peak m/z 751.98.
Furthermore, the breakdown curves of these two consecutive peaks (m/z 764.47 and 751.98) are shifted to higher energies and exhibit lower abundances, consistent with their formation from m/z 772.98. This decrease in intensity is also reflected in the loadings magnitude: the loading for m/z 772.98 has a higher magnitude than those of its consecutive peaks, m/z 764.47 and 751.98. This pattern once again demonstrates the proportional relationship between abundance and loading magnitude.
The MS/MS spectrum shown in Figure 12 reveals that all these fragment ions are generated by scrambling [56]. Fragmentation of peptides by scrambling refers to a process in which peptide ions undergo fragmentation through rearrangements. In scrambling, the peptide may fragment in a way that involves less predictable bond cleavages or rearrangements, resulting in fragment ions that differ from those produced by conventional peptide fragmentation. The change in the position of amino acids in the sequence during fragmentation leads to different combinations of amino acids in a fragment ion. Scrambling can complicate the interpretation of mass spectrometry data, as it introduces unexpected peaks.
For T-Car-T, due to scrambling, carnosine (Car) ends up in the C-terminal position and then separates from TAT1. Schematically, the following transformation occurs:
GRKKRRQ-βAla-H-RRRPS → RRRPS-GRKKRRQ-βAla-H → RRRPS-GRKKRRQ
This final sequence would correspond to a b-type ion with m/z 781.99 (labeled bβ2⁺ in Figure 12 for clarity). However, this peak is not detected in the MS/MS spectrum. Instead, a peak at m/z 772.98 is observed, corresponding to the neutral loss of water from bβ2⁺. This suggests that the neutral loss of water occurs prior to fragmentation by scrambling. Figure 12 shows several fragment ions generated by neutral losses of bβ2⁺.
Also for T-Car-T, the loadings demonstrate their ability to identify specific fragmentation patterns. Moreover, it is important to note that these fragment ions would be quite difficult to identify without PCA because they are generated by scrambling, leading to unexpected peaks. Furthermore, Figure 12 reaffirms that the alignment of the loading vectors is logical, as all these peaks are generated by consecutive neutral losses from the same fragment ion generated by scrambling, bβ2⁺. This further supports the idea that the correlation observed in the loadings can serve as an indicator of consecutive fragmentation patterns for T-Car-T.
Additionally, as for Car-TAT1, the loading magnitude is proportional to fragment ions abundance. Specifically, m/z 772.98 exhibits the highest loading and the highest abundance. This peak is followed in abundance by m/z 764.47, which shows a lower loading magnitude. This trend is further confirmed by m/z 751.98, 743.46, and 755.96, which display progressively lower abundances and lower loading magnitudes.
2.5. Specific Fragment Ions for TAT1-Car Identified by PCA
Figure 13 highlights some of the peaks identified as characteristic of TAT1-Car in the PCA (Figure 8b,d). Two peaks with the highest loading magnitudes were selected: m/z 796.98 and m/z 788.47. Their vector loadings indicate a significant correlation between the two peaks, even though the vectors are not perfectly aligned, suggesting that the correlation is strong but not complete. Two highly correlated additional peaks, m/z 723.40 and m/z 668.93, also correspond to loadings characteristic of TAT1-Car, but their magnitudes are lower.
Figure 13 reveals that m/z 796.98 is not unique to TAT1-Car, as T-Car-T also displays this peak, albeit at much lower intensity. Nonetheless, this peak is identified as characteristic in the PCA due to its significantly higher abundance in TAT1-Car. All other peaks were specific to TAT1-Car, demonstrating that the loadings provide valuable information for identifying specific peaks of TAT1-Car.
As shown in Figure 13, the abundance of these peaks in TAT1-Car is proportional to their loading magnitudes. Specifically, the peak m/z 796.98 has a slightly higher abundance than m/z 788.47. Conversely, the peaks m/z 668.93 and m/z 723, which have nearly overlapping loadings, display very similar abundances. In line with their lower loading magnitudes, these peaks exhibit much lower abundances compared to m/z 796.98 and m/z 788.47.
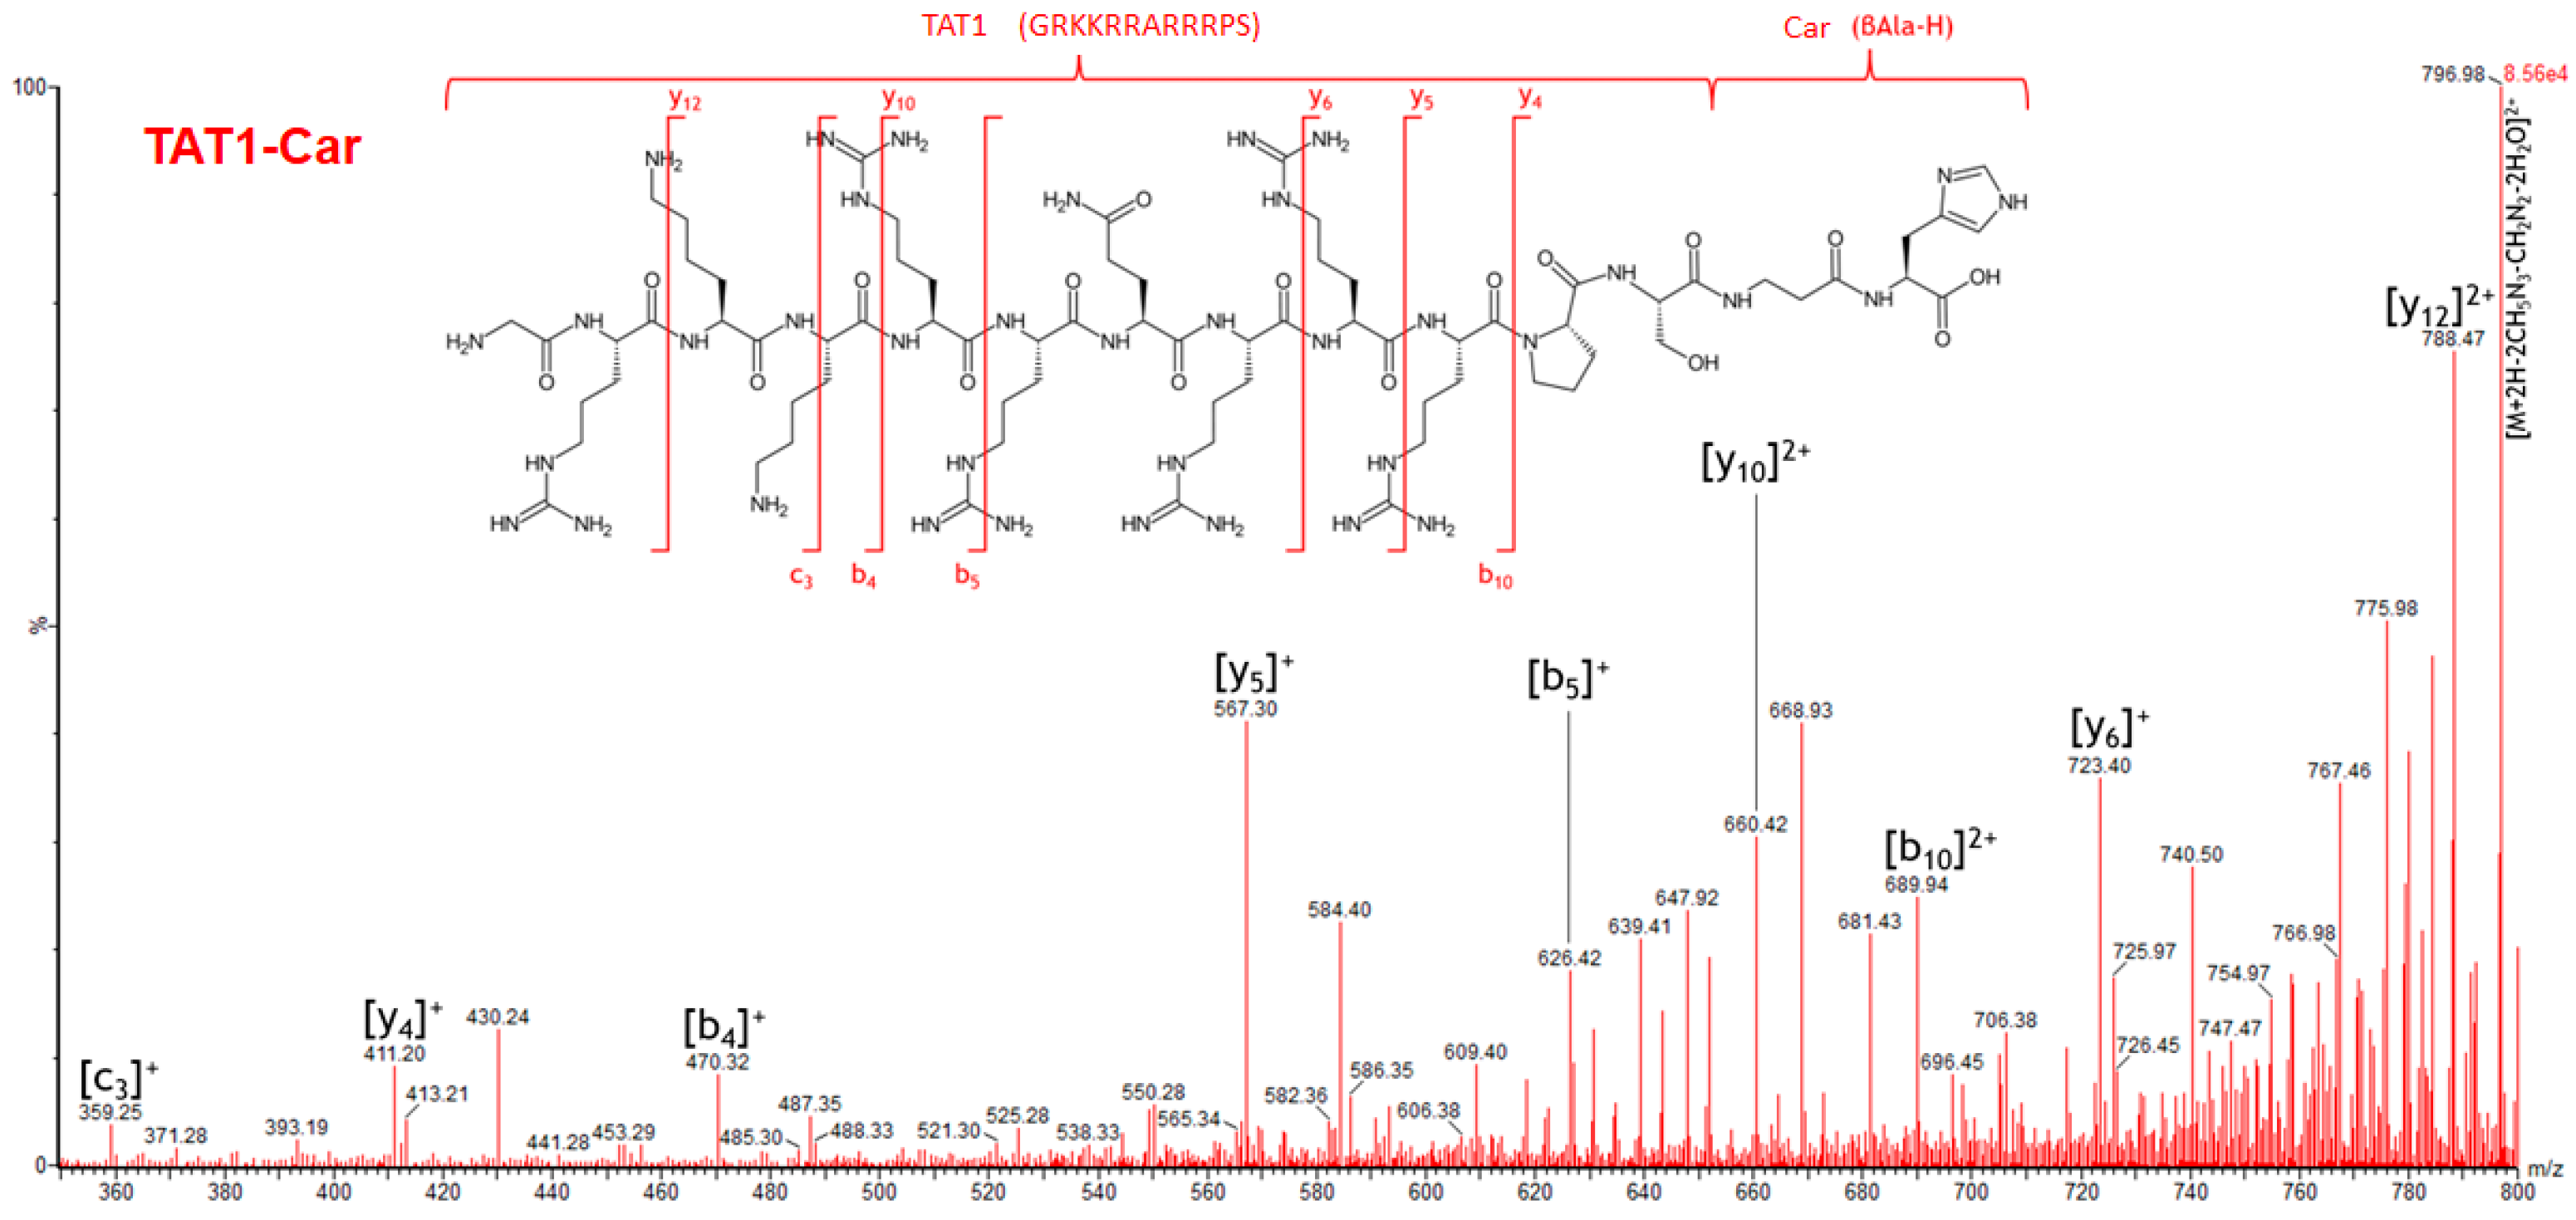
Figure 14 shows the MS/MS spectrum of TAT1-Car. In this case, the fragment ions of this peptide primarily result from conventional fragmentation and neutral losses, making them easier to identify than the fragment ions of T-Car-T. These conventional fragment ions consist mainly of b and y ions carrying one or two charges. Additional fragment ions are attributed to neutral losses associated with the b or y fragment ions. For instance, m/z 668.93 is formed by the neutral loss of carbodiimide from the b10 fragment ion.
It should be noted that the formation of bm – yn-m ion pairs, which confirm cleavage sites, was observed only for b4-y10 and b10-y4. Among the ions identified, two peaks correspond to neutral losses from the precursor ion: m/z 796.98 and its consecutive peak, m/z 775.98, generated by the neutral loss of carbodiimide. Therefore, it is logical that the peak m/z 796.98 is not entirely selective to TAT1-Car, as it arises solely from neutral losses of the precursor ion and does not carry structural information. In contrast, although m/z 775.98 is also formed from neutral losses of the precursor ion, this fragment ion was selective to TAT1-Car at 36 V. This explains the position of its loading vector, which is more correlated with the conventional fragment ions characteristic of TAT1-Car.
3. Materials and Methods
3.1. Chemicals and Synthesis of Peptides
Acetonitrile and formic acid (LC-MS grade) were obtained from Honeywell (Guyancourt, France). Milli-Q water was produced using a Milli-Q water purification system (Millipore, Bedford, MA, USA).
Peptides were synthesised by microwave-assisted solid-phase peptide synthesis using a Liberty Blue Microwave Automated Peptide Synthesizer (CEM Corporation, Matthews, NC, USA) following the standard protocol for Fmoc/tBu chemistry on a 0.1 mmol scale [ref dos articulos Giuseppe]. Fmoc-deprotection cycles consisted of 15 s at 75 °C (155 W) and 30 s at 90 °C (30 W). The synthesised peptides had the following sequences (see Figure 1):
TAT1-Car: GRKKRRQRRRPS-βAla-H
Car-TAT1: βAla-HGRKKRRQRRRPS
T-Car-T: GRKKRRQ-βAla-H-RRRPS
All peptides were isomers with the molecular formula C72H133N37O17 and a monoisotopic mass of 1788.0654 Da. Peptides were purified using semi-preparative RP-HPLC with a fully automated Waters Preparative System equipped with a Phenomenex Synergi 4µ Fusion-RP C18 column (150 × 10 mm) operated at a flow rate of 4 mL·min at 25 °C. The solvent systems used were: A (0.1% trifluoroacetic acid in water) and B (0.1% trifluoroacetic acid in acetonitrile).
Peptide purity was analysed by analytical RP-UPLC ESI-MS using a Waters Acquity UPLC coupled to a Waters 3100 ESI-SQD MS equipped with a Luna Omega PS C18 column (1.6 µm, 2.1 × 50 mm) operated at 35 °C with a flow rate of 0.6 mL·min. The solvent systems were the same as those used for semi-preparative HPLC. All peptides were obtained with a purity of ≥90%. Peptide solutions were prepared at a concentration of 10 µmol L−1 in 70:30 acetonitrile/water containing 1%v formic acid.
For calibration in HR-MS, a solution of sodium formate (HCOONa) and a leucine enkephalin solution (100 pg µL−1) were used. The HCOONa solution was prepared by mixing 100 µL of 0.1 M NaOH with 200 µL of 10%v formic acid (Amresco Inc., Fontenay-sous-Bois, France), followed by the addition of 20 mL of 80:20 acetonitrile/water. The leucine enkephalin solution was prepared by diluting a 1 mg·mL−1 stock solution 1:10 in 0.1:50:50 formic acid/methanol/water. The stock solution was prepared using leucine enkephalin acetate salt hydrate (Sigma-Aldrich, Saint Louis, MO, USA, ≥95% HPLC grade).
3.2. Energy-Resolved Mass Spectrometry
High-resolution MS/MS spectra of the peptides were acquired using a Waters Q-ToF Synapt XS high-resolution mass spectrometer. Data acquisition and MS/MS processing were performed with MassLynx software 4.2 (Waters Corp., Milford, MA, USA).
The analyses were carried out by direct infusion at a flow rate of 10 µL·min⁻¹. The precursor ion selected for MS/MS experiments was the doubly protonated peptide [M+2H]2⁺ (m/z 895.03).
All mass measurements were performed in positive ion mode using an electrospray source (ESI+). The temperature of the source was set at 90 °C; nitrogen was used as the desolvation gas at a flow rate of 300 L·h⁻¹ and a temperature of 250 °C. Cone gas flow was set at 50 L·h⁻¹ and nebulizer gas pressure was set at 4 bars. The capillary voltage was set at 3.8 kV. During the CID MS/MS experiments, the quadrupolar mass analyser was used with LM and HM resolutions set to 20 and 15, respectively. Argon was used as the collision gas with a pressure of 8.15 × 10⁻3 mbar inside the collision cell during MS/MS experiments (uncorrected gauge reading).
All MS/MS spectra were acquired in the spectral range from 50 to 2000 m/z, with each acquisition lasting 1 minute. The instrument resolution was higher than 15,000. A solvent rinse (acetonitrile/water 7:3) was performed after each solution change to avoid cross-contamination.
The MS/MS spectra obtained were processed as follows: smoothed using a Savitzky-Golay algorithm with a 5-channel window and centred. The high-resolution MS/MS spectra were acquired at acceleration voltages ranging from 20 V to 42 V.
3.3. Multivariate Analysis
The multivariate analysis was carried out using R software [58] and RStudio [59]. Principal component analysis (PCA) was performed with the package “mdatools” [60]. The MS/MS spectra were normalised to the total ion current (TIC), ensuring all MS/MS spectra had the same value range from 0 to 1. This range corresponds to the relative abundance of each peak. The normalised data were centered before performing PCA. PCA was subsequently conducted using the NIPALS (Nonlinear Estimation by Iterative Partial Least Squares) algorithm.
4. Conclusions
The high rigidity of the TAT1-Carnosine peptides, attributed to the highly basic nature of these anomalously arginine-rich peptides, resulted in highly similar high-resolution MS/MS spectra for the three isomeric peptides. The predominant fragment ions, primarily observed in the 800–900 m/z range, were consistent across all three peptides. These fragment ions arose mainly from neutral losses of arginine side chains and lacked structural information regarding the position of the Carnosine residue. Furthermore, energy-resolved mass spectrometry proved inconclusive for distinguishing between the three isomeric peptides. The SY curves were nearly superimposable, and the breakdown curves of the predominant fragment ions were non-specific and remarkably similar for all three peptides.
In contrast, principal component analysis (PCA) demonstrated its effectiveness in differentiating the three isomeric peptides by identifying key fragment ions across the full MS/MS spectra. Unlike approaches that focus solely on the precursor ion or the most intense fragment ions, PCA enabled clear discrimination of the peptides. The PCA loadings revealed the presence of characteristic fragment ions for each peptide, including those with lower intensities. These correlated loadings also provided insights into consecutive fragmentation patterns. Moreover, the magnitude of the PCA loadings was proportional to the abundance of the characteristic fragment ions, offering the possibility of identifying the most abundant specific fragment ions for a given peptide. Notably, PCA identified low-intensity fragment ions that were difficult to detect through visual inspection, particularly in the case of T-Car-T, where fragment ions generated by scrambling were unexpected and challenging to identify manually.
The specific fragment ions identified through PCA further highlight the influence of Carnosine’s position within the peptide sequence on its fragmentation behaviour. For Carn-TAT, where Carnosine is located at the N-terminal position, fragmentation primarily results in its dissociation from TAT, producing only the b2 and y12 conventional ions. In contrast, TAT1-Car, with Carnosine at the C-terminal position, generates a broader range of conventional fragment ions. Interestingly, when Carnosine is positioned in the middle of the sequence, as in T-Car-T, fragmentation involves scrambling, with Carnosine rearranging to the C-terminal position before cleavage. This behaviour suggests that the C-terminal position of Carnosine facilitates peptide fragmentation.
Looking ahead, multivariate calibration methods such as Partial Least Squares (PLS) could be explored to evaluate the potential of chemometric approaches for quantifying mixtures of the three Carnosine-TAT1 peptides. Additionally, alternative fragmentation techniques, such as Electron Transfer Dissociation (ETD), could be employed to generate fragment ions that are more closely related to the peptide’s structure, avoiding the arginine side-chain losses that lack structural information. Finally, ion-mobility spectrometry could be investigated to determine its ability to distinguish between the three isomeric peptides.
Author Contributions
Conceptualization, A.M. (A. Maroto) and A.M. (A. Memboeuf); methodology, O.B., A.M. (A. Maroto) and A.M. (A. Memboeuf); software, A.M. (A. Maroto), O.B. and A.M. (A. Memboeuf); validation, A.M. (A. Maroto) and A.M. (A. Memboeuf); formal analysis, O.B., A.M. (A. Maroto), C.E. and A.M (A. Memboeuf); investigation, O.B., A.D., F.A., A.M (A. Memboeuf); resources, O.M., E.P., G.G. and A.M (A. Memboeuf); data curation, O.B. and A.M. (A. Maroto); writing—original draft preparation, A.M. (A. Maroto); writing—review and editing, A.M (A. Maroto) and A.M. (A. Memboeuf); visualization, A.M. (A. Maroto), G.G., C.E. and A.M. (A. Memboeuf); supervision, A.M. (A. Memboeuf); project administration, A.M. (A. Memboeuf); funding acquisition, A.M. (A. Memboeuf). All authors have read and agreed to the published version of the manuscript.
Funding
This research received no external funding.
Institutional Review Board Statement
Not applicable.
Informed Consent Statement
Not applicable.
Data Availability Statement
The data presented in this study are contained within the article.
Acknowledgements
The authors are grateful to the University of Brest for providing the necessary facilities to carry out this research.
Conflicts of Interest
The authors declare no conflicts of interest.
References
- Caruso, G. Unveiling the Hidden Therapeutic Potential of Carnosine, a Molecule with a Multimodal Mechanism of Action: A Position Paper. Molecules 2022, 27, 3303. [Google Scholar] [CrossRef] [PubMed]
- Chmielewska, K.; Dzierzbicka, K.; Inkielewicz-Stępniak, I.; Przybyłowska, M. Therapeutic Potential of Carnosine and Its Derivatives in the Treatment of Human Diseases. Chem. Res. Toxicol. 2020, 33, 1561–1578. [Google Scholar] [CrossRef] [PubMed]
- Tiedje, K.E.; Stevens, K.; Barnes, S.; Weaver, D.F. β-Alanine as a Small Molecule Neurotransmitter. Neurochemistry International 2010, 57, 177–188. [Google Scholar] [CrossRef]
- Aiello, G.; Rescigno, F.; Meloni, M.; Baron, G.; Aldini, G.; Carini, M.; D’Amato, A. Oxidative Stress Modulation by Carnosine in Scaffold Free Human Dermis Spheroids Model: A Proteomic Study. International Journal of Molecular Sciences 2022, 23, 1468. [Google Scholar] [CrossRef]
- Bellia, F.; Vecchio, G.; Cuzzocrea, S.; Calabrese, V.; Rizzarelli, E. Neuroprotective Features of Carnosine in Oxidative Driven Diseases. Molecular Aspects of Medicine 2011, 32, 258–266. [Google Scholar] [CrossRef]
- Caruso, G.; Fresta, C.G.; Fidilio, A.; O’Donnell, F.; Musso, N.; Lazzarino, G.; Grasso, M.; Amorini, A.M.; Tascedda, F.; Bucolo, C.; et al. Carnosine Decreases PMA-Induced Oxidative Stress and Inflammation in Murine Macrophages. Antioxidants 2019, 8, 281. [Google Scholar] [CrossRef]
- Caruso, G.; Benatti, C.; Musso, N.; Fresta, C.G.; Fidilio, A.; Spampinato, G.; Brunello, N.; Bucolo, C.; Drago, F.; Lunte, S.M.; et al. Carnosine Protects Macrophages against the Toxicity of Aβ1-42 Oligomers by Decreasing Oxidative Stress. Biomedicines 2021, 9, 477. [Google Scholar] [CrossRef]
- Miceli, V.; Pampalone, M.; Frazziano, G.; Grasso, G.; Rizzarelli, E.; Ricordi, C.; Casu, A.; Iannolo, G.; Conaldi, P.G. Carnosine Protects Pancreatic Beta Cells and Islets against Oxidative Stress Damage. Molecular and Cellular Endocrinology 2018, 474, 105–118. [Google Scholar] [CrossRef]
- Boldyrev, A.A.; Gallant, S.Ch.; Sukhich, G.T. Carnosine, the Protective, Anti-Aging Peptide. Biosci Rep 1999, 19, 581–587. [Google Scholar] [CrossRef]
- Menini, S.; Iacobini, C.; Fantauzzi, C.B.; Pugliese, G. L-Carnosine and Its Derivatives as New Therapeutic Agents for the Prevention and Treatment of Vascular Complications of Diabetes. Current Medicinal Chemistry 27, 1744–1763. [CrossRef]
- Distefano, A.; Caruso, G.; Oliveri, V.; Bellia, F.; Sbardella, D.; Zingale, G.A.; Caraci, F.; Grasso, G. Neuroprotective Effect of Carnosine Is Mediated by Insulin-Degrading Enzyme. ACS Chem. Neurosci. 2022, 13, 1588–1593. [Google Scholar] [CrossRef]
- Kawahara, M.; Sadakane, Y.; Mizuno, K.; Kato-Negishi, M.; Tanaka, K. Carnosine as a Possible Drug for Zinc-Induced Neurotoxicity and Vascular Dementia. International Journal of Molecular Sciences 2020, 21, 2570. [Google Scholar] [CrossRef] [PubMed]
- Anderson, E.J.; Vistoli, G.; Katunga, L.A.; Funai, K.; Regazzoni, L.; Monroe, T.B.; Gilardoni, E.; Cannizzaro, L.; Colzani, M.; Maddis, D.D.; et al. A Carnosine Analog Mitigates Metabolic Disorders of Obesity by Reducing Carbonyl Stress. J Clin Invest 2018, 128, 5280–5293. [Google Scholar] [CrossRef] [PubMed]
- Caruso, G.; Fresta, C.G.; Martinez-Becerra, F.; Antonio, L.; Johnson, R.T.; de Campos, R.P.S.; Siegel, J.M.; Wijesinghe, M.B.; Lazzarino, G.; Lunte, S.M. Carnosine Modulates Nitric Oxide in Stimulated Murine RAW 264.7 Macrophages. Mol Cell Biochem 2017, 431, 197–210. [Google Scholar] [CrossRef]
- Brown, C. Eric.; Antholine, W.E. Chelation Chemistry of Carnosine. Evidence That Mixed Complexes May Occur in Vivo. J. Phys. Chem. 1979, 83, 3314–3319. [Google Scholar] [CrossRef]
- Ciaffaglione, V.; Rizzarelli, E. Carnosine, Zinc and Copper: A Menage a Trois in Bone and Cartilage Protection. International Journal of Molecular Sciences 2023, 24, 16209. [Google Scholar] [CrossRef]
- Jukić, I.; Kolobarić, N.; Stupin, A.; Matić, A.; Kozina, N.; Mihaljević, Z.; Mihalj, M.; Šušnjara, P.; Stupin, M.; Ćurić, Ž.B.; et al. Carnosine, Small but Mighty—Prospect of Use as Functional Ingredient for Functional Food Formulation. Antioxidants 2021, 10, 1037. [Google Scholar] [CrossRef]
- Prakash, M.D.; Fraser, S.; Boer, J.C.; Plebanski, M.; de Courten, B.; Apostolopoulos, V. Anti-Cancer Effects of Carnosine—A Dipeptide Molecule. Molecules 2021, 26, 1644. [Google Scholar] [CrossRef]
- Artasensi, A.; Mazzotta, S.; Sanz, I.; Lin, L.; Vistoli, G.; Fumagalli, L.; Regazzoni, L. Exploring Secondary Amine Carnosine Derivatives: Design, Synthesis, and Properties. Molecules 2024, 29, 5083. [Google Scholar] [CrossRef]
- Orioli, M.; Vistoli, G.; Regazzoni, L.; Pedretti, A.; Lapolla, A.; Rossoni, G.; Canevotti, R.; Gamberoni, L.; Previtali, M.; Carini, M.; et al. Design, Synthesis, ADME Properties, and Pharmacological Activities of β-Alanyl-D-Histidine (D-Carnosine) Prodrugs with Improved Bioavailability. ChemMedChem 2011, 6, 1269–1282. [Google Scholar] [CrossRef]
- Jeang, K.-T.; Xiao, H.; Rich, E.A. Multifaceted Activities of the HIV-1 Transactivator of Transcription, Tat *. Journal of Biological Chemistry 1999, 274, 28837–28840. [Google Scholar] [CrossRef]
- Vivès, E.; Brodin, P.; Lebleu, B. A Truncated HIV-1 Tat Protein Basic Domain Rapidly Translocates through the Plasma Membrane and Accumulates in the Cell Nucleus*. Journal of Biological Chemistry 1997, 272, 16010–16017. [Google Scholar] [CrossRef] [PubMed]
- Rizzuti, M.; Nizzardo, M.; Zanetta, C.; Ramirez, A.; Corti, S. Therapeutic Applications of the Cell-Penetrating HIV-1 Tat Peptide. Drug Discovery Today 2015, 20, 76–85. [Google Scholar] [CrossRef] [PubMed]
- Distefano, A.; Calì, F.; Gaeta, M.; Tuccitto, N.; Auditore, A.; Licciardello, A.; D’Urso, A.; Lee, K.-J.; Monasson, O.; Peroni, E.; et al. Carbon Dots Surface Chemistry Drives Fluorescent Properties: New Tools to Distinguish Isobaric Peptides. Journal of Colloid and Interface Science 2022, 625, 405–414. [Google Scholar] [CrossRef] [PubMed]
- Auditore A; Tuccitto N; Grasso G; Monasson O; Peroni E; Licciardello A Time-of-Flight SIMS Investigation of Peptides Containing Cell Penetrating Sequences. Biointerphases 2023, 18. [CrossRef]
- Antonio Zingale, G.; Pandino, I.; Tuccitto, N.; Distefano, A.; Calì, F.; Calcagno, D.; Grasso, G. Carbon Dots Fluorescence Can Be Used to Distinguish Isobaric Peptide and to Monitor Protein Oligomerization Dynamics. Methods 2024, 230, 1–8. [Google Scholar] [CrossRef]
- Uclés, S.; Lozano, A.; Sosa, A.; Parrilla Vázquez, P.; Valverde, A.; Fernández-Alba, A.R. Matrix Interference Evaluation Employing GC and LC Coupled to Triple Quadrupole Tandem Mass Spectrometry. Talanta 2017, 174, 72–81. [Google Scholar] [CrossRef]
- Yan, Z.; Maher, N.; Torres, R.; Cotto, C.; Hastings, B.; Dasgupta, M.; Hyman, R.; Huebert, N.; Caldwell, G.W. Isobaric Metabolite Interferences and the Requirement for Close Examination of Raw Data in Addition to Stringent Chromatographic Separations in Liquid Chromatography/Tandem Mass Spectrometric Analysis of Drugs in Biological Matrix. Rapid Communications in Mass Spectrometry 2008, 22, 2021–2028. [Google Scholar] [CrossRef]
- Tao, W.A.; Cooks, R.G. Peer Reviewed: Chiral Analysis by MS. Anal. Chem. 2003, 75, 25 A–31 A. [Google Scholar] [CrossRef]
- Tao, W.A.; Wu, L.; Cooks, R.G. Differentiation and Quantitation of Isomeric Dipeptides by Low-Energy Dissociation of Copper(II)-Bound Complexes. J. Am. Soc. Mass Spectrom. 2001, 12, 490–496. [Google Scholar] [CrossRef]
- Far, J.; Delvaux, C.; Kune, C.; Eppe, G.; de Pauw, E. The Use of Ion Mobility Mass Spectrometry for Isomer Composition Determination Extracted from Se-Rich Yeast. Anal. Chem. 2014, 86, 11246–11254. [Google Scholar] [CrossRef]
- Hanozin, E.; Morsa, D.; De Pauw, E. Energetics and Structural Characterization of Isomers Using Ion Mobility and Gas-Phase H/D Exchange: Learning from Lasso Peptides. PROTEOMICS 2015, 15, 2823–2834. [Google Scholar] [CrossRef] [PubMed]
- Lapthorn, C.; Pullen, F.; Chowdhry, B.Z. Ion Mobility Spectrometry-Mass Spectrometry (IMS-MS) of Small Molecules: Separating and Assigning Structures to Ions. Mass Spectrom Rev 2013, 32, 43–71. [Google Scholar] [CrossRef] [PubMed]
- Morsa, D.; Defize, T.; Dehareng, D.; Jérôme, C.; De Pauw, E. Polymer Topology Revealed by Ion Mobility Coupled with Mass Spectrometry. Anal. Chem. 2014, 86, 9693–9700. [Google Scholar] [CrossRef] [PubMed]
- Wu, Q.; Wang, J.-Y.; Han, D.-Q.; Yao, Z.-P. Recent Advances in Differentiation of Isomers by Ion Mobility Mass Spectrometry. TrAC Trends in Analytical Chemistry 2020, 124, 115801. [Google Scholar] [CrossRef]
- Carlo, M.J.; Nanney, A.L.M.; Patrick, A.L. Energy-Resolved In-Source Collison-Induced Dissociation for Isomer Discrimination. J. Am. Soc. Mass Spectrom. 2024, 35, 2631–2641. [Google Scholar] [CrossRef]
- Dong, X.; Mayes, H.B.; Morreel, K.; Katahira, R.; Li, Y.; Ralph, J.; Black, B.A.; Beckham, G.T. Energy-Resolved Mass Spectrometry as a Tool for Identification of Lignin Depolymerization Products. ChemSusChem 2023, 16, e202201441. [Google Scholar] [CrossRef]
- Harrison, A.G. Energy-Resolved Mass Spectrometry: A Comparison of Quadrupole Cell and Cone-Voltage Collision-Induced Dissociation. Rapid Commun Mass Spectrom 1999, 13, 1663–1670. [Google Scholar] [CrossRef]
- Maroto, A.; Jeanne Dit Fouque, D.; Memboeuf, A. Ion Trap MS Using High Trapping Gas Pressure Enables Unequivocal Structural Analysis of Three Isobaric Compounds in a Mixture by Using Energy-Resolved Mass Spectrometry and the Survival Yield Technique. J Mass Spectrom 2020, 55, e4478. [Google Scholar] [CrossRef]
- Maroto, A.; dit Fouque, D.J.; Lartia, R.; Memboeuf, A. Removal of Isobaric Interference Using Pseudo-Multiple Reaction Monitoring and Energy-Resolved Mass Spectrometry for the Isotope Dilution Quantification of a Tryptic Peptide. Journal of Mass Spectrometry 2024, 59, e5025. [Google Scholar] [CrossRef]
- Menicatti, M.; Guandalini, L.; Dei, S.; Floriddia, E.; Teodori, E.; Traldi, P.; Bartolucci, G. The Power of Energy-Resolved Tandem Mass Spectrometry Experiments for Resolution of Isomers: The Case of Drug Plasma Stability Investigation of Multidrug Resistance Inhibitors. Rapid Commun Mass Spectrom 2016, 30, 423–432. [Google Scholar] [CrossRef]
- Menicatti, M.; Guandalini, L.; Dei, S.; Floriddia, E.; Teodori, E.; Traldi, P.; Bartolucci, G. Energy Resolved Tandem Mass Spectrometry Experiments for Resolution of Isobaric Compounds: A Case of Cis/Trans Isomerism. Eur J Mass Spectrom (Chichester) 2016, 22, 235–243. [Google Scholar] [CrossRef] [PubMed]
- Menicatti, M.; Pallecchi, M.; Ricciutelli, M.; Galarini, R.; Moretti, S.; Sagratini, G.; Vittori, S.; Lucarini, S.; Caprioli, G.; Bartolucci, G. Determination of Coeluted Isomers in Wine Samples by Application of MS/MS Deconvolution Analysis. Journal of Mass Spectrometry 2020, 55, e4607. [Google Scholar] [CrossRef] [PubMed]
- Crotti, S.; Menicatti, M.; Pallecchi, M.; Bartolucci, G. Tandem Mass Spectrometry Approaches for Recognition of Isomeric Compounds Mixtures. Mass Spectrometry Reviews 2023, 42, 1244–1260. [Google Scholar] [CrossRef] [PubMed]
- Pallecchi, M.; Lucio, L.; Braconi, L.; Menicatti, M.; Dei, S.; Teodori, E.; Bartolucci, G. Isomers Recognition in HPLC-MS/MS Analysis of Human Plasma Samples by Using an Ion Trap Supported by a Linear Equations-Based Algorithm. International Journal of Molecular Sciences 2023, 24, 11155. [Google Scholar] [CrossRef]
- Pallecchi, M.; Braconi, L.; Menicatti, M.; Giachetti, S.; Dei, S.; Teodori, E.; Bartolucci, G. Simultaneous Degradation Study of Isomers in Human Plasma by HPLC-MS/MS and Application of LEDA Algorithm for Their Characterization. International Journal of Molecular Sciences 2022, 23, 13139. [Google Scholar] [CrossRef]
- Menicatti, M.; Pallecchi, M.; Bua, S.; Vullo, D.; Di Cesare Mannelli, L.; Ghelardini, C.; Carta, F.; Supuran, C.T.; Bartolucci, G. Resolution of Co-Eluting Isomers of Anti-Inflammatory Drugs Conjugated to Carbonic Anhydrase Inhibitors from Plasma in Liquid Chromatography by Energy-Resolved Tandem Mass Spectrometry. J Enzyme Inhib Med Chem 2018, 33, 671–679. [Google Scholar] [CrossRef]
- Bellumori, M.; Pallecchi, M.; Zonfrillo, B.; Lucio, L.; Menicatti, M.; Innocenti, M.; Mulinacci, N.; Bartolucci, G. Study of Mono and Di-O-Caffeoylquinic Acid Isomers in Acmella Oleracea Extracts by HPLC-MS/MS and Application of Linear Equation of Deconvolution Analysis Algorithm for Their Characterization. Pharmaceuticals 2023, 16, 1375. [Google Scholar] [CrossRef]
- Memboeuf, A.; Jullien, L.; Lartia, R.; Brasme, B.; Gimbert, Y. Tandem Mass Spectrometric Analysis of a Mixture of Isobars Using the Survival Yield Technique. J. Am. Soc. Mass Spectrom. 2011, 22. [Google Scholar] [CrossRef]
- Maroto, A.; Boqué, R.; Jeanne Dit Fouque, D.; Memboeuf, A. Energy-Resolved Mass Spectrometry and Mid-Infrared Spectroscopy for Purity Assessment of a Synthetic Peptide Cyclised by Intramolecular Huisgen Click Chemistry. Methods and Protocols 2024, 7, 97. [Google Scholar] [CrossRef]
- Jeanne Dit Fouque, D.; Maroto, A.; Memboeuf, A. Purification and Quantification of an Isomeric Compound in a Mixture by Collisional Excitation in Multistage Mass Spectrometry Experiments. Anal. Chem. 2016, 88, 10821–10825. [Google Scholar] [CrossRef]
- Jeanne Dit Fouque, D.; Lartia, R.; Maroto, A.; Memboeuf, A. Quantification of Intramolecular Click Chemistry Modified Synthetic Peptide Isomers in Mixtures Using Tandem Mass Spectrometry and the Survival Yield Technique. Anal Bioanal Chem 2018, 410, 5765–5777. [Google Scholar] [CrossRef] [PubMed]
- Jeanne Dit Fouque, D.; Maroto, A.; Memboeuf, A. Internal Standard Quantification Using Tandem Mass Spectrometry of a Tryptic Peptide in the Presence of an Isobaric Interference. Anal. Chem. 2018, 90, 14126–14130. [Google Scholar] [CrossRef] [PubMed]
- Maroto, A.; Fouque, D.J. dit; Lartia, R.; Memboeuf, A. LC-MS Accurate Quantification of a Tryptic Peptide Co-Eluted with an Isobaric Interference by Using in-Source Collisional Purification. Anal Bioanal Chem 2023, 415, 7211–7221. [Google Scholar] [CrossRef] [PubMed]
- Paizs, B.; Suhai, S. Fragmentation Pathways of Protonated Peptides. Mass Spectrometry Reviews 2005, 24, 508–548. [Google Scholar] [CrossRef] [PubMed]
- Bleiholder, C.; Osburn, S.; Williams, T.D.; Suhai, S.; Van Stipdonk, M.; Harrison, A.G.; Paizs, B. Sequence-Scrambling Fragmentation Pathways of Protonated Peptides. J. Am. Chem. Soc. 2008, 130, 17774–17789. [Google Scholar] [CrossRef]
- Massart, D.L.; Vandeginste, B.G.M.; Buydens, L.M.C.; De Jong, S.; Lewi, P.J.; Smeyers-Verbeke, J. Handbook of Chemometrics and Qualimetrics: Part A; Elsevier: Amsterdam. The Netherlands, 1997; ISBN 0-444-89724-0. [Google Scholar]
- R Core Team (2022). R: A Language and Environment for Statistical Computing. R Foundation for Statistical Computing, Vienna, Austria. URL Https://Www.R-Project.Org/.
- RStudio Team (2022). RStudio: Integrated Development Environment for R. RStudio, PBC, Boston, MA URL Http://Www.Rstudio.Com/.
- Kucheryavskiy, S. Mdatools – R Package for Chemometrics. Chemometrics and Intelligent Laboratory Systems 2020, 198, 103937. [Google Scholar] [CrossRef]
Figure 1.
Amino acid sequences of Carnosine (Car) and TAT1. The three isomeric peptides studied are also shown. In Car-TAT1, carnosine is bound to the N-terminus; in TAT1-Car, it is bound to the C-terminus; and in T-Car-T, carnosine is located in the middle of the TAT1 amino acid sequence.
Figure 1.
Amino acid sequences of Carnosine (Car) and TAT1. The three isomeric peptides studied are also shown. In Car-TAT1, carnosine is bound to the N-terminus; in TAT1-Car, it is bound to the C-terminus; and in T-Car-T, carnosine is located in the middle of the TAT1 amino acid sequence.
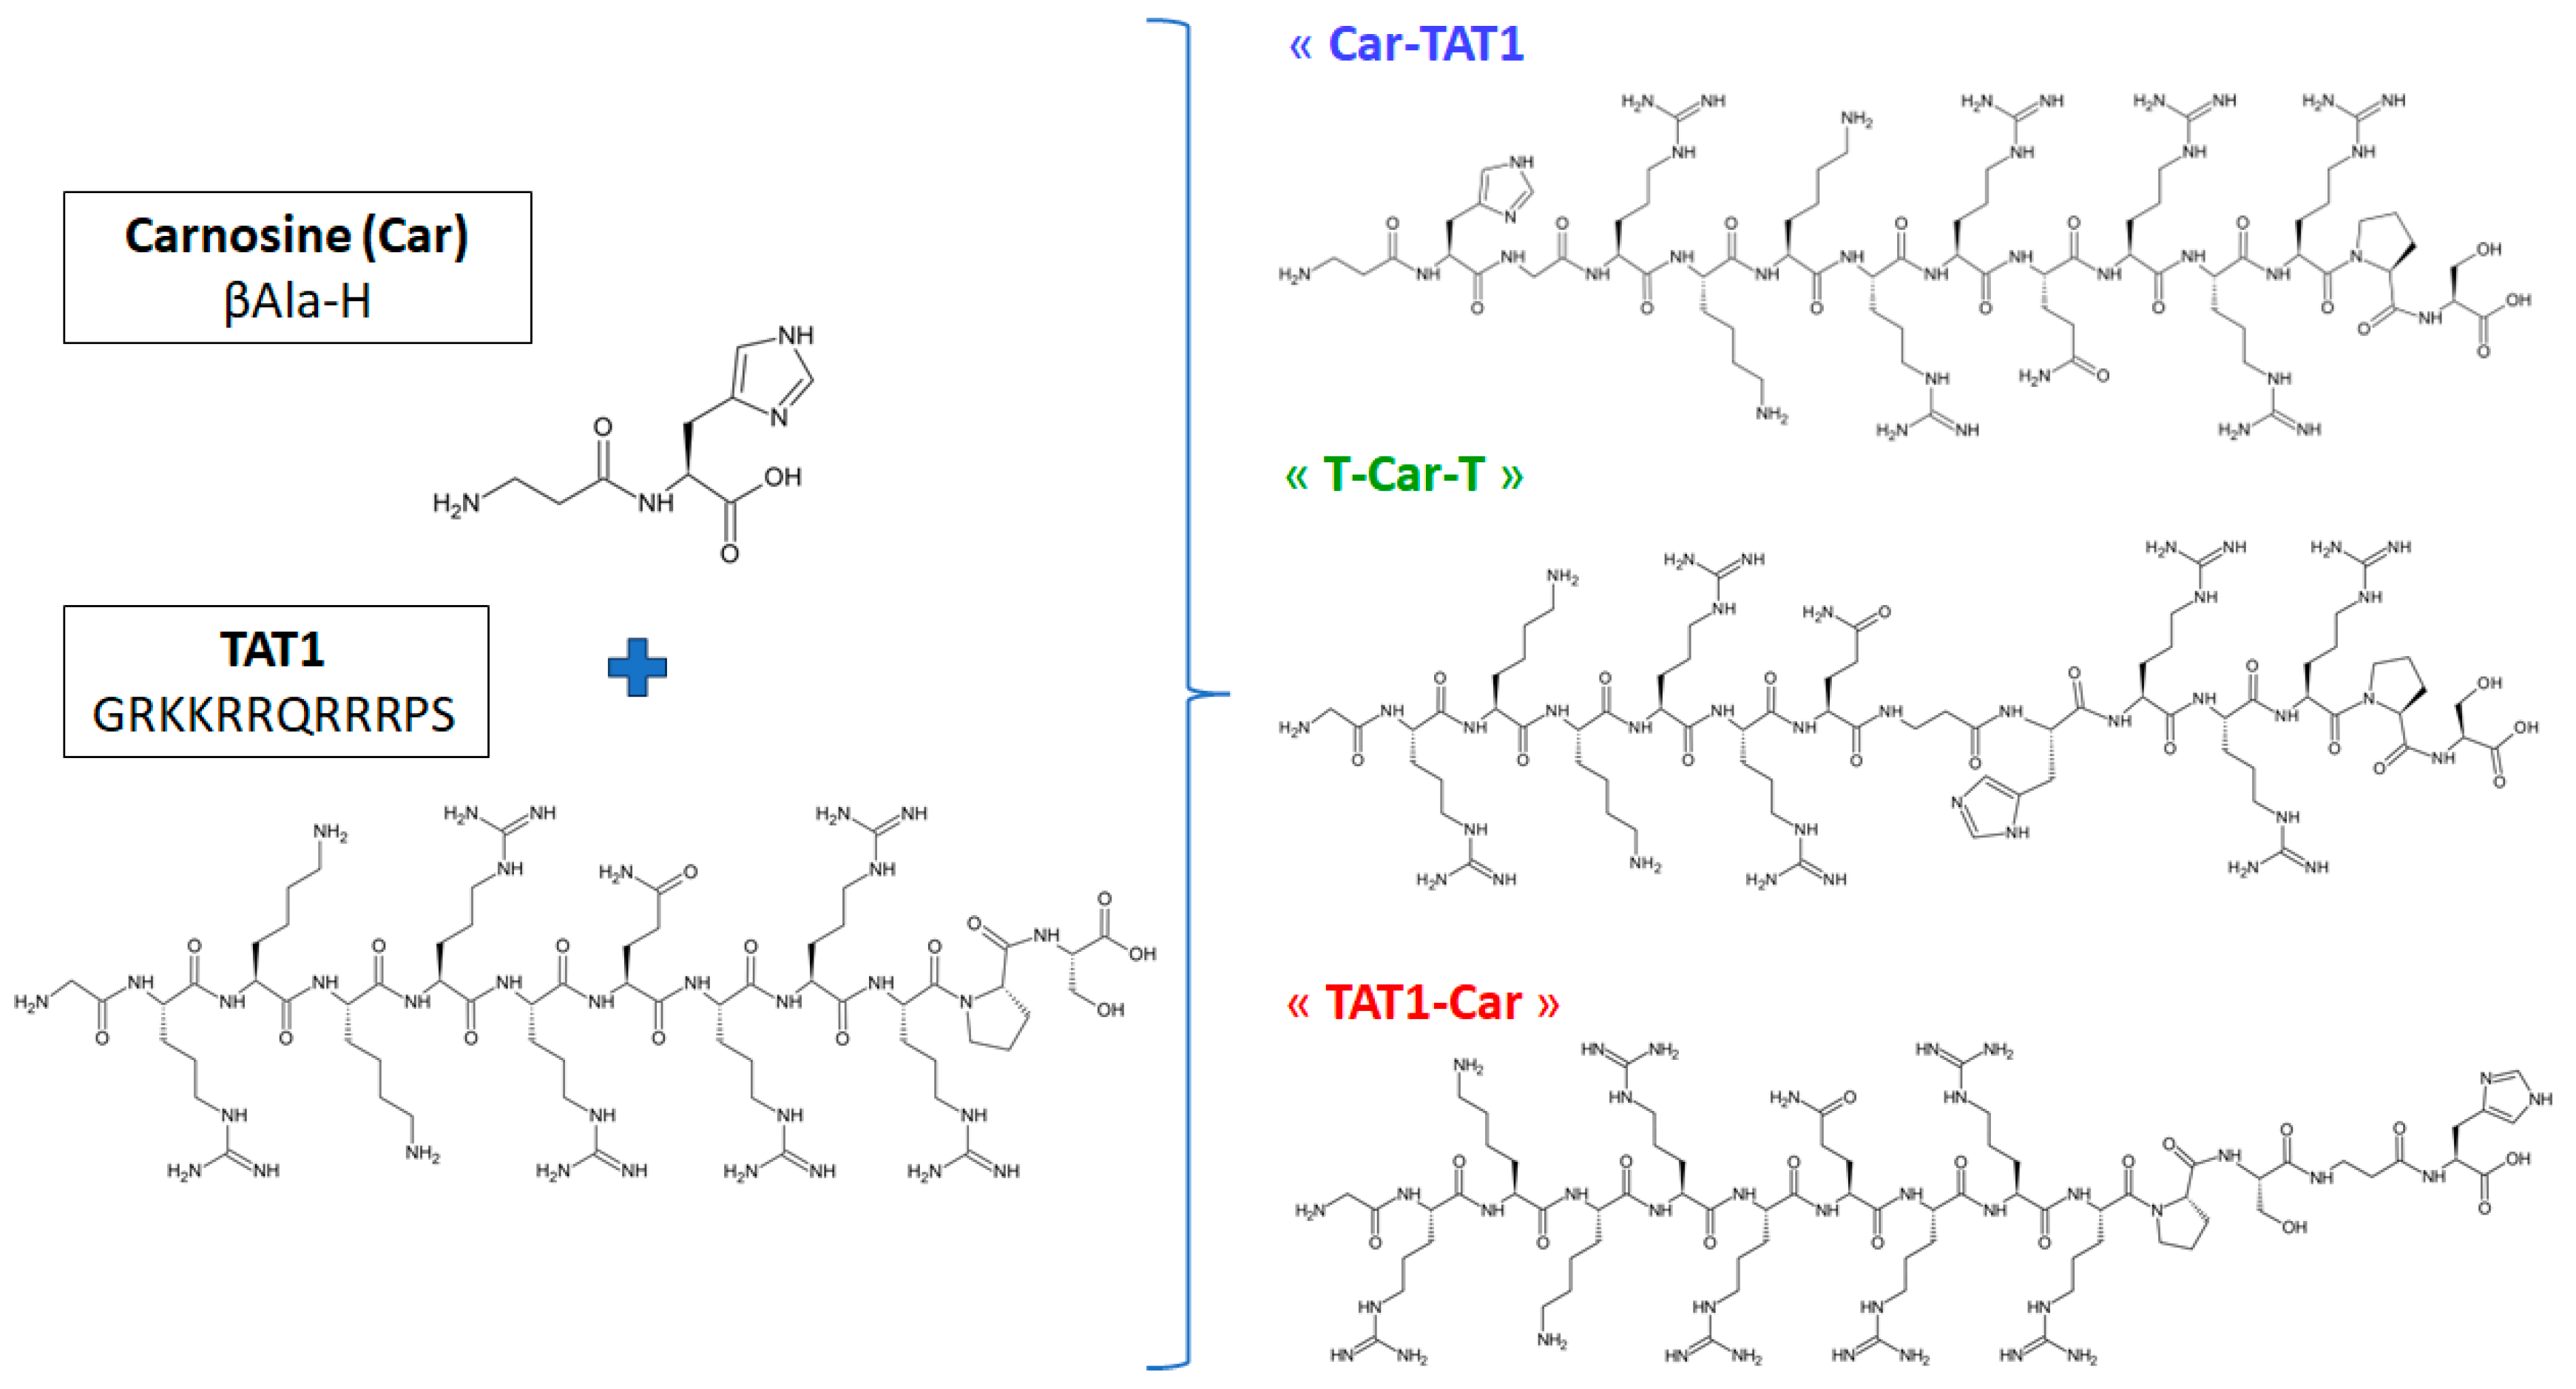
Figure 2.
High resolution MS/MS spectra of T-Car-T, TAT1-Car and Car-TAT1. Acceleration voltage: 36 V. The precursor ion at m/z 895.04 corresponds to the doubly protonated peptide.
Figure 2.
High resolution MS/MS spectra of T-Car-T, TAT1-Car and Car-TAT1. Acceleration voltage: 36 V. The precursor ion at m/z 895.04 corresponds to the doubly protonated peptide.
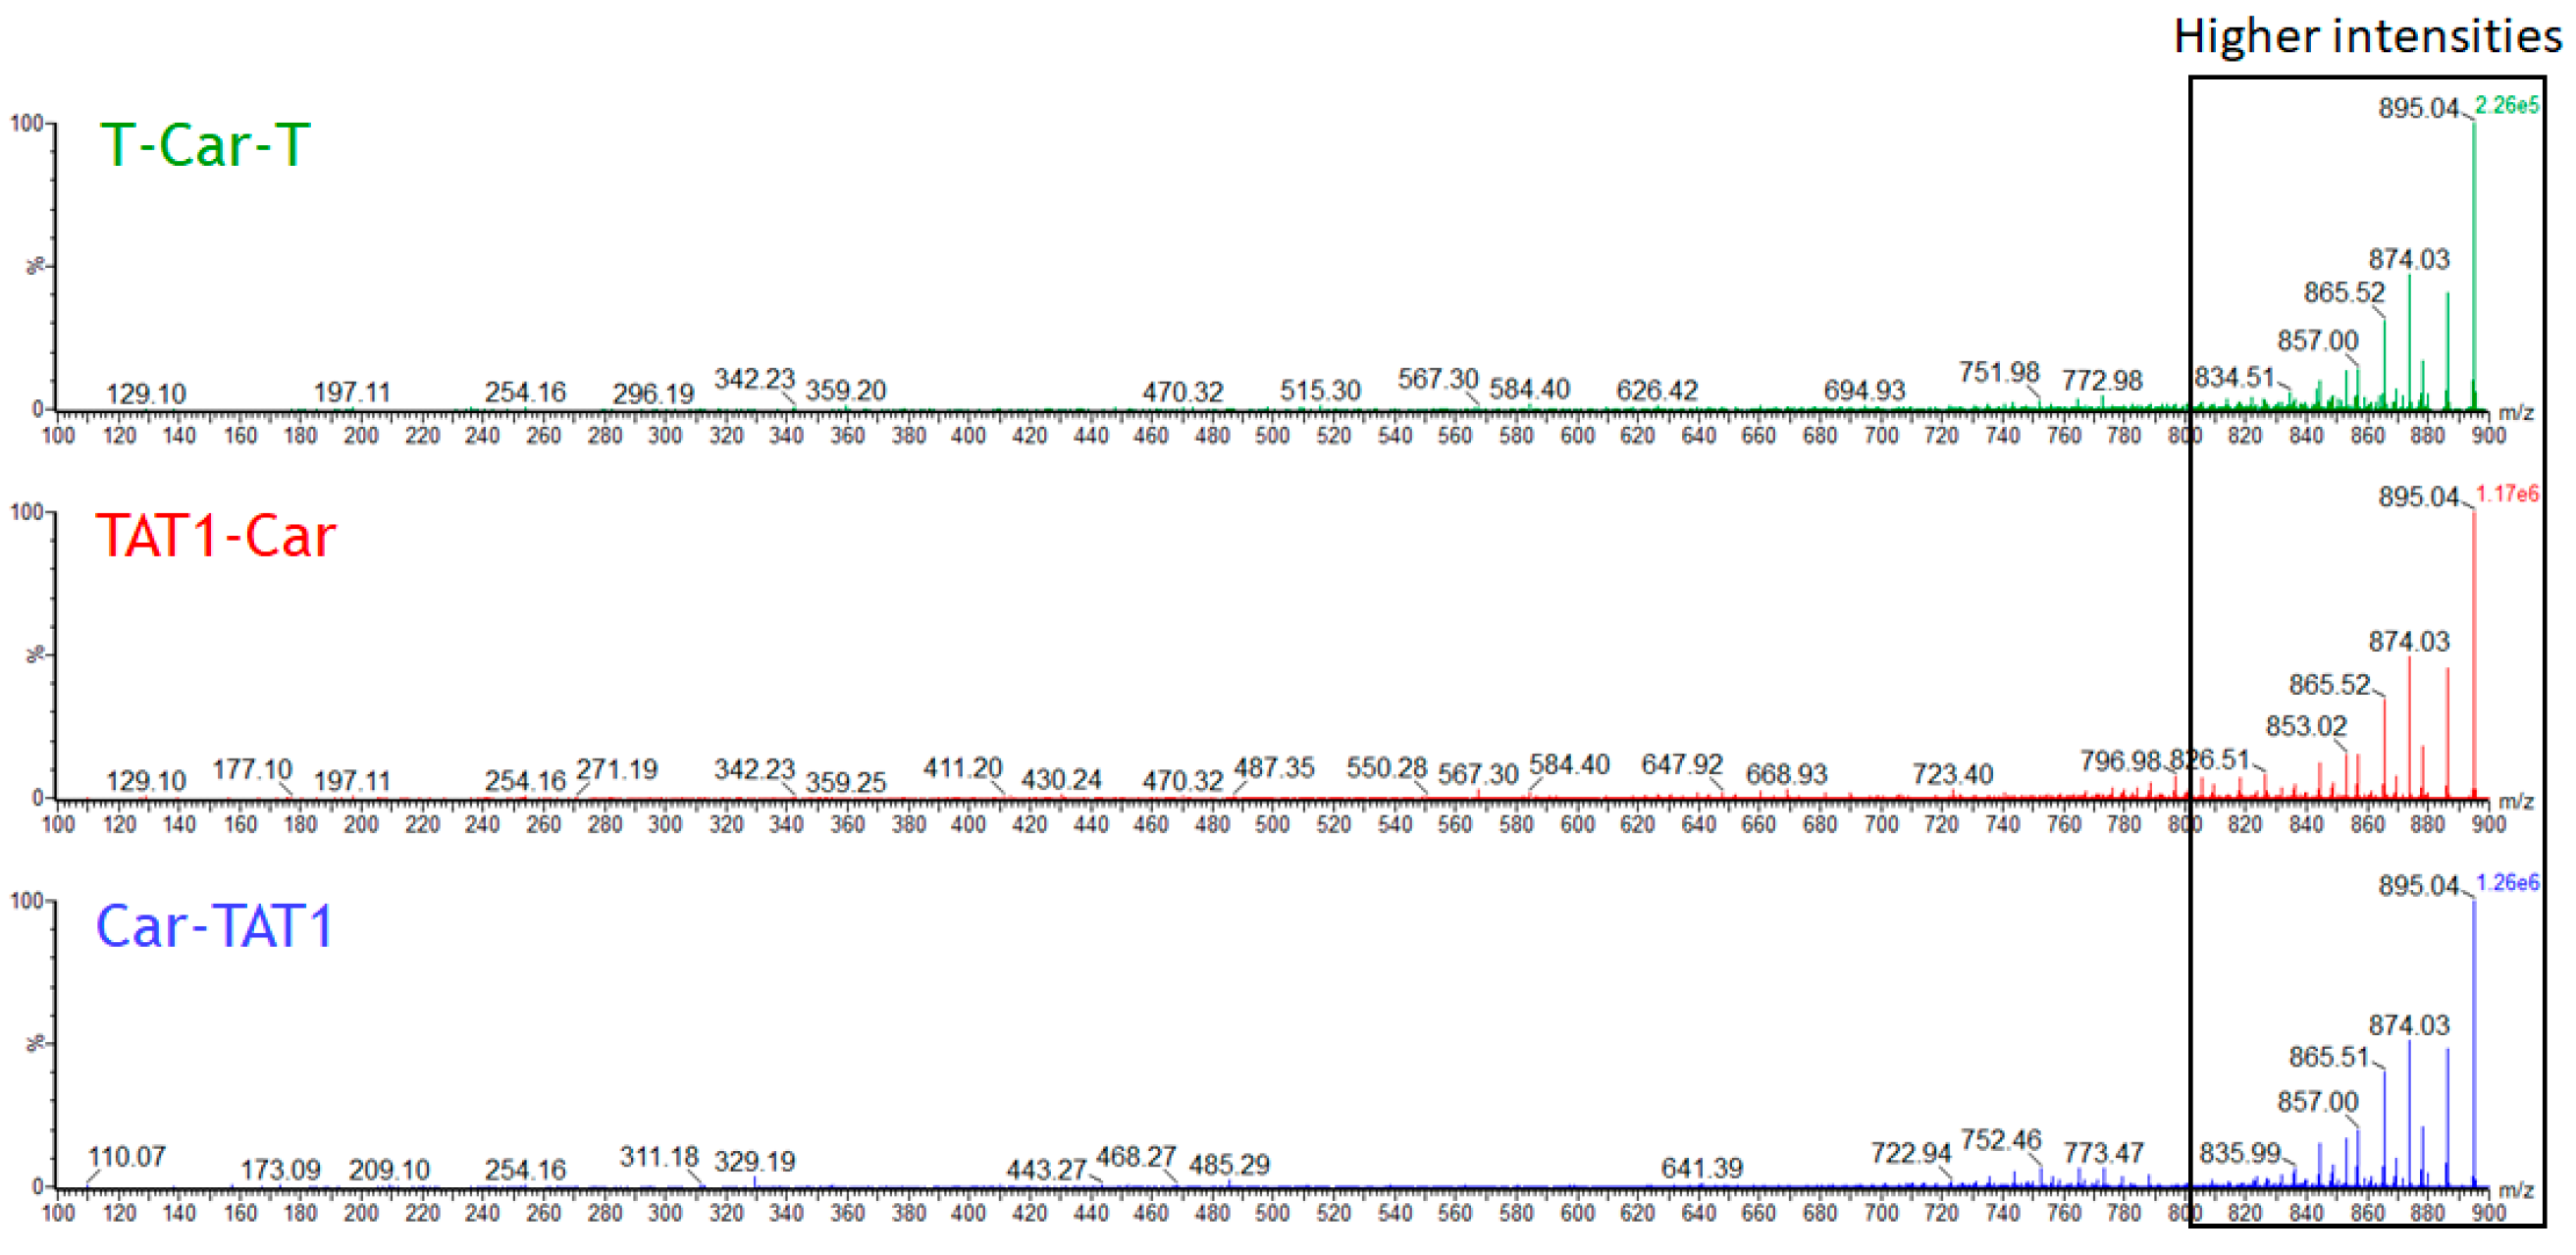
Figure 3.
High resolution MS/MS spectrum of Car-TAT1 from 800 to 900 m/z (rectangle of Figure 2). Acceleration voltage: 36 V. The fragment ions are due to consecutive neutral losses and they do not provide information on the position of Carnosine. This part of the MS/MS spectrum is very similar for the three isomeric peptides.
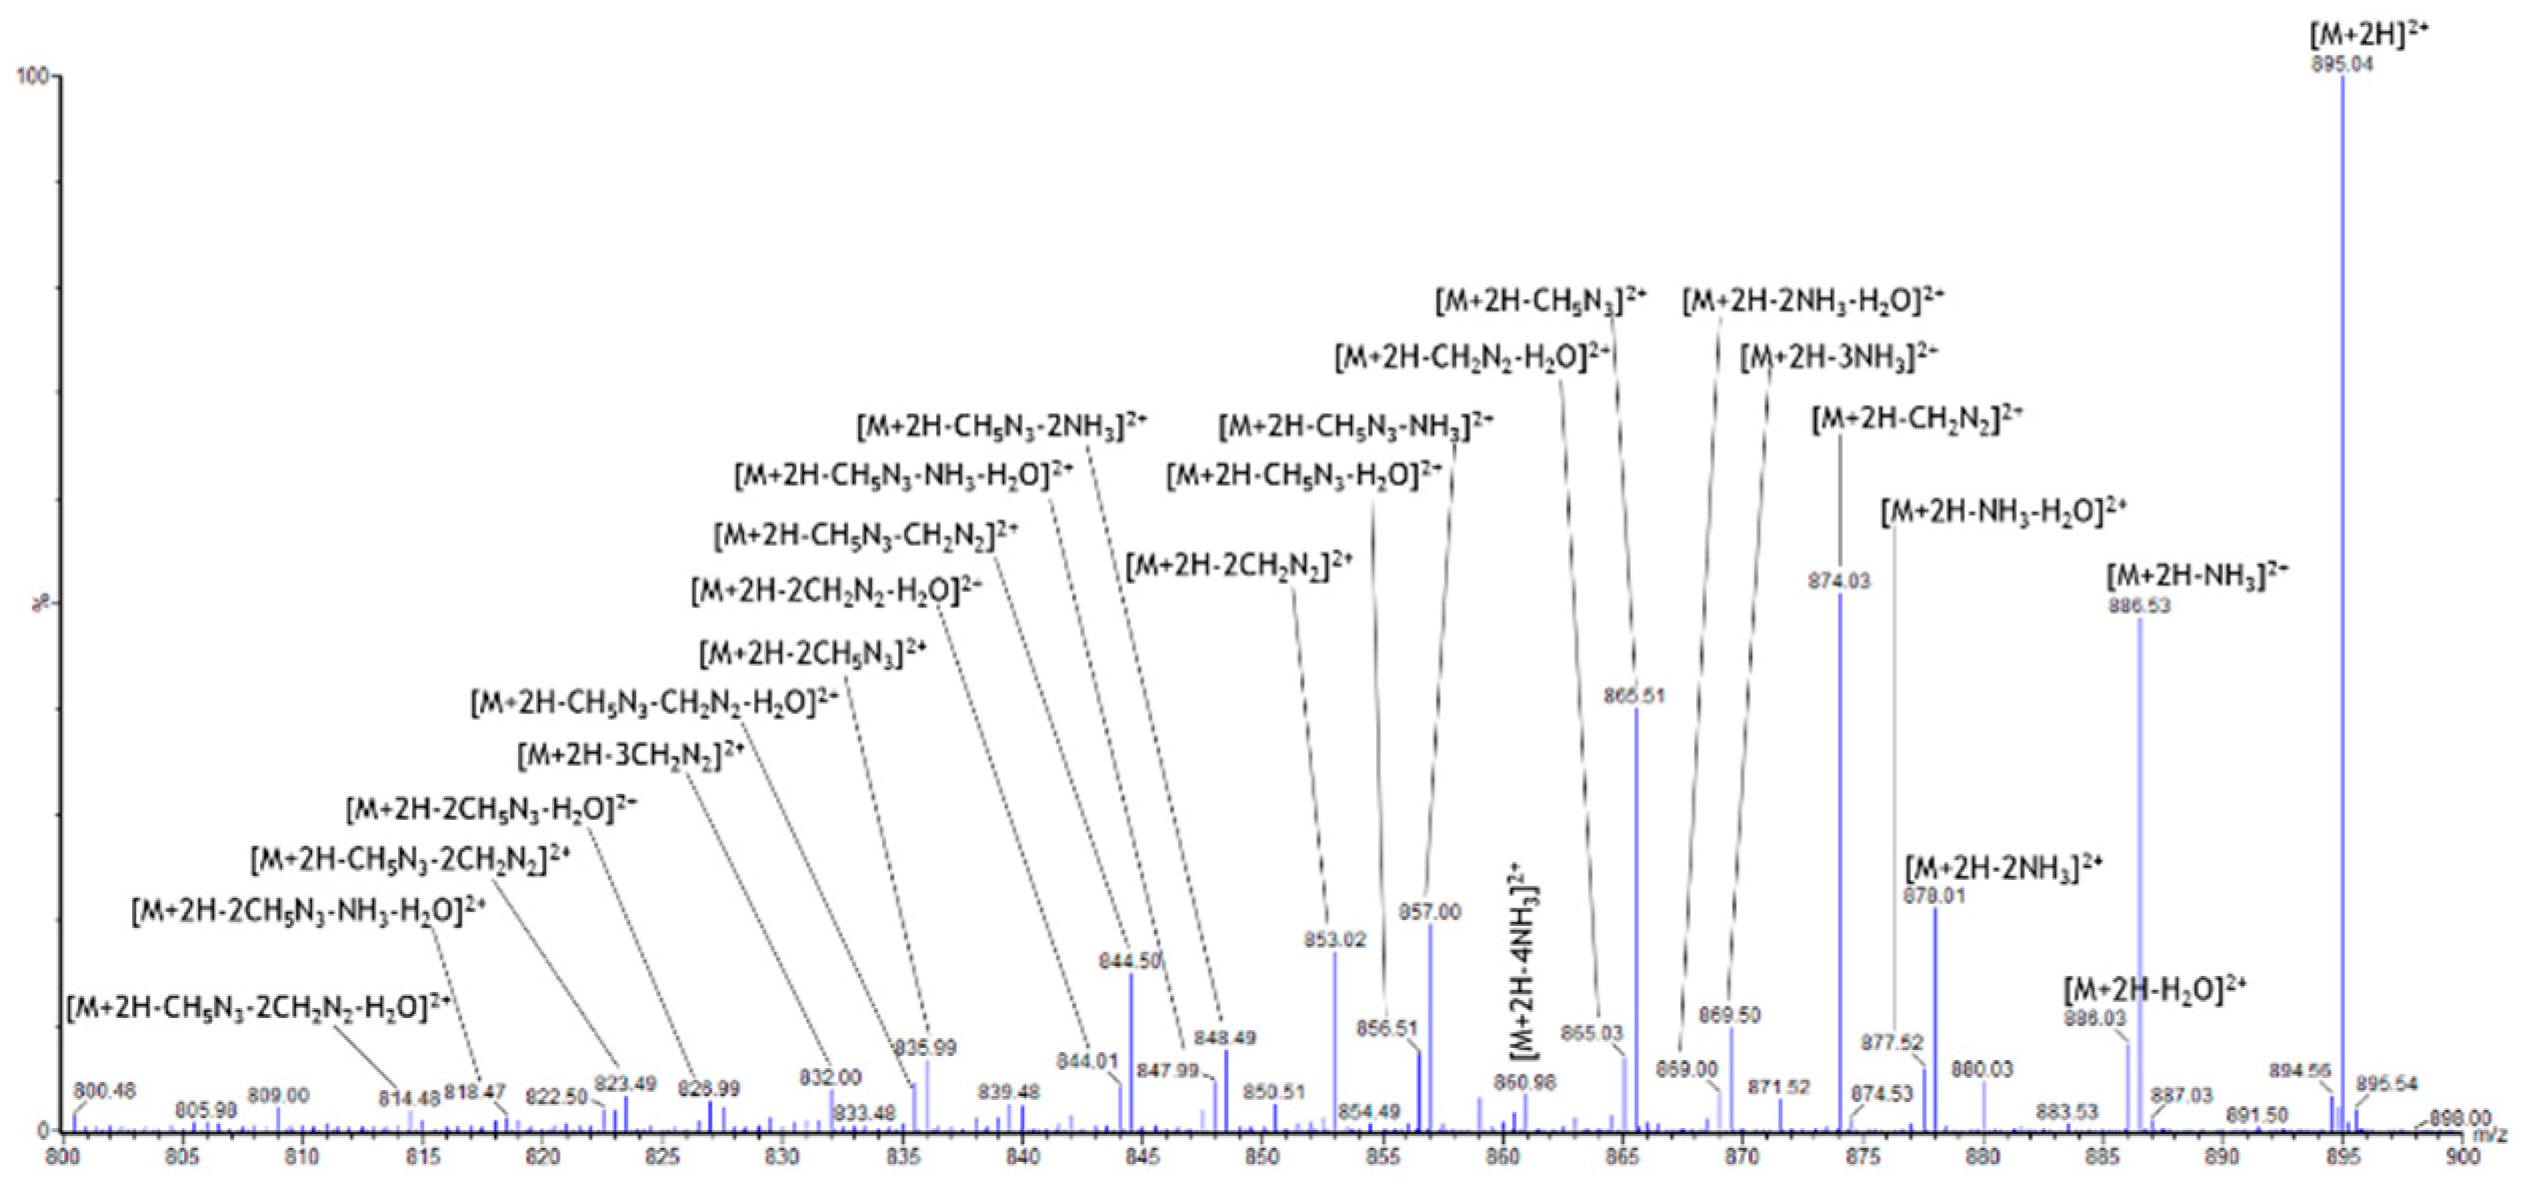
Figure 4.
Survival Yield (SY) curve of the double protonated isomeric peptides: Car-TAT1 (blue), TAT1-Car (red) and T-Car-T (green). SY was calculated from high resolution MS/MS spectra performed at acceleration voltages comprised between 20 V and 42 V. The SY curves are very similar for the three peptides.
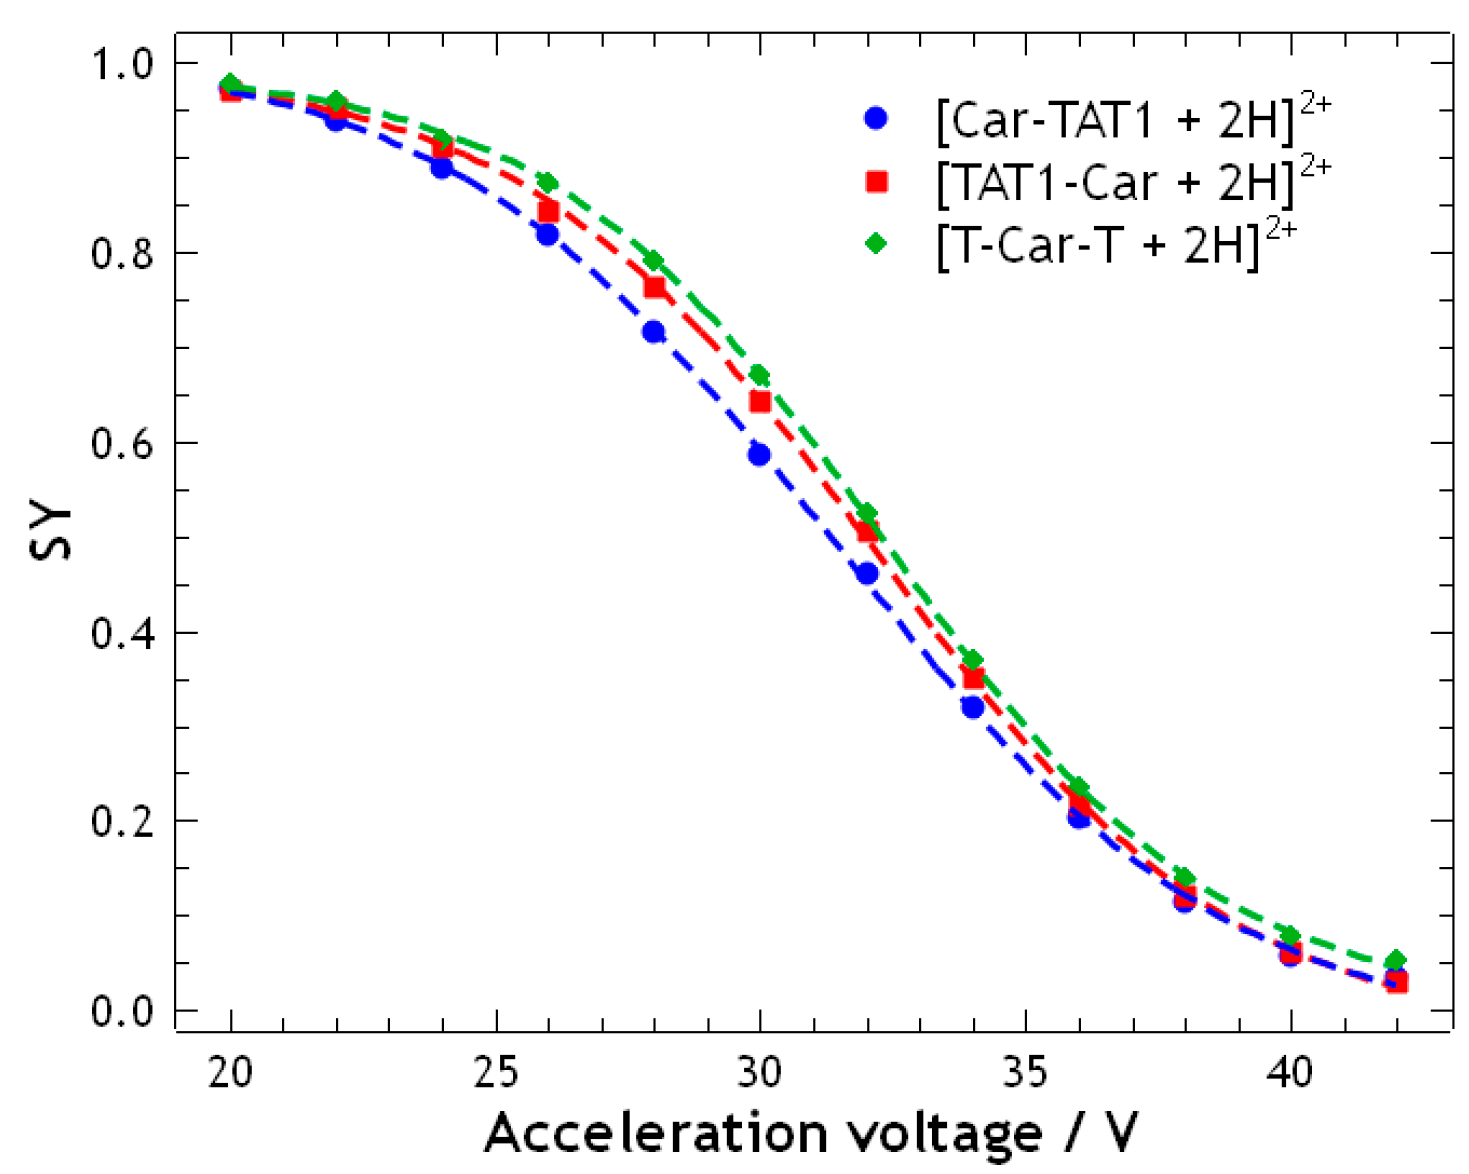
Figure 5.
Breakdown curves of the doubly protonated isomeric peptides: Car-TAT1 (blue), TAT1-Car (red), and T-Car-T (green), obtained for the major fragment ions at m/z 886.52, 874.03, 865.51, and 857.00. High-resolution MS/MS spectra were acquired at acceleration voltages ranging from 20 V to 42 V.
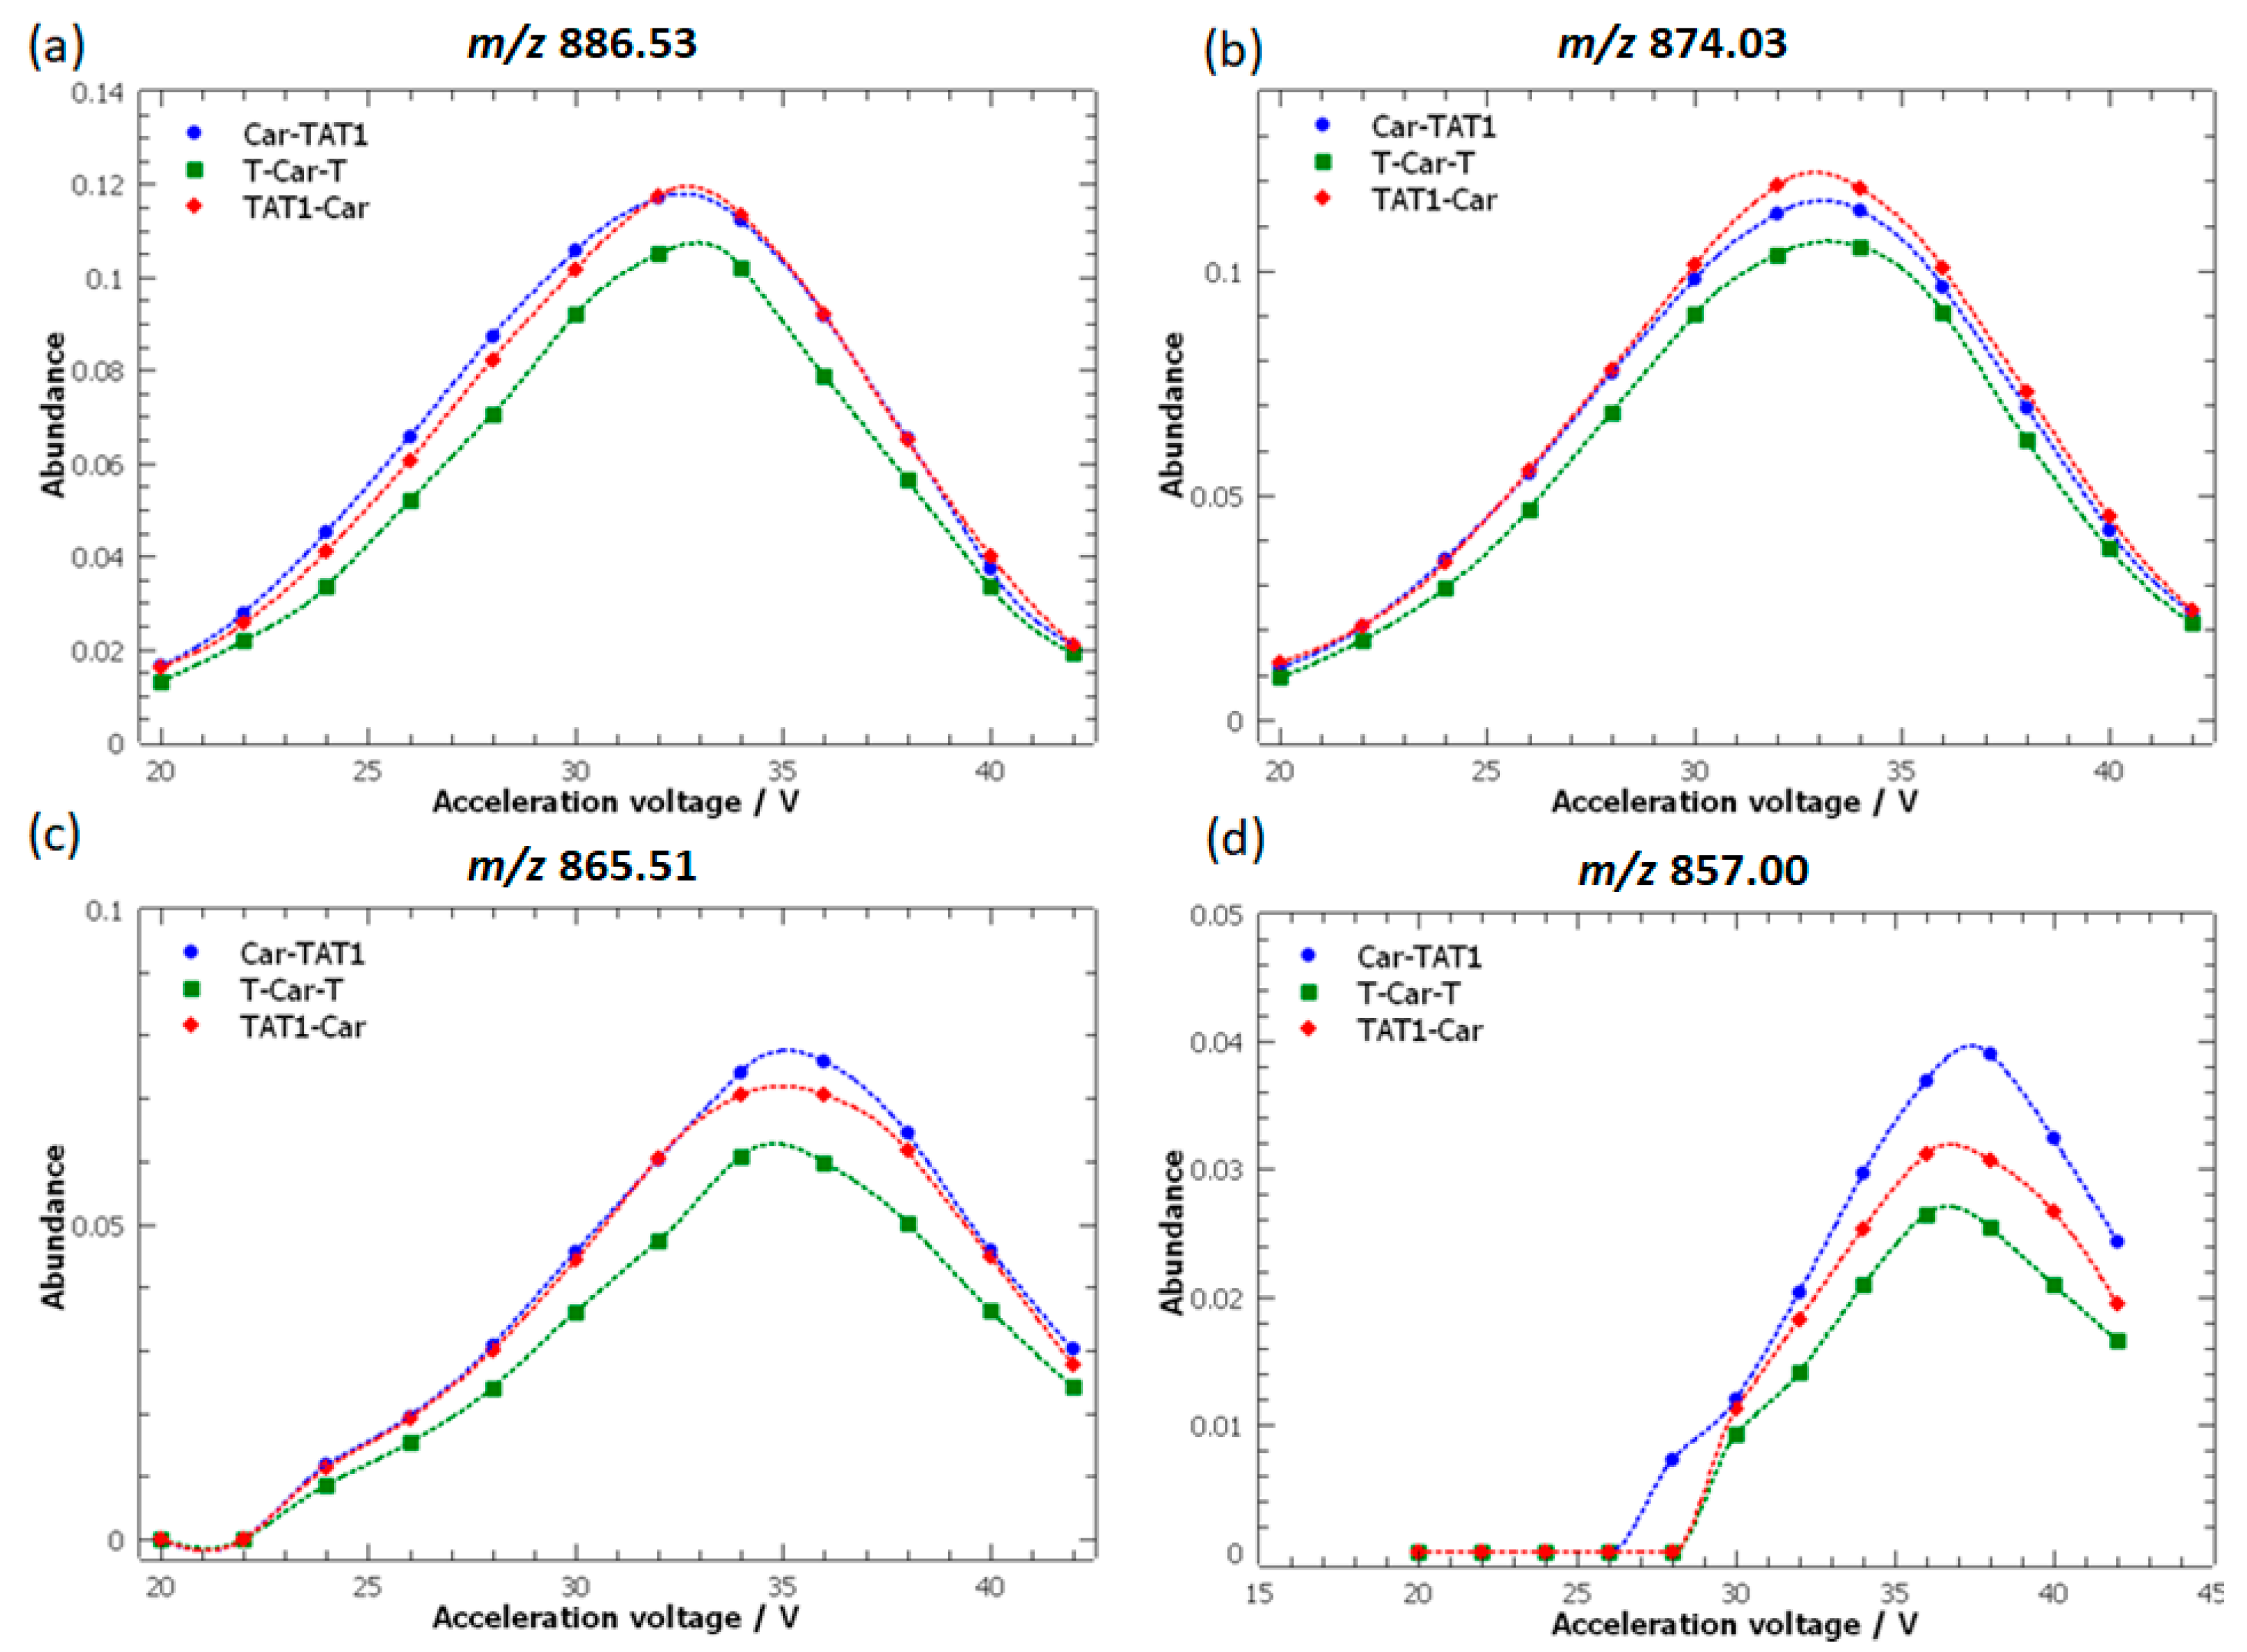
Figure 6.
Principal Component Analysis (PCA) performed on the high resolution MS/MS spectra of T-Car-T, TAT1-Car and Car-TAT1 in the m/z range of 100-900. (a) Score plot of the two first principal components (the explained variance for PC1 is 52.05% and 47.95% for PC2). (b) Loading plot of PC1 vs PC2. Each point (in blue) shows the loading of a mass peak (m/z) for PC1 (in x-axis) and PC2 (in y-axis). (c) Loadings (line plot). Each line shows the loading of a given m/z plotted for PC1 (in blue) and PC2 (in red). High positive or negative loadings shows the m/z variables with higher contribution. (d) PCA biplot with PC1 and PC2 as the axes. Each point (in blue) represents one of the peptides, while the red arrows represents the loadings of the mass peaks.
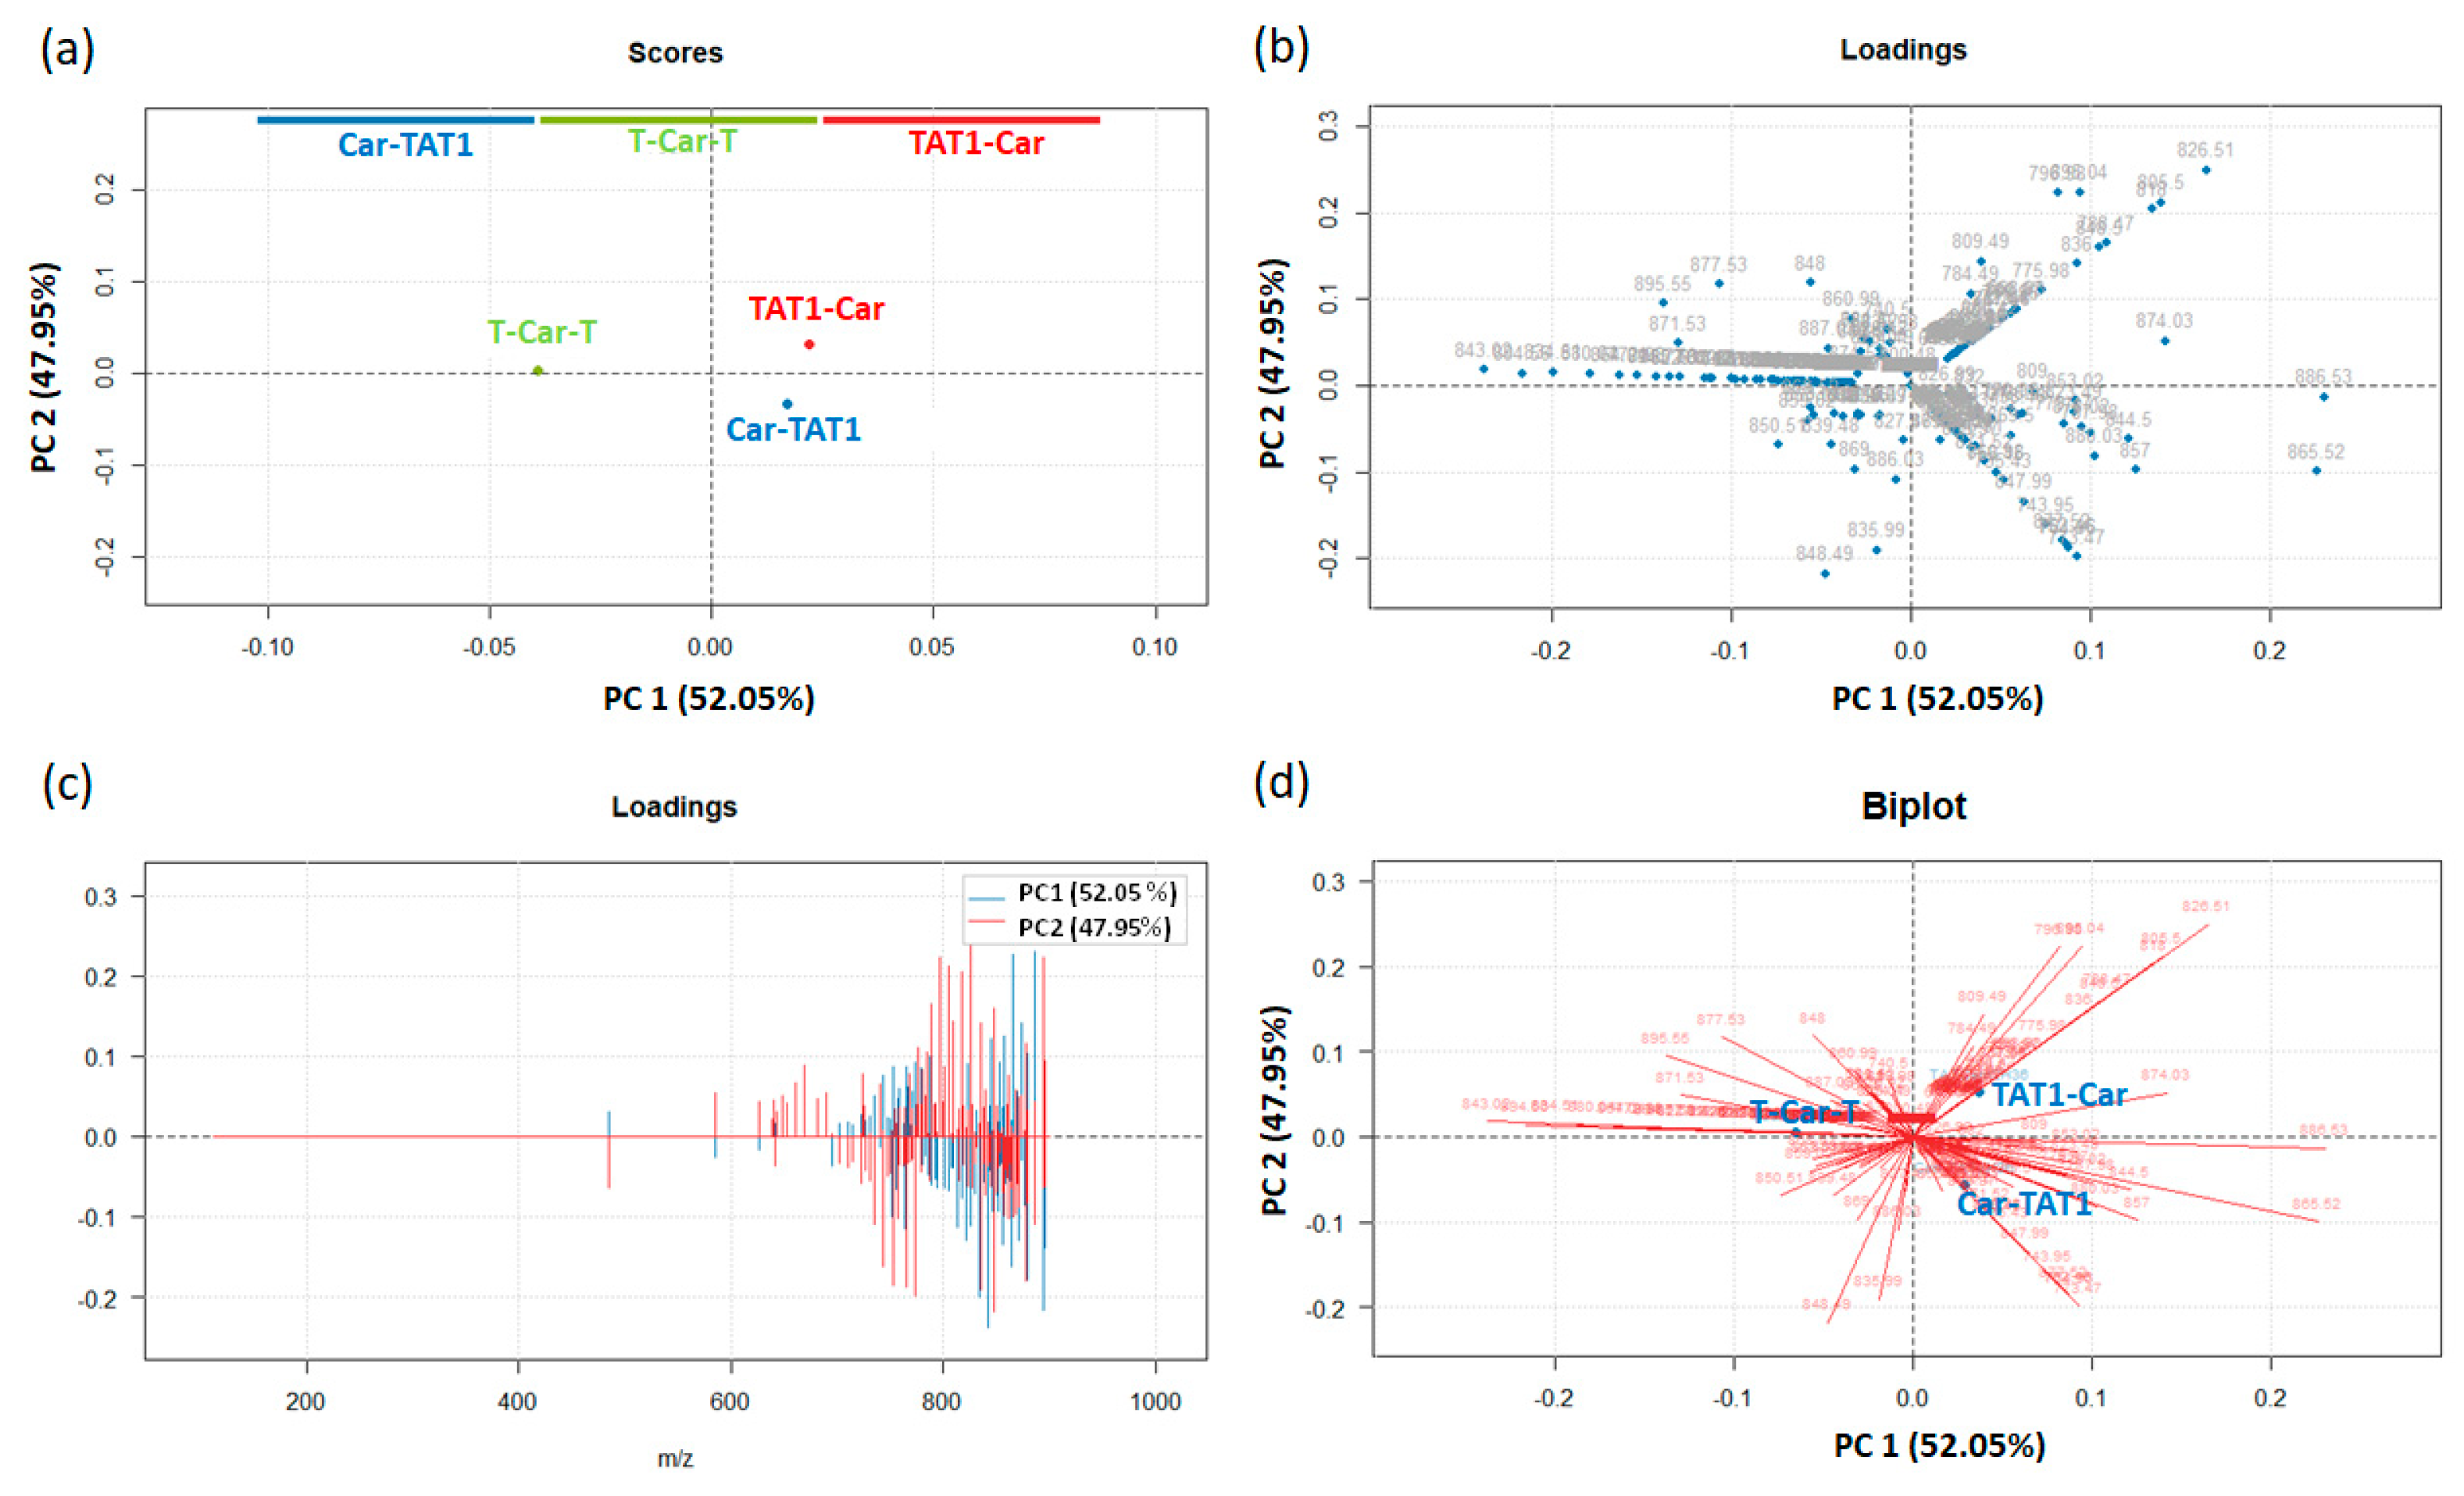
Figure 7.
Breakdown curves of the doubly protonated isomeric peptides: Car-TAT1 (blue), TAT1-Car (red), and T-Car-T (green), corresponding to the key fragment ions peak identified as the most significant loadings in the biplot. The high-resolution MS/MS spectra were acquired at acceleration voltages ranging from 20 V to 42 V.
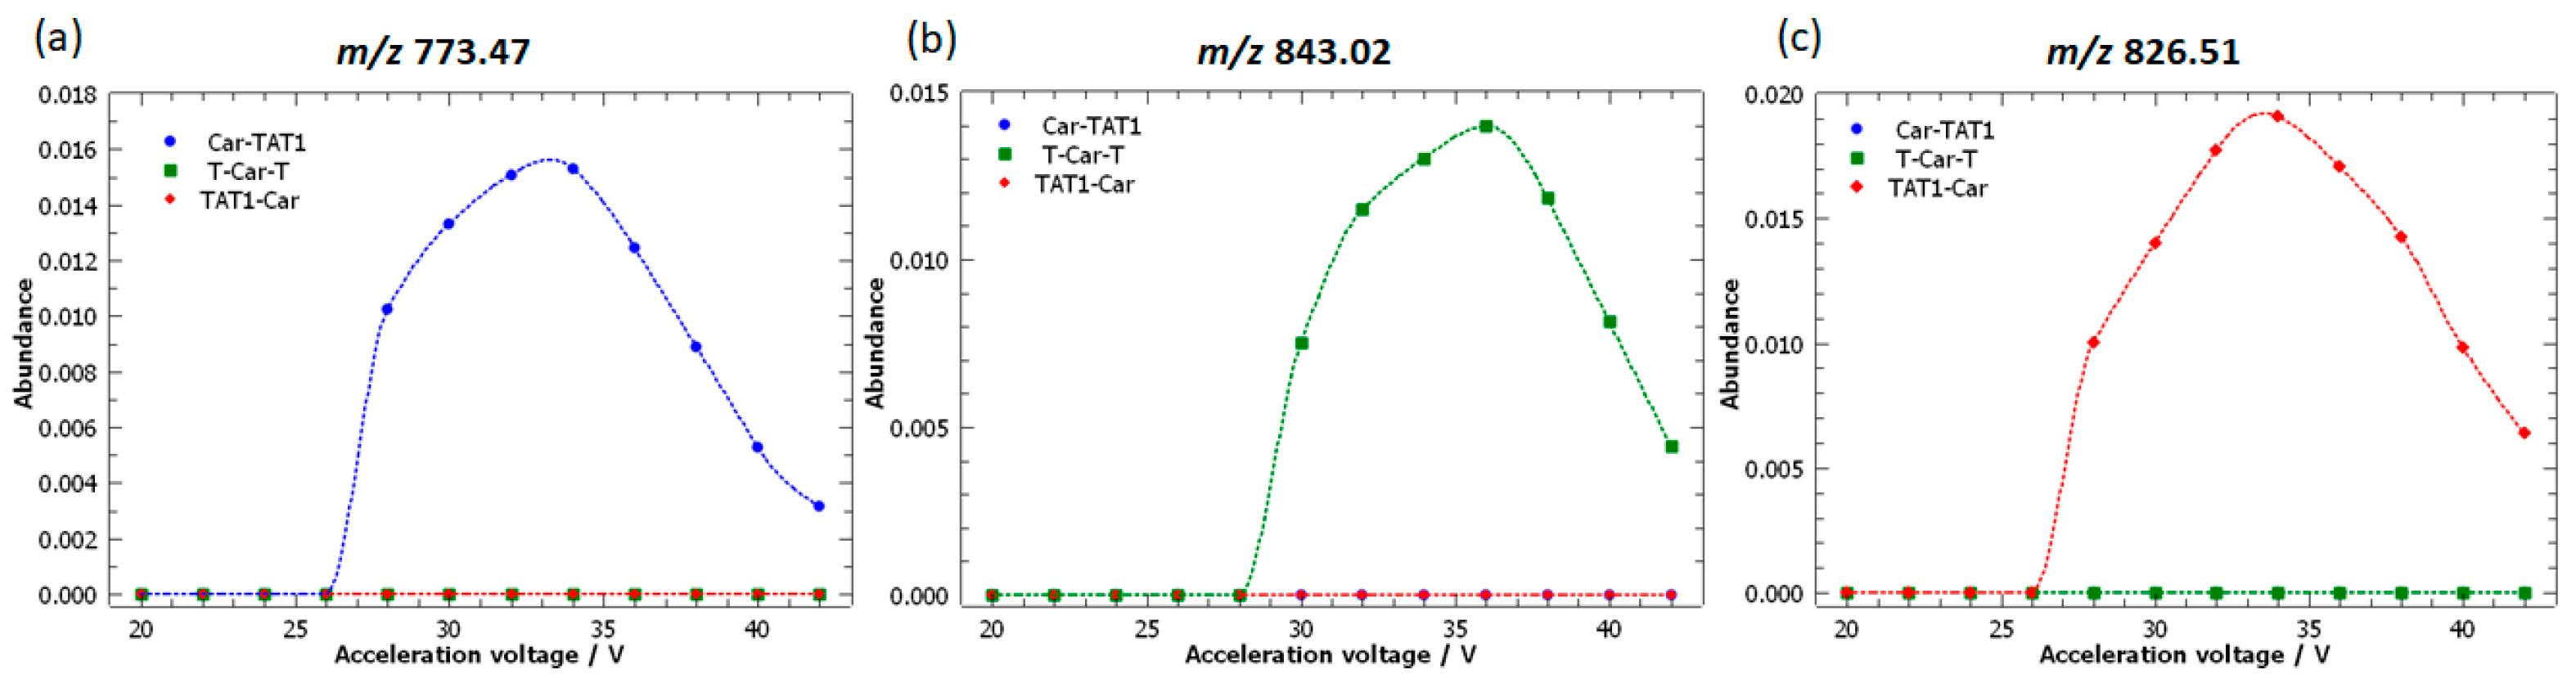
Figure 8.
Principal Component Analysis (PCA) performed on the high-resolution MS/MS spectra of T-Car-T, TAT1-Car, and Car-TAT1 in the reduced m/z range of 600–800. (a) Score plot of the first two principal components, with PC1 explaining 89.97% of the variance and PC2 explaining 10.03%. (b) Loading plot of PC1 versus PC2. Each blue point represents the loading of a mass peak (m/z), with PC1 shown on the x-axis and PC2 on the y-axis. (c) Loadings line plot. Each line represents the loading of a specific m/z for PC1 (blue) and PC2 (red). High positive or negative loadings indicate the m/z variables that contribute most significantly. (d) PCA biplot with PC1 and PC2 as the axes. Blue points represent individual peptides, while red arrows denote the loadings of the mass peaks (m/z).
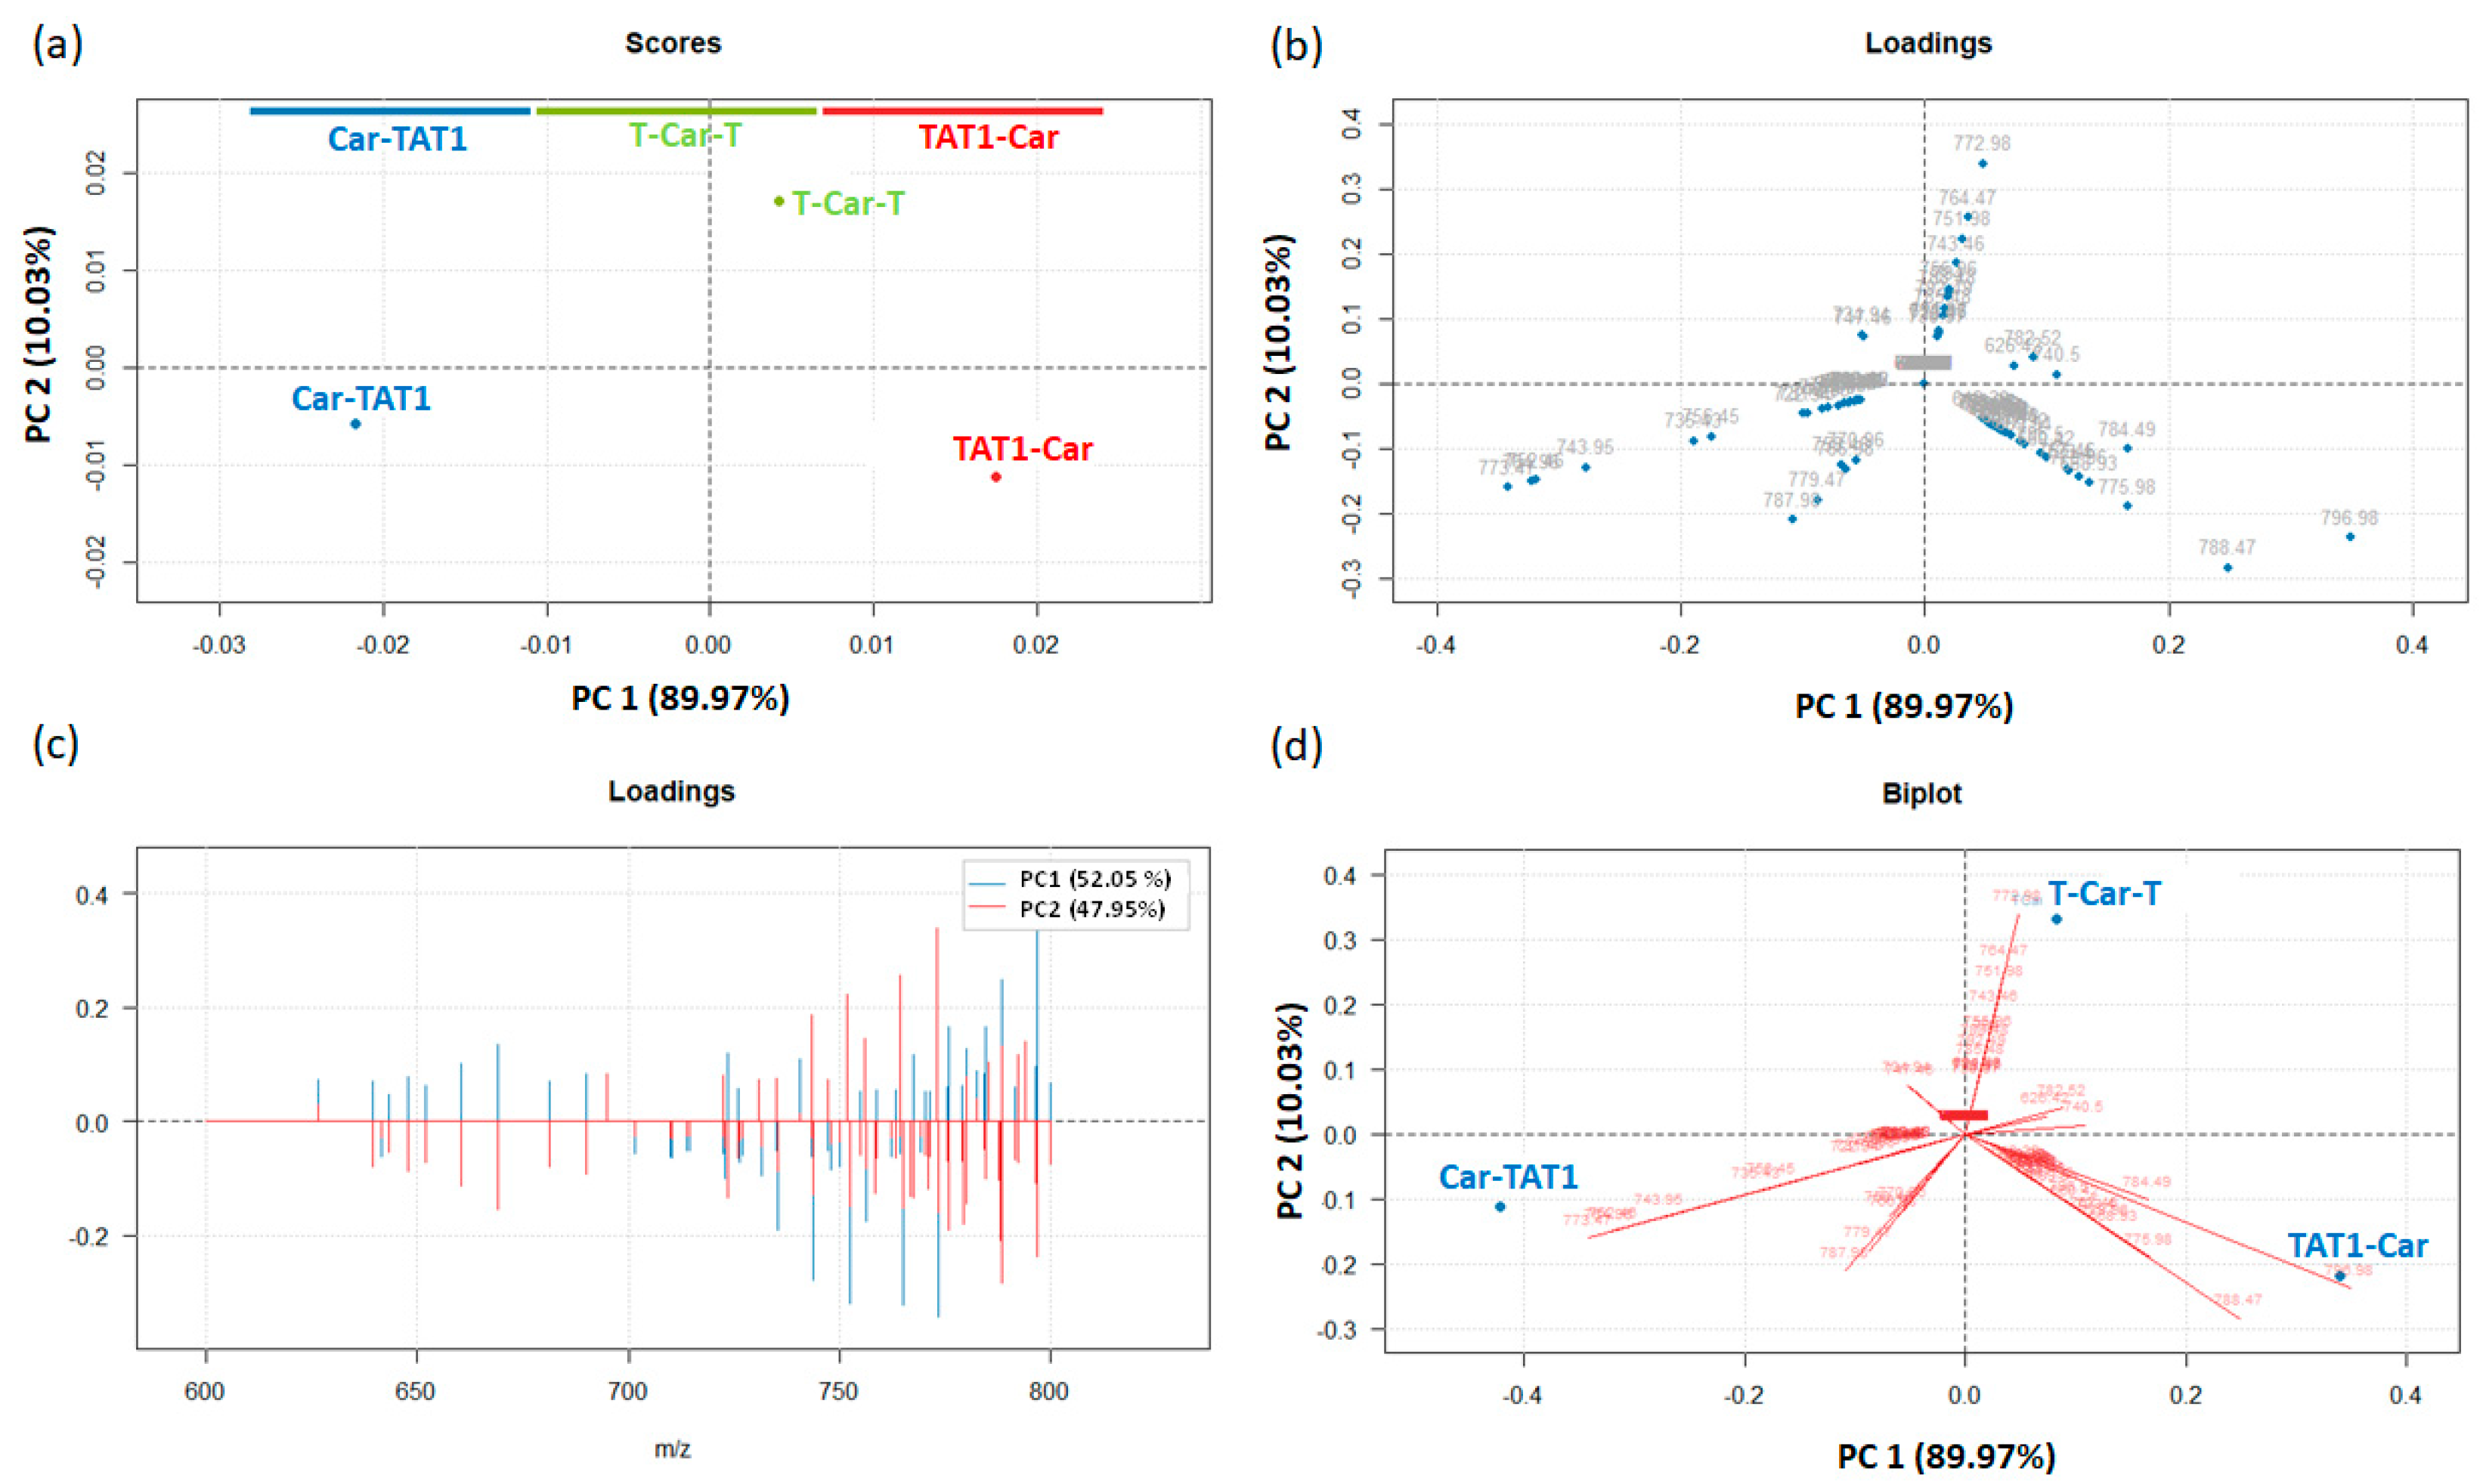
Figure 9.
Breakdown curves of the doubly protonated isomeric peptides: Car-TAT1 (blue), TAT1-Car (red), and T-Car-T (green). The curves correspond to fragment ions identified as characteristic of Car-TAT1 based on the loadings in the biplot. High-resolution MS/MS spectra were acquired at acceleration voltages ranging from 20 V to 42 V.
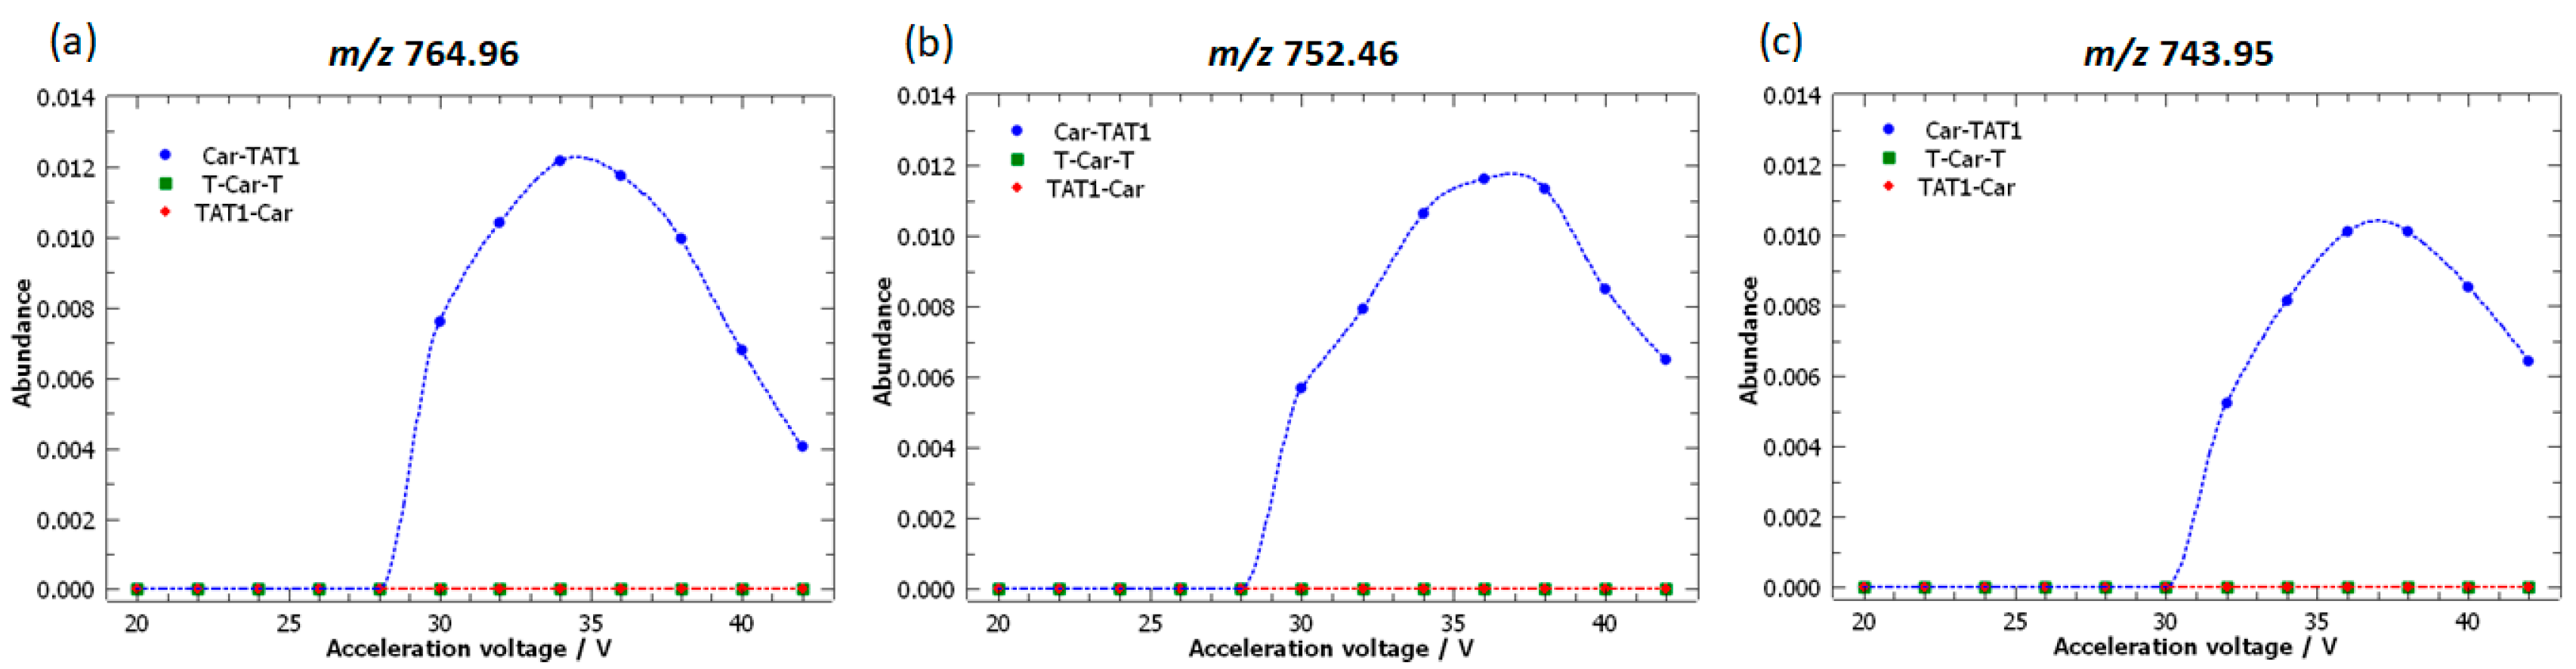
Figure 10.
(a) Conventional fragmentation of Car-TAT1 resulting in the complementary fragment ions [b2]+ and [y12]2+. (b) Extract from the high-resolution MS/MS spectrum corresponding to the ion [b2]+. (c) Extract from the high-resolution MS/MS spectrum of the Car-TAT1 peptide, covering the m/z range from 700 to 800. Ions derived from consecutive neutral losses of [y12]2+ are highlighted, although [y12]2+ is hardly detected.
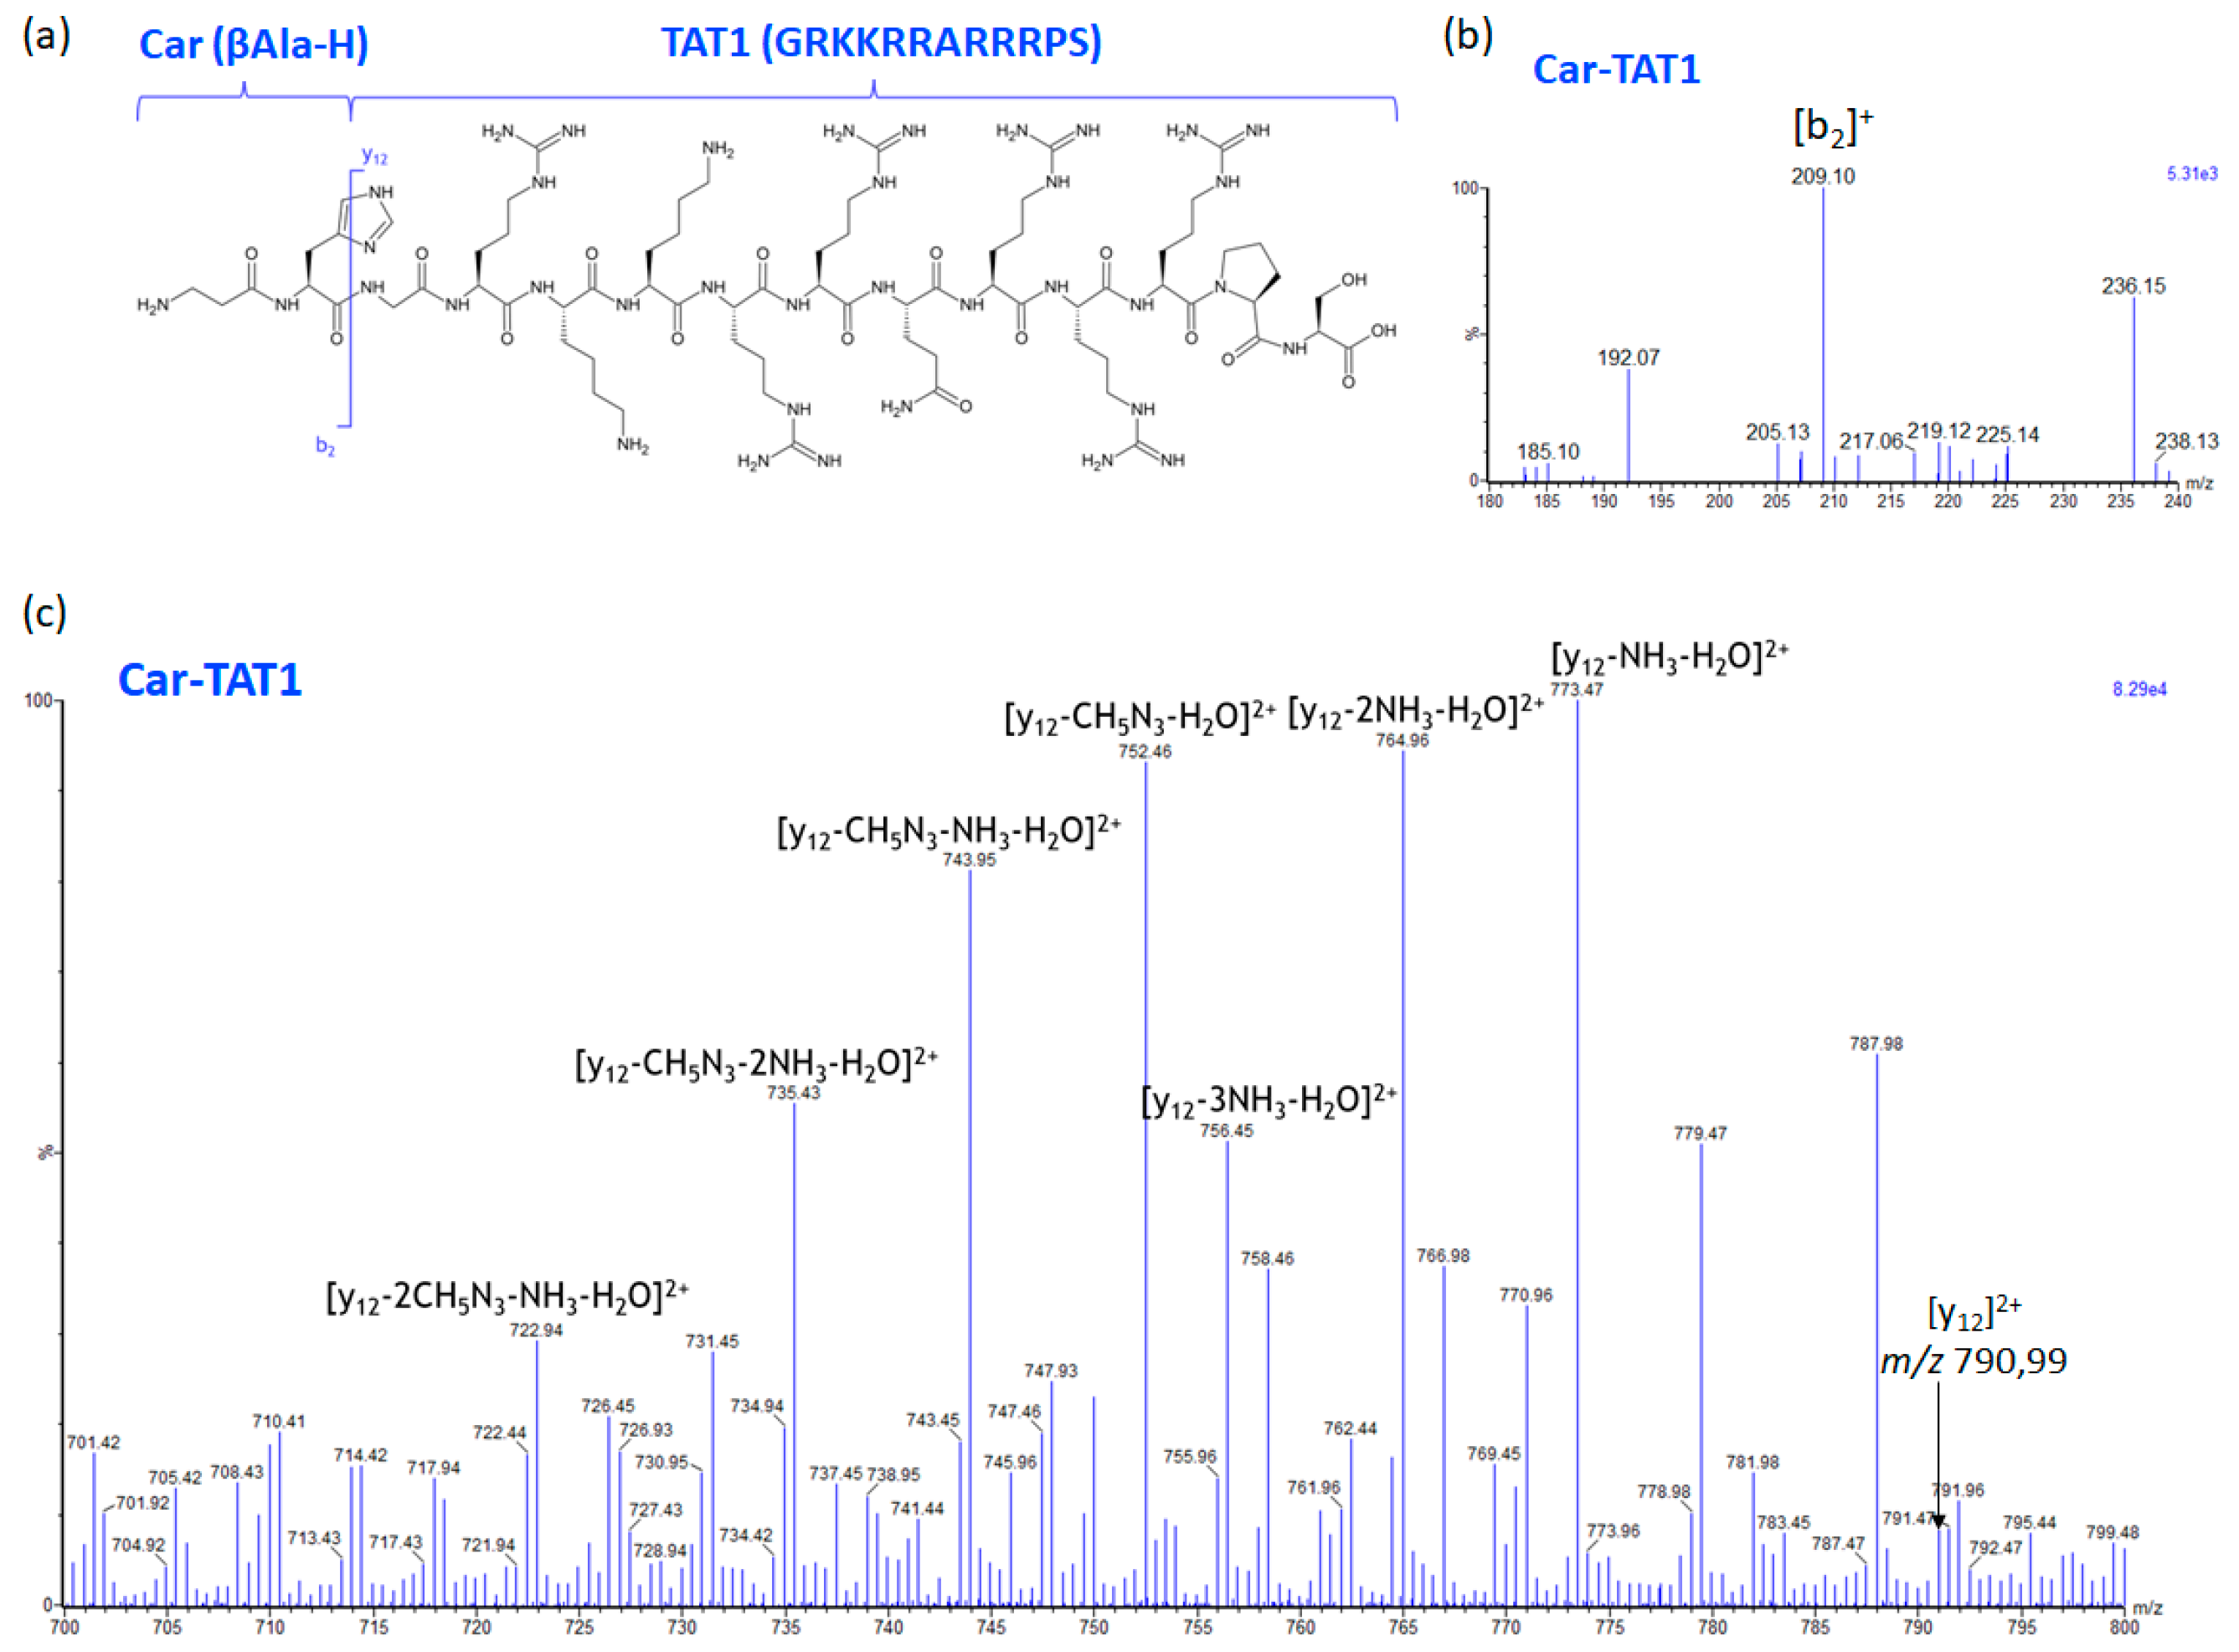
Figure 11.
Breakdown curves of the doubly protonated isomeric peptides: Car-TAT1 (blue), TAT1-Car (red), and T-Car-T (green). The curves correspond to fragment ions identified as characteristic of T-Car-T based on the loadings in the biplot. High-resolution MS/MS spectra were acquired at acceleration voltages ranging from 20 V to 42 V.
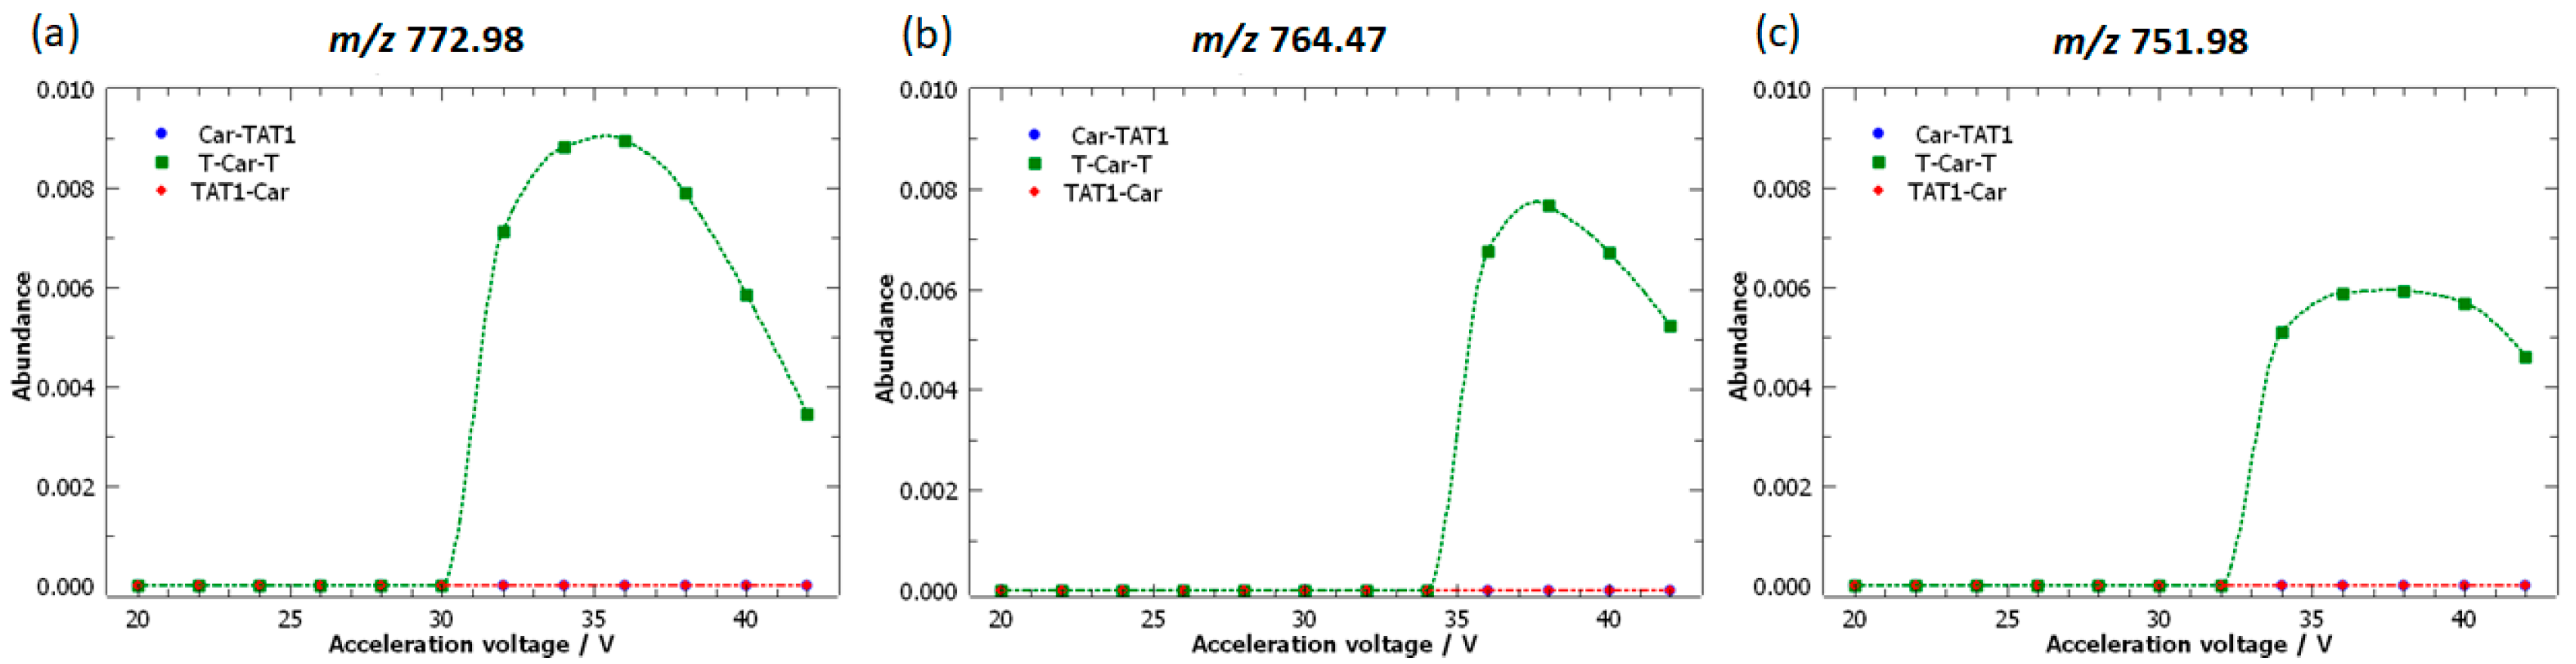
Figure 12.
Extract from the high-resolution MS/MS spectrum of the T-Car-T peptide, covering the m/z range from 550 to 800. Ions derived from scrambling and consecutive neutral losses are highlighted.
Figure 12.
Extract from the high-resolution MS/MS spectrum of the T-Car-T peptide, covering the m/z range from 550 to 800. Ions derived from scrambling and consecutive neutral losses are highlighted.
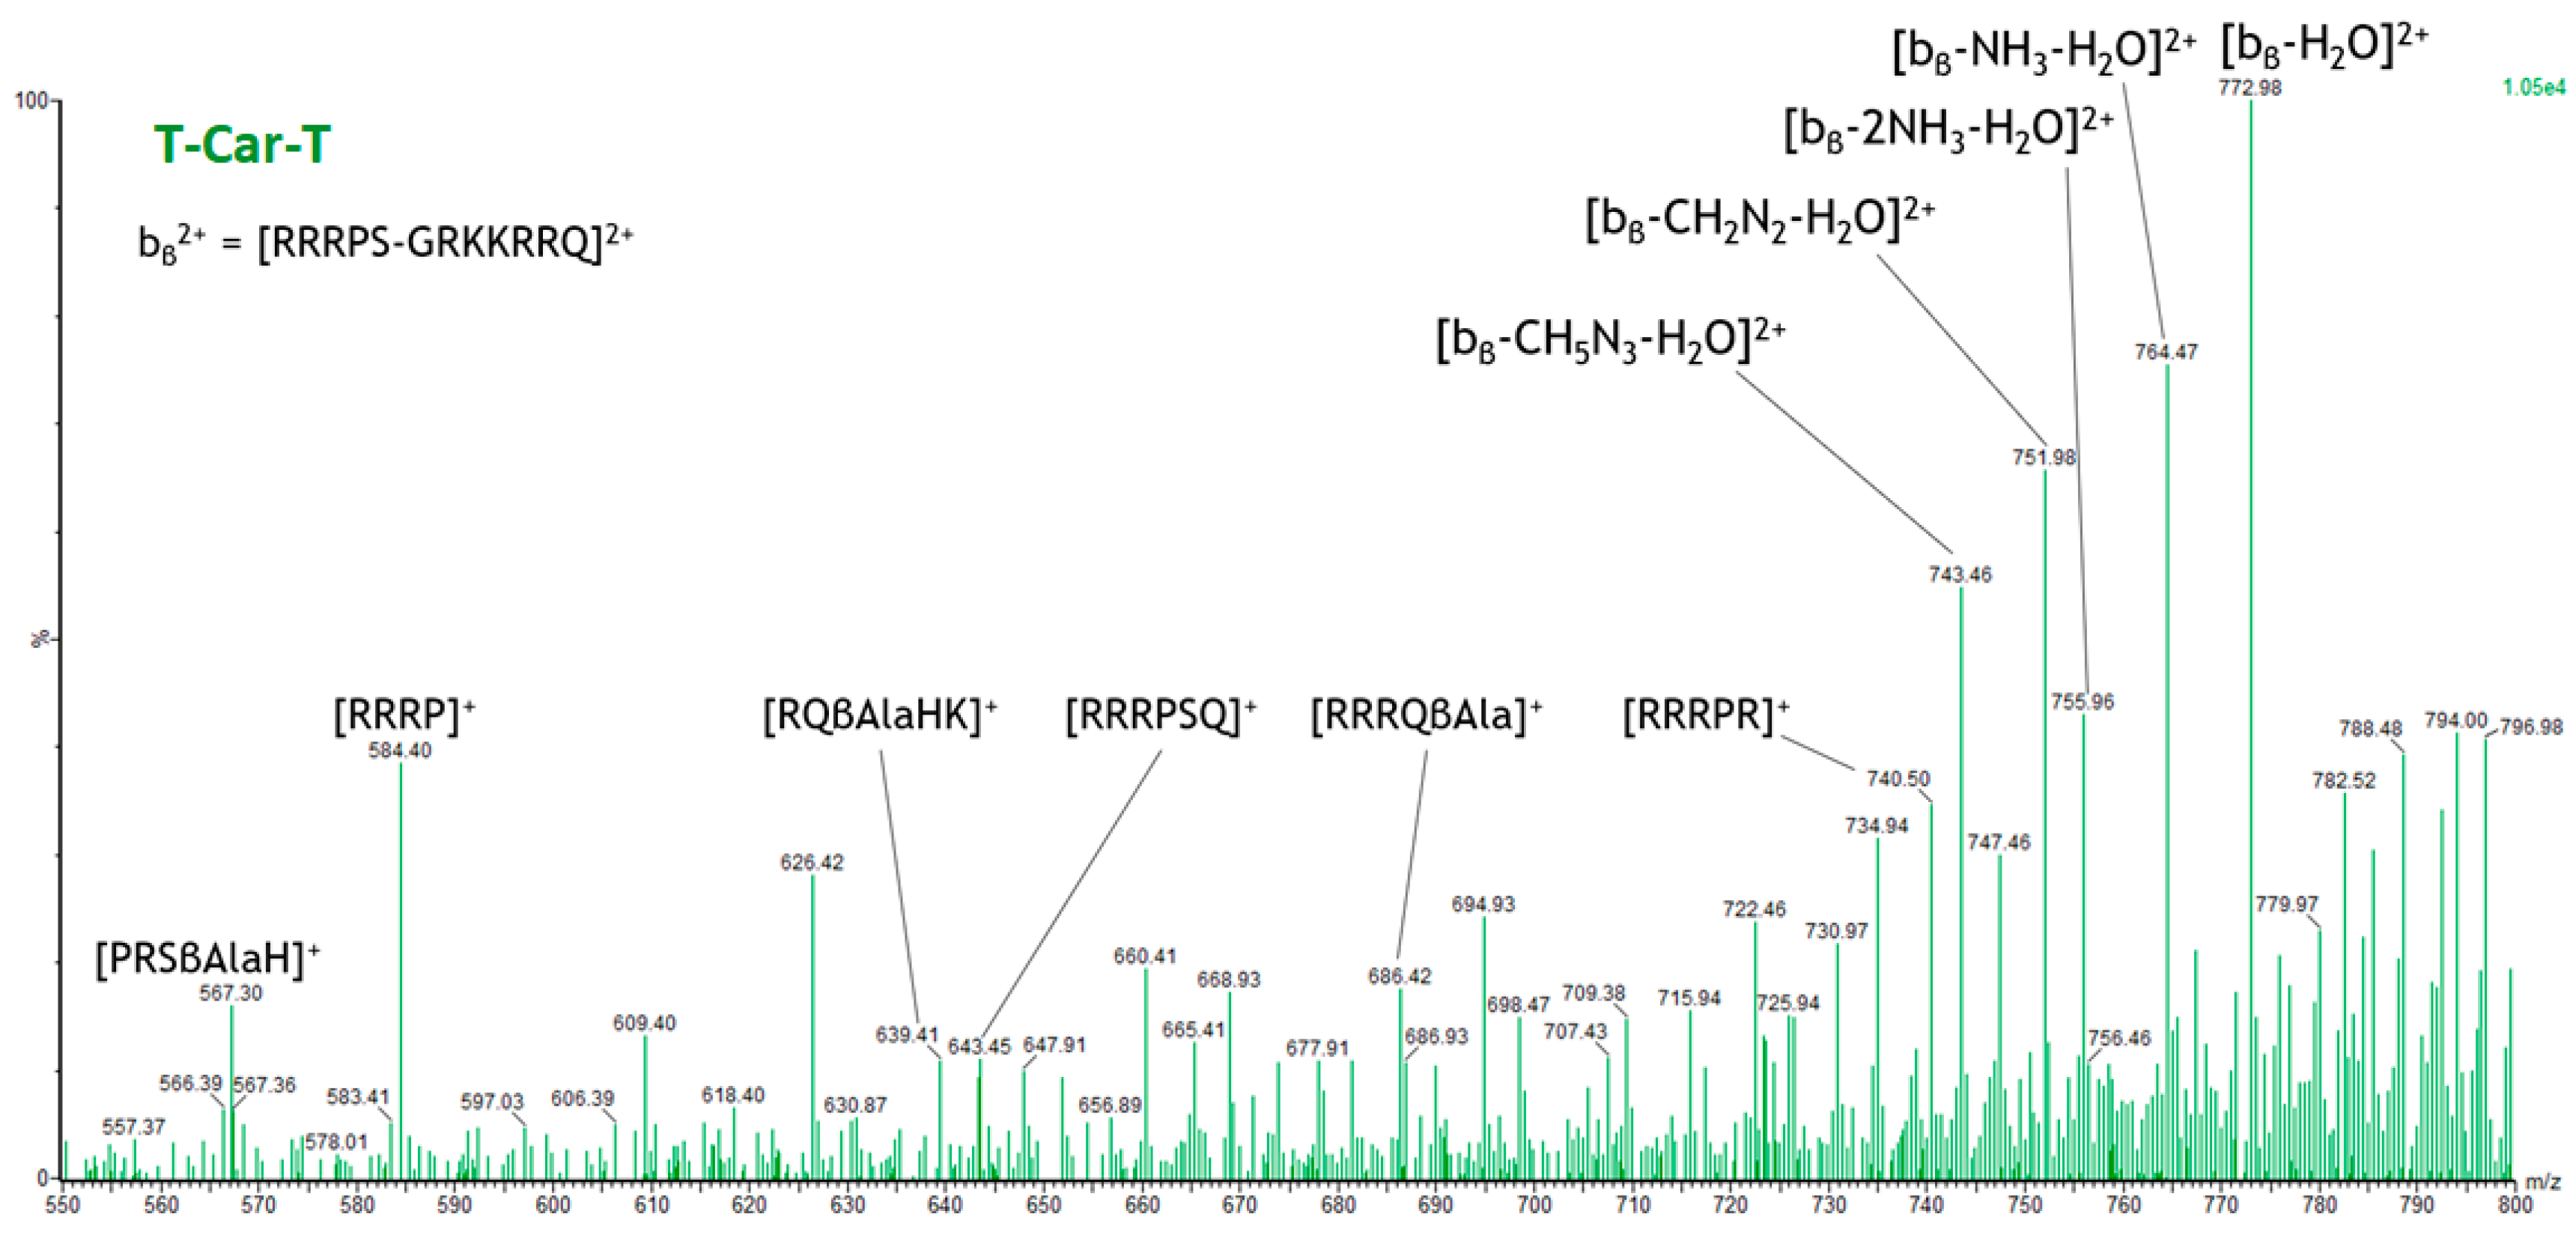
Figure 13.
Breakdown curves of the doubly protonated isomeric peptides: Car-TAT1 (blue), TAT1-Car (red), and T-Car-T (green). The curves correspond to fragment ions identified as characteristic of TAT1-Car based on the loadings in the biplot. High-resolution MS/MS spectra were acquired at acceleration voltages ranging from 20 V to 42 V.
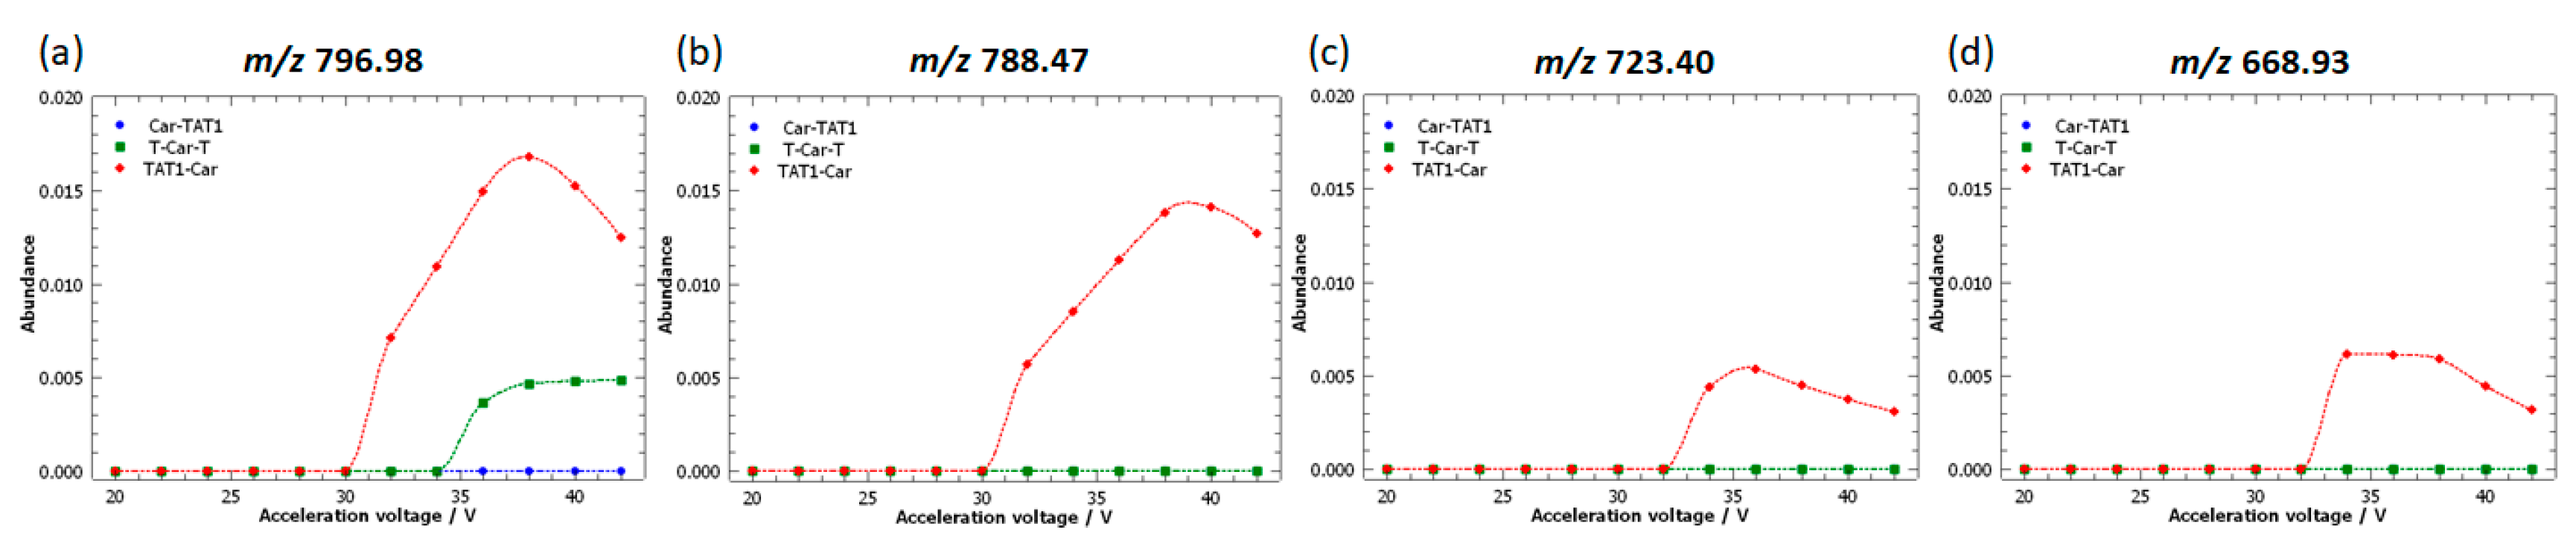
Figure 14.
Extract from the high-resolution MS/MS spectrum of the TAT1-Car peptide, covering the m/z range from 360 to 800. Ions derived from conventional fragmentation are highlighted.
Figure 14.
Extract from the high-resolution MS/MS spectrum of the TAT1-Car peptide, covering the m/z range from 360 to 800. Ions derived from conventional fragmentation are highlighted.
Disclaimer/Publisher’s Note: The statements, opinions and data contained in all publications are solely those of the individual author(s) and contributor(s) and not of MDPI and/or the editor(s). MDPI and/or the editor(s) disclaim responsibility for any injury to people or property resulting from any ideas, methods, instructions or products referred to in the content. |
© 2024 by the authors. Licensee MDPI, Basel, Switzerland. This article is an open access article distributed under the terms and conditions of the Creative Commons Attribution (CC BY) license (http://creativecommons.org/licenses/by/4.0/).
Copyright: This open access article is published under a Creative Commons CC BY 4.0 license, which permit the free download, distribution, and reuse, provided that the author and preprint are cited in any reuse.


