1. Introduction
For safe navigation through our environment, the human ability to perceive auditory cues is essential, especially in situations where potential collisions with objects, such as vehicles, must be avoided. For instance, pedestrians rely on their sense of hearing to detect approaching vehicles, particularly when the road and traffic is not clearly visible. This reliance on auditory information becomes even more important for visually impaired persons and also in the context of electric-car development [
1]. Those more and more unconventional sounds represent unique challenges to the pedestrian safety. Conducting safety-relevant studies in a naturalistic setting would cause safety risks, and field experiments lead to more costs. On top of that, it is not possible to easily control parameters, like vehicle types or environmental conditions. For these reasons, many traffic studies were transferred to complex virtual reality laboratories.
Previous studies have focused on participant detection times [
2] and time-to-collision (TTC) estimates [
3,
4,
5] for different driving conditions, such as accelerating and constant speeds, vehicle types and TTCs. The TTC is the time remaining until an approaching vehicle arrives at the listener's position [
4]. Stereophony as a possible playback method is widely used and established, because of the easy setup in audio production [
6]. The disadvantages are, e.g., the limited spatial listening area (sweet spot) and the localization blur. To allow a more complex reproduction, loudspeaker arrays with different sound synthesis techniques, such as Wave Field Synthesis (WFS) and Higher Order Ambisonics (HOA) can be used. [
7].
Both playback systems were seen as distinct sound spatialization methods, but recent insights [
8] suggest that these audio rendering approaches are related in some characteristics. They rely on loudspeaker arrays aiming to physically recreate the primary sound field and offer exact solutions to the sound wave equation. However, the different reproduction techniques (spherical harmonic expansion for the HOA; Kirchhoff-Helmholtz Integral for the WFS) also lead to a several differences. The frequency above which spatial aliasing occurs, a key issue in sound field encoding, is calculated with the speed of sound
and the spacing between the speakers.
Especially in WFS, spatial aliasing can occur if the wavelengths of the sampled waves are smaller than the speaker spacing. Above this cut-off frequency, inaccuracies may occur in the audio reproduction. As a result, certain spatial details may be misrepresented or lost during the encoding process, leading to spatial aliasing. WFS systems aims to reproduce the sound accurately over the entire listening area within the array, at least until the aliasing frequency. In contrast, HOA systems use spherical harmonic functions to encode the sound field, which allows for a more accurate representation of spatial information, also in higher frequency ranges. Due to the reliance on spherical harmonics, there is a limited area where the sound field is reproduced spatially correct, especially in higher frequencies. The listener has to be located in the center of the loudspeaker array.
Several studies investigated subjective differences and highlighted the importance of further studies on the perception of both audio rendering approaches [
9,
10]. Rozenn et al. [
11] highlighted the existence of perceptual differences between the playback setups and real-world environments. Therefore, it is essential to comprehend how participants perceive the sounds of these different setups.
Furthermore, Singh et al. [
12] compared auditory perception of real vehicles versus vehicles simulated in a virtual reality environment. The participants were first exposed to the vehicles in a real-world setting and completed a paper-based questionnaire wherein they evaluated various attributes. These subjective attributes were categorized as “detection distance”, “recognizability”, “detectability” and general impressions of the vehicle sound. Two months after the experiment in the real environment, the participants experienced the same driving-by-stimuli, but now in a simulated scene in the laboratory. The audio simulation used vector-based amplitude panning (VBAP) to reproduce the vehicle sound over eight speakers. They again completed the same questionnaire, rating the various sound attributes. The participants evaluated the VR sounds similar to the real-world scenarios, but they tended to recognize the EV later in the laboratory.
As other studies [
13,
14] have demonstrated, using a number of different sound stimuli and various playback methods (e.g., via headphones or a variety of loudspeaker array dimensions, including 1D, 2D, and 3D), the perception of sound differs between playback methods. It was highlighted that, especially in a spatial context, these differences were particularly pronounced, but differences also occurred in terms of coloration and timbre, e.g., the sounds in the 3D configuration were perceived as more muffled. In addition to assessing timbral attributes of artificial sounds such as noise and speech, the perceived localisation blur was also evaluated by listeners in the investigations of Wierstorf [
15]. Kaplanis et al. [
16] underline the importance of the room treatment, in sound reproduction environments. Even with subtle differences according the reverberation time, the timbral and spatial perceptions of the participants were influenced. As such, we also investigate room-related attributes in this paper.
To ensure similar results when conducting safety-relevant experiments in different playback environments, such as a HOA-VBAP setting and a modern WFS system with a small speaker spacing, the vehicle scenes should be perceived similar. Therefore, it is important to evaluate the playback quality of certain 3D audio rendering systems. Daniel et al. [
8] compared those approaches on a mathematical and numerical basis, they suggest more work towards psychoacoustical values and subjective perceptions. In a first step, the investigations concentrated mainly on physical and psychoacoustic values to get an overview over similarities and differences. The first question that we address: Do the different playback systems reproduce the sounds similarly or are there differences in physical and psychoacoustic parameters? We selected several relevant psychoacoustic parameters, which were calculated from recordings made of the three simulation-methods based on hearing models. In a next step, it is crucial to figure out, whether the actual perception in the different laboratories differ. To understand the perceptual behavior of subjects in the playback environments, a listening test was conducted. Attributes out of different perceptual dimensions were chosen. Loudness-, timbre- and room-related ones were taken from studies and regulations such as [
17,
18]. Besides that, also parameters that influence safety-relevant decisions when crossing a street were taken into account. As other studies already revealed, speed estimations of pedestrians are connected to street crossing decisions and deliver relevant information [
19,
20]. As already explained before, the ideal playback environments should present the driving-by-scenes without affecting the perception. We expected that there would be no significant differences between (1) the psychoacoustic and physical values of the recorded scenes in the different playback environments and (2) the perception of chosen perceptual attributes. This study offers a more comprehensive understanding of the effectiveness of these advanced audio playback systems.
2. Methodology
To obtain subjective evaluations from participants, a listening test was conducted. This involved simulating driving scenes in laboratories using a record-based simulation approach. To prepare stimuli for the listening test, driving-by-scenes were recorded in two simulation environments, utilizing a dummy head setup (details below). The binaural audio recording allows a realistic playback in later listening experiments. In order to create an experimental setup allowing to compare different laboratories, headphones were used.
2.1. Laboratories
2.1.1. Wave Field Synthesis (WFS) at TUD Dresden University of Technology
Perceived sound not only activates our sensation, it also acts as a carrier of environmental information. Virtual reality technology offers real-time interaction with computer-generated environments, facilitating flexible and cost-effective presentation of complex experimental scenarios. The Multi Modal Measurement Laboratory of TUD Dresden University of Technology [
21] spans 24 square meters, characterized by a rectangular shape with walls inclined by 3° to minimize fluttering echo. Acoustical treatments aligned with standards such as ITU-R BS1116.1 and DIN 15996 [
22,
23] attached to the walls and ceiling. Perforated metal sheets, covering 20% of the area, along with strategically placed Helmholtz resonators in the corners, providing a calculated acoustically treatment over a wide frequency range. For audio reproduction, a WFS system from IOSONO was installed. The setup comprises 464 loudspeakers and 4 subwoofers, with each loudspeaker panel housing 6 tweeters and 2 mid-range speakers. To combat the spatial aliasing effect, tweeters were placed with a distance of 6 cm between them, minimizing the aliasing frequency to approximately 3000 Hz, i.e., in the higher frequency range. Each loudspeaker is driven individually, so in total 468 separate channels are handled. The control unit oversees signal processing, communication with audio servers, and routing systems handling internal and external connections. Eight rendering PCs, executing the WFS algorithm in real-time, are housed in an acoustically isolated external server room, ensuring optimal performance. Calibration serves as a crucial step to ensure scenes are played back at their original level, reproducing real traffic conditions accurately. To calibrate the system, pink noise from 125 Hz to 8000 Hz with a sound pressure level (SPL) of 80 dB is used. This pink noise is projected from a specific point positioned eight meters in front of the listener and captured at the listener position using a free-field microphone (capsule type 4188; preamp type 2671, Brüel & Kjaer, Kopenhagen, Denmark). By comparing the recorded SPL with the calculated reference based on source distance and the principles of sound propagation, the level difference is identified. It facilitates adjustments made within the IOSONO control unit to align the overall reproduced volume with the calculated reference. To fine-tune the frequency spectrum of the system, an Equalizer App developed by Beyer et. al [
24] is utilized. This application allows for the creation of individual filters to balance sound characteristics, that could arise from room acoustics and treatments such as metal sheets. By selecting pink noise as a reference sound and analyzing both the original stimuli and recorded audio files, the filter magnitudes for each third octave band can manually be adjusted by visually comparing Fast Fourier Transform (FFT) representations. These filter coefficients are stored for subsequent use, ensuring the signal is appropriately filtered before playback via the WFS system.
2.1.2. Combination of Higher Order Ambisonics (HOA) and 3D VBAP at Johannes Gutenberg University Mainz
In Mainz, a combination of HOA [
7] and VBAP [
25] was used. The direct sound and the reflections from the ground surface and house fronts were rendered separately. For the direct sound, we used 15
th order 2D Ambisonics with
maxRe decoding [
26,
27] played back via 32 Genelec 8020 DPM loudspeakers arranged in a circle with 4.6 m diameter (spaced 11.25 degrees apart), that were positioned approximately at participants' ear height (speaker height 163 cm above the floor) and a subwoofer (Genelec 7360 APM; crossover frequency 62.5 Hz). To simulate the sound reflections from the ground surface and other acoustically reflective surfaces such as house fronts, we used 3D VBAP [
25] with the full loudspeaker array, containing both the aforementioned 32 loudspeakers at ear height and an additional lower ring of 8 Genelec 8020DPM speakers (spaced 45 degrees apart and angled towards the listener’s head; ring diameter 4.6 m, speaker height 87 cm above the floor) and the subwoofer. The array was driven by daisy-chained Ferrofish A32 Pro (24-bit audio resolution,
fs = 44.1 kHz) and Ferrofish Pulse 16 (24-bit audio resolution,
fs = 44.1 kHz) audio converters. The Ferrofish A32 Pro received audio signals via 64-channel MADI from an RME HDSPEe MADI audio interface on a computer running TASCAR under Linux. The 32 loudspeakers of the ear-height ring were driven by the Ferrofish A32 Pro. The 8 loudspeakers of the lower ring and the subwoofer were driven by the Ferrofish Pulse 16. For the present experiment, additional dummy head recordings were made in a configuration where both the direct and reflected sound was rendered on a subset of 16 equally spaced loudspeakers in the circular array at ear height. A similar 16-speakers setup had been used in earlier experiments in Mainz [
3,
4,
28,
29]
The loudspeaker array was located on one side of a large lab space (15.00 m × 7.05 m). To reduce interference from acoustic reflections, the laboratory area containing the loudspeaker array (8.44 m × 7.05 m) was sound-treated. It was separated from the other side of the lab space with sound-absorbing acoustic curtains (Gerriets Bühnenvelours Ascona 570; 570g/m²; absorption coefficient of 0.95 at frequencies above 400 Hz). A 20 cm thick layer of Basotect G+ (BASF; absorption coefficient of 0.95 at frequencies above 125 Hz) was attached to the walls and ceiling. To reduce reflections from the floor, a carpet (High-pile, IKEA Stoense) was placed inside the array, on top of a 7 mm layer of felt. In addition, 10 cm thick Basotect G+ panels (BASF; absorption coefficient of 0.95 at frequencies above 400 Hz) were added on top of the carpet.
The TASCAR Speaker Calibration Tool [
30] alongside a sound level meter (Nor131, Norsonic, Oelde, Germany) and a freefield microphone (MP40, Roga, Gotha, Germany), positioned at the center of the loudspeaker array at a height of 165 cm above the floor, was used for the calibration procedure. This ensured compensation for level and spectral differences between each loudspeaker and calibrated sound pressure levels for both point source and diffuse sound field scenarios.
2.2. Scene Creation
2.2.1. Sub Sources Recordings in a Real Environment
For the recording-based simulations, acoustic recordings were made on an asphalt test track at the Technical University of Darmstadt by Oberfeld et al. [
3]. These recordings were used in the experiment. Recordings had been made for two small Kia passenger cars: an Internal Combustion Engine Vehicle (ICEV) represented by a gasoline-powered Kia Rio 1.0 T-GDI (2019, 1.0 L, 88 kW, 3 cylinders) with manual transmission, equipped with Continental summer tires (ContiSportContact 5, 205/45 R17), and a Kia e-Niro (2019, 150 kW) Electric Vehicle (EV) with Michelin summer tires (Primacy 3, 215/55 R17) and an Acoustic Vehicle Alerting System (AVAS), active until speeds of 28 km/h. To capture tire-road noise and powertrain noise, four free field microphones (MI-17, Roga, Gotha, Germany) were mounted on both front tires, the right back tire, and centrally on the engine hood. A GPS antenna (Trimble AG25) was installed centrally on the vehicle’s roof and was connected to a high-performance GPS receiver (JAVAD Triumph LS, recording rate 10 Hz) inside the vehicle. Using the Real Time Kinematic (RTK) method, the GPS position of the vehicle on the test track was recorded with a precision of a few centimeters [
31]. The high precision of the method is achieved by evaluating the carrier phase of the satellite signals, processing signals from at least 5 satellites, and matching the data from the mobile receiver with data from a geostationary reference station. We used a reference station provided by the Hessian State Office for Land Management and Geoinformation within the framework of SAPOS-GPPS (
https://sapos.hvbg.hessen.de/), located at a distance to the test track of about 6 kilometers. A dummy head (4100D, Brüel & Kjaer, Kopenhagen, Denmark) was placed 0.5 meters beside the road- in a height of one meter to record the real driving by sounds in the real test track environment. Recordings from this dummy head corresponding to exactly the same pass-by trials as the source recordings used a input for the simulation systems were presented as an additional condition in this experiment.
2.2.2. Processing of the Scenes for the VR Approach
With the subsource recordings, it is possible to transfer traffic scenarios to a Virtual Environment (VE). The software TASCAR [
30] enables dynamic processing of the acoustic scene geometry, allowing for the placement of sound sources in a time-dependent manner. On each time step, TASCAR models the sound propagation between sources and receivers, and thus provides physically plausible simulations of various acoustic phenomena, including the directional characteristics of sound sources, distance-dependent changes in sound level due to spherical spreading and air absorption, and the time-varying sound travel time (which may induce Doppler effects). Moreover, TASCAR simulates sound reflections on surfaces such as the ground, utilizing the image sound source method [
32]. It models time-variant comb-filter effects resulting from acoustical interference between reflected and direct sound. Acoustical effects, focusing on test track reflections and effects detailed before, were configured in TASCAR. The recorded sound sources from the test track were positioned in the VE based on the distances between microphones in the real-world setting [
3]. At the JGU Mainz, TASCAR was used for the dynamic vehicle simulations and renderings.
At TUD, the IONSONO system cannot be controlled by TASCAR, necessitating the development of a MATLAB toolbox [
24]. This toolbox processes TASCAR scene definition files and, using the same calculations as TASCAR provided in [
30], runs the same vehicle simulations, but with an output that can be used by the IONSONO system.
Figure 1.
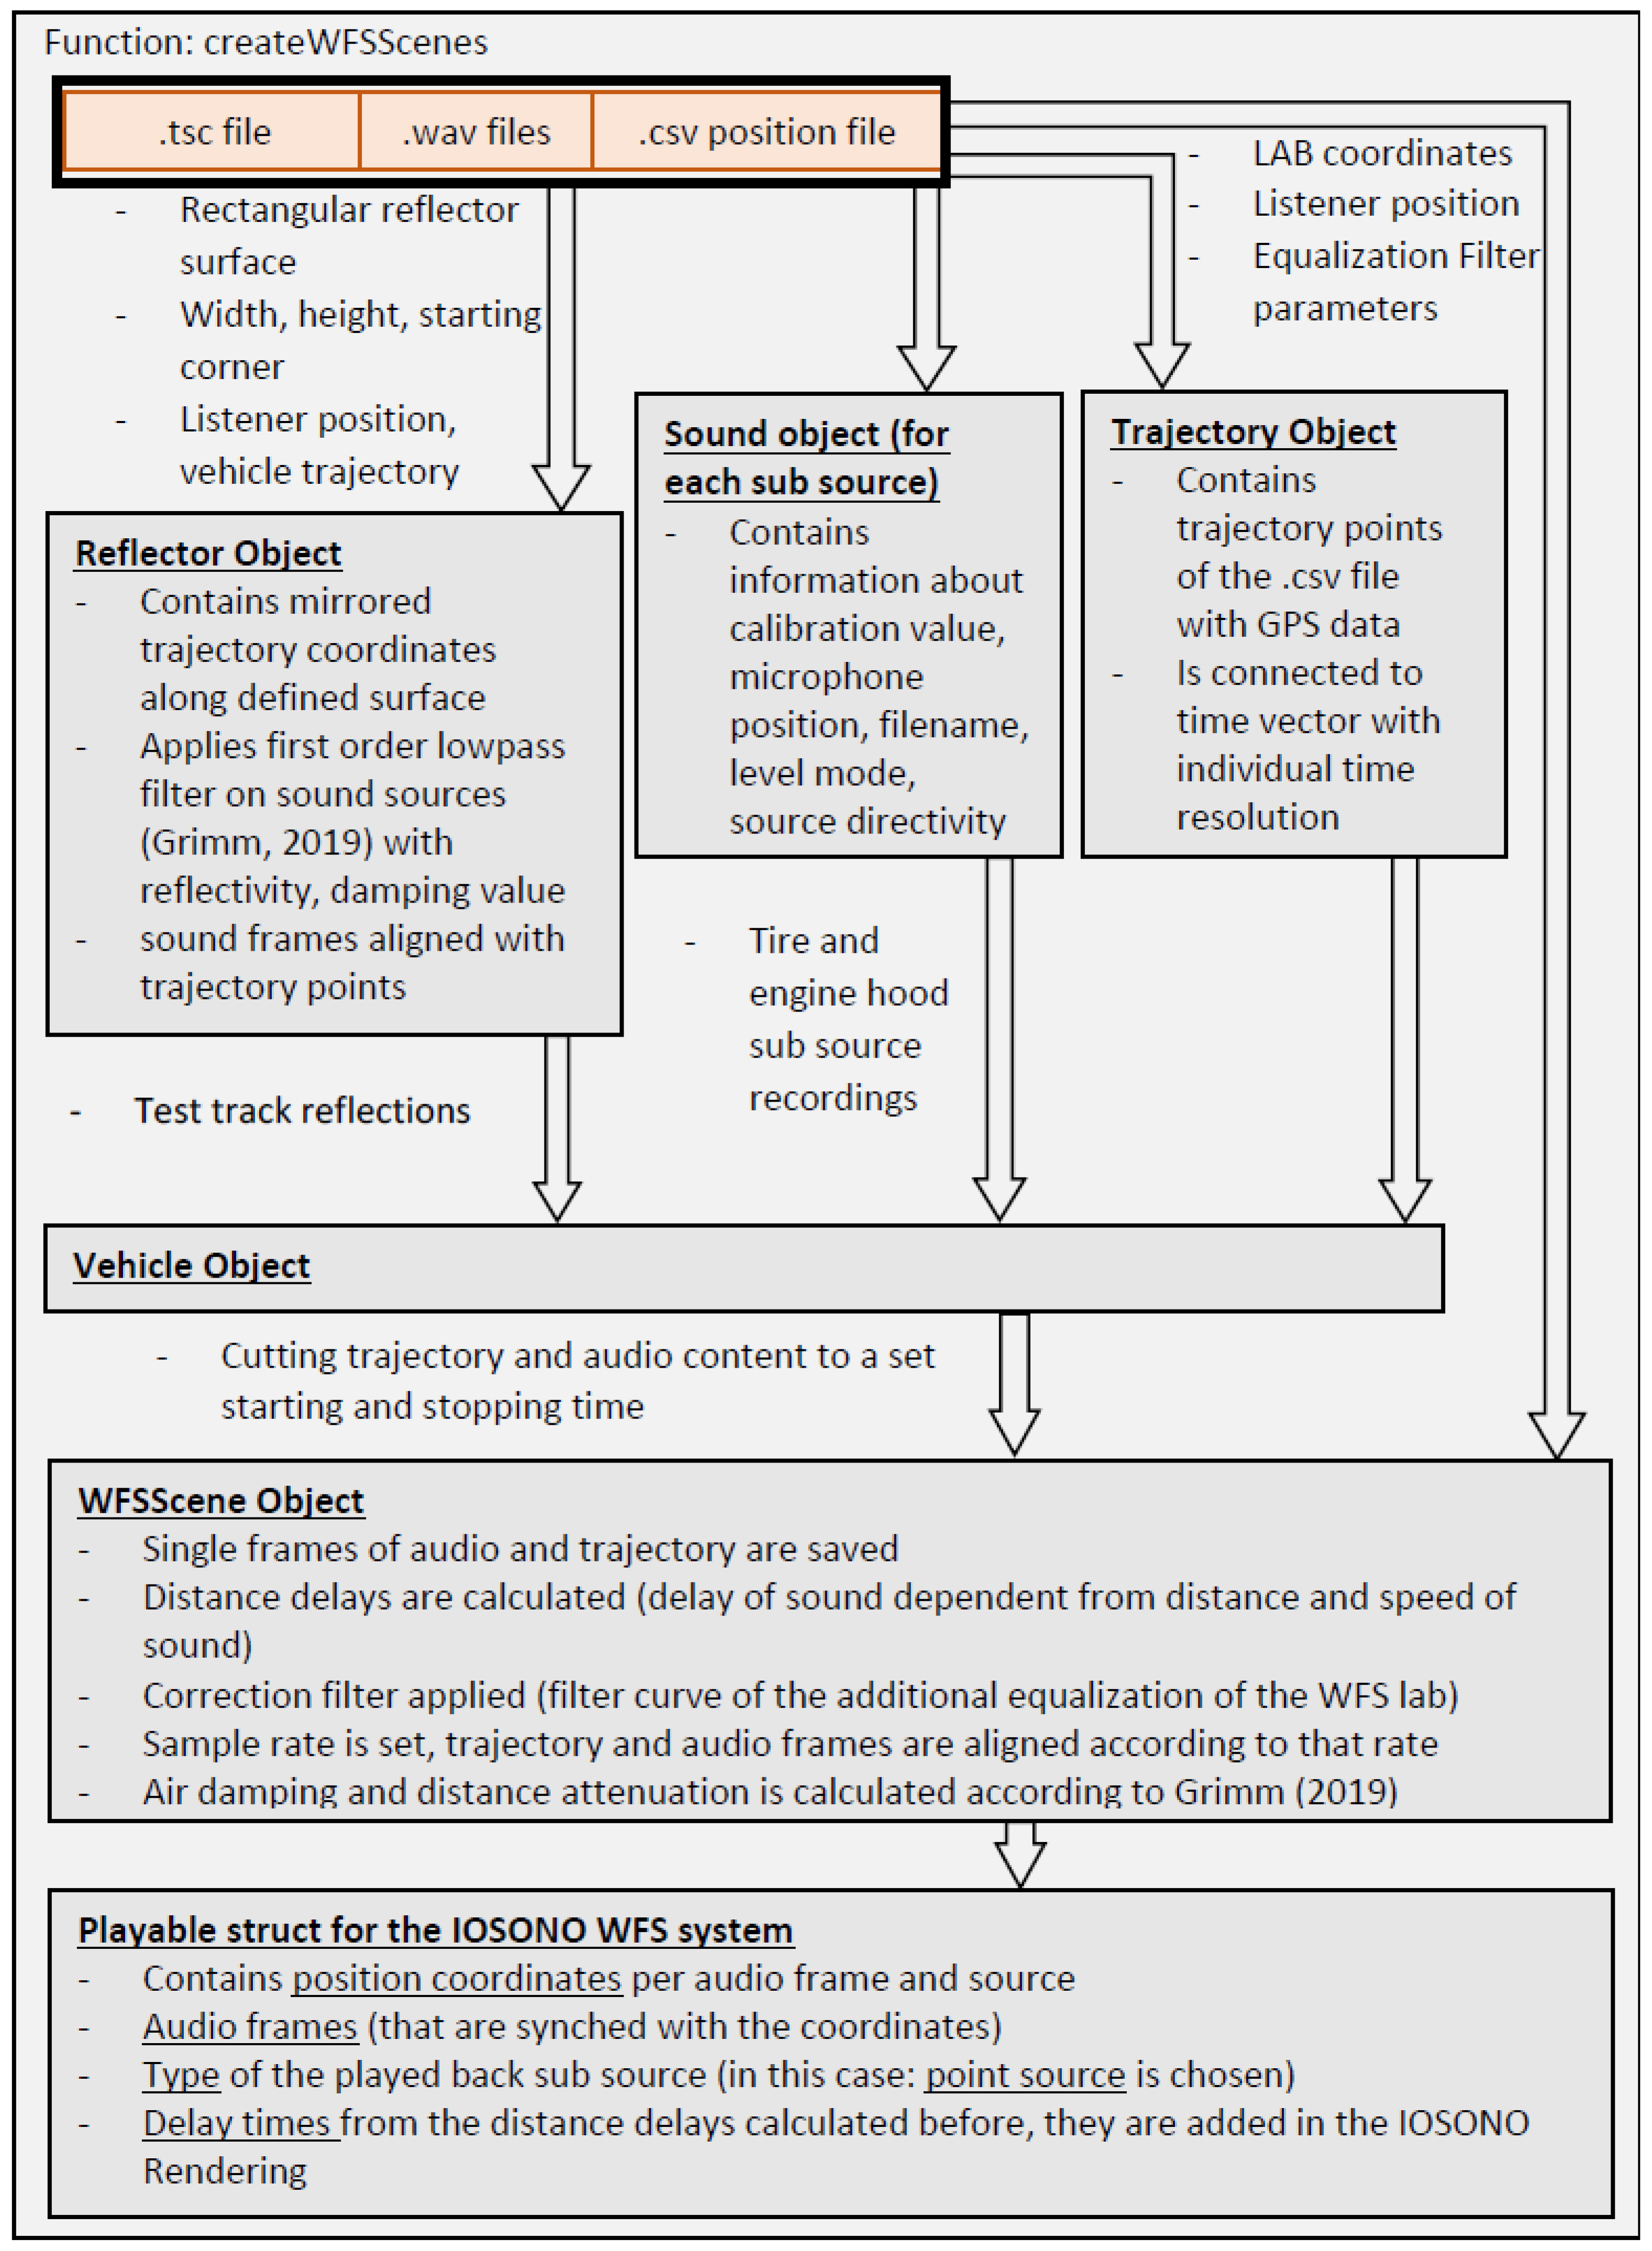
Schematic representation of the Matlab function for processing .tsc files into a playable file.
Figure 1.
Schematic representation of the Matlab function for processing .tsc files into a playable file.
For all vehicle recordings, the time series GPS and position data is stored in a .csv file, thereby capturing dynamic information about the position of the vehicle. Furthermore, four .wav files containing audio recordings of discrete sub-sources, in this case tire and engine hood sounds, are available in the same directory. Each sub-source of the .tsc file (special file format used for TASCAR) contains key parameters, such as calibration level, positional offset along the vehicle and microphone characteristics. In MATLAB, the wav-files for each sub-source were loaded and stored as discrete audio objects. Furthermore, parameters for environmental properties, such as reflections, were also configured, by mirroring the sub sources. Therefore, a rectangular reflector was defined with specific width, height, damping value, and reflectivity. In order to emulate realistic sound propagation, each sub-source was virtually mirrored across the reflective surface, and a first-order low-pass filter was applied to approximate acoustic reflection effects, in accordance with the methodology outlined by Grimm [
30]. Subsequently, GPS coordinates and time vectors from the .csv file were transferred into a structured MATLAB format, facilitating precise temporal alignment within the simulation. These elements, along with the combined sounds from the reflector and sub-sources, were compiled into a vehicle object. In the next phase, individual start and stop times were established, and trajectory and sound data were cutted accordingly. Following this, room-specific acoustic adjustments were simulated by applying a predefined room equalization filter curve of the WFS laboratory, as described earlier. Calculations were also performed to determine distance delays for each sub-source sound, considering the exact spatial distance between each source and the listener, with the total distance computed as the vector sum of longitudinal and diagonal components. Finally, to model air damping, equations from Grimm [
30] were applied to the audio signal, simulating natural attenuation over distance. The processed audio frames, each connected with their exact trajectory coordinates, were stored in a MATLAB struct, preparing them for playback on the IOSONO system at TUD, which facilitated the spatialized auditory experience of the simulation. The single sources were played back as point sources. In general, this toolbox allows for the adjustment of parameters for acoustic effects, position data and sound sources within vehicle scenes. Its functionality is orientated on that of TASCAR Toolbox.
2.3. Recording Setup in Laboratories
In the listening experiment, participants evaluated the quality of the various playback methods in a single experimental session, with recordings being played back via headphones. For this, recordings were made of the acoustic simulations of the driving scenes. Binaural recordings were made using a dummy head (HSU III.3, Head acoustics, Herzogenrath, Germany) equipped with a shoulder unit. It was positioned at the height of the loudspeaker arrays and with the shoulder unit aligned perpendicular to the course of the road in the virtual scene. The dummy head, characterized by two ICP condenser microphones and featuring an individual pinna design, was connected to the labHSU Interface of Head acoustics. This setup allowed for the application of various equalization curves to process the binaural signal, reducing effects such as reflections from the shoulder section. The resulting filtered signal can then be treated as a measurement signal for later analysis. Different equalization filter curves, including diffuse field (DF), free field (FF) and Independent of Direction (ID), are available. As the laboratories are not treated as anechoic chambers and do not represent free field conditions, the DF filter was employed. Recording signals are captured using the ArtemiS Suite. It is crucial to precisely determine when the vehicle passes by the reference point at the listener’s position. At the JGU Mainz, a sinus-type marker signal was recorded to indicate this moment through an impulse. At TUD the scenes were recorded in a simulated environment, with a 15-second interval before and five seconds after the reference point, and were then recorded one after another in a single total recording. Subsequently, the individual scenes were extracted from the recording, using time windows of 20 seconds. This process may have resulted in minor deviations. With this setup and editing techniques, the driving-by stimuli were recorded in both laboratories.
In addition to the recordings inside the speaker arrays made with the Head Acoustics dummy head, the experiment presented recordings of a virtual dummy head receiver that was rendered via TASCAR. It simulates a binaural recording, based on the Spherical Head Model (SHM). The head is modeled as a rigid sphere in this approach and includes effects, like head shadow or interaural time differences. The height of the receiver was set to one meter, to match the listener position of the test track placed dummy head. The listener is placed 0.5 meters beside the roadside with the shoulders placed vertical to the road direction. In this study, a reference point at the listener position will be relevant. The vehicle will pass that reference point, marked as a red line in
Figure 1. at the height of the listener.
2.4. Preparing Listening Test Scenes
For the following listening test, dummy head recordings were used. They represent the driving-by-scenes, that were played back of five different recording conditions: 1) dummy-head recordings made using the 41-channels HOA and VBAP rendering at JGU Mainz, 2) dummy-head recordings made using the reduced 16-speakers HOA rendering at JGU Mainz, 3) dummy-head recordings made using the Wave Field Synthesis environment at TUD, 4) virtual recordings made of a binaural receiver in TASCAR (i.e., purely virtual) and 5) the original dummy head recordings which were made on the test track using real vehicles. These original dummy head recordings were made synchronously with the microphone-on-chassis recordings that are used for the virtual vehicle renderings. During the recording process of the original recordings, various background noises, such as airplanes and loud bird calls, were present. Subsequently, only the scenes that seemed suitable, devoid of disruptive noises, were selected. Also, during most recordings there was a significant amount of wind, which likely affected the overall level of the vehicle sound arriving at the dummy head on the test track, but also might have induced level fluctuations due to changing wind speed or wind direction during an approach of the vehicle on the test track. Since the original recordings were made using a Brüel & Kjaer 4100D dummy head we applied a DF filter to account for differences between the B&K and the Head Acoustics dummy head. For the optimized parametric HRTF model, introduced from Schwark et al. [
33], a DF equalization was already applied.
Table 1 specifies the scene-parameters, that are present for all of the five playback systems.
A time window spanning 5 seconds before the car reaches the listener was set, as indicated by the red line in
Figure 1. The scenes were captured using the setup described above and edited using ArtemiS Suite. Following an analysis of the level diagrams of the recorded signals, it was observed that some differences in the reproduced SPL persisted despite system calibration. In light of the numerous studies that have explored the significance of maximum SPL in scene perception, the normalization process focused on the maximum level. To account for both perception and frequency-dependent hearing, A-weighted levels were employed, and the scenes were adjusted to maintain consistent maximum SPL(A) values. The mean values of the recorded scenes for each vehicle type and velocity were computed and a defined maximum value was established. This approach not only ensured uniformity but also guaranteed the reliability and accuracy of stimuli presentation, thereby enhancing the validity of subsequent analyses and the overall study findings.
2.5. Signal analysis
To provide a concrete example, a comparison of the adjusted scenes demonstrates the implications of aligning A-weighted levels. In the alignment process, the maximum mean level values of both dummy head ear recordings were matched across the different reproduced scenes. However, even with these adjustments, we observed variations of up to 5 dB in the quieter sections of the scenes.
Figure 2 shows all the A-weighted level of the two dummy head microphones for each played back vehicle scene.
The two different simulation toolboxes (TASCAR versus TUD Matlab toolbox), different recording setups in the laboratories and on the test track and the transfer functions of the three different binaural receivers may have led to differences of the levels that were reproduced. Furthermore, the different room treatments of the laboratories and the semi-free field condition on the test track play an important role. In addition, a significant proportion of the recordings on the test track were made at higher wind speeds, which likely caused relatively strong wind-related level fluctuations in the vehicle sound recorded by the dummy head on the test track. In contrast, due to the close proximity of the microphones attached to the vehicle’s chassis to the vehicle sound sources, these recordings were virtually unaffected by wind speed, and we excluded recordings by the microphones mounted on the vehicle that contained wind noise.
To get a first impression of the reproduction characteristics of the recorded scenes, defined psychoacoustical values were calculated, as visible in
Table 2.
For the analysis, sharpness was calculated according to Aures and loudness according ISO 532-1 [
34]. When comparing the max SPL and max A-weighted SPL, the varying SPL maximum value becomes evident. See, for instance, the variation in the SPL of the ICEV_10kmh scenes and the large difference between max SPL and max A-weighted SPL. This indicates that a) there is quite some low-frequency content in this scene (since A-weighting particularly reduces the level in this frequency range, resulting in large differences between SPL and A-weighted SPL) and b) the different playback methods differ in their ability to reproduce this low-frequency content (as visible from the differences in SPL). Additionally, sharpness values differ among the scenes. Sharpness arises from a high amount of high-frequency energy relative to the total. The highest sharpness values were provided by the test track recordings. When comparing the 41-channel HOA-VBAP and WFS systems, differences are apparent, with WFS exhibiting slightly higher sharpness values. Therefore, when comparing the 41-channel HOA-VBAP system with the WFS, it is evident that the WFS system tends to reproduce sound with a different high and low-frequency ratio. The loudness values are generally similar across the playback environments. Combined, these values highlight differences in audio reproduction across various playback systems and real-world recordings. The variations in sharpness and loudness suggest that laboratory simulations and real-world scenarios can yield different perceptual experiences. In the following listening test, we investigated whether different level or frequency characteristics have an influence on the perception of the driving-by-scenes.
2.6. Listening Test
2.6.2. Attributes
While existing studies often focus on aspects such as detectability or general unpleasantness, the objective of this paper is to explore a broad perceptual spectrum of vehicle scenes. The literature offers a structural framework for investigating the characteristics of 3D playback systems, which guided the selection of attributes in this study [
11]. Using different perceptual dimensions, the chosen attribute groups included source location, timbral balance, loudness, room-related attributes, and naturalness (or the realistic feeling). These attributes were selected based on their intuitive rating potential when evaluating driving-by-scenes. Additionally, an extra attribute related to velocity perception was incorporated, considering its critical role in safety-relevant investigations. In the subsequent table, the attribute groups and the specific attributes are delineated.
Table 3.
The used perceptual attributes and their corelating group.
Table 3.
The used perceptual attributes and their corelating group.
| Dimension |
Attributes |
| Timbral balance |
Dark-bright |
| Naturalness |
Realistic-unrealistic |
| Room-related |
Limited-open |
| Source localization |
Sounds from one point-sounds bigger |
| Loudness |
Soft-loud |
| Velocity perception |
Slow-fast |
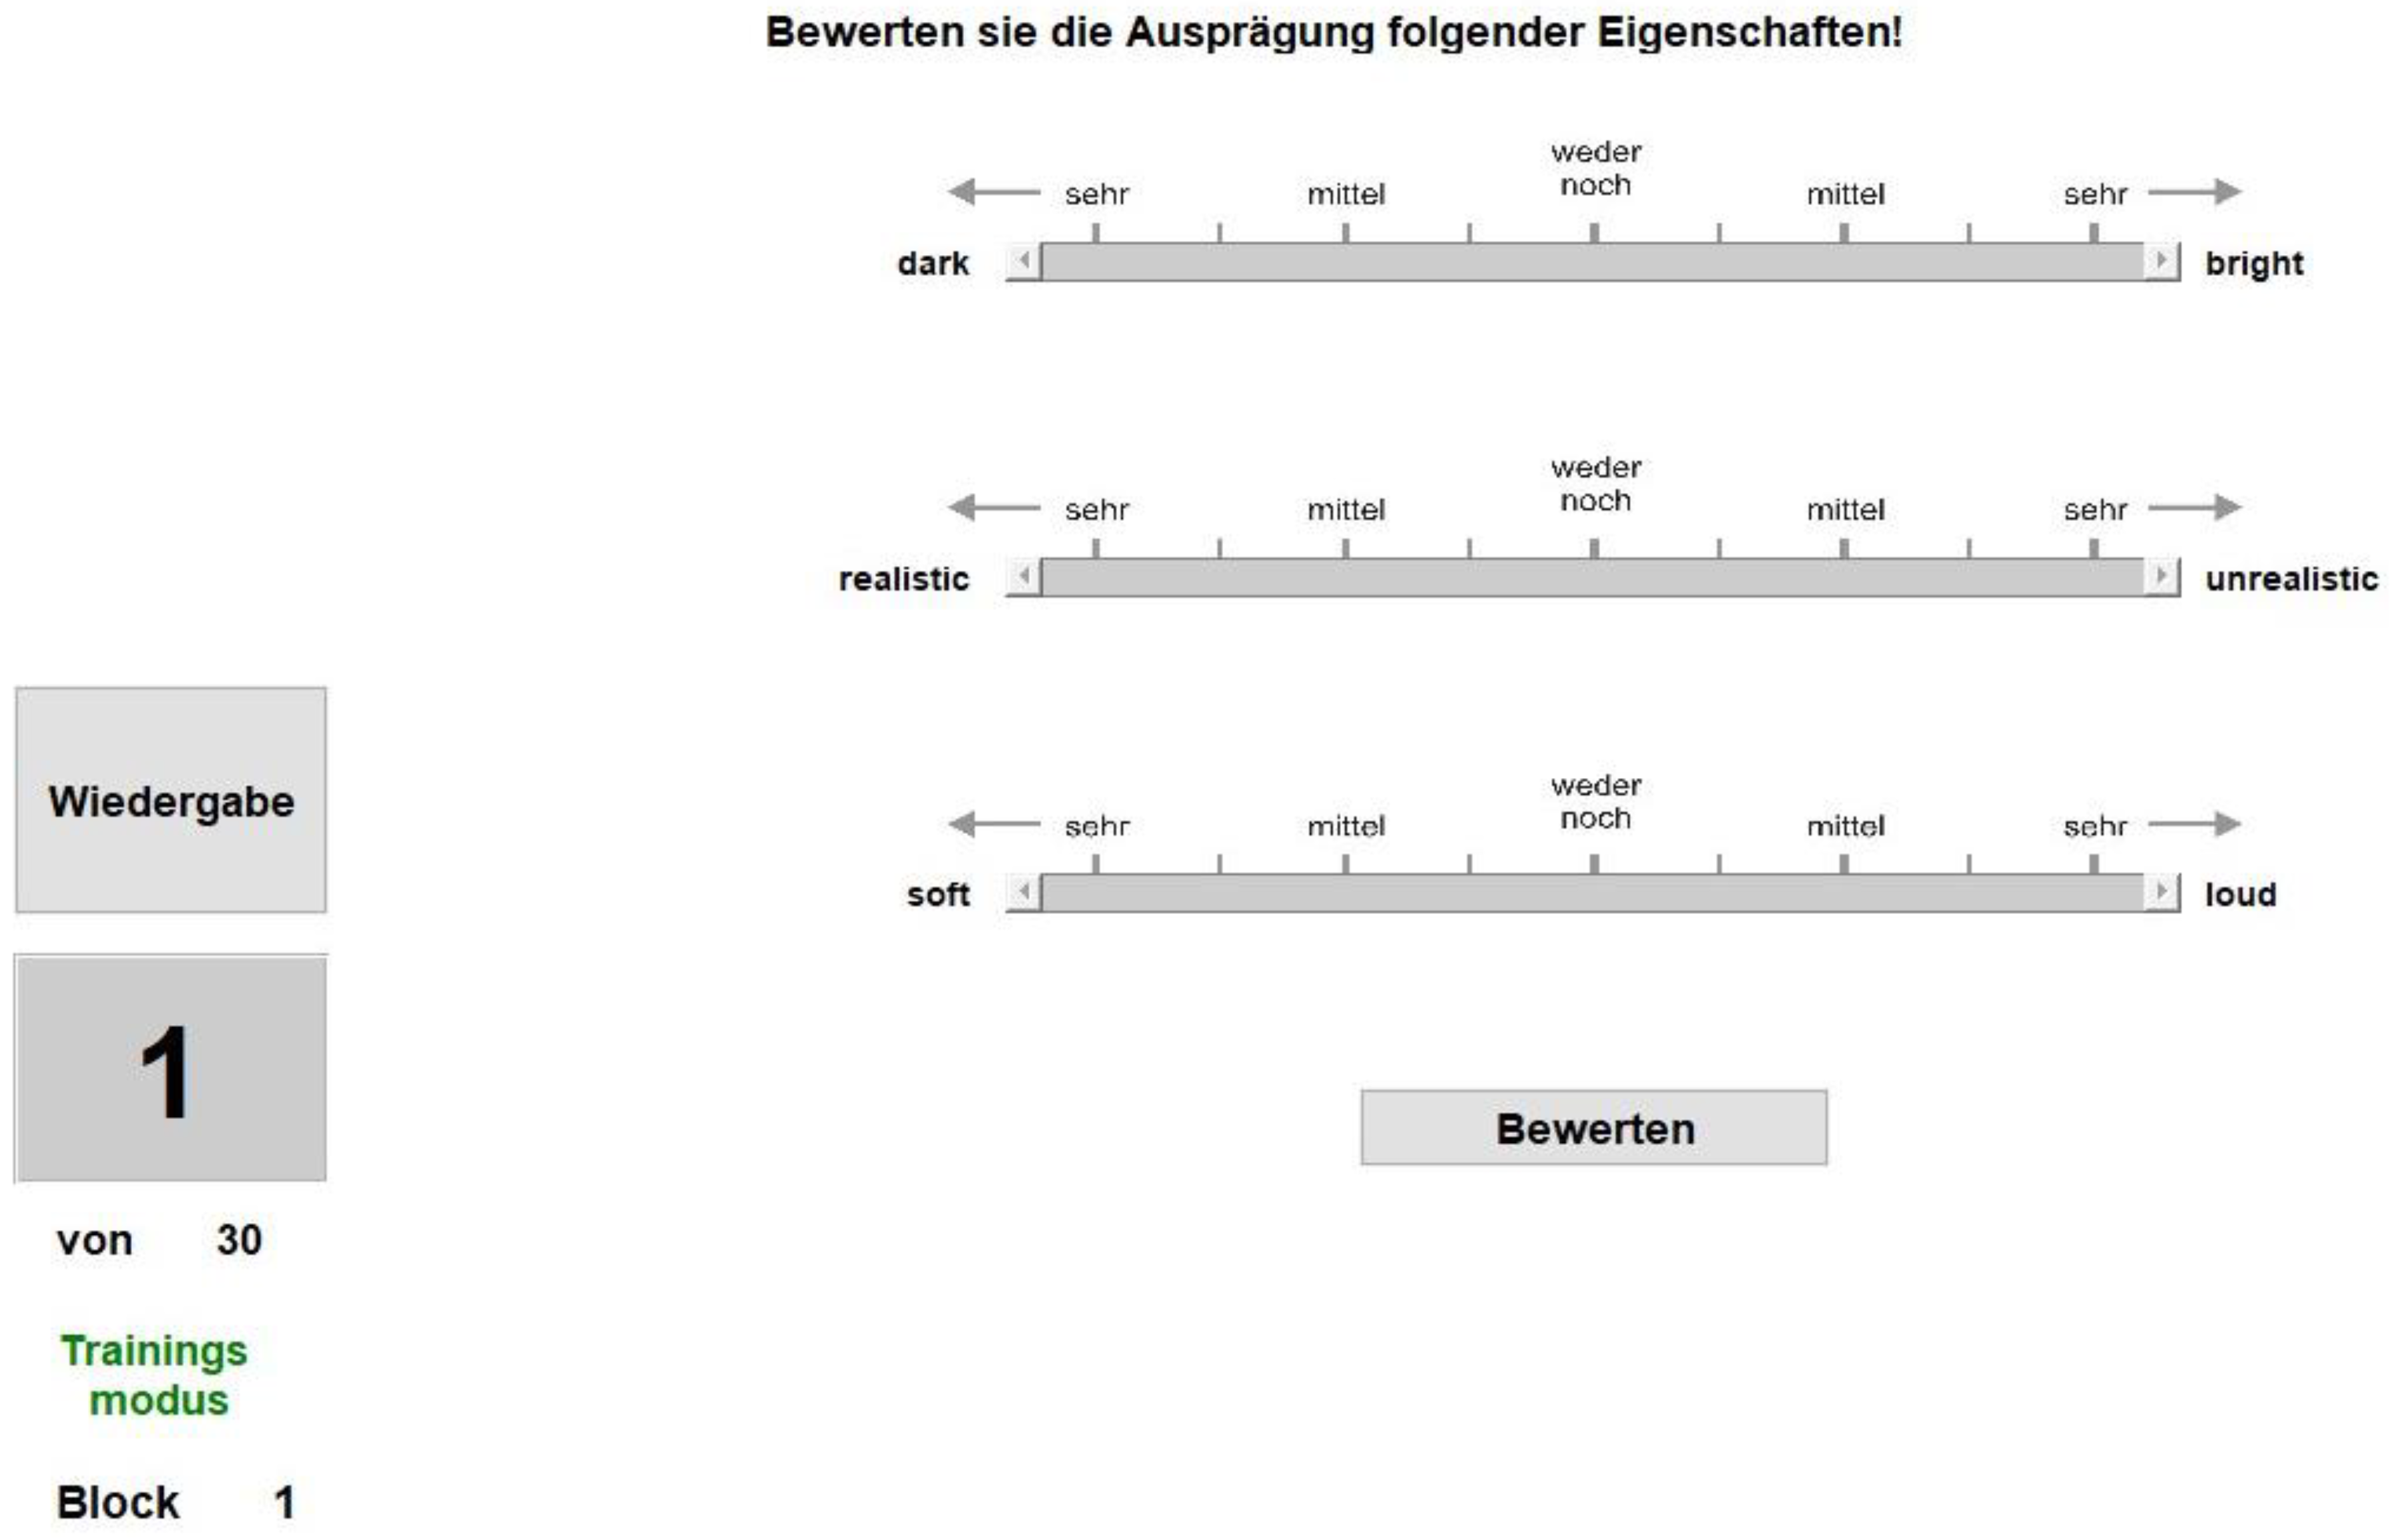
Participants were prompted to assess these attributes, utilizing a rating scale ranging from 0 to 100.
Figure 3.
GUI of the rating experiment.
Figure 3.
GUI of the rating experiment.
2.6.1. Playback System
To ensure that differences in environments would not affect the results, we played back the processed recordings via headphones (HD650, Sennheiser, Wedemark, Germany).
2.6.3. Procedure
Participants were instructed to assume a comfortable seating position before participating in the experiment. Prior to the actual rating tasks, they received general information about the experimental procedures and were given the opportunity to familiarize themselves with the perceptual attributes. During this phase, participants were encouraged to ask questions and clarify any uncertainties regarding the attributes presented. Once ready, participants put on their headphones, and the experiment unfolded in two distinct parts, each comprising 30 stimuli (the 30 unique scenes) and focusing on three perceptual attributes. In the first part, participants evaluated attributes dark-bright, realistic-unrealistic, and soft-loud. The second part encompassed the assessment of all remaining attributes, as detailed in
Table 3. Before each experimental segment, participants engaged in a training session featuring eight scenes from the 30 possible scenes. The training sessions incorporated scenes from each playback system, including both the quietest and loudest stimuli, to expose participants to a wide range of scene attributes. While the results of these training trials did not contribute to the final analysis, they served the purpose of acquainting participants with the rating scale and the diverse characteristics of the scenes. Following the training phase, the main experiment commenced and spanned approximately 35 minutes.
2.6.4. Participants
24 participants (18 male, 6 female) participated voluntarily in the listening study. The participants ages ranged from 19 to 61 years (M=30 years; SD=10 years) and all were self-reported normal hearing listeners. This experiment was approved by the ethics committee of the TU Dresden with the Number: SR-EK-68022020.
4. Results
4.1. Subjective Ratings of ICEV Driving by Scenes
As shown in
Figure 4 and
Figure 5, the patterns of ratings for the six sound attributes generally showed a high degree of similarity between the playback systems, although there were differences. The first noticeable point is the interaction effects between the scene and playback factors. For the attributes "soft-loud" and "dark-bright", the interaction effects become significant. They show a medium effect size according to Cohen [
35]. In contrast, the significant interaction effects for the attributes "slow-fast" and "realistic-unrealistic" show a medium to strong effect size. The most important influences of the playback systems on the attribute ratings are analyzed first. For the "soft-loud" attribute, there is no significant influence of the playback configurations on the perception. It was expected, because the scenes were (A) level-matched. The different playback setups do not have a significant influence on the rating results of the room related attributes as well. Despite this, the ratings of the "limited-open" attribute show some tendencies. Every test track recording, especially those with increasing velocities, was rated as slightly more open, compared to the recordings of the other playback systems. For the "dark-bright" attribute, the effect of the playback system on the attribute rating is highly significant. The 41-channel HOA-VBAP configuration and the virtual binaural receiver simulating this setup were perceived as very dark. The test track recordings were rated as the brightest, followed by the 16-channel HOA and WFS systems. The speed perception of the vehicle scenes, which is represented by the attribute “slow-fast”, is also significantly influenced by the different playback systems. Comparing speed perception values between the 16-channel HOA and WFS systems reveals that vehicles in the WFS system were perceived as slightly faster. It remains to be investigated if this was due to differences in sound playback (HOA vs. WFS) or differences in the simulation (TASCAR vs. TUD Matlab toolbox).
The speed of the virtual dummy head receiver recordings tended to be perceived as lower than that of the other playback systems. For speeds above 10 km/h, the speed perceptions in the 41-channel HOA-VBAP and WFS were nearly the same. Regarding the "realistic" attribute, the playback system had a significant influence. For speeds above 10 km/h, the test track was perceived as most realistic. It was thought that different speeds would affect the rating for attributes like dark-bright. This is because of the effect of different engine speeds and sounds. Further investigation is needed into how these scene parameters affect perception.
4.2. Subjective Ratings of EV Driving by Scenes
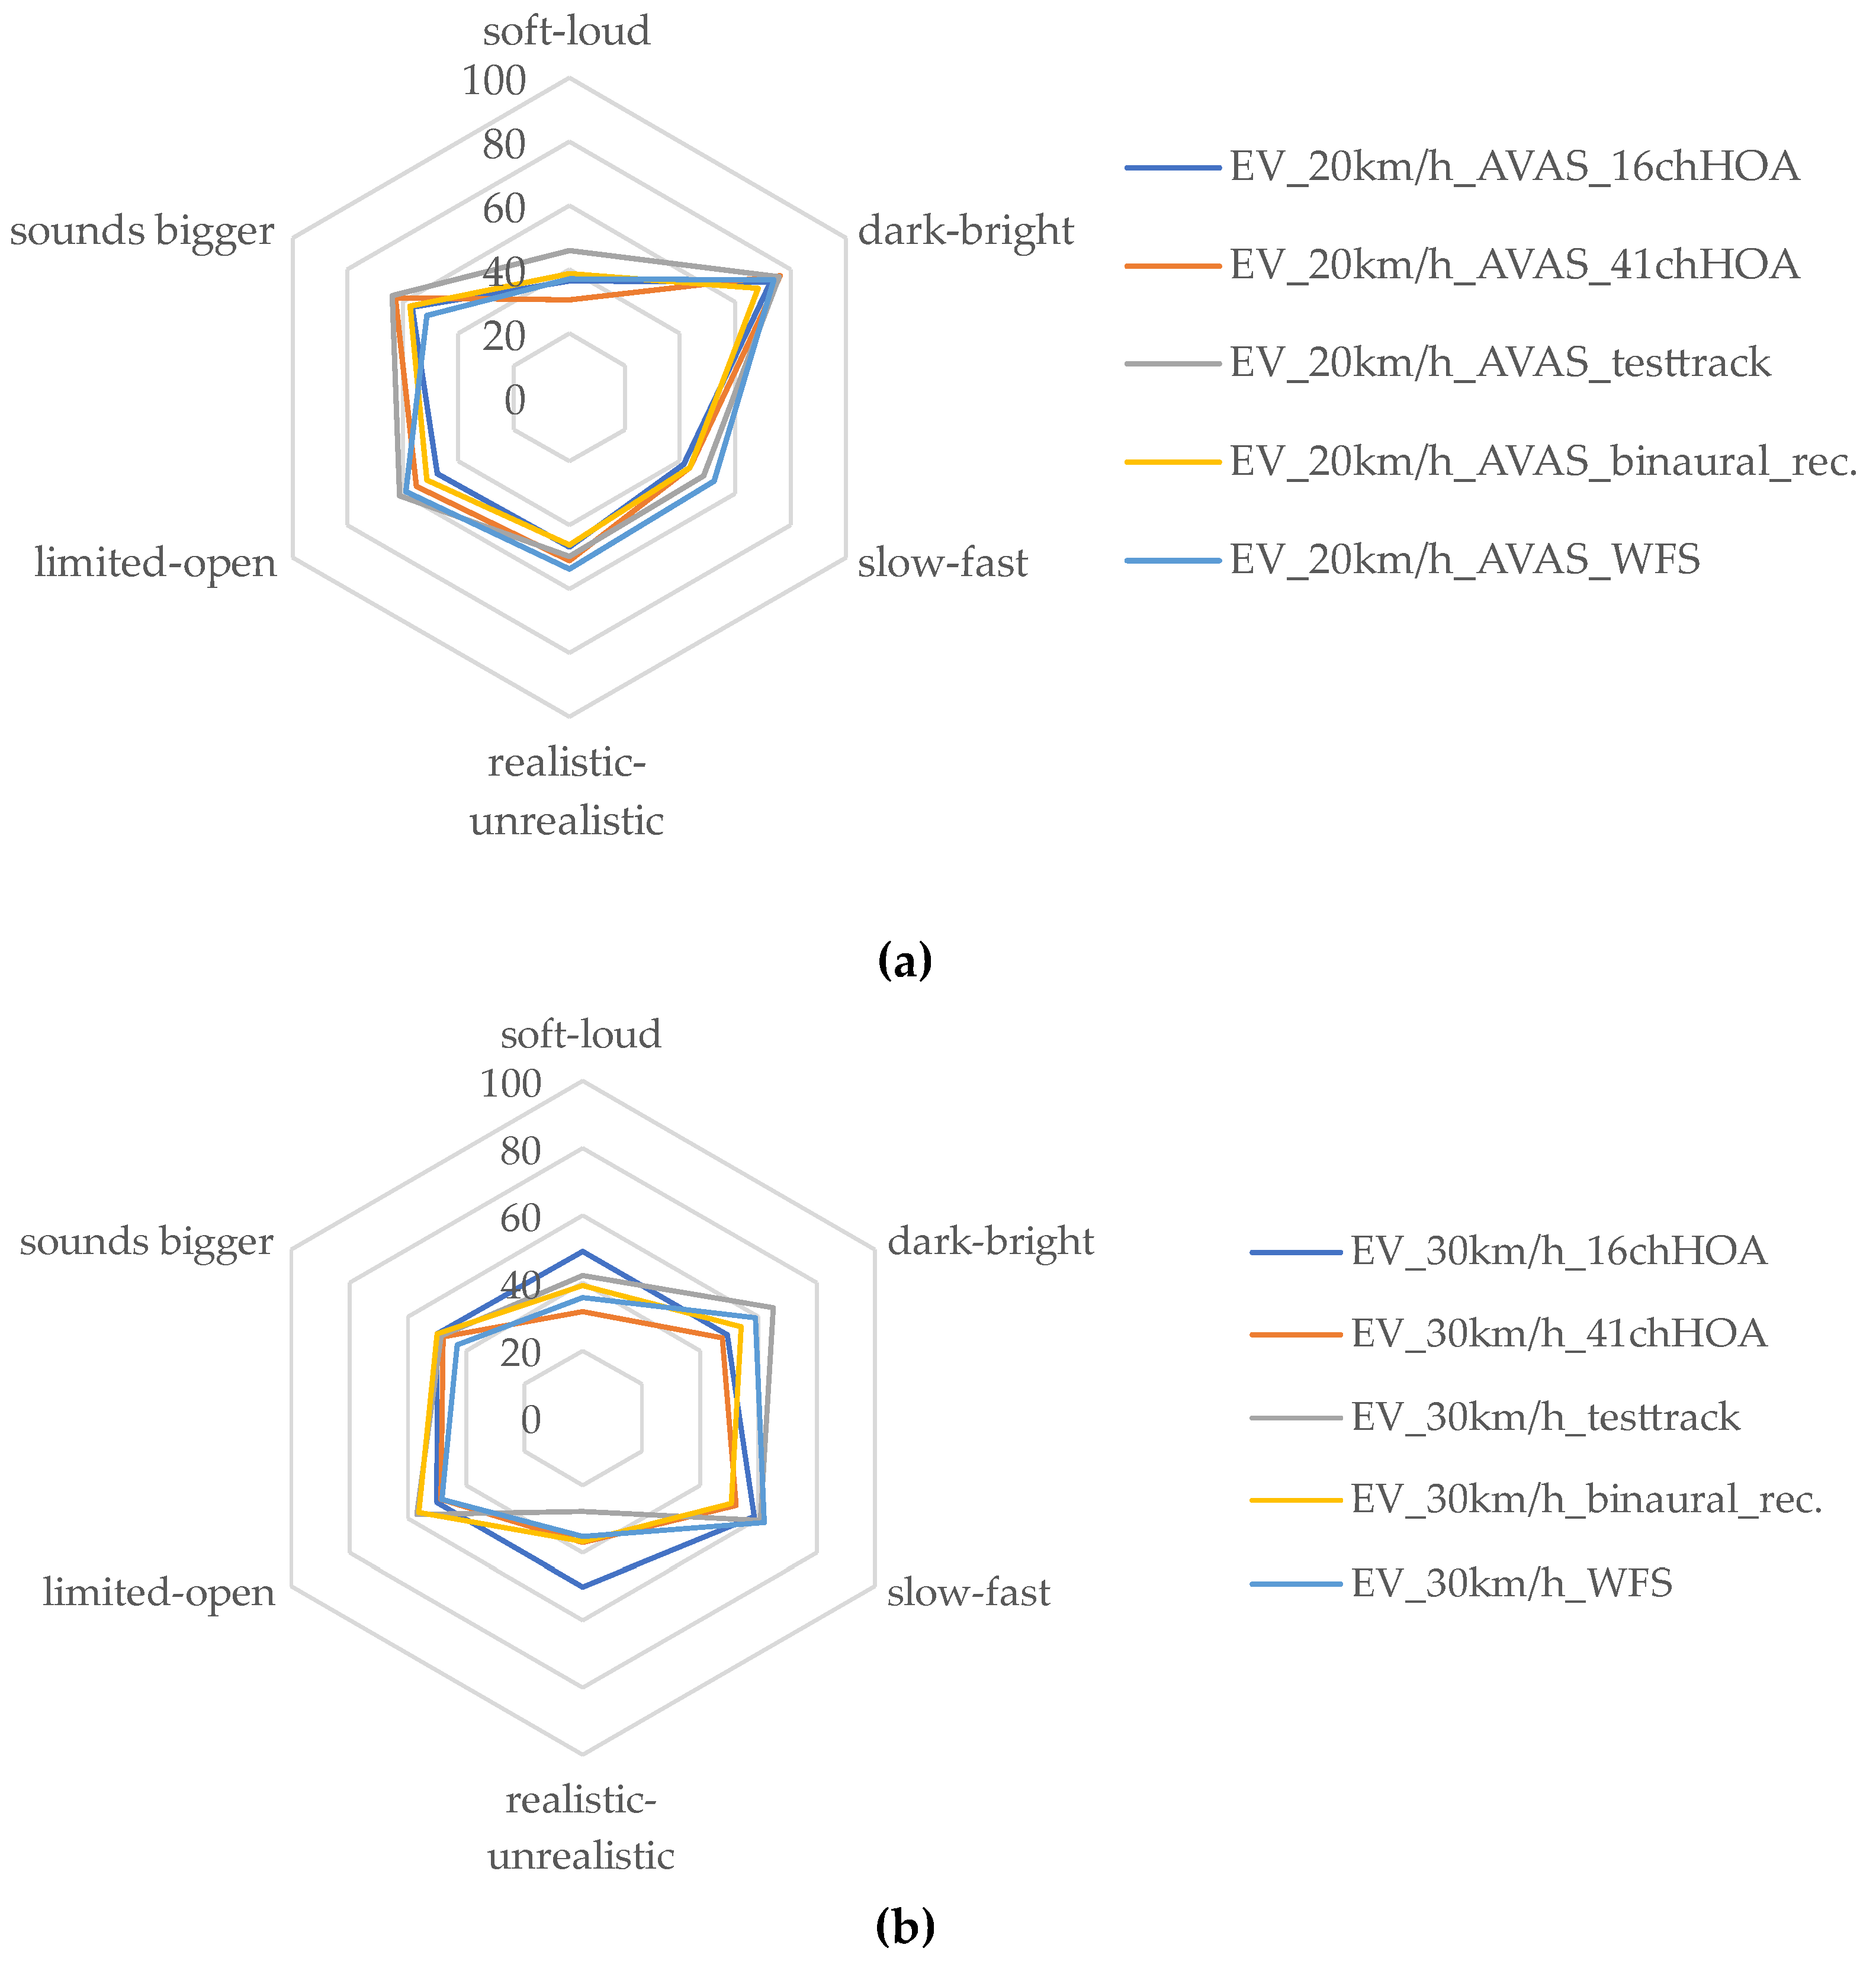
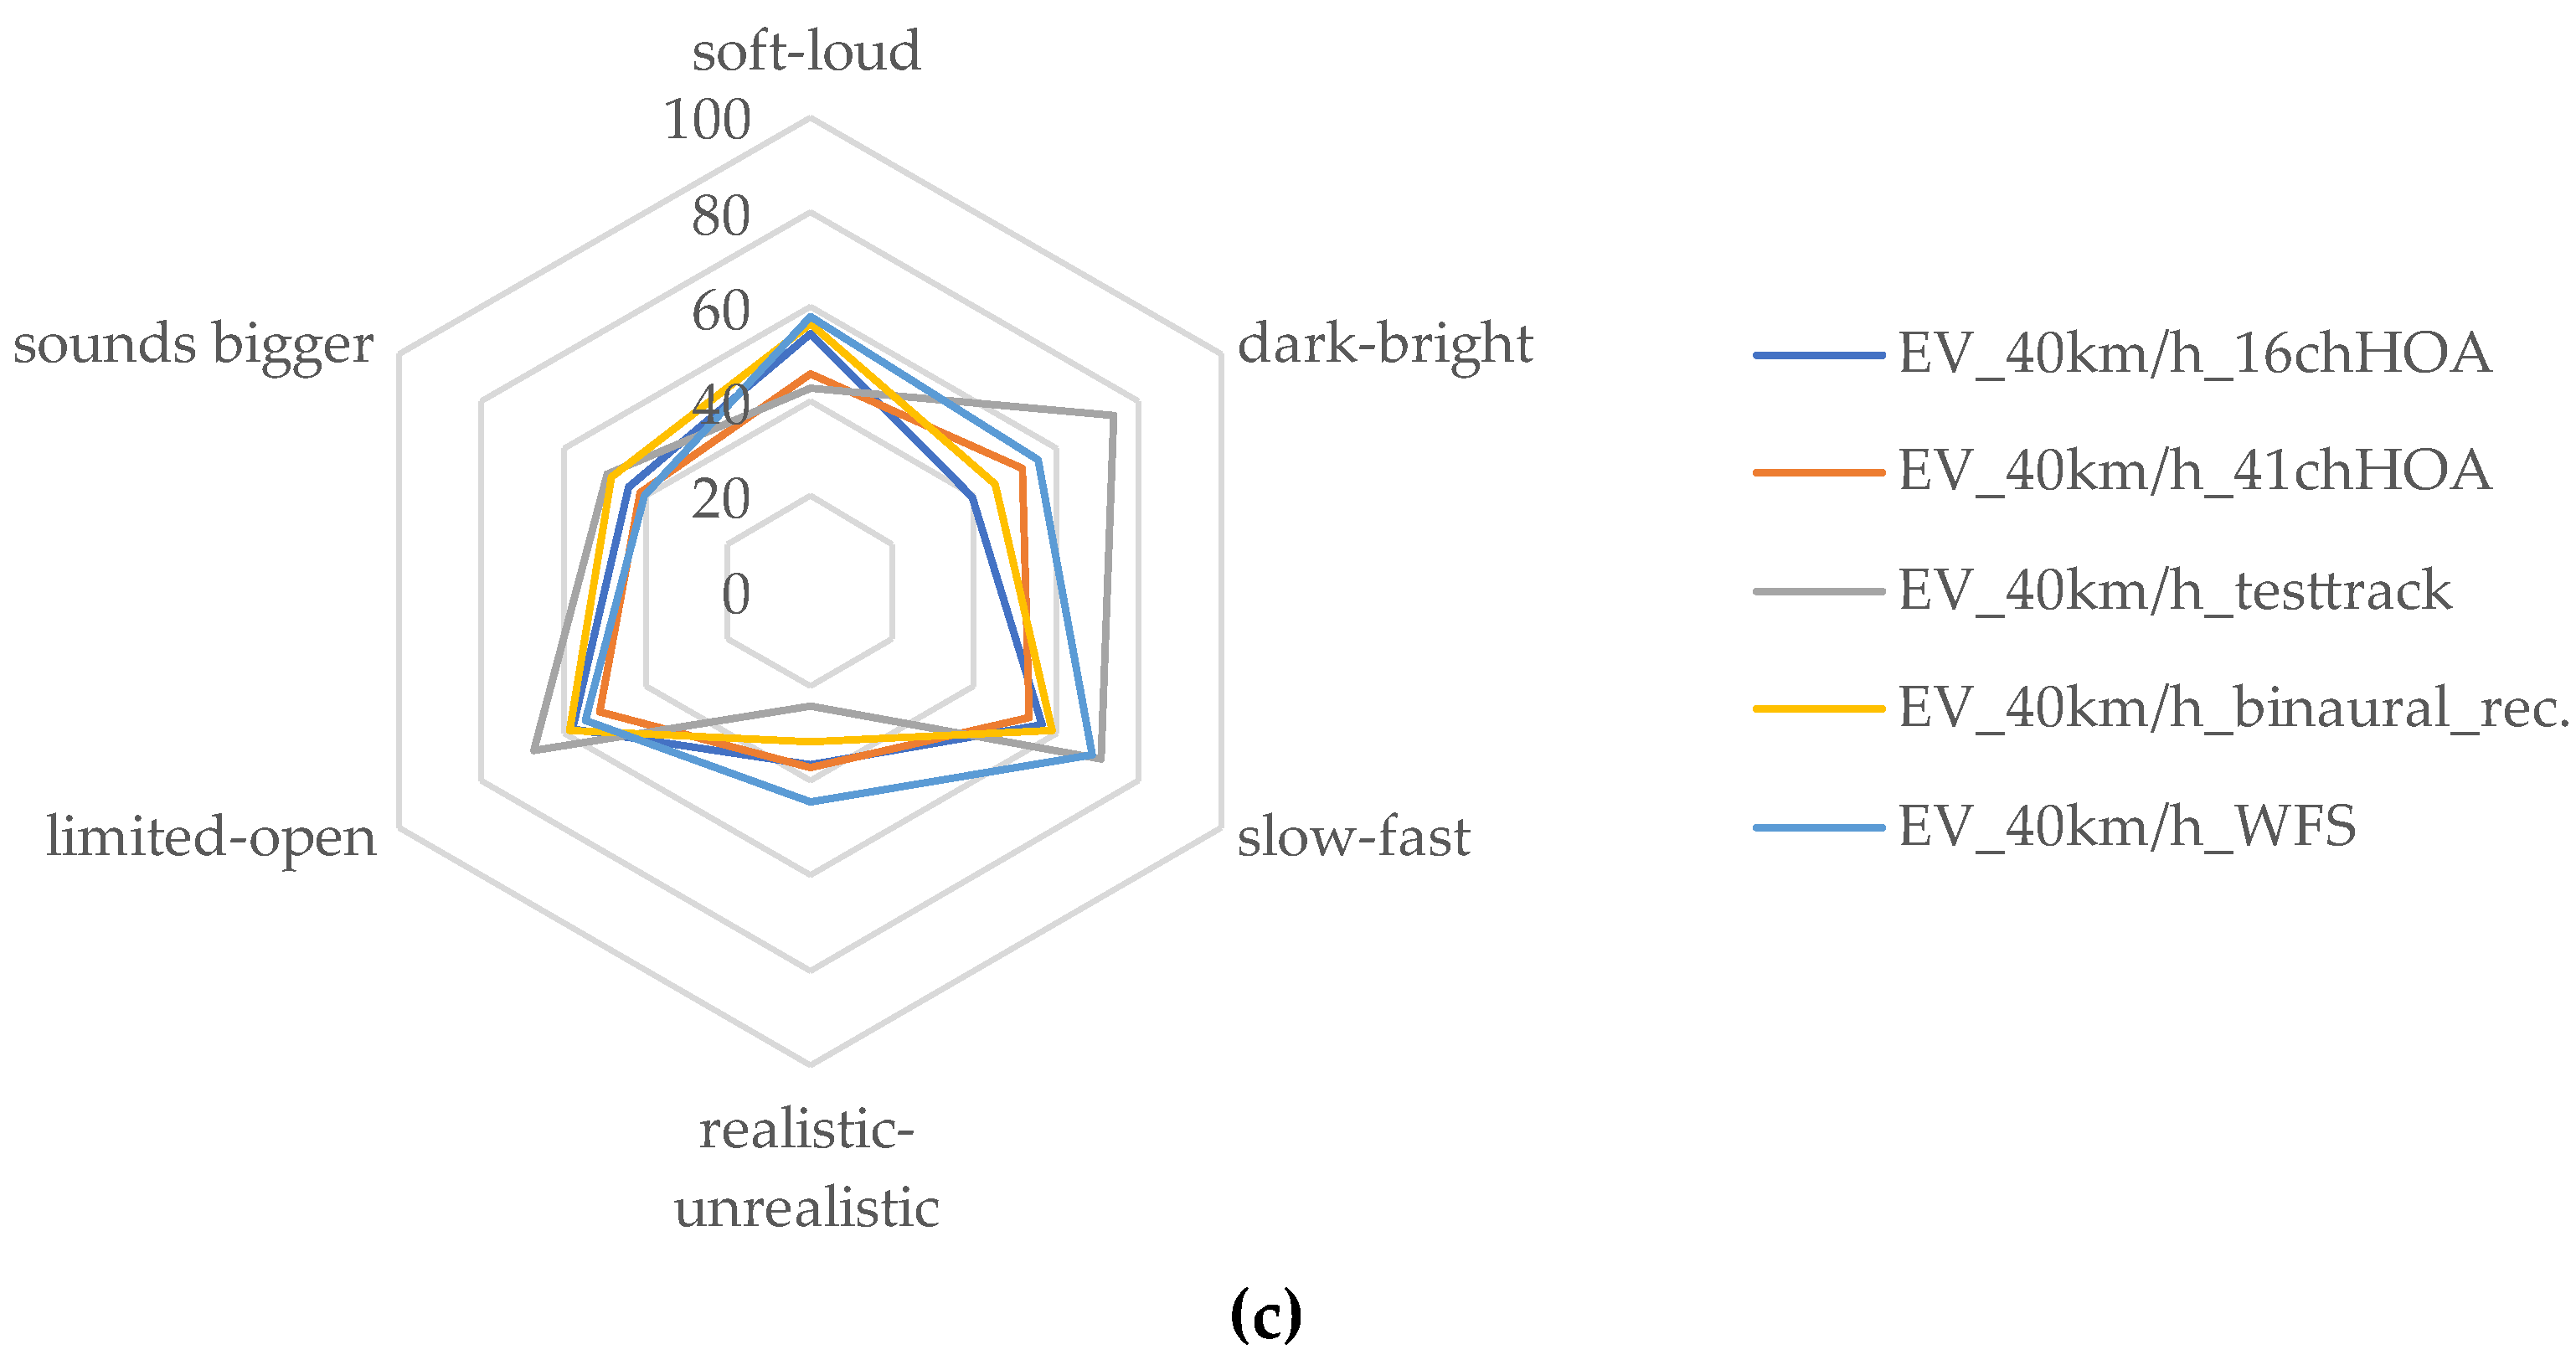
The interaction effects of the "soft-loud", "dark-bright" and “realistic-unrealistic” attributes were significant. For the EV scenes, the influence of the playback systems on the attribute ratings were taken into account. Especially the rating for the attribute "soft-loud" should be explained at first. There were tendencies that illustrate the potential perceptual behavior of the participants. Notably, EV scenes were perceived as generally quieter than ICEV scenes. Specifically, the electric vehicle with the AVAS system switched on is perceived as 10 to 20% quieter than the combustion engine vehicle, when comparing scenes at the same constant velocity of 20 km/h, although the scenes containing different vehicle types were (A) level-matched. When analyzing the attribute “dark-bright”, the EV scene with the AVAS system switched on is perceived as significantly brighter. The AVAS sound is perceived to have distinct timbre characteristics compared to traditional engine sounds. When examining scenes with varying speed parameters, the test track recording was perceived as brighter compared to the playback methods, a characteristic present in both ICEV and EV scenes. Furthermore, the "realistic-unrealistic" attribute revealed a consistent tendency for the test track recordings to be perceived as more realistic, as it was the case for the ICEV scenes. When comparing the rating results of the attribute “slow fast”, it turns out that the vehicles in the WFS and test track environment were perceived generally faster than in the other playback environments.
Figure 5.
Average rating of the perceptual attributes of the EV driving-by-scenes. The numbers from one to 100 represent the rating results in percent. The first word of the net legend (e.g. dark from the attribute pair dark-bright) is related to zero percent.
Figure 5.
Average rating of the perceptual attributes of the EV driving-by-scenes. The numbers from one to 100 represent the rating results in percent. The first word of the net legend (e.g. dark from the attribute pair dark-bright) is related to zero percent.
4.3. Tables with the Results of the Statistic Analysis
The results were analyzed using a rmANOVA method. An α-level of .05 was used for all analyses. Presented results are at
Table 4 and
Table 5 contain the rmANOVA results for every attribute. In the following sub sections, the distributions of the groups are explained more detailed.
5. Discussion
Given that the majority of safety-relevant experiments in the field of automotive development are conducted in simulation environments, a variety of laboratory approaches have emerged as the prevailing methodology. The present study compares and contrasts the characteristics of two simulation toolboxes (TASCAR and TUD-MATLAB toolbox) and two playback systems, namely HOA-VBAP and WFS. On top of that, the test track and virtual dummy head recordings were considered as well. The ideal scenario would be to see no differences in the perception of audio reproduction between the different laboratory environments. In fact, analyses of model-based psychoacoustic parameters such as sharpness and listeners ratings of various sound attributes showed a high degree of similarity between the reproduction approaches. However, we also found some significant differences between the reproduction systems for certain attribute ratings. Before playing the test track scenes back over the Head labO2 Interface with the DF playback equalizer, an individual DF filter for the Brüel & Kjaer 4100D dummy head was used for processing the signal, as already done with the recorded signals with the Head HSU III.3 dummy head. Despite the utilisation of analogous processing techniques to minimise discrepancies between the recordings of the two dummy heads, it was not possible to eliminate them entirely. However, the sharpness of the test track recordings was higher, compared to the recordings in the laboratories (see
Table 2). It underscores the fact, that the higher frequency content is remarkably dominant for the test track scenes. The 16ch HOA system showed similar results to the WFS system, whereas the 41ch HOA-VBAP system was perceived tendentially darker, presumably due to the additional subwoofer. The ICEV scenes were perceived generally as darker with decreasing velocity. One potential explanation for this phenomenon is the engine orders of the combustion engine. As the rotational speed decreases, the frequency content also declines. This is particularly noticeable in the 41ch HOA-VBAP system, where it is played back with greater prominence. Psychoacoustic metrics, such as sharpness, underline the differences in the timbral balance of the different reproduction methods and the test track recordings. This suggests that for future record-based simulations, it could be useful to compare the frequency spectrum recorded at the listener’s position in the laboratories with the spectrum of actual test track dummy head recordings. Such a step ensures that the simulation closely mirrors the real traffic scenario. However, precise comparisons are only possible when during the test track dummy head recordings the ambient noise level is very low, and on windless days. Both criteria are quite difficult to meet. In fact, in the present analyses, the test track dummy head recordings contained significant ambient noise and were affected by wind, which likely affected all psychoacoustic metrics as well as the listening test results. Thus, it is important to treat these results with caution and view them as indicative rather than definitive. The use of two different dummy head models for the real test track recordings and the laboratory recordings introduced additional deviations.
Besides that, the observed differences can probably be attributed to the differing loudspeaker configurations, circular setups, and reproduction methods employed in each laboratory. These variations can lead to slight differences in the transfer functions of the sounds, subsequently influencing perception, as already investigated in previous playback method comparisons [
10,
13]. Additionally, the WFS system utilizes a unique filtering method developed to balance its frequency response against an ideal pink noise reference. This method, based on third-octave band filter magnitudes, produces a filter curve with limited accuracy, potentially causing minor differences in the reproduced signal. When examining the dynamic perception of stimuli, these findings align with known issues from previous research. A prior study revealed that TTCs were underestimated in the WFS system compared to the 16-channel HOA system, despite using identical stimuli [
36]. An erroneous level calibration was suggested as a possible explanation. However, in the present study, special attention was given to the detailed calibration of the systems. By matching the maximum A-weighted levels and examining small deviations, efforts were made to ensure reproduction accuracy. Nevertheless, the velocity perception results of the ICEV scenes indicated a similar trend: participants tended to perceive approaching vehicles as faster in the WFS compared to the 16ch HOA approach. It can’t be finally explained, why this issue occurs. Previous investigations already revealed, that there are differences between sound reproductions within different playback methods, especially in coloration [
10,
13]. As such differences occur also between the laboratories in Mainz and Dresden, future studies should explore in general whether this has an impact on safety-relevant decisions made by pedestrians.
Fairly notably, at higher velocities, test track scenes were rated as more realistic and slightly more open compared to their simulated counterparts. The most likely explanation for this result is that ambient background noise (birds, aircraft noise, distant traffic etc.) was present on the test track recordings but not in the simulated vehicle approaches. One potential improvement could be to record the ambient noise of the real environment and play it back alongside the sound of the reproduced vehicle scenes to better approximate real-world conditions.
While all these attributes could be rated well, the participants tend to have problems, rating the room related attributes, as their rating values are mostly around 50%, indicating that they did not distinctly choose one extreme or the other. While limited-open showed at least some tendency, e.g. the test track recordings were rated as slightly more open in the vehicle scenes, especially the “sounds bigger” attribute had larger 95% confidence intervals and was mainly rated in the 40 to 60 percent range. Both attribute ratings were not significantly influenced by the different playback methods, so the results are more neutral, than showing actual tendencies in the localization ability or room impression The labs were treated differently and, having listened carefully to the drive-by scenes, it was expected that these attributes would vary between the different playback systems. As this was not the case, future work should focus on the selection of better attributes for investigating spatial perception in audio reproduction methods.
Beyond the comparison of the general attributes, the analysis of loudness ratings also revealed interesting tendencies. Despite equal A-weighted levels of the vehicle scenes, participants perceived the EV scenes with a constant velocity of 20 km/h as quieter than those of the ICEV. It appears that rating the loudness of electric vehicle scenes may have been more challenging for participants, as these vehicles do not emit the typical engine sounds that pedestrians are accustomed to in traffic dominated by combustion engine vehicles. This finding is consistent across playback systems, emphasizing the challenge pedestrians face in perceiving electric vehicles compared to conventional combustion engine vehicles. The lower loudness of EVs observed in the present study might imply an impaired perception of the electric vehicles. Other studies, such as [
37,
38] underline this assumption. However, although current regulations and guidelines for AVAS warning sounds focus on specific noise levels [
39,
40], this study demonstrates that the participants rated the EV scenes as quieter. Therefore, when developing AVAS sounds, the detectability must be ensured. As Bazilinskyy et al. [
41] suggest, that one potential method for enhancing the ability to recognize a vehicle is through an increase in the loudness of the vehicle sound. That could be feasible, ensuring perceptually comparable sound levels of the EV to those of combustion engine vehicles. Furthermore, it could enhance pedestrian safety and address the auditory challenges posed by the increasing prevalence of electric vehicles.
Finally, it is important to note that despite the moderate differences in perceived sound attributes between playback systems observed in the present study, this does not automatically imply that, e.g., time-to-collision estimation [
3] or street-crossing decisions [
28] can be expected to differ between the systems. For instance, even when the vehicle sounds are perceived as somewhat brighter in one system compared to another system, participants could be equally able to gather information about the motion of the approaching vehicle from the dynamic changes in loudness or azimuthal angle provided by auditory stimulus. [
42] Thus, additional research is required to investigate if behavioral tasks such as TTC estimation or street-crossing decisions also show differences between the playback systems.
6. Conclusions
This investigation shows differences in the different actual sound reproduction methods with auditory only stimuli. On the one hand, there are timbral and minor loudness perception differences within the different playback methods, but on the other hand stronger brightness perception of the real test track scenes stood out. Besides that, the velocity perceptions of the driving by scenes show plausible results, although some minor deviations exist and some could be assigned to those of previous studies. It still has to be investigated, whether coloration differences in reproduced driving by scenes actually influence important decisions of pedestrians in traffic scenarios. Beside the comparison of the reproduction methods, one general trend of the loudness perception ratings underlined the reduced detectability of electric vehicles. Especially when developing AVAS sounds, special attention should be given on comparable sound levels between EV and ICEV.
Author Contributions
Conceptualization, J.K.; methodology, J.K. , D.O. and T.H.; investigation, J.K.; resources, D.O. and T.H.; data curation, D.O.; writing—original draft preparation, J.K.; formal analysis, J.K.; visualization, J.K.; supervision, M.E.A.; project administration, J.K.; funding acquisition, M.E.A. and D.O.; writing—review and editing, T.H., D.O., M.M.M. and M.E.A. All authors have read and agreed to the published version of the manuscript
Funding
This work was supported by the German Research Foundation (DFG, Deutsche Forschungsgemeinschaft) AL 1473/13-1 (Ercan Altinsoy) / OB 346/8-1 (Daniel Oberfeld)— Project ID 444809588. The project is part of the priority program AUDICTIVE - SPP2236.
Institutional Review Board Statement
The study was conducted in accordance with the Declaration of Helsinki, and approved by the Ethics Committee of Technische Universität Dresden (protocol code SR-EK-68022020 and date of approval 04 December 2020).
Informed Consent Statement
Informed consent was obtained from all participants involved in the study.
Data Availability Statement
The evaluation results of the participants can be received from the corresponding authors in anonymized form.
Conflicts of Interest
The authors declare no conflict of interest.
References
- Wall Emerson, R.; Kim, D.S.; Naghshineh, K.; Pliskow, J.; Myers, K. Detection of Quiet Vehicles by Blind Pedestrians. J. Transp. Eng. 2013, 139, 50–56. [CrossRef]
-
Wahrnehmung und Bewertung von Fahrzeugaußengeräuschen durch Fußgänger in verschiedenen Verkehrssituationen und unterschiedlichen Betriebszuständen; Bundesanstalt für Straßenwesen, Ed.; Fachverlag NW in der Carl Schünemann Verlag GmbH: Bremerhaven, 2015, ISBN 978-3-95606-206-3.
- Oberfeld, D.; Wessels, M.; Büttner David. Overestimated time-to-collision for quiet vehicles: Evidence from a study using a novel audiovisual virtual-reality system for traffic scenarios. accident analysis and prevention 2022, 175. [CrossRef]
- Wessels, M.; Kröling, S.; Oberfeld, D. Audiovisual time-to-collision estimation for accelerating vehicles: The acoustic signature of electric vehicles impairs pedestrians' judgments. Transportation Research Part F: Traffic Psychology and Behaviour 2022, 91, 191–212. [CrossRef]
- DeLucia, P.R.; Preddy, D.; Oberfeld, D. Audiovisual Integration of Time-to-Contact Information for Approaching Objects. Multisens. Res. 2016, 29, 365–395. [CrossRef]
- Franco, A.F.; Merchel, S.; Pesqueux, L.; Rouau, M.; Sørensen, M.O. Sound Reproduction By Wave Field Synthesis 2004.
-
3-D-Lautsprecher-Wiedergabemethoden; BLAUERT, J., Ed. DAGA, Dresden, 2008.
-
Further Investigations of High-Order Ambisonics and Wavefield Synthesis for Holophonic Sound Imaging; Daniel; Jerome; Moreau; Sebastien; Nicol; Rozenn, Eds. Audio Engineering Society, Amsterdam, March 22-25, 2003.
-
A comparison of Wave Field Synthesis and Higher-Order Ambisonics with Respect to Physical Properties and Spatial Sampling; Spors, S.; Ahrens, J., Eds. Audio Engineering Society, San Francisco, October 2-5, 2008.
- Spors, S.; Wierstorf, H.; Raake, A.; Melchior, F.; Frank, M.; Zotter, F. Spatial Sound With Loudspeakers and Its Perception: A Review of the Current State. Proc. IEEE 2013, 101, 1920–1938. [CrossRef]
-
A roadmap for assessing the Quality of Experience of 3D Audio binaural rendering; Rozenn Nicol, Laetitia Gros, Cathy Colomes, Olivier Warusfel, Markus Noisternig, Hélène Bahu, Brian FG Katz, Laurent S. R. Simon, Author Four, Ed.; Universitätsverlag der TU Berlin: Berlin, 2014.
- Singh, S.; Payne, S.R.; Mackrill, J.B.; Jennings, P.A. Do experiments in the virtual world effectively predict how pedestrians evaluate electric vehicle sounds in the real world? Transportation Research Part F: Traffic Psychology and Behaviour 2015, 35, 119–131. [CrossRef]
- Guastavino, C.; Katz, B.F.G. Perceptual evaluation of multi-dimensional spatial audio reproduction. J. Acoust. Soc. Am. 2004, 116, 1105–1115. [CrossRef]
-
Spatial audio quality in regard to 3D video; Samuel Moulin; Rozenn Nicol; Laetitia Gros, Eds. Acoustics 2012, Nantes, 23.-27. April, 2012.
- Wierstorf, H. Perceptual Assessment of Sound Field Synthesis. Dissertation; Technische Universität, Berlin, 2014.
- Kaplanis, N.; Bech, S.; Lokki, T.; van Waterschoot, T.; Holdt Jensen, S. Perception and preference of reverberation in small listening rooms for multi-loudspeaker reproduction. J. Acoust. Soc. Am. 2019, 146, 3562. [CrossRef]
- Berg, J.; Rumsay, F. Spatial Attribute Identification and Scaling by Repertory Grid Technique and other methods 1999.
- International Telecommunication Union. Methods for selecting and describing attributes and terms, in the preparation of subjective tests; ITU: Geneva, 2017 (BS.2399-0).
- Störig, C.; Pörschmann, C. Investigations into Velocity and Distance Perception Based on Different Types of Moving Sound Sources with Respect to Auditory Virtual Environments, 2014.
- Pörschmann, C.; Störig, C. Investigations Into the Velocity and Distance Perception of Moving Sound Sources. Acta Acustica united with Acustica 2009, 95, 696–706. [CrossRef]
-
Progress of Auditory Perception Laboratories- Multimodal Measurement Laboratory of Dresden University of Technology; Altinsoy, E.M.; Jekosch, U.; Merchel, S.; Landgraf, J., Eds. Audio Engineering Society, San Francisco, November 4-7, 2010.
- Deutsches Institut für Normierung. Bild- und Tonbearbeitung in Film-, Video- und Rundfunkbetrieben – Grundsätze und Festlegungen für den Arbeitsplatz; Beuth Verlag GmbH: Berlin, 2020 (15996).
- ITU Radiocommunication Bureau. BS.1116-1 - Methods for the subjective assessment of small impairments in audio systems including multichannel sound systems.
-
Comparison of Recorded and Synthesized Stimuli of Trac Scenarios in an Auditory Virtual Reality Environment Using Wave Field Synthesis; Beyer, F.; Fischer, S.; Steinbach, L.; Altinsoy, M.E., Eds. DAGA, Hamburg, 2023.
- Pulkki, V. Virtual sound source positioning using vector base amplitude panning. Journal of the Audio Engineering Society 1997, 456–466.
- Daniel, J. Représentation de champs acoustiques, application à la transmission et à la reproduction de scènes sonores complexes dans un contexte multimédia. Dissertation; Université Pierre et Marie Curie, Paris(VI), 2000.
- Gerzon, M.A. Ambisonics in multichannel broadcasting and video. Journal of the Audio Engineering Society 1985, 859–871.
- Oberfeld-Twistel, D.; Wessels, M.; Kröling, S. Risiko hohe Beschleunigung: Straßenquerungsverhalten von Fußgänger:innen in Interaktion mit E-Fahrzeugen (mit und ohne AVAS) im Vergleich zu Verbrennern, 1. Auflage; Gesamtverband der Deutschen Versicherungswirtschaft: Berlin, 2021, ISBN 9783948917074.
- Wessels, M.; Zähme, C.; Oberfeld, D. Auditory Information Improves Time-to-collision Estimation for Accelerating Vehicles. Curr Psychol 2023, 42, 23195–23205. [CrossRef]
- Grimm, G.; Luberadzka, J.; Hohmann, V. A Toolbox for Rendering Virtual Acoustic Environments in the Context of Audiology. Acta Acustica united with Acustica 2019, 105, 566–578. [CrossRef]
- Rabbany, A.E. Introduction to GPS: the global positioning system; Artech House: London, 2002.
- Allen, B, J.; Berkley, A, D. Image Method for Efficiently Simulating Small-room Acoustics. J. Acoust. Soc. Am. 1979, 943–950.
-
Data-driven Optimization of Parametric Filters for Simulating Head-Related Transfer Functions in real-time Rendering Systems; Schwark, F.; Schädler, M.R.; Grimm, G., Eds. Euroregio BNAM 2022, Aalborg, Denmark, 9th-14th of May, 2022.
- International Organization of Standardization. Akustik -Verfahren zur Berechnung der Lautheit -Teil 1: Verfahren nach Zwicker (ISO 532-1:2017, korrigierte Fassung 2017-11); Beuth Verlag GmbH: Berlin, 2022 (532-1).
- Cohan, J. A Power primer. Psychological Bulletin 1992.
-
Safety Investigation on Traffic Scenarios using Virtual Environments in a Wave Field Synthesis Laboratory; Lisa Steinbach; Friedrich Beyer; M. Ercan Altinsoy; Daniel Oberfeld-Twistel; Marlene Wessels, Eds. DAGA, Stuttgart, 2022.
- Steinbach, L.; Altinsoy, M.E. Influence of an artificially produced stationary sound of electrically powered vehicles on the safety of visually impaired pedestrians. Applied Acoustics 2020, 165, 107290. [CrossRef]
-
The detectability of conventional, hybrid and electric vehicle sounds by sighted, visually impaired and blind pedestrians; Altinsoy, E., Ed. internoise, Innsbruck, 2013.
- Amtsblatt der Europäischen Union. Regelung Nr. 138 der Wirtschaftskommission für Europa der Vereinten Nationen (UNECE) — Einheitliche Bestimmungen für die Genehmigung geräuscharmer Straßenfahrzeuge hinsichtlich ihrer verringerten Hörbarkeit [2017/ 71], 2017.
- Amtsblatt der Europäischen Union. VERORDNUNG (EU) Nr. 540•/•2014 DES EUROPÄISCHEN PARLAMENTS UND DES RATES - vom 16. April 2014 - über den Geräuschpegel von Kraftfahrzeugen und von Austauschschalldämpferanlagen sowie zur Änderung der Richtlinie 2007/•46/•EG und zur Aufhebung der Richtlinie 70/•157/•EWG -, 2014.
- Bazilinskyy, P.; Merino-Martínez, R.; Özcan, E.; Dodou, D.; Winter, J. de. Exterior sounds for electric and automated vehicles: Loud is effective. Applied Acoustics 2023, 214, 109673. [CrossRef]
- Jenison, R.L. On Acoustic Information for Motion. Ecological Psychology 1997, 9, 131–151. [CrossRef]
|
Disclaimer/Publisher’s Note: The statements, opinions and data contained in all publications are solely those of the individual author(s) and contributor(s) and not of MDPI and/or the editor(s). MDPI and/or the editor(s) disclaim responsibility for any injury to people or property resulting from any ideas, methods, instructions or products referred to in the content. |
© 2024 by the authors. Licensee MDPI, Basel, Switzerland. This article is an open access article distributed under the terms and conditions of the Creative Commons Attribution (CC BY) license (http://creativecommons.org/licenses/by/4.0/).