
Submitted:
19 December 2024
Posted:
19 December 2024
You are already at the latest version
Abstract
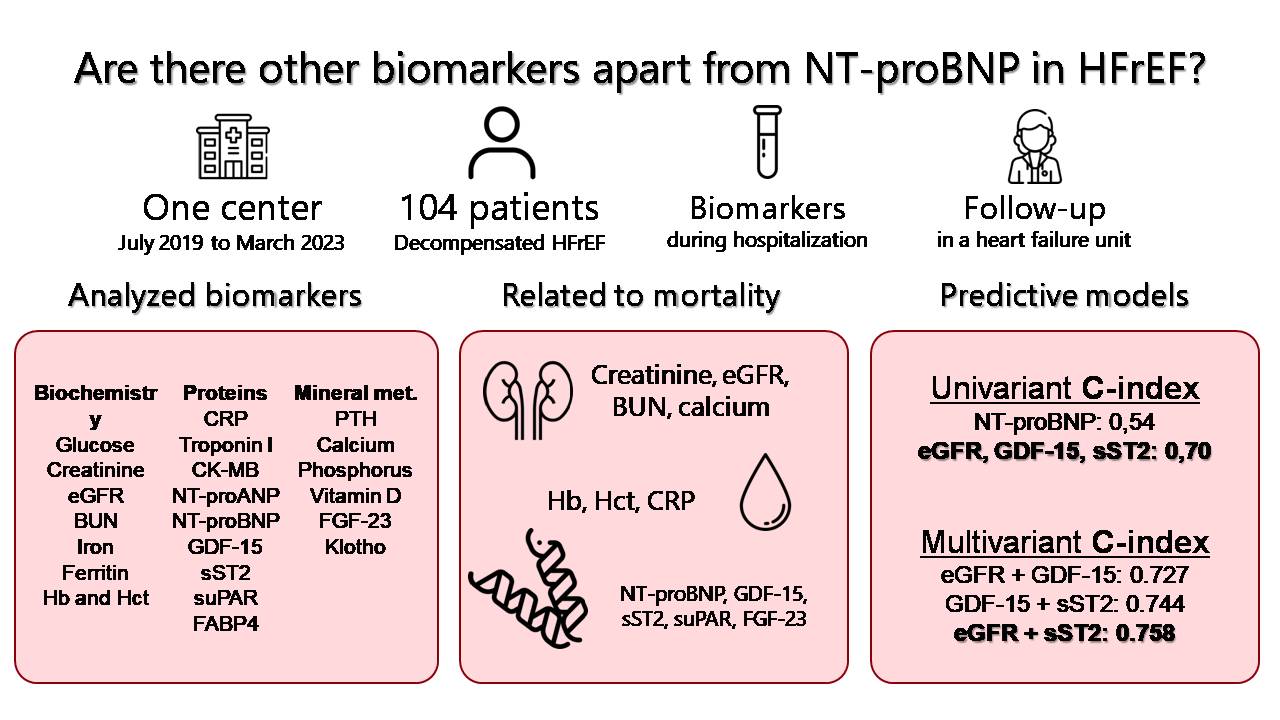
Natriuretic peptides are established biomarkers related to the prognosis of heart failure.New biomarkers have emerged in the area of cardiovascular disease. The prognostic value of these biomarkers in heart failure with reduced LVEF (HFrEF) is not well established.We conducted a prospective, single-centre study, including consecutively (July 2019 to March 2023) 104 patients admitted with a diagnosis of acute HFrEF decompensation.Median follow-up was 23.5 months, during which 20 deaths (19.4%) and 21 readmissions for heart failure (20.2%) were recorded. Plasma biomarkers such as NT-proBNP, GDF-15, sST2, uPAR, and FGF-23 were associated with an increased risk of all-cause mortality. However, a Cox regressionanalysis showed that the strongest predictors of mortality were estimated glomerular filtration rate (HR 0.96 [0.93-0.98]), GDF-15 (HR 1.3 [1.16-1.45]), and sST2 (HR 1.2 [1.11-1.35]). The strongest predictive model was formed by the combination of glomerular filtration rate and sST2 (C-index 0.758). In conclusion, in patients with acute decompensated HFrEF, GDF-15 and sST2 showed the highest predictive power for all-cause mortality, superior to other established biomarkers such as natriuretic peptides. GDF-15 and sST2 may provide additional prognostic information to improve the prognostic assessment.
Keywords:
Systolic heart failure
; biomarkers
; prognosis
; GDF 15
; sST2
1. Introduction
Heart failure (HF) remains a prevalent and relevant health problem today. It is estimated that approximately 1-2% of the adult population suffers from it, reaching a prevalence of more than 10% in elderly patients [1,2]. Despite major advances in the treatment and management of these patients in recent years, the mortality and morbidity associated with HF remains high [3]. Several markers and prognostic models have been studied over the last decades in order to predict which patients are at increased risk of events [4]. Among these risk markers, biomarkers, elements detectable in analytical samples, stand out. Their prognostic and diagnostic role has been analysed in the cardiovascular field, and also specifically in the field of HF [5]. Markers have been described at the neurohormonal level, inflammatory mediators, cell damage, etc., with natriuretic peptides standing out in particular. They have been fully implemented in clinical practice, playing a prognostic role, guiding treatment, or even in the very definition of HF [6]. In recent years, new biomarkers(related to inflammation, oxidative stress, tissue damage, renal function, etc.) have been sought to provide new advances in the management of patients with HF. To date, these new biomarkers have not been successfully used in routine clinical practice [7]. However, some of them such as soluble Suppression of Tumorigenicity 2 (sST2), Growth Differentiation Factor-15 (GDF-15), soluble urokinase Plasminogen Activator Receptor (suPAR), Fatty Acid Binding Protein 4 (FABP4), or mineral metabolism (MM) biomarkers (Fibroblast Growth Factor 23 (FGF23), klotho, phosphorus (P), parathyroid hormone (PTH ), or 1-25-dihydroxyvitamin D (calcidiol) have shown promising results in relation to the diagnosis and prognosis of HF.
The aim of our study was to analyse the prognostic role of these new biomarkers in HF with reduced ejection fraction (HFrEF), in the setting of discharge after admission for acute heart failure, assessing and comparing the prognostic power of these biomarkers and their associations, as well as their added value to natriuretic peptides.
2. Results
2.1. Baseline characteristics of patients
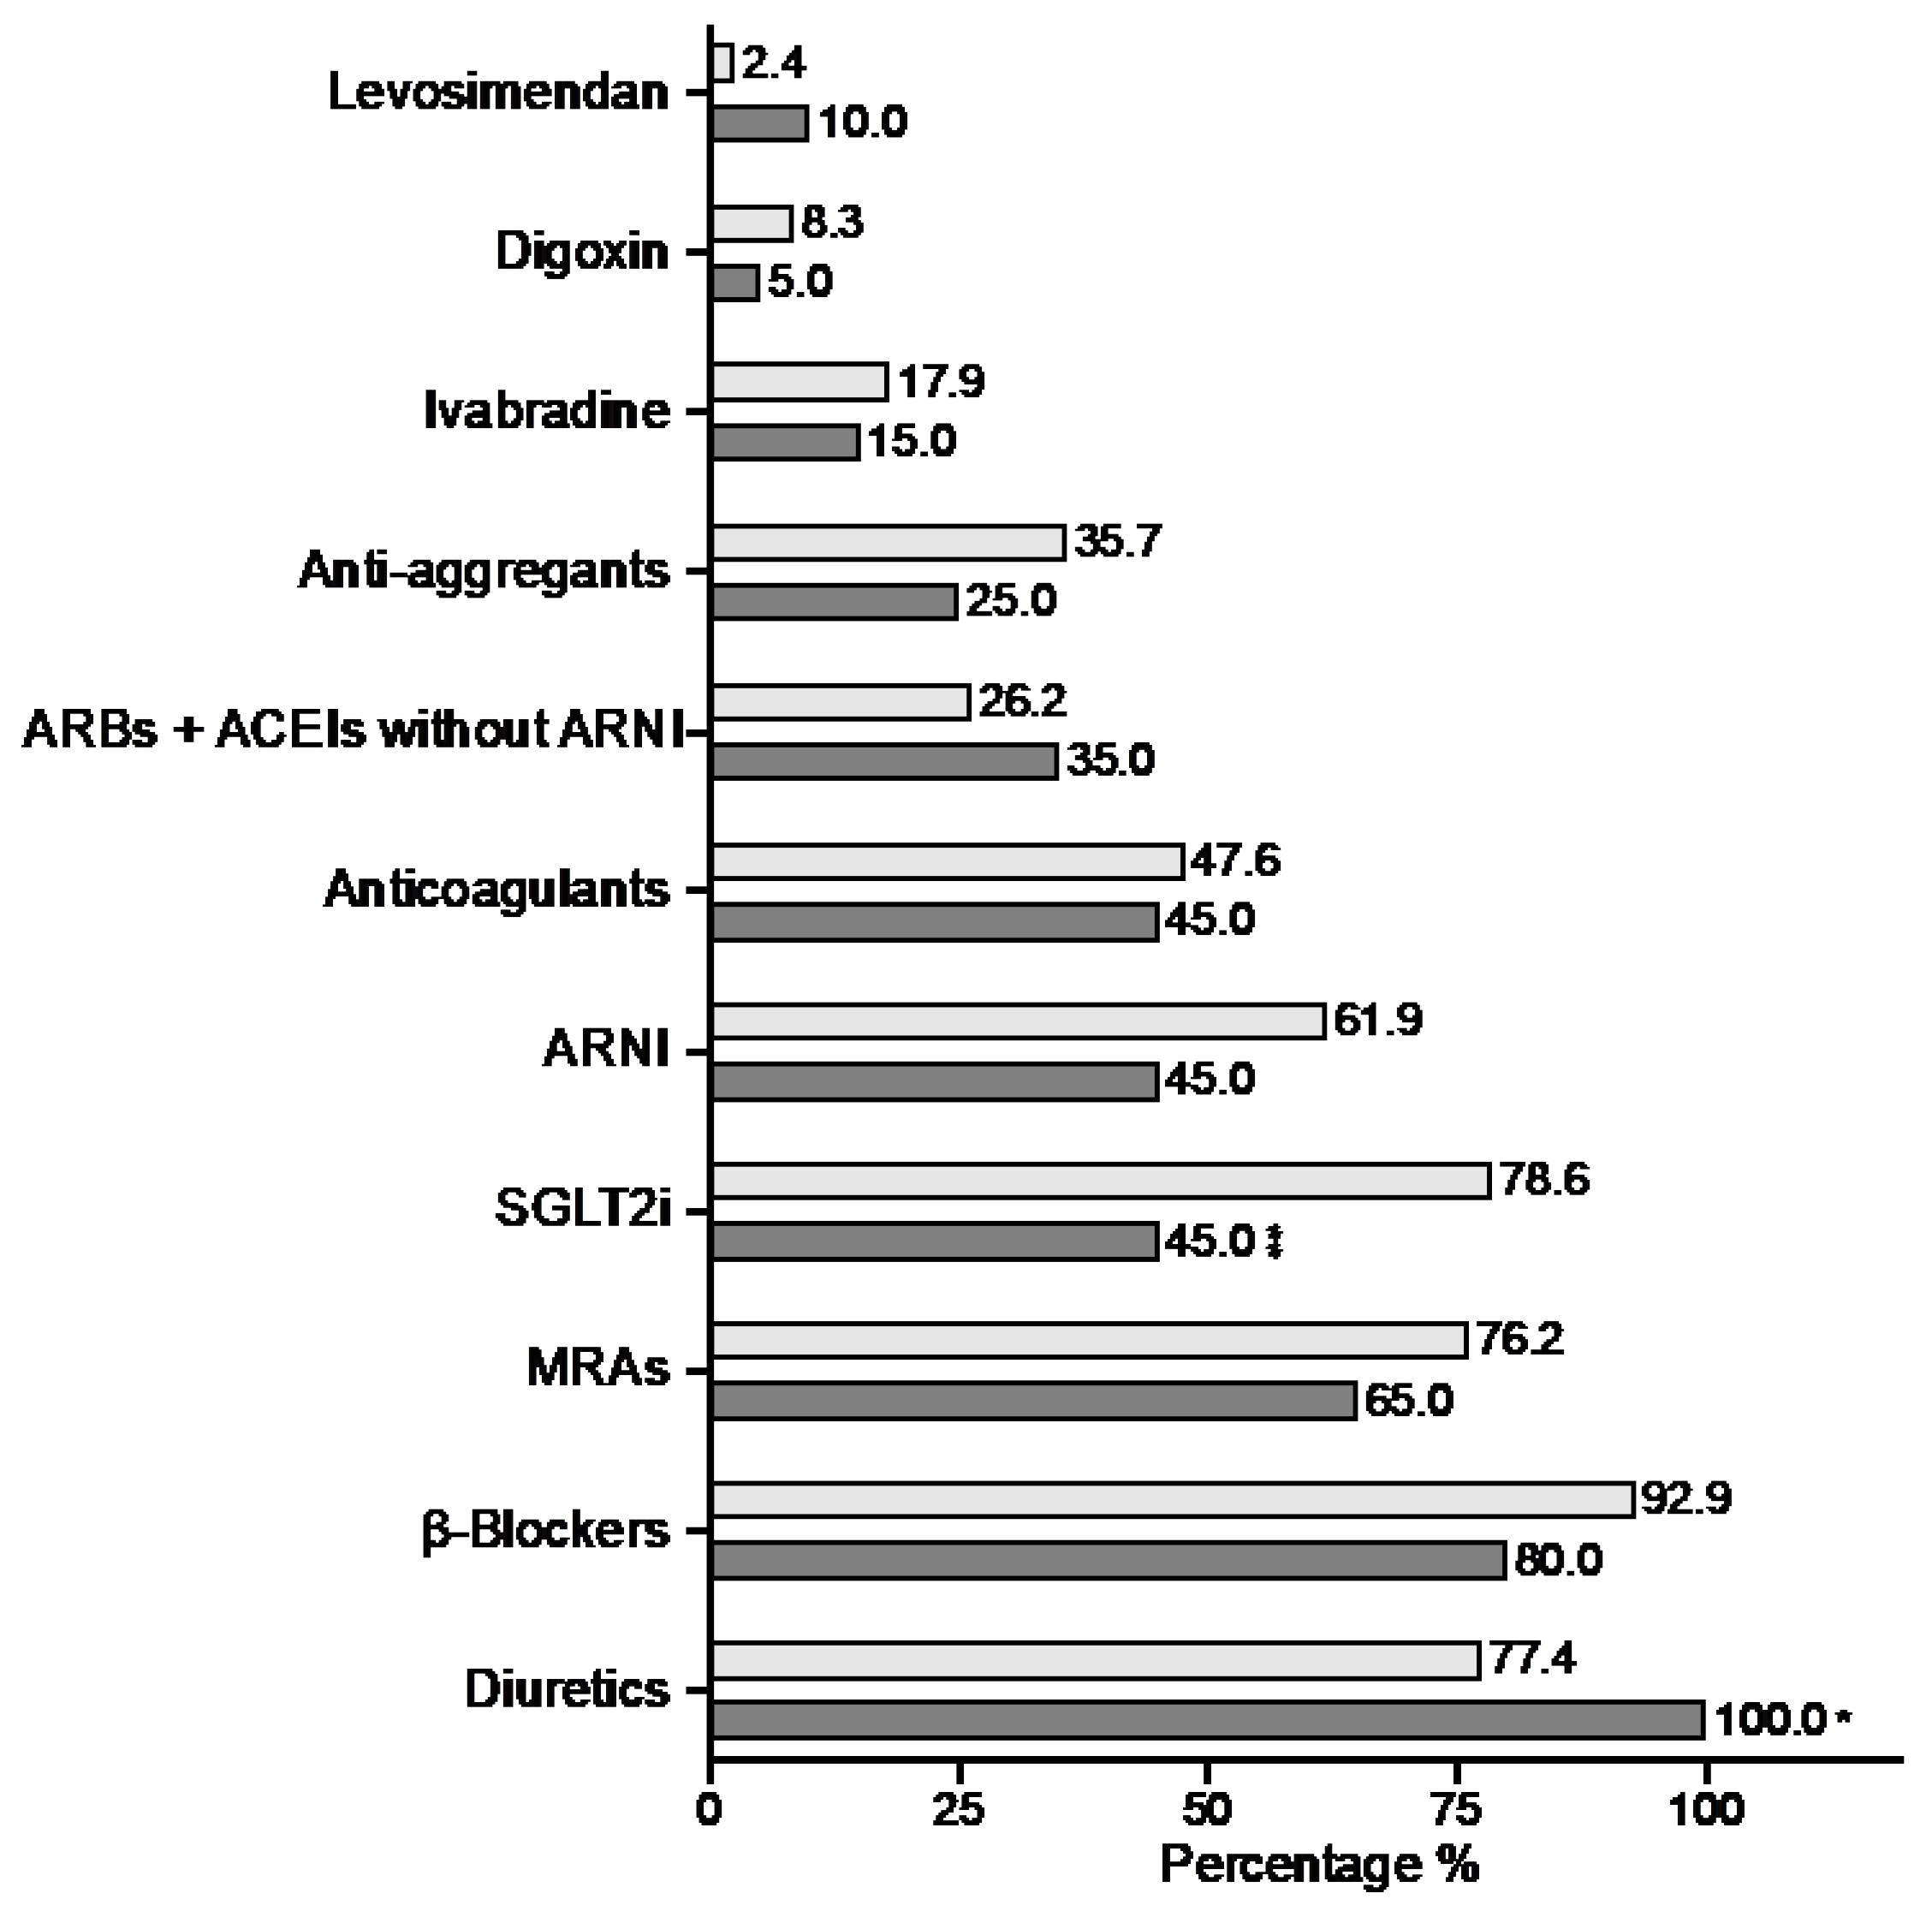
We included 104 patients in our study (Figure 1). The median age of our population was 66.7 years, with a majority of male patients (78.8%). The percentage of patients with comorbidities was relatively high. Thus, 29.8% had chronic lung disease (COPD, asthma, OSA), 31.7% had chronic kidney disease, 10.6% had a history of stroke, and30.8% of patients were in atrial fibrillation at inclusion. The percentage of diabetics in our population reached almost 50%, with more than 66% hypertensive. In 31% of the study population, the main underlying cause of LV systolic dysfunction was ischaemic heart disease, with 27.9% of patients having a history of previous STEMI. After hospital discharge, patients were followed up in the HFU according to the study protocol, achieving treatment rates with BB greater than 90%, ARBS-ACEIS-ARNI 87%, MRAs 74%, and SGLT2i 72.1%.
Following the described methodology, we analysed plasma samples obtained fromour study population at admission. Table 1 shows the results of the main biochemical blood parameters (renal function, iron profile, haemogram...) in our population. It also shows the results of the wide range of biomarkers determined in our study: the most classical ones (CK-MB, NT-proBNP, TnI), as well as a wide representation of new biomarkers (mineral metabolism biomarkers, GDF-15, sST2, suPAR, etc.).
Figure 1.
Baseline characteristics: clinical and treatment. Comparison according to all-cause mortality.
Figure 1.
Baseline characteristics: clinical and treatment. Comparison according to all-cause mortality.

| All-cause death | ||||
| Total | No | Yes | p-Value | |
| (n= 104) | (n= 84) | (n= 20) | ||
| Anthropometric parameters | ||||
| Age (years) | 66.7 (18.3) | 65.5 (16.1) | 76.6 (13.5) | 0.009 |
| Male [n (%)] | 82 (78.8) | 66 (78.6) | 16 (80) | 0.888 |
| Obesity [n (%)] | 39 (37.5) | 34 (40.5) | 5 (25) | 0.199 |
| Risk factors and comorbidities | ||||
| Stroke [n (%)] | 11 (10.6) | 9 (10.7) | 2 (10) | 0.926 |
| Peripheral vascular disease [n (%)] | 9 (8.7) | 7 (8.3) | 2 (10) | 0.683 |
| CPD [n (%)] | 31 (29.8) | 23 (27.4) | 8 (40) | 0.268 |
| CKD [n (%)] | 33 (31.7) | 22 (26.3) | 11 (55) | 0.013 |
| Cancer [n (%)] | 15 (14.4) | 9 (10.7) | 6 (30) | 0.038 |
| STEMI [n (%)] | 29 (27.9) | 24 (28.6) | 5 (25) | 0.749 |
| LVEF (%) | 20 (15) | 20 (15) | 20 (10) | 0.936 |
| Atrial fibrillation [n (%)] | 32 (30.8) | 26 (31.1) | 6 (30) | 0.934 |
| NYHA III-IV [n (%)] | 13 (12.5) | 3 (3.6) | 10 (50) | <0.001 |
| HF [n (%)] | 46 (44.2) | 31 (36.9) | 15 (75) | 0.002 |
| Prior coronary revasc. [n (%)] | 21 (20.2) | 18 (21.4) | 3 (15) | 0.520 |
| Smoking [n (%)] | 37 (35.6) | 30 (35.7) | 7 (35) | 0.952 |
| Diabetes [n (%)] | 49 (47.1) | 41 (48.8) | 8 (40) | 0.448 |
| Hypertension [n (%)] | 69 (66.3) | 56 (66.7) | 13 (65) | 0.887 |
| Dyslipidemia [n (%)] | 58 (55.8) | 47 (56) | 11 (55) | 0.939 |
* ACEI: angiotensin converting enzyme inhibitor; ARB: angiotensin receptor blocker; ARNI: angiotensin receptor/neprilysin inhibitor;CPD:Chronic pulmonary disease; CKD: chronic kidney disease;HF: admission for heart failure prior to inclusion; LVEF: left ventricular ejection fraction; MRAs: mineralocorticoid receptor antagonists;SLGT2i: sodium-glucose co-transporter-2 inhibitors; STEMI: ST-elevation myocardial infarction.Bold p-values and asterisk indicate statistical significance.
2.2. Association of biomarkers and all-cause death
After a median follow-up of 23.5 months, 20 deaths were recorded in our population. Seven of these deaths were of cardiac origin (including 3 sudden deaths). In up to 8 cases death was due to a non-cardiac cause. In the remaining 5 patients the origin of death could not be determined. Table 1 and Figure 1 show comparatively different variables (clinical, treatment and biochemical parameters) with respect to all-cause mortality. Variables such as age, CKD, previous cancer, previous admissions for HF or advanced functional class were associated with higher mortality in the univariate study. Treatment with SGLT2i was shown to be a protective factor, with a significantly lower rate of use in patients who died. In terms of biochemical parameters, glomerular filtration rate and haemoglobin were associated with total mortality, as expected. As for biomarkers, several of them were associated with worse prognosis in our study population. Higher levels of C-reactive protein, NT-proBNP, GDF-15, sST2 and suPAR were associated with an increased risk of mortality. Regarding biomarkers of mineral metabolism, FGF-23 was also associated with an increased risk of all-cause mortality, with a borderline significant relationship with calcium.
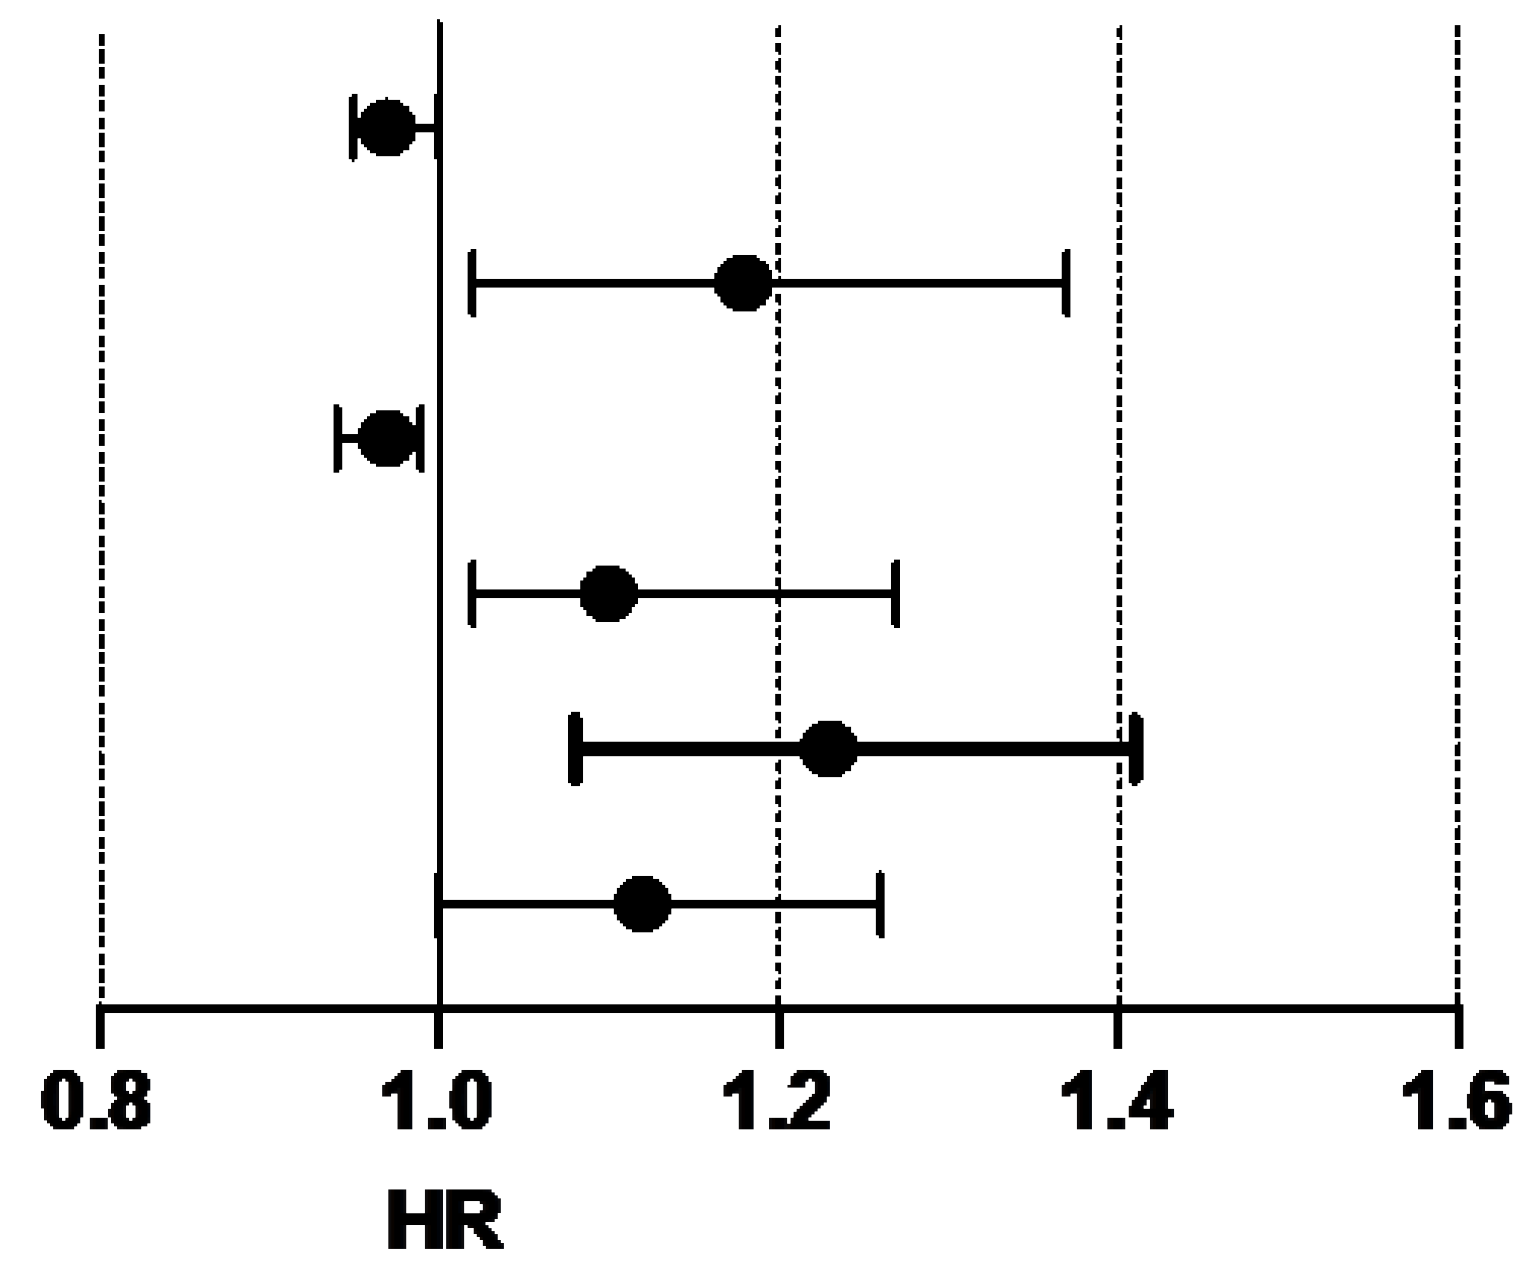
As described in the methodology, wedesigned multivariable predictive models for all-cause mortality considering for the selection of variables those that showed a C index 0.7 in the univariable Cox regression analysis (Figure 2). Following this methodology, we found 3 variables with adequate predictive power: glomerular filtration rate, GDF-15, and sST2. These three variables showed greater predictive power than the rest of the clinical and biochemical variables. We used these 3 variables to generate different predictive models of mortality by combining them. In this way, three predictive models could be generated. The model combining GDF-12 and sST2 showed adequate predictive power (C-index 0.744), although the most powerful model resulted from the combination of sST2 and estimated glomerular filtration rate. Figure 3 shows comparatively the different predictive models for mortality obtained in our analysis.
Figure 2.
All-cause mortality: Univariate Cox regression analysis (statistically significant variables).
Figure 2.
All-cause mortality: Univariate Cox regression analysis (statistically significant variables).
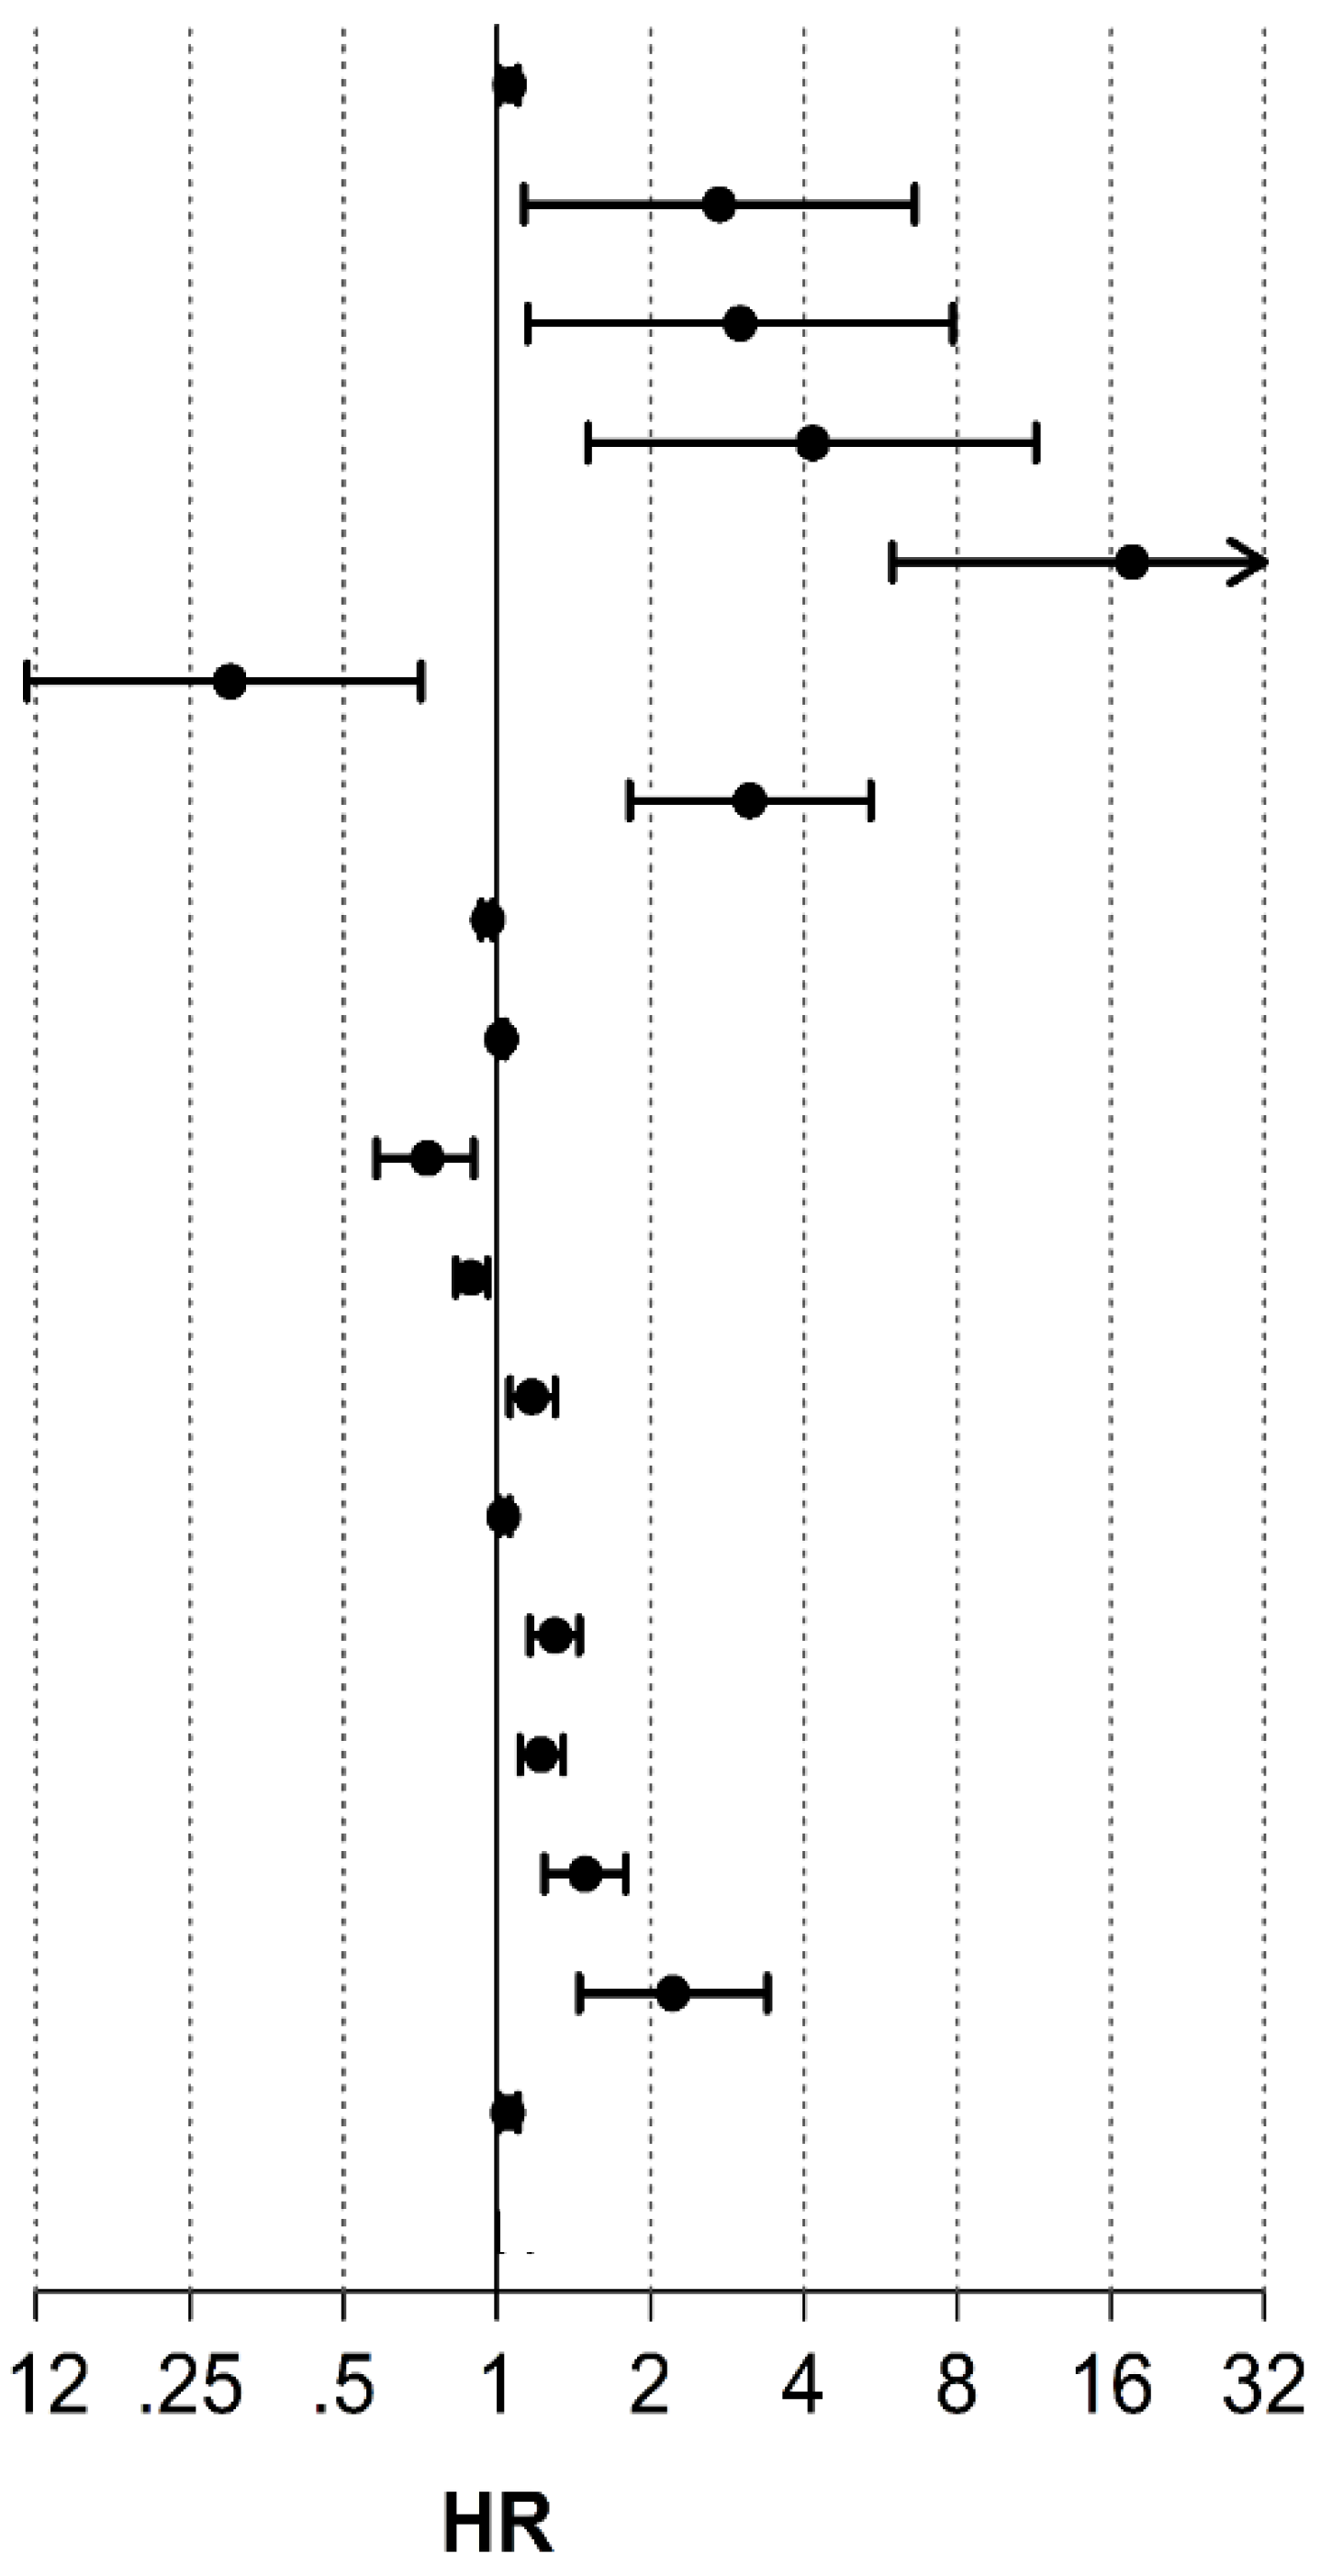
Figure 3.
All-cause mortality: Multivariate Cox regression analysis and predictive models.
| All-cause death | ||||
| HR | (95% CI) | p-Value | C-index | |
| Age (years) | 1.07 | 1.01-1.10 | 0.012 | 0.63 |
| CKD [n (%)] | 2.73 | 1.13-6.60 | 0.025 | 0.41 |
| Cancer [n (%)] | 3 | 1.15-7.83 | 0.025 | 0.29 |
| HF [n (%)] | 4.2 | 1.51-11.45 | 0.006 | 0.52 |
| NYHA III-IV [n (%)] | 9.62 | 3.97-23.408 | <0.001 | 0.048 |
| SGLT2i [n (%)] | 0.3 | 0.12-0.71 | 0.007 | 0.45 |
| Creatinine (mg/dL) | 3.13 | 1.82-5.4 | <0.001 | 0.66 |
| eGFR (mL/min/1.73 m2) | 0.96 | 0.93-0.98 | <0.001 | 0.7 |
| BUN (mg/dL) | 1.02 | 1.01-1.04 | 0.007 | 0.65 |
| HB(g/dL) | 0.73 | 0.58-0.90 | 0.004 | 0.66 |
| Hct (%) | 0.89 | 0.83-0.96 | 0.002 | 0.66 |
| CRP (mg/L) | 1.17 | 1.06-1.30 | 0.003 | 0.6 |
| NT-ProBNP (pg/mL) | 1.03 | 1.01-1.06 | 0.010 | 0.54 |
| GDF-15 (ng/mL) | 1.3 | 1.16-1.45 | <0.001 | 0.7 |
| sST2 (x10 ng/mL) | 1.2 | 1.11-1.35 | <0.001 | 0.7 |
| suPAR (ng/mL) | 1.49 | 1.24-1.79 | <0.001 | 0.65 |
| FGF-23 (x103 RU/mL) | 2.2 | 1.45-3.39 | <0.001 | 0.56 |
| NT-ProANP (ng/mL) | 1.05 | 1.01-1.10 | 0.024 | 0.57 |
* eGFR: estimated glomerular filtration rate; FGF23: Fibroblast Growth Factor 23; GDF-15: Growth Differentiation Factor-15; HB: haemoglobin; HF: admission for heart failure prior to inclusion; Hct: haematocrit; CRP: C-reactive protein; NT-ProANP: N-terminal Proatrial Natriuretic Peptide; NT-ProBNP: N-terminal Probrain Natriuretic Peptide; sST2: soluble Suppression of Tumorigenicity 2; suPAR: soluble urokinase Plasminogen Activator Receptor.
| All-cause death | ||||
| HR | (95% CI) | p-Value | C-index | |
| eGFR (mL/min/1.73 m2) | 0.97 | 0.95-1.00 | 0.069 | 0.727 |
| GDF-15(ng/mL) | 1.18 | 1.02-1.37 | 0.031 | |
| eGFR (mL/min/1.73 m2) | 0.97 | 0.94-0.99 | 0.009 | 0.758 |
| sST2 (x10 ng/mL) | 1.1 | 1.02-1.27 | 0.020 | |
| GDF-15(ng/mL) | 1.23 | 1.08-1.41 | 0.002 | 0.744 |
| sST2 (x10 ng/mL) | 1.12 | 1-1.26 | 0.051 | |
* eGFR: estimated glomerular filtration rate; GDF-15: Growth Differentiation Factor-15; sST2: soluble Suppression of Tumorigenicity 2. Bold p-values indicate statistical significance.
2.3. Hospital Readmissionsfor Heart Failure
At the end of the follow-up period of our study population, there were 21 patients with HF readmissions. After univariate survival analysis using Cox regression, biomarkers such GDF-15, suPAR, calcidiol and FGF23 were associated with readmissions. Other variables such as advanced NYHA functional class (NYHA III or IV), HF admissions prior to study inclusion, or previous history of coronary revascularisation were significantly associated also with HF readmissions. However, none of these variables achieved sufficient predictive ability according to the statistical methodology described, with a C-index in all cases of less than 0.7. Tables 2 to 4 show the results of the statistical analyses of our study population with respect to readmissions for heart failure.
Table 2.
Baseline characteristics: clinical and treatment. Comparison according to heart failure readmission.
Table 2.
Baseline characteristics: clinical and treatment. Comparison according to heart failure readmission.
| Heart Failure readmission | ||||
| Total | No | Yes | p-Value | |
| (n= 104) | (n= 83) | (n= 21) | ||
| Anthropometric parameters | ||||
| Age (years) | 66.7 (18.3) | 66.7(20.1) | 64.8 (12.14) | 0.310 |
| Male [n (%)] | 82 (78.8) | 66 (79.5) | 16 (76.2) | 0.739 |
| Obesit [n (%)] | 39 (37.5) | 30 (36.1) | 9 (42.9) | 0.570 |
| Risk factors and comorbidities | ||||
| Stroke [n (%)] | 11 (10.6) | 8 (9.6) | 3 (14.3) | 0.691 |
| Peripheral vasc dis.[n (%)] | 9 (8.7) | 6 (7.2) | 3 (14.3) | 0.381 |
| COPD [n (%)] | 31 (29.8) | 22 (26.5) | 9 (42.9) | 0.183 |
| CKD [n (%)] | 33 (31.7) | 23 (27.7) | 10 (47.6) | 0.080 |
| Cancer [n (%)] | 15 (14.4) | 14 (16.9) | 1 (4.8) | 0.295 |
| STEMI [n (%)] | 29 (27.9) | 20 (24.1) | 9 (42.9) | 0.087 |
| LVEF (%) | 20 (15) | 20 (15) | 20 (10) | 0.953 |
| Atrial fibrillation [n (%)] | 32 (30.8) | 23 (27.7) | 9 (42.9) | 0.179 |
| NYHA III-IV [n (%)] | 13 (12.5) | 4 (4.8) | 9 (42.9) | <0.001 |
| HF [n (%)] | 46 (44.2) | 29 (34.9) | 17 (81) | <0.001 |
| Prior coronary revasc. [n (%)] | 21 (20.2) | 12 (14.5) | 9 (42.9) | 0.012 |
| Smoking [n (%)] | 37 (35.6) | 28 (33.7) | 9 (42.9) | 0.435 |
| Diabetes [n (%)] | 49 (47.1) | 39 (47) | 10 (47.6) | 0.959 |
| Hypertension [n (%)] | 69 (66.3) | 55 (66.3) | 14 (66.7) | 0.972 |
| Dyslipidemia [n (%)] | 58 (55.8) | 49 (59) | 9 (42.9) | 0.182 |
| Pharmacology | ||||
| Anticoagulants [n (%)] | 49 (47.1) | 36 (43.4) | 13 (61.9) | 0.129 |
| Anti-aggregants [n (%)] | 35 (33.7) | 28 (33.7) | 7 (33.3) | 0.972 |
| MRAs [n (%)] | 77 (74) | 61 (73.5) | 16 (76.2) | 0.801 |
| SGLT2i [n (%)] | 75 (72.1) | 62 (74.7) | 13 (61.9) | 0.243 |
| ARBs + ACEIs without ARNI | 29 (27.9) | 25 (30.1) | 4 (19) | 0.312 |
| β-Blockers [n (%)] | 94 (90.4) | 75 (90.4) | 19 (90.5) | 0.987 |
| Diuretics [n (%)] | 85 (81.7) | 66 (79.5) | 19 (90.5) | 0.350 |
| Digoxin [n (%)] | 8 (7.7) | 7 (8.4) | 1 (4.8) | 0.573 |
| Ivabradine [n (%)] | 18 (17.3) | 16 (19.3) | 2 (9.5) | 0.518 |
| Levosimendan [n (%)] | 4 (3.8) | 2 (2.4) | 2 (9.5) | 0.181 |
| ARNI [n (%)] | 61 (58.7) | 51 (61.4) | 10 (47.6) | 0.250 |
* ACEI: angiotensin converting enzyme inhibitor; ARB: angiotensin receptor blocker; ARNI: angiotensin receptor/neprilysin inhibitor; CPD:Chronic pulmonary disease; CKD: chronic kidney disease; HF: admission for heart failure prior to inclusion; LVEF: left ventricular ejection fraction; MRAs: mineralocorticoid receptor antagonists; SLGT2i:sodium-glucose co-transporter-2 inhibitors; STEMI: ST-elevation myocardial infarction. Bold p-values indicate statistical significance.
Table 3.
Baseline characteristics: biochemical analysis. Comparison according to heart failure readmission.
Table 3.
Baseline characteristics: biochemical analysis. Comparison according to heart failure readmission.
| HF readmission | ||||
| Total | No | Yes | p-Value | |
| (n= 104) | (n= 83) | (n= 21) | ||
| Biochemestry | ||||
| Glucose (mg/dL) | 113 (45) | 113 (35) | 99 (73) | 0.489 |
| Creatinine (mg/dL) | 1.1 (0.6) | 1.1 (0.49) | 1.2 (0.64) | 0.047 |
| eGFR (mL/min/1.73 m2) | 66.9 (38) | 68 (35.9) | 54 (37.83) | 0.111 |
| BUN (mg/dL) | 25 (16) | 25 (15) | 29 (19) | 0.395 |
| Serum iron level (µg/dL) | 54 (37.8) | 54 (41.5) | 47 (28) | 0.672 |
| Ferritin (ng/mL) | 147.4 (220) | 137.6 (265) | 127 (143) | 0.101 |
| HB (g/dL) | 13.6 (3.6) | 13.7 (3.3) | 13 (4.05) | 0.709 |
| Hct (%) | 41.9 (9.4) | 42.5 (8.9) | 40 (12.8) | 0.755 |
| ProteinBiomarkers | ||||
| CRP (mg/L) | 0.96 (2.4) | 0.92 (2.64) | 0.99 (2.08) | 0.288 |
| TnI (ng/mL) | 0.04 (0.1) | 0.04 (0.07) | 0.05 (0.1) | 0.893 |
| CK-MB (ng/mL) | 1.1 (0.7) | 1.01 (0.75) | 1.05 (0.87) | 0.929 |
| NT-proBNP (pg/mL) | 6.4 (10.7) | 7.61 (10.96) | 5.08 (5.35) | 0.195 |
| NT-proANP (ng/mL) | 29.7 (10) | 29.69 (9.84) | 28.57 (13.71) | 0.442 |
| GDF-15 (ng/mL) | 3.1 (2.4) | 3 (2.25) | 4.04 (3.23) | 0.072 |
| sST2 (x10 ng/mL) | 3.53 (3.5) | 3.37 (3.05) | 3.98 (3.86) | 0.229 |
| uPAR (ng/mL) | 2.9 (1.5) | 2.8 (1.41) | 3.18 (1.4) | 0.093 |
| FABP4 (ng/mL) | 44.21 (32.6) | 44.36 (33.99) | 52.95 (29.17) | 0.574 |
| MM Biomarkers | ||||
| PTH (pg/mL) | 71 (49.5) | 71 (54) | 71 (55) | 0.156 |
| Calcium (mg/dL) | 9.4 (0.8) | 9.4 (0.95) | 9.5 (0.95) | 0.810 |
| Phosphorus (mg/dL) | 3.7 (1) | 3.6 (1) | 3.9 (1.05) | 0.305 |
| 25(OH)D (ng/mL) | 24.5 (27.2) | 23 (21.3) | 34 (36) | 0.211 |
| FGF-23 (x103 RU/mL) | 0.36 (0.5) | 0.32 (0.36) | 0.71(1.58) | 0.104 |
| Klotho (pg/mL) | 458.5 (242) | 452 (230) | 529 (278) | 0.135 |
* 25(OH)D: 1-25-dihydroxyvitamin D; eGFR: estimated glomerular filtration rate; FABP4: Fatty Acid Binding Protein 4; FGF23: Fibroblast Growth Factor 23; GDF-15: Growth Differentiation Factor-15; HB: haemoglobin; Hct: haematocrit; CK-MB: creatine kinase-MB; CRP: C-reactive protein; NT-ProANP: N-terminal Proatrial Natriuretic Peptide; NT-ProBNP: N-terminal Probrain Natriuretic Peptide; PTH: parathormone; sST2: soluble Suppression of Tumorigenicity 2; TnI: troponin I; suPAR: soluble urokinase Plasminogen Activator Receptor. Bold p-values indicate statistical significance.
Table 4.
Heart failure readmission: Univariate Cox regression analysis (statistically significant variables).
Table 4.
Heart failure readmission: Univariate Cox regression analysis (statistically significant variables).
| All-cause death | ||||
|---|---|---|---|---|
| HR | (95% CI) | p-Value | C-index | |
| Creatinine (mg/dL) | 2.20 | 1.14-4.22 | 0.018 | 0.58 |
| GDF-15 (ng/mL) | 1.22 | 1.07-1.38 | 0.003 | 0.59 |
| suPAR (ng/mL) | 1.41 | 1.12-1.77 | 0.003 | 0.60 |
| Calcidiol (ng/mL) | 1.02 | 1.01-1.04 | 0.006 | 0.53 |
| FGF-23 (x103 RU/mL) | 2.12 | 1.36-3.33 | 0.001 | 0.53 |
| CKD [n (%)] | 2.40 | 1.02-5.67 | 0.046 | 0.37 |
| HF [n (%)] | 7.38 | 2.47-22.0 | <0.001 | 0.56 |
| NYHA III-IV [n (%)] | 12.0 | 4.58-31.3 | <0.001 | 0.51 |
| Prior coronary revasc. [n (%)] | 3.43 | 1.44-8.15 | 0.005 | 0.40 |
* CKD: chronic kidney disease; FGF-23: Fibroblast Growth Factor 23; GDF-15: Growth Differentiation Factor-15; HF: admission for heart failure prior to inclusion; suPAR: soluble urokinase Plasminogen Activator Receptor.
3. Discussion
HF is a clinical syndrome of marked relevance today, with a high prevalence and incidence [6,8,9]. Mortality and morbidity associated with HF remain significant, with a mortality rate of around 8% per year and a one-year hospitalization rate of over 28% according to some registries [10]. Properly identifying those patients with the worst prognosis allow us to select patients with the greatest care needs, allowing us to carry out a more rational management of health system resources. In this regard, several prognostic markers and models have been evaluated in recent decades within HFrEF [4]. Among these risk markers arebiomarkers. The prognostic and diagnostic role of these biomarkers has been analysed in different cardiovascular diseases, also specifically in the field of HF [5,11]. The most widely used in routine clinical practice are natriuretic peptides, having shown utility in the diagnosis, risk stratification, and clinical follow-up of patients with HF[12,13]. However, natriuretic peptides have some limitations. Their blood levels are influenced by several factors, like age, renal failure, hypertrophy or obesity [14,15]. Moreover, natriuretic peptides are produced almost exclusively in the heart, in response to increased end-diastolic wall stress in the left ventricle [16], so their blood levels are determined solely by this condition. Nevertheless, HF is a much more complex clinical syndrome, with diverse aetiologies and pathophysiological mechanisms involved, including inflammatory and immunomodulatory processes not measurable by natriuretic peptides [17,18]. For these and other reasons, in recent years several studies have evaluated the role of new biomarkers that may add diagnostic and prognostic value to natriuretic peptides [7]. In our work, we have collected some of these promising new biomarkers and analysed their prognostic role in the setting of discharge after admission forHFrEF. Our analysis shows a significant relationship of NT-proBNPwith mortality, but also other biomarkers such as CRP, GDF-15, sST2, suPAR, or FGF-23. Moreover, the predictive power of sST2 and GDF-15 was superior to other biomarkers (including natriuretic peptides), leading to more powerful predictive models (in association with estimated glomerular filtration rate).
GDF-15 and sST2 are biomarkers belonging to the TGF-β,and interleukin-1 receptor families respectively [19,20]. In situations of myocardial stress or cellular overload, they are highly expressed in cardiomyocytes, but also in other cell types. In addition,theyare also associated with different pathophysiological conditions such as oxidative stress, hypoxia, tissue injuryand inflammatory and immune processes [21,22,23]. Several publications have shown a prognostic relationship of these biomarkers with cardiovascular disease [24,25,26,27,28,29], and specifically with HF. In this setting, increased levels of GDG-15 have been found in patients with HF [30], as well as an increased risk of developing HF [31]. Several studies have shown a worse prognosis in patients with chronic stable HFrEF and elevated levels of GDF-15or sST2[32,33,34,35,36,37,38,39,40], even witha stronger prognostic power than other more traditional variables, including natriuretic peptides [41]. However, In the setting of acute HF in patients with HFrEF, the evidence is scarce. Although several studies have been published showing a prognostic value of these biomarkers in acute HF, most of them are based on a very heterogeneous population, analyzing HFpEF and HFrEF together, or not differentiating both entities [23,42,48], or with HFrEF criteria different from current recommendations [49]. In contrast to these publications, wefocused on a specific and homogeneus population of patients with decompensated HFrEF, providing a greater robustness to our results in relation to this subgroup of patients. This subgroup has a particularly poor prognosis, as demonstrated by the high mortality in our study group. Our results show an important prognostic role of GDF-15 and sST2, allowing the identification of those patients with a higher risk and facilitating a better allocation of resources.
We also analysed other biomarkers that in recent years have been related to cardiovascular disease, such as suPAR, FABP4 and MM biomarkers (P, PTH, vitamin D, FGF-23, klotho). In this setting, changes in the different components of the MMcascade have been associated with cardiac alterations (functional and structural) and heart diseases, playing a prognostic role even the general population and incertain CVD [50,51,52,53,54,55]. Specifically, alterations of several MM biomarkershave been associated with an increased incidence of HF[56,57,58,59,60,61,62,63,64], as with suPAR [65], and FABP4 [66]. Some ofthese biomarkers have demonstrated a prognostic role in HF,including in HFrEF [67,68,69,70,71,72,73]. However, there is little or no data on the prognostic role of these biomarkers in acute HF, and generally without differentiating HFrEF and HFpEF [74,75]. In our study population of patients with acute HFrEF, only FGF-23 and suPAR showed a statistically significant relationship with prognosis, losing its significance in multivariate analysis. It is possible that a larger study population could change our results regarding these biomarkers.
In summary, results such as those obtained in our population of patients with decompensated HFrEF, together with those published by other authors in other populations of patients with HF, support the prognostic utility of these new biomarkers (specifically sST2 and GDF-15). HF is a complex clinical syndrome, with various pathophysiological mechanisms involved that are reflected in these new biomarkers (immune processes, inflammation,tissue injury etc.). Their use could provide additional prognostic information improving the prognostic assessment of our patients with HF.
4. Materials and Methods
4.1. Patients and Study Design
We carried out a single-centre, observational prospective study. Between July 2019 and March 2023, patients admitted to our centre with a principal diagnosis of decompensated HFrEF were consecutively included. Inclusion criteria were as follows: 1) diagnosis prior to or during admission of HFrEF, according to the 2021 recommendations of the European Society of Cardiology (symptoms and signs of HF, and LVEF <40%) [6]; 2) HF as the main cause for admission; and 3) referral at discharge to the HF Unit (HFU) of our centre for follow-up. Exclusion criteria for the study, as well as for follow-up of patients in the HFU were: a) HFrEF due to heart disease potentially reversible with cardiac surgery or programmed short-term intervention (revascularization, surgical valve replacement-repair, percutaneous aortic prosthesis implantation, mitral valvuloplasty, etc.); b) non-cardiac end-stage disease with life expectancy of less than 6 months; c) decompensation of HF secondary to non-cardiac cause; and d) patients expected to be unable to follow the protocol.
During admission, several clinical and demographic variables were collected from the included patients. After patients gave their consent to be included in the study, blood samples were drawn after 12 h of fasting. Blood sampling was performed as soon as possible after the patient's admission date. These venous blood samples were collected in tubes with and without EDTA, and were centrifuged at 2500 g for 10 minutes. The obtained plasma samples were stored in 2 ml cryovials at -80°C. After hospital discharge, all patients were referred to the HFU of our hospital and included in the specific follow-up programme of this unit. This programme included follow-up visits by both physicians and specialised nurses, with early visits after discharge, as well as repeated medical check-ups throughout the follow-up, according to the patient's needs. During this follow-up, patients were clinically assessed, medical treatment was optimised and specific patient education activities, among other actions, were carried out. During patient follow-up in the HFU, several clinical and follow-up variables were collected for further analysis.
This investigation was carried out in accordance with the principles outlined in the Declaration of Helsinki. A written informed consent was obtained from all participants. Moreover, the study design and protocol have been approved by the Clinical Research Ethics Committee of our institution (Ref. PIC157-18_FJD).
4.2. Clinical Outcomes
The outcomes analysed in our study were the rate of all-cause death and admissiondue to HF. HF admission was defined as admission to a healthcare facility lasting > 24 h dueto the worsening of HF symptoms and followed by specific treatment for HF (regardless ofthe cause of decompensation). Clinical events and death during follow-up were collected from patients’ electronic health records or, if not available, from telephone interviews with patients or relatives.
4.3. Biochemical Analysis
Serum and plasma samples were collected and stored (at -80 ◦C) during hospital admission (at inclusion of patients in the study). We measuredthe usual blood parameters (complete blood count, lipid profile, kidney function, liver function, etc.). Additionally, we analysed the levels of several specific biomarkers. Plasma concentrations of human GDF-15, sST2, and suPAR were measured using the automated immunoassay system ELLA from Protein Simple (Bio-Techne, Minnesota, USA), following the manufacturer's instructions. The detection kits used were SPCKB-PS-000269 (GDF-15), SPCKB-PS-000221 (sST2), and SPCKB-PS-007370 (suPAR). Each plasma sample was run in triplicate, and the inter-plate coefficient of variation (CV%) was less than 4% in all cases. Also, plasma levels of human NT-ProANP and FABP4 were measured by immunoassay using Quantikine® colorimetric sandwich ELISA kits (ref: DANP00 and DFBP40, respectively) from R&D Systems. The absorbance was set at 450nm with a wavelength correction at 570 nm using a plate reader (EnSpire® Multimode Reader, Perkin Elmer, Waltham, MA, USA). For both assays, the intra-assay CV% was less than 4.5%, and the inter-plate CV was less than 7.5%. Additionally, the creatine kinase-myocardial band (CK-MB) levels were measured by immunoassay using VITROS Immunodiagnostic products (CK-MB reagent pack, ref: 1896836, VITROS Immunodiagnostic, Raritan, NJ, USA) at the Analytical Service of the Fundación Jiménez Díaz. For MM biomarkers, plasma calcidiol levels were quantified by chemiluminescent immunoassay (CLIA) on the LIAISON XL analyzer (LIAISON 25OH-Vitamin D Total Assay, Dia Sorin, Saluggia, Italy). FGF-23 was measured by enzyme-linked immunosorbent assay (ELISA) recognizing epitopes within the carboxyl-terminal portion of FGF23 (Human FGF23, C-Term, Immutopics Inc, San Clemente, CA). Klotho levels were measured by ELISA (Human Soluble Alpha Klotho Assay Kit, Immuno-Biological Laboratories Co., Hokkaido, Japan). Finally, intact PTH was analyzed using a second-generation automated chemiluminescent method (Elecsys 2010 platform, Roche Diagnostics, Mannheim, Germany).
4.4. Statistical Analysis
Qualitative variables were presented as absolute and relative frequencies. Associations between qualitative variables were assessed using the Chi-squared test or Fisher’s exact test. Subsequently, the relative risk (RR) was calculated. On the other hand, quantitative variables were described using medians and interquartile ranges (IQR), and comparisons were performed with the Mann–Whitney U test for independent samples. Subsequently, relationships between variables were explored using both univariable and multivariable Cox regression models. Initially, univariable Cox regression analysis was conducted to identify variables associated with all-cause mortality and HF admissions. For each variable, the hazard ratio with its 95% confidence interval, p-value, and C-statistic (C-Index) were reported, with the latter being derived through the Leave-One-Out Cross-Validation method. This method was employed to select variables generating univariable models with the best predictive capacity (C-index ≥ 0.7) [76]. A multivariable Cox regression analysis was then performed to identify significant predictors. All statistical analyses were conducted using the Statistical Package for the Social Sciences (SPSS v.26.0, IBM, Armonk, NY, USA), the R statistical language version 4.0.5 (R Foundation for Statistical Computing, Vienna, Austria) and the statistical package for the biomedical sciences (MedCalc v.23.0.2, Ostend, Belgium; https://www.medcalc.org).
5. Conclusions
In our population of patients with acute heart failure and HFrEF, GDF-15 and sST2 showed the highest predictive power for all-cause mortality, superior to more established biomarkers (natriuretic peptides). Their use would provide additional prognostic information and could improve the prognostic assessment of our acute HF patients.
Author Contributions
Conceptualization, M.C., M.T.U and O.L.; methodology, M.C., AM.P. and OL; formal analysis, O.L., J.L.C and I.M.; investigation, CS.G.T, MB.A.R., L.M., AM.P, AJ.B, JM.R.O. and JA.E.C; data curation, M.C., O.L. and J.L.C..; writing—original draft preparation, M.C.; writing—review and editing, O.L. and J.T.; supervision, J.T.; funding acquisition, J.T. All authors have read and agreed to the published version of the manuscript
Funding
This research was funded by grants from Carlos III Health Institute (ISCIII) (grant numbers PI20/00923; PI24/00978), Spain’s Ministry of Science and Innovation (grant number RTC2019-006826-1), and Spanish Society of Cardiology.
Institutional Review Board Statement
The study was conducted in accordance with the Declaration of Helsinki, and approved by the Clinical Research Ethics Committee of Hospital Universitario Fundación Jiménez Díaz (protocol codePIC157-18_FJD;date of approval: June 2019).
Informed Consent Statement
Informed consent was obtained from all subjects involved in the study.
Data Availability Statement
Further information and requests for resources and data base should be directed to and will be fulfilled by the corresponding author, Dr.Marcelino Cortés (mcortesg@quironsalud.es). All data reported in this paper will be shared by the corresponding author upon request.
Conflicts of Interest
The authors declare no conflicts of interest. The funders had no role in the design of the study; in the collection, analyses, or interpretation of data; in the writing of the manuscript; or in the decision to publish the results.
Abbreviations
The following abbreviations are used in this manuscript:
| 25(OH)D ACEI ARB ARNI COPD CKD eGFR FABP4 FGF23 GDF-15 HF HFrEF HFU MM MRA OSA P PTH SLGT2i sST2 STEMI suPAR TnI |
1-25-dihydroxyvitamin D Angiotensin Converting Enzyme Inhibitor Angiotensin Receptor Blocker Angiotensin Receptor/Neprilysin Inhibitor Chronic Obstructive Pulmonary Disease Chronic Kidney Disease estimated Glomerular GiltrationRate Fatty Acid Binding Protein 4 Fibroblast Growth Factor 23 Growth Differentiation Factor-15 Heart Failure Heart Failure with reduced ejection fraction Heart Failure Unit Mineral Metabolism Mineralocorticoid Receptor Antagonists Obstructive Sleep Apnea Phosphorus Paratohormone Sodium-Glucose Co-Transporter-2 Inhibitors Soluble Suppression of Tumorigenicity 2 ST elevation myocardial infarction soluble urokinase Plasminogen Activator Receptor. Troponin I |
References
- van Riet, E.E.S.; Hoes, A.W.; Limburg, A.; Landman, M.A.J.; van der Hoeven, H.; Rutten, F.H. Prevalence of unrecognized heart failure in older persons with shortness of breath on exertion. Eur.J.Heart Fail. 2014, 16, 772–777. [Google Scholar] [CrossRef] [PubMed]
- Mosterd, A.; Hoes, A.W. Clinical epidemiology of heart failure. Heart 2007, 93, 1137–1146. [Google Scholar] [CrossRef] [PubMed]
- Rahimi, K.; et al. Risk prediction in patients with heart failure: a systematic review and analysis. JACC.Heart Fail. 2014, 2, 440–446. [Google Scholar] [CrossRef] [PubMed]
- Ouwerkerk, W.; Voors, A.A.; Zwinderman, A.H. Factors influencing the predictive power of models for predicting mortality and/or heart failure hospitalization in patients with heart failure. JACC.Heart Fail. 2014, 2, 429–436. [Google Scholar] [CrossRef]
- Chow, S.L.; et al. Role of Biomarkers for the Prevention, Assessment, and Management of Heart Failure: A Scientific Statement From the American Heart Association. Circulation 2017, 135, e1054–e1091. [Google Scholar] [CrossRef]
- McDonagh, T.A.; et al. 2021 ESC Guidelines for the diagnosis and treatment of acute and chronic heart failure. Eur Heart J 2021, 42, 3599–3726. [Google Scholar] [CrossRef]
- Meijers, W.C.; et al. Circulating heart failure biomarkers beyond natriuretic peptides: review from the Biomarker Study Group of the Heart Failure Association ( HFA ), European Society of Cardiology ( ESC ). European J of Heart Fail 2021, 23, 1610–1632. [Google Scholar] [CrossRef]
- Savarese, G.; et al. Heart Failure Drug Treatment—Inertia, Titration, and Discontinuation. JACC: Heart Failure 2023, 11, 1–14. [Google Scholar] [CrossRef]
- Tsao, C.W.; et al. Heart Disease and Stroke Statistics-2022 Update: A Report From the American Heart Association. Circulation 2022, 145, e153–e639. [Google Scholar] [CrossRef]
- Chioncel, O.; et al. Epidemiology and one-year outcomes in patients with chronic heart failure and preserved, mid-range and reduced ejection fraction: an analysis of the ESC Heart Failure Long-Term Registry. Eur J Heart Fail 2017, 19, 1574–1585. [Google Scholar] [CrossRef]
- Paul, S.; Harshaw-Ellis, K. Evolving Use of Biomarkers in the Management of Heart Failure. Cardiol Rev 2019, 27, 153–159. [Google Scholar] [CrossRef] [PubMed]
- Roberts, E.; et al. The diagnostic accuracy of the natriuretic peptides in heart failure: systematic review and diagnostic meta-analysis in the acute care setting. BMJ 2015, 350, h910. [Google Scholar] [CrossRef] [PubMed]
- Mueller, C.; et al. Heart Failure Association of the European Society of Cardiology practical guidance on the use of natriuretic peptide concentrations. Eur J Heart Fail 2019, 21, 715–731. [Google Scholar] [CrossRef] [PubMed]
- Clerico, A.; Emdin, M. Diagnostic accuracy and prognostic relevance of the measurement of cardiac natriuretic peptides: a review. Clin Chem 2004, 50, 33–50. [Google Scholar] [CrossRef]
- Madamanchi, C.; Alhosaini, H.; Sumida, A.; Runge, M.S. Obesity and natriuretic peptides, BNP and NT-proBNP: mechanisms and diagnostic implications for heart failure. Int J Cardiol 2014, 176, 611–617. [Google Scholar] [CrossRef]
- Maeda, K.; Tsutamoto, T.; Wada, A.; Hisanaga, T.; Kinoshita, M. Plasma brain natriuretic peptide as a biochemical marker of high left ventricular end-diastolic pressure in patients with symptomatic left ventricular dysfunction. Am Heart J 1998, 135, 825–832. [Google Scholar] [CrossRef]
- Adamo, L.; Rocha-Resende, C.; Prabhu, S.D.; Mann, D.L. Reappraising the role of inflammation in heart failure. Nat Rev Cardiol 2020, 17, 269–285. [Google Scholar] [CrossRef]
- Murphy, S.P.; Kakkar, R.; McCarthy, C.P.; Januzzi, J.L. Inflammation in Heart Failure: JACC State-of-the-Art Review. J Am Coll Cardiol 2020, 75, 1324–1340. [Google Scholar] [CrossRef]
- Bootcov, M.R.; et al. MIC-1, a novel macrophage inhibitory cytokine, is a divergent member of the TGF-beta superfamily. Proc Natl Acad Sci U S A 1997, 94, 11514–11519. [Google Scholar] [CrossRef]
- Dale, M.; Nicklin, M.J.H. Interleukin-1 Receptor Cluster: Gene Organization ofIL1R2, IL1R1, IL1RL2(IL-1Rrp2),IL1RL1(T1/ST2), andIL18R1(IL-1Rrp) on Human Chromosome 2q. Genomics 1999, 57, 177–179. [Google Scholar] [CrossRef]
- Rochette, L.; Zeller, M.; Cottin, Y.; Vergely, C. Insights Into Mechanisms of GDF15 and Receptor GFRAL: Therapeutic Targets. Trends Endocrinol Metab 2020, 31, 939–951. [Google Scholar] [CrossRef] [PubMed]
- Sawalha, K.; Norgard, N.B.; Drees, B.M.; López-Candales, A. Growth Differentiation Factor 15 (GDF-15), a New Biomarker in Heart Failure Management. Curr Heart Fail Rep 2023, 20, 287–299. [Google Scholar] [CrossRef] [PubMed]
- Pascual-Figal, D.A.; et al. Soluble ST2, high-sensitivity troponin T- and N-terminal pro-B-type natriuretic peptide: complementary role for risk stratification in acutely decompensated heart failure. Eur J Heart Fail 2011, 13, 718–725. [Google Scholar] [CrossRef] [PubMed]
- Katsioupa, M.; et al. Novel Biomarkers and Their Role in the Diagnosis and Prognosis of Acute Coronary Syndrome. Life (Basel) 2023, 13, 1992. [Google Scholar] [CrossRef]
- Wollert, K.C.; Kempf, T.; Wallentin, L. Growth Differentiation Factor 15 as a Biomarker in Cardiovascular Disease. Clin Chem 2017, 63, 140–151. [Google Scholar] [CrossRef]
- Bonaca, M.P.; et al. Growth differentiation factor-15 and risk of recurrent events in patients stabilized after acute coronary syndrome: observations from PROVE IT-TIMI 22. ArteriosclerThrombVasc Biol 2011, 31, 203–210. [Google Scholar] [CrossRef]
- Li, M.; et al. Growth differentiation factor-15 is associated with cardiovascular outcomes in patients with coronary artery disease. Cardiovasc Diabetol 2020, 19, 120. [Google Scholar] [CrossRef]
- Gohar, A.; et al. Circulating GDF-15 levels predict future secondary manifestations of cardiovascular disease explicitly in women but not men with atherosclerosis. Int J Cardiol 2017, 241, 430–436. [Google Scholar] [CrossRef]
- Schopfer, D.W.; Ku, I.A.; Regan, M.; Whooley, M.A. Growth differentiation factor 15 and cardiovascular events in patients with stable ischemic heart disease (The Heart and Soul Study). Am Heart J 2014, 167, 186–192e1. [Google Scholar] [CrossRef]
- Stahrenberg, R.; et al. The novel biomarker growth differentiation factor 15 in heart failure with normal ejection fraction. Eur J Heart Fail 2010, 12, 1309–1316. [Google Scholar] [CrossRef]
- Fernandez, C.; et al. Circulating protein biomarkers predict incident hypertensive heart failure independently of N-terminal pro-B-type natriuretic peptide levels. ESC Heart Fail 2020, 7, 1891–1899. [Google Scholar] [CrossRef] [PubMed]
- Kuster, N.; et al. Multimarker approach including CRP, sST2 and GDF-15 for prognostic stratification in stable heart failure. ESC Heart Fail 2020, 7, 2230–2239. [Google Scholar] [CrossRef] [PubMed]
- Benes, J.; et al. The Role of GDF-15 in Heart Failure Patients With Chronic Kidney Disease. Can J Cardiol 2019, 35, 462–470. [Google Scholar] [CrossRef] [PubMed]
- Bouabdallaoui, N.; et al. Growth differentiation factor-15 is not modified by sacubitril/valsartan and is an independent marker of risk in patients with heart failure and reduced ejection fraction: the PARADIGM-HF trial. Eur J Heart Fail 2018, 20, 1701–1709. [Google Scholar] [CrossRef]
- Stojkovic, S.; et al. GDF-15 is a better complimentary marker for risk stratification of arrhythmic death in non-ischaemic, dilated cardiomyopathy than soluble ST2. J Cell Mol Med 2018, 22, 2422–2429. [Google Scholar] [CrossRef]
- Weinberg, E.O.; Shimpo, M.; Hurwitz, S.; Tominaga, S.; Rouleau, J.-L.; Lee, R.T. Identification of serum soluble ST2 receptor as a novel heart failure biomarker. Circulation 2003, 107, 721–726. [Google Scholar] [CrossRef]
- Ky, B.; et al. High-sensitivity ST2 for prediction of adverse outcomes in chronic heart failure. Circ Heart Fail 2011, 4, 180–187. [Google Scholar] [CrossRef]
- Lupón, J.; et al. Combined use of the novel biomarkers high-sensitivity troponin T and ST2 for heart failure risk stratification vs conventional assessment. Mayo Clin Proc 2013, 88, 234–243. [Google Scholar] [CrossRef]
- Emdin, M.; et al. sST2 Predicts Outcome in Chronic Heart Failure Beyond NT-proBNP and High-Sensitivity Troponin T. J Am Coll Cardiol 2018, 72, 2309–2320. [Google Scholar] [CrossRef]
- Dong, G.; Chen, H.; Zhang, H.; Gu, Y. Long-Term and Short-Term Prognostic Value of Circulating Soluble Suppression of Tumorigenicity-2 Concentration in Chronic Heart Failure: A Systematic Review and Meta-Analysis. Cardiology 2021, 146, 433–440. [Google Scholar] [CrossRef]
- Gruson, D.; Lepoutre, T.; Ahn, S.A.; Rousseau, M.F. Increased soluble ST2 is a stronger predictor of long-term cardiovascular death than natriuretic peptides in heart failure patients with reduced ejection fraction. Int J Cardiol 2014, 172, e250–252. [Google Scholar] [CrossRef]
- Aimo, A.; et al. Meta-Analysis of Soluble Suppression of Tumorigenicity-2 and Prognosis in Acute Heart Failure. JACC Heart Fail 2017, 5, 287–296. [Google Scholar] [CrossRef] [PubMed]
- Jin, M.; et al. Predictors of Long-Term Mortality in Patients With Acute Heart Failure. Int Heart J 2017, 58, 409–415. [Google Scholar] [CrossRef] [PubMed]
- Ip, C.; et al. Soluble suppression of tumorigenicity 2 (sST2) for predicting disease severity or mortality outcomes in cardiovascular diseases: A systematic review and meta-analysis. IJC Heart & Vasculature 2021, 37, 100887. [Google Scholar] [CrossRef]
- van Vark, L.C.; et al. Prognostic Value of Serial ST2 Measurements in Patients With Acute Heart Failure. J Am Coll Cardiol 2017, 70, 2378–2388. [Google Scholar] [CrossRef]
- Lourenço, P.; Cunha, F.M.; Ferreira-Coimbra, J.; Barroso, I.; Guimarães, J.-T.; Bettencourt, P. Dynamics of growth differentiation factor 15 in acute heart failure. ESC Heart Fail 2021, 8, 2527–2534. [Google Scholar] [CrossRef]
- Álvarez-García, J.; et al. A 3-Biomarker 2-Point-Based Risk Stratification Strategy in Acute Heart Failure. Front Physiol 2021, 12, 708890. [Google Scholar] [CrossRef]
- Hao, J.; et al. Growth differentiation factor-15 combined with N-terminal prohormone of brain natriuretic peptide increase 1-year prognosis prediction value for patients with acute heart failure: a prospective cohort study. Chin Med J (Engl) 2019, 132, 2278–2285. [Google Scholar] [CrossRef]
- Manzano-Fernández, S.; Mueller, T.; Pascual-Figal, D.; Truong, Q.A.; Januzzi, J.L. Usefulness of soluble concentrations of interleukin family member ST2 as predictor of mortality in patients with acutely decompensated heart failure relative to left ventricular ejection fraction. Am J Cardiol 2011, 107, 259–267. [Google Scholar] [CrossRef]
- Michos, E.D.; Cainzos-Achirica, M.; Heravi, A.S.; Appel, L.J.; Supplements, C. Vitamin D, Calcium Supplements, and Implications for Cardiovascular Health. Journal of the American College of Cardiology 2021, 77, 437–449. [Google Scholar] [CrossRef]
- Falkner, B.; Keith, S.W.; Gidding, S.S.; Langman, C.B. Fibroblast growth factor-23 is independently associated with cardiac mass in African-American adolescent males. J Am Soc Hypertens 2017, 11, 480–487. [Google Scholar] [CrossRef] [PubMed]
- Panwar, B.; et al. Association of Fibroblast Growth Factor 23 With Risk of Incident Coronary Heart Disease in Community-Living Adults. JAMA Cardiol 2018, 3, 318–325. [Google Scholar] [CrossRef] [PubMed]
- Liu, M.; et al. Fibroblast growth factor-23 and the risk of cardiovascular diseases and mortality in the general population: A systematic review and dose-response meta-analysis. Front Cardiovasc Med 2022, 9, 989574. [Google Scholar] [CrossRef]
- Gonzalez-Parra, E.; et al. Important abnormalities of bone mineral metabolism are present in patients with coronary artery disease with a mild decrease of the estimated glomerular filtration rate. J.BoneMiner.Metab 2016, 34, 587–598. [Google Scholar] [CrossRef]
- Tunon, J.; et al. Coexistence of low vitamin D and high fibroblast growth factor-23 plasma levels predicts an adverse outcome in patients with coronary artery disease. PLoS.One. 2014, 9, e95402. [Google Scholar] [CrossRef]
- Bansal, N.; et al. Serum parathyroid hormone and 25-hydroxyvitamin D concentrations and risk of incident heart failure: the Multi-Ethnic Study of Atherosclerosis. J.Am.Heart Assoc. 2014, 3, e001278. [Google Scholar] [CrossRef]
- Dhingra, R.; et al. Relations of serum phosphorus levels to echocardiographic left ventricular mass and incidence of heart failure in the community. Eur.J.Heart Fail. 2010, 12, 812–818. [Google Scholar] [CrossRef]
- Binnenmars, S.H.; et al. Fibroblast Growth Factor 23 and Risk of New Onset Heart Failure With Preserved or Reduced Ejection Fraction: The PREVEND Study. J Am Heart Assoc 2022, 11, e024952. [Google Scholar] [CrossRef]
- Janus, S.E.; et al. Multi-variable biomarker approach in identifying incident heart failure in chronic kidney disease: results from the Chronic Renal Insufficiency Cohort study. Eur J Heart Fail 2022, 24, 988–995. [Google Scholar] [CrossRef]
- Xu, J.-P.; Zeng, R.-X.; He, M.-H.; Lin, S.-S.; Guo, L.-H.; Zhang, M.-Z. Associations Between Serum Soluble α-Klotho and the Prevalence of Specific Cardiovascular Disease. Front. Cardiovasc. Med. 2022, 9, 899307. [Google Scholar] [CrossRef]
- Cai, J.; et al. Association between serum Klotho concentration and heart failure in adults, a cross-sectional study from NHANES 2007–2016. International Journal of Cardiology 2023, 370, 236–243. [Google Scholar] [CrossRef] [PubMed]
- Luo, W.; Wei, N.; Sun, Z.; Gong, Y. Association between serum α-klotho level and the prevalence of heart failure in the general population. Cardiovasc J Afr 2023, 34, 1–6. [Google Scholar] [CrossRef] [PubMed]
- Gutiérrez-Landaluce, C.; et al. Parathormone levels add prognostic ability to N-terminal pro-brain natriuretic peptide in stable coronary patients. ESC Heart Failure 2021, 8, 2713–2722. [Google Scholar] [CrossRef] [PubMed]
- Kallmeyer, A.; et al. Fibroblast growth factor 23 independently predicts adverse outcomes after an acute coronary syndrome. ESC Heart Fail 2024, 11, 240–250. [Google Scholar] [CrossRef] [PubMed]
- Borné, Y.; Persson, M.; Melander, O.; Smith, J.G.; Engström, G. Increased plasma level of soluble urokinase plasminogen activator receptor is associated with incidence of heart failure but not atrial fibrillation. Eur J Heart Fail 2014, 16, 377–383. [Google Scholar] [CrossRef]
- Cabré, A.; Valdovinos, P.; Lázaro, I.; Bonet, G.; Bardají, A.; Masana, L. Parallel evolution of circulating FABP4 and NT-proBNP in heart failure patients. Cardiovasc Diabetol 2013, 12, 72. [Google Scholar] [CrossRef]
- Gruson, D.; Lepoutre, T.; Ketelslegers, J.M.; Cumps, J.; Ahn, S.A.; Rousseau, M.F. C-terminal FGF23 is a strong predictor of survival in systolic heart failure. Peptides 2012, 37, 258–262. [Google Scholar] [CrossRef]
- Koller, L.; et al. Fibroblast Growth Factor 23 Is an Independent and Specific Predictor of Mortality in Patients With Heart Failure and Reduced Ejection Fraction. Circ.Heart Fail. 2015, 8, 1059–1067. [Google Scholar] [CrossRef]
- Wohlfahrt, P.; et al. Association of Fibroblast Growth Factor-23 Levels and Angiotensin-Converting Enzyme Inhibition in Chronic Systolic Heart Failure. JACC.Heart Fail. 2015, 3, 829–839. [Google Scholar] [CrossRef]
- Dupuy, A.M.; et al. Long term pronostic value of suPAR in chronic heart failure: reclassification of patients with low MAGGIC score. Clin Chem Lab Med 2021, 59, 1299–1306. [Google Scholar] [CrossRef]
- Hayek, S.S.; et al. Soluble Urokinase Plasminogen Activator Receptor Levels and Outcomes in Patients with Heart Failure. J Card Fail 2023, 29, 158–167. [Google Scholar] [CrossRef]
- Rodríguez-Calvo, R.; et al. Fatty Acid Binding Proteins 3 and 4 Predict Both All-Cause and Cardiovascular Mortality in Subjects with Chronic Heart Failure and Type 2 Diabetes Mellitus. Antioxidants (Basel) 2023, 12, 645. [Google Scholar] [CrossRef] [PubMed]
- Koller, L.; et al. Soluble Urokinase-Type Plasminogen Activator Receptor Improves Risk Prediction in Patients With Chronic Heart Failure. JACC Heart Fail 2017, 5, 268–277. [Google Scholar] [CrossRef] [PubMed]
- Cornelissen, A.; et al. Intact fibroblast growth factor 23 levels and outcome prediction in patients with acute heart failure. Sci Rep 2021, 11, 15507. [Google Scholar] [CrossRef] [PubMed]
- Mohebi, R.; et al. Biomarker prognostication across Universal Definition of Heart Failure stages. ESC Heart Fail 2022, 9, 3876–3887. [Google Scholar] [CrossRef]
- Harrell, F.E.; Lee, K.L.; Mark, D.B. Multivariable prognostic models: issues in developing models, evaluating assumptions and adequacy, and measuring and reducing errors. Stat Med 1996, 15, 361–387. [Google Scholar] [CrossRef]
Table 1.
This is a table. Tables should be placed in the main text near to the first time they are cited.
Table 1.
This is a table. Tables should be placed in the main text near to the first time they are cited.
| All-cause death | ||||
| Total | No | Yes | p-Value | |
| (n= 104) | (n= 84) | (n= 20) | ||
| Biochemestry | ||||
| Glucose (mg/dL) | 113 (45) | 111.5 (45) | 117.5 (49) | 0.954 |
| Creatinine (mg/dL) | 1.1 (0.6) | 1 (0.4) | 1.5 (1) | <0.001 |
| eGFR (mL/min/1.73 m2) | 66.9 (38) | 70.3 (36.7) | 46 (27.9) | <0.001 |
| BUN (mg/dL) | 25 (16) | 23.5 (14) | 38.5 (26) | 0.03 |
| Serum iron level (µg/dL) | 54 (37.8) | 54 (39) | 48 (42.5) | 0.615 |
| Ferritin (ng/mL) | 147.4 (220) | 137.5 (231) | 163 (183) | 0.961 |
| HB (g/dL) | 13.6 (3.6) | 13.9 (3.2) | 11.8 (3) | 0.006 |
| Hct (%) | 41.9 (9.4) | 43 (7.9) | 36.9 (9.9) | 0.008 |
| ProteinBiomarkers | ||||
| CRP (mg/L) | 0.96 (2.4) | 0.9 (2) | 2.6 (4.6) | 0.027 |
| TnI (ng/mL) | 0.04 (0.1) | 0.04 (0.07) | 0.04 (0.08) | 0.834 |
| CK-MB (ng/mL) | 1.1 (0.7) | 0.99 (1.4) | 1.12 (1.4) | 0.091 |
| NT-proBNP (pg/mL) | 6.4 (10.7) | 6.1 (8.7) | 10.1 (14.5) | 0.029 |
| NT-proANP (ng/mL) | 29.7 (10) | 28.9 (11.4) | 31.8 (6.8) | 0.175 |
| GDF-15 (ng/mL) | 3.1 (2.4) | 2.9 (2.1) | 5 (6.4) | <0.001 |
| sST2 (x10 ng/mL) | 3.53 (3.5) | 3.09 (2.9) | 5 (5.82) | <0.001 |
| suPAR (ng/mL) | 2.9 (1.5) | 2.8 (1.4) | 3.5 (2.1) | 0.004 |
| FABP4 (ng/mL) | 44.21 (32.6) | 43.2 (32.2) | 50 (54.2) | 0.152 |
| MM Biomarkers | ||||
| PTH (pg/mL) | 71 (49.5) | 67.5 (46) | 85 (80) | 0.416 |
| Calcium (mg/dL) | 9.4 (0.8) | 9.4 (0.9) | 9.6 (0.6) | 0.048 |
| Phosphorus (mg/dL) | 3.7 (1) | 3.7 (1) | 3.6 (1.3) | 0.948 |
| 25(OH)D (ng/mL) | 24.5 (27.2) | 25.5 (26.5) | 19.3 (22.2) | 0.345 |
| FGF-23 (x103 RU/mL) | 0.36 (0.5) | 0.33 (0.4) | 0.90 (1.8) | 0.034 |
| Klotho (pg/mL) | 458.5 (242) | 458.5 (235) | 461 (264) | 0.603 |
* 25(OH)D: 1-25-dihydroxyvitamin D;eGFR: estimated glomerular filtration rate; FABP4: Fatty Acid Binding Protein 4;FGF23: Fibroblast Growth Factor 23; GDF-15: Growth Differentiation Factor-15;HB: haemoglobin; Hct: haematocrit; CK-MB: creatine kinase-MB; CRP: C-reactive protein; NT-ProANP: N-terminal Proatrial Natriuretic Peptide; NT-ProBNP: N-terminal Probrain Natriuretic Peptide; PTH: parathormone; sST2: soluble Suppression of Tumorigenicity 2; TnI: troponin I; suPAR: soluble urokinase Plasminogen Activator Receptor. Bold p-values indicate statistical significance.
Disclaimer/Publisher’s Note: The statements, opinions and data contained in all publications are solely those of the individual author(s) and contributor(s) and not of MDPI and/or the editor(s). MDPI and/or the editor(s) disclaim responsibility for any injury to people or property resulting from any ideas, methods, instructions or products referred to in the content. |
© 2024 by the authors. Licensee MDPI, Basel, Switzerland. This article is an open access article distributed under the terms and conditions of the Creative Commons Attribution (CC BY) license (http://creativecommons.org/licenses/by/4.0/).
Copyright: This open access article is published under a Creative Commons CC BY 4.0 license, which permit the free download, distribution, and reuse, provided that the author and preprint are cited in any reuse.


