Preprint
Article

This version is not peer-reviewed.

Combination of the Modified Models for End-Stage Liver Disease and sST2/LVMI Ratio Predicts Mortality in the Patients with Advanced Heart Failure

A peer-reviewed article of this preprint also exists.

Submitted:

03 December 2024

Posted:

04 December 2024

You are already at the latest version

Abstract

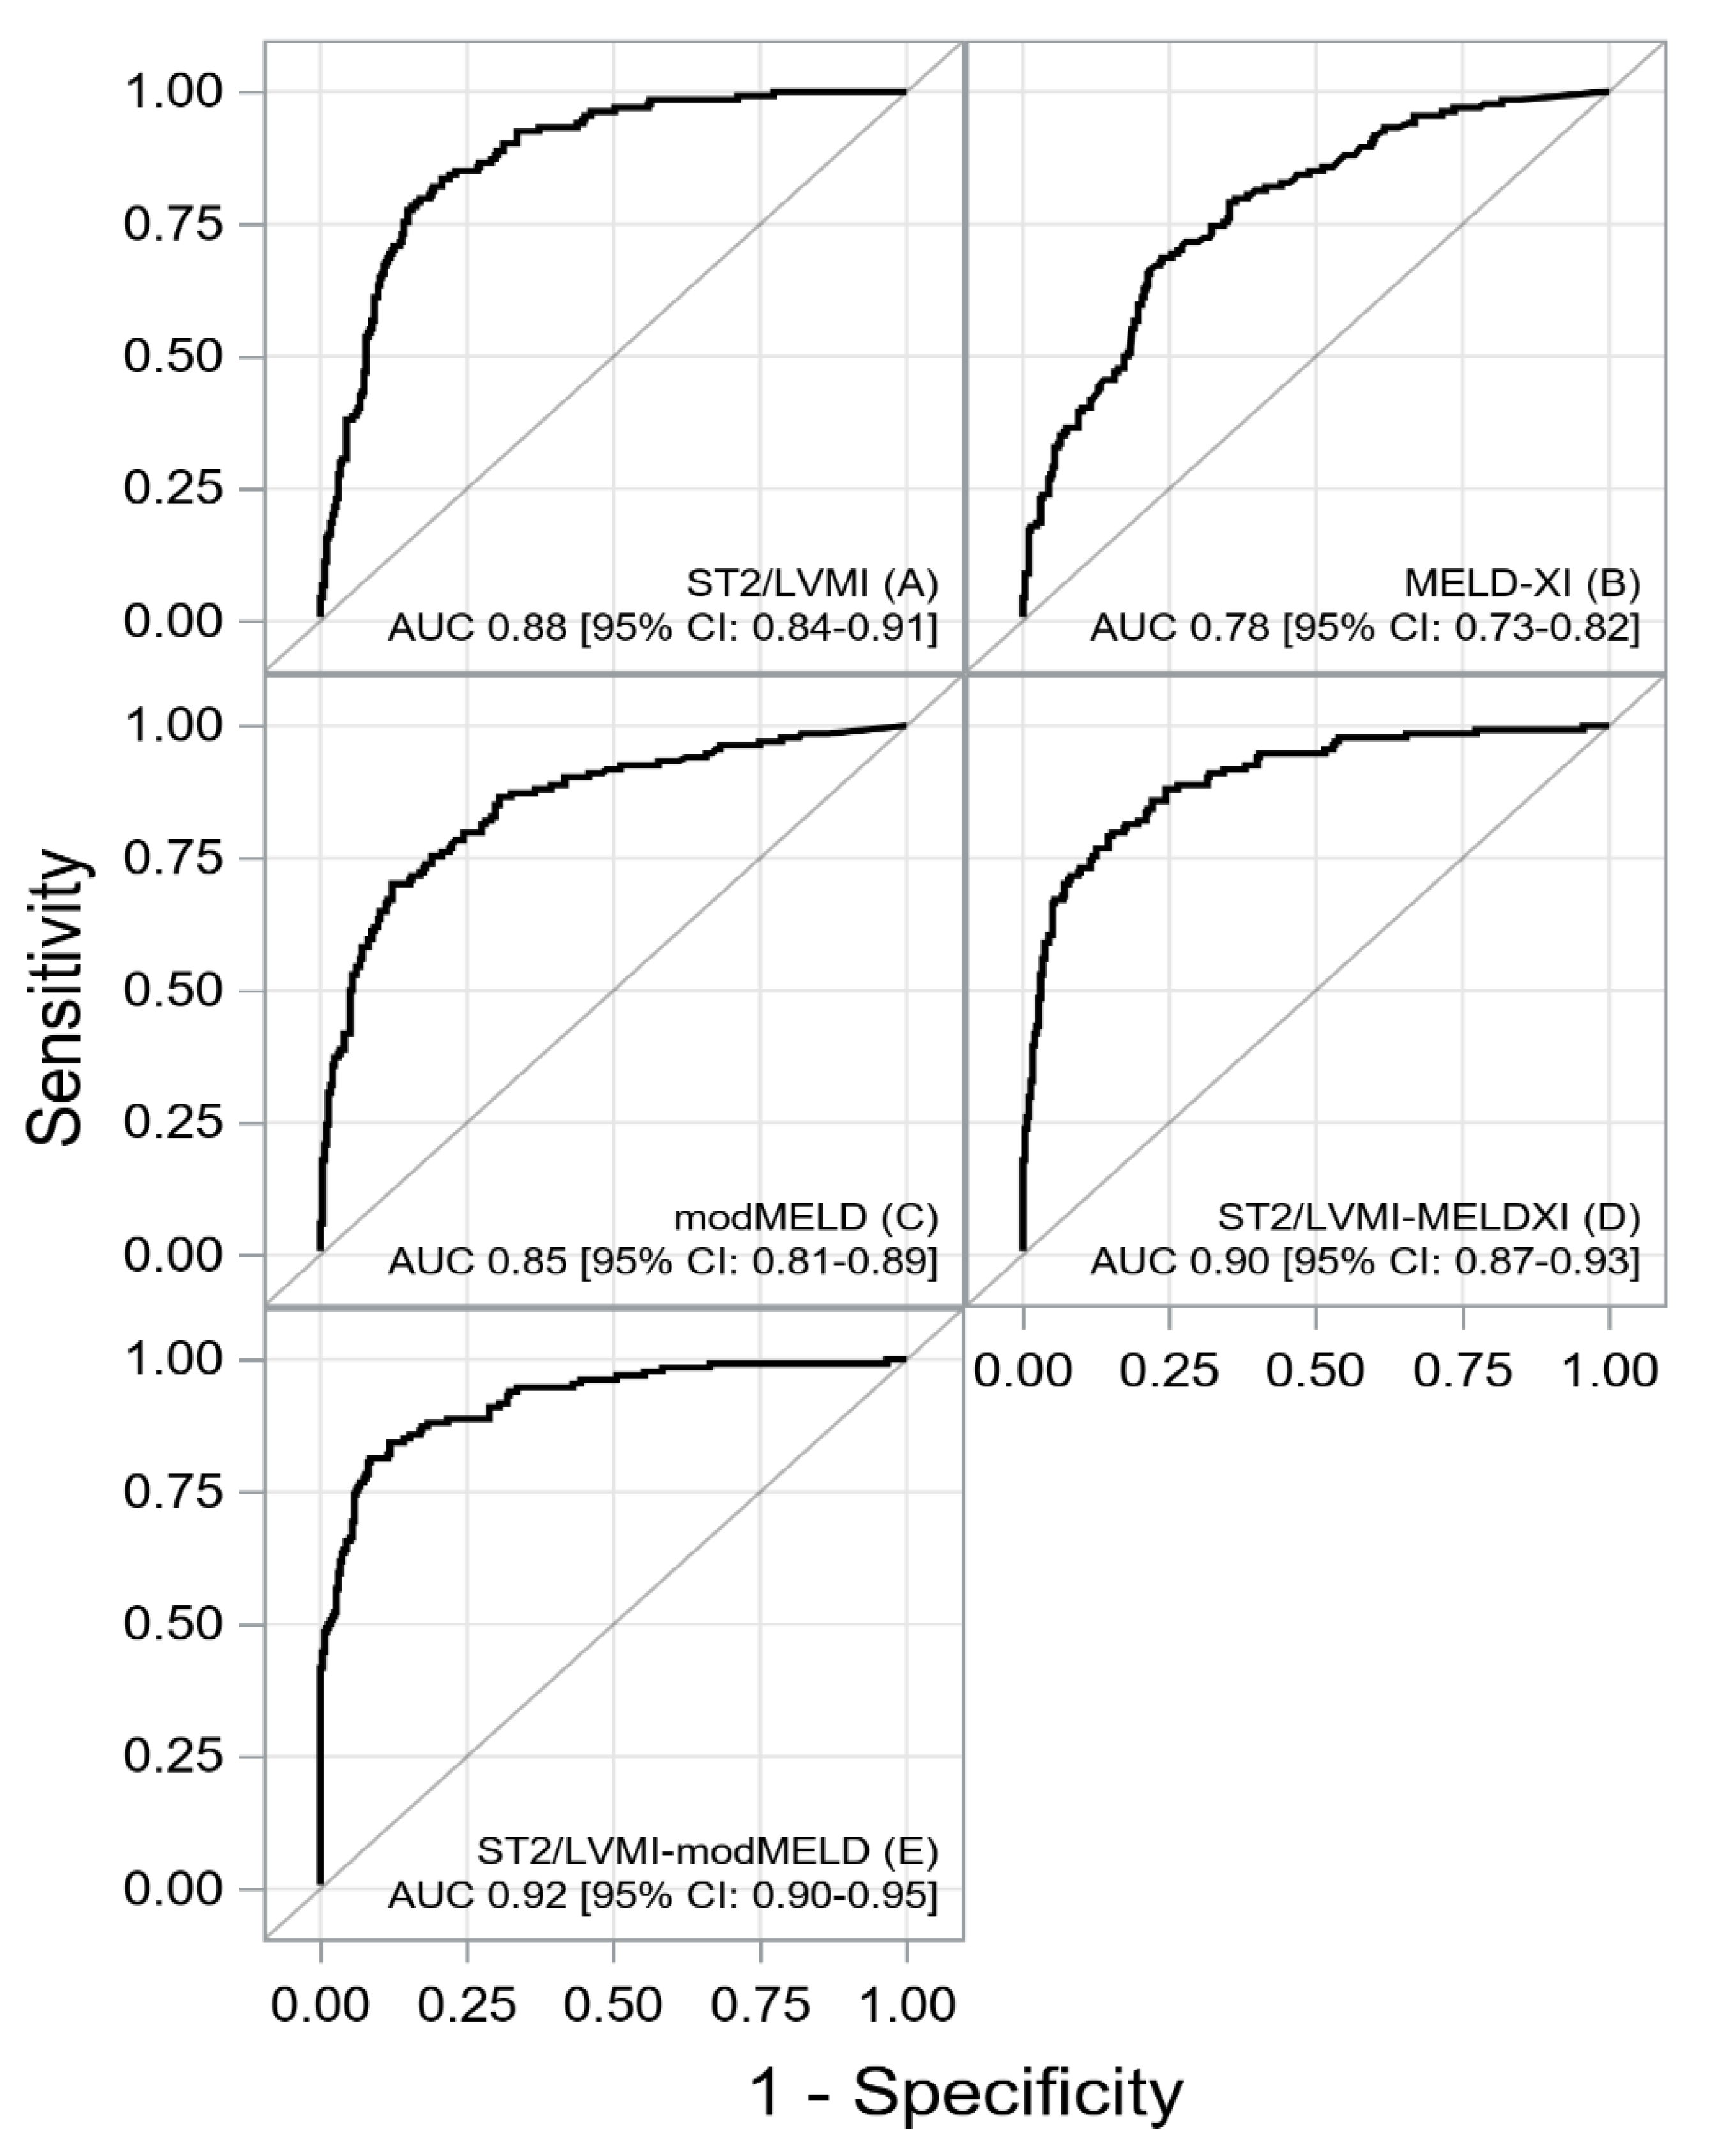
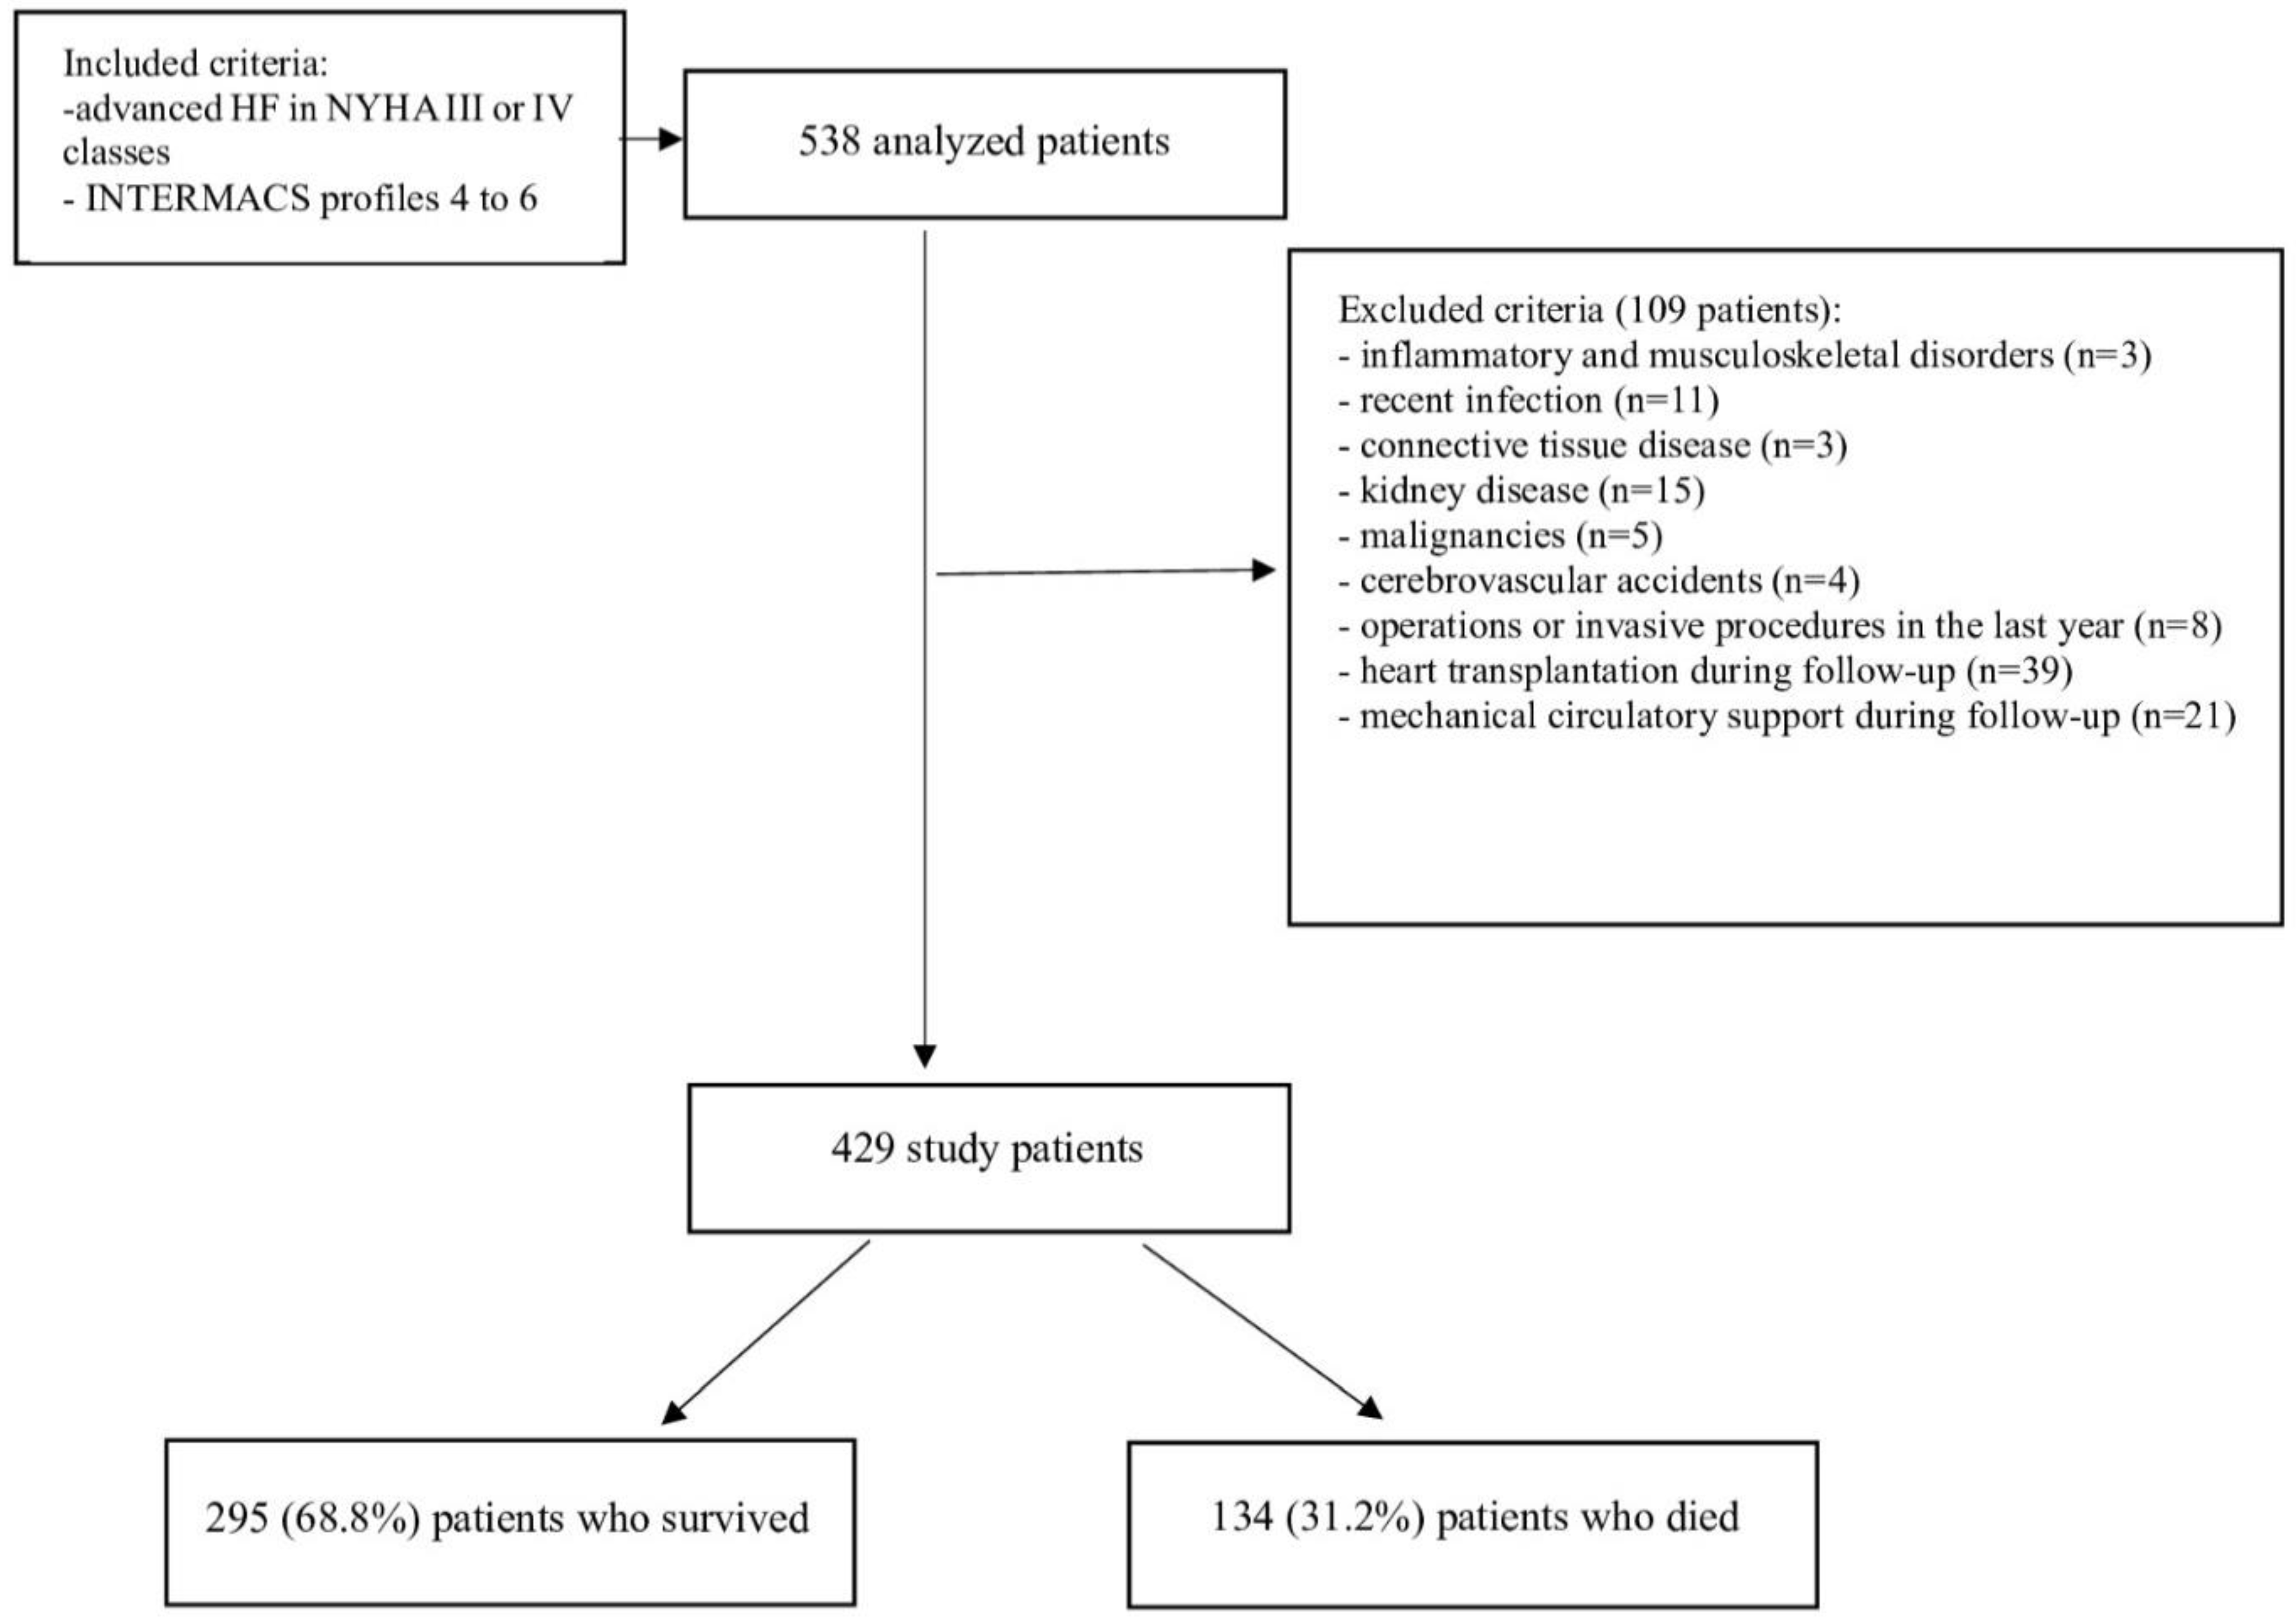
Biomarkers in heart failure (HF) management are critical for enhancing diagnostic accuracy, monitoring therapeutic response and assessing the risk of death. The aim of the study was to assess risk factors for one-year mortality in patients with advanced HF, with particular emphasis on the soluble suppression of tumorigenicity 2/left ventricular mass index (sST2/LVMI) ratio, modified Model for End-stage Liver Disease (modMELD) and Model for End-stage Liver Disease excluding INR (MELD-XI). We propectively analyzed 429 adult patients with advanced HF hospitalized between 2018 and 2023. The end-point of the study was defined as all-cause mortality during a one-year follow-up. The median age was 56.0 (50.0–60.0) years; 89.2% were male. During one-year follow-up, 134 (31.2%) patients died. The area under the receiver operating characteristics (ROC) curves indicated an excellent prognostic powers of sST2/LVMI-MELDXI (AUC: 0.90 [CI: 0.87-0.93]; sensitivity 80%, and specificity 85%) and sST2/LVMI-modMELD (AUC: 0.92 [95% CI: 0.90-0.95]; sensitivity 81%, and specificity 92%) for assessment of one-year mortality. The multivariable Cox regression model showed that: sST2/LVMI-MELD-XI [HR 2.501 (2.168-2.886) p<0.001], sodium [HR 1.065(1.004-1.130) p=0.036], NT-proBNP [HR 1.004 (1.004-1.007) p=0.008],fibrinogen [HR 1.002 (1.000-1.004) p<0.001], and uric acid [1.001 (1.000-1.002), 0.0426] in first model, and sST2/LVMI-modMELD [HR 2.552 (2.224-2.928) p<0.0001], NT-proBNP [HR 1.005 (1.002-1.008) p=0.002],fibrinogen [HR 1.002 (1.000-1.003) p=0.0099], and uric acid [1.001 (1.000-1.002), 0.0489] in second model were independent risk factors for one- year mortality. The sST2/LVMI-modMELD and sST2/LVMI- MELD-XI ratios are strongly associated with one-year mortality in the patients with advanced HF. Both models have a excellent prognostic powers for an effective separation of one-year survivors from non-survivors. Another independent risk factors for one-year mortality in the analyzed population were higher levels of fibrinogen, uric acid and NT-proBNP, as well as lower sodium levels.

Keywords: 
;  ;  

1. Introduction

In recent years, there has been growing interest in the risk stratification for heart failure (HF) using simple and cheap biomarkers that reflect various pathophysiological processes associated with the development and progression of HF [1]. Among these biomarkers soluble suppression of tumorigenicity 2/left ventricular mass index (sST2/LVMI) and models for end-stage liver diseases deserve attention [2,3]. The sST2/LVMI ratio reflects two important pathways of HF [2]. sST2 is a member of the interleukin-1 receptor family produced by both cardiac fibroblasts and cardiomyocytes in response to myocardial stress and plays an important role in the fibrotic response to inflammation [2]. In turn, LVMI is a parameter of the prefibrotic inflammatory phase of HF [4] and increased LVMI leads to higher risk of HF and all-cause mortality [4,5,6]. Assessed together as sST2/LVMI ratio, they allow for a precise assessment of the fibrosis processess in HF. Another important indicators associated with HF are the models for end-stage liver disease (MELD), which are calculated on the basis of simple and easily available laboratory parameters - bilirubin and creatinine concentrations in the case of the MELD excluding INR (MELD-XI) scale and additionally albumin concentration in the case of the modified MELD (modMELD) scale [3]. Those scales reflect cardiorenal and cardiohepatic interactions in HF and a higher MELD-XI and modMELD scores are indicators of HF progression and worse outcomes [3,7,8]. Among emerging biomarkers, we would like to highlight the potential for sST2/LVMI ratio and modifed MELD scales as a plausible new indicators that could be helpful in providing prognostic information regarding HF mortality.
The aim of our study was to evaluate the prognostic power of sST2/LVMI ratio, MELD-XI and modMELD in the patients with advanced HF during a one-year follow-up. Futheremore, we investigated whether the combination of sST/LVMI ratio with modMELD or MELD-XI improves the prognostic strenght of these scales in assessment of prognosis in the patients with advanced HF. We also aimed to identify other risk factors associated with outcomes in the analyzed group of patients.

2. Material and methods

2.1 Study population

We prospectively analyzed the patients with advanced HF who underwent heart transplantation (HT) evaluation at our institution between 2018 and 2023. A flow chart of the study design for the inclusion and exclusion criteria is presented in Figure 1. The end-point of the study was defined as all-cause mortality during a one-year follow-up. During hospitalization every patient underwent standard clinical evaluation and received recommended treatment for HF according to the ESC guidelines [9]. All patients underwent a panel of laboratory tests, echocardiography, ergospirometric exercise test and right heart catheterization at the time of inclusion to the study. The study protocol was approved by the local ethics committee of Medical University of Silesia in Katowice (specific ethics codes: KNW/0022/KB1/53/18, PCN/0022/KB1/69/I/19, CN/0022/KB/159/20, PCN/CBN/0052/KB1/20/II/21/22) and the study was conducted in accordance with the Helsinki Declaration. All patients signed written informed consent to participate in the study.

2.2. Echocardiography

Transthoracic echocardiography examinations were performed by experienced echocardiographers using a Philips Sonos 7500 (Philips Medical Systems, Eindhoven, The Netherlands) according to the recommendations of the American Society of Echocardiography. M-mode echocardiograms and two-dimensional echocardiograms followed by pulsatile and continuous wave Doppler records were obtained in each patient. Conventional techniques were used to measure the left ventricular size. Measurements were averaged over 3 cardiac cycles. The LV measurements included interventricular septal thickness at end-diastole (IVSd), the posterior wall thickness at end-diastole (PWTd), the LV internal dimensions at end-diastole (LVIDd) and at end-systole (LVIDs). LV systolic function was calculated by Teichholz's formula. LV mass (LVM) was calculated using the formula: LVM (g) = 0.8 × 1.04 × [(LVIDd + IVSTd + LVPWTd)3 − (LVIDd)3] + 0.6). The LVMI was calculated by dividing LVM by body surface area (BSA).

2.3 Analyzed biomarkers and scores

Blood samples of peripheral venous blood were drawn after 12 h of fasting at the time of enrollment. The hematological and biochemical parameters, as well as human ST2 concentrations were measured as we described earlier in the study by Szczurek -Wasilewicz et al. [8]. sST2/LVMI was calculated as the ratio of sST2 to LVMI.
As a large proportion of patients with atrial fibrillation were on vitamin K antagonists, we used a modification of the MELD score: MELD-XI and modMELD as their calculation does not take into account the INR value.
The MELD XI score was calculated according to the formula developed by Heuman et al.: (5.11 × ln bilirubin, in mg/dl) + (11.76 × ln creatinine, in mg/dl) + 9.44 [10]
The modMELD score was calculated using the following formulas [11]:
1.12 × (ln 1) + 0.378× (ln total bilirubin, in mg/dl) + 0.957×(ln creatinine, in mg/dl) + 0.643, if the plasma albumin level was higher than 4.1 g/dl
1.12×(ln [1 + 4.1 – albumin)]) + 0.378×(ln total bilirubin, in mg/dl) + 0.957×(ln creatinine, in mg/dl) + 0.643, if the plasma albumin level was less than 4.1 g/dl
The raw score for modMELD was multiplied by 10.
A lower limit was 1.0 for all variables to prevent negative values of the logarithm in the formula and the upper limit for creatinine was capped at 4.0 mg/dl. There was no upper limit for bilirubin and albumin levels.
New scores were created to assess the prognostic utility of combined sST2/LVMI-MELD-XI and sST2/LVMI-modMELD. Both variables (sST2/LVMI and MELD-XI and sST2/LVMI and modMELD separately) were entered into the Cox regression model as continuous variables. Both variables were multiplied by the associated β coefficient, and risk scores were summed for each patient according to the following formulas:
sST2/LVMI+MELD-XI = 0.241xMELD-XI + 5.058xST2/LVMI
sST2/LVMI+modMELD= 0.206 x modMELD + 4.380 x ST2/LVMI

2.4 Statistical analysis

The statistical analysis was performed using SAS software, version 9.4 (SAS Institute Inc., Cary, NC, USA). Continuous variables were presented as mean ± standard deviation (SD) or median with upper and lower quartiles and compared using the t test if they conform normal distribution or the Mann–Whitney test if not. Categorical variables were expressed as percentages and compared using the chi-square test. To examine the discrimination of one-year mortality, we examined the area under the receiver-operating characteristic (ROC) for selected scales and NT-proBNP. The optimal cut-off value for the assessed indicators was determined using the Youden criterion. Diagnostic utilities of analyzed parameters were evaluated using sensitivity, specificity, negative predictive value (NPV), positive predictive value (PPV), negative likelihood ratio (LR+), positive likelihood ratio (LR-), and accuracy. The Hosmer-Lemeshow goodnes of fit test was calculated for all analyzed parameters. The DeLong test was used to quantitatively compare ROC curves, while the Hanley and McNeil methods were used to compare differences between AUC values. An AUC> 0.7 was considered clinically relevant. The univariable Cox proportional analysis was used to identify potential predictors of worse 1-year mortality for inclusion in the multivariable analysis. Correlations between variables were assessed by the Spearman rank correlation coefficient and multicollinearity was evaluated by means of tolerance and variance inflation factors. Because LVMI/ST2- MELD-XI and LVMI/ST2-modMELD were highly correlated (r=0.94) we created to models including significant clinical and statistical parameters and LVMI/ST2-MELD-XI or LVMI/ST2-modMELD. The results were presented as hazard ratios (HRs) with corresponding 95% confidence interval (95% CI). A P value of < 0.05 was considered as statistically significant.

3. Results

The final analyzed group consisted of 429 patients with advanced HF, who had New York Heart Association (NYHA) functional class III or IV and 4-6 profiles according to the INTERMACS classification. The baseline characteristics of the study cohort is presented in Table 1. Overall, 87.6% of the patients were male, and the median age was 56 (50-60). A total of 134 (32.1%) patients died over the study period.
The results of the univariable and multivariable analysis are shown in Table 2. In the first model sST2/LVMI-MELD-XI, fibrinogen, uric acid, sodium and N-terminal pro-B-type natriuretic peptide (NT-proBNP) were independently associated with an increased risk of death during the one-year follow-up. The Harrell concordance index for the first final Cox regression model was 0.854. In second model, sST2/LVMI-modMELD, fibrinogen, uric acid and NT-proBNP were strongly associated with worse prognosis in the one-year period of observation. The Harrell concordance index for the second final Cox regression model was 0.861.
In the ROC curves analyses sST2/LVMI-MELD-XI had a comparable area under curve to that of sST2/LVMI-modMELD (0.900 vs. 0.924, respectively). The Hosmer–Lemeshow test demonstrated adequate calibration of the sST2/LVMI-MELD_XI (p=0.8620) and sST2/LVMI-modMELD (0.6327). The differences between the AUC for the combined scores and the AUC for their components were significant (p<0.05), which indicates that the new scores are significantly better predictors for the one-year mortality in ambulatory HF patients than the individual components. Receiver operator characteristic (ROC) curves of the studied risk scores are presented in Figure 1. Results obtained from the ROC analysis are summarized in Table 3. A comparison of the areas under the ROC curves for the new scales and their components are presented in Table 4.
Figure 1. The ROC curves for sST2/LVMI (A), MELD-XI (B), modMELD (C), sST2/LVMI-MELD-XI (D) and sST2/LVMI-modMELD (E). Abbreviations: see Table 1, Abbreviations: see Table 1.
Preprints 141778 g002

4. Discussion

The present study is the first one to demonstrate that new prognostic scales - sST2/LVMI-modMELD and sST2/LVMI- MELD-XI are strongly associated with one-year mortality in the patients with advanced HF. Both models have an excellent prognostic powers, as well as good sensitivities and specificities, allowing for an effective separation of one-year survivors from non-survivors. The prognostic power of new models is significantly better than their individual components.
The sST2/LVMI ratio allows for the assessment of two major pathways of HF pathophysiology - inflammation and fibrosis [6,12]. sST2 is a decoy receptor that inhibits beneficial cardioprotective effects of Interleukin-33. Thus contributing to cardiac hypertrophy, myocardial fibrosis, and in the final phase to HF, sST2 also increases the production of oxidative stress and inflammatory markers in the heart, and measurement of sST2 is useful for assessing the severity of HF and outcomes [12,13,14]. In turn, LVMI allows for the assessment of the prefibrotic inflammatory phase of HF and is a well-established parameter that can independently predict adverse cardiovascular events and premature death [15]. Thus, the combined evaluation of ST2 and LVMI indices allows for an accurate assessment of fibrotic and inflammatory abnormalites in the heart. Our study showed that sST2/LVMI ratio has a good prognostic power, sensitivity and specificity for assessment of one-year mortality in the patients with advanced HF. Only one study by Li et al. also demonstrated prognostic value of this scale in patients with HF. In this research a higher baseline ratio of sST2/LVMI was associated with an increased risk of cardiovascular mortality and rehospitalization in HF patients with reduced ejection fraction in the short-term follow-up [12].
Similarly to previous studies [11,16,17], MELD XI and modMELD scores also provided important prognostic information and allowed for accurate risk stratification of one-year mortality in the patients with advanced HF. MELD and its modifications reflect multiorgan dysfunction associated with congestion in the course of HF [18]. The classic MELD scale is calculated based on bilirubin, creatinine and international normalized ratio (INR) levels. However, anticoagulants treatment affects the INR value, therefore a modified versions of the MELD scales were used - modMELD, in which the INR was replaced by the albumin level and MELD-XI calculated solely on the basis of bilirubin and creatinine levels [19]. Bilirubin reflects the metabolic function of the liver, while albumin allows for the assessment of the synthetic function of the liver. In turn, the creatinine level is used to assess the severity of renal dysfunction [11,18,20,21]. Previous studies have shown that liver and kidney dysfunction are important independent risk factors of worse prognosis in the patients with advanced HF [20,21]. However, MELD score and its modifications are better markers of liver and kidney dysfunction than individual laboratory assays, because allow for a holistic assessment of peripheral organ dysfunction secondary to HF [11,16,17].
Considering the importance of inflammation and fibrosis in HF assessed by LVMI/sST2 and cardio-hepatic and cardio-renal interactions using MELD-XI and modMELD scores, we decided to assess the prognostic value of the combined model. To the best of our knowledge this is the first study to show that new prognostic models: sST2/LVMI-MELD-XI and sST2/LVMI-modMELD with excellent prognostic power allow to effectively separate one-year survivors from non-survivors during a one-year follow-up. It seems that the modified risk scores may better stratify the outcomes by considering several pathological mechanisms of HF and important risk factors and thus facilitate appropriate decisions regarding HF therapy.
Another finding of our study was independent association between higher fibrinogen levels and worse prognosis in patients with HF. Fibrinogen is a glycoprotein complex produced by the liver which plays an important role in coagulation and inflammation [22,23]. Under the influence of thrombin, fibrinogen is transformed into fibrin monomer, which then cross-links platelets, increases blood viscosity and ultimately leads to clot formation [24]. Besides, fibrinogen production gradually increases in response to chronic, low-grade inflammatory processes [25]. It is also directly involved in the processes closely related to HF pathogenesis by inducing endothelial dysfunction, stimulating smooth muscle cells proliferation and migration and increasing chemotaxis of leukocytes, monocytes and fibroblasts [25,26,27,28,29]. From a pathophysiological point of view, fibrinogen as a marker of thrombosis and low-grade inflammation may be linked to the development and progression of HF [23,25]. However, studies on the prognostic value of fibrinogen level in the patients with HF are few [26,27,28,30]. Massimo Cugno et al. demonstrated that HF leads to hypercoagulability and increased fibrinogen concentration, which may be important in disease progression and thromboembolic complications [26]. Another study also showed that higher fibrinogen levels (≥284 mg/dl) independently predicted worse prognosis in the patients with acute exacerbation of chronic HF [27]. The recent study by Yang et al. also demonstrated that an elevated fibrinogen to bilirubin ratio is an independent predictor of death in patients with HF [28]. In turn, the study by Xu et al. showed a nonlinear association between baseline fibrinogen level and the rehospitalization risk in HF patients within 6 months [30]. However in this study the authors didn’t find the association between fibrinogen concentration and the risk for death during the follow up [30].
Our study also confirmed the importance of commonly known risk factors of HF. Lower sodium concentration as well as higher NT-proBNP and uric acid concentrations were also associated with an increased risk of one-year mortality in the analyzed group of patients. Hyponatremia is one of the most common electrolyte abnormality associated with poor short- and long-term outcomes in patients with advanced HF [31,32,33,34,35]. The prevalence of hyponatremia in HF patients ranges between 11% and 27% [31,32]. From the pathological point of view, in the early stages of HF, retention of sodium and water by the kidney causes expansion of extracellular fluid volume and peripheral edema. As HF progresses, there is a gradual impairment of water excretion by the kidneys, and an increase in antidiuretic hormone causes an aquaristic defect, which, in combination with the use of potent diuretics, leads to hyponatremia [31]. In addition, low cardiac output in advanced HF leads to activation of the renin-angiotensin-aldosterone system (RAAS) and increased angiotensin II concentration, which is a strong thirst stimulant, thus results in increased water intake by the patient [33].
Similarly to low sodium concentration, elevated NT-proBNP concentration is a commonly known factor of worse prognosis in patients with advanced HF [36,37]. Natriuretic peptides are the most widely studied and used in clinical practice to aid the diagnosis of HF, assess the effect of therapy and asessment of prognosis in the patients with HF [36,37]. They play an important regulatory role in responsing to myocardial stretch and cause a decrease in sympathetic nervous system expression, increase diuresis, reduce peripheral resistance, and increase smooth muscle relaxation [35,36,37]. Despite the importance of NT-proBNP in assessing the prognosis in HF, it should be emphasized that many factors affect the concentration of natriuretic peptides including: age, anemia, renal failure, atrial fibrillation, hyperthyroidism or obesity [38]. Therefore, the NT-proBNP values should be interpreted taking into account comorbidities and clinical conditions affecting its value.
The last independent factor associated with an increased risk of one- year mortality in analyzed group of patients was higher uric acid concentration. Many previous studies showed that hyperuricemia is a common finding in HF and is an independent predictor of worse outcomes [39,40]. Furthermore, higher uric acid concentration is related to higher natriuretic peptides, lower peak oxygen uptake, higher ventricular filling pressure, and lower cardiac output, thus, it may reflect the severity of HF [41,42]. The importance of uric acid in the development and progression of cardiovascular diseases is related to induction of inflammation in vascular endothelial and smooth muscle cells, as well as intracellular oxidative stress [43,44]. Uric acid is the end-product of purine metabolism mainly regulated by xanthine oxidase, converting hypoxanthine to xanthine and xanthine to uric acid [45]. In hypoxic, catabolic or inflammatory conditions which are presented in HF, xanthine oxidase is activated, which is a powerful oxygen radical-generating system [46]. In turn, increased generation of reactive oxygen species (ROS) contributes to endothelial dysfunction, metabolic and functional impairment, as well as inflammatory activation, which is closely related to the HF pathophysiology [46]. Hyperuricemia also inhibits myocardial cells activity by activating the extracellular signal-regulated kinase pathway and induces cardiomyocyte apoptosis by activating calpain-1, thus leading to damage to the myocardium [47,48]. Increased uric acid concentration further activates the renin-angiotensin-aldosterone system, which plays a critical role in the pathophysiology of HF [49]. Furthermore, other comorbidities such as kidney disease as well as the treatment with loop diuretics and potassium-sparing diuretics constitute an additional source of elevated serum uric acid in the patients with HF [41].
Our study has certain limitations. First, the study group was relatively small. However, the group was homogenous and many exclusion criteria had to be included due to the impact on the analyzed markers. Second, we only collected the data of the patients on admission. Additional measurements of analyzed parameters at discharge and/or follow-up may reliably determine the relationship of those indicators with prognosis. Third, the dataset was collected from a single center, so models developed using the data may not be generalizable. Fourth, the study was conducted at a time when guidelines for HF treatment were changing. Some patients were enrolled in the study before the era of SGLT2 inhibitor treatment for HF. Further studies should be conducted in large population of the patients treated with SGLT2 inhibitors. Finally, during follow-up, therapy was modified according to the clinical status. Thus, treatment effect during follow-up cannot be ruled out.

5. Conclusions

This study evaluated noninvasive and simple indicators associated with the one-year mortality in the patients with advanced HF. sST2/LVMI, MELD-XI and modMELD have good prognostic powers, acceptable sensitivity and good specificity for prediction of outcomes. New prognostic scales - the sST2/LVMI-modMELD and sST2/LVMI- MELD-XI – which are combination of the MELD scales and sST2/LVMI - are strongly associated with one-year mortality in the patients with advanced HF. Both new models have a excellent prognostic powers, as well as good sensitivities and specificities, allowing for an effective separation of one-year survivors from non-survivors. The prognostic power of new models are significantly better than their individuals componets. Another independent risk factors for one-year mortality in the analyzed population were higher levels of fibrinogen, uric acid and NT-proBNP, as well as lower sodium levels.

Author Contributions

Conceptualization, Wioletta Szczurek-Wasilewicz and Bożena Szyguła-Jurkiewicz; Data curation, Wioletta Szczurek-Wasilewicz, Michał Jurkiewicz, Michał Skrzypek, Ewa Romuk, Jacek Jóźwiak, Mariusz Gąsior and Bożena Szyguła-Jurkiewicz; Formal analysis, Wioletta Szczurek-Wasilewicz and Michał Skrzypek; Funding acquisition, Mariusz Gąsior and Bożena Szyguła-Jurkiewicz; Investigation, Wioletta Szczurek-Wasilewicz, Michał Jurkiewicz, Michał Skrzypek, Ewa Romuk, Jacek Jóźwiak, Mariusz Gąsior and Bożena Szyguła-Jurkiewicz; Methodology, Wioletta Szczurek-Wasilewicz, Michał Jurkiewicz and Bożena Szyguła-Jurkiewicz; Project administration, Wioletta Szczurek-Wasilewicz; Supervision, Wioletta Szczurek-Wasilewicz, Mariusz Gąsior and Bożena Szyguła-Jurkiewicz; Visualization, Wioletta Szczurek-Wasilewicz and Bożena Szyguła-Jurkiewicz; Writing – original draft, Wioletta Szczurek-Wasilewicz; Writing – review & editing, Wioletta Szczurek-Wasilewicz, Michał Jurkiewicz, Michał Skrzypek, Ewa Romuk, Jacek Jóźwiak, Mariusz Gąsior and Bożena Szyguła-Jurkiewicz. All authors will be updated at each stage of manuscript processing, including submission, revision, and revision reminder, via emails from our system or the assigned Assistant Editor.

Funding

This work was supported by an internal grants from the Medical University of Silesia (grant number: BNW-1-047/K/3/K; to BS-J)

Institutional Review Board Statement

The study was approved by the Bioethical Committee of the Medical University of Silesia (specific ethics codes: KNW/0022/KB1/53/18, PCN/0022/KB1/69/I/19, CN/0022/KB/159/20, PCN/CBN/0052/KB1/20/II/21/22). The study was conducted according to the guidelines of the Declaration of Helsinki.

Informed Consent Statement

Informed consent was obtained from all subjects involved in the study.

Data Availability Statement

The data presented in this study are available on request from the corresponding author. The data are not publicly available due to privacy restrictions related to the rules in our institution.

Conflicts of Interest

The authors declare that they have no conflict of interest.

References

  1. Castiglione, V.; Aimo, A.; Vergaro, G.; Saccaro, L.; Passino, C.; Emdin, M. Biomarkers for the diagnosis and management of heart failure. Hear. Fail. Rev. 2022, 27, 625–643. [Google Scholar] [CrossRef]
  2. Sciatti, E.; Merlo, A.; Scangiuzzi, C.; Limonta, R.; Gori, M.; D’elia, E.; Aimo, A.; Vergaro, G.; Emdin, M.; Senni, M. Prognostic Value of sST2 in Heart Failure. J. Clin. Med. 2023, 12, 3970. [Google Scholar] [CrossRef]
  3. Szczurek, W.; Szyguła-Jurkiewicz, B.; Siedlecki, Ł.; Gąsior, M. Prognostic scales in advanced heart failure. Pol. J. Cardio-Thoracic Surg. 2018, 15, 183–187. [Google Scholar] [CrossRef]
  4. Gehlken, C.; Screever, E.M.; Suthahar, N.; van der Meer, P.; Westenbrink, B.D.; Coster, J.E.; Van Veldhuisen, D.J.; de Boer, R.A.; Meijers, W.C. Left atrial volume and left ventricular mass indices in heart failure with preserved and reduced ejection fraction. ESC Hear. Fail. 2021, 8, 2458–2466. [Google Scholar] [CrossRef]
  5. Zhou, D.; Huang, Y.; Cai, A.; Yan, M.; Cheng, Q.; Feng, X.; Nie, Z.; Feng, Y. Longitudinal Study of Left Ventricular Mass Index Trajectories and Risk of Mortality in Hypertension: A Cohort Study. J. Am. Hear. Assoc. 2023, 12, e028568. [Google Scholar] [CrossRef] [PubMed]
  6. Li, F.; Xu, M.; Fu, M.; Cui, X.; Lian, Z.; Xin, H.; Zhou, J.; Ge, J. Increased ratio of sST2/LVMI predicted cardiovascular mortality and heart failure rehospitalization in heart failure with reduced ejection fraction patients: a prospective cohort study. BMC Cardiovasc. Disord. 2021, 21, 1–10. [Google Scholar] [CrossRef]
  7. Yang, J.A.; Kato, T.S.; Shulman, B.P.; Takayama, H.; Farr, M.; Jorde, U.P.; Mancini, D.M.; Naka, Y.; Schulze, P.C. Liver dysfunction as a predictor of outcomes in patients with advanced heart failure requiring ventricular assist device support: Use of the Model of End-stage Liver Disease (MELD) and MELD eXcluding INR (MELD-XI) scoring system. J. Hear. Lung Transplant. 2012, 31, 601–610. [Google Scholar] [CrossRef] [PubMed]
  8. Szygula-Jurkiewicz, B.; Szczurek, W.; Skrzypek, M.; Zakliczyński, M.; Siedlecki, Ł.; Przybyłowski, P.; Zembala, M.; Gąsior, M. One year survival of ambulatory patients with the end-stage heart failure: the analysis of prognostic factors. Pol. Arch. Intern. Med. 2017, 127, 254–260. [Google Scholar] [CrossRef]
  9. McDonagh, T.A.; Metra, M.; Adamo, M.; Gardner, R.S.; Baumbach, A.; Böhm, M.; Burri, H.; Butler, J.; Čelutkienė, J.; Chioncel, O.; et al. 2021 ESC Guidelines for the diagnosis and treatment of acute and chronic heart failure: Developed by the Task Force for the diagnosis and treatment of acute and chronic heart failure of the European Society of Cardiology (ESC). With the special contribution of the Heart Failure Association (HFA) of the ESC. Eur. J. Hear. Fail. 2022, 24, 4–131. [Google Scholar] [CrossRef]
  10. Heuman, D.M.; Mihas, A.A.; Habib, A.; Gilles, H.S.; Stravitz, R.T.; Sanyal, A.J.; Fisher, R.A. MELD-XI: A rational approach to “sickest first” liver transplantation in cirrhotic patients requiring anticoagulant therapy. Liver Transplant. 2006, 13, 30–37. [Google Scholar] [CrossRef]
  11. Szczurek, W.; Szyguła-Jurkiewicz, B.; Zakliczyński, M.; Król, B.; Gąsior, M.; Zembala, M. Prognostic utility of the N terminal prohormone of brain natriuretic peptide and the modified Model for End Stage Liver Disease in patients with end stage heart failure. Pol. Arch. Intern. Med. 2018, 128, 235–243. [Google Scholar] [CrossRef] [PubMed]
  12. Li, F.; Xu, M.; Fu, M.; Cui, X.; Lian, Z.; Xin, H.; Zhou, J.; Ge, J. Increased ratio of sST2/LVMI predicted cardiovascular mortality and heart failure rehospitalization in heart failure with reduced ejection fraction patients: a prospective cohort study. BMC Cardiovasc. Disord. 2021, 21, 1–10. [Google Scholar] [CrossRef]
  13. Matilla, L.; Ibarrola, J.; Arrieta, V.; Garcia-Peña, A.; Martinez-Martinez, E.; Sádaba, R.; Alvarez, V.; Navarro, A.; Fernández-Celis, A.; Gainza, A.; et al. Soluble ST2 promotes oxidative stress and inflammation in cardiac fibroblasts: an in vitro and in vivo study in aortic stenosis. Clin. Sci. 2019, 133, 1537–1548. [Google Scholar] [CrossRef] [PubMed]
  14. McCarthy, C.P.; Januzzi, J.L., Jr. Soluble ST2 in Heart Failure. Heart Fail. Clin. 2018, 14, 41–48. [Google Scholar] [CrossRef]
  15. Lai, C.-L.; Chien, K.-L.; Hsu, H.-C.; Su, T.-C.; Chen, M.-F.; Lee, Y.-T. Left ventricular mass and risk of cardiovascular events and all-cause death among ethnic Chinese—The Chin-Shan Community Cardiovascular Cohort study. Int. J. Cardiol. 2011, 149, 347–352. [Google Scholar] [CrossRef]
  16. Szczurek, W.; Gąsior, M.; Romuk, E.; Skrzypek, M.; Szyguła-Jurkiewicz, B. Usefulness of combining prognostic scores to predict survival in patients with advanced heart failure. J. Hear. Lung Transplant. 2019, 38, 1224–1227. [Google Scholar] [CrossRef] [PubMed]
  17. Szygula-Jurkiewicz, B.; Szczurek, W.; Skrzypek, M.; Zakliczyński, M.; Siedlecki, Ł.; Przybyłowski, P.; Zembala, M.; Gąsior, M. One year survival of ambulatory patients with the end-stage heart failure: the analysis of prognostic factors. Pol. Arch. Intern. Med. 2017, 127, 254–260. [Google Scholar] [CrossRef] [PubMed]
  18. Gotou, M.; Suzuki, A.; Shiga, T.; Kikuchi, N.; Hagiwara, N. Implication of modified MELD scores for postdischarge prognosis in hospitalized patients with heart failure. Hear. Vessel. 2022, 38, 535–542. [Google Scholar] [CrossRef]
  19. Szczurek, W.; Szyguła-Jurkiewicz, B.; Siedlecki, Ł.; Gąsior, M. Prognostic scales in advanced heart failure. Pol. J. Cardio-Thoracic Surg. 2018, 15, 183–187. [Google Scholar] [CrossRef] [PubMed]
  20. Kato, T.; Kim, M.; Farr, M.; Wu, C.; Givens, R.; Collado, E.; Mancini, D.; Schulze, P. Hepatic Dysfunction in Ambulatory Patients with Heart Failure – Application of the MELD Scoring System for Outcome Prediction. J. Hear. Lung Transplant. 2013, 32, S165. [Google Scholar] [CrossRef]
  21. Schefold, J.C.; Filippatos, G.; Hasenfuss, G.; Anker, S.D.; von Haehling, S. Heart failure and kidney dysfunction: epidemiology, mechanisms and management. Nat. Rev. Nephrol. 2016, 12, 610–623. [Google Scholar] [CrossRef]
  22. Xu, Q.; Zhu, C.; Zhang, Q.; Hu, Z.; Ji, K.; Qian, L. Association between fibrinogen-to-albumin ratio and prognosis of patients with heart failure. Eur. J. Clin. Investig. 2023, 53, e14049. [Google Scholar] [CrossRef]
  23. Anjum, F.; Gilani, M.; Latif, M.; Sattar, A.; Ashraf, H.; Rafaqat, S. The Role of Coagulation in Heart Failure: A Literature Review. Curr. Hear. Fail. Rep. 2024, 21, 277–291. [Google Scholar] [CrossRef] [PubMed]
  24. Jiang, P.; Gao, Z.; Zhao, W.; Song, Y.; Tang, X.-F.; Xu, J.-J.; Wang, H.-H.; Jiang, L.; Chen, J.; Qiao, S.-B.; et al. Relationship between fibrinogen levels and cardiovascular events in patients receiving percutaneous coronary intervention. Chin. Med J. 2019, 132, 914–921. [Google Scholar] [CrossRef] [PubMed]
  25. Vilar, R.; Fish, R.J.; Casini, A.; Neerman-Arbez, M. Fibrin(ogen) in human disease: both friend and foe. Haematologica 2020, 105, 284–296. [Google Scholar] [CrossRef]
  26. Cugno, M.; Mari, D.; Meroni, P.L.; Gronda, E.; Vicari, F.; Frigerio, M.; Coppola, R.; Bottasso, B.; Borghi, M.O.; Gregorini, L. Haemostatic and inflammatory biomarkers in advanced chronic heart failure: role of oral anticoagulants and successful heart transplantation. Br. J. Haematol. 2004, 126, 85–92. [Google Scholar] [CrossRef] [PubMed]
  27. Meng, Z.; Zhao, Y.; He, Y. Fibrinogen Level Predicts Outcomes in Critically Ill Patients with Acute Exacerbation of Chronic Heart Failure. Dis. Markers 2021, 2021, 1–7. [Google Scholar] [CrossRef] [PubMed]
  28. Yang, S.; Pi, J.; Ma, W.; Gu, W.; Zhang, H.; Xu, A.; Liu, Y.; Shi, T.; Yang, F.; Chen, L. Prognostic value of the fibrinogen-to-albumin ratio (FAR) in patients with chronic heart failure across the different ejection fraction spectrum. Libyan J. Med. 2024, 19, 2309757. [Google Scholar] [CrossRef]
  29. Green, D.; Foiles, N.; Chan, C.; Schreiner, P.J.; Liu, K. Elevated fbrinogen levels and subsequent subclinical atherosclerosis: the CARDIA Study. Atherosclerosis. 2009, 202(2), 623–631. [Google Scholar] [CrossRef] [PubMed]
  30. Xu, Z.; Liu, H.; Zhu, M.; Huang, Y. The inverted U-shaped association between blood fibrinogen and rehospitalization risk in patients with heart failure. Sci. Rep. 2024, 14, 1–9. [Google Scholar] [CrossRef]
  31. Rodriguez, M.; Hernandez, M.; Cheungpasitporn, W.; Kashani, K.B.; Riaz, I.; Rangaswami, J.; Herzog, E.; Guglin, M.; Krittanawong, C. Hyponatremia in Heart Failure: Pathogenesis and Management. Curr. Cardiol. Rev. 2019, 15, 252–261. [Google Scholar] [CrossRef]
  32. Omar, H.R.; Charnigo, R.; Guglin, M. Prognostic Significance of Discharge Hyponatremia in Heart Failure Patients With Normal Admission Sodium (from the ESCAPE Trial). Am. J. Cardiol. 2017, 120, 607–615. [Google Scholar] [CrossRef] [PubMed]
  33. Rodriguez, M.; Hernandez, M.; Cheungpasitporn, W.; Kashani, K.B.; Riaz, I.; Rangaswami, J.; Herzog, E.; Guglin, M.; Krittanawong, C. Hyponatremia in Heart Failure: Pathogenesis and Management. Curr. Cardiol. Rev. 2019, 15, 252–261. [Google Scholar] [CrossRef]
  34. Gheorghiade, M.; Rossi, J.S.; Cotts, W.; Shin, D.D.; Hellkamp, A.S.; Piña, I.L.; Fonarow, G.C.; DeMarco, T.; Pauly, D.F.; DiSalvo, T.G.; et al. Characterization and Prognostic Value of Persistent Hyponatremia in Patients With Severe Heart Failure in the ESCAPE Trial. Arch. Intern. Med. 2007, 167, 1998–2005. [Google Scholar] [CrossRef]
  35. Nadar, S.K.; Shaikh, M.M. Biomarkers in Routine Heart Failure Clinical Care. Card. Fail. Rev. 2019, 5, 50–56. [Google Scholar] [CrossRef] [PubMed]
  36. Hartmann, F.; Packer, M.; Coats, A.J.; Fowler, M.B.; Krum, H.; Mohacsi, P.; Rouleau, J.L.; Tendera, M.; Castaigne, A.; Anker, S.D.; et al. Prognostic Impact of Plasma N-Terminal Pro–Brain Natriuretic Peptide in Severe Chronic Congestive Heart Failure. Circulation 2004, 110, 1780–1786. [Google Scholar] [CrossRef]
  37. Senni, M.; Lopez-Sendon, J.; Cohen-Solal, A.; Ponikowski, P.; Nkulikiyinka, R.; Freitas, C.; Vlajnic, V.M.; Roessig, L.; Pieske, B. Vericiguat and NT- -proBNP in patients with heart failure with reduced ejection fraction: analyses from the VICTORIA trial. ESC Heart Fail. 2022, 9(6), 3791–3803. [Google Scholar] [CrossRef] [PubMed]
  38. Kim, H.-N.; Januzzi, J.L. Natriuretic Peptide Testing in Heart Failure. Circulation 2011, 123, 2015–2019. [Google Scholar] [CrossRef] [PubMed]
  39. Doehner, W.; Anker, S.D.; Butler, J.; Zannad, F.; Filippatos, G.; Ferreira, J.P.; Salsali, A.; Kaempfer, C.; Brueckmann, M.; Pocock, S.J.; et al. Uric acid and sodium-glucose cotransporter-2 inhibition with empagliflozin in heart failure with reduced ejection fraction: the EMPEROR-reduced trial. Eur. Hear. J. 2022, 43, 3435–3446. [Google Scholar] [CrossRef] [PubMed]
  40. Miao, L.; Guo, M.; Pan, D.; Chen, P.; Chen, Z.; Gao, J.; Yu, Y.; Shi, D.; Du, J. Serum Uric Acid and Risk of Chronic Heart Failure: A Systematic Review and Meta-Analysis. Front. Med. 2021, 8, 785327. [Google Scholar] [CrossRef]
  41. Packer, M. Uric Acid Is a Biomarker of Oxidative Stress in the Failing Heart: Lessons Learned from Trials With Allopurinol and SGLT2 Inhibitors. J. Card. Fail. 2020, 26, 977–984. [Google Scholar] [CrossRef]
  42. Cicero, A.F.G.; Rosticci, M.; Parini, A.; Baronio, C.; D’addato, S.; Borghi, C. Serum uric acid is inversely proportional to estimated stroke volume and cardiac output in a large sample of pharmacologically untreated subjects: data from the Brisighella Heart Study. Intern. Emerg. Med. 2013, 9, 655–660. [Google Scholar] [CrossRef] [PubMed]
  43. Kang, D.-H.; Park, S.-K.; Lee, I.-K.; Johnson, R.J. Uric Acid–Induced C-Reactive Protein Expression. J. Am. Soc. Nephrol. 2005, 16, 3553–3562. [Google Scholar] [CrossRef]
  44. El Din, U.A.S.; Salem, M.M.; Abdulazim, D.O. Uric acid in the pathogenesis of metabolic, renal, and cardiovascular diseases: A review. Journal of Advanced Research 2016, 8, 537–548. [Google Scholar] [CrossRef]
  45. Saito, Y.; Tanaka, A.; Node, K.; Kobayashi, Y. Uric acid and cardiovascular disease: A clinical review. J. Cardiol. 2021, 78, 51–57. [Google Scholar] [CrossRef]
  46. Doehner, W.; Landmesser, U. Xanthine Oxidase and Uric Acid in Cardiovascular Disease: Clinical Impact and Therapeutic Options. Semin. Nephrol. 2011, 31, 433–440. [Google Scholar] [CrossRef] [PubMed]
  47. Li, Z.; Shen, Y.; Chen, Y.; Zhang, G.; Cheng, J.; Wang, W. High Uric Acid Inhibits Cardiomyocyte Viability Through the ERK/P38 Pathway via Oxidative Stress. Cell. Physiol. Biochem. 2018, 45, 1156–1164. [Google Scholar] [CrossRef]
  48. Kumrić, M.; A Borovac, J.; Kurir, T.T.; Božić, J. Clinical Implications of Uric Acid in Heart Failure: A Comprehensive Review. Life 2021, 11, 53. [Google Scholar] [CrossRef]
  49. Yu, M.-A.; Sánchez-Lozada, L.G.; Johnson, R.J.; Kang, D.-H. Oxidative stress with an activation of the renin–angiotensin system in human vascular endothelial cells as a novel mechanism of uric acid-induced endothelial dysfunction. J. Hypertens. 2010, 28, 1234–1242. [Google Scholar] [CrossRef] [PubMed]
Figure 1. Flow chart of the study design for the inclusion and exclusion criteria. Abbreviations: HF, heart failure, INTERMACS, Interagency Registry for Mechanically Assisted Circulatory Support, NYHA, New York Heart Association.
Preprints 141778 g001
Table 1. Baseline characteristics of the study population.
Survival
N=295
Nonsurvival
N=134
P
Age, years 56 (50.0 - 60.0) 55 (50.0 - 60.0) 0.6835
Male, n (%) 263 (89.2) 113 (84.3) 0.1593
Ischemic etiology of HF (%)

HF, n (%)
191 (64.7) 89 (66.4) 0.736
BMI, kg/m2 26.1 (23.0 - 29.7) 25.6 (23.2 - 28.2) 0,1094
Hypertension, n (%) 146 (49.5) 62 (46.3) 0.5359
Type 2 diabetes, n (%) 152 (51.5) 82 (61.2) 0.0620
Dyslipidemia, n (%) 198 (67.1) 79 (59.0) 0.1014
Persistent AF, n (%) 132 (44.7) 61 (45.5) 0.8809
WBC, x 109/l 7.3 (6.0 - 8.6) 7.4 (6.2 - 8.7) 0.4293
Hemoglobin, mmol/l 8.8 (8.2 - 9.6) 8.8 (8.1 - 9.7) 0.902
Creatinine, umol/l 103.0 (90.0 - 119.0) 126.0 (108.0 - 138.0) <0.0001*
Total bilirubin, µmol/l 16.9 (11.7 - 22.8) 22.9 (15.9 - 32.3) <0.0001*
Albumin, g/l 43.0 (41.0 - 46.0) 37.0 (35.0 - 41.0) <0.0001*
Uric acid, µmol/l 419.0 (343.0 - 498.0) 502.0 (430.0 - 599.0) <0.0001*
Urea, µmol/l 7.7 (5.9 - 11.7) 9.10 (6.3 - 12.8) 0.0485*
Fibrinogen, mg/dl 369.0 (292.0 - 441.0) 412.5 (341.0 - 537.0) <0.0001*
AST, U/l 26.0 (20.0 - 31.0) 26.0 (21.0 - 34.0) 0.4975
ALT, U/l 23.0 (17.0 - 33.0) 22.00 (16.0 - 31.0) 0.5767
ALP, U/l 77.0 (57.0 - 101.0) 83.5 (65.0 - 109.0) 0.0447*
GGTP, U/l 62.0 (33.0 - 112.0) 91.0 (48.0 - 144.0) 0.0001*
Cholesterol, mmol/l 4.4 (3.8 - 4.9) 4.5 (4.1 - 4.9) 02376
hs-CRP, mg/l 3.0 (1.5 - 5.6) 6.0 (3.8 - 8.5) <0.0001*
Sodium, mmol/l 139.0 (138.0 - 141.0) 137.0 (135.0 - 139.0) <0.0001*
NT-proBNP, pg/ml 3564.0 (1761.0-6682.0) 5526.0 (2517.0-7645.0) 0.0006*
ST2, ng/ml 35.6 (29.8 - 45.4) 89.3 (70.2 - 101.3) <0.0001*
VO2max, mL/kg/min 11.0 (10.1 - 11.8) 11.2 (10.3 - 12.0) 0.0618
CI, l/min/m2 1.9 (1.7 - 1.9) 1.9 (1.7 - 2.1) 0.7124
PVR, Wood units 2.0 (1.6 - 2.4) 2.1 (1.5 - 2.9) 0.2234
LA, mm 52.0 (47.0 - 56.0) 53.0 (47.0 - 57.0) 0.202
RVEDd, mm 34.0 (30.0 - 42.0) 34.0 (30.0 - 40.0) 0,8325
LVEDd, mm 73.0 (68.0 - 78.0) 75.5 (70.0 - 82.0) 0.0014*
IVSd, mm 10.0 (9.0 - 11.0) 10.0 (9.0 - 11.0) 0.2246
PWTd, mm 10.0 (9.0 - 11.0) 10.0 (9.0 - 11.0) 0.2405
LVEF, % 18.0 (15.0 - 21.0) 18.0 (15.0 - 20.0) 0.1898
LVMI, g/m2 174.0 (149.9 - 199.2) 189.5 (160.5 - 226.5) 0.0002*
Cardiac medication on admission, n (%)
B-blockers, n (%) 273 (92.5) 127 (94.8) 0.3931
ACEI/ARB, n (%) 272 (92.2) 126 (94) 0.4983
Loop diuretics, n (%) 295 (100.0) 134 (100.0) 1.00
MRA, n (%) 282 (95.6) 124 (92.5) 0.1928
Flosins, n (%) 155 (52.5) 68 (50.7) 0.73
ICD/CRT-D, n (%) 295 (100.0) 134 (100.0) 1.00
Statins, n (%) 214 (72.5) 93 (69.4) 0.5041
Other parameters
modMELD 9.0 (7.5 - 11.1) 14.2 (11.7 - 16.9) <0.0001*
MELD-XI 12.0 (10.5 - 13.9) 14.8 (13.3 - 17.1) <0.0001*
ST2/LVMI 0.22 (0.16 - 0.29) 0.45 (0.34 - 0.58) <0.0001*
ST2/LVMI-MELD-XI 4.1 (3.6 - 4.7) 5.9 (5.3 - 6.8) <0.0001*
ST2/LVMI-modMELD 2.9 (2.4 - 3.5) 4.9 (4.2 - 5.7) <0.0001*
The data are presented as medians (25th–75th percentiles) or numbers (percentages) of patients. * p < 0.05 (statistically significant). Abbreviations: ACEI, angiotensin-converting enzyme inhibitor; AF, atrial fibrillation; ALP, alkaline phosphatase; ALT, alanine aminotransferase; AST, aspartate aminotransferase; ARB, angiotensin receptor blocker; BMI, body mass index; CI, cardiac index; CRT-D, cardiac resynchronization therapy-defibrillator; GGTP, gamma-glutamyl transpeptidase; HF, heart failure; hs-CRP, high-sensitivity C-reactive protein; ICD, implantable cardioverter-defibrillator; IVSs, septal thickness at end-diastole; LA, left atrium; LVEDd, left ventricular end-diastolic dimension; LVEF-left ventricular ejection fraction; LVMI, left ventricular mass index; MELD-XI, Model for End-stage Liver Disease excluding INR; modMELD, modified Model for End-stage Liver Disease; MRA, mineralocorticoid receptor antagonist; NT-proBNP, N-terminal pro-B-type natriuretic peptide; PVR, pulmonary vascular resistance; PWTd, posterior wall thickness at end-diastole; RVEDd, right ventricular end-diastolic dimension; sST2, soluble suppression of tumorigenicity 2; TPG, transpulmonary gradient; VO2max, maximal oxygen uptake; WBC, white blood cells.
Table 2. Univariable and multivariable analysis of predictors associated with one-year mortality.
Univariable data Multivariable data
Model 1
Multivariable data
Model 2
Parameter HR (95% CI) P HR (95% CI) P HR (95% CI) P
CRP (+) 1.018 [1.001-1.035] 0.0353
Fibrinogen (+) 1.004 [1.003-1.005] <0.001 1.002 [1.001-1.004] <0.001 1.002 [1.000-1.003] 0.0099
ALP (+) 1.005 [1.000-1.010] 0.0472
GGTP (+) 1.006[1.003-1.009] <0.001
Uric acid (+) 1.003 [1.002-1.004] <0.001 1.001 [1.000-1.002] 0.0426 1.001 [1.000-1.002] 0.0489
Urea (+) 1.023 [0.996-1.051] 0.0980
NT-proBNP (a) 1.006[1.003-1.009] <0.001 1.004 [1.004-1.007] 0.0081 1.005 [1.002-1.008] 0.0020
Sodium (-) 1.164 [1.103-1.229] <0.001 1.065 [1.004-1.130] 0.0360
ST2/LVMI-MELD-XI (+) 2.718 [2.369-3.118] <0.001 2.501 [2.168-2.886] <0.001
ST2/LVMI-modMELD (+) 2.718 [2.389-3.092] <0.001 2.552 [2.224-2.928] <0.0001
Abbreviations: see Table 1, CI, confidence interval; HR, hazard ratio. (+) per one unit increase. (-) per one unit decrease. a per 100-unit increase.
Table 3. A summary of the ROC curve analysis for biomarkers.
AUC
[±95 CI]
Cut-off Sensitivity
[±95 CI]
Specificity
[±95 CI]
PPV
[±95 CI]
NPV
[±95 CI]
Accuracy
sST2/LVMI 0.88 [0.84-0.91] ≥0.306 0.84 [0.76-0.89] 0.79 [0.74-0.84] 0.65 [0.57-0.72] 0.91 [0.87-0.94] 0.81 [0.77-0.84]
MELD-XI 0.78 [0.73-0.83] ≥13.96 0.69 [0.60-0.76] 0.76 [0.71-0.81] 0.57 [0.49-0.65] 0.84 [0.79-0.88] 0.74 [0.69-[0.78]
ModMELD 0.85 [0.81-0.89] ≥12.55 0.70 [0.62-0.78] 0.88 [0.84-0.91] 0.72 [0.64-0.80] 0.87 [0.82-0.90] 0.82 [0.78-0.86]
sST2/LVMI-MELDXI 0.90 [0.87-0.93] ≥5.07 0.80 [0.72-0.86] 0.85 [0.80-0.89] 0.70 [0.62-0.78] 0.90 [0.86-0.93] 0.83 [0.79-0.87]
sST2/LVMI-modMELD 0.92 [0.89-0.95] ≥4.04 0.81 [0.74-0.88] 0.92 [0.88-0.94] 0.81 [0.74-0.88] 0.92 [0.88-0.944] 0.88 [0.85-0.91]
Abbreviations: see Table 1; Abbreviations: see Table 1.
Table 4. A comparison of the areas under the ROC curves for the new scales and their components.
ST2/LVMI- modMELD, AUC [±95 CI]1 P
modMELD, AUC [±95 CI] 0.0214 [0.00251-0.0402] 0.0263
LVMI/ST2, AUC [±95 CI] 0.0862 [0.0540-0.1183] 0.0001
ST2/LVMI- MELD-XI AUC [±95 CI]1 P
MELD-XI, AUC [±95 CI] 0.0486 [0.0213-0.0760] 0.0005
LVMI/ST2 AUC [±95 CI] 0.0456 [0.0157-0.0755] 0.0028
1 AUC difference between the new scale and its components. Abbreviations: see Table 1; AUC, area under the curve; CI, confidence interval.
Disclaimer/Publisher’s Note: The statements, opinions and data contained in all publications are solely those of the individual author(s) and contributor(s) and not of MDPI and/or the editor(s). MDPI and/or the editor(s) disclaim responsibility for any injury to people or property resulting from any ideas, methods, instructions or products referred to in the content.
Copyright: This open access article is published under a Creative Commons CC BY 4.0 license, which permit the free download, distribution, and reuse, provided that the author and preprint are cited in any reuse.
Prerpints.org logo

Preprints.org is a free preprint server supported by MDPI in Basel, Switzerland.

Subscribe

Disclaimer

Terms of Use

Privacy Policy

Privacy Settings

© 2025 MDPI (Basel, Switzerland) unless otherwise stated