
Submitted:
19 December 2024
Posted:
19 December 2024
You are already at the latest version
Abstract
Ammonia is one of the primary chemical commodities produced and is widely used as a fertilizer, with increasing interest as an energy storage vector. The primary method for producing ammonia today, the Haber-Bosch process, requires large amounts of energy and resources. Microbial production of ammonia is being developed and could provide more sustainable alternatives. No success has been achieved in using natural yeast cells. This paper reports that growing different Saccharomyces cerevisiae strains in a carbon/nitrogen unbalanced rich-protein medium results in limited ammonia secretion. Through adaptive laboratory evolution of the CEN.PK 113-7D strain, we selected an evolved strain with a 5-fold increase in ammonia excretion and amino acid utilization. Multi-step bioreactor fermentation of the evolved strain allowed the production of 1,36 g/L of ammonia, a value in line with levels produced by other microbial systems. This proof-of-concept study suggests that yeast-based processes can be adapted straightforwardly to ammonia production from high-protein-waste derived from several sources.
Keywords:
S. cerevisiae
; adaptive laboratory evolution
; bioreactor
; protein-based medium
; ammonia
1. Introduction
Ammonia (NH3) is a colorless gas composed of nitrogen and hydrogen. It is one of the most produced chemicals worldwide, with a global production of 235 million metric tons [1]. About 70% is used in the agricultural sector to synthesize nitrogenous fertilizers [2], with the remainder used for a wide range of applications, such as plastics, pharmaceuticals, explosives, dyes, and other industrial chemicals [3]. Ammonia can also be used as a low-carbon fuel and energy storage due to its high hydrogen volumetric content (121 kg m-3) and weight fraction (17.6%) [1,4]. Most synthetic ammonia is produced nowadays through the Haber-Bosch process, which requires high temperature (400-650°C) and pressure (100-400 bar) operating conditions [5]. Therefore, this process is highly energy-demanding, accounting for 2% of the global energy supply [6]. Moreover, since it mainly relies on the use of fossil fuels, it is responsible for direct emissions of 450 Mt CO2 every year [7]. The migration towards a carbon-free society should consider ammonia production’s impact. Therefore, the future demand for ammonia must be accomplished by seeking different sustainable solutions. To this aim, microorganisms’ exploitation represents a practical option thanks to their plasticity. Microbial ammonia production has been obtained by combining various genetic manipulations with several protein-based biomasses. In Azotobacter vinelandii, the disruption of various genes led to increased natural ammonia secretion, making it interesting from an agricultural perspective [8]. Furthermore, ammonia-producing bacteria from different biomasses were achieved by the metabolic engineering of Bacillus subtilis and Escherichia coli [9,10,11].
Even though the yeast S. cerevisiae is one of the most suitable and used microorganisms in biotechnology, ammonia production from wild-type cells has yet to be reported [12]. Indeed, defects in genes related to ammonia uptake or nitrogen compound degradation are associated with unsustainable or low growth in this organism. Watanabe and colleagues accomplished ammonia production outside the cell by expressing a heterologous catabolic enzyme on the yeast surface and feeding cells with single amino acids or mixtures [4,13]. This study uses the vast biological, genetic, and fermentation knowledge accumulated for budding yeast to exploit the S. cerevisiae deamination metabolism to increase ammonia release through better amino acid utilization. An essential step in our strategy was using an unbalanced carbon/nitrogen medium to promote ammonia excretion as a selection medium for applying an adaptive laboratory evolution strategy (ALE), which provided strains with improved ammonia production and amino acid utilization. Through a multi-step fed-batch fermentation of the evolved strain, we obtained ammonia accumulation in the medium to a level comparable to the production obtained by other microbiological systems [14]. Therefore, this study provides strains and fermentation protocols that could be the basis for successfully using S. cerevisiae for sustainable ammonia production from proteinaceous wastes.
2. Materials and Methods
2.1. Strains and Shake Flask Cultivation
S. cerevisiae strains are listed in Table 1. Strains were stored at -80°C in YPD medium, containing 10 g/L yeast extract, 20 g/L peptone, and 20 g/L d-glucose, with 30% (v/v) glycerol. Before any experiment, aliquots of each strain were refreshed on YP medium (yeast extract 10 g/L and peptone 20 g/L) at 30°C for two days. For adaptive laboratory evolution and ammonia production, strains were grown in a YPD or YP medium buffered with 0.4 M KH2PO4 at pH 5.0. Shake flask cultivations were carried out in 250 ml shake flasks with 50 ml of fresh medium at 0.2 OD (optical density 660 nm), and the inoculation occurred from a preculture in the log phase. The cultures were then incubated at 30°C with shaking at 160 rpm. Samples were collected to determine growth and metabolites.
2.2. Dry Weight Determination
Biomass dry weight was quantified by directly measuring the weight of the samples. Approximately 50 OD were centrifuged at 13.000 RPM for 3 min at room temperature, washed three times with deionized water, and dried at 45°C in a 1,5 ml pre-weighted dry Eppendorf tube until constant weight.
2.3. Bioreactor Cultivation
Bioreactor cultivation was carried out in YP medium in an autoclaved 2 L water-jacketed bioreactor (Biostat M, B. Braun, Melsungen, Germany) with a 1,5 L useful volume. A Biostat C fermentation unit monitored temperature, pH, aeration, and foam formation. The temperature was set at 30°C, with aeration and mixing regulated as a function of dissolved oxygen (DO), which was maintained above 20%. The filtered air was fed through a sparger at a flow rate of 1 VVM. pH was automatically adjusted to 5 using 2M KOH and 2M H3PO4. Foam formation was controlled using a silicon polymer suppressor (Antifoam A, Sigma-Aldrich). Cells precultured in a shake flask were harvested by centrifugation at 4000 rpm for 5 min, washed twice with cold, sterile water, and resuspended in 5 mL sterile water before transfer into the bioreactor. OD was measured to inoculate the bioreactor at 0.2. Before use, the reactors, antifoam bottles, and the pH control solution were autoclaved at 121 °C for 30 min.
2.4. Three-Step Fermentation
Using the same equipment used for batch cultivation, we carried out a 3-step fermentation strategy with a 1 L working volume. The duration of the batch phase was 24 hours. After this period, we initiated a linear feeding strategy using fresh YP-concentrated medium (500 mL, yeast extract 100 g/L, peptone 200 g/L) with a peristaltic pump set at 25 mL/h. When no changes in the optical density were observed, we started the third phase by adding 3% trehalose.
2.5. Ammonia, Trehalose, Glycerol, Acetic Acid Determination
The concentration of ammonia in the supernatant was measured using an enzymatic assay K-AMIAR (Ammonia-Rapid kit, Megazyme, Wicklow, Ireland). At the end of the reaction, the absorbance of the mixture at 340 nm was read twice until no further movements were observed. The background ammonia concentration in different media was subtracted from the final values for each determination. All calculations were performed using the Megazyme Excel calculation sheet. Trehalose, glycerol, acetic acid, and amino acid concentrations were determined by chromatographic analysis using a Jasco HPLC system (Jasco Europe, Cremella, Lecco, Italy). The injection volume of the samples and standards was 20 μL. Trehalose, glycerol, and acetic acid were monitored using an Aminex-HPX-87H (Bio-Rad) and a cation H+ micro guard cartridge (Bio-Rad Laboratories, Hercules, CA, USA). Analyses were performed isocratically at 0.5 mL/min and 55°C. The mobile phase consisted of 5 mM H2SO4, and the compounds were detected using a refractive index detector.
2.6. Amino Acid Analysis
Amino acid analyses were performed using the method previously described [18]. The derivatized amino acids were separated using a Waters (Milford, MA) XTerra RP18 Column (4.6 mm × 250 mm i.d, 5μm particle size) equipped with a precolumn Security Guard (Phenomenex, U.S.). Separation was performed at 40°C. The flow rate of the mobile phase was 1 ml/min throughout the analysis. The pre-column derivatization reagent o-phthalaldehyde (OPA) was prepared by dissolving 25 mg of OPA and 25 mg of 3-Mercaptopropionic acid in 5 mL of 0.2 M borate buffer, pH 10.2. The 9-Fluorenylmethyloxycarbonyl (FMOC) stock solution was prepared by dissolving FMOC in acetonitrile (1,25 mg/mL). All the solutions were flushed with nitrogen and stored in the dark at 4°C until any sign of degradation was observed. The derivatization reaction was initiated by adding 5.5 μL of the derivatization reagents to 5.5 μL of the sample and bringing it up to 200 μL with water. Mobile phases A (40 mM Sodium Phosphate Buffer, pH 7.8) and B (30% acetonitrile: 60% methanol: 10%H2O) were used for HPLC separation. Before each sample, the column was equilibrated with 94.5%/5.5% (v/v) mobile phase A-B for 10 min. The elution gradient was set as follows: 94.5%/ 5.5% for 0.85 min; 2.15-min linear gradient to 13% phase B; 23 min linear gradient to 54% phase B; 7 min linear gradient to 66% phase B; 94.5%/ 5.5% for 7 min. Uv detection was initially set at 338nm until min 27 and then switched to 265nm. A standard amino acid solution was prepared in 0.1 N HCL, and the peaks were identified by comparison with retention times.
2.7. Adaptive Laboratory Evolution and Screening
We induced ALE in a YP medium (yeast extract 10 g/L, peptone 20 g/L). The initial strains were inoculated in 50 mL shake flasks grown at 30°C and 160 rpm. Every ten days, 5 ml of the culture was transferred to 50 ml fresh YP. This process was repeated for a total of 10 cycles. Simultaneously, samples of the same culture were transferred onto YP medium plates (yeast extract 10 g/L, peptone 20 g/L, and technical agar 20 g/L) to obtain approximately 500 cells per plate. The plates were incubated at 30°C. After 5-7 days, the largest colonies were selected for more accurate screening. For each cycle of inoculation, the cultures completed four–five duplications. Single clones were screened for growth in 15 mL tubes containing 3 mL of fresh medium (YP) and grown at 30°C. After 72h, growth was measured at OD. Clones with the larger colonies on plates and the best growth were selected for further experiments.
2.8. Total Peptide Determination
The supernatant fraction was determined with 0,1 mL of culture preventively evaporated in a vacufuge (Eppendorf, Hamburg, Germany). Total protein content was determined using the modified Biuret method [19]. Samples were suspended in 0,9 ml KOH 1M and boiled for 10 min. After cooling on ice, 0,1 ml of CuSO4*5H2O 250 mM was added to a final concentration of 25 mM. After 5 min at room temperature, the samples were centrifuged for 2 min, and the absorbance of the supernatant was read at 550 nm. BSA was used as the standard.
2.9. Specific Growth Rate, Ammonia Yield, and Nitrogen Consumption Ratio
The maximum specific growth rate, µmax (h-1), was calculated by the following equation:
where tD is the time required for a duplication measured by optical density (OD). Ammonia yields were calculated based on total nitrogen uptake: grams of ammonia produced divided by the sum of nitrogen grams derived from peptides, using a conversion factor of 6.25 [20], and from individual amino acids [20]. We introduce the nitrogen consumption ratio (TN/OD) to evaluate the amount of nitrogen consumed to produce 1 OD. TN/OD was calculated by taking the total amount of nitrogen consumed expressed as the sum of amino acids and peptides (g/L) and dividing it by the maximum turbidity (OD) at 72 hours of growth when no more ammonia secretion was observed.
2.10. Statistical Analysis
Data were represented as the mean ± SD. Student’s t-test and one-way Welch’s ANOVA followed by post hoc tests (Games-Howell, Dunnett) between wild-type strains and between the evolved (AAV) clones with their isogenic parental strain were performed using JASP (a graphical user interface for R: https://jasp-stats.org/). p values < 0.05 were considered statistically significant.
3. Results
3.1. Growth on Carbon/Nitrogen Unbalanced Sources Enhances Ammonia Release in Saccharomyces cerevisiae
Many studies have reported ammonia accumulation in bacteria grown in protein-rich media [13,21,22], in which amino acid deamination produces ammonia molecules eventually released outside the cells [10]. Budding yeast, in general, strongly assimilates ammonia as the preferred nitrogen source; however, low levels of extracellular ammonia in the presence of abundant nitrogen compounds are frequently observed [23,24]. YP is a classic rich medium for S. cerevisiae, which contains a mixture of peptides, amino acids, growth factors, purine and pyrimidine bases, carbohydrates, and water-soluble B-group vitamins [25]. In addition to amino acids and peptides, YP contains trehalose, acetate, and glycerol, which could support some yeast biomass accumulation (Table S1). YP is usually supplemented with a carbon source, such as glucose (YPD). Given the known interconnection between glucose catabolite repression and amino acid and ammonium transport [26,27], we grew the same S. cerevisiae strains in the presence of 2% glucose (YPD) or with no sugar supplementation (YP). All strains successfully grew in YP media, even without adding glucose to the medium. The final biomass exhibited significant variation among the tested strains, particularly in YPD (Figure 1A, B), emphasizing the role of glucose as the primary carbon source in sustaining biomass accumulation. Yeast strains grown on YPD medium till the stationary phase (Figure 1A) did not consume all the available amino acids and proteins/peptides (Figure 1C, D, left bars and Table S1). Despite differences in growth kinetics among different YPD-grown strains, the uptake of amino acids and peptides consistently aligned with biomass production as estimated by the obtained OD. By the end of growth in YPD, low ammonia levels were found in the extracellular environment (Figure 1E, left bars), which agrees with Rojas et al.’s findings [28]. YP-grown cells attained a significantly lower final OD than YPD-grown cells, with a lower amino acid and peptide uptake (Figure 1 C, D). At the end of the growth phase, we observed complete consumption of the largest carbon source in YP, trehalose (Data not shown), and the partial uptake of peptides and amino acids (Table S2), suggesting that certain amino acids and peptides were used not in protein biosynthesis but as a carbon source. Presumably, this scenario resulted in enhanced ammonia production, eventually leading to a 2-5-fold increase of ammonia released in the spent growth medium (Figure 1E). The nitrogen consumption ratio (TN/OD, see Materials & Methods section), used to estimate the mass-normalized amount of nitrogen consumed by the cells, was, on average, higher in YP than in YPD, with statical significance for CBS8272, CBS8267, and CEN.PK113.7D (Figure 1F).
3.2. Increased Amino Acid Catabolism Correlates with High Ammonia Secretion
Yeast cells can synthesize amino acids de novo but also actively import them from the medium [29]. Enhanced amino acid metabolism gives an energetic advantage, and amino acid breakdown provides carbon and nitrogen ready for use. We applied Adaptive Laboratory Evolution (ALE) to the representative S. cerevisiae CEN.PK 113-7D strain to test the possibility of isolating yeast variants having better fitness on YP (Figure 2A). We isolated seven CEN.PK 113-7D-derived clones showing no decrease in overall growth rate compared to the non-evolved wild-type strain (0,28 µ-1), and capable of completing one further round of mass duplication. The only exception was the evolved strain AAV1, showing a growth rate of 0,19 µ-1 and reaching a lower final OD (Figure 2B). All the evolved strains consumed, on average, about 3-4-fold more amino acids than their wild-type isogenic counterparts (Figure 2C), while no significant difference was observed in the peptide uptake rate (Figure 2D). Ammonia production increased by 3 to 5 times (Figure 2E), reflecting the higher usage of amino acids. The uptake of seven proteogenic amino acids (Asp, Glu, Asn, Ser, Arg, Ala, and Trp) was enhanced (Figure S1). Once again, we observed a trend of increased nitrogen uptake per OD unit, with statistically significant results for clones AAV1 and AAV6 (Figure 2F). Because of its slow growth phenotype, strain AAV1 was not further considered, and the evolved strain AAV6 was used in the following bioreactor experiments.
3.3. Improved Amino Acid Uptake Yields Significant Ammonia Production
Batch fermentation of the AAV6 strain in a bioreactor did not improve the NH3 production process (Figure 3A) despite a remarkable increase in biomass yield resulting from a reduction in total amino acid and peptide uptake (Figure 3B). Therefore, we transitioned to a three-step fermentation strategy to further stimulate amino acid uptake and, ultimately, ammonia accumulation. Initially, cells were cultured in batch mode until they reached an optical density of 10 (Figure 3C). After 24h, 500 ml of fresh, concentrated medium (Yeast extract 100 g/L – Peptone 200 g/L) was provided in a feeding mode for 20 hours, resulting in turbidity of 30 OD and 0.53 g/L of ammonia produced (Figure 3D). At the end of the second phase, a significant amount of residual amino acids remained in the medium. In particular, the amino acids glutamate and aspartate, which tended to be zero in the batch bioreactor tests (Figure S2), were still present (Figure S3). At this point, a third phase was initiated by adding 30 g/L trehalose to allow the cells to continue consuming amino acids and avoid ammonia uptake. The uptake of residual amino acids was observed, and the turbidity of the culture increased to 110. This protocol allowed us to obtain 1,36 g/L of ammonia (Figure 3D) with amino acids and peptide uptake of 8,8 g/L and 10,1 g/L, respectively. The final ammonia yield relative to the whole amino acids and peptides usage was 0.34 g/g.
4. Discussion
Due to massive requests for fertilization and transport applications, worldwide ammonia demand is expected to increase in the coming decades [30]. Ammonia production is primarily carried out via the Haber-Bosch synthesis, and much effort has been devoted in the last ten years to investigate the potential use of microorganisms for sustainable production [4,12]. Most attempts have been directed towards the use of B. subtilis or E. coli, harboring deletions of genes involved in nitrogen metabolism and able to exploit the deamination of amino acids to produce ammonia [9,10,11,14]. Yeast has generally not been considered for two main reasons: firstly, deletion of genes involved in nitrogen metabolism is deleterious and leads to poor growth [30,31,32]; moreover, ammonia is a preferred nitrogen source for yeast cells, that are more inclined to absorb ammonia from the environment rather than to release it [33]. To date, successful ammonia production from yeast has been achieved only by using strains expressing either glutaminase or L-amino acid oxidase on the cellular surface, enhancing enzyme efficiency by allowing direct interaction with extracellular substrates [4,13]. In this study, we demonstrate the possibility of using the yeast S. cerevisiae by exploiting its metabolism to produce ammonia naturally. Using Adaptive Laboratory Evolution of the wild-type strain CEN.PK 113-7D in YP medium (i.e., in a condition promoting ammonia secretion in a shake flask, Figure 2A), we isolated different clones characterized by a strong biomass formation, enhanced amino acids usage, and impressive ammonia production compared to the wild-type strain (Figure 2B, C, E). As shown in Figure 2C and in comparison with Figure 2D, the improved release of ammonium may be associated with increased amino acid uptake and consumption. Besides aspartate and glutamate, the evolved strains used other amino acids such as asparagine, serine, arginine, alanine, and tryptophan, contributing to their phenotype of overall increased amino acid uptake (Figure S1). When grown in the presence of glucose, the phenotypical changes acquired by ALE disappeared, and little ammonium was generated (Table S3). In both wild-type and evolved strains, as well as in shake flasks or the fermenter, growth in the glucose-free medium is mandatory to stimulate ammonia production, similar to what is observed in E. coli [11]. Previous studies in yeast suggested that higher consumption of amino acids is associated with a catabolite derepressed state, a process involving the PKA and TOR pathways [27]. Once internalized, the amino acid’s carbon skeleton is directly used as a carbon source [34], while ammonia resulting from deamination can be stored as glutamic acid, glutamine, and other branched-chain amino acids [35]. We speculated that ammonia excretion in YP is due to excess nitrogen not being employed for biomass production [36]. The differences in concentrations of produced ammonia between YPD and YP could be related to the main carbon source forming the biomass. Since nitrogen accounts for 9% of yeast biomass [19,37] while it constitutes about 16% of average proteins [20], the growth of amino acids results in a surplus of nitrogen. Due to its toxic effect and in analogy with bacteria, as well as previous observations in nutrient sources that function as both carbon and nitrogen [36], the share of nitrogen not necessary for biomass formation would be released outside the cells. Indeed, in the batch fermentation of the evolved strain, nearly two-thirds of input nitrogen present in amino acids and peptides (Figure 4, blue and red portions of the Nitrogen Input bar) does not accumulate in the biomass but instead is excreted as ammonia in the medium (Figure 4, green portion of the Nitrogen Output bar). Given the central role of amino acid transport in ammonia excretion, a genetic and transcriptional analysis of amino acid transporters expressed during fermentation may identify the transporter involved and suggest strategies to improve amino acid transport, possibly leading to improved ammonia release. Our results show that S. cerevisiae can release ammonia from nitrogen-enriched substrates in response to an imbalance in the C/N ratio. Therefore, contrary to what has been reported in previous studies [13], yeast can be used to produce ammonia through its metabolism, which is in line with previous findings in other microorganisms [10,11,14,22]. Yeast showed specificity in amino acid utilization, and the ALE protocol expanded the range of employed substrates. Growing the evolved AAV6 strain according to a three-step fermentation strategy involving a batch step, a linear feeding strategy with fresh YP-concentrated medium, and a final addition of trehalose, we obtained the release of a total of 1,36 grams of ammonia per liter. To the best of our knowledge, this represents the highest level of natural ammonia secretion from S. cerevisiae observed in the context of intracellular production, closely aligning with typical levels recorded in other microbial systems [12]. We believe that ammonia production can be further enhanced by increasing and maximizing the range of amino acid usage while maintaining cells in a state of catabolite derepression. Although this study has focused on producing ammonia using conventional substrates, future improvements in this process may involve protein-rich waste derived from several sources.
Supplementary Materials
The following supporting information can be downloaded at the website of this paper posted on Preprints.org, Table S1: Detailed YP/YPD composition; Table S2:Residual amino acids after 72 h of growth in YP buffered medium; Table S3: Ammonia generated by CEN.PK113-7D and Evolved Strain in YPD medium at the end of growth (72 hour); Figure S1: Quantification of free amino acid levels in YP medium after 72 hours of cultivation; Figure S2: Quantification of free amino acid levels in a bioreactor (AAV6); Figure S3: 3-step fermentation strategy with AAV6.
Author Contributions
Data curation; formal analysis; investigation; methodology; writing – original draft, A.A; investigation; methodology, T.S.; Investigation; methodology, A.G.; Data curation; methodology, S.B.; investigation; writing – review and editing M.V.; investigation; methodology; writing – original draft; writing – review and editing, L.B. All authors have read and agreed to the published version of the manuscript.
Funding
This work was supported by grants from the Ministry of University and Research (MIUR): ISBE-SYSBIO infrastructure and from ”ELIXIRxNextGenerationIT” (Code IR0000010)-CUP B53C22001800006 to M.V.. A.P. benefits of a post-doctoral research fellowship (Assegno di Ricerca) from the University of Milano-Bicocca.
Data Availability Statement
Data will be made available on request.
Acknowledgments
The authors thank Francesca Polizzo for her assistance in preparing the samples for HPLC analysis.
Conflicts of Interest
The authors declare that the research was conducted without any commercial or financial relationships that could be construed as a potential conflict of interest.
References
- Ghavam, S.; Vahdati, M.; Wilson, I.A.G.; Styring, P. Sustainable Ammonia Production Processes. Front. Energy Res. 2021, 9, 1–19. [Google Scholar] [CrossRef]
- Amhamed, A.I.; Shuibul Qarnain, S.; Hewlett, S.; Sodiq, A.; Abdellatif, Y.; Isaifan, R.J.; Alrebei, O.F. Ammonia Production Plants—A Review. Fuels 2022, 3, 408–435. [Google Scholar] [CrossRef]
- Cardoso, J.S.; Silva, V.; Rocha, R.C.; Hall, M.J.; Costa, M.; Eusébio, D. Ammonia as an Energy Vector: Current and Future Prospects for Low-Carbon Fuel Applications in Internal Combustion Engines. J. Clean. Prod. 2021, 296, 126562. [Google Scholar] [CrossRef]
- Watanabe, Y.; Aoki, W.; Ueda, M. Sustainable Biological Ammonia Production towards a Carbon-Free Society. Sustainability 2021, 13, 1–13. [Google Scholar] [CrossRef]
- Chen, S.; Perathoner, S.; Ampelli, C.; Centi, G. Electrochemical Dinitrogen Activation: To Find a Sustainable Way to Produce Ammonia. Stud. Surf. Sci. Catal. 2019, 178, 31–46. [Google Scholar] [CrossRef]
- Kyriakou, V.; Garagounis, I.; Vourros, A.; Vasileiou, E.; Stoukides, M. An Electrochemical Haber-Bosch Process. Joule 2020, 4, 142–158. [Google Scholar] [CrossRef]
- Liu, X.; Elgowainy, A.; Wang, M. Life Cycle Energy Use and Greenhouse Gas Emissions of Ammonia Production from Renewable Resources and Industrial By-Products. Green Chem. 2020, 22, 5751–5761. [Google Scholar] [CrossRef]
- Mus, F.; Khokhani, D.; MacIntyre, A.M.; Rugoli, E.; Dixon, R.; Ané, J.M.; Peters, J.W. Genetic Determinants of Ammonium Excretion in nifL Mutants of Azotobacter Vinelandii. Appl. Environ. Microbiol. 2022, 88. [Google Scholar] [CrossRef] [PubMed]
- Huo, Y.X.; Cho, K.M.; Rivera, J.G.L.; Monte, E.; Shen, C.R.; Yan, Y.; Liao, J.C. Conversion of Proteins into Biofuels by Engineering Nitrogen Flux. Nat. Biotechnol. 2011, 29, 346–351. [Google Scholar] [CrossRef]
- Choi, K.Y.; Wernick, D.G.; Tat, C.A.; Liao, J.C. Consolidated Conversion of Protein Waste into Biofuels and Ammonia Using Bacillus Subtilis. Metab. Eng. 2014, 23, 53–61. [Google Scholar] [CrossRef]
- Tatemichi, Y.; Kuroda, K.; Nakahara, T.; Ueda, M. Efficient Ammonia Production from Food By-Products by Engineered Escherichia Coli. AMB Express 2020, 10. [Google Scholar] [CrossRef]
- Watanabe, Y.; Aoki, W.; Ueda, M. Ammonia Production Using Bacteria and Yeast toward a Sustainable Society. Bioeng. 2023 Vol 10 Page 82 2023, 10, 82–82. [Google Scholar] [CrossRef]
- Watanabe, Y.; Kuroda, K.; Tatemichi, Y.; Nakahara, T.; Aoki, W.; Ueda, M. Construction of Engineered Yeast Producing Ammonia from Glutamine and Soybean Residues (Okara). AMB Express 2020, 10. [Google Scholar] [CrossRef]
- Adeniyi, A.; Bello, I.; Mukaila, T.; Sarker, N.C.; Hammed, A. Trends in Biological Ammonia Production. BioTech 2023, 12, 41–41. [Google Scholar] [CrossRef]
- Dijken, J.P.V.; Bauer, J.; Brambilla, L.; Duboc, P.; Francois, J.M.; Gancedo, C.; Giuseppin, M.L.F.; Heijnen, J.J.; Hoare, M.; Lange, H.C.; et al. An Interlaboratory Comparison of Physiological and Genetic Properties of Four Saccharomyces Cerevisiae Strains. Enzyme Microb. Technol. 2000, 26, 706–714. [Google Scholar] [CrossRef]
- Wenzel, T.J.; Van Den Berg, M.A.; Visser, W.; Van Den Berg, J.A.; Steensma, H.Y. Characterization of Saccharomyces Cerevisiae Mutants Lacking the E1α Subunit of the Pyruvate Dehydrogenase Complex. Eur. J. Biochem. 1992, 209, 697–705. [Google Scholar] [CrossRef]
- Brachmann, C.B.; Davies, A.; Cost, G.J.; Caputo, E.; Li, J.; Hieter, P.; Boeke, J.D. Designer Deletion Strains Derived from Saccharomyces Cerevisiae S288C: A Useful Set of Strains and Plasmids for PCR-Mediated Gene Disruption and Other Applications. Yeast 1998, 14, 115–132. [Google Scholar] [CrossRef]
- De Divitiis, M.; Ami, D.; Pessina, A.; Palmioli, A.; Sciandrone, B.; Airoldi, C.; Regonesi, M.E.; Brambilla, L.; Lotti, M.; Natalello, A.; et al. Cheese-Whey Permeate Improves the Fitness of Escherichia Coli Cells during Recombinant Protein Production. Biotechnol. Biofuels Bioprod. 2023, 16, 30. [Google Scholar] [CrossRef]
- Verduyn, C.; Postma, E.; Scheffers, W.A.; Dijken, J.P.V. Physiology of Saccharomyces Cerevisiae in Anaerobic Glucose-Limited Chemostat Cultures. J. Gen. Microbiol. 1990, 136, 395–403. [Google Scholar] [CrossRef] [PubMed]
- Jones, D.B. (David B. Factors for Converting Percentages of Nitrogen in Foods and Feeds into Percentages of Proteins. US Dep. Agric. Circ. Ser. 1931, 183, 1–21. [Google Scholar]
- Whitehead, T.R.; Cotta, M.A. Isolation and Identification of Hyper-Ammonia Producing Bacteria from Swine Manure Storage Pits. Curr. Microbiol. 2004, 48, 20–26. [Google Scholar] [CrossRef]
- Mikami, Y.; Yoneda, H.; Tatsukami, Y.; Aoki, W.; Ueda, M. Ammonia Production from Amino Acid-Based Biomass-like Sources by Engineered Escherichia Coli. AMB Express 2017, 7. [Google Scholar] [CrossRef]
- Palková, Z.; Forstová, J. Yeast Colonies Synchronise Their Growth and Development. J. Cell Sci. 2000, 113 (Pt 11), 1923–1928. [Google Scholar] [CrossRef]
- Palkova, Z.; Janderova, B.; Gabriel, J.; Zikanova, B.; Pospisek, M.; Forstova, J. Ammonia Mediates Communication between Yeast Colonies. Nature 1997, 390, 532–536. [Google Scholar] [CrossRef]
- Sivapragasam, M.; Wilfred, C.D.; Jaganathan, J.R.; Krishnan, S.; Ghani, W.A.W.A.W.K. Choline-Based Ionic Liquids as Media for the Growth of Saccharomyces Cerevisiae. Process. 2019 Vol 7 Page 471 2019, 7, 471–471. [Google Scholar] [CrossRef]
- Peter, G.J.; §, L.D.R.; Ahmed, A. Carbon Catabolite Repression Regulates Amino Acid Permeases in Saccharomyces Cerevisiae via the TOR Signaling Pathway *. J. Biol. Chem. 2006, 281, 5546–5552. [Google Scholar] [CrossRef]
- Hothersall, J.S.; Ahmed, A. Metabolic Fate of the Increased Yeast Amino Acid Uptake Subsequent to Catabolite Derepression. J. Amino Acids 2013, 2013, 1–7. [Google Scholar] [CrossRef]
- Cueto-Rojas, H.F.; Seifar, R.M.; ten Pierick, A.; van Helmond, W.; Pieterse, M.M.; Heijnen, J.J.; Wahl, S.A. In Vivo Analysis of NH4+ Transport and Central Nitrogen Metabolism in Saccharomyces Cerevisiae during Aerobic Nitrogen-Limited Growth. Appl. Environ. Microbiol. 2016, 82, 6831–6831. [Google Scholar] [CrossRef] [PubMed]
- Ruiz, S.J.; van ’t Klooster, J.S.; Bianchi, F.; Poolman, B. Growth Inhibition by Amino Acids in Saccharomyces Cerevisiae. Microorganisms 2021, 9, 1–17. [Google Scholar] [CrossRef] [PubMed]
- Nishina, K. New Ammonia Demand: Ammonia Fuel as a Decarbonization Tool and a New Source of Reactive Nitrogen. Environ. Res. Lett. 2022, 17, 21003–21003. [Google Scholar] [CrossRef]
- Hess, D.C.; Lu, W.; Rabinowitz, J.D.; Botstein, D. Ammonium Toxicity and Potassium Limitation in Yeast. PLoS Biol. 2006, 4, 2012–2023. [Google Scholar] [CrossRef]
- Santos, J.; Sousa, M.J.; Leão, C. Ammonium Is Toxic for Aging Yeast Cells, Inducing Death and Shortening of the Chronological Lifespan. PLoS ONE 2012, 7. [Google Scholar] [CrossRef] [PubMed]
- Roca-mesa, H.; Sendra, S.; Mas, A.; Beltran, G.; Torija, M.J. Nitrogen Preferences during Alcoholic Fermentation of Different Non-Saccharomyces Yeasts of Oenological Interest. Microorganisms 2020, 8. [Google Scholar] [CrossRef] [PubMed]
- Plaitakis, A.; Kalef-Ezra, E.; Kotzamani, D.; Zaganas, I.; Spanaki, C. The Glutamate Dehydrogenase Pathway and Its Roles in Cell and Tissue Biology in Health and Disease. Biology 2017, 6, 1–26. [Google Scholar] [CrossRef] [PubMed]
- Alberghina, L.; Mavelli, G.; Drovandi, G.; Palumbo, P.; Pessina, S.; Tripodi, F.; Coccetti, P.; Vanoni, M. Cell Growth and Cell Cycle in Saccharomyces Cerevisiae: Basic Regulatory Design and Protein-Protein Interaction Network. Biotechnol. Adv. 2012, 30, 52–72. [Google Scholar] [CrossRef] [PubMed]
- Flores, C.L.; Gancedo, C. Construction and Characterization of a Saccharomyces Cerevisiae Strain Able to Grow on Glucosamine as Sole Carbon and Nitrogen Source. Sci. Rep. 2018, 8, 1–10. [Google Scholar] [CrossRef] [PubMed]
- Yu, R.; Campbell, K.; Pereira, R.; Björkeroth, J.; Qi, Q.; Vorontsov, E.; Sihlbom, C.; Nielsen, J. Nitrogen Limitation Reveals Large Reserves in Metabolic and Translational Capacities of Yeast. Nat. Commun. 2020 111 2020, 11, 1–12. [Google Scholar] [CrossRef]
Figure 1.
S. cerevisiae characterization in YPD and YP. (A) Growth curves of different S. cerevisiae strains in YPD and (B) YP. (C) amino acid uptake, (D) total peptide uptake, and (E) ammonia production after 72h. (F) Nitrogen consumption ratio (TN/OD) of strains grown in YPD and YP. OD represents the highest value achieved during growth, while TN is the total amount of amino acids and peptides taken up by yeast after 72h. A high TN/OD ratio indicates a high nitrogen consumption per unit OD. The asterisk (*) indicates significant differences (p < 0.05) in the TN/OD between the two media for the same strain, using one-way Welch’s ANOVA followed by Games-Howell post hoc tests.
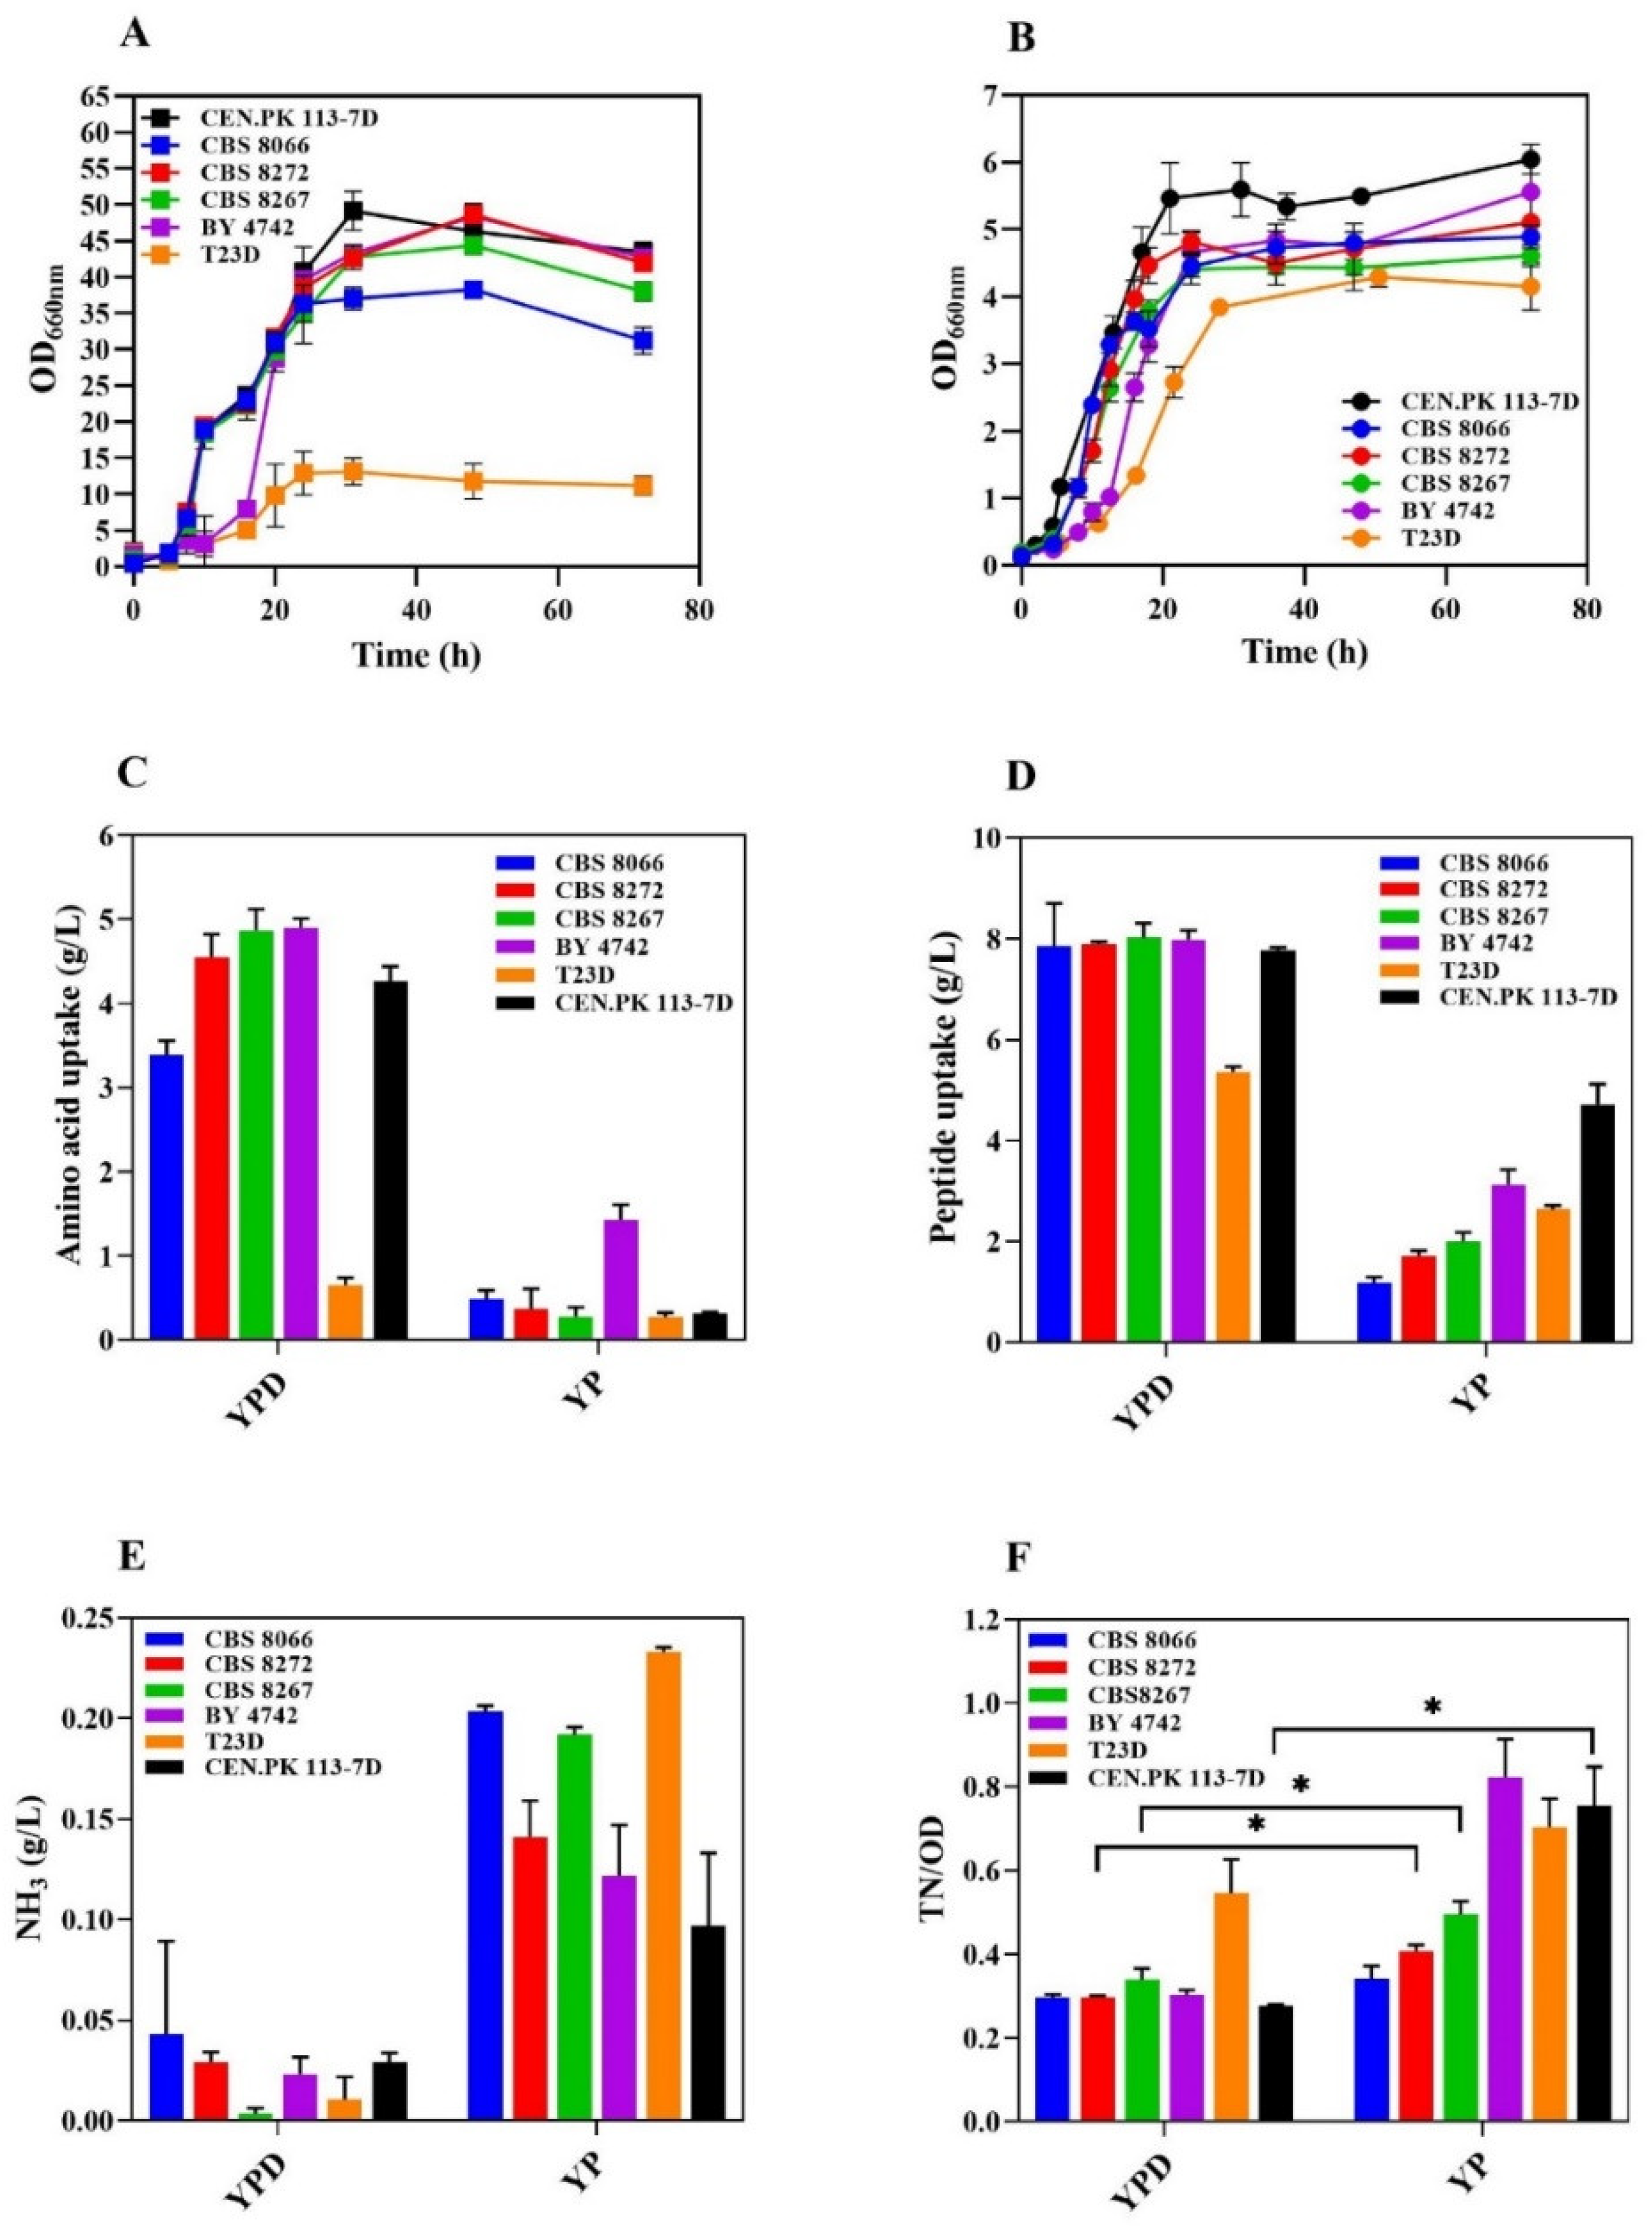
Figure 2.
S. cerevisiae CEN.PK113-7D and evolved clones characterization. (A) This schematic representation illustrates the ALE process used to evolve the CEN-PK113-7D strain successfully, allowing it to utilize a broader range of amino acids. (B) The evolved strain (AAV) growth curve compared with the WT strain in a YP-buffered medium at pH 5. (C) Overall amino acid and (D) peptide uptake in the medium. (E) Ammonia production after 72h. (F) Nitrogen consumption ratio between the strain CEN.PK 113-7D and AAV clones in YP. A high TN/OD ratio indicates more nitrogen consumed per unit OD. The asterisk (*) indicates significant differences (p < 0.05) compared to the control (CEN.PK 113-7D) using Student’s t-test or one-way Welch’s ANOVA followed by post hoc tests.
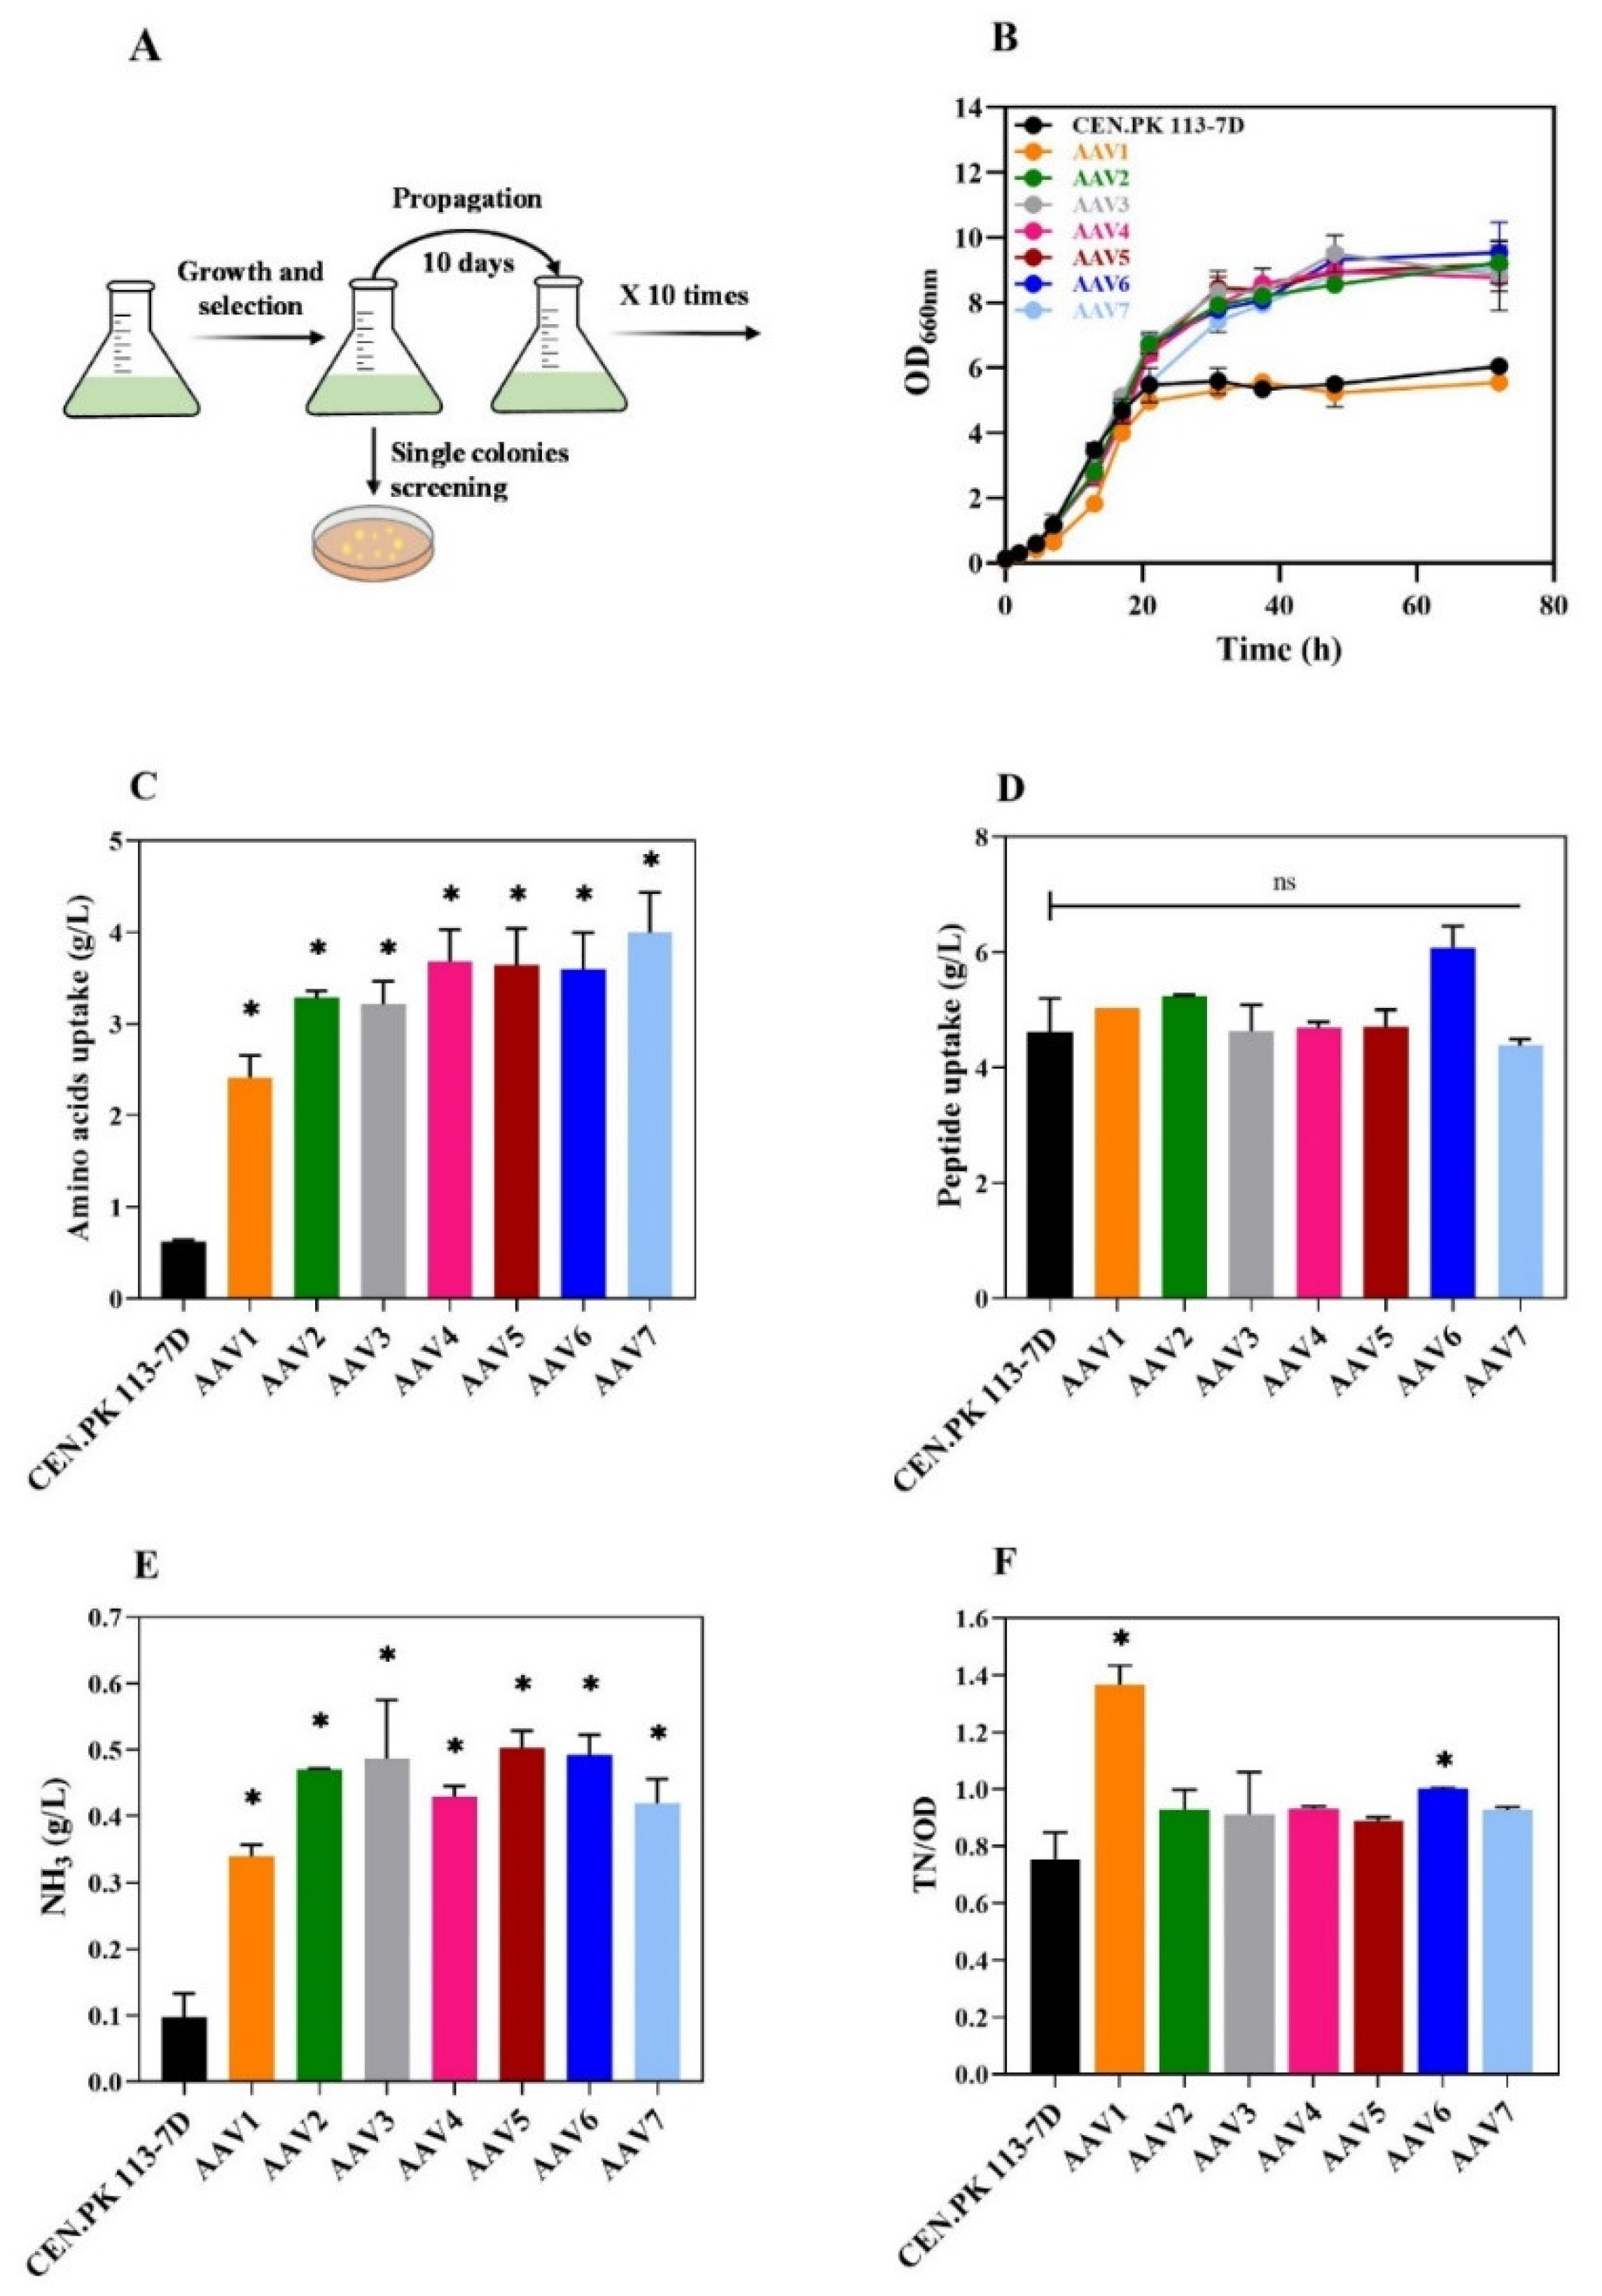
Figure 3.
Bioreactor and flask characterization of the evolved strain AAV6. (A) Flask and Batch bioreactor experiments in YP medium at pH 5. (B) Amino acid and peptide uptake at the end of growth in flasks and batch reactor (72h). (C) Growth curve in a 3-step fermentation mode. The experiment comprised three steps: (i) batch cultivation in YP medium at pH 5, (ii) linear feeding of fresh YP concentrated medium (yeast extract 100 g/L, peptone 200 g/L), and (iii) addition of 3% trehalose. (D) Calculated parameter during the three-step fermentation strategy with the evolved strainAAV6. OD, ammonia, and yield represent the value achieved at the end of each phase. The yield is the amount of ammonia produced divided by the nitrogen uptake from amino acids and peptides (see M&M). The asterisk (*) indicates significant differences (p < 0.05) using Student’s t-test.
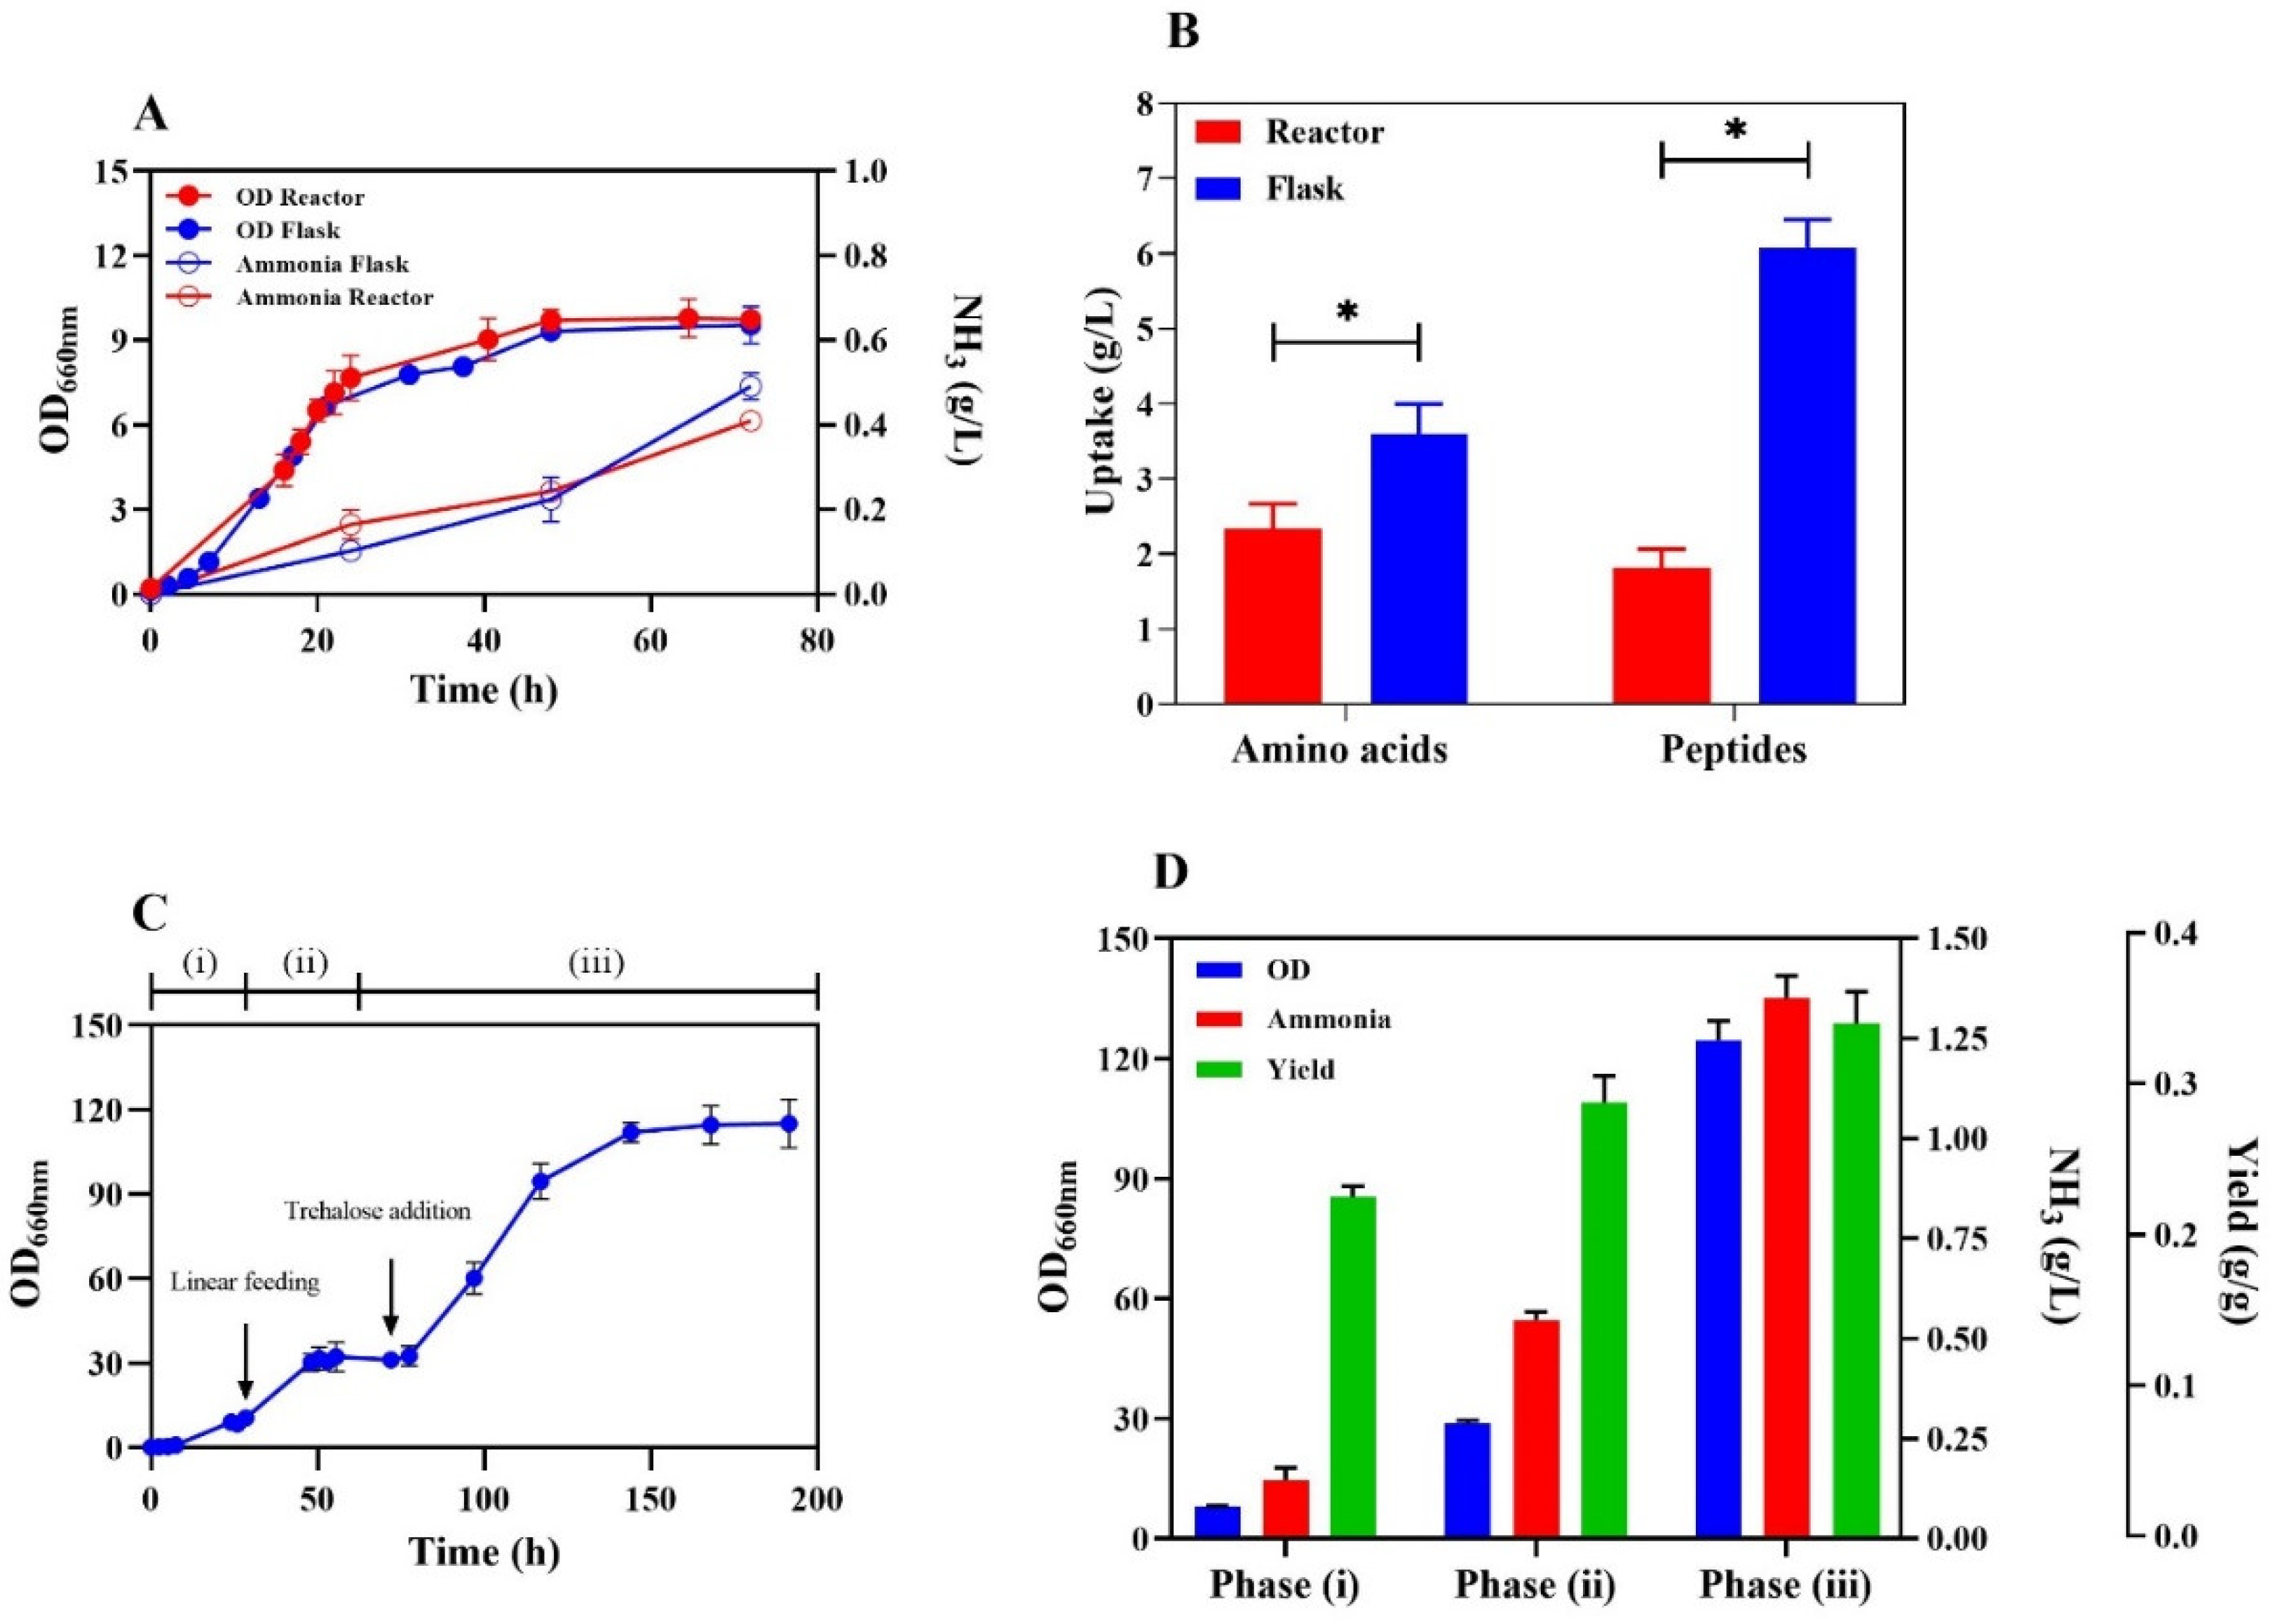
Figure 4.
Total nitrogen balance for AAV6 in batch bioreactor: Nitrogen input refers to the total nitrogen usage from amino acids and peptides, whereas nitrogen input indicates the amount of nitrogen contributing to both biomass formation and ammonia production after 72 hours of growth in YP.
Figure 4.
Total nitrogen balance for AAV6 in batch bioreactor: Nitrogen input refers to the total nitrogen usage from amino acids and peptides, whereas nitrogen input indicates the amount of nitrogen contributing to both biomass formation and ammonia production after 72 hours of growth in YP.
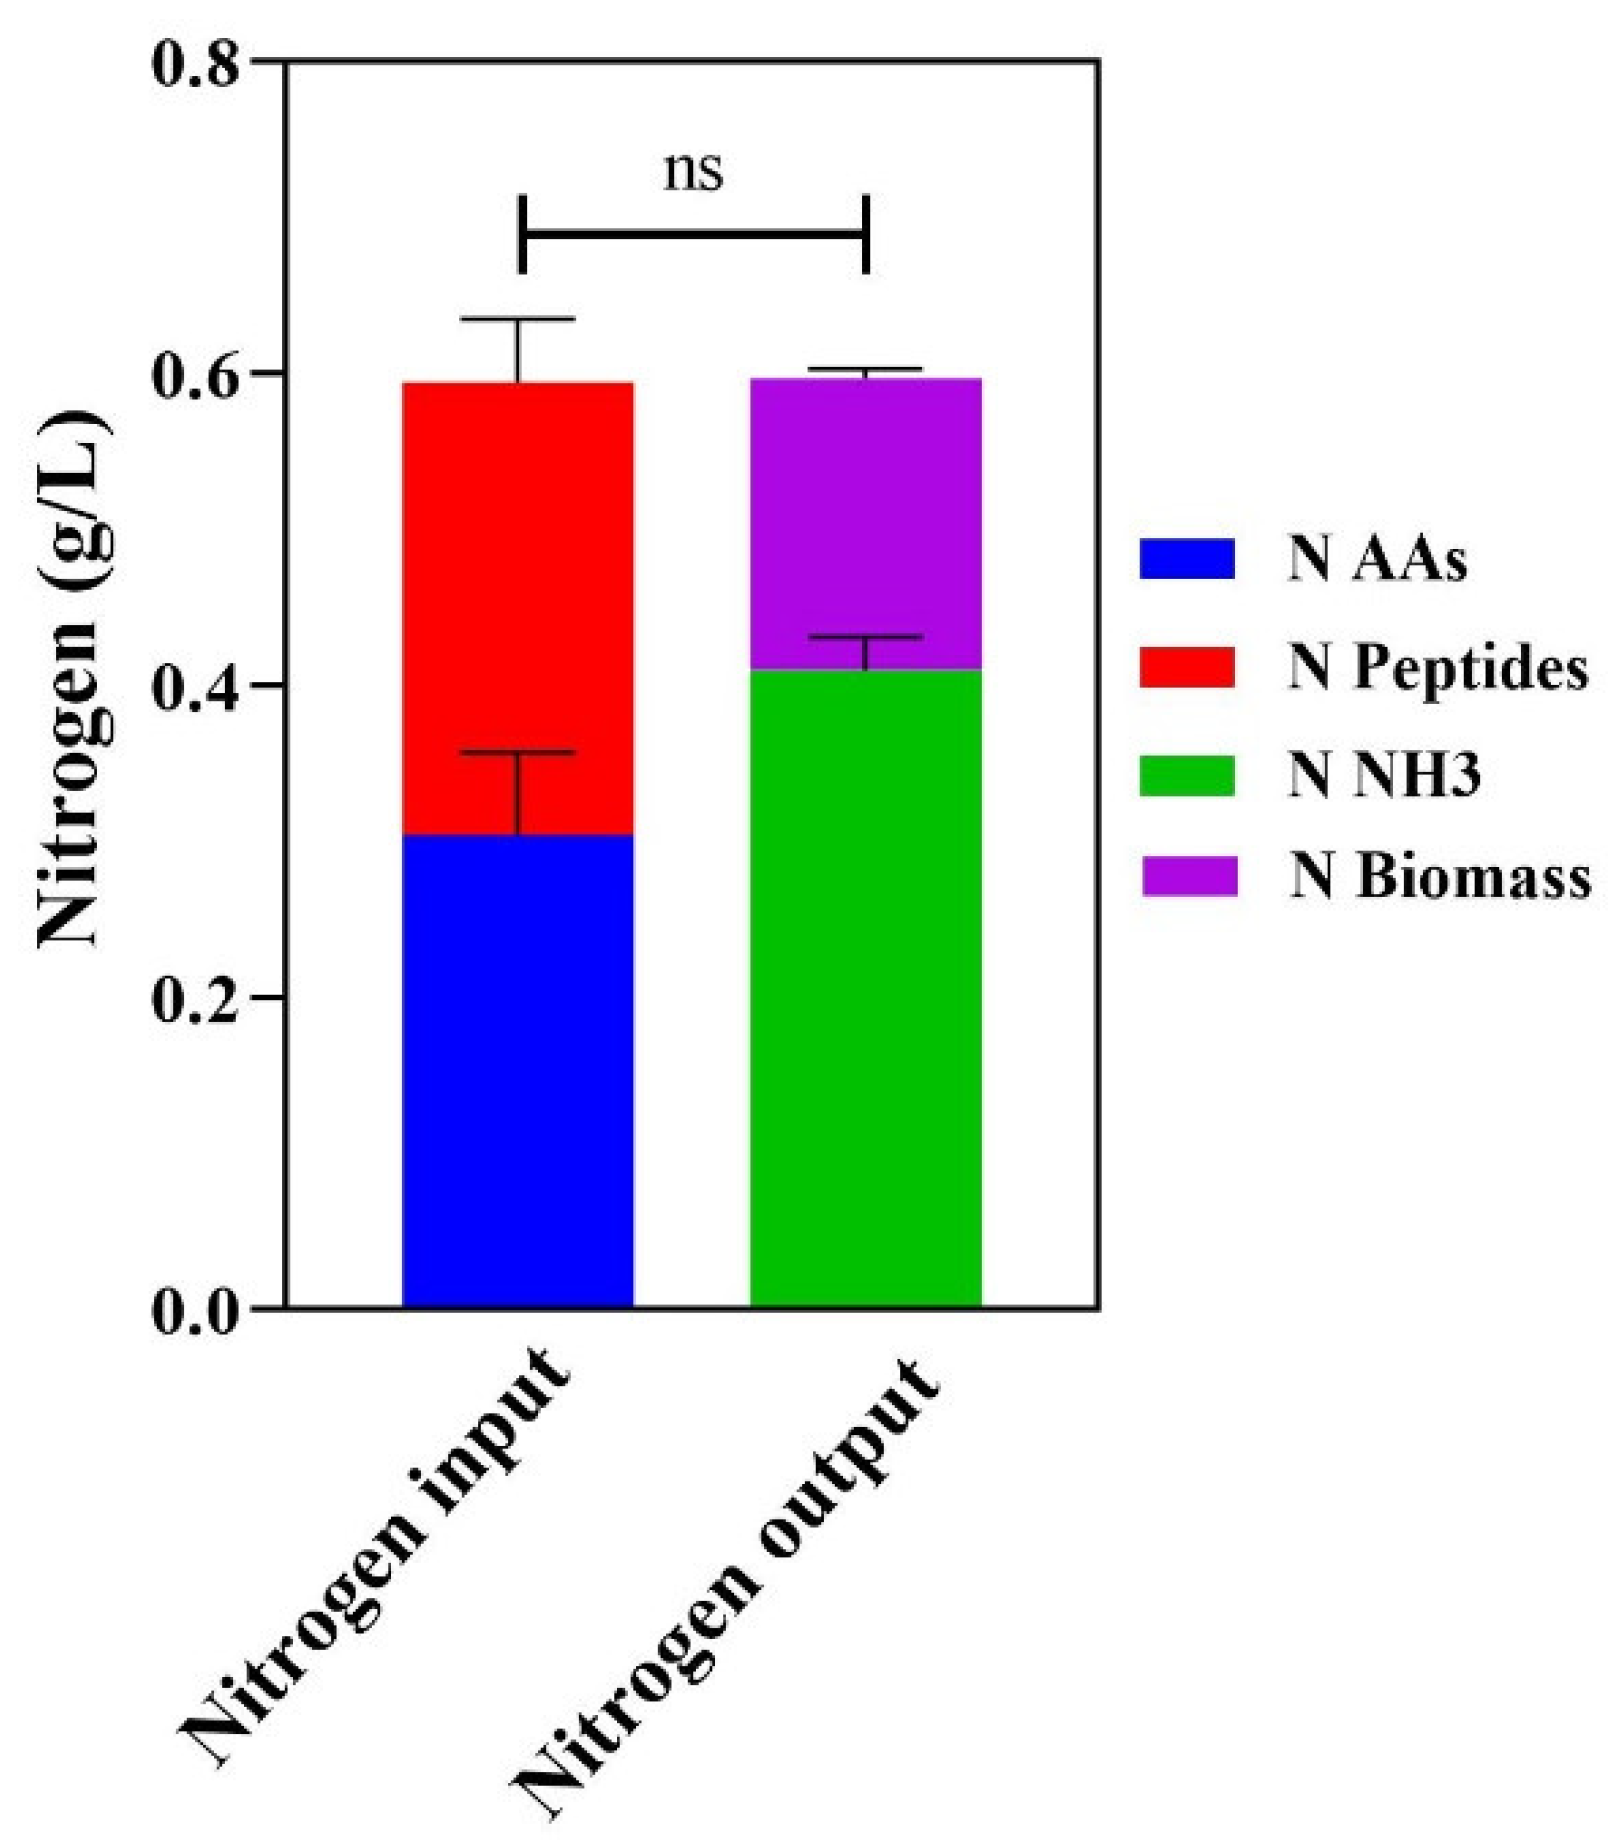

Table 1.
List of the S. cerevisiae strains and mutants selected by ALE. Alias: CBS 8272-CEN.PK122; CBS 8267-BAY17.
Table 1.
List of the S. cerevisiae strains and mutants selected by ALE. Alias: CBS 8272-CEN.PK122; CBS 8267-BAY17.
| Saccharomyces cerevisiae strain | Description | Source |
|---|---|---|
| CEN.PK 113-7D | MATa MAL2-8c SUC2 | [15] |
| CBS 8066 | MATa/α HO/ho | [15] |
| CBS 8272 | MATa/α, prototrophic | [15] |
| CBS 8267 | MATa/α, prototrophic | [15] |
| T23D | Meiotic progeny of CBS 8066 | [16] |
| BY4742 | MATα; his3Δ1; leu2Δ0; lys2Δ0; ura3Δ0 | [17] |
| AAV1-7 | CEN.PK 113-7D mutants selected by ALE | This study |
Disclaimer/Publisher’s Note: The statements, opinions and data contained in all publications are solely those of the individual author(s) and contributor(s) and not of MDPI and/or the editor(s). MDPI and/or the editor(s) disclaim responsibility for any injury to people or property resulting from any ideas, methods, instructions or products referred to in the content. |
© 2024 by the authors. Licensee MDPI, Basel, Switzerland. This article is an open access article distributed under the terms and conditions of the Creative Commons Attribution (CC BY) license (http://creativecommons.org/licenses/by/4.0/).
Copyright: This open access article is published under a Creative Commons CC BY 4.0 license, which permit the free download, distribution, and reuse, provided that the author and preprint are cited in any reuse.


