Submitted:
18 December 2024
Posted:
19 December 2024
You are already at the latest version
Abstract
Wild emmer is one of the progenitors of wheat, with a high genetic potential for breeding. Continuous evaluations of emmer and other progenitor species are necessary for long-term improvement in yield, agronomic, and stress-related traits. For this purpose, genetic diversity and relationships among 43 wild emmer (Triticum dicoccoides) and 5 durum wheat (Triticum durum) accessions were determined using two DNA marker systems, CAAT box-derived polymorphism (CBDP) and start codon targeted (SCoT) markers. CAAT and SCoT markers generated 63 and 76 polymorphic bands, averaging 9 and 7.6 bands per primer, respectively. The discriminating power, effective multiplex ratio, expected heterozygosity, mean heterozygosity, marker index, polymorphism information content, and resolving power parameters obtained for both marker systems showed the high efficiency of these markers in detecting genetic variation in wild emmer and durum wheat. The results showed that CAAT and SCoT markers with average polymorphism are suitable marker systems for detecting genetic variation between a pool of accessions or populations. These markers would be used for gene-targeted breeding and the results suggest that genetic analysis with these markers would be practical for crop improvement and development programs.
Keywords:
Wild Emmer Wheat
; Triticum dicoccoides
; Durum Wheat
; CAAT and SCoT markers
1. Introduction
Analysis of genetic diversity within and between plant species is crucial for the success of any breeding program (Poehlman et al., 1995). Various marker technologies (RAPD, ISSR, AFLP, SSR, etc.) are widely used for genetic diversity analysis and QTL mapping (Nadeem et al.,2018). Molecular markers have been successfully used to study genetic diversity and population structure of agriculturally important crops. The assessment of genetic diversity resulting from the identification of novel genes or alleles in historical varieties, landraces, and natural populations enhances the efficacy of breeding programs by creating varieties with the necessary traits and offers new ways to locate keystone genes (Dempewolf et al., 2017; El Haddad, Kabbaj, et al., 2021; El Haddad, Sanchez-Garcia, et al., 2021). In recent years, many novel alternatives and promising marker techniques have emerged (Bertrand et al 2009). The genetic diversity in wild emmer has been thoroughly studied using diverse molecular marker techniques such as AFLP, ISSR, SSR, SNP, retransposons, etc. Start codon-targeted (ScoT), a unique molecular marker technology with high polymorphism and effectiveness, has been effectively applied in several crops, including rice, peanut, mango, potato, and grape (Collard et al 2009; Xiong et al 2011; Luo et al. 2010, 2011, 2012, Gorji et al 2011, Guo et al 2012). Studies by Joshi et al. (1997) and Sawant et al. (1999) have previously reported the existence of SCoT polymorphism, a brief conserved area that surrounds the ATG start codon in plant genes. ATG flanking the promoter initiation codon was the target of a single primer designed to amplify the genomic region containing the conserved sequence for SCoT. Recently, gene-targeted marker techniques have become an excellent and useful system for analyzing genetic diversity. CAAT box-derived polymorphism (CBDP) is also known as a novel molecular marker based on the short-conserved region of the CAAT box promoter. Singh et al (2014) reported that eukaryotic genes share a conserved sequence in the CAAT box region upstream of the start codon (GGCCAATCT). Due to their many advantages, including reproducibility, high polymorphism, and low cost, CAAT markers have been successfully used in genetic analyses (Aslan-Parviz, 2020). Additionally, the CAAT approach is anticipated to be more dependable and repeatable than random molecular markers since it uses longer primers with a higher annealing temperature (Collard et al 2009). In a similar vein, SCoT markers are widely applicable to many noteworthy but undervalued plant species. These applications include a wide range of subjects, including genetic diversity analysis, species, hybrid, and cultivar identification, gender determination, genetic relationships between different species, linkage map construction, association mapping analysis, differential gene expression investigations, and genetic evaluation of plants cultured in tissue. The information supplied includes current information on SCoT markers and their application in a variety of commercially significant plant species, encompassing both well-known and lesser-known species and cultivars (Rai, 2023). Consequently, these marker techniques may offer advantages over random techniques in QTL mapping and DNA fingerprinting applications (Andersen et al 2003, Etminan 2018). This study attempts to uncover unique genetic diversity in a panel of selected wild emmer (Triticum dicoccoides) accessions, utilizing two successful marker approaches, CAAT and SCoT.
2. Material and Method
2.1. Plant Material
In this study, forty-three genotypes selected from different populations of wild emmer wheat (Triticum dicoccoides) collected from the distinct regions of the Fertile Crescent (Turkey, Israel, Lebanon, and Syria), and five genotypes of durum wheat (Triticum durum) were used as plant material (Table1). The seeds were sown in the 2021-2022 wheat growing season. The field study was conducted at Çukurova University's Department of Field Crops.
2.2. DNA Extraction
Fresh and young leaf samples were collected at the seedling stage and dried in a lyophilizer (Dryfreezer). The dried leaf samples were stored at +4 °C until DNA isolation. Genomic DNA was extracted according to the CTAB protocol (Doyle and Doyle, 1987; Kafkas et al. 2006). The leaf samples were ground in a mortar with the help of liquid nitrogen and were transferred to 2 ml Eppendorf tubes. Afterwards, 1 ml of CTAB DNA isolation solution was added and the tubes were kept in a water bath at 65°C for 1.5 hours. The tubes were slowly shaken every 10 minutes during the water bath. The tubes were then taken out and left to cool at room temperature (approximately 5 minutes) and then 0.5 ml of chloroform: isoamyl alcohol (24:1) was added to these tubes and shaken gently by hand for 15 minutes. Afterward, the tubes were centrifuged at 135000 rpm for 10 minutes. The upper phases of the centrifuged tubes were taken and transferred to new 1.5 ml Eppendorf tubes. 500 μl of isopropanol was added to these tubes and the DNA was precipitated by slowly turning it into a single phase. All the liquid was poured so that the DNA remained at the bottom and the DNA sample was washed with 76% ethyl alcohol containing 10mM ammonium acetate and the samples were dried overnight at room temperature. After drying, 50 μl of ddH20 (double distilled water) was added to the DNA samples, and the dissolved DNA samples were stored at -20°C. To determine the DNA quality and the concentration of the DNA samples, 2 μl of DNA sample was taken into a 0.5 ml Eppendorf tube and 4 μl of 6X loading buffer and 14 μl of ddH20 were added. The mixture was vortexed and then centrifuged for a short time. 10 μl of the sample taken from these prepared samples was loaded in 0.8% agarose gel in 0.5X TBE (Tris-borate-EDTA) solution. The loaded samples run at 90 volts for 60 minutes. After the run, agarose gel was stained with ethidium bromide and visualized with the aid of gel imaging. DNA concentrations were determined with the help of λ DNA (25 ng - 50 ng - 100 ng - 200 ng) loaded in the gel. The final concentration of DNA samples was set at 10 ng/µl. DNA quality was determined by 0.8% agarose gel electrophoresis.

Table 1.
Wild Emmer Wheat (Triticum dicoccoides) genotypes were collected from the fertile crescent region and durum wheat genotypes.
Table 1.
Wild Emmer Wheat (Triticum dicoccoides) genotypes were collected from the fertile crescent region and durum wheat genotypes.
| Accession ID | Plant Species | Genbank Code | Country Of Origin | Collsite | Lat (N) | Long (E) | Elevation |
|---|---|---|---|---|---|---|---|
| WE 270 | T. dicoccoides | PI 428089 | TUR | 37 km NE from kilis to Gaziantep | 37°20'19'' | 37°16'50'' | 830 |
| WE 5 | T. dicoccoides | PI 428023 | TUR | 36.2 km west of Diyarbakir in the Karacadag | 37°53'00'' | 39°52'00'' | 1200 |
| WE 230 | T. dicoccoides | PI 428046 | TUR | 12.9 km NW from Ovadag to Pirinclik | 37°47'31'' | 39°57'18'' | 1007 |
| WE 28 | T. dicoccoides | PI 428089 | TUR | 20.2 km east of Siverek | 37°43'00'' | 39°30'00'' | 1200 |
| WE 262 | T. dicoccoides | PI 656872 | TUR | 34 km ESE from Narli (WSW of Karadağ) | 37°20'12'' | 37°17'53'' | 780 (813) |
| WE 14 | T. dicoccoides | PI 428051 | TUR | 36.2 km west of Diyarbakir in the Karacadag | 37°53’00’’ | 39°52’00’’ | 1200 |
| WE 264 | T. dicoccoides | TUR | 37 km NE from Kilis to Gaziantep | 37°20'19'' | 37°16'50'' | 830 | |
| WE 274 | T. dicoccoides | TUR | Siverek Karakeçi Road Azemi Village | 37° 36' 51'' | 39° 20' 12'' | 733 | |
| WE 164 | T. dicoccoides | PI 654321 | TUR | 4km south of Siverek on Karakecili road | 37° 43’05’’ | 39° 19’37’’ | 720 |
| WE 157 | T. dicoccoides | PI 554581 | TUR | 25 km southwest of Diyarbakir | 37° 45’00’’ | 40° 06’00’’ | 1000 |
| WE 114 | T. dicoccoides | PI 538646 | TUR | 36.2 km west of Diyarbakir in the Karacadag | 37° 53’00’’ | 39° 52’00’’ | 1200 |
| WE 159 | T. dicoccoides | PI 554583 | TUR | 3 km southeast of the Junction of Karacadag Mt. road and Diyarbakir highway | 37° 47’00’’ | 39° 47’00’’ | 1350 |
| WE 154 | T. dicoccoides | PI 538713 | LBN | between Ain Harsch and Ain Ata | 33° 26’00’’ | 35° 46’00’’ | 1192 |
| WE 169 | T. dicoccoides | TRI 18478, PI 427998 | LBN | zwischen Kfarkouk und Aiha | 33° 31’00’’ | 35° 52’00’’ | 1216 |
| WE 193 | T. dicoccoides | TRI 18530, PI 538706 | LBN | zwischen Aiha und Kfarkouk, ca. 1 km von Aiha | 33° 30’00’’ | 35° 52’00’’ | 1216 |
| WE 150 | T. dicoccoides | PI 538703 | LBN | near Rashaya | 33° 30’04’’ | 35° 50’22’’ | 1000 |
| WE 41 | T. dicoccoides | PI 428133 | LBN | Aiha-Kfarkouk, above 'sahlet' | 33° 31’00’’ | 35° 52’00’’ | 1141 |
| WE 149 | T. dicoccoides | PI 538702 | LBN | near Rashaya | 33° 30’04’’ | 35° 50’22’’ | 1000 |
| WE 151 | T. dicoccoides | PI 538704 | LBN | near Rashaya | 33° 30’04’’ | 35° 50’22’’ | 1000 |
| WE 46 | T. dicoccoides | PI 428143 | LBN | between Rashaya and Aiha | 33° 30’00’’ | 35° 50’00’’ | 1000 |
| WE 1 | T. dicoccoides | CItr 17675 | LBN | outskirts of Rashaya | 33° 30’04’’ | 35° 50’22’’ | 1000 |
| WE 179 | T. dicoccoides | TRI 18499, PI 470979 | LBN | Mt. Hermon | 33° 25’00’’ | 35° 52’00’’ | 2655 |
| WE 34 | T. dicoccoides | PI 428105 | ISR | 1 to 2 km south of Rosh Pinna towards Safad | 32° 58’00’’ | 35° 32’00’’ | 549 |
| WE 145 | T. dicoccoides | PI 538696 | ISR | Between 'En haShofet and Daliyya | 32° 35’00’’ | 35° 03’00’’ | 122 |
| WE 127 | T. dicoccoides | PI 538670 | ISR | Afula-Tiberias | 32° 36’40’’ | 35° 17’30’’ | 300 |
| WE 139 | T. dicoccoides | PI 538690 | ISR | near Safad on the road to Rosh Pinna | 32° 58’00’’ | 35° 29’40’’ | 800 |
| WE 134 | T. dicoccoides | PI 538679 | ISR | Afula-Tiberias | 32° 36’40’’ | 35° 17’30’’ | 300 |
| WE 61 | T. dicoccoides | PI 466972 | ISR | Bat Shelomo | 32° 35’48’’ | 35° 00’07’’ | 105 |
| WE 59 | T. dicoccoides | PI 466969 | ISR | Bat Shelomo | 32° 35’48’’ | 35° 00’07’’ | 105 |
| WE 62 | T. dicoccoides | PI 466974 | ISR | Bat Shelomo | 32° 35’48’’ | 35° 00’07’’ | 105 |
| WE 267 | T. dicoccoides | PI 538696 | ISR | Between 'En haShofet and Daliyya | 32° 35’00’’ | 35° 03’00’’ | 122 |
| WE 35 | T. dicoccoides | PI 428112 | ISR | 1 to 2 km south of Rosh Pinna towards Safad | 32° 58’00’’ | 35° 32’00’’ | 549 |
| WE 87 | T. dicoccoides | PI 471041 | ISR | Kokhav haShahar | 31° 57’00’’ | 35° 20’00’’ | 696 |
| WE 51 | T. dicoccoides | PI 466943 | SYR | Kazrin | 32° 59’24’’ | 35° 41’24’’ | 259 |
| WE 80 | T. dicoccoides | PI 470956 | SYR | Kazrin | 32° 59’24’’ | 35° 41’24’’ | 259 |
| WE 184 | T. dicoccoides | TRI 18506, PI487255 | SYR | Damaskus Provinz | 33° 45’00’’ | 36° 05’00’’ | 1240 |
| WE 186 | T. dicoccoides | TRI 18508, PI 487262 | SYR | Damaskus Provinz | 33° 40’00’’ | 36° 02’00’’ | 1300 |
| WE 96 | T. dicoccoides | PI 487260 | SYR | 32km from Sweida between Sale and Malah | 32° 38’52’’ | 36° 47’24’’ | 1530 |
| WE 93 | T. dicoccoides | PI 487254 | SYR | Nawa | 32° 52’10’’ | 36° 01’51’’ | 551 |
| WE 98 | T. dicoccoides | PI 487264 | SYR | Aleppo-Abeen road after Aleppo-Afrin road, Aleppo Province | 36° 30’00’’ | 37° 00’00’’ | 350 |
| WE 76 | T. dicoccoides | PI 470945 | SYR | Kazrin | 32° 59’24’’ | 35° 41’24’’ | 259 |
| WE 185 | T. dicoccoides | TRI 18507, PI 487261 | SYR | Es Suweida (Soud) | 32° 38’00’’ | 36° 46’00’’ | 1450 |
| WE 292 | T.durum | PI 466947 | Iran | ||||
| WE 294 | T. durum | Buckzafıro | Arj | ||||
| WE 293 | T. durum | PI 656872 | TUR | 112km northwest of Maras | |||
| WE 291 | T. durum | PI 654317 | TUR | ||||
| WE 289 | T. durum | Landrace | Italy |
2.3. CAAT-PCR and SCoT-PCR Amplification
In this study, CAAT primers (24) were screened using the method developed by Etminan et al. (2018), and 7 CAAT primers with highly polymorphic bands were used in all wheat genotypes. PCR products and their concentration 10Xdream taq buffer 1.5 μl, 200 μM dNTP (1 μl), 1.5 μl primers, dream taq enzyme 0.3μl, 5.7 μl ddH2O (double distilled water) 5.7 μl were obtained in a total volume of 15 μl of PCR reactions used in the CAAT reaction. Amplification was done at 95 °C for 4 min, followed by 30 cycles of denaturation at 94 °C for 60 seconds, primer annealing at 50 °C for 60 seconds, and primer elongation at 72 °C for 120 seconds. The final extension was 7 min at 72 °C. The amplification reaction products were detected by 1.5% agarose gel stained The 10 SCoT primers with the highest number of polymorphic bands were employed following the testing of 34 primers, following Collard and David et al. (2009). All PCR reactions were performed within a total volume of 10 μl. PCR reaction mixtures contained PCR buffer (Promega; 20 mM Tris-HCl (pH 8.4), 50 mM KCl), 1.5 mM MgCl2, 0.24 mM of each dNTP, 0.5 U of Taq polymerase (Promega), and 1.6 μl of primer. Each reaction contained 25 ng of template DNA. A standard PCR cycle was used described as follows: an initial denaturation step at 94°C for 3 min, followed by 35 cycles of 94°C for 1 min, 50°C for 1 min, and 72°C for 2 min; the final extension at 72°C was held for 5 min. All PCR amplification products were separated on 1.2% agarose gels in Tris-borate buffer stained with ethidium bromide and visualized under UV light. Table 2 contains the list of PCR-amplified CAAT and SCoT markers.
2.4. Data Evaluation
Polymorphism was evaluated for the scorable bands that were evident on the gel. The information is displayed in binary form, with 1 denoting polymorphism's presence and 0 denoting its absence. A total of 48 Triticum genotypes were studied (43 Triticum dicoccoides and 5 of Triticum durum), using the CAAT and SCoT marker systems. The discriminating power (D), effective multiplex ratio (E), expected heterozygosity (H), mean heterozygosity (Hav), marker index (MI), polymorphism information content (PIC), and resolving power (R) of the genotypes were calculated. Polymorphism statistics calculated by iMEC (Online Marker Efficiency Calculator) for different primer types for wild emmer and durum wheat according to Amiryousefi et al. (2018). Binary data were generated from CAAT and SCoT primers for Triticum genotypes using DARwin software (version 6). The genetic similarity coefficients for the genotypes obtained from both marker systems were calculated using the Dice index (1945). The binary data was then analyzed following Gascuel (1997). Finally, an Unweighted Neighbor Joining clustering method was used to construct a tree.
3. Results and Discussion
Emmer wheat is one of the most important background genetic resources of domesticated wheat. It provides significant allelic diversity for various abiotic and biotic stress factors (Rasheed et al., 2017; Qiu et al., 2021; Yang et al., 2021; Tene et al., 2022). Evaluation of core collections and wild populations is a crucial step in advancing allelic variation in breeding programs. This study was conducted to evaluate the effectiveness of the CAAT and SCoT markers. Firstly, a prescreening was conducted using a total of 57 CAAT/SCoT primers on 8 wheat genotypes. Based on the results of the prescreening, 10 SCoT, and 7 CAAT primers were selected for further analysis. DNA analysis was then performed on wild emmer and durum wheat genotypes using the selected primers.
3.1. Polymorphism Values for the Entire Set of Genotypes
Genetic diversity of the whole set was evaluated by calculating the expected heterozygosity (H), mean heterozygosity (Hav), polymorphism information content (PIC), discrimation power (D), effective multiplex ratio (E), marker index (MI) and resolving power (R).
In this study, H values were determined for 48 wild emmer and durum wheat genotypes using CAAT and ScoT markers (Table 3). Among these primers, the lowest H value was observed in the CAAT12 primer with a value of 0.328, while the highest H value was observed in the CAAT14 primer with a value of 0.499. Moreover, H value was also high i.e. 0.498 and 0.491, in the primers CAAT21 and CAAT13, respectively. The lowest mean heterozygosity (Hav) of 0.001 was observed in primer CAAT22, while the highest was recorded as 0.005 in primer CAAT10.
In the case of ScoT markers, the lowest H value was observed in the SCoT9 primer with a value of 0.440, while the highest was observed in the SCoT23 with an H value of 0.500. ScoT primer SCoT16 showed the lowest Hav value of 0.001, while the SCoT19 primer had the highest Hav value of 0.002. In a similar study, Ren et al. (2013) used Single Nucleotide Polymorphism (SNP) markers to examine genetic diversity in 120 wild emmer wheat genotypes from 25 different wild wheat populations and found a Hav value of 0.184. Furthermore, Shizuka et al. (2015) reported an H value of 0.285. The H values obtained in these two studies differed from those recorded in our study. The difference could be a result of the difference in the genotypes and the types of DNA markers used.
The screening with CAAT primers revealed that the PIC value was as low as 0.348 in the primer CAAT14, while the maximum value was 0.419 in the primer CAAT12, followed by 0.401 in the primer CAAT20. The mean PIC value was found to be 0.377 in CAAT markers. In the case of ScoT markers, the lowest PIC value was seen in the primer SCoT23 with a PIC value of 0.365, while the highest PIC value (0.393) was obtained from primer SCoT9, followed by a PIC value of 0.373 in the primer SCoT16. The mean PIC value was found to be 0.373 in SCoT markers. Abouseada et al. (2023) reported that the mean number of polymorphic bands for SCoT primers in their study was 7.7, which aligns with this study, where the average number of polymorphic bands for SCoT primer was recorded as 7.6, while the average number of polymorphic bands obtained was low compared to CAAT primers (9). In addition, PIC values for the SCoT primer ranged from 0.17 to 0.37, which are similar to or lower than the values obtained in the present study. The PIC value is usually the effective factor used to compare different molecular markers and can also be used as an evaluation parameter to determine the degree of effectiveness of primers (Hongtrakul et al., 1997; Garcia et al., 2004).
The lowest D value of 0.539 was recorded in CAAT10, and the highest (0.958) was shown by the CAAT12 primer. However, the D value for SCoT primers was the lowest (0.727) in SCoT19, and the highest (0.894) was shown by the SCoT9 primer. Since allele frequencies vary between gene pools, the informativeness of a particular marker may differ between collections from different countries. However, a set containing the most informative markers identified in a collection of germplasms with high D values may also provide high discrimination power in other gene pools (Sefc et al., 2000).
The lowest and highest E value for CAAT primers was reported to be 1.361 and 6.361 in the primers CAAT10 and CAAT21, respectively. On the other hand, the lowest E value (2.361) for SCoT primers was recorded in the SCoT13, while the highest (4.191) was observed from SCoT8 primer.
When the primer MI values were examined for CAAT and SCoT molecular markers, the lowest MI (0.001) was derived from CAAT12, while the highest MI (0.006) was from CAAT10. Additionally, for ScoT markers the lowest MI value (0.003) was obtained from SCoT9, and the highest MI value (0.006) was shown by SCoT19 primer.
The R value is based on the distribution of alleles in the analyzed genotypes and correlates strongly with the ability to discriminate between these genotypes. The lowest R value for CAAT primer was recorded as 1.063 in CAAT10 and the highest R value of 7.531 was recorded from CAAT21. On the other hand, the lowest R value for ScoT markers was found to be 2.127 in SCoT11, while the highest (5.489) was obtained from SCoT8. When both markers are examined, CAAT21 and SCoT8 had the highest R values, while CAAT10 and SCoT11 had the lowest R values. Moreover, it was determined that the CAAT primers had higher R values than the SCoT primers. Therefore, the choice of CAAT and SCoT molecular markers largely depends on the level of polymorphism to be detected and their genomic coverage, rather than on the technology used to generate the markers. Gowayed et al. (2021) elaborated on some wheat (Triticum aestivum L.) genotypes that the mean values of E, MI and R values were 10.67, 7.80 and 9.15, respectively for different primers. Mean values of parameters E, MI, and R were low, medium, and high in this study. The possible reasons for these findings are whether the CAAT or the SCOT detects the polymorphism of the conserved regions around the markers.
3.2. Polymorphism Values Calculated Basen on the Collected Region of Accessions
The genetic diversity values of each collected country and region are estimated by calculating H, Hav, PIC, D, E, MI and R values for wild emmer wheat from the Fertile Crescent (Turkey, Israel, Lebanon, and Syria), as well as durum wheat (Table 4).
3.3. Parameters Obtained Using CAAT Molecular Markers
The expected genetic diversity values in wild emmer wheat genotypes collected in Turkey were found to be the lowest 0.278 with CAAT12 and the highest 0.500 with CAAT14. The expected H mean was found to be 0.428, and the calculated Hav was the lowest at 0.002 in the CAAT22 primer, while the highest was recorded to be 0.005 in CAAT14. The expected genetic diversity value was obtained as the lowest at 0.329 with CAAT12 and the highest at 0.500 with CAAT13 in Israel, and the calculated Hav was lowest at 0.018 in the CAAT10 primer, while the highest was recorded to be 0.006 in CAAT14. The lowest expected genetic diversity value was 0.368 with CAAT12, while the highest was 0.500 with CAAT13/CAAT21. The expected H mean was determined to be 0.444 for wild emmer wheat genotypes collected from Lebanon, and the calculated Hav value was the lowest at 0.004 in CAAT22 primer, and the highest at 0.021 in CAAT10. The expected genetic diversity value in wild emmer wheat genotypes obtained from Syria was determined as the lowest 0.320 with CAAT10/CAAT20 and the highest 0.498 with CAAT21. The expected H mean was determined to be 0.408, and the calculated Hav value was found to be the lowest 0.003 in the CAAT20/CAAT22 primer and the highest 0.016 in the CAAT10 for Syria. The expected genetic diversity value in durum wheat genotypes was determined as the lowest 0.095 with CAAT22 and the highest 0.500 with CAAT10, and the calculated Hav value was found to be the lowest 0.002 in the CAAT22 primer and the highest 0.050 in the CAAT10 for durum wheat.
CAAT analysis on wild emmer wheat genotypes collected from Turkey produced the lowest PIC value of 0.349 from the CAAT14 primer, the highest of 0.435 from the CAAT12 primer, and the mean PIC value of 0.379. The PIC value ranged from 0.364 with CAAT13 primer to 0.435 with CAAT12 primer, with a mean of 0.391 collected from Israel. Among the wild emmer wheat genotypes collected in Lebanon, the PIC value was the lowest (0.365) in CAAT13/CAAT21 primers and the highest (0.423) in primer CAAT12, with a mean PIC value of 0.391. According to CAAT analysis on wild emmer wheat genotypes collected from Syria, the lowest PIC value of 0.331 was recorded from the CAAT21 primer, and the highest (0.403) was obtained from the CAAT10/ CAAT20 primer with a mean PIC value of 0.369. The PIC value in durum wheat genotypes was determined as the lowest 0.171 with CAAT10 and the highest 0.292 with CAAT22, with a mean PIC value of 0.243. Ren et al. (2013), studied Single Nucleotide Polymorphism in 120 wild emmer wheat genotypes and recorded the PIC value as 0.153.
The mean MI showed a high value of 0.024 (CAAT21) and a low of 0.004 (CAAT12), with a mean MI value of 0.015 in wild emmer wheat samples from Turkey. The wild emmer wheat genotypes from Israel had a high value of 0.026 (CAAT10/CAAT21) and a low of 0.006 (CAAT12), with a mean MI value of 0.018. Similarly, the wild emmer wheat genotype from Lebanon also exhibited a high value of 0.030 (CAAT14) and a low MI value of 0.009 (CAAT12), with a mean MI value of 0.021. The MI exhibited a high value of 0.026 (CAAT10) and a low of 0.006 (CAAT20), with a mean MI value of 0.016 in wild emmer wheat harvested from Syria. The minimum and maximum MI values for durum wheat were 0.001 from CAAT22 and 0.050 from CAAT10, with a mean of 0.016.
This study evaluated the D values of wild emmer wheat from Turkey and Israel. The results showed the lowest D value of 0.653 with CAAT21 (Israel) and the highest D value of 0.974 with CAAT12 primer (Turkey), yielding a mean D value of 0.823 for wild emmer genotypes collected in Turkey. The mean discriminating power of wild emmer wheat from Israel was 0.774, with a high D value of 0.959 by using CAAT12 and a low D value of 0.481 with CAAT10. The mean D value in wild emmer wheat from Lebanon was 0.767, with a high of 0.944 for CAAT12 and a low of 0.521 for CAAT10. Similarly, wild emmer wheat from Syria had a mean D value of 0.811, with a high D value of 0.962 in CAAT20 and a low of 0.368 in CAAT10. D showed a high value of 0.995 for CAAT20 and a low value of 0.778 for CAAT10, with a mean value of 0.940 in durum wheat.
The markers had a mean R value of 3.785, ranging from 1.166 for CAAT10 to 6.500 for CAAT21 in wild emmer wheat from Turkey. For wild emmer wheat from Israel, the markers had a mean R value of 3.870, ranging from 1.090 with CAAT10 to 7.636 with CAAT22. The markers demonstrated a mean R value of 3.914 with a range from 1.200 (CAAT10) to 8.200 (CAAT21) in wild emmer wheat from Lebanon, whilst the mean R was 3.914. In wild emmer wheat from Syria with a range of 0.600 (CAAT12) to 4.800 (CAAT21). In durum wheat, the mean resolving power of the markers was 1.714, with a range from 0.001 (CAAT10) to 3.600 (CAAT13). Aslan-Parviz et al. (2020) reported that the used primers can detect the genetic variation in the investigated durum wheat genotypes. The R value of the 12 primers varied between 5.73 (CBDP12) and 12.60 (CBDP1) with a mean of 9.62. The lowest and highest value of MI was recorded for CBDP12 (3.68) and CBDP6 (5.99), respectively. The R value of the 12 primers ranged from 5.73 (CBDP12) to 12.60 (CBDP1), with a mean value of 9.62, the marker parameters possibly correlate with the frequency of allelic variance, which may be affected by different climatic conditions, these variations could potentially be attributed to the genotypes utilized in this investigation. The markers' informative parameters, such as the expected heterozygosity, Polymorphism Information Content, effective multiplex ratio, mean heterozygosity, marker index, discriminating power, and resolving power, indicate that the applied primers possess adequate discriminating power. Therefore, the genetic diversity and structure in the wheat germplasm can be analyzed effectively by implementing this technique.
3.4. Parameters Obtained Using SCoT Molecular Markers
Parameters obtained using SCoT molecular markers for the wild emmer and durum wheat genotypes collected from different countries are shown in Table 5. The mean H value in wild emmer wheat genotypes collected from Turkey was 0.467, with a minimum of 0.413 for SCoT9/SCoT16, with a maximum of 0.499 for SCoT7. Calculated Hav was found to be the lowest (0.003) in SCoT16 primer, while the highest was 0.008 in SCoT19 for Turkey. The mean H value in wild emmer wheat genotypes collected from Israel was 0.484, with a minimum value of 0.452 for SCoT19 and a maximum of 0.499 for SCoT13/ SCoT17. Calculated Hav value was the lowest (0.004) in SCoT8 primer, while the highest (0.008) was in SCoT19 for Israel. The mean H value in wild emmer wheat genotypes collected from Lebanon was 0.478, with a minimum of 0.420 for SCoT13, with a maximum of 0.499 for SCoT7. Calculated Hav was recorded to be the lowest 0.0047 in SCoT8 primer, and the highest (0.010) was in SCoT19 for Lebanon. The mean H value in wild emmer wheat genotypes collected from Syria was 0.454, with a minimum of 0.353 for SCoT23, with a maximum of 0.500 for SCoT10. Calculated Hav found the lowest 0.004 in SCoT8 primer, while the highest (0.010) was recorded in SCoT19 for Syria. The mean H value in durum wheat genotypes was 0.359, with a minimum of 0.180 for SCoT9, with a maximum of 0.496 for SCoT10. The lowest calculated Hav was 0.005 in the SCoT9 primer and the highest was 0.015 in the SCoT19 primer for durum wheat.
The mean PIC value per primer was 0.379, with a maximum of 0.400 for SCoT9/SCoT16 and a minimum of 0.360 for SCoT7 among wild emmer wheat genotypes collected in Turkey. The mean PIC value per primer was 0.382, with a maximum of 0.397 for SCoT19 and a minimum of 0.376 for SCoT13/ SCoT17 in wild emmer wheat genotypes collected from Israel. The mean PIC value per primer was 0.385, with a maximum of 0.411 for SCoT13 and a minimum of 0.375 for SCoT11/ SCoT7 in wild emmer wheat genotypes collected from Lebanon. The mean PIC value per primer was 0.363, with a maximum of 0.405 for SCoT23 and a minimum of 0.342 for SCoT10 in wild emmer wheat genotypes collected from Syria. The mean PIC value per primer was 0.329, with a maximum of 0.384 for SCoT9 and a minimum of 0.277 for SCoT10 in durum wheat genotypes.
Effective multiplex ratio (E) had a high value of 4.333 (SCoT7) and a low of 2.250 (SCoT16), with a mean E value of 3.216 in wild emmer wheat collected from Turkey. E had a high value of 5.272 (SCoT16) and a low of 2.818 (SCoT11), with a mean E value of 3.709 in wild emmer wheat from Israel. The E values ranged from 6.100 (SCoT8) to 2.100 (SCoT13), with an average of 3.700 for wild emmer wheat from Lebanon. The lowest and highest E values for wild emmer wheat from Syria were 1.600 from SCoT23 and 4.000 from SCoT16 markers, with an average of 2.820. The lowest and highest E values for durum wheat were obtained as 0.80 from SCoT9/SCoT13/17 and 3.80 from SCoT8/SCoT10, with an average of 1.86.
The MI had a high value of 0.024 (SCoT17/ SCoT19) and a low of 0.010 (SCoT9/ SCoT16), with an average marker index of 0.017 in wild emmer wheat from Turkey. MI had a high value of 0.027 (SCoT19) and a low of 0.016 (SCoT8/SCoT9), with an average marker index of 0.022 in wild emmer wheat collected from Israel. MI had a high value of 0.029 (SCoT23/SCoT17) and a low of 0.013 (SCoT13), with a mean marker index of 0.023 in wild emmer wheat from Lebanon. MI had a high value of 0.027 (SCoT11) and a low of 0.008 (SCoT23), with an average marker index of 0.018 in wild emmer wheat from Syria. The lowest and highest MI values for durum wheat were 0.036 from SCoT9 and 0.054 from SCoT10, respectively, with an average of 0.022.
For the D the lowest value was 0.663 with SCoT17, the highest 0.917 with SCoT9 primer mean D of 0.802 for wild emmer wheat collected from Turkey. D had a high value of 0.862 in SCoT9 and a low of 0.576 in SCoT19, with an average discriminating power of 0.746 in wild emmer wheat from Israel. D had a high value of 0.913 on SCoT13 and a low of 0.626 on SCoT17/SCoT23, with an average discriminating power of 0.755 in wild emmer wheat from Lebanon. D had a high value of 0.950 SCoT23 and a low of 0.720 SCoT11, with a mean D value of 0.853 in wild emmer wheat from Syria. D had a high value of 0.990 SCoT11 and a low of 0.713 SCoT10, with an average discriminating power of 0.915 in durum wheat. The mean R value of the markers was 2.566 with a range of 1.333 (SCoT10) to 5.333 (SCoT8) for wild emmer wheat from Turkey. The mean R of the markers was 2.872 with a range of 1.636 (SCoT11) to 4.727 (SCoT8) for wild emmer wheat from Israel. The mean R of the markers was 2.32 with a range of 1.00 (SCoT10/SCoT17) to 4.200 (SCoT8) for the wild emmer wheat from Lebanon. The mean R of the markers was 2.480 with a range of 1.00 (SCoT17) to 3.800 (SCoT8) for the wild emmer wheat from Syria. The mean R of the markers was 1.440 with a range of 0.400 (SCoT10/SCoT13) to 2.800 (SCoT7) to durum wheat.
3.5. Mean Genetic Diversity Parameters for CAAT and SCoT Markers
Table 6 displays several iMEC characteristics estimated to assess the mean genetic diversity in CAAT and SCoT molecular markers for wild emmer and durum wheat genotypes collected from different countries. The Hav with CAAT primers in durum wheat was found to be the lowest at 0.012, while the highest was recorded from SCoT primers in durum wheat at 0.010. The H value was the lowest 0.29 with CAAT primers in durum wheats, while the highest was 0.48 with SCoT primers in populations from Israel. Shizuka et al. (2015) reported mean genetic diversity of 0.28 and 0.29 in the two populations they studied, respectively, and the difference revealed in the current study can be attributed to differences in marker selection and genotype origin. It was discovered that the lowest mean PIC value was 0.243 (CAAT primers) in durum wheat, while the highest mean value was 0.391 (CAAT primers) obtained from Israel/Lebanon. The mean D was measured and found to be the lowest at 0.746 (SCoT primers for wild emmer wheat from Israel) and the highest at 0.940 (CAAT primers for durum wheat). The mean E in durum wheat was the lowest at 1.628 (CAAT primers), while the highest was found in Israel at 3.844. Furthermore, the mean primer MI was lowest (0.015) in CAAT primers for Turkish wild emmer wheat and highest (0.023) for wild emmer wheat from Lebanon. The mean R value was the lowest (1.440) for durum wheat (SCoT primers) and highest (3.914) for wild emmer wheat from Lebanon (CAAT primers). These traits were used to evaluate the efficiency of primers in wild emmer wheat genotypes, revealing degree and genotype differences.
3.6. Principal Coordinate Analysis (PCoA)
To obtain further information about the wild emmer wheat and durum wheat genotypes, principal coordinate analysis (PCoA) was used to identify the variance in SCoT primers (Figure 2 and Figure 3). Turkey, Israel, Lebanon, and Syria are represented by accessions from the known wild emmer region (Triticum dicoccoides), while durum corresponds to wheat genotypes. For the majority of the comparable GPS source coordinates, many identical accessions were detected. Cluster analysis has been used extensively to describe genetic diversity and clustering based on similar characteristics. Based on the Unweighted Neigbor-joining clustering method (UNJ), the 43 wild emmer wheat and 5 durum wheat genotypes were grouped into three major groups with SCoT primers (Figure 4). Cluster A consisted of 27 genotypes from Turkey, Lebanon, and Israel. Cluster B included 16 genotypes from Syria, wild emmer wheat from Lebanon, and durum wheat. The remaining genotypes formed a third cluster originating from Israel, Syria, and Lebanon. According to the UNJ, the 48 genotypes of wild emmer and durum wheat were grouped into three distinct clusters for CAAT primers (Figure 5). Cluster I consisted of 27 genotypes of wild emmer from Turkey, Lebanon, Israel, and Syria. Cluster II included 19 genotypes of wild emmer from four different countries and five durum wheat. The last group, Cluster III had two genotypes within Israel and Syria. The dendrogram of 38 durum wheat landraces in Iran, based on the dissimilarity matrix developed with SCoT markers using the UNJ method of Seyedimoradi et al (2016), showed that SCoT and CDDP markers formed three main groups each, whereas SCoT markers formed three main groups and CAAT markers formed two main groups in the wild emmer and durum wheat studied. Genetic diversity and relationships between wild emmer and durum wheat genotypes revealed three clustering patterns according to the UNJ dendrogram, implying that CAAT-SCoT markers are an acceptable marker system.
.
4. Conclusions
Maintaining the highest possible level of genetic diversity is one of the main objectives of genetic resource conservation programs, and assessing genetic diversity using reliable methods provides useful information for genetic resource management and crop improvement programs. The results revealed a substantial degree of variation in the wheat germplasm examined in various Triticum species. The current study found that both SCoT and CAAT marker systems can effectively estimate genetic diversity in wild emmer and durum wheat genotypes, as demonstrated by the calculated via iMEC to compare the mean of genetic diversity parameters in CAAT and SCoT molecular markers. In general, SCoT/CAAT markers generated high polymorphism and PIC values. In conclusion, two marker methods, which targeted certain parts of the plant genome or candidate genes by primer design were used to estimate the genetic diversity of durum wheat. This information is valuable for germplasm classification and defining various/ heterotic groups, which is particularly important in hybrid/ cross-breeding programs for wheat. The results obtained revealed a significant genetic diversity in wild emmer populations of different countries. These results were supported by various statistical analyses such as iMEC online marker efficiency, UNJ, PCoA, and cluster analyses showing a high difference between populations. The study showed that the new-generation SCoT and CAAT marker systems are powerful tools for exploiting the genetic diversity of wheat wild relatives and cultivars. Thus, it can be suggested that these DNA-based systems can be used in combination with other molecular markers for genetic analyses such as association mapping studies and the construction of linkage maps.
Availability Statement: The original contributions presented in this study are included in the article/supplementary material. Further inquiries can be directed to the corresponding author.
Acknowledgments
This research was carried out at the Department of Field Crops, Faculty of Agriculture, Cukurova University in the Molecular Genetics Laboratory. Under the support and guidance of Prof. Dr. Hakan ÖZKAN.Data.
Conflicts of Interest
The authors declare no conflicts of interest.
References
- Abouseada, H.H.; Mohamed, A.-S.H.; Teleb, S.S.; Badr, A.; Tantawy, M.E.; Ibrahim, S.D.; Ellmouni, F.Y.; Ibrahim, M. Genetic diversity analysis in wheat cultivars using SCoT and ISSR markers, chloroplast DNA barcoding and grain SEM. Plant Biol. 2023, 23, 193. [Google Scholar] [CrossRef] [PubMed]
- Amiryousefi, A.; Hyvonen, J.; Poczai, P. Irscope: An Online Program to Visualize The Junction Sites Of Chloroplast Genomes. Bioinformatics 2018, 34, 3030–3031. [Google Scholar] [CrossRef] [PubMed]
- Andersen, J.R.; Lubberstedt, T. Functional markers in plants. TrendsPlant Sci. 2003, 8, 554–50. [Google Scholar] [CrossRef] [PubMed]
- Aslan-Parviz, M.; Omidi, M.; Rashidi, V.; Etminan, A.; Ahmadzadeh, A. Evaluation of genetic diversity of durum wheat (Triticum durum desf.) genotypes using inter-simple sequence repeat (ISSR) and CAAT box-derived polymorphism (CBDP) markers. Genetika 2020, 52, 895–909. [Google Scholar] [CrossRef]
- Bertrand, C.Y.; Collard, *!!! REPLACE !!!*; David, J.M. Start Codon Targeted (SCoT) Polymorphism: A Simple, Novel DNA Marker Technique for Generating Gene-Targeted Markers in Plants. In Plant Molecular Biology Reporter; 2009. [Google Scholar]
- Collard, B.C.Y.; Jahufer, M.Z.Z.; Brouwer, J.B.; Pang, E.C.K. An introduction to markers, quantitative trait loci (QTL) mapping and markerassisted selection for crop improvement: the basic concepts. Euphytica. 2005, 142, 169–96. [Google Scholar] [CrossRef]
- Collard, B.C.Y.; Mackill, D.J. Conserved DNA-derived polymorphism (CDDP): a simple and novel method for generating DNA markers in plants. Plant. Mol. Biol. Report. 2009, 27, 558–562. [Google Scholar] [CrossRef]
- DARwin software (Version 6).
- Dempewolf, H.; Baute, G.; Anderson, J.; Kilian, B.; Smith, C.; Guarino, L. Past and Future Use of Wild Relatives in Crop Breeding. Crop Science 2017, 57, 1070–1082. [Google Scholar] [CrossRef]
- Dice, L.R. Measures amount of ecologic association between species. Ecology 1945, 26, 297–302. [Google Scholar] [CrossRef]
- Doyle, J.J.; Doyle, J.L. A Rapid Isolation Procedure for Small Quantities of Fresh Leaf Tissue. Phytochemical Bulletin. 1987, 19, 11–15. [Google Scholar]
- El Haddad, N.; Kabbaj, H.; Zaïm, M.; El Hassouni, K.; Tidiane Sall, A.; Azouz, M.; Ortiz, R.; Baum, M.; Amri, A.; Gamba, F.; Bassi, F.M. Crop wild relatives in durum wheat breeding: Drift or thrift? Crop Science 2021, 61, 37–54. [Google Scholar] [CrossRef]
- El Haddad, N.; Sanchez-Garcia, M.; Visioni, A.; Jilal, A.; El Amil, R.; Sall, A.T.; Lagesse, W.; Kumar, S.; Bassi, F.M. Crop Wild Relatives Crosses: Multi-Location Assessment in Durum Wheat, Barley, and Lentil. Agronomy 2021, 11, 2283. [Google Scholar] [CrossRef]
- Etminan, A.; Pour-Aboughadareh, A.; Mohammadi, R.; Noori, A.; Ahmadi-Rad, A. Applicability of CAAT Box-derived Polymorphism (CBDP) Markers for Analysis of Genetic Diversity in Durum Wheat. Cereal Research Communications 2018, 46, 1–9. [Google Scholar] [CrossRef]
- Garcia, A.A.F.; Benchimol, L.L.; Barbosa, A.M.M.; Geraldi, I.O.; Souza Jr, C.L.; Souza, A.P. Comparison of RAPD, RFLP, AFLP and SSR markers for diversity studies in tropical maize inbred lines. Genetics and Molecular Biology 2004, submitted. [CrossRef]
- Gascuel, O. Concerning the NJ algorithm and its unweighted version, UNJ. In : Mathematical Hierarchies and Biology. DIMACS workshop, Series in Discrete Mathematics and Theoretical Computer Science. American Mathematical Society 1997, 37, 149–170. [Google Scholar]
- Gorji, A.M.; Poczai, P.; Polgar, Z.; Taller, J. Efficiency of arbitrarily amplified dominant markers (SCOT, ISSR and RAPD) for diagnostic fingerprinting in tetraploid potato. Am. J. Potato Res. 2011, 88, 226–237. [Google Scholar] [CrossRef]
- Gowayed SM, H.; El-Moneim, D.A. Detection of genetic divergence among some wheat (Triticum aestivum L.) genotypes using molecular and biochemical indicators under salinity stress. PLoS ONE 2021, 16, e0248890. [Google Scholar] [CrossRef]
- Guo, D.L.; Zhang, J.Y.; Liu, C.H. Genetic diversity in some grape varieties revealed by SCoT analyses. Mol. Biol. Rep. 2012, 39, 5307–5313. [Google Scholar] [CrossRef]
- Hongtrakul, V.; Huestis, G.M.; Knapp, S.J. Amplified Fragment Length Polymorphisms As A Tool For DNA Fingerprinting Sunflower Germplasm, Genetic Diversity Among Oilseed İnbred Lines, Theor. Appl. Genet. 1997, 95, 400–407. [Google Scholar] [CrossRef]
- Joshi, C.P.; Zhou, H.; Huang, X.; Chiang, V.L. Context sequences of translation initiation codon in plants. Plant Mol. Biol. 1997, 35, 993–1001. [Google Scholar] [CrossRef]
- Kafkas, S.; Ozkan, H.; Ak BEAcar, I.; Atlı, H.S.; Koyuncu, S. Detecting DNA Polymorfism and Genetic Diversity in a Wide Pistachio Germplasm: Comparison of AFLP, ISSR and RAPD Markers. Journal of the American Society for Horticultural Science 2006, 131, 522–529. [Google Scholar] [CrossRef]
- Luo, C.; He, X.H.; Chen, H.; Ou, S.J.; Gao, M.P. Analysis of diversity and relationshipsamong mango cultivars using start codon targeted (SCoT) markers. Biochem. Syst.Ecol. 2010, 38, 1176–1184. [Google Scholar] [CrossRef]
- Luo, C.; He, X.H.; Chen, H.; Ou, S.J.; Gao, M.P.; Brown, J.S.; Tondo, C.T.; Schnell, R.J. Genetic diversity of mango cultivars estimated using SCoT and ISSR markers. Biochem.Syst. Ecol. 2011, 39, 676–684. [Google Scholar] [CrossRef]
- Luo, C.; He, X.H.; Chen, H.; Hu, Y.; Ou, S.J. Genetic relationship and diversity ofMangifera indica L.: revealed through SCoT analysis. Genet. Resour. Crop. Evol. 2012, 59, 1505–1515. [Google Scholar] [CrossRef]
- Pour-Aboughadareh, A.; Mohmoudi, M.; Ahmadi, J.; Moghaddam, M.; Mehrabi, A.A.; Alavikia, S.S. Agro-morphological and molecular variability in Triticum boeoticum accessions from Zagros Mountains, Iran. Genet. Resour. Crop. Evol. 2017, 64, 545–556. [Google Scholar] [CrossRef]
- Nadeem, M.A.; Nawaz, M.A.; Shahid, M.Q.; Doğan, Y.; Comertpay, G.; Yıldız, M.; Hatipoğlu, R.; Ahmad, F.; Alsaleh Ahmad Labhane, N.; Özkan, H.; Chung, G.; Baloch, F.S. DNA molecular markers in plant breeding: current status and recent advancements in genomic selection and genome editing. Biotechnology & Biotechnological Equipment 2018, 32, 261–285. [Google Scholar] [CrossRef]
- Poehlman, J.M.; Sleper, D.A. Breeding field crops. Alkek General, Floor 1995, 6, SB1857P63. [Google Scholar]
- Qiu, J.; Ma, C.; Jia, Y.-H.; Wang, J.-Z.; Cao, S.-K.; Li, F.F. The distribution and behavioral characteristics of plateau pikas (Ochotona curzoniae). ZooKeys 2021, 1059, 157–171. [Google Scholar] [CrossRef]
- Rai, K. M. Start codon targeted (SCoT) polymorphism marker in plant genome analysis: current status and prospects. Planta 2023, 257, 34. [Google Scholar] [CrossRef]
- Rasheed, A.; Hao, Y.; Xia, X.C.; Khan, A.; Xu, Y.; Varshney, R.K.; He, Z. Crop breeding chips and genotyping platforms: progress, challenges and perspectives. Mol Plant 2017, 10, 1047–1064. [Google Scholar] [CrossRef]
- Ren, J.; Chen, L.; Sun, D.; You, F.M.; Wang, J.; Peng, Y.; Nevo, E.; Beıles, A.; Sun, D.; Luo, M.-C.; Peng, J. SNP-Revealed Genetic Diversity İn Wild Emmer Wheat Correlates with Ecological Factors. BMC Evolutionary Biology 2013, 13, 169. [Google Scholar] [CrossRef]
- Sawant, S.; Singh, P.; Gupta, S.; Madnala, R.; Tuli, R. Conserved nucleotide sequencesin highly expressed genes in plants. J. Genet. 1999, 78, 123–131. [Google Scholar] [CrossRef]
- Sefc, K.M.; Lopes, M.S.; Lefort, F.; Botta, R.; Roubelakis-Angelakis, K.A.; Ibáñez, J.; Pejić, I.; et al. Microsatellite variability in grapevine cultivars from different European regions and evaluation of assignment testing to assess the geographic origins of cultivars. Theoretical and Applied Genetics 2000, 100, 498–505. [Google Scholar] [CrossRef]
- Seyedimoradi, H.; Talebi, R.; Fayaz, F. Geographical diversity pattern in Iranian landrace durum wheat (Triticum turgidum) accessions using start codon targeted polymorphism and conserved DNA-derived polymorphism markers. Environmental and Experimental Biology 2016, 14, 63–68. [Google Scholar] [CrossRef]
- Shizuka, T.; Morı, N.; Ozkan, H.; Ohta, S. Chloroplast DNA Haplotype variation within two Natural Populations Of Wild Emmer Wheat (Triticum turgidum ssp. dicoccoides) In Southern Turkey. Biotechnol. Biotechnol. Equip. 2015, 29, 423–430. [Google Scholar] [CrossRef]
- Singh, A.K.; Rana, M.K.; Singh SKumar, S.; Kumar, R.; Singh, R. CAAT box- derived polymorphism (CBDP): a novelpromoter -targeted molecular marker for plants. Journal of Plant Biochemistry and Biotechnology 2014, 23, 175–183. [Google Scholar] [CrossRef]
- Yang, J.; Li, W.; Guo, X.; Chen, P.; Cheng, Y.; Mao, K.; Ma, F. Cation/Ca2+ Exchanger 1 (MdCCX1), a Plasma Membrane-Localized Na+ Transporter, Enhances Plant Salt Tolerance by Inhibiting Excessive Accumulation of Na+ and Reactive Oxygen Species. Front. Plant Sci.,Sec. Plant Abiotic Stress 2021, 12. [Google Scholar] [CrossRef]
- Xiong, F.Q.; Zhong, R.C.; Han, Z.Q.; Jiang, J.; He, L.Q.; Zhuang, W.J.; Tang, R.H. Start Codon Targeted polymorphism for evaluation of functional genetic variation and relationships in cultivated peanut (Arachis hypogaea L.) genotypes. Mol. Biol. Rep. 2011, 38, 3487–3494. [Google Scholar] [CrossRef]
- Tene, M.; Adhikari, E.; Cobo, N.; Jordan, K.W.; Matny, O.; del Blanco, l.A.; Roter, J.; Ezrati, S.; Govta, L.; Manisterski, J.; Yehuda, P.B.; Chen, X.; Steffenson, B.; Akhunov, E.; Sela, H. GWAS for Stripe Rust Resistance in Wild Emmer Wheat (Triticum dicoccoides) Population: Obstacles and Solutions. Crops 2022, 2, 42–61. [Google Scholar] [CrossRef]
Figure 2.
Principal Coordinate Analysis (PCoA) of countries wild emmer wheat and durum wheat revealed by the SCoT markers.
Figure 2.
Principal Coordinate Analysis (PCoA) of countries wild emmer wheat and durum wheat revealed by the SCoT markers.
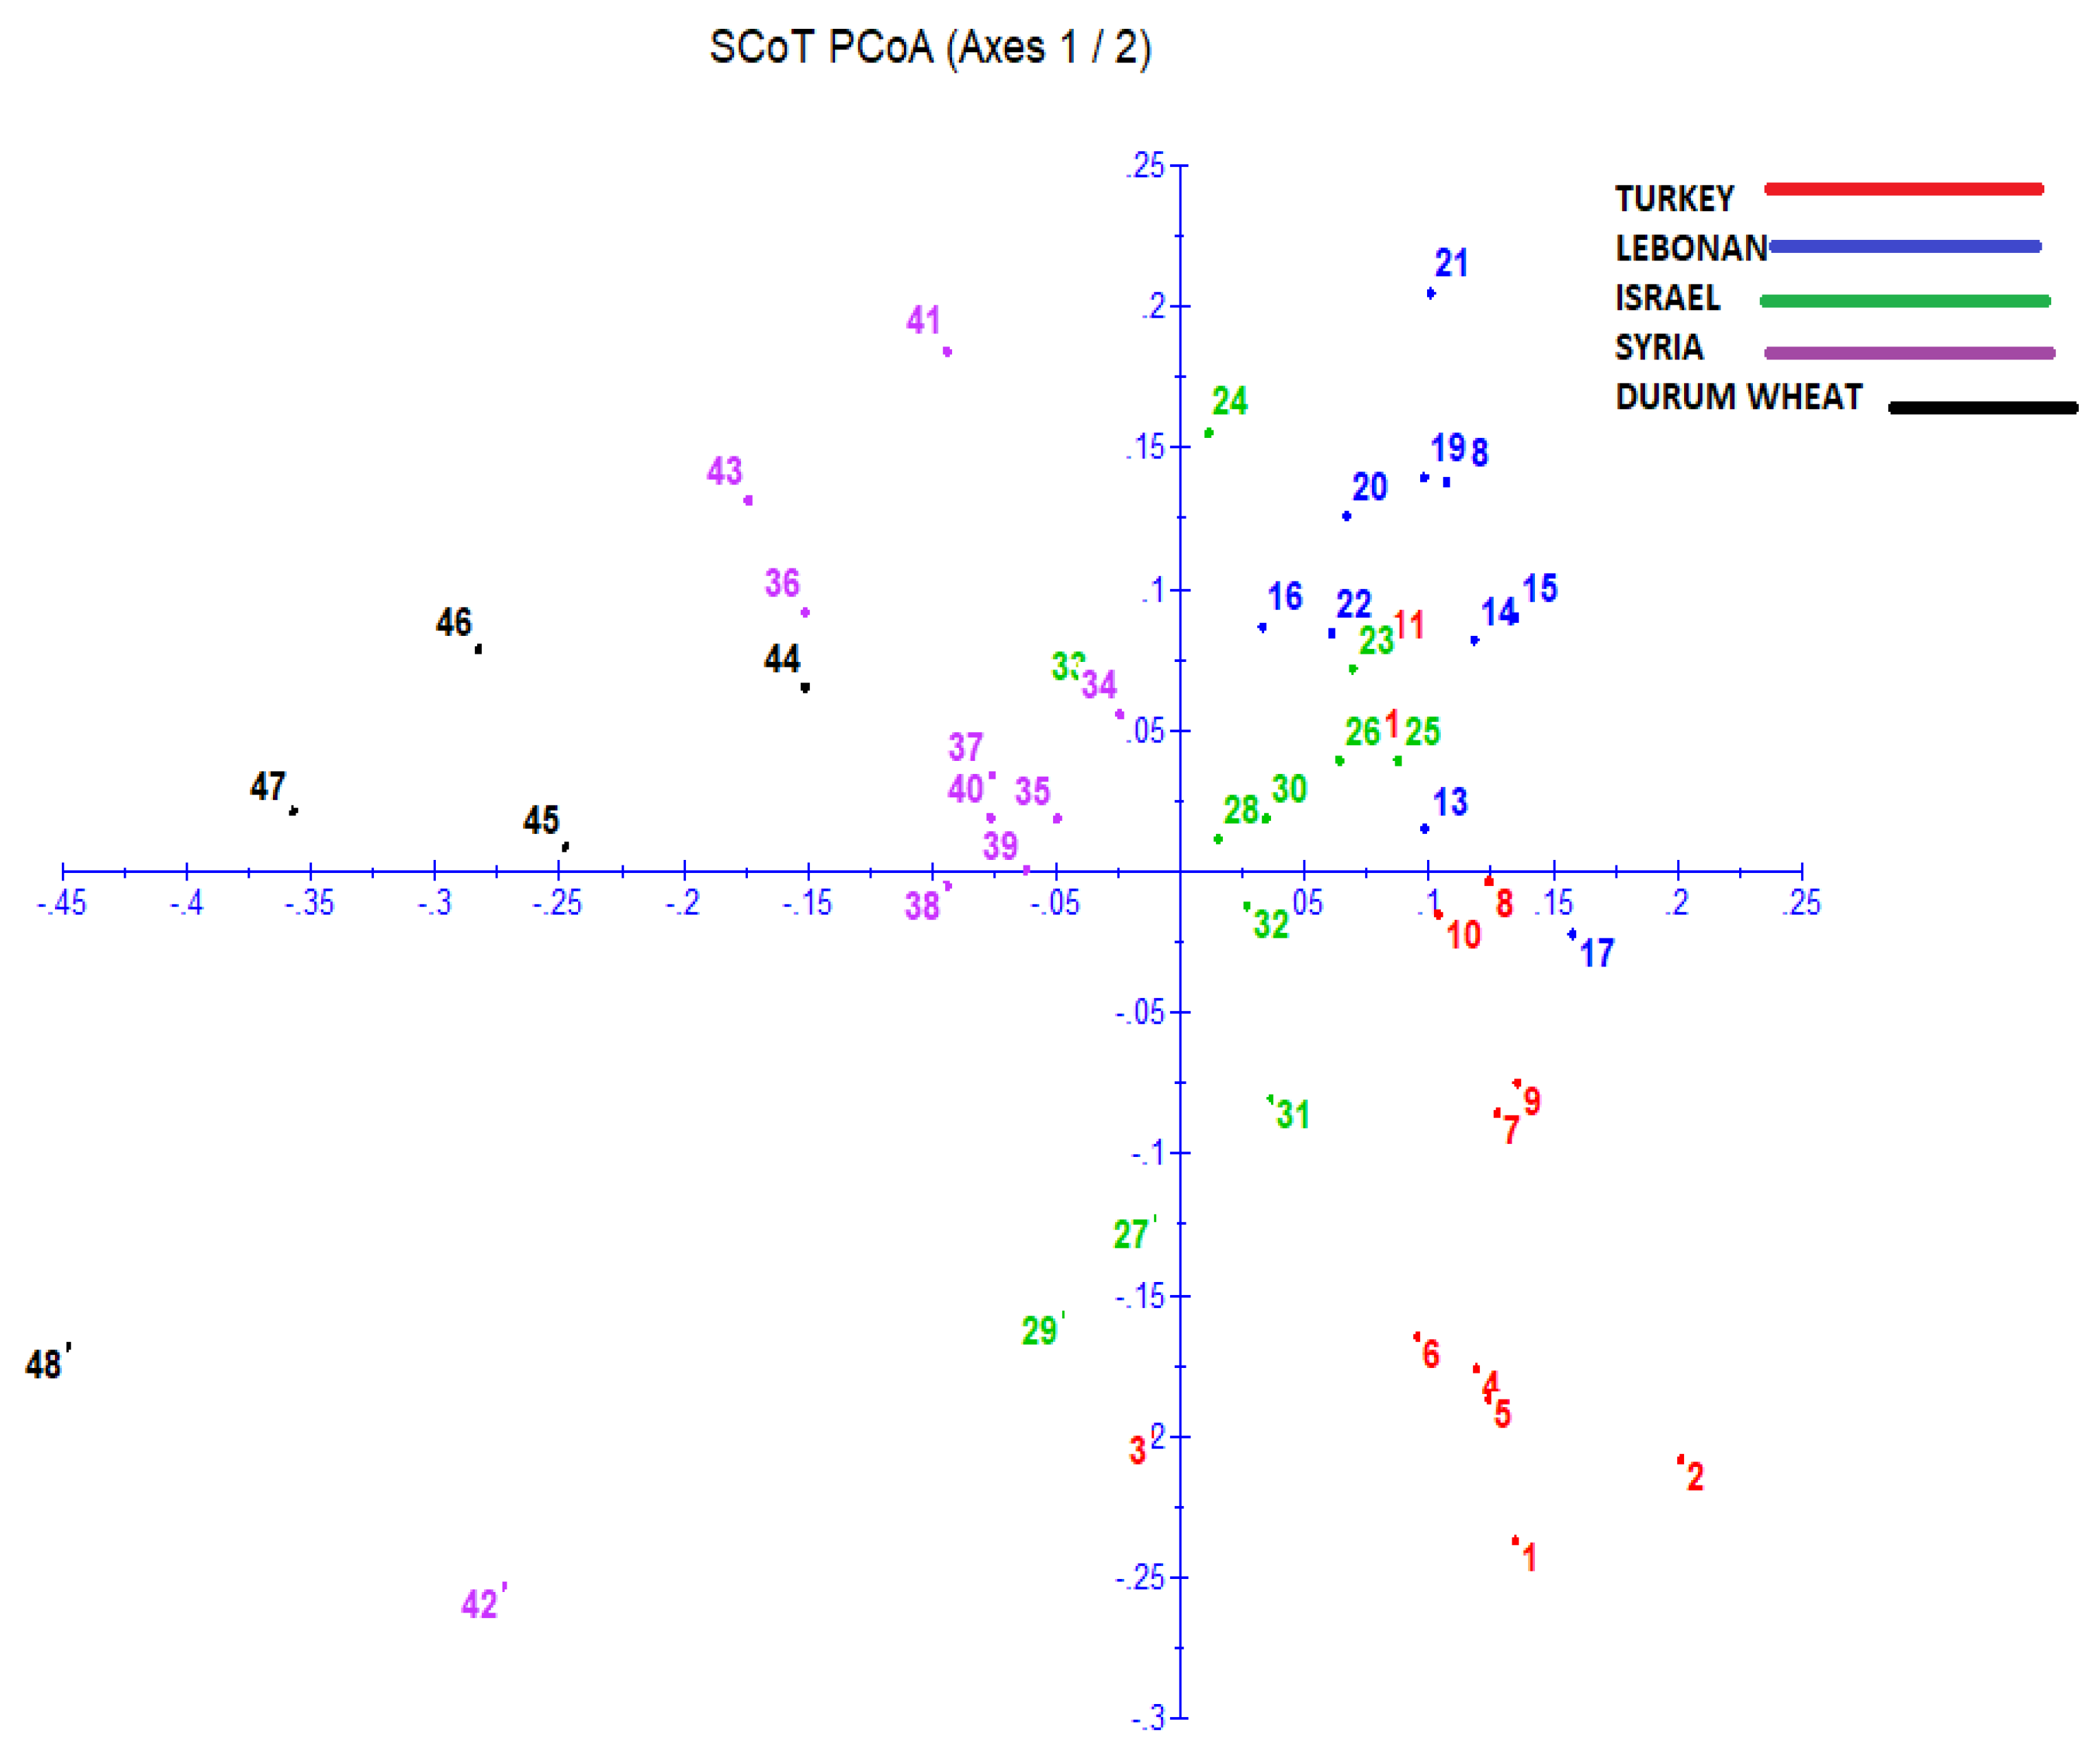
Figure 3.
Principal Coordinate Analysis (PCoA) of countries' wild emmer wheat and durum wheat genotypes revealed by the CAAT markers.
Figure 3.
Principal Coordinate Analysis (PCoA) of countries' wild emmer wheat and durum wheat genotypes revealed by the CAAT markers.
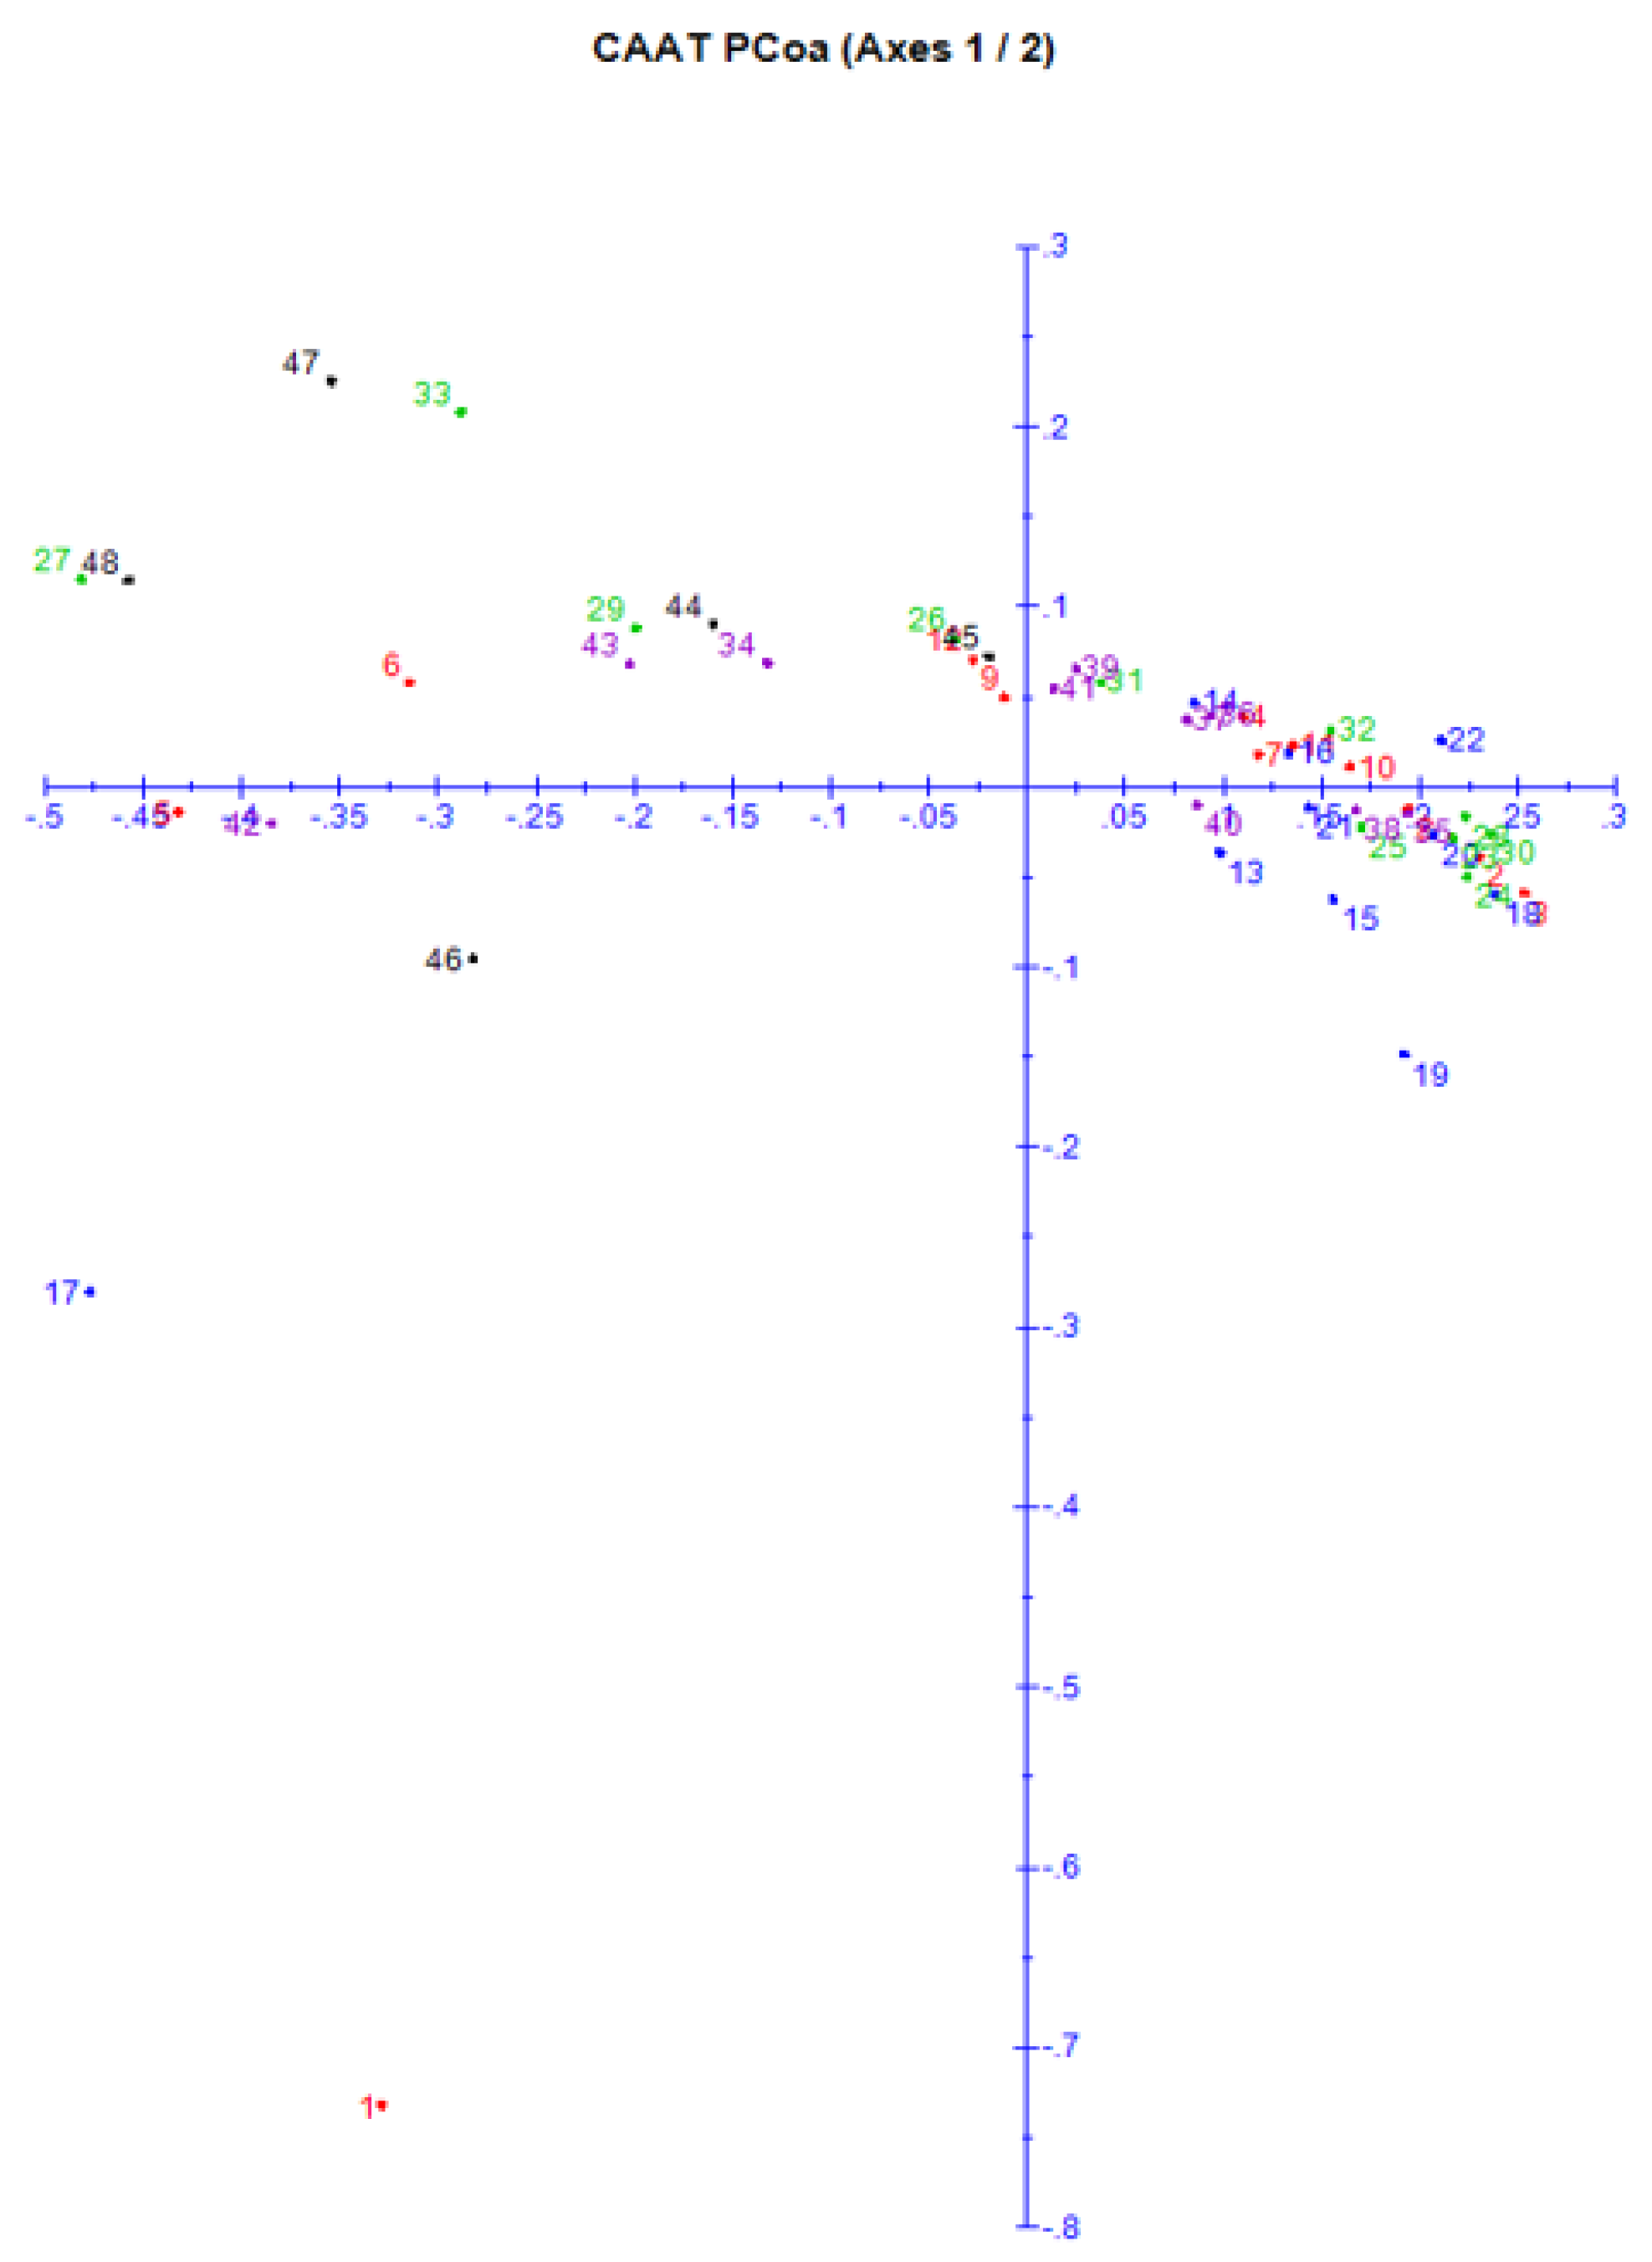
Figure 4.
Unweıghted Neighbor-joining analysis of countries wild emmer and durum wheat revealed by the SCoT marker system.
Figure 4.
Unweıghted Neighbor-joining analysis of countries wild emmer and durum wheat revealed by the SCoT marker system.
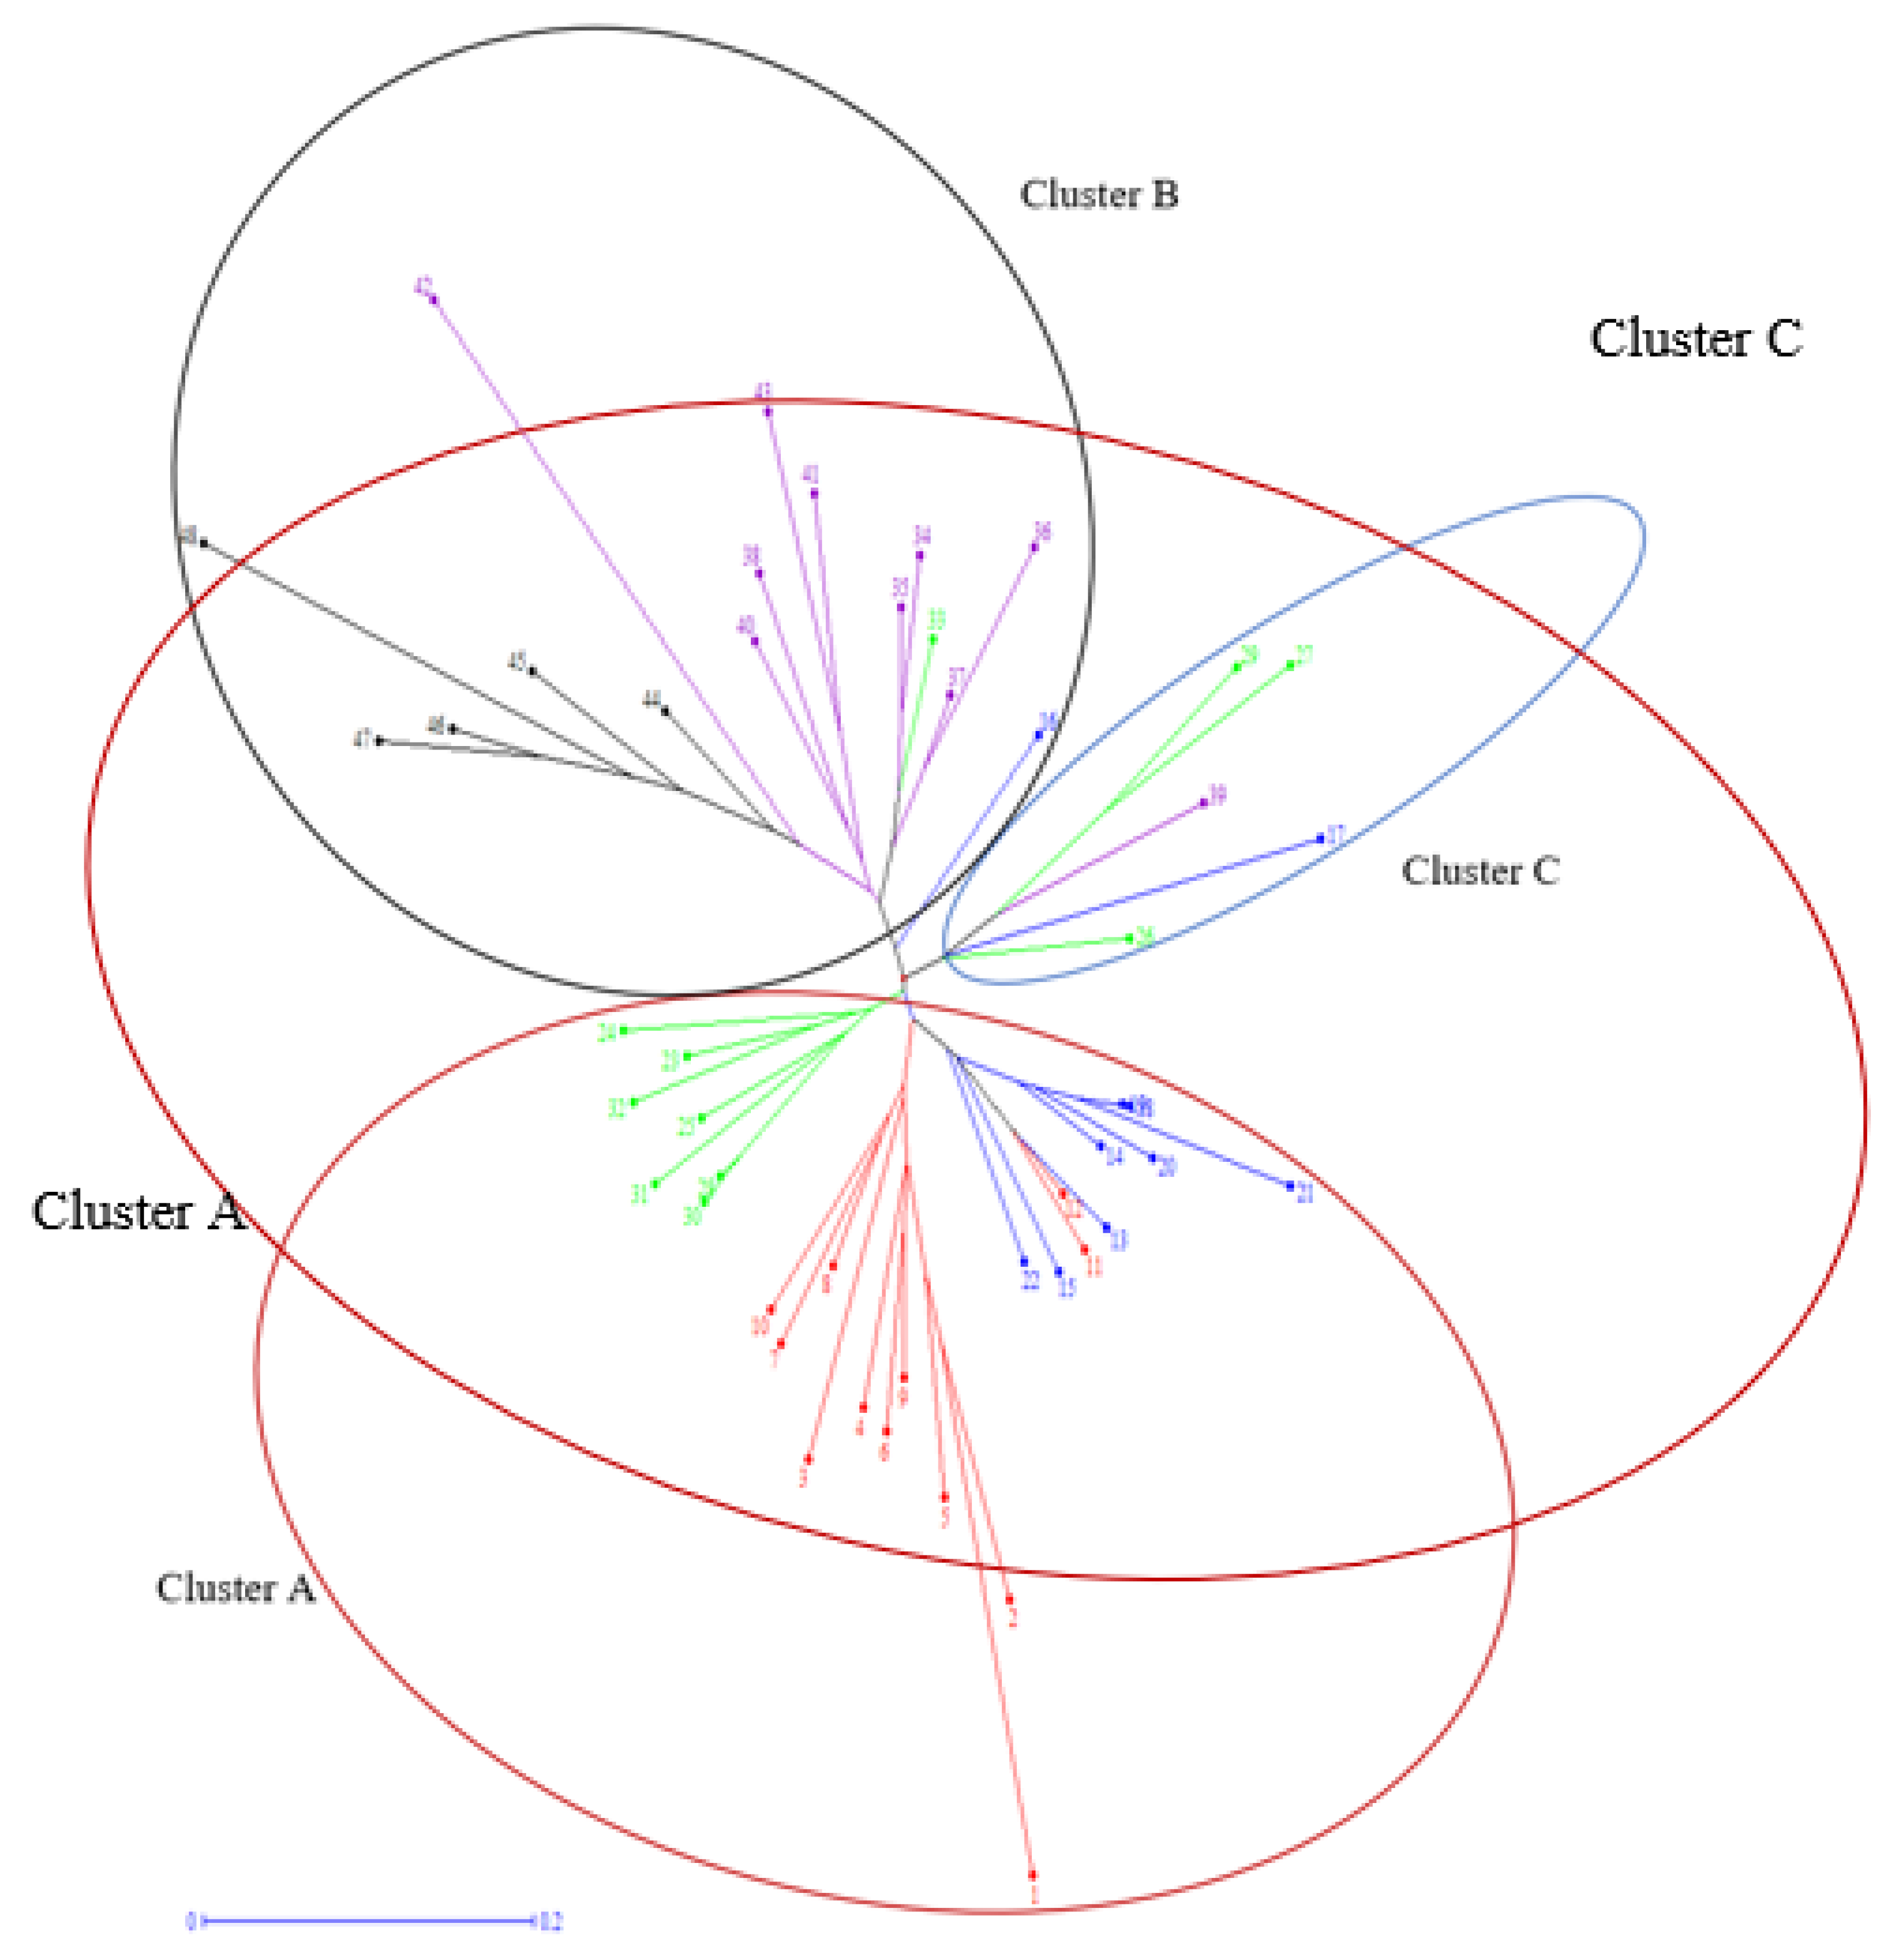
Figure 5.
Unweıghted Neighbor-joining analysis of countries wild emmer wheat and durum wheat revealed by the CAAT marker system. Note: Accession ID 1=CUZF1, 2=CUZF2, 3=CUZF3, 4=CUZF4, 5=CUZF5, 6=CUZF6, 7=CUZF7, 8 =CUZF8, 9=CUZF9, 10=CUZF10, 11=CUZF11, 12=CUZF12, 13=CUZF13, 14=CUZF14, 15=CUZF15, 16=CUZF16, 17=CUZF17, 18 =CUZF18, 19=CUZF19, 20=CUZF20, 21=CUZF21, 22=CUZF22, 23=CUZF23, 24=CUZF24, 25=CUZF25, 26=CUZF26, 27=CUZF27, 28=CUZF28, 29=CUZF29, 30=CUZF30, 31=CUZF31, 32=CUZF32, 33=CUZF33,34=CUZF34, 35=CUZF35, 36=CUZF36, 37=CUZF37,38=CUZF38, 39=CUZF39, 40=CUZF40, 41=CUZF41, 42=CUZF42, 43=CUZF43, 44=CUZF44, 45=CUZF45, 46=CUZF46, 47=CUZF47, 48=CUZF48.
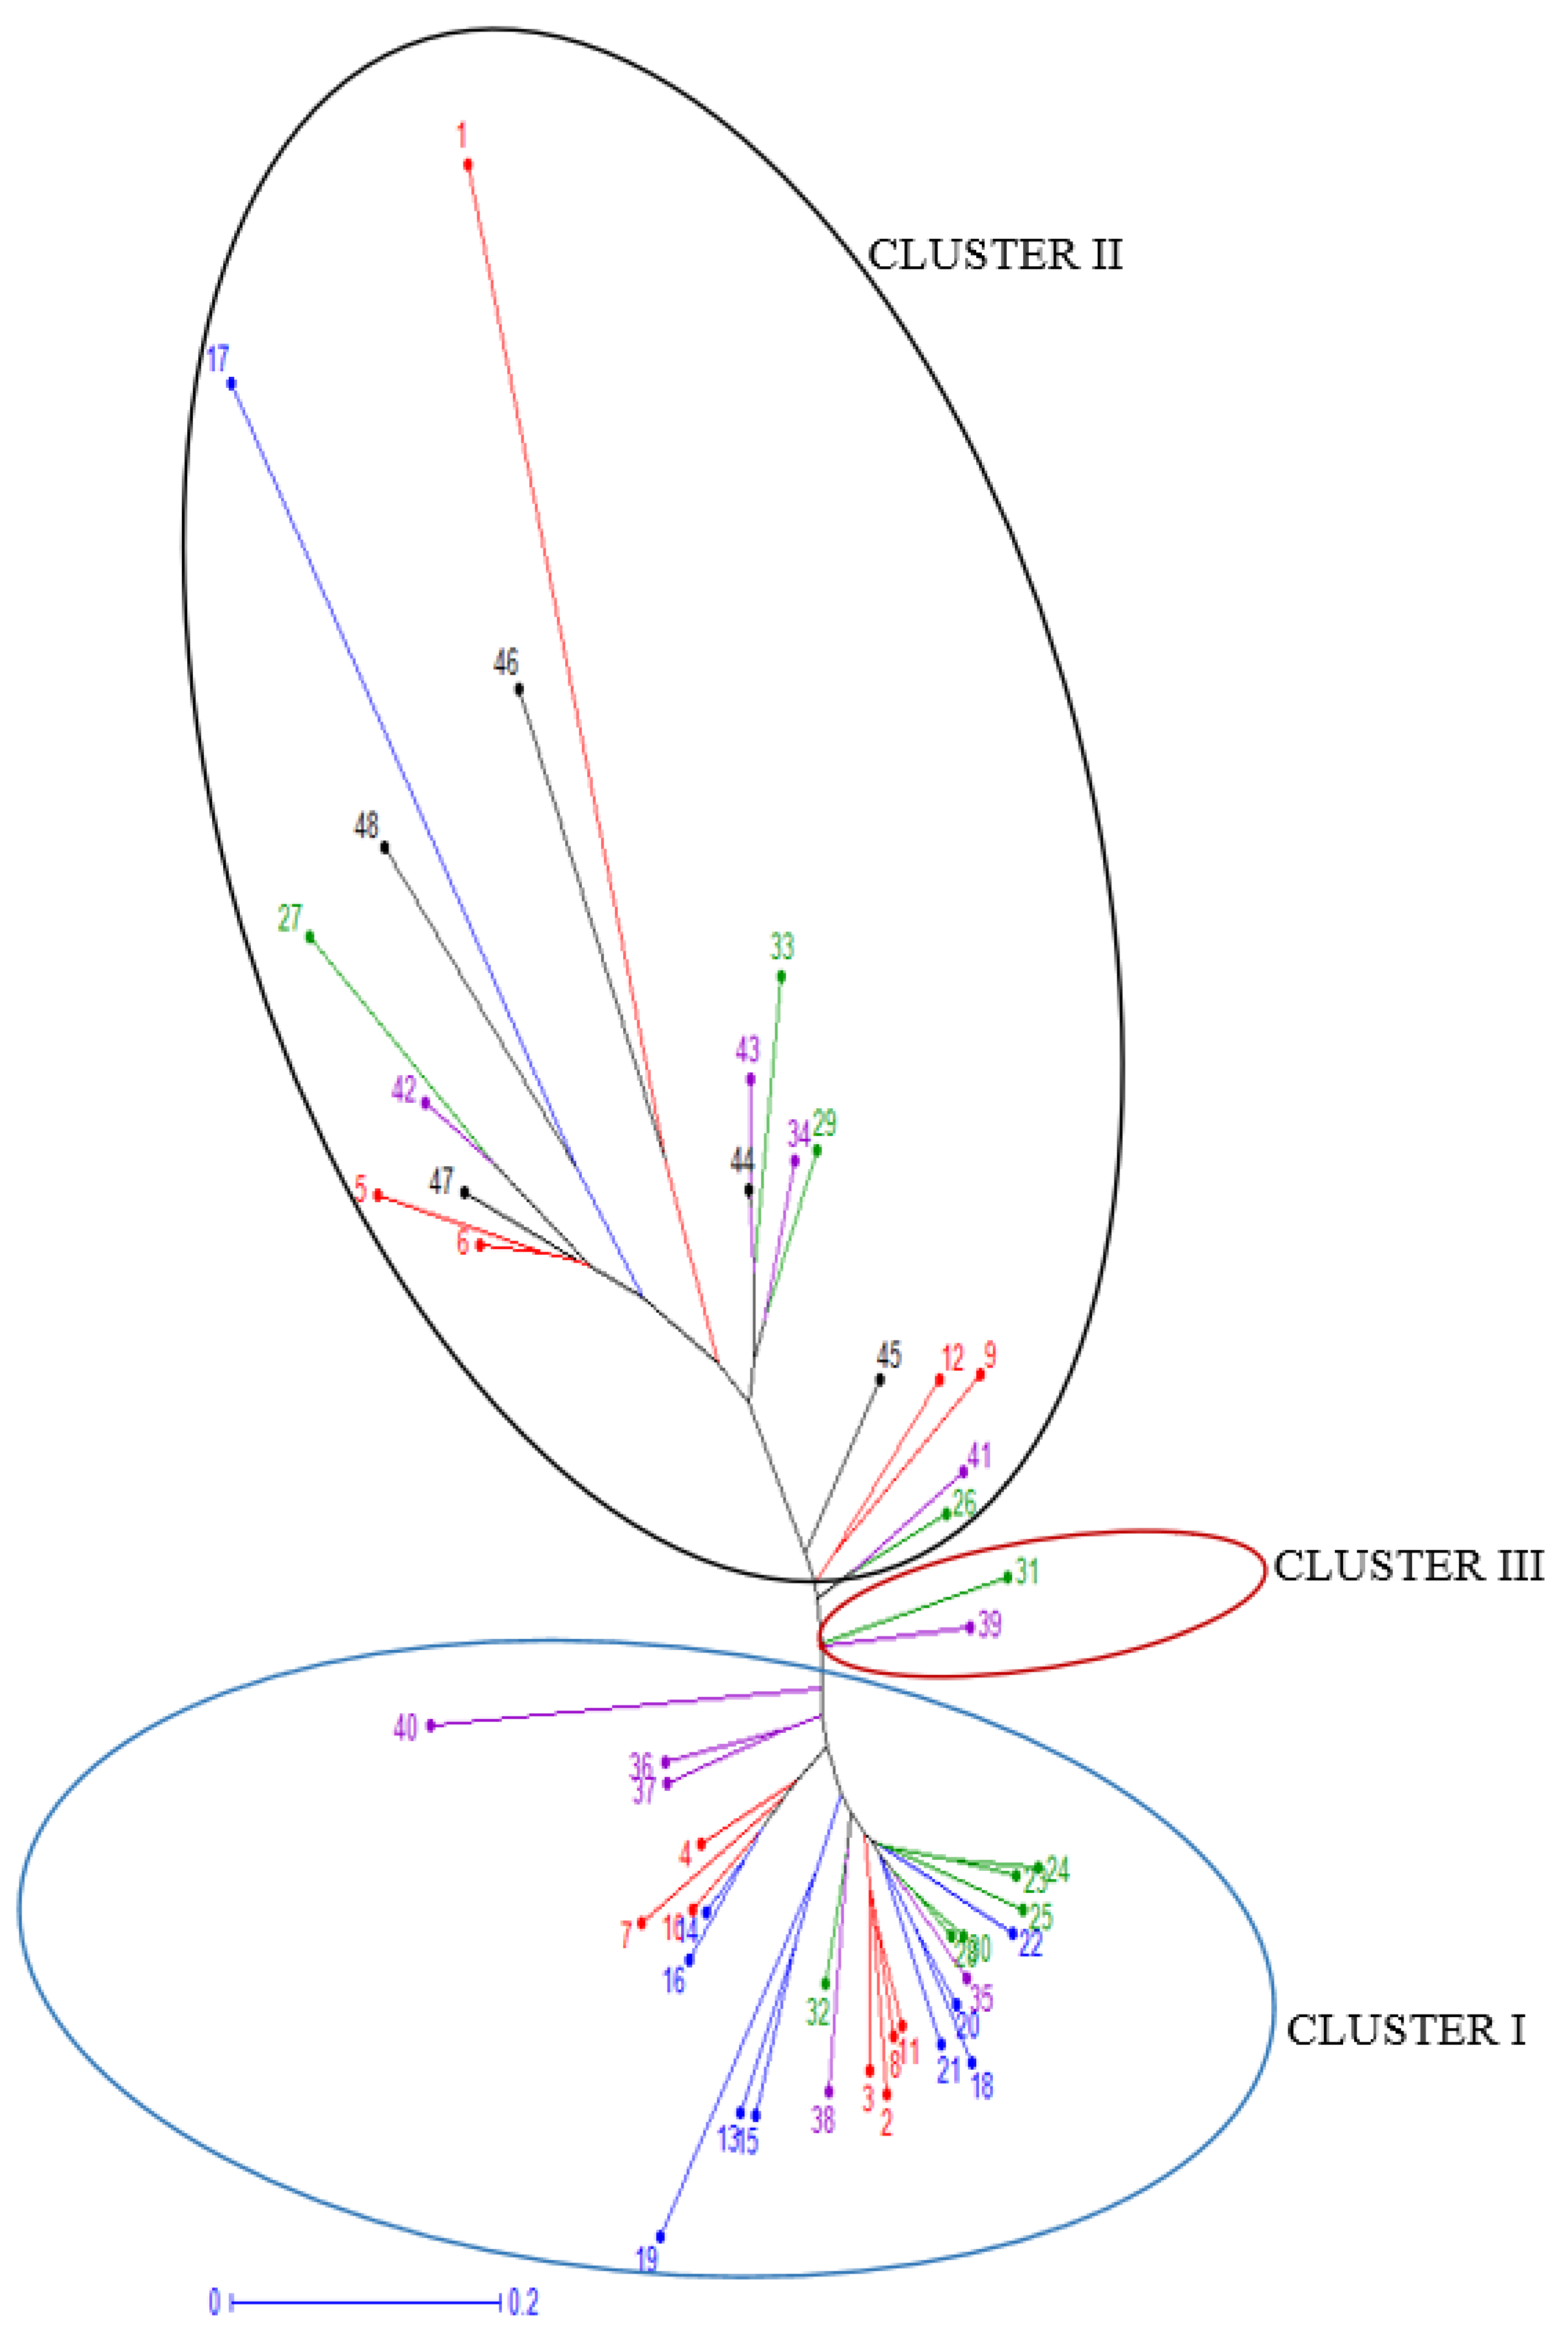
Table 2.
CAAT and SCoT Markers and Base Sequences Used in the Study.
| Primer Name | Sequencing (5’-3’) |
|---|---|
| CAAT PRIMERS | |
| CAAT10 | TGAGCACGATCCAATGTT |
| CAAT12 | TGAGCACGATCCAATATA |
| CAAT13 | TGAGCACGATCCAATGAG |
| CAAT14 | TGAGCACGATCCAATGCG |
| CAAT20 | CTGAGCACGATCCAATAT |
| CAAT21 | CTGAGCACGATCCAATCA |
| CAAT22 | CTGAGCACGATCCAATCG |
| SCoT PRIMERS | |
| SCOT7 | CAACAATGGCTACCACGG |
| SCOT8 | CAACAATGGCTACCACGT |
| SCOT9 | CAACAATGGCTACCAGCA |
| SCOT10 | CAACAATGGCTACCAGCC |
| SCOT11 | AAGCAATGGCTACCACCA |
| SCOT13 | ACGACATGGCGACCATCG |
| SCOT16 | CCATGGCTACCACCGGCC |
| SCOT17 | CATGGCTACCACCGGCCC |
| SCOT19 | GCAACAATGGCTACCACC |
| SCOT23 | ACCATGGCTACCACGGGC |
Table 3.
Polymorphism Statistics Calculated with Different CAAT and SCoT Primers in Wild Emmer (Triticum dicocccoides) and Durum WheatGenotypes.
Table 3.
Polymorphism Statistics Calculated with Different CAAT and SCoT Primers in Wild Emmer (Triticum dicocccoides) and Durum WheatGenotypes.
| Primer Name | Scored Bands | H | PIC | E | Hav | MI | D | R |
|---|---|---|---|---|---|---|---|---|
| CAAT Primers | ||||||||
| CAAT10 | 2 | 0.435 | 0.378 | 1.361 | 0.005 | 0.006 | 0.539 | 1.063 |
| CAAT12 | 7 | 0.328 | 0.419 | 1.446 | 0.001 | 0.001 | 0.958 | 1.617 |
| CAAT13 | 12 | 0.491 | 0.352 | 5.212 | 0.001 | 0.005 | 0.812 | 4.638 |
| CAAT14 | 8 | 0.499 | 0.348 | 3.872 | 0.001 | 0.005 | 0.766 | 3.829 |
| CAAT20 | 10 | 0.378 | 0.401 | 2.531 | 0.001 | 0.002 | 0.936 | 3.574 |
| CAAT21 | 12 | 0.498 | 0.349 | 6.361 | 0.001 | 0.006 | 0.719 | 7.531 |
| CAAT22 | 12 | 0.402 | 0.392 | 3.340 | 0.001 | 0.002 | 0.923 | 5.914 |
| Mean | 6.3 | 0.433 | 0.377 | 3.446 | 0.001 | 0.004 | 0.808 | 4.024 |
| SCoT Primers | ||||||||
| SCoT7 | 9 | 0.491 | 0.370 | 3.893 | 0.001 | 0.005 | 0.813 | 4.340 |
| SCoT8 | 10 | 0.487 | 0.371 | 4.191 | 0.001 | 0.004 | 0.825 | 5.489 |
| SCoT9 | 8 | 0.440 | 0.393 | 2.617 | 0.001 | 0.003 | 0.894 | 3.531 |
| SCoT10 | 7 | 0.498 | 0.366 | 3.255 | 0.002 | 0.005 | 0.784 | 2.936 |
| SCoT11 | 6 | 0.497 | 0.367 | 2.765 | 0.002 | 0.005 | 0.788 | 2.127 |
| SCoT13 | 7 | 0.447 | 0.390 | 2.361 | 0.001 | 0.003 | 0.887 | 3.319 |
| SCoT16 | 10 | 0.483 | 0.373 | 4.085 | 0.001 | 0.004 | 0.834 | 2.553 |
| SCoT17 | 7 | 0.499 | 0.365 | 3.361 | 0.002 | 0.005 | 0.770 | 2.382 |
| SCoT19 | 5 | 0.499 | 0.365 | 2.617 | 0.002 | 0.006 | 0.727 | 2.595 |
| SCoT23 | 7 | 0.500 | 0.365 | 3.468 | 0.002 | 0.005 | 0.755 | 4.723 |
| Mean | 7.6 | 0.484 | 0.373 | 3.261 | 0.001 | 0.005 | 0.808 | 3.400 |
Discriminating power (D), effective multiplex ratio (E), expected heterozygosity (H), mean heterozygosity (Hav), marker index (MI), polymorphism information content (PIC), resolving power (R).
Table 4.
Parameters Obtained Using CAAT Molecular Markers in Wild Emmer (Triticum dicoccoides) and Durum Wheat Genotypes Representing Different Countries.
Table 4.
Parameters Obtained Using CAAT Molecular Markers in Wild Emmer (Triticum dicoccoides) and Durum Wheat Genotypes Representing Different Countries.
| Countries | CAAT primers | H | PIC | E | Hav | MI | D | R |
|---|---|---|---|---|---|---|---|---|
| caat10 | 0.497 | 0.350 | 1.083 | 0.021 | 0.022 | 0.717 | 1.166 | |
| caat12 | 0.278 | 0.435 | 1.166 | 0.003 | 0.004 | 0.974 | 2.000 | |
| caat13 | 0.481 | 0.358 | 4.833 | 0.003 | 0.016 | 0.839 | 4.333 | |
| caat14 | 0.500 | 0.349 | 4.083 | 0.005 | 0.021 | 0.742 | 3.500 | |
| Turkey | caat20 | 0.413 | 0.388 | 2.916 | 0.003 | 0.010 | 0.917 | 3.833 |
| caat21 | 0.472 | 0.362 | 7.416 | 0.003 | 0.024 | 0.620 | 6.500 | |
| caat22 | 0.353 | 0.411 | 2.750 | 0.002 | 0.007 | 0.949 | 5.166 | |
| mean | 0.428 | 0.379 | 3.464 | 0.006 | 0.015 | 0.823 | 3.785 | |
| caat10 | 0.397 | 0.411 | 1.454 | 0.018 | 0.026 | 0.481 | 1.090 | |
| caat12 | 0.329 | 0.435 | 1.454 | 0.004 | 0.006 | 0.959 | 1.818 | |
| caat13 | 0.500 | 0.364 | 5.909 | 0.004 | 0.022 | 0.759 | 3.090 | |
| caat14 | 0.499 | 0.365 | 3.818 | 0.006 | 0.022 | 0.775 | 3.090 | |
| Israel | caat20 | 0.388 | 0.414 | 2.636 | 0.004 | 0.009 | 0.932 | 3.636 |
| caat21 | 0.483 | 0.373 | 7.090 | 0.004 | 0.026 | 0.653 | 6.727 | |
| caat22 | 0.471 | 0.379 | 4.545 | 0.004 | 0.016 | 0.858 | 7.636 | |
| mean | 0.438 | 0.391 | 3.844 | 0.006 | 0.018 | 0.774 | 3.870 | |
| caat10 | 0.420 | 0.402 | 1.400 | 0.021 | 0.029 | 0.521 | 1.200 | |
| caat12 | 0.368 | 0.423 | 1.700 | 0.005 | 0.009 | 0.944 | 1.400 | |
| caat13 | 0.500 | 0.365 | 5.900 | 0.004 | 0.025 | 0.760 | 4.200 | |
| caat14 | 0.455 | 0.387 | 5.200 | 0.006 | 0.030 | 0.580 | 2.400 | |
| Lebanon | caat20 | 0.428 | 0.399 | 3.100 | 0.004 | 0.013 | 0.906 | 4.600 |
| caat21 | 0.500 | 0.365 | 5.900 | 0.004 | 0.025 | 0.760 | 8.200 | |
| caat22 | 0.439 | 0.394 | 3.900 | 0.004 | 0.014 | 0.896 | 5.400 | |
| mean | 0.444 | 0.391 | 3.315 | 0.007 | 0.021 | 0.767 | 3.914 | |
| caat10 | 0.320 | 0.403 | 1.600 | 0.016 | 0.026 | 0.368 | 0.800 | |
| caat12 | 0.368 | 0.387 | 1.700 | 0.005 | 0.009 | 0.944 | 0.600 | |
| caat13 | 0.477 | 0.341 | 4.700 | 0.004 | 0.019 | 0.849 | 3.800 | |
| caat14 | 0.480 | 0.339 | 3.200 | 0.006 | 0.019 | 0.843 | 3.600 | |
| Syria | caat20 | 0.320 | 0.403 | 2.200 | 0.003 | 0.006 | 0.962 | 2.800 |
| caat21 | 0.498 | 0.331 | 5.600 | 0.004 | 0.023 | 0.784 | 4.800 | |
| caat22 | 0.391 | 0.378 | 3.200 | 0.003 | 0.010 | 0.931 | 4.000 | |
| mean | 0.408 | 0.369 | 3.171 | 0.006 | 0.016 | 0.811 | 2.714 | |
| caat10 | 0.500 | 0.171 | 1.000 | 0.050 | 0.050 | 0.778 | 0.001 | |
| caat12 | 0.202 | 0.276 | 0.800 | 0.006 | 0.005 | 0.990 | 1.600 | |
| caat13 | 0.391 | 0.220 | 3.200 | 0.007 | 0.021 | 0.932 | 3.600 | |
| caat14 | 0.320 | 0.245 | 1.600 | 0.008 | 0.013 | 0.964 | 2.400 | |
| Durum Wheat | caat20 | 0.147 | 0.286 | 0.800 | 0.003 | 0.002 | 0.995 | 1.200 |
| caat21 | 0.406 | 0.214 | 3.400 | 0.007 | 0.023 | 0.923 | 2.000 | |
| caat22 | 0.095 | 0.292 | 0.600 | 0.002 | 0.001 | 0.998 | 1.200 | |
| mean | 0.295 | 0.243 | 1.628 | 0.012 | 0.016 | 0.940 | 1.714 |
Discriminating power (D), effective multiplex ratio (E), expected heterozygosity (H), mean heterozygosity (Hav), marker index (MI), polymorphism information content (PIC), resolving power (R).
Table 5.
Parameters Obtained Using SCoT Molecular Markers in Wild Emmer (Triticum dicoccoides) and Durum Wheat Genotypes Representing Different Countries.
Table 5.
Parameters Obtained Using SCoT Molecular Markers in Wild Emmer (Triticum dicoccoides) and Durum Wheat Genotypes Representing Different Countries.
| Countries | Primers | H | PIC | E | Hav | MI | D | R |
|---|---|---|---|---|---|---|---|---|
| Scot7 | 0.499 | 0.360 | 4.333 | 0.005 | 0.020 | 0.771 | 2.666 | |
| Scot8 | 0.486 | 0.370 | 4.166 | 0.004 | 0.017 | 0.828 | 5.333 | |
| Scot9 | 0.413 | 0.400 | 2.333 | 0.004 | 0.010 | 0.917 | 3.000 | |
| Scot10 | 0.472 | 0.380 | 2.666 | 0.006 | 0.015 | 0.858 | 1.333 | |
| Turkey | Scot11 | 0.486 | 0.370 | 2.500 | 0.007 | 0.017 | 0.830 | 2.333 |
| Scot13 | 0.436 | 0.390 | 2.250 | 0.005 | 0.012 | 0.899 | 2.166 | |
| Scot16 | 0.413 | 0.400 | 2.916 | 0.003 | 0.010 | 0.917 | 3.166 | |
| Scot17 | 0.486 | 0.370 | 4.083 | 0.006 | 0.024 | 0.663 | 1.833 | |
| Scot19 | 0.486 | 0.370 | 2.916 | 0.008 | 0.024 | 0.664 | 1.500 | |
| Scot23 | 0.490 | 0.370 | 4.000 | 0.006 | 0.023 | 0.676 | 2.333 | |
| Mean | 0.467 | 0.379 | 3.216 | 0.005 | 0.017 | 0.802 | 2.566 | |
| Scot7 | 0.485 | 0.382 | 3.727 | 0.005 | 0.018 | 0.831 | 4.000 | |
| Scot8 | 0.472 | 0.388 | 3.818 | 0.004 | 0.016 | 0.856 | 4.727 | |
| Scot9 | 0.469 | 0.390 | 3.000 | 0.005 | 0.016 | 0.862 | 2.545 | |
| Scot10 | 0.490 | 0.380 | 4.000 | 0.006 | 0.025 | 0.677 | 2.545 | |
| Israel | Scot11 | 0.498 | 0.376 | 2.818 | 0.008 | 0.021 | 0.783 | 1.636 |
| Scot13 | 0.499 | 0.375 | 3.636 | 0.006 | 0.024 | 0.733 | 2.545 | |
| Scot16 | 0.499 | 0.375 | 5.272 | 0.005 | 0.024 | 0.724 | 3.272 | |
| Scot17 | 0.499 | 0.375 | 3.363 | 0.006 | 0.022 | 0.772 | 2.727 | |
| Scot19 | 0.452 | 0.397 | 3.272 | 0.008 | 0.027 | 0.576 | 2.000 | |
| Scot23 | 0.481 | 0.384 | 4.181 | 0.006 | 0.026 | 0.646 | 2.727 | |
| Mean | 0.484 | 0.382 | 3.709 | 0.006 | 0.022 | 0.746 | 2.872 | |
| Scot7 | 0.500 | 0.375 | 4.600 | 0.006 | 0.026 | 0.742 | 3.200 | |
| Scot8 | 0.476 | 0.386 | 6.100 | 0.005 | 0.029 | 0.630 | 4.200 | |
| Scot9 | 0.480 | 0.384 | 3.200 | 0.006 | 0.019 | 0.843 | 3.200 | |
| Scot10 | 0.474 | 0.387 | 2.700 | 0.007 | 0.018 | 0.855 | 1.000 | |
| Scot11 | 0.499 | 0.375 | 2.900 | 0.008 | 0.024 | 0.771 | 1.400 | |
| Lebanon | Scot13 | 0.420 | 0.411 | 2.100 | 0.006 | 0.013 | 0.913 | 2.600 |
| Scot16 | 0.484 | 0.383 | 4.100 | 0.005 | 0.020 | 0.834 | 2.200 | |
| Scot17 | 0.474 | 0.387 | 4.300 | 0.007 | 0.029 | 0.626 | 1.000 | |
| Scot19 | 0.497 | 0.376 | 2.700 | 0.010 | 0.027 | 0.713 | 2.200 | |
| Scot23 | 0.474 | 0.387 | 4.300 | 0.007 | 0.029 | 0.626 | 2.200 | |
| Mean | 0.478 | 0.385 | 3.700 | 0.007 | 0.023 | 0.755 | 2.320 | |
| Scot7 | 0.470 | 0.356 | 3.400 | 0.005 | 0.018 | 0.860 | 2.400 | |
| Scot8 | 0.412 | 0.382 | 2.900 | 0.004 | 0.012 | 0.918 | 3.800 | |
| Scot9 | 0.439 | 0.370 | 2.600 | 0.005 | 0.014 | 0.897 | 3.200 | |
| Scot10 | 0.500 | 0.342 | 3.400 | 0.007 | 0.024 | 0.768 | 3.200 | |
| Syria | Scot11 | 0.498 | 0.343 | 3.200 | 0.008 | 0.027 | 0.720 | 2.400 |
| Scot13 | 0.420 | 0.379 | 2.100 | 0.006 | 0.013 | 0.913 | 2.200 | |
| Scot16 | 0.480 | 0.352 | 4.000 | 0.005 | 0.019 | 0.842 | 1.600 | |
| Scot17 | 0.485 | 0.349 | 2.900 | 0.007 | 0.020 | 0.832 | 1.000 | |
| Scot19 | 0.487 | 0.348 | 2.100 | 0.010 | 0.020 | 0.829 | 2.600 | |
| Scot23 | 0.353 | 0.405 | 1.600 | 0.005 | 0.008 | 0.950 | 2.400 | |
| Mean | 0.454 | 0.363 | 2.820 | 0.006 | 0.018 | 0.853 | 2.480 | |
| Scot7 | 0.411 | 0.316 | 2.600 | 0.009 | 0.024 | 0.921 | 2.800 | |
| Scot8 | 0.471 | 0.289 | 3.800 | 0.009 | 0.036 | 0.860 | 2.000 | |
| Scot9 | 0.180 | 0.384 | 0.800 | 0.005 | 0.004 | 0.992 | 1.600 | |
| Scot10 | 0.496 | 0.277 | 3.800 | 0.014 | 0.054 | 0.713 | 0.400 | |
| Durum Wheat | Scot11 | 0.391 | 0.323 | 1.600 | 0.013 | 0.021 | 0.936 | 1.200 |
| Scot13 | 0.202 | 0.379 | 0.800 | 0.006 | 0.005 | 0.990 | 0.400 | |
| Scot16 | 0.461 | 0.294 | 3.600 | 0.009 | 0.033 | 0.875 | 2.000 | |
| Scot17 | 0.202 | 0.379 | 0.800 | 0.006 | 0.005 | 0.990 | 1.600 | |
| Scot19 | 0.365 | 0.333 | 1.200 | 0.015 | 0.018 | 0.950 | 1.200 | |
| Scot23 | 0.408 | 0.317 | 2.000 | 0.012 | 0.023 | 0.924 | 2.000 | |
| Mean | 0.359 | 0.329 | 1.860 | 0.010 | 0.022 | 0.915 | 1.440 |
Table 6.
Mean Genetic Diversity Parameters of Triticum dicoccoides and Durum Wheat Genotypes in Relation to CAAT and SCoT Markers.
Table 6.
Mean Genetic Diversity Parameters of Triticum dicoccoides and Durum Wheat Genotypes in Relation to CAAT and SCoT Markers.
| H | PIC | E | Hav | MI | D | R | ||
|---|---|---|---|---|---|---|---|---|
| CAAT PRIMERS | ||||||||
| Turkey | 0.428 | 0.379 | 3.464 | 0.006 | 0.015 | 0.823 | 3.785 | |
| Israel | 0.438 | 0.391 | 3.844 | 0.006 | 0.018 | 0.774 | 3.870 | |
| Lebanon | 0.444 | 0.391 | 3.315 | 0.007 | 0.021 | 0.767 | 3.914 | |
| Syria | 0.408 | 0.369 | 3.171 | 0.006 | 0.016 | 0.811 | 2.714 | |
| Durum Wheat | 0.295 | 0.243 | 1.628 | 0.012 | 0.016 | 0.940 | 1.714 | |
| SCoT PRIMERS | ||||||||
| Turkey | 0.467 | 0.379 | 3.216 | 0.005 | 0.017 | 0.802 | 2.566 | |
| Israel | 0.484 | 0.382 | 3.709 | 0.006 | 0.022 | 0.746 | 2.872 | |
| Lebanon | 0.478 | 0.385 | 3.700 | 0.007 | 0.023 | 0.755 | 2.320 | |
| Syria | 0.454 | 0.363 | 2.820 | 0.006 | 0.018 | 0.853 | 2.480 | |
| Durum Wheat | 0.359 | 0.329 | 2.100 | 0.010 | 0.022 | 0.915 | 1.440 | |
Disclaimer/Publisher’s Note: The statements, opinions and data contained in all publications are solely those of the individual author(s) and contributor(s) and not of MDPI and/or the editor(s). MDPI and/or the editor(s) disclaim responsibility for any injury to people or property resulting from any ideas, methods, instructions or products referred to in the content. |
© 2024 by the authors. Licensee MDPI, Basel, Switzerland. This article is an open access article distributed under the terms and conditions of the Creative Commons Attribution (CC BY) license (http://creativecommons.org/licenses/by/4.0/).
Copyright: This open access article is published under a Creative Commons CC BY 4.0 license, which permit the free download, distribution, and reuse, provided that the author and preprint are cited in any reuse.


