
Submitted:
18 December 2024
Posted:
20 December 2024
You are already at the latest version
Abstract
Drought is the most significant negative factor affecting common bean (Phaseolus vulgaris L.) production. Scarce studies about genetic control of drought tolerance in beans impedes a more effective exploitation these traits in plant breeding. The Tepary bean (Phaseolus acitifolius A. Gray) is considered a valuable source of drought-resistant genes for improving commercial varieties that are susceptible to drought. The main objective of this study was to evaluate the germination and seedling growth components in response to drought stress simulated with polyethylene glycol (PEG-6000). We developed a F3 biparental population from the cross between susceptible P-saltillo variety and drought tolerant T-cafe, which allowed the study of drought tolerance genetics in beans. The F3 biparental population showed wide variability for the traits studied. I.e. from 0.0 to 2.4 for hypocotyl length. From 0.3 to 3.9 and 7.5 to 97.5 for germinated seeds (n and % hypocotyls, respectively). From 0.3 to 3.9 and 7.5 to 97.5 for germinated seeds (n and % roots, respectively). From 0.3 to 4.5 for root length, and from 0.0 to 4.8 for total length. The heritabilities for hypocotyl length (cm), germinated seeds (n hypocotyl), germinated seeds (% hypocotyl), root length (cm), germinated seeds (n roots), and germinated seeds (% roots) were moderate from 0.32 to 0.47. The heritability for root length was low with a value of 0.20. The most important positive and significant genetic correlations (0.80) were found between hypocotyls length (cm) and root length, which means that the longer the hypocotyls, the longer the root. All variables studied have normal distribution, which is why they are considered quantitative inheritance. The results highlight lines that can be candidates for registration of new drought tolerant varieties or used as sources of drought tolerance in future common bean improvement programs. Our results indicate that multiple genetic factors are involved in the drought tolerance response of the F3.
Keywords:
Phaseolus acutifolius
; Phaseolus vulgaris
; drought stress
; polyethylene glycol- 6000
; genetics
1. Introduction
The common bean (Phaseolus vulgaris L.) is the most important food legume; about 60% of its worldwide production is affected by droughts [1]. Dry bean is a resource of great importance since it is a healthy food rich in nutrients due to its high content of proteins, minerals, vitamins and dietary fiber mainly [2]; [3]. Bean production is influenced by biotic and abiotic factors [4]. Its yields widely vary and are often below the genetic potential of the species, given the diversity of cropping systems and climatic changes [3]. Pressures from climate change and population growth have negative effects on agriculture, increasingly threatening food security [5]. Abiotic stresses, such as drought, soil salinity, heavy metal toxicity, and extreme temperatures, lead to significant alterations in plant morphology, physiology, biochemistry, and cellular functions [6]; [7], ultimately contributing to decreased agricultural productivity [8]. However, drought is a major constraint to common bean production worldwide [9]; [10]; [11]; [12]; [13]; [14].
Drought is defined as a prolonged period of below-average rainfall and poses a serious problem for plant growth and agricultural productivity in many regions of the world [15]. Factors such as inadequate rainfall, inconsistent rainfall distribution, severity and duration of droughts and progression of stress contribute to soil water scarcity which affects common bean cultivation [16]. The aspect of stress that defines drought is the decreased availability of soil moisture, which in turn lowers the water potential (ψw) [17]. There is evidence to support that various germination and seedling growth indices are often employed as predictors for evaluating crops drought tolerance [18]; [19]; [20]; [21]; [22]; [23]; grain legumes, representing 90% of Mexico's agricultural output, are particularly sensitive to drought conditions [4]. These crops have experienced only slight annual yield increases of 0-2%, and their production is increasingly hindered by the effects of rapid climate change [24].
In Mexico, beans are a strategic crop, and the country ranks as the 8th largest producer globally. Mexican bean fields account for 3.9% of the global area dedicated to this crop, contributing 3.5% to the world’s total production [25]. In 2023, national bean production decreased by 25.0% due to the climatic challenges the country faced, leading to reduced domestic availability and a significant increase in imports, which were 3.6 times higher in both volume and value compared to the previous year [60]. In this regard, drought stress can result in a reduction in plant biomass, the number of seeds and pods per plant, maturity time, harvest index, seed yield, and seed weight in beans [26].
The Tepary bean (Phaseolus acutifolius A. Gray), one of the five domesticated species in the genus Phaseolus is native to the desert highlands of northwestern Mexico and the southwestern United States and is particularly notable because its resistance to drought and heat [27]. Wild lines maintain higher rates of leaf growth, pod growth, and seed filling under drought [12]. Tepary bean is a viable and nutritious alternative to improve common bean in areas with excessively high temperatures and/or chronic drought [27]. Also some common bean genotypes are a source of genetic variability and provide excellent material for the selection and improvement of numerous agronomic traits and the creation of modern cultivars [3]. Over the past few decades, it has been considered a valuable source of drought-resistant genes for the common bean. However, crossing common beans with Tepary beans has traditionally been challenging, often necessitating the use of cytoplasmic techniques and embryo rescue to produce viable F1 plants [28]. Despite the difficulties, the Tepary bean has been used where crops depend on dryland conditions. Recently, [29] reported the first cross between P. vulgaris x P. acutifolius (P-saltillo × T-amarillo) with direct crossing and obtaining fertile seeds, without the need for embryo rescue. Drought tolerance is an increasingly important trait in common bean due to the reduction in water resources by climate change, a shift in production areas and increasing input costs [30]. To achieve stable yields under these conditions, improved common bean varieties must possess characteristics that give them tolerance to drought. The success of common bean production depends to a large extent on the quality of the seed, the production approach and new breeding programs [3].
Polyethylene glycol is a chemically inactive compound that is commonly used to simulate consistent drought conditions during the early stages of germination and seedling growth, allowing researchers to study the effects of water stress on various plant species [31]; [32]; [20].
The main objective of this work was to evaluate drought tolerance in a biparental F3 population of P-saltillo (P. vulgaris) × T-cafe (P. acutifolius) under PEG-6000 induced drought stress for emergence and early seedling traits to identify potential lines of drought tolerance in the early stages of development for the improvement of common beans. All offspring of this population have the commercial color of the mother, P-saltillo. The parents are currently used in bean genetic improvement programs for northern Mexico.
2. Materials and Methods
2.1. Development of the F3 Biparental Population
The parental lines were selected by its level of susceptibility and tolerance to drought. P-saltillo as susceptible and T-cafe as tolerant [33]. We could not cross the most susceptible, PS-AZH-15, with the most tolerant, T-cafe [33], nor with embryo rescue. The two parents of the F3 biparental population (Table 1) were crossed to obtain single cross in 2020. After the F1, we self-pollinated the plants during other two generations, spring-summer 2021 to F2, and 2021-2022 autumn-winters to F3 using the single seed descendant method and finally obtained 98 F3 lines.
2.2. Experimental Design
The 98 F3 lines of the biparental population together with the two parents were evaluated in two bioassays for drought tolerance at the Colegio de Postgraduados, Montecillo, México in 2022. This study was conducted in the Laboratory of Biofísica and Fisiología Vegetal Ambiental where seeds were incubated in the dark at 27 °C in a growth chamber. Water potencial of -0.6 MPa was created using aqueous solution of PEG-6000 based on the equation supplied by [34]. Seed germination test was done in 10 cm Petri dishes with a layer of filter paper and 8 mL of a aqueous solution containing 200 g L-1 of PEG-6000. Seeds were considered germinated when the radicle or hypocotyls were approximately 2 mm long or more. The experimental design was a simple lattice design 10×10 with two repetitions. The experimental unit consists of a Petri dish with four seed of each F3 or Parent. The seeds used from the F3 and the parents were harvested on February 2022 in Santiago Ixcuintla, Nayarit, México. The experiment started on March 2022. The following variables were measured: 1) hypocotyl length (cm), measured with Image tool Program. 2) Germinated seeds (n hypocotyls), obtained accounted number of seeds that had more than 2 mm or more in hypocotyls length. 3) Germinated seeds (% hypocotyl), obtained with formula: GS= Germinated seeds (n hypocotyls) × 100/4. 4) Root length (cm), as root length measured with Image tool Program. 5) Germinated seeds (n roots), obtained accounted number of seeds that had more than 2 mm or more in root length. 6) Germinated seeds (% roots), obtained with formula: GS= Germinated seeds (n roots) × 100/4. 7) Total length, as the sum of hypocotyls length and root length.
2.3. Statistical Analysis
An analysis of variance was performed in statistical package SAS 9.4 [59]. For mean comparisons was used the test of MSD (Minimum Significative Difference) from LSD at p<0.05. Genotypes were fixed effects, while replicates, blocks and all interactions were considered random factors. The distributions of all traits were analyzed using the univariate procedure (PROC UNIVARIATE) of SAS 9.4. Heritabilities (h2) were estimated for each trait on a family mean basis as described by [35]. Genetic and phenotypic correlations between traits were calculated following [36]. All previous analyzes were done in SAS software 9.4 [59].
3. Results
3.1. Mean, Ranks and Heritabilities of the F3 Population
Significant differences were found for almost the variables studied between the parents of the F3 biparental population, the exception was hypocotyl length. The genotype that showed 100% germination, the greatest root length (4.35 cm), and the greatest total length (5.88 cm) was T-café (Table 2).
The best parent for germinated seeds (n hypocotyls and percentage hypocotyls) was T-cafe with a 4 and 100 %, respectively. In addition, the best parent for germinated seeds (n roots and % roots) was T-cafe with values of 4 and 100 % respectively. T-cafe was the best in root length with a value of 4.35 cm. The best parent was T-cafe with a total length of 5.88 cm. The F3 biparental population showed wide variability for the traits studied; from 0.0 to 2.4 for hypocotyl length. From 0.3 to 3.9 and 7.5 to 97.5 for germinated seeds (n and % hypocotyls, respectively). From 0.3 to 3.9 and 7.5 to 97.5 for germinated seeds (n and % roots, respectively). From 0.3 to 4.5 for root length. From 0 to 4.8 for total length. From 0 to 48.0 for hypocotyl length and from 6.0 to 78.0 for root length (Table 2).
The heritability for hypocotyl length (cm), germinated seeds (n hypocotyl), germinated seeds (% hypocotyl), root length (cm), germinated seeds (n roots), and germinated seeds (% roots) were moderate (from 0.32 to 0.47). The heritability for total length was low with a value of 0.20 (Table 2).
3.2. Genetic and Phenotypic Correlations
The most important positive and significant genetic correlations were found between hypocotyls length (cm) and root length (0.80), which means that the longer the hypocotyls is, the longer the root is (Table 3).
3.3. Distributions Analysis
3.4. Mean Comparison of the 4 Tolerant, the 3 Susceptible F3 and 2 Parents for Drought Tolerance
Highly significant statistical differences were found when analyzing the four best lines, three worst and the two parents. The best line within the F3 biparental population for hypocotyls length was the Line 4_1 (Figure 2).
Highly significant statistical differences were found when analyzing the four best lines, three worst and the two parents. The best lines within the F3 biparental population for germinated seeds (n hypocotyls) were the Line 44_1 and Line 42_1 (Figure 3). In Line 7_2, Line 5_1, and Line 1_3, germination was inhibited.
Highly significant statistical differences were found when analyzing the four best lines, three worst and the two parents. The best lines within the F3 biparental population for germinated seeds (% hypocotyls) were the Line 44_1 and Line 42_1 (Figure 4).
The best lines within the F3 biparental population for root length were the Line 42_1 and Line 40_1 (Figure 5). The bean genotypes exhibited a wide variability in their response to the reduction in ψw during germination and early developmental stages.
Highly significant statistical differences were found when analyzing the four best lines, three worst and the two parents. The best lines within the F3 biparental population for germinated seeds (n roots) were the Line 44_1 and Line 42_1 (Figure 6).
Highly significant statistical differences were found when analyzing the four best lines, three worst and the two parents. The best lines within the F3 biparental population for germinated seeds (% roots) were the Line 44_1 and Line 42_1 (Figure 7).
Highly significant statistical differences were found when analyzing the four best lines, three worst and the two parents. The best lines within the F3 biparental population for total length (cm) were the Line 42_1 and Line 44_1 (Figure 8).
4. Discussion
Tepary bean is superior to common bean in combining several desirable traits that contribute to greater level of adaptation to terminal drought stress [1]. Variability in genotypes is a prerequisite for undertaking a varietal development program [37]. Therefore, it is essential to analyze the characteristics and the extent of the heritable genetic variation present in such genotypes. Water stress at critical growth stages, such as germination and seedling establishment, results in reduced crop yield [38]. Bean genotypes that tolerate drought stress would stabilize and increase production in drought environments [39].
Few reports to study the heritability drought tolerance in Tepary bean and common bean have been based on the evaluation of adult plants in field trials [40]; [41]; [42]; [43]. No studies have been reported to determine the inheritance of drought tolerance in germination bioassays with PEG-6000. Our study focuses on predicting drought tolerance by simulating lower water availability using PEG-6000 during germination and seedling development. This method, utilizing PEG-6000, has been employed in other crops [44]; [45]; [46]; [47]; [48] and offers the advantage of measuring root and hypocotyls length, fresh weight of root and hipocotyls, dry weight of roots and hypocotyls and germination unlike field experiments where such measurements cannot be made accurately.
4.1. Mean, Ranks and Heritabilities of the F3 Population
This result in T-cafe for root length and total length had already been previously reported by [33]; they evaluated drought tolerance in different Tepary bean and common bean genotypes based on osmotic potential trials with PEG-6000.
These results in present research on heritability for hypocotyl length (cm), germinated seeds (n hypocotyl), germinated seeds (% hypocotyl), root length (cm), germinated seeds (n roots), and germinated seeds (% roots) (0.32-0.47) are according that reported moderate heritabilities from 0.55 and 0.51 for root area, 0.50 and 0.47 for root length, 0.51 and 0.61 for root mass by [49]. [41] reported heritability’s for shoot biomass at harvest of 33.8 under rainfed conditions and 56.9 under irrigated conditions and for shoot biomass at flowering reported heritability of 54.9; in addition the heritability reported by [50] estimate for shoot biomass was 0.36. [42] reported a heritability for hypocotyls root length of 0.36. All previous studies are in agreement with our study with heritability’s from 0.32 to 47.0.
The heritability estimates for specific traits are crucial in determining how these traits will respond to selection, which directly affects the planning of the legume breeding program. This includes choosing the type of selection, the breeding method to use, and assessing the need for replicated trials or progeny tests to control environmental variation. Traits exhibiting high heritability suggest that selection is more effective. Conversely, traits with low heritability imply that selection is impacted by environmental factors. A high heritability of a trait also signifies that additive genetic effects play a significant role in controlling that trait. The study found that the variability observed in most traits was attributable to both genotypic variance and environmental factors. The effectiveness of selecting for a specific trait is influenced by the balance between genetic and environmental factors, which highlight the differences among genotypes within a population [51].
4.2. Genetic and Phenotypic Correlations
The positive and significant genetic correlations were found between hypocotyls length (cm) and root length (0.80), which means that the longer the hypocotyls is, the longer the root is and are agree with [49] that reported highly significant phenotypic and genotypic correlations between shoot mass and root mass, according with our study, although they analyzed the mass of root and shoot. According with [52] which states that root growth and shoot growth have a complex relationship. In other words, the shoot provides the root with carbon and certain hormones, and the root provides the shoot with water, nutrients, and with hormones. To increase grain yield through a better plant growth under both optimal and drought stress conditions, the root system must be able to supply water and nutrients to the new plant growth without sequestering too much photo assimilates from the shoot. No significant genetic correlation was found between hypocotyls length and total length (0.41); however, in this study a positive and significant genetic correlation between root length and total length (1.0) was found, meaning the longer the root, the longer the total. In this biparental population justifies screening genotypes indirectly based solely on hypocotyls length, since these lines will have greater root length and greater total length (Table 3).
4.3. Distributions Analysis
While monogenic traits have been successfully improved using conventional breeding methods in legumes, quantitative traits, such as drought tolerance, controlled by multiple genes and significantly influenced by environmental factors and gene-environment interactions, make conventional breeding slower and less precise. Drought tolerance breeding is very complex due to number of traits involved, quantitative inheritance and environmental influence [13, 53]. This study is agreed because all traits studied had a normal distribution showing continuous variation, so they are considered to be quantitatively inherited (Figure 1). However, the variability was found for the traits studied, which allows selecting lines with a high level of drought tolerance within the F3 biparental population.
4.4. Mean Comparison of the 4 Tolerant, the 3 Susceptible F3 and 2 Parents for Drought Tolerance
Among various selection criteria, seed yield on field experiments has been found to be the most effective to improve drought tolerance in common bean [54]. Stability of yield on irrigation-drought field bioassays are effective method to select drought tolerance genotypes [55]; [56]. However, in germination experiments with PEG-6000, seven traits of the seed, root and hypocotyls can be observed and measured, such as: germination, root length, hypocotyls length, root fresh weight, stem fresh weight, root dry weight, and stem dry weight [33].
Drought stress reduced or even inhibited germination in some lines; it has been previously reported that there are susceptible genotypes like P-saltillo [57]; [33].
Rooting depth, root length density, root hairs, root branching and root biomass have been related to improved drought tolerance [58]. According with the present study highly significant statistical differences were found when analyzing the four best lines, three worst and the two parents. However, the traits related to root architecture and above-ground physiology in isolation cannot be as fruitful [13]. According with our study, we analyzed root length and hypocotyls length and its genetic and phenotypic correlations to determine the drought tolerance of the F3 of the biparental population.
The cross P. vulgaris × P. acutifolius (P-saltillo × T-cafe) is noteworthy because is the second reported about direct cross between species with fertile offspring after the cross between P-saltillo × T- amarillo (P. vulgaris × P. acutifolius) to determine the inheritance of the resistance to A. obtectus reported by [29].
The development and use of drought-resistant and high yield common bean varieties would reduce dependence on irrigation water or best production in rainfed conditions and production costs, stabilize yield in drought-prone environments, and potentially increase profit margins for farmers [54].
5. Conclusions
The F3 biparental population from the cross between susceptible (P-saltillo) and drought tolerant (T-cafe) allowed the study of drought tolerance genetics in beans. The population, given the cross, between P. vulgaris × P. acutifolius was also adequate to looking of the best lines into the population based on drought tolerance and study its relationship with tolerance traits. All variables studies have normal distribution which is why they are considered quantitative inheritance. Several lines can be candidates for registration of new drought tolerant varieties or used as sources of drought tolerance in future common bean improvement programs. The biparental population justifies screening genotypes indirectly based solely on hypocotyls length, since these lines will have greater root length and greater total length. Multiple genetic factors are involved in the drought tolerance response of the F3.
Author Contributions
M.C.-G. and D.P.-C. carried out bioassays in the laboratory. J.C.J.-G., M.C.-G. and D.P-C realized the statistical analysis of data. M.C.-G., J.C.J.-G and D.P-C. realized the draft of initial manuscript. C.B.P-V., E.U.-M., A. G.-E. reviewed and corrected the manuscript. All authors have read and agreed to the published version of the manuscript.
Funding
This study was supported by the CONACYT and National Institute of Forestry, Agriculture and Livestock Research (INIFAP México). Grant number: 317548 “Desarrollo de una variedad de frijol pinto (Phaseolus vulgaris L.) de alto rendimiento en densidades bajas y tolerante a sequía para reducir los efectos del cambio climático e incrementar la producción nacional”.
Data Availability Statement
The data sets generated and analyzed during the current study and material are available from Marcela Cilia-García and José Cruz Jiménez-Galindo upon reasonable request.
Acknowledgments
The first author thanks CONAHCYT for the scholarship granted to carry out his doctoral studies. José Jiménez wishes to thank to the CONAHCYT, México and National Institute of Agricultural, Forestry and Livestock Research (INIFAP), campus Cuauhtémoc for their support in the present research.
Conflicts of Interest
The authors declare no conflict of interest.
References
- Rao, I. , et al., Can tepary bean be a model for improvement of drought resistance in common bean? African Crop Science Journal 2013, 21. [Google Scholar]
- Didinger, C. , et al., Nutrition and human health benefits of dry beans and other pulses. Dry Beans and pulses: Production, processing, and Nutrition 2022, 481-504.
- Vidak, M. , et al., New Age of Common Bean, in Production and Utilization of Legumes-Progress and Prospects. 2023, IntechOpen.
- Khatun, M. , et al., Drought stress in grain legumes: Effects, tolerance mechanisms and management. Agronomy 2021, 11, 2374. [Google Scholar] [CrossRef]
- Gong, Z. , et al., Plant abiotic stress response and nutrient use efficiency. Science China Life Sciences 2020, 63, 635–674. [Google Scholar] [CrossRef] [PubMed]
- Zhang, H., Y. Zhao, and J.-K. Zhu, Thriving under stress: how plants balance growth and the stress response. Developmental Cell 2020, 55, 529–543. [Google Scholar] [CrossRef]
- Zhang, H. , et al., Abiotic stress responses in plants. Nature Reviews Genetics 2022, 23, 104–119. [Google Scholar] [CrossRef]
- Chang, Y.N. , et al., Epigenetic regulation in plant abiotic stress responses. Journal of integrative plant biology 2020, 62, 563–580. [Google Scholar] [CrossRef]
- Terán, H. and S.P. Singh, Comparison of sources and lines selected for drought resistance in common bean. Crop science 2002, 42, 64–70. [Google Scholar] [CrossRef]
- Sánchez-Reinoso, A.D., G. A. Ligarreto-Moreno, and H. Restrepo-Díaz, Evaluation of drought indices to identify tolerant genotypes in common bean bush (Phaseolus vulgaris L.). Journal of Integrative Agriculture 2020, 19, 99–107. [Google Scholar] [CrossRef]
- Polania, J. , et al., Shoot and root traits contribute to drought resistance in recombinant inbred lines of MD 23–24× SEA 5 of common bean. Frontiers in Plant Science 2017, 8, 296. [Google Scholar] [CrossRef]
- Hageman, A. and E. Van Volkenburgh, Sink strength maintenance underlies drought tolerance in common bean. Plants, 10 (3), 489. 2021.
- Sofi, P. , et al., Integrating root architecture and physiological approaches for improving drought tolerance in common bean (Phaseolus vulgaris L.). Plant Physiology Reports 2021, 26, 4–22. [Google Scholar] [CrossRef]
- Godoy Androcioli, L. , et al., Effect of water deficit on morphoagronomic and physiological traits of common bean genotypes with contrasting drought tolerance. Water 2020, 12, 217. [Google Scholar] [CrossRef]
- Kaushal, M. and S.P. Wani, Rhizobacterial-plant interactions: strategies ensuring plant growth promotion under drought and salinity stress. Agriculture, Ecosystems & Environment 2016, 231, 68–78. [Google Scholar]
- Patel Priyanka, J. , et al., Rhizospheric microflora: a natural alleviator of drought stress in agricultural crops. Plant Growth Promoting Rhizobacteria for Sustainable Stress Management: Volume 1: Rhizobacteria in Abiotic Stress Management 2019, 103-115.
- Boyer, J.S. , Plant productivity and environment. Science 1982, 218, 443–448. [Google Scholar] [CrossRef] [PubMed]
- Comas, L.H. , et al., Root traits contributing to plant productivity under drought. Frontiers in plant science 2013, 4, 442. [Google Scholar] [CrossRef]
- Ayalew, H., X. Ma, and G. Yan, Screening wheat (Triticum spp.) genotypes for root length under contrasting water regimes: potential sources of variability for drought resistance breeding. Journal of Agronomy and Crop Science 2015, 201, 189–194. [Google Scholar] [CrossRef]
- Waheed, A. , Screening and selection of tomato genotypes/cultivars for drought tolerance using multivariate analysis. Pak J of Bot 2014, 46, 1165–1178. [Google Scholar]
- Obidiegwu, J.E. , et al., Coping with drought: stress and adaptive responses in potato and perspectives for improvement. Frontiers in plant science 2015, 6, 542. [Google Scholar] [CrossRef] [PubMed]
- Khan, N.H. , et al., Genetics of drought tolerance at seedling and maturity stages in Zea mays L. Spanish Journal of Agricultural Research 2016, 14, 0705. [Google Scholar] [CrossRef]
- Álvarez-Iglesias, L. , et al., A simple, fast and accurate screening method to estimate maize (Zea mays L) tolerance to drought at early stages. 2017.
- Foyer, C.H. , et al., Neglecting legumes has compromised human health and sustainable food production. Nature plants 2016, 2, 1–10. [Google Scholar] [CrossRef]
- Dobler-Morales, C. and G. Bocco, Social and environmental dimensions of drought in Mexico: An integrative review. International Journal of Disaster Risk Reduction 2021, 55, 102067. [Google Scholar] [CrossRef]
- Pradhan, J., D. Katiyar, and A. Hemantaranjan, Drought mitigation strategies in pulses. Pharm. Innov. J 2019, 8, 567–576. [Google Scholar]
- Porch, T.G. , et al., Release of tepary bean cultivar ‘USDA Fortuna’with improved disease and insect resistance, seed size, and culinary quality. Journal of Plant Registrations 2024, 18, 42–51. [Google Scholar] [CrossRef]
- Souter, J.R. , et al., Successful introgression of abiotic stress tolerance from wild tepary bean to common bean. Crop Science 2017, 57, 1160–1171. [Google Scholar] [CrossRef]
- Jiménez-Galindo, J.C. , et al., Inheritance and metabolomics of the resistance of two F 2 populations of Phaseolus spp. to Acanthoscelides obtectus. Arthropod-Plant Interactions 2020, 14, 641–651. [Google Scholar] [CrossRef]
- Porch, T. , et al., Evaluation of common bean for drought tolerance in Juana Diaz, Puerto Rico. Journal of Agronomy and Crop Science 2009, 195, 328–334. [Google Scholar] [CrossRef]
- Kauser, R., H. U.R. Athar, and M. Ashraf, Chlorophyll fluorescence: a potential indicator for rapid assessment of water stress tolerance in canola (Brassica napus L.). Pakistan Journal of Botany 2006, 38, 1501–1509. [Google Scholar]
- Khodarahmpour, Z. , Effect of drought stress induced by polyethylene glycol (PEG) on germination indices in corn (Zea mays L.) hybrids. African Journal of Biotechnology 2011, 10, 18222–18227. [Google Scholar] [CrossRef]
- Jimenez-Galindo, J.C. , et al., Screening for Drought Tolerance in Tepary and Common Bean Based on Osmotic Potential Assays. Plant 2018, 6, 24. [Google Scholar] [CrossRef]
- Michel, B.E. and M.R. Kaufmann, The osmotic potential of polyethylene glycol 6000. Plant physiology 1973, 51, 914–916. [Google Scholar] [CrossRef]
- Holland, J.B., W. E. Nyquist, and C.T. Cervantes-Martinez, Estimating and interpreting heritability for plant breeding: An update. Plant Breeding Reviews 2002, 22, 9–112. [Google Scholar]
- Holland, J.B. , Estimating genotypic correlations and their standard errors using multivariate restricted maximum likelihood estimation with SAS Proc MIXED. Crop Science 2006, 46, 642–654. [Google Scholar] [CrossRef]
- Kumawat, K.R. and D. Gothwal, Genetic variability for seedling characters in lentil under salinity stress. Electronic Journal of Plant Breeding 2018, 9, 1295–1302. [Google Scholar] [CrossRef]
- Farooq, M. , et al., Plant drought stress: effects, mechanisms and management. Agronomy for Sustainable Development 2009, 29, 185–212. [Google Scholar] [CrossRef]
- Singh, S.P. , Selection for water-stress tolerance in interracial populations of common bean. Crop Science 1995, 35, 118–124. [Google Scholar] [CrossRef]
- Briñez, B. , et al., Mapping QTLs for drought tolerance in a SEA 5 x AND 277 common bean cross with SSRs and SNP markers. Genetics and Molecular Biology 2017, 40, 813–823. [Google Scholar] [CrossRef]
- Hoyos-Villegas, V., Q. Song, and J.D. Kelly, Genome-wide association analysis for drought tolerance and associated traits in common bean. The Plant Genome 2017, 10, plantgenome2015.12–0122. [Google Scholar] [CrossRef]
- Kachiguma, N.A. , et al., Preliminary evaluation of genetic inheritance of root traits of common bean (Phaseolus vulgaris L.) for tolerance to low soil moisture. Journal of Agricultural and Crop Research 2021, 9, 152–158. [Google Scholar]
- White, J.W. , et al., Inheritance of seed yield, maturity and seed weight of common bean (Phaseolus vulgaris) under semi-arid rainfed conditions. The Journal of Agricultural Science 1994, 122, 265–273. [Google Scholar] [CrossRef]
- Magar, M.M. , et al., Effect of PEG induced drought stress on germination and seedling traits of maize (Zea mays L.) lines. Türk Tarım ve Doğa Bilimleri Dergisi 2019, 6, 196–205. [Google Scholar] [CrossRef]
- Zhao, F. , et al., The difference of physiological and proteomic changes in maize leaves adaptation to drought, heat, and combined both stresses. Frontiers in plant science 2016, 7. [Google Scholar] [CrossRef] [PubMed]
- Ruta, N. , et al., Collocations of QTLs for seedling traits and yield components of tropical maize under water stress conditions. Crop science 2010, 50, 1385. [Google Scholar] [CrossRef]
- Lu, Z. and P.M. Neumann, Water-stressed maize, barley and rice seedlings show species diversity in mechanisms of leaf growth inhibition. Journal of Experimental Botany 1998, 49, 1945–1952. [Google Scholar] [CrossRef]
- Ortega-Ortega, A. , et al., Osmotic stress tolerance in forage oat varieties (Avena Sativa L.) based on osmotic potential trials. 2023.
- Araújo, A.P., I. F. Antunes, and M.G. Teixeira, Inheritance of root traits and phosphorus uptake in common bean (Phaseolus vulgaris L.) under limited soil phosphorus supply. Euphytica 2005, 145, 33–40. [Google Scholar] [CrossRef]
- Asfaw, A., M. W. Blair, and P.C. Struik, Multienvironment quantitative trait loci analysis for photosynthate acquisition, accumulation, and remobilization traits in common bean under drought stress. G3: Genes| Genomes| Genetics 2012, 2, 579–595. [Google Scholar] [CrossRef] [PubMed]
- Mahmood, T. , et al., Genetic potential and inheritance pattern of phenological growth and drought tolerance in cotton (Gossypium hirsutum L.). Frontiers in Plant Science 2021, 12, 705392. [Google Scholar] [CrossRef] [PubMed]
- Bingham, I. , Soil-root-canopy interactions. Annals of Applied Biology 2001, 138, 243–251. [Google Scholar] [CrossRef]
- Mir, R.R. , et al., Integrated genomics, physiology and breeding approaches for improving drought tolerance in crops. Theoretical and Applied Genetics 2012, 125, 625–645. [Google Scholar] [CrossRef] [PubMed]
- Terán, H. and S.P. Singh, Selection for drought resistance in early generations of common bean populations. Canadian journal of plant science 2002, 82, 491–497. [Google Scholar] [CrossRef]
- Jiménez Galindo, J.C. and J.A. Acosta Gallegos, Rendimiento de frijol común (Phaseolus vulgaris L.) y Tépari (Phaseolus acutifolius A. Gray) bajo el método riego-sequía en Chihuahua. Revista mexicana de ciencias agrícolas 2013, 4, 599–610. [Google Scholar]
- Jiménez Galindo, J.C. and J.A. Acosta Gallegos, Caracterización de genotipos criollos de frijol Tepari (Phaseolus acutifolius A. Gray) y común (Phaseolus vulgaris L. ) bajo temporal. Revista mexicana de ciencias agrícolas 2012, 3, 1565–1577. [Google Scholar] [CrossRef]
- Gholami, A. , et al., Germination of different seed size of pinto bean cultivars as affected by salinity and drought stress. Journal of Food Agriculture & Environment 2009, 7, 555–558. [Google Scholar]
- Vadez, V. , et al., Transpiration efficiency: new insights into an old story. Journal of experimental botany 2014, 65, 6141–6153. [Google Scholar] [CrossRef] [PubMed]
- SAS Institute. Base SAS 9.4 Procedures Guide: Statistical Procedures. Version 9.4; SAS Institute: Cary, NC, USA, 2016. [Google Scholar]
- SIAP-SADER. 2023. Sistema de Información Agro Pecuaria de la Secretaria de Desarrollo Rural. Available online: https://nube.siap.gob.mx/cierreagricola/ (accessed on 20 May 2023).
Figure 1.
(A) Distribution analysis for hypocotyls length (cm), (B) germinated seeds (n hypocotyls), (C) germinated seeds (% hypocotyls), (D) root length (cm), (E) germinated seeds (n roots), (F) germinated seeds (% roots), and (G) total length (cm) of 98 F3 of the biparental population.
Figure 1.
(A) Distribution analysis for hypocotyls length (cm), (B) germinated seeds (n hypocotyls), (C) germinated seeds (% hypocotyls), (D) root length (cm), (E) germinated seeds (n roots), (F) germinated seeds (% roots), and (G) total length (cm) of 98 F3 of the biparental population.
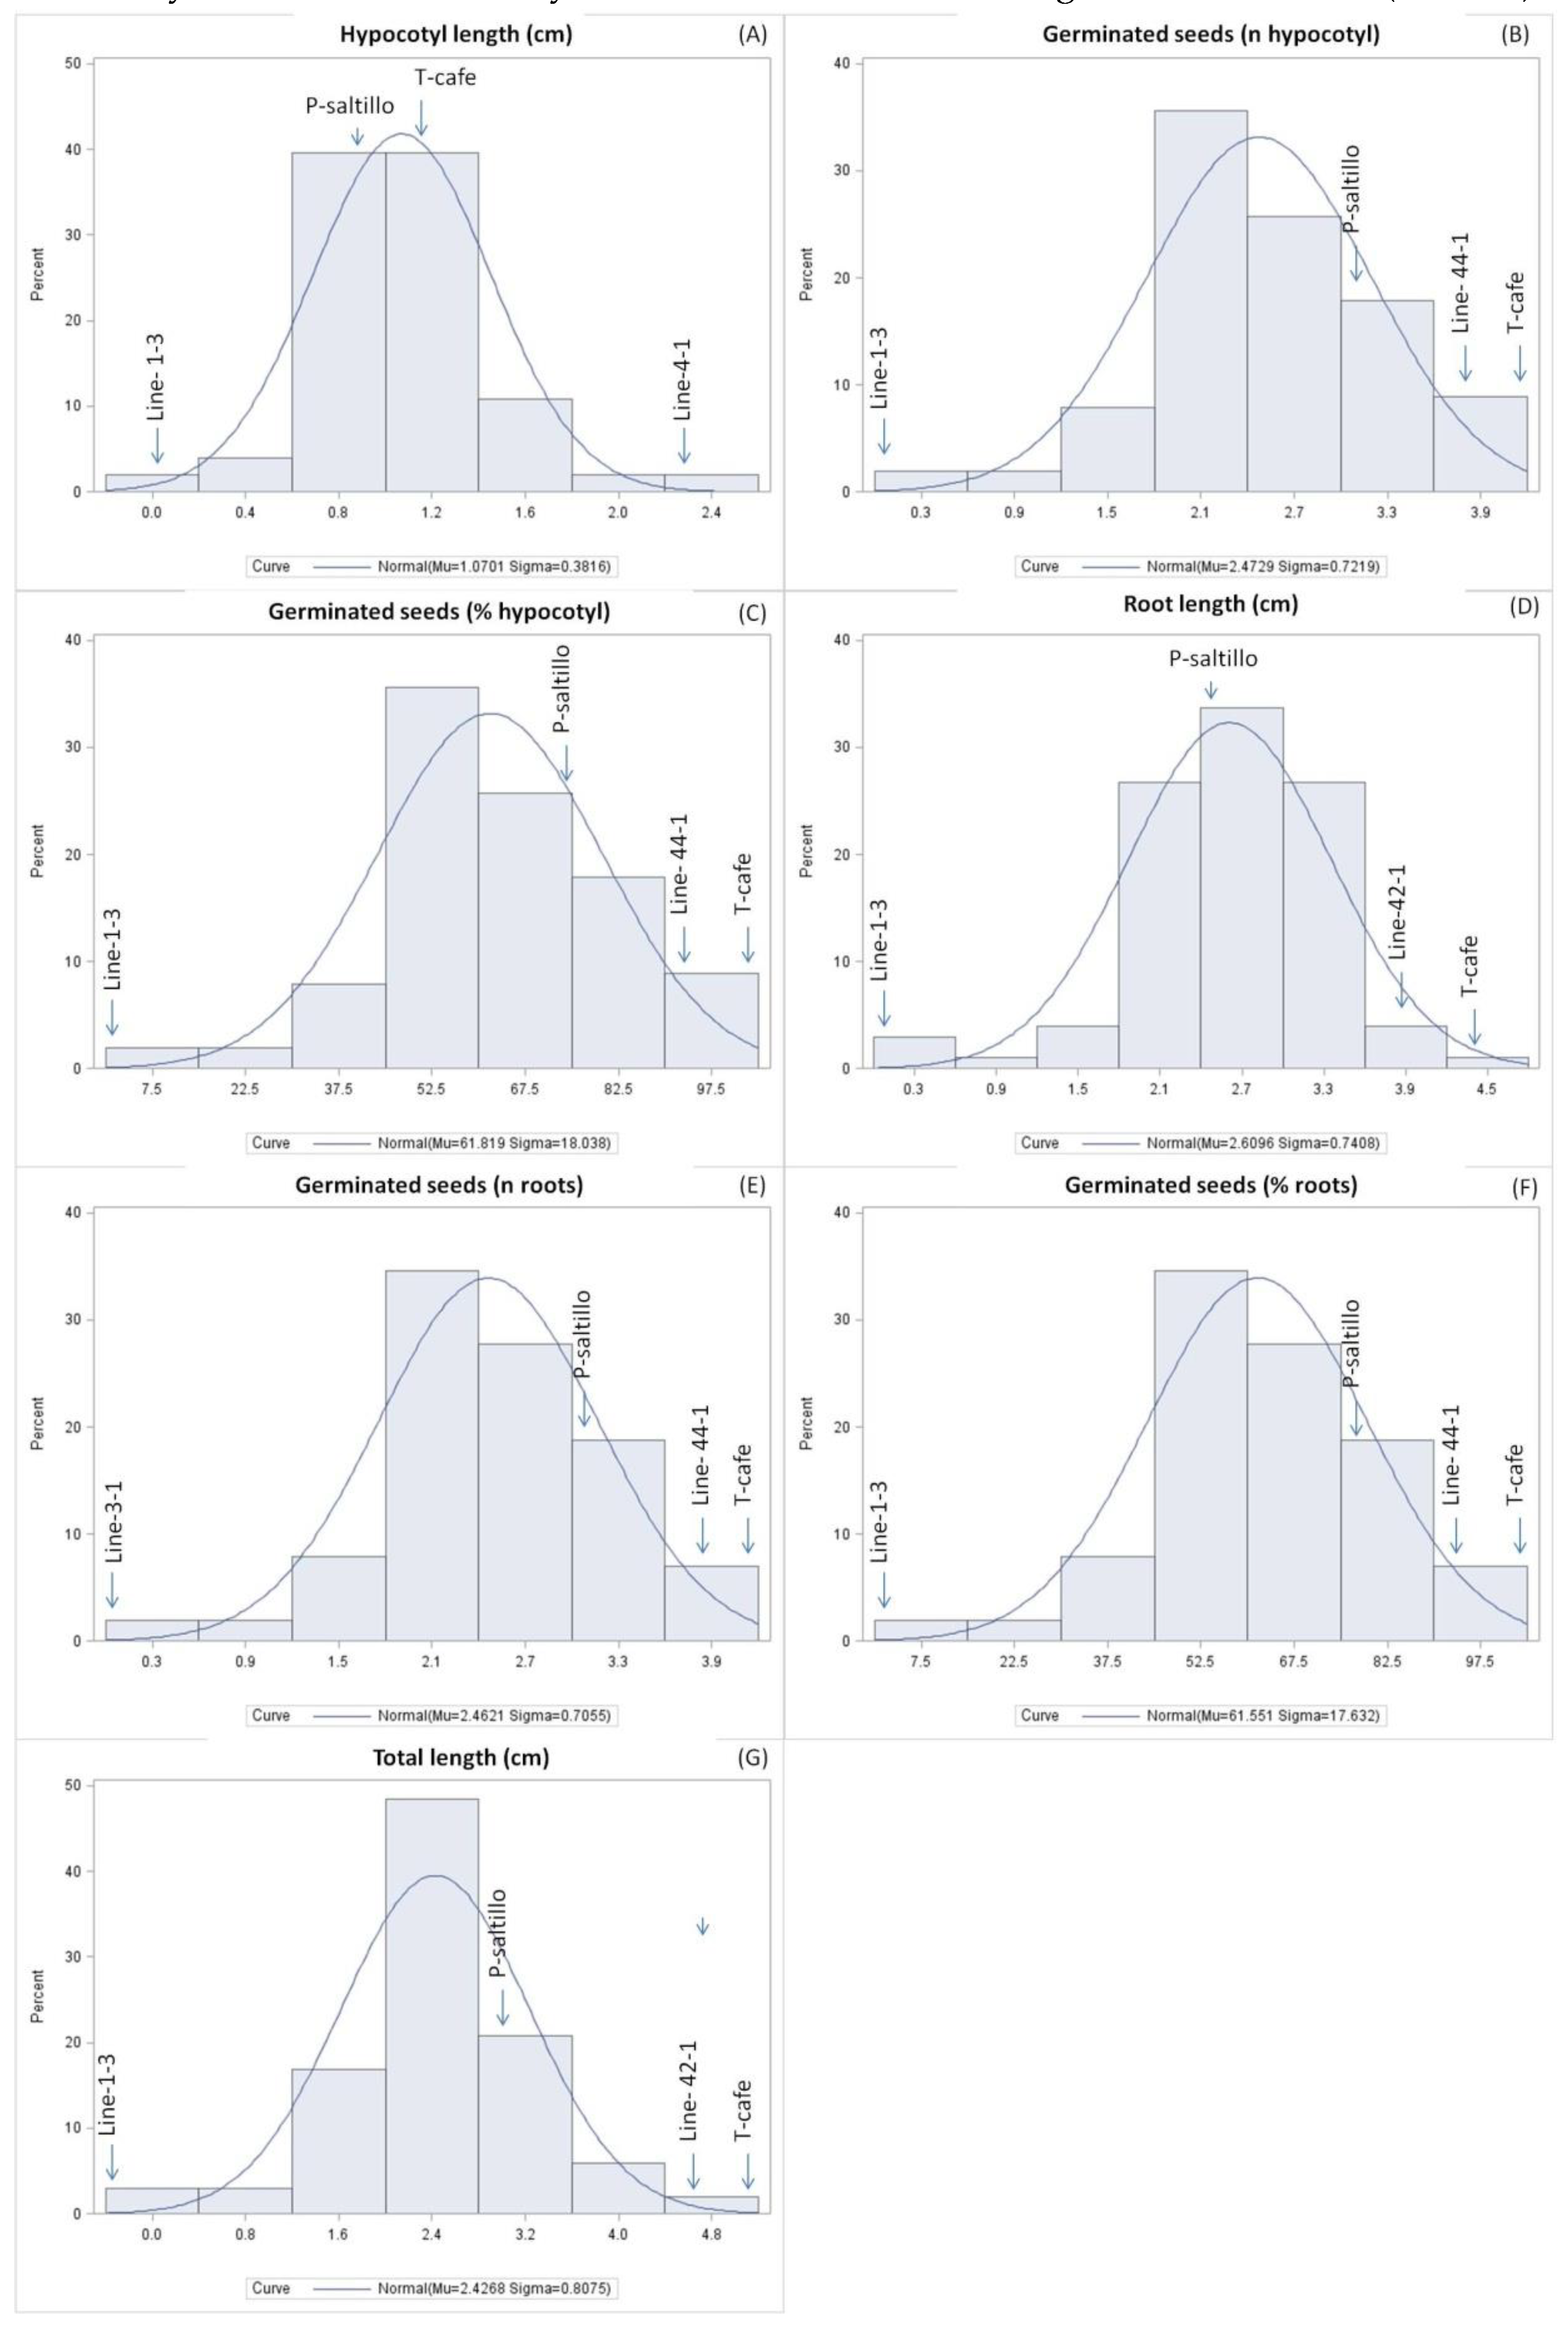
Figure 2.
Means and LSD for hypocotyls length (cm). Means followed by the same letter are not significantly different (p < 0.05). R2= 0.97, C.V.= 51.3, LSD= 1.4.
Figure 2.
Means and LSD for hypocotyls length (cm). Means followed by the same letter are not significantly different (p < 0.05). R2= 0.97, C.V.= 51.3, LSD= 1.4.
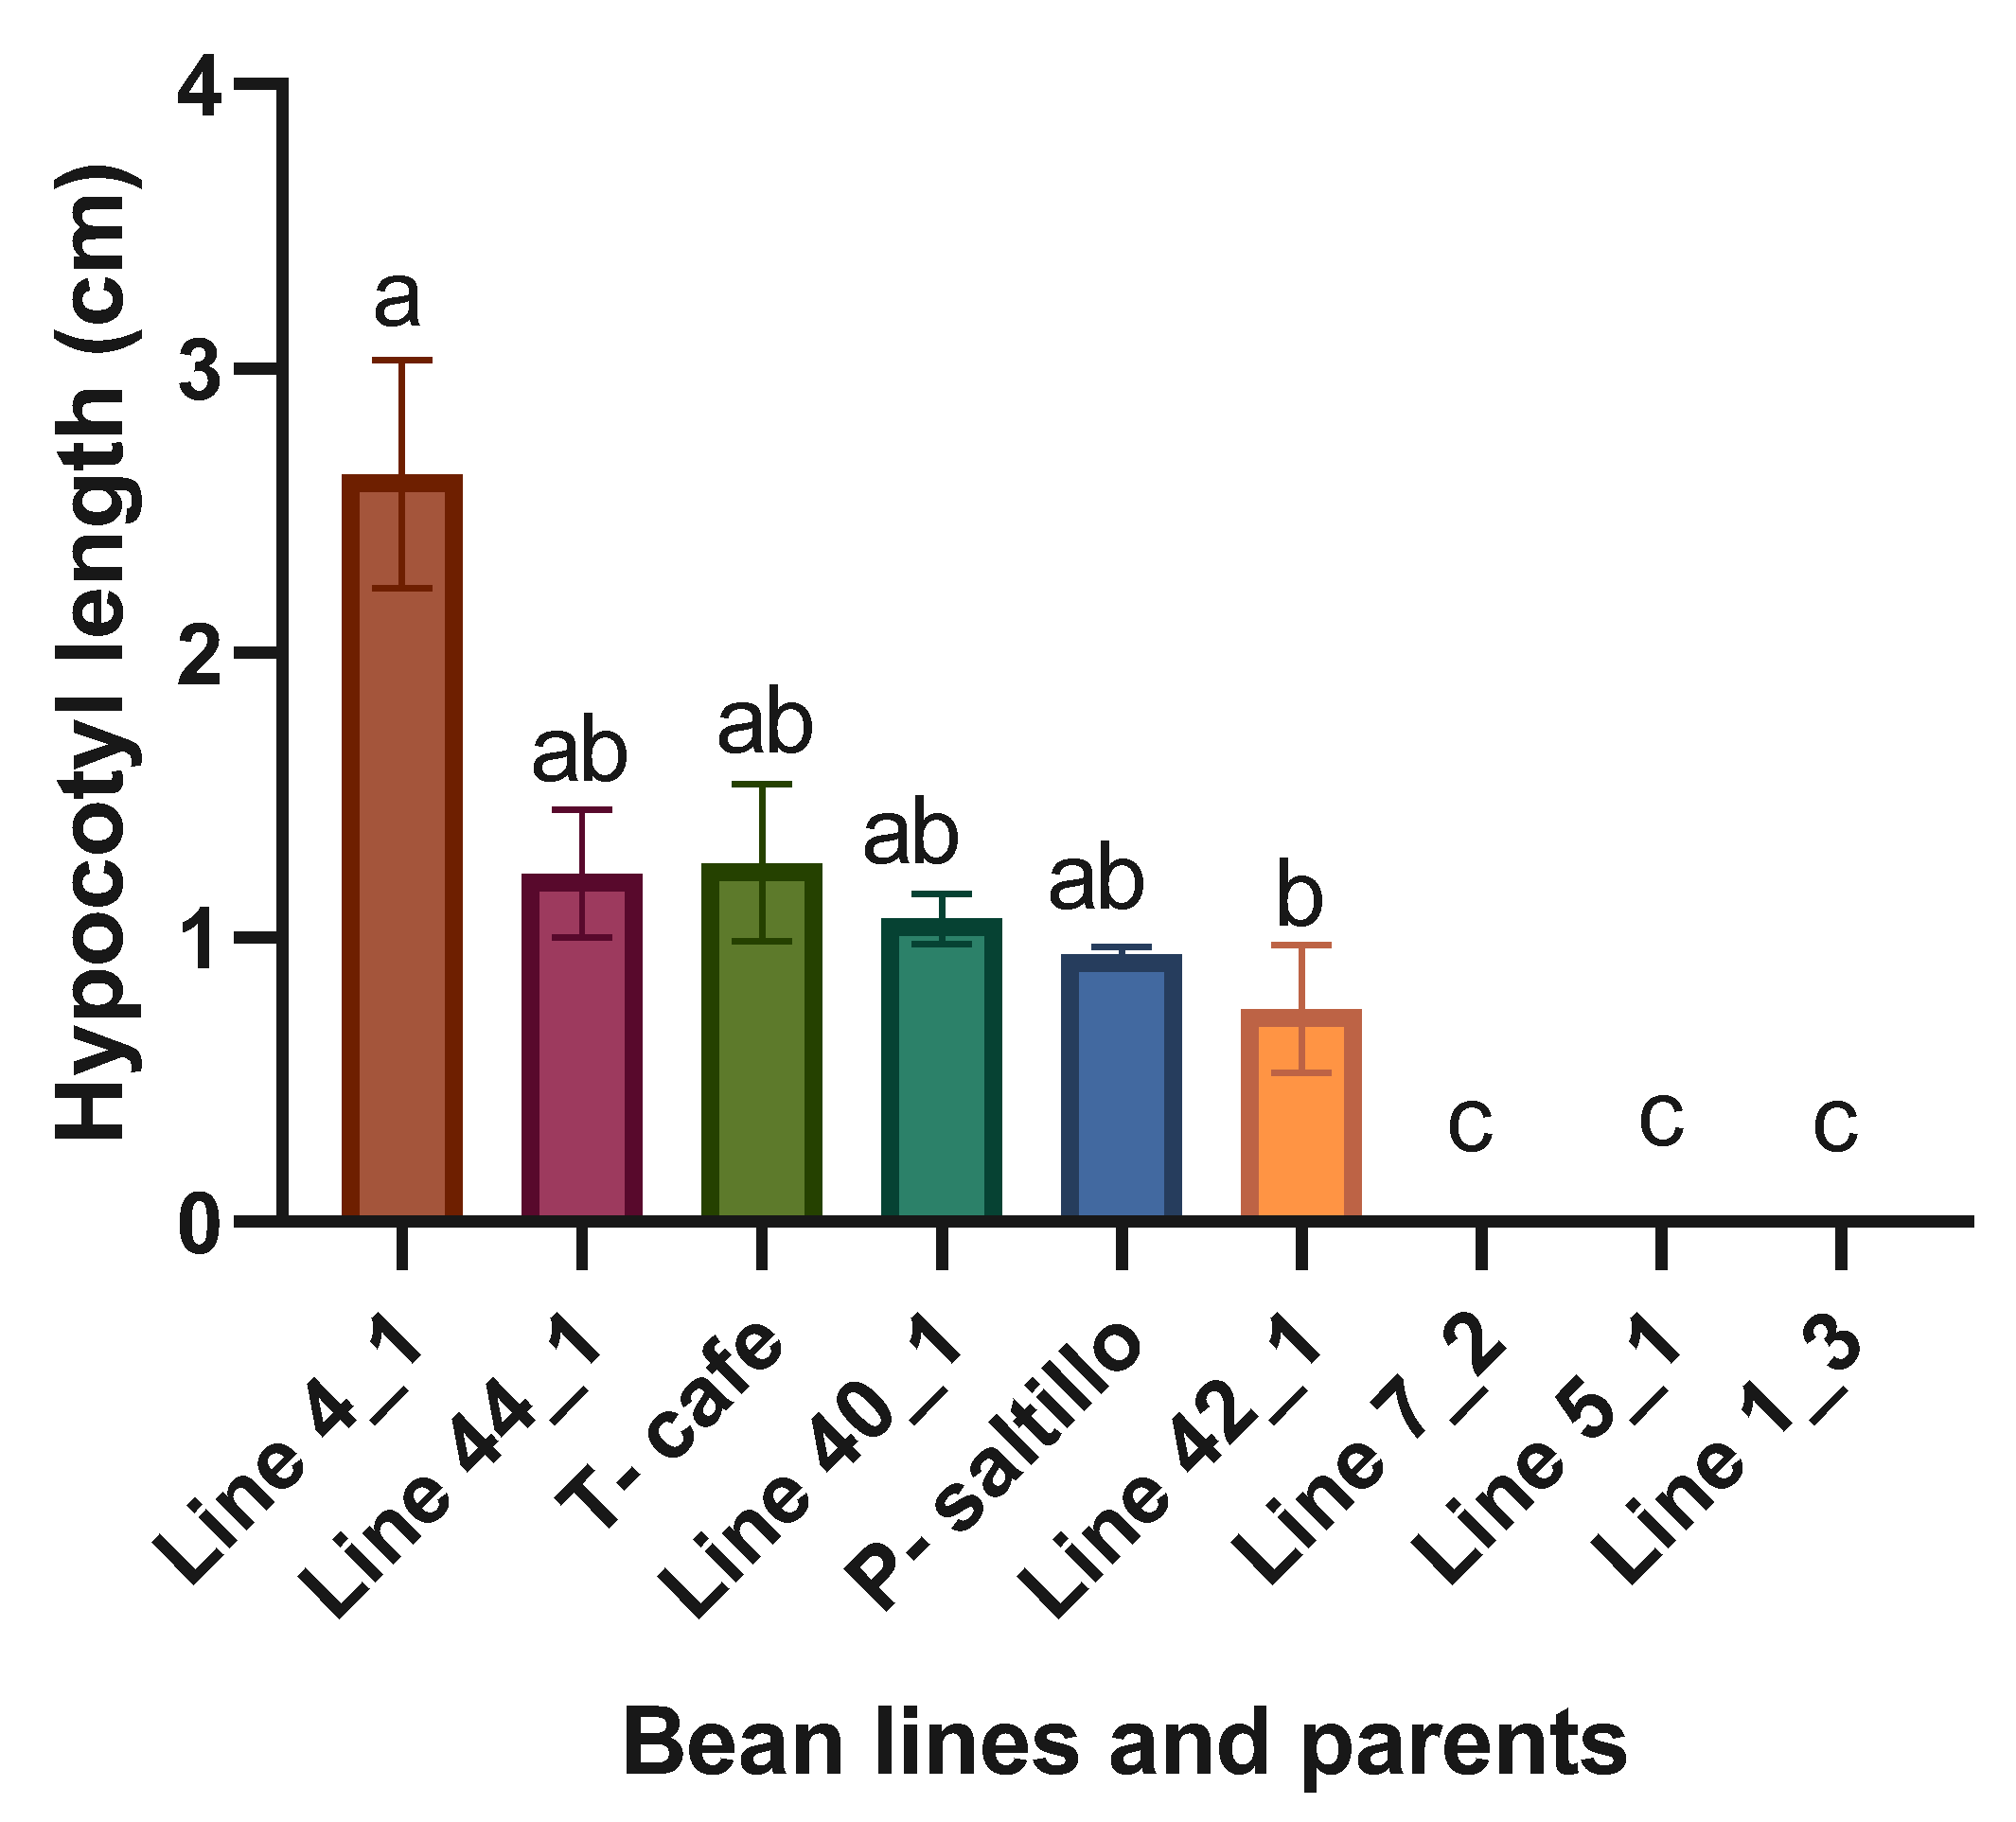
Figure 3.
Means and LSD for germinated seeds (n hypocotyls). Means followed by the same letter are not significantly different (p < 0.05). R2= 0.98, C.V.= 28.8, LSD= 1.5.
Figure 3.
Means and LSD for germinated seeds (n hypocotyls). Means followed by the same letter are not significantly different (p < 0.05). R2= 0.98, C.V.= 28.8, LSD= 1.5.
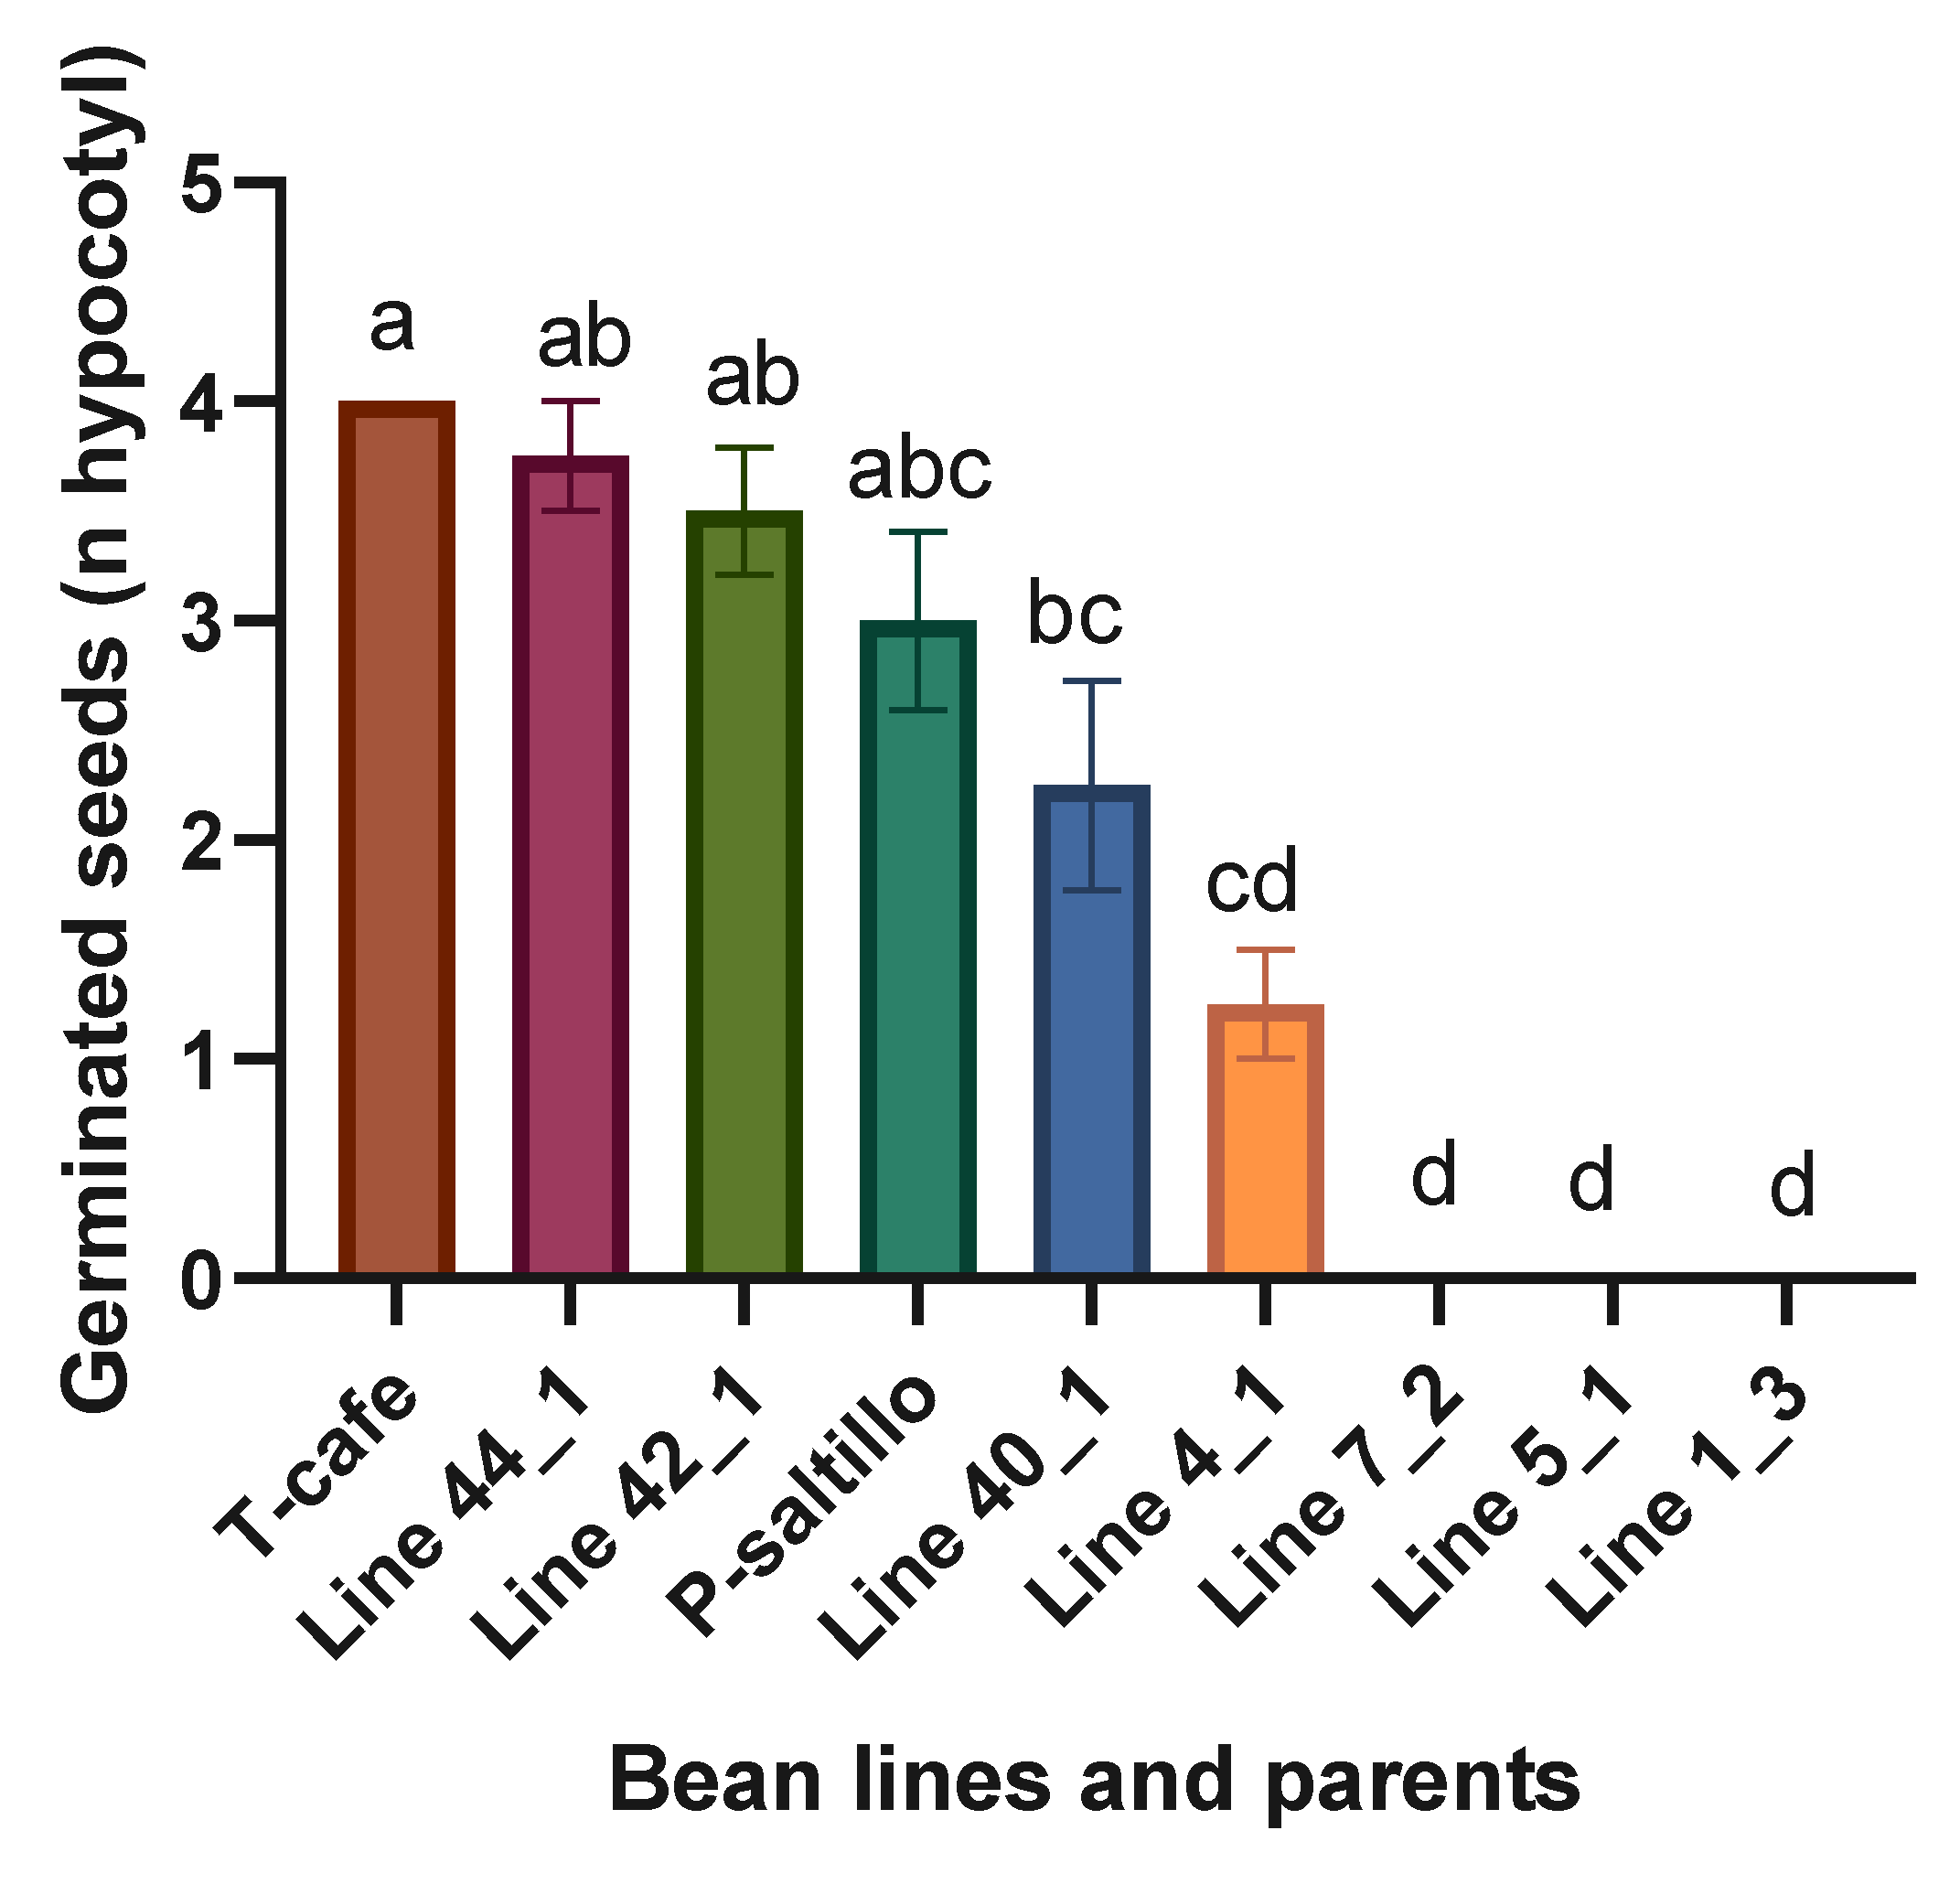
Figure 4.
Means and LSD for germinated seeds (% hypocotyls). Means followed by the same letter are not significantly different (p < 0.05). R2= 0.98, C.V.=28.8, LSD= 38.5.
Figure 4.
Means and LSD for germinated seeds (% hypocotyls). Means followed by the same letter are not significantly different (p < 0.05). R2= 0.98, C.V.=28.8, LSD= 38.5.
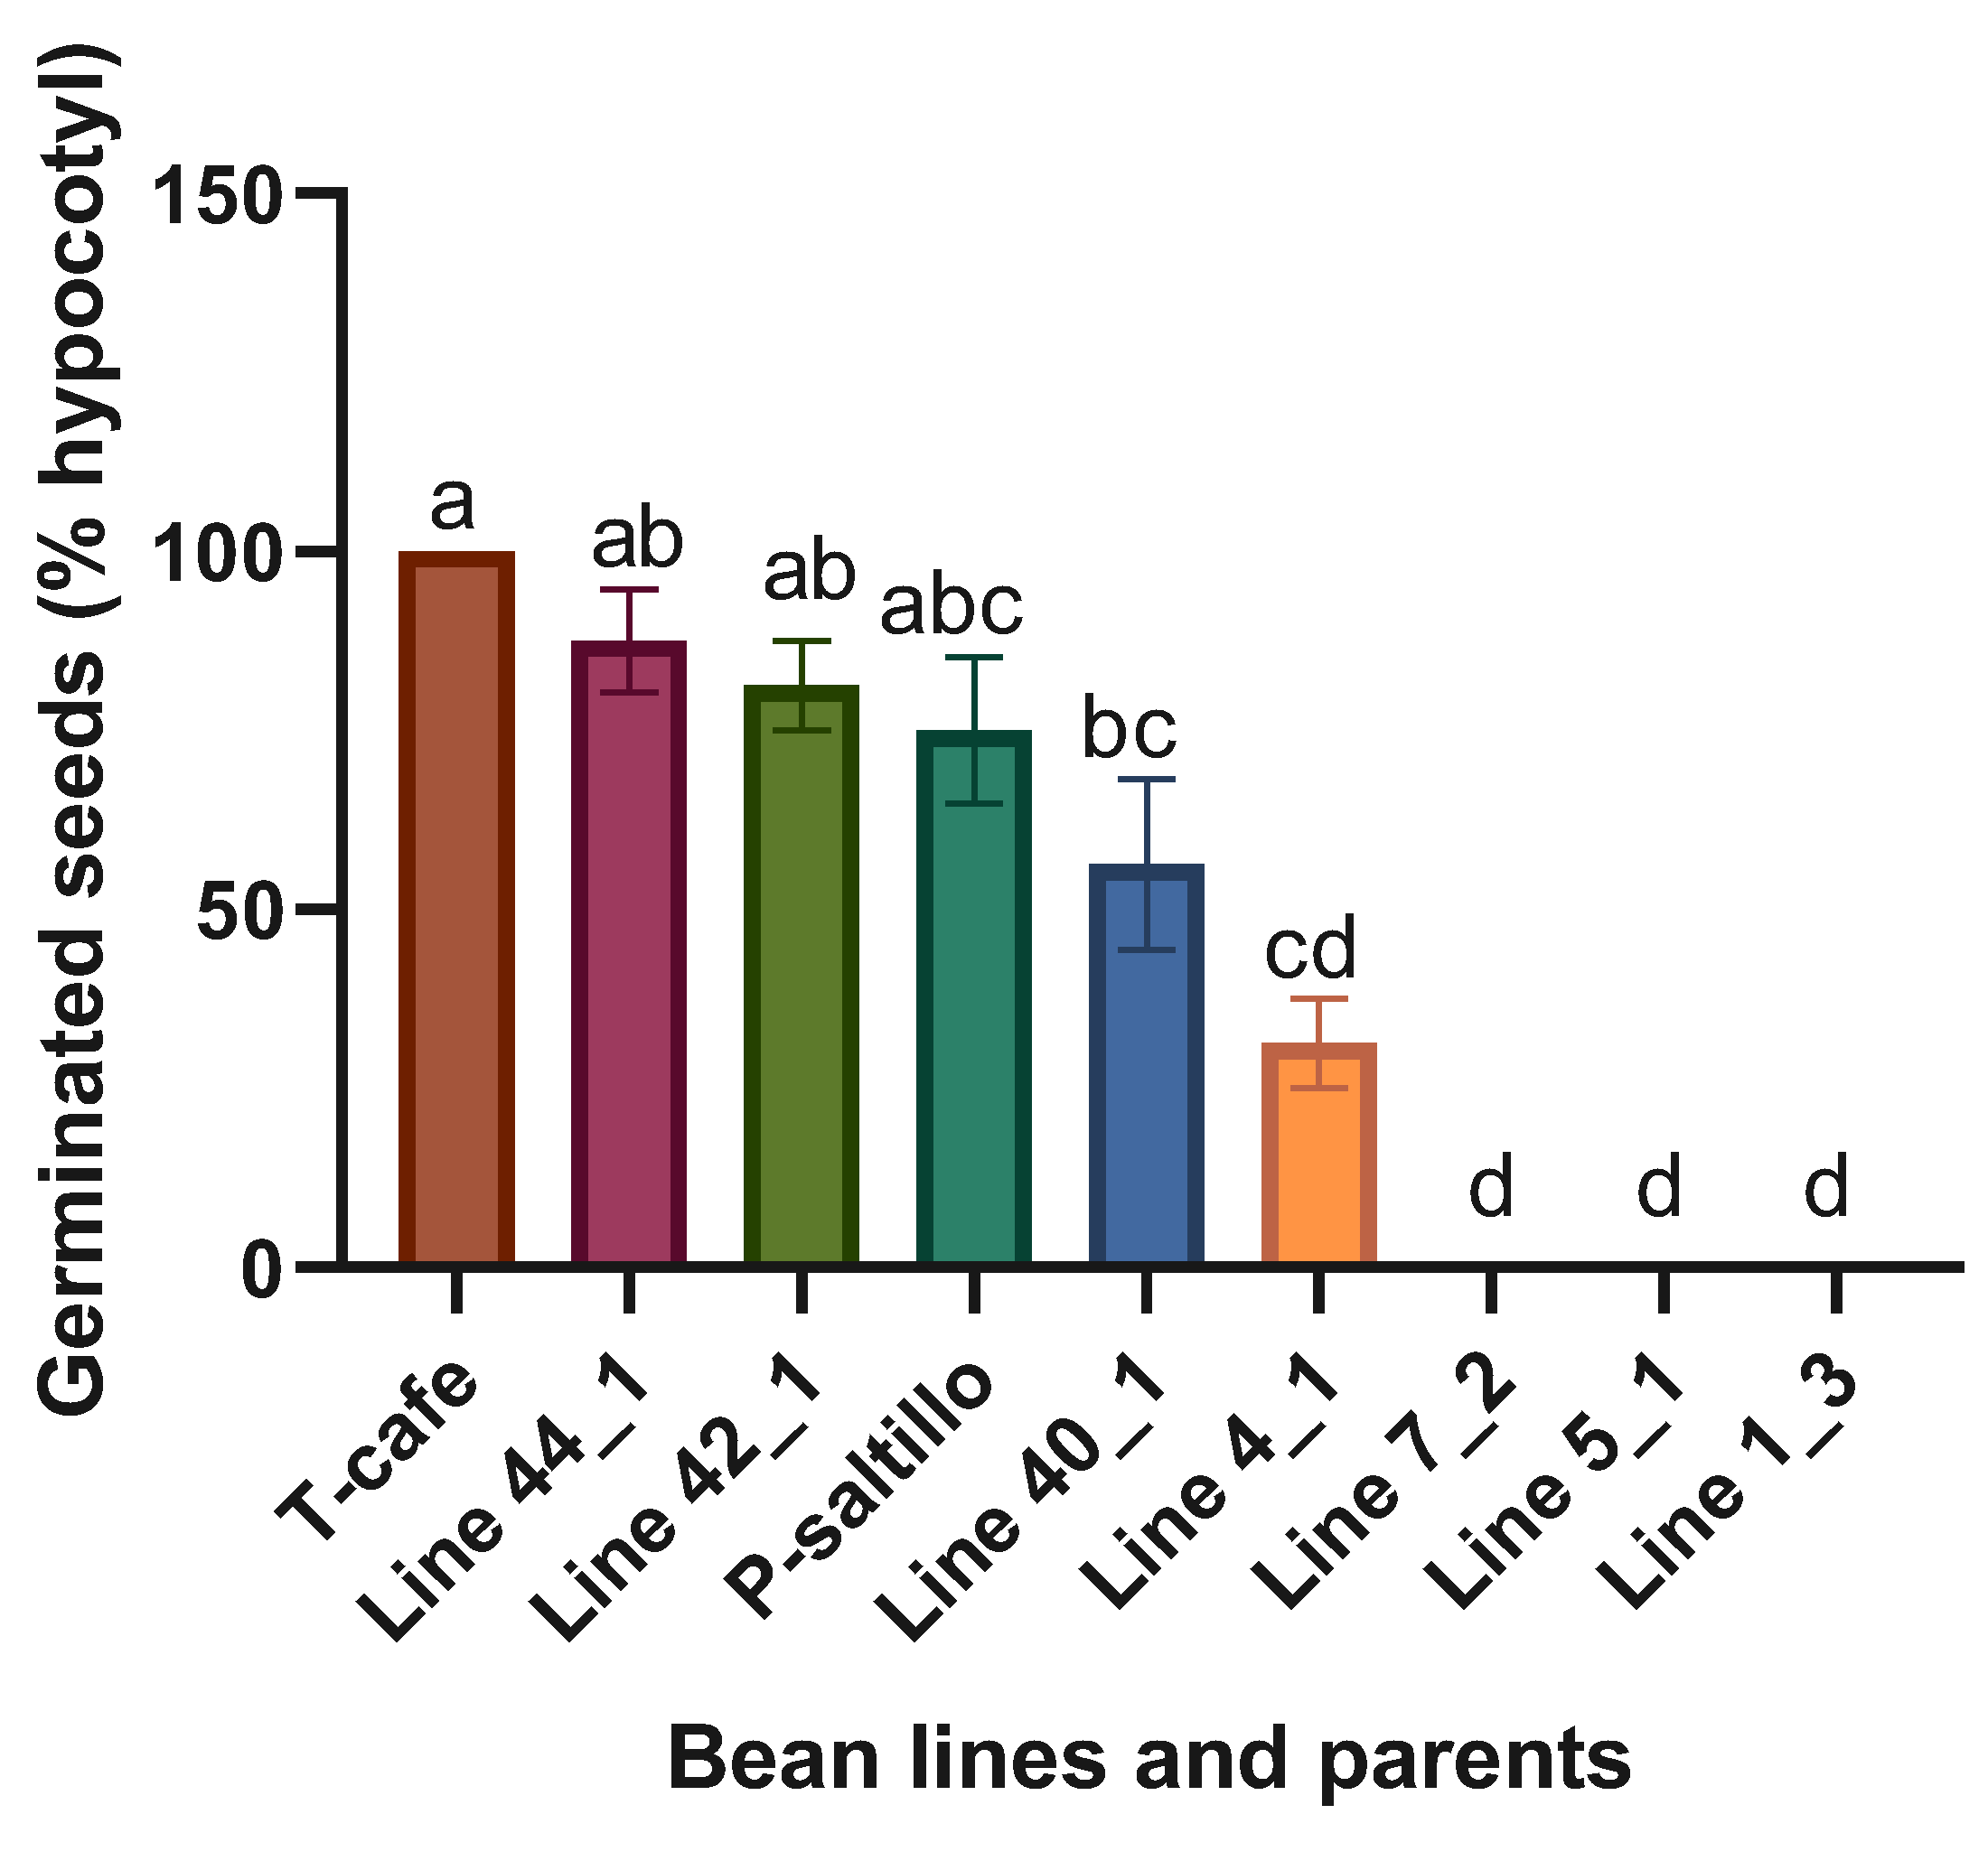
Figure 5.
Means and LSD for root length (cm). Means followed by the same letter are not significantly different (p < 0.05). R2= 0.99, C.V.= 20.0, LSD= 1.6.
Figure 5.
Means and LSD for root length (cm). Means followed by the same letter are not significantly different (p < 0.05). R2= 0.99, C.V.= 20.0, LSD= 1.6.
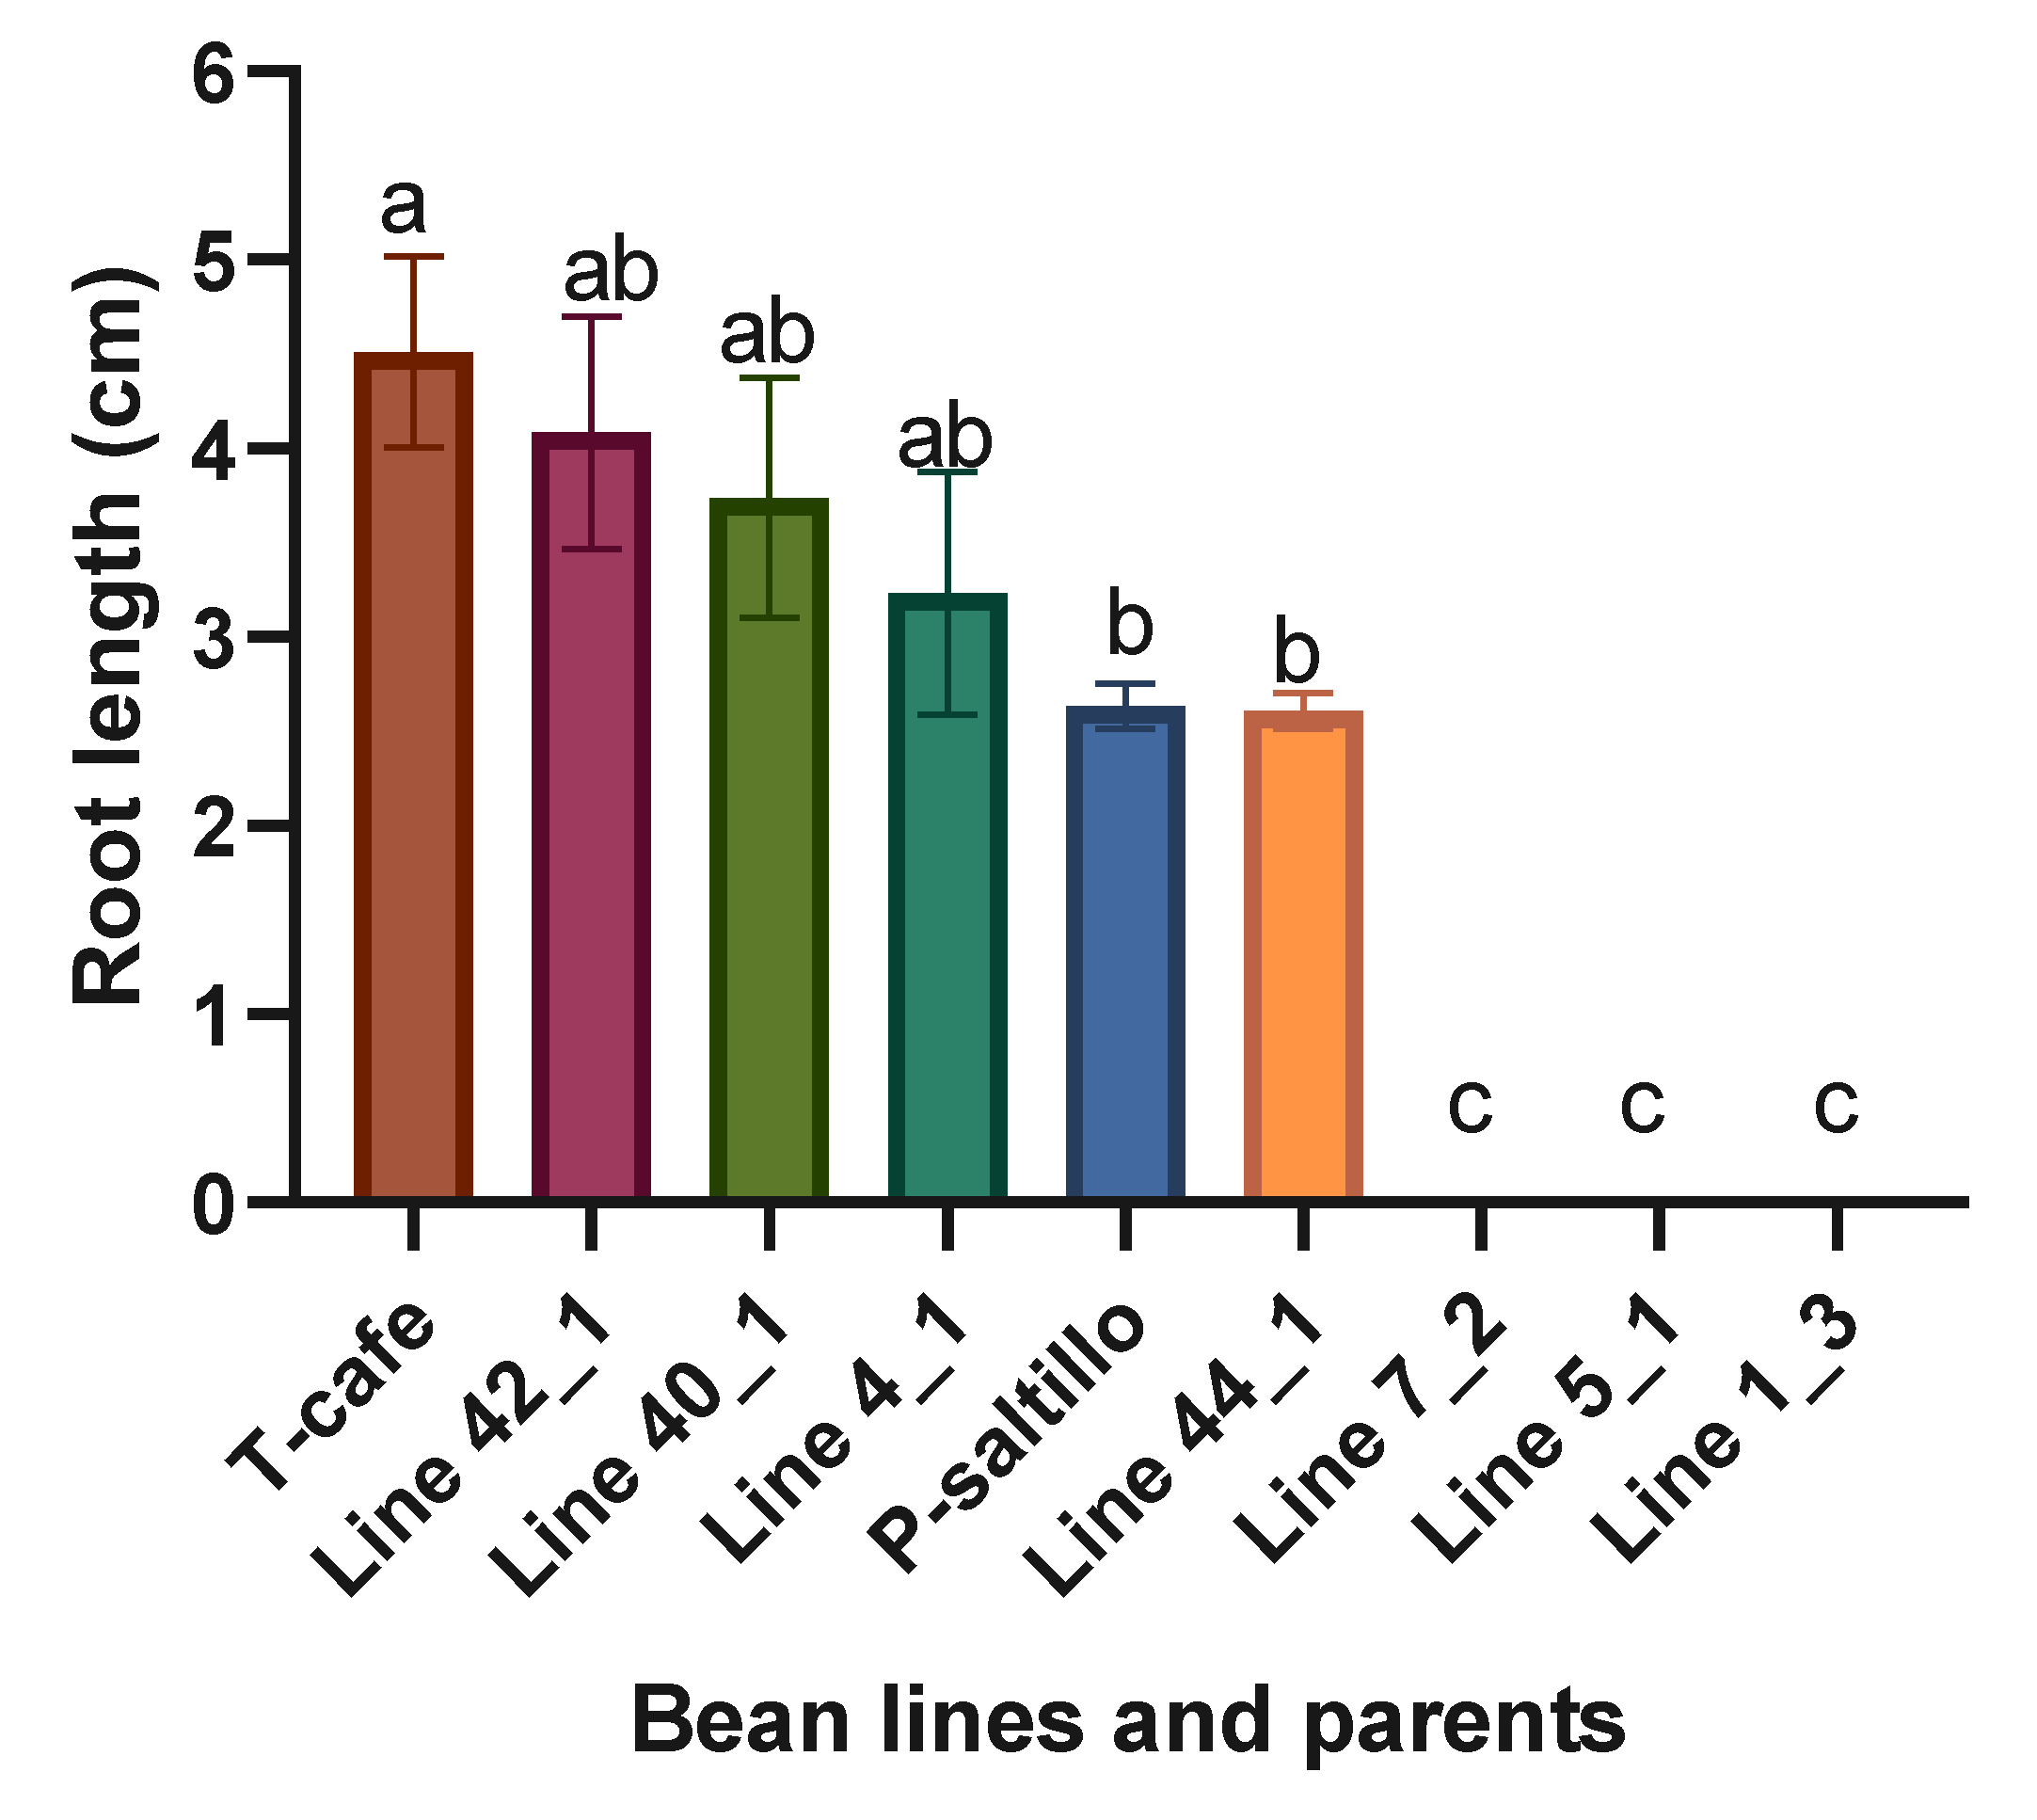
Figure 6.
Means and LSD for germinated seeds (n roots) (cm). Means followed by the same letter are not significantly different (p < 0.05). R2= 0.98, C.V.= 28.8, LSD= 1.5.
Figure 6.
Means and LSD for germinated seeds (n roots) (cm). Means followed by the same letter are not significantly different (p < 0.05). R2= 0.98, C.V.= 28.8, LSD= 1.5.
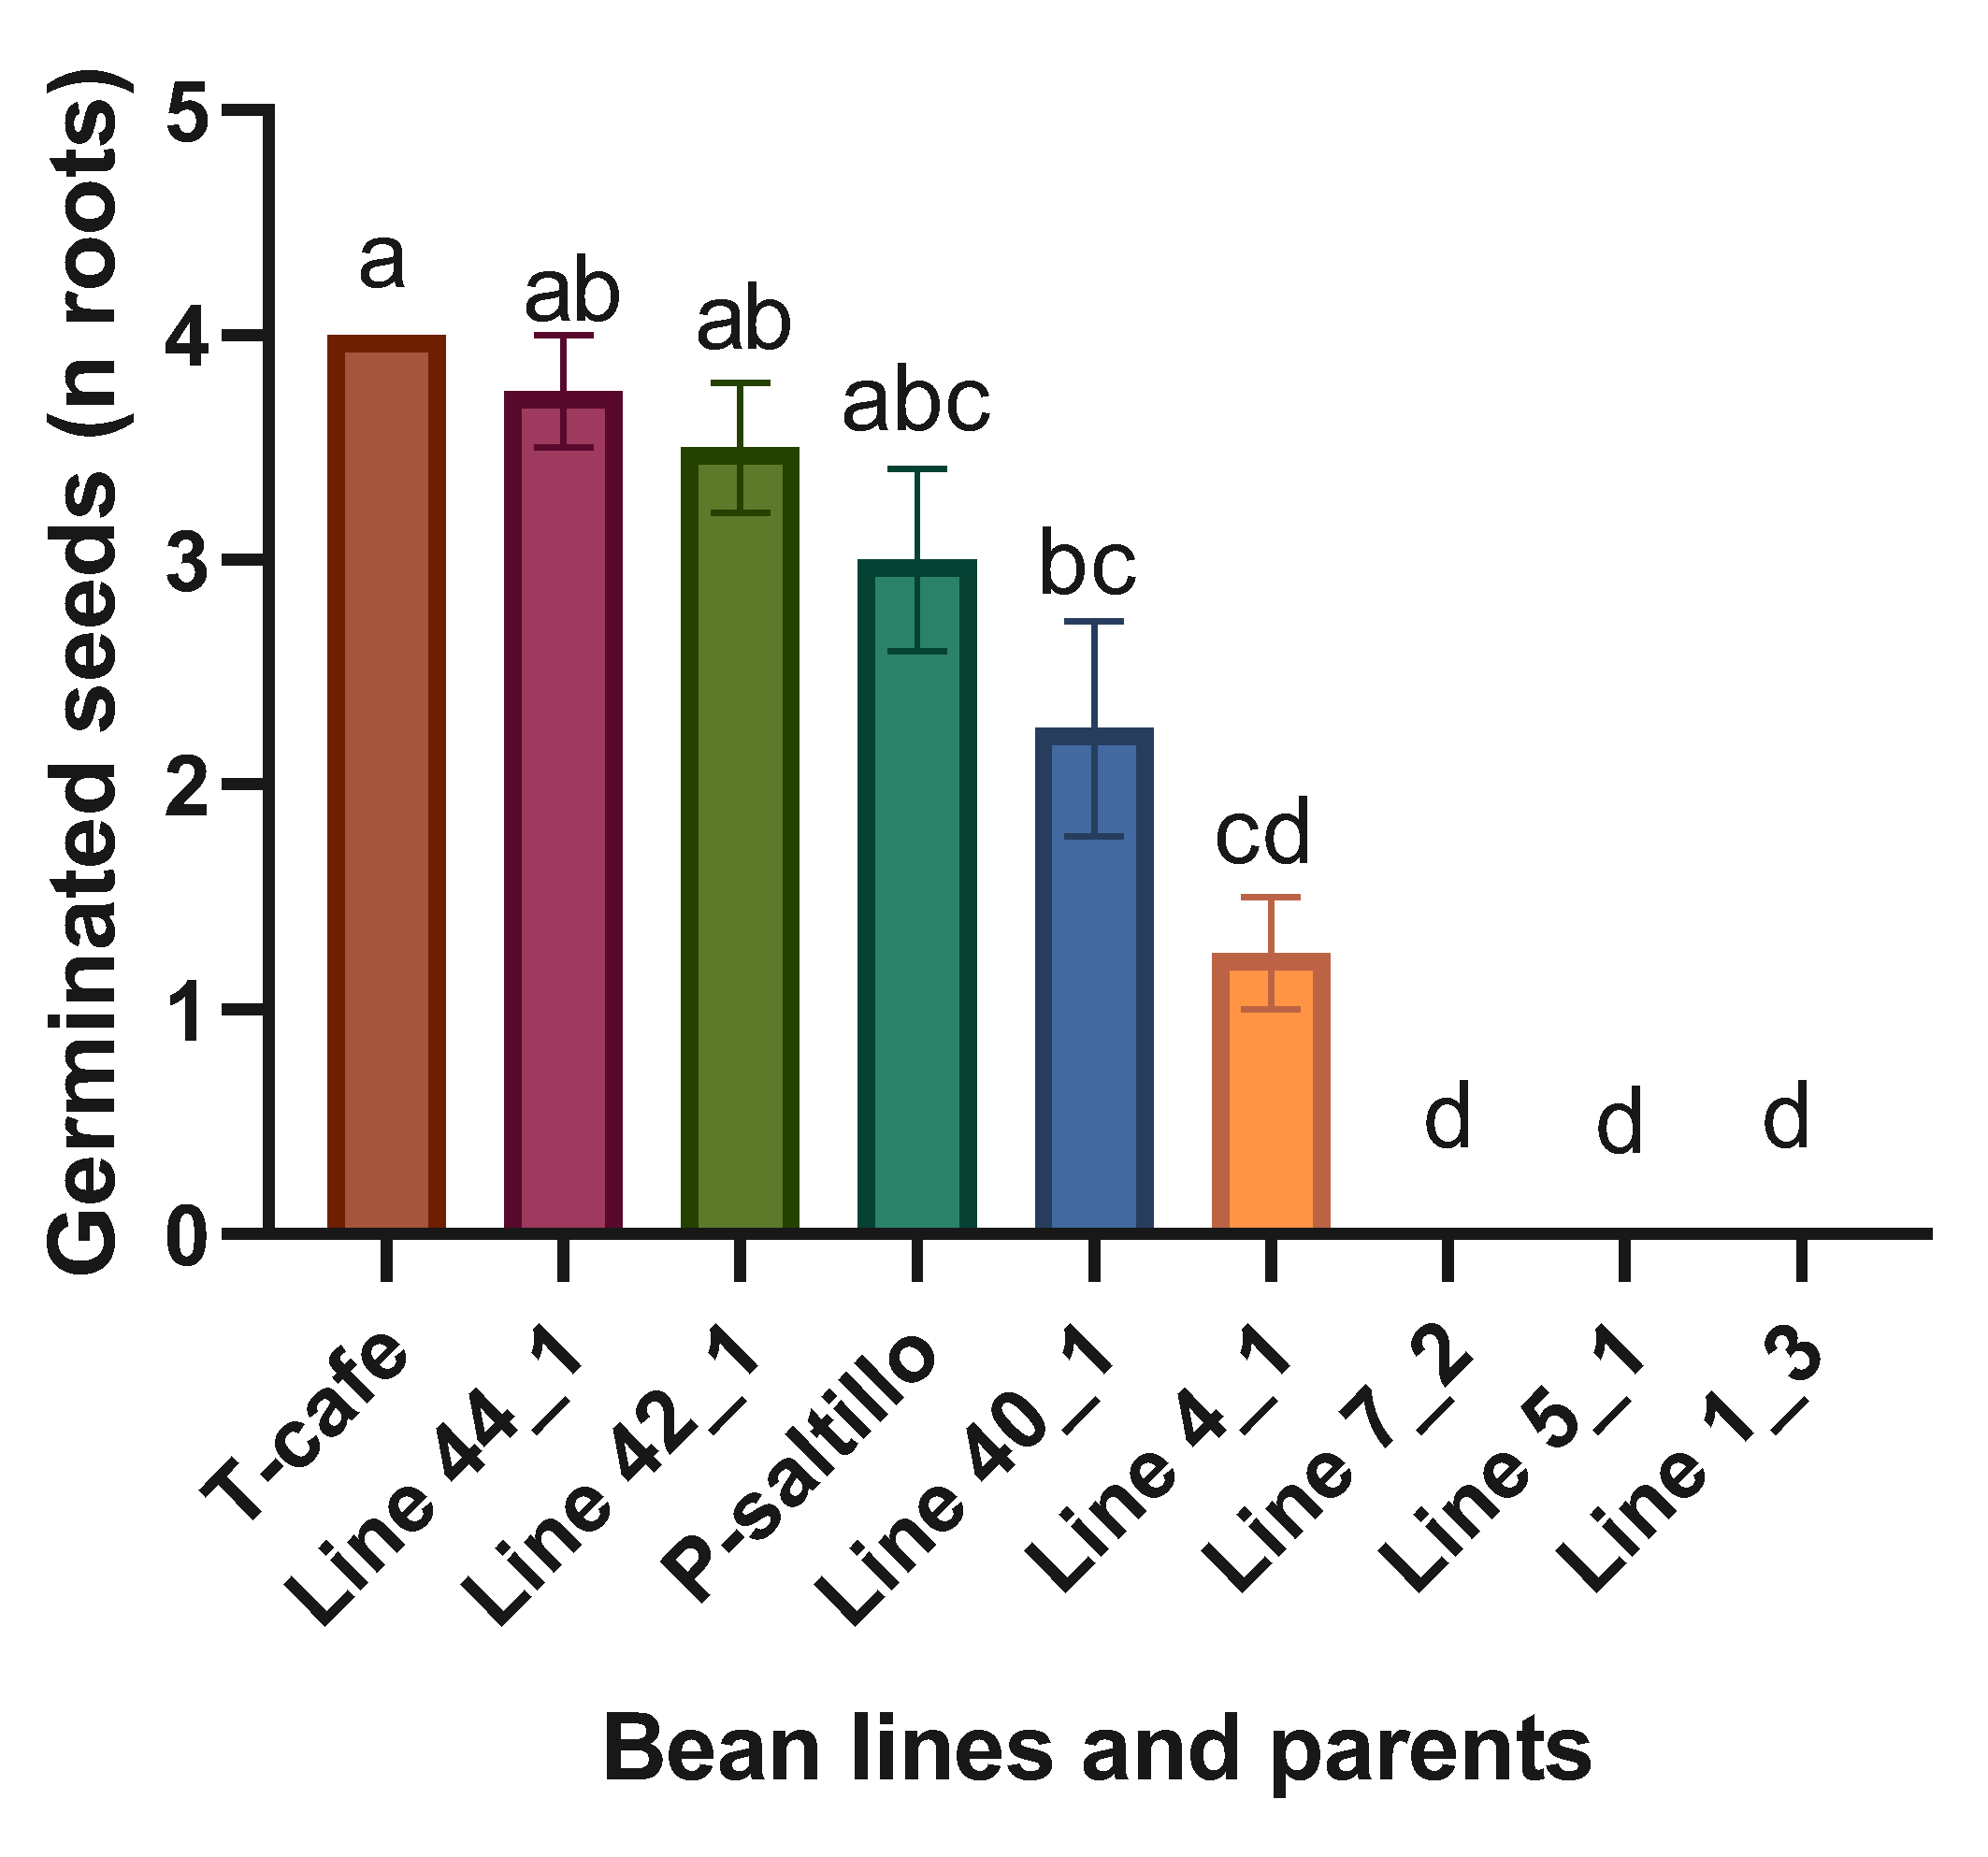
Figure 7.
Means and LSD for germinated seeds (% roots). Means followed by the same letter are not significantly different (p < 0.05). R2= 0.98, C.V.= 28.8, LSD= 38.5.
Figure 7.
Means and LSD for germinated seeds (% roots). Means followed by the same letter are not significantly different (p < 0.05). R2= 0.98, C.V.= 28.8, LSD= 38.5.
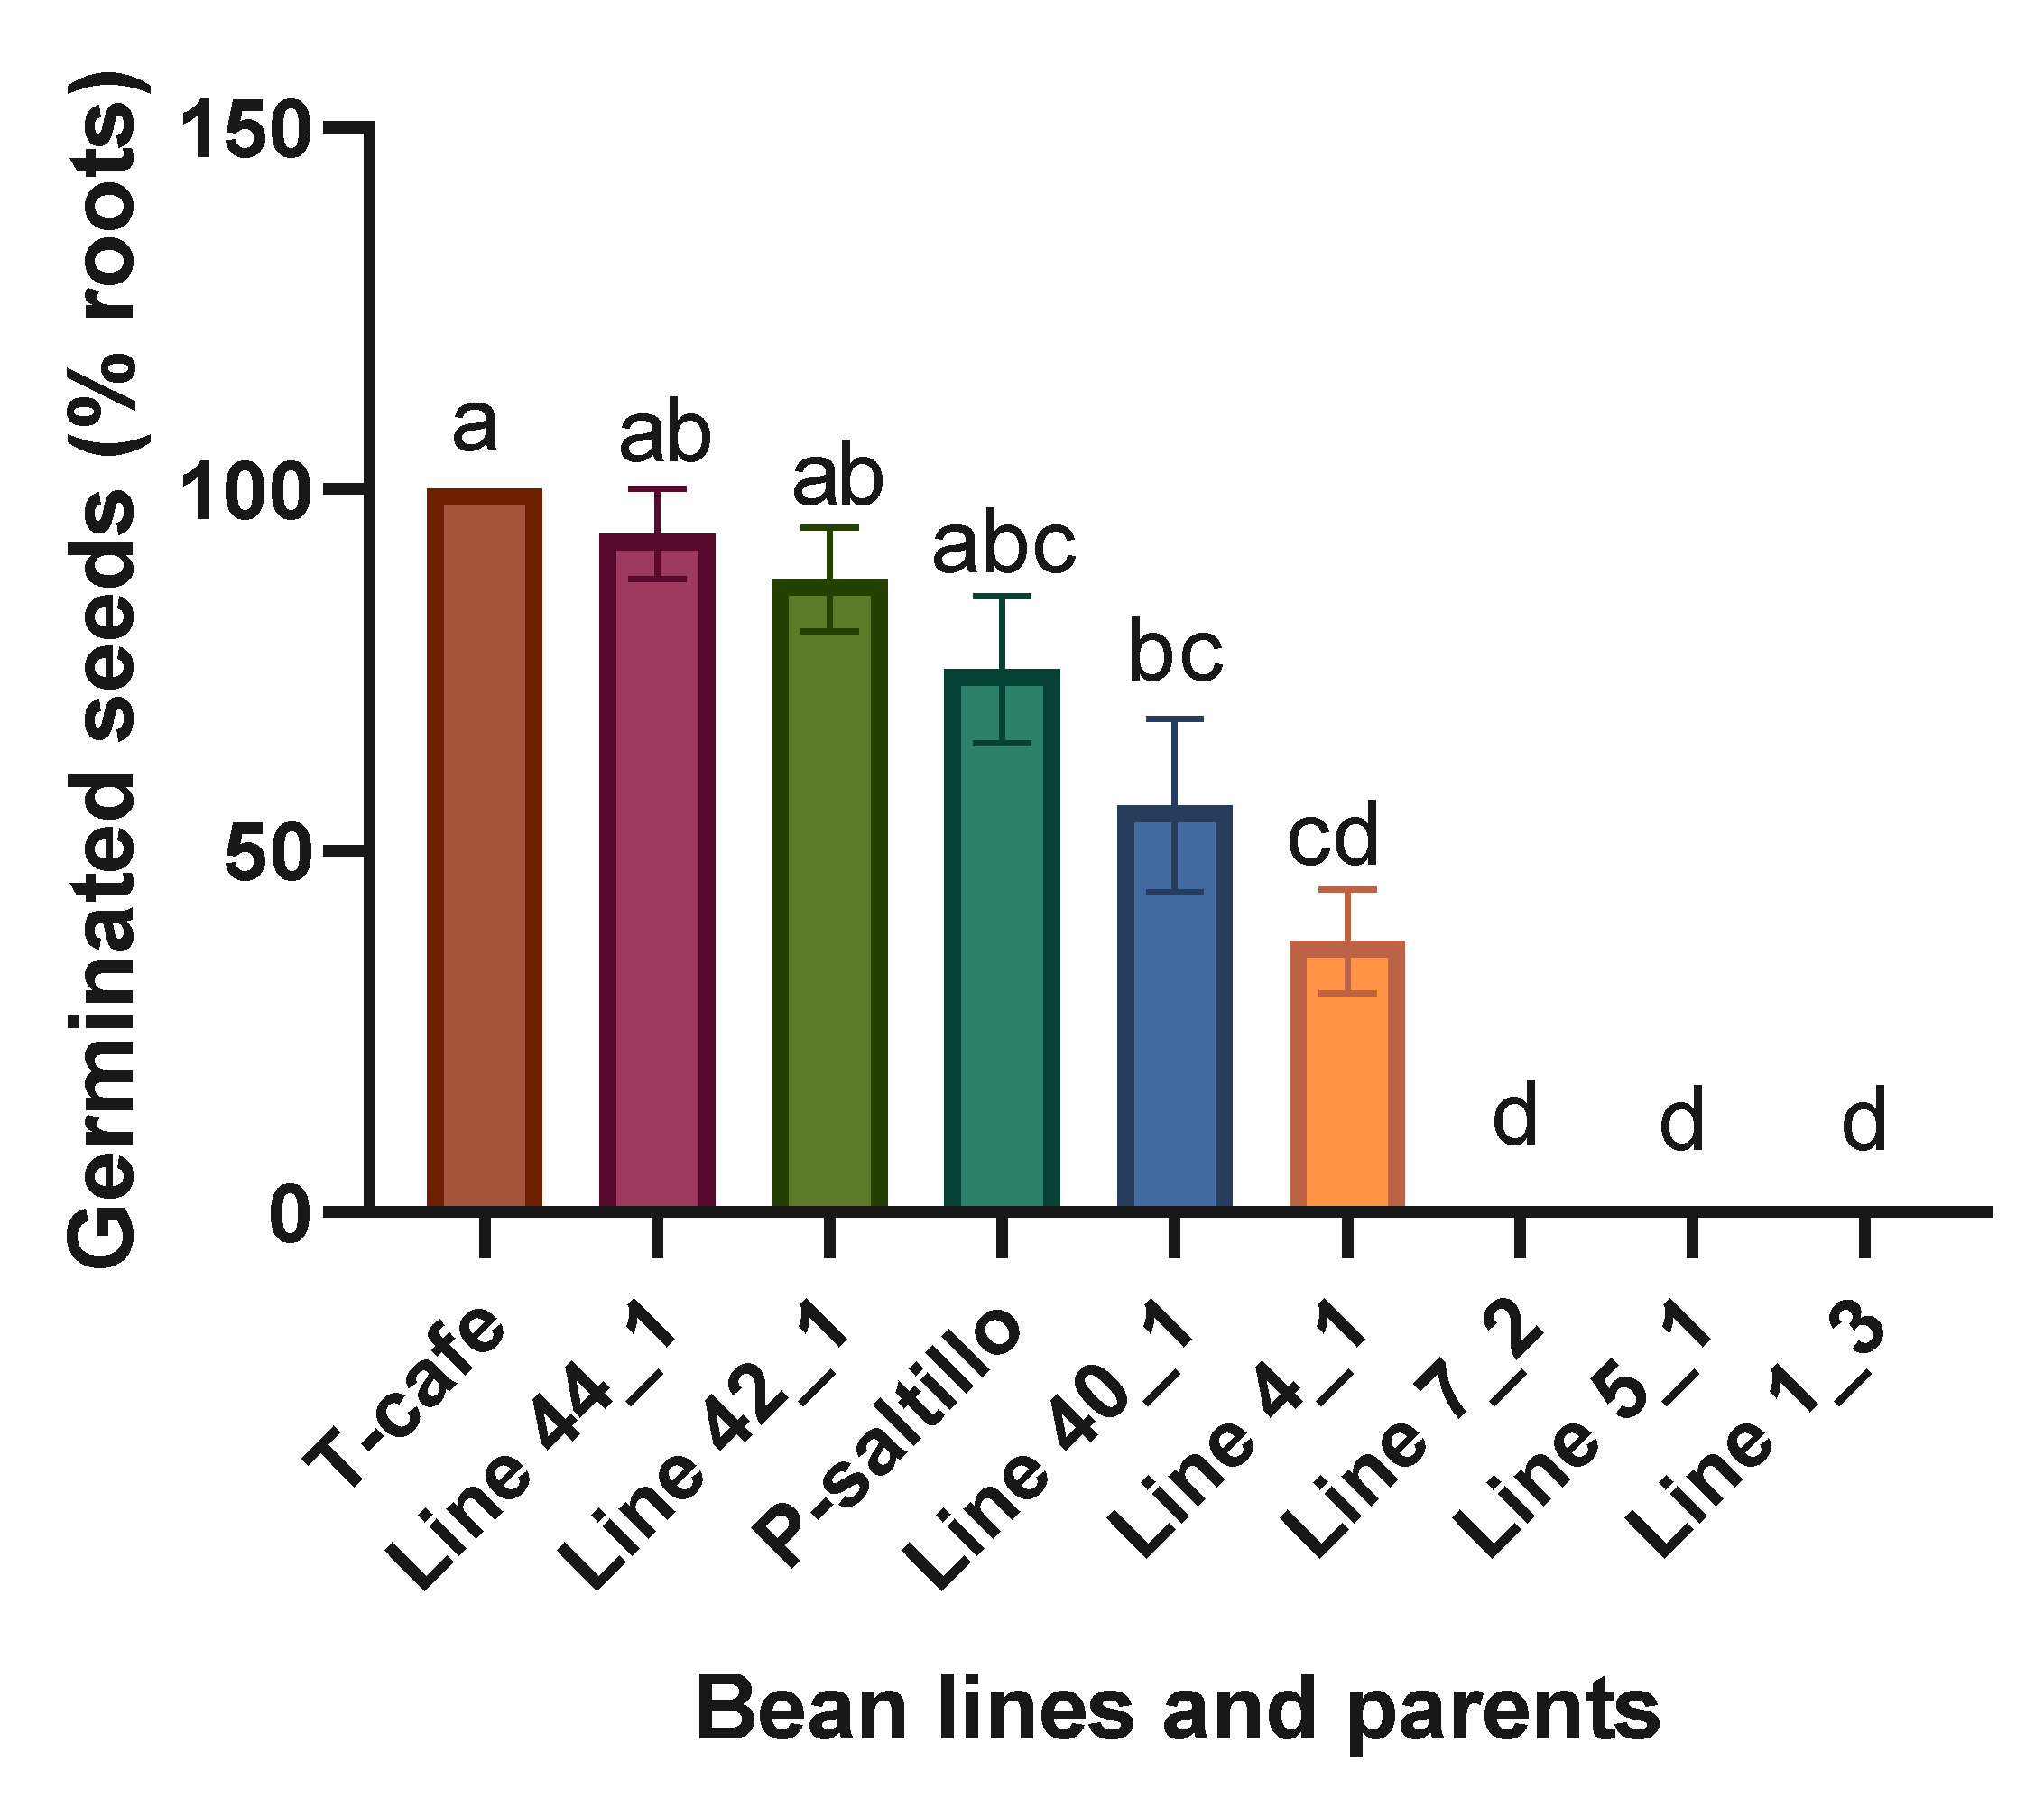
Figure 8.
Means and LSD for total length (cm). Means followed by the same letter are not significantly different (p < 0.05). R2= 0.98, C.V.= 27.5, LSD=1.7.
Figure 8.
Means and LSD for total length (cm). Means followed by the same letter are not significantly different (p < 0.05). R2= 0.98, C.V.= 27.5, LSD=1.7.
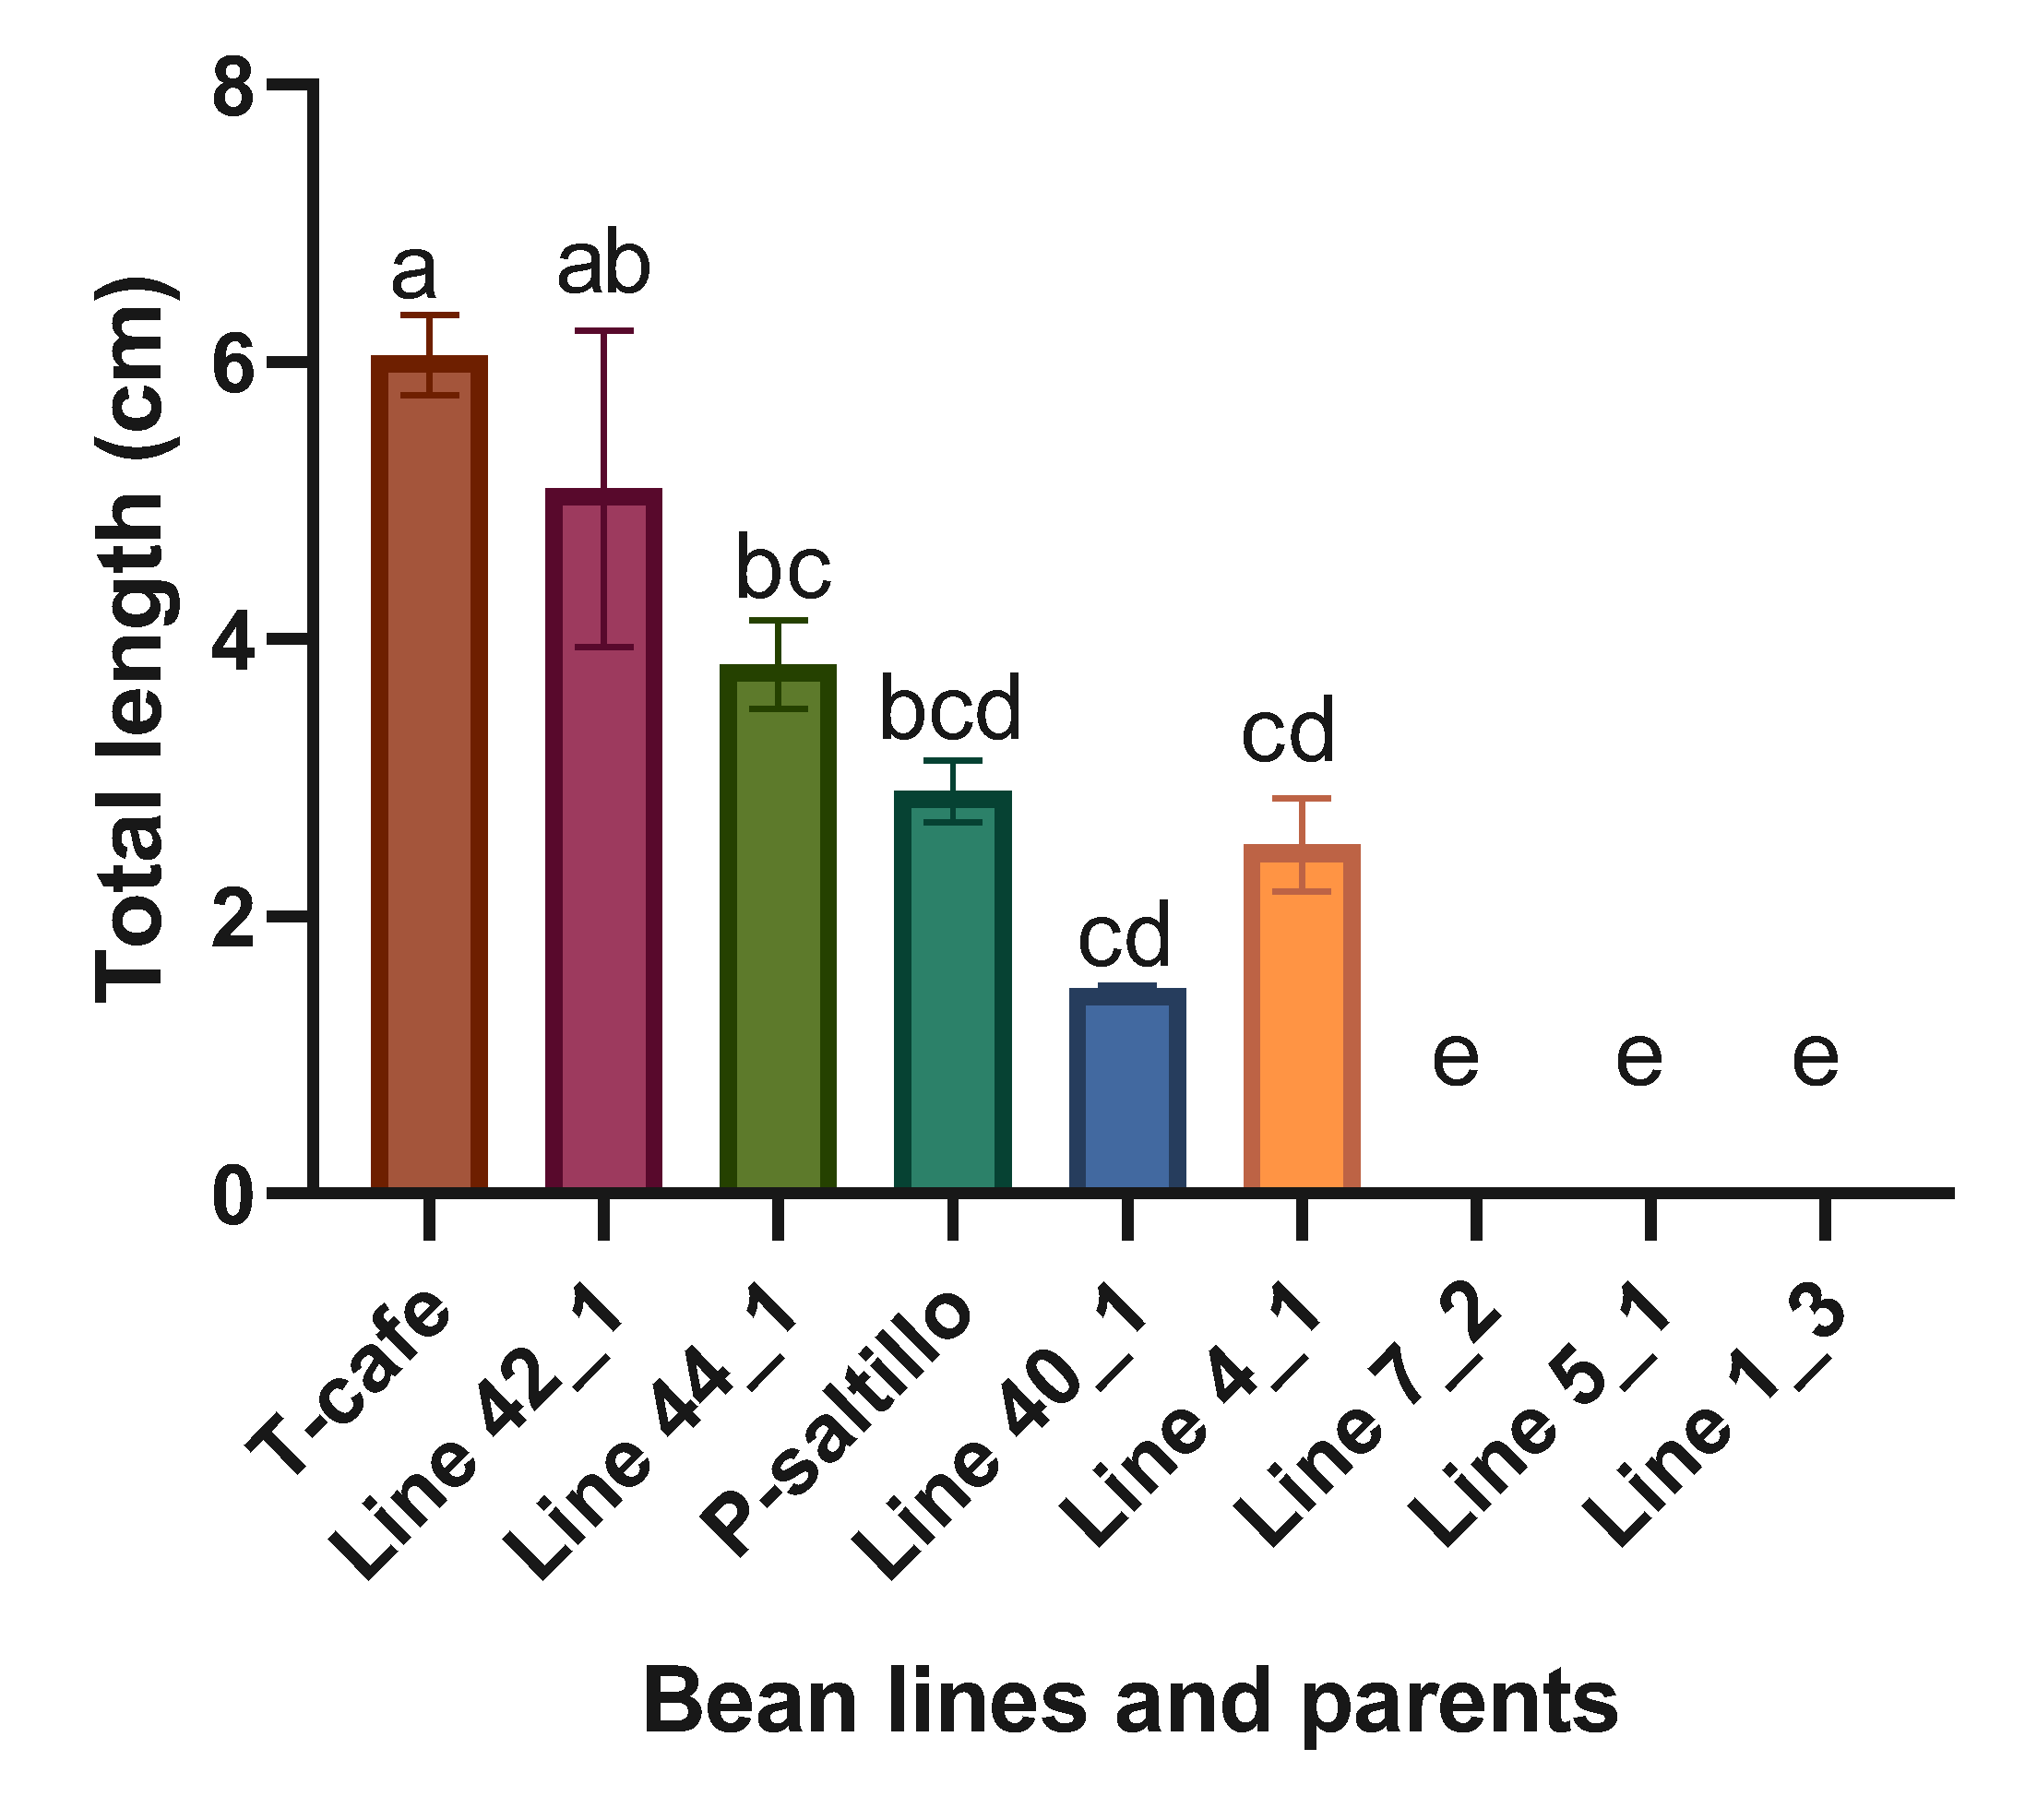
Figure 9.
Effect of osmotic potential in 2 best lines, 2 middle lines, 2 worst lines and parents of the population evaluated in vitro under ψW of -0.6 MPa generated by concentration of PEG-6000.
Figure 9.
Effect of osmotic potential in 2 best lines, 2 middle lines, 2 worst lines and parents of the population evaluated in vitro under ψW of -0.6 MPa generated by concentration of PEG-6000.
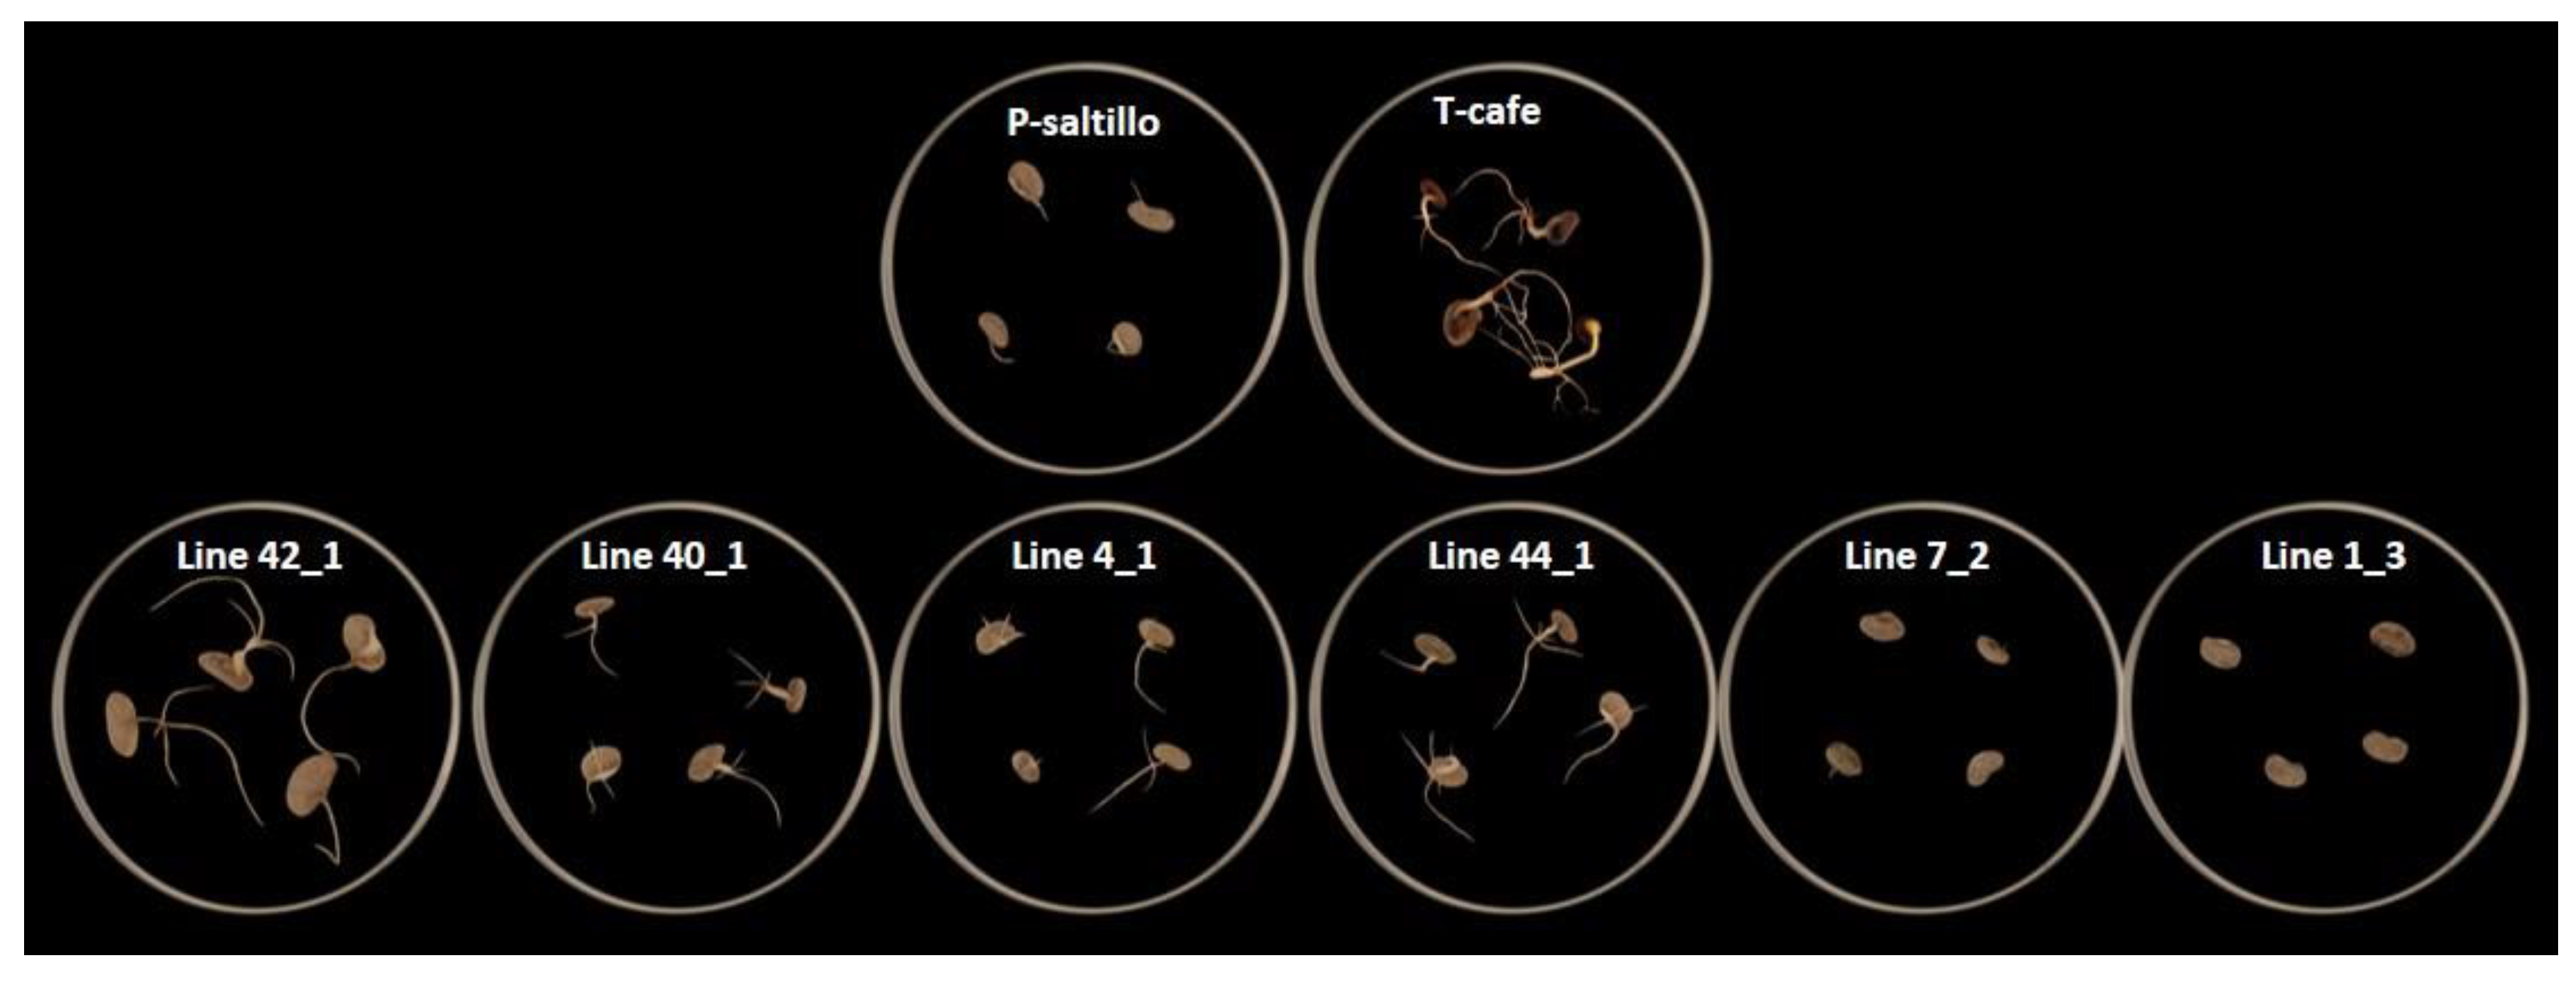

Table 1.
Parental lines of the F3 biparental population.
| Parental lines | Grain color | Race | Drought tolerant level |
|---|---|---|---|
| P-saltilloa | White-brown | Durango | Susceptibleb |
| T-cafea | Brown | Wild | Tolerantb |
a From INIFAP (Mexico). b[33].
Table 2.
Means ± standard errors and heritabilities (h2) of the F3 biparental population drought tolerance traits. The means of the two parents of the F3 biparental population and controls are also shown.
Table 2.
Means ± standard errors and heritabilities (h2) of the F3 biparental population drought tolerance traits. The means of the two parents of the F3 biparental population and controls are also shown.
| HL | GSNH | GSPH | RL | GSNR | GSPR | TL | ||
|---|---|---|---|---|---|---|---|---|
| F3 | ||||||||
| Mean | 1.06 | 2.45 | 61.42 | 2.62 | 2.44 | 61.11 | 2.39 | |
| Rank | 0-2.4 | 0.30-3.9 | 7.5-97.5 | 0.3-4.5 | 0.3-3.9 | 7.5-97.5 | 0.0-4.8 | |
| h2 | 0.46 | 0.47 | 0.47 | 0.32 | 0.45 | 0.45 | 0.20 | |
| Parents | ||||||||
| T-café | 1.18 a | 4.00 a | 100.00 a | 4.35 a | 4.00 a | 100.00 a | 5.88 a | |
| P-saltillo | 0.95 a | 3.00 b | 75.00 b | 2.67 b | 3.00 b | 75.00 b | 2.89 b | |
| LSD P > 0.05 | 4.09 | 75E-16 | 0.0 | 0.62 | 75E-16 | 0.0 | 1.14 | |
HL: Hypocotyls length (cm); GSNH: Germinated seeds (n hypocotyls); GSPH: Germinated seeds (% hypocotyls); RL: Root length (cm); GSNR: Germinated seeds (n roots); GSPR: Germinated seeds (% roots); TL: Total length (cm).
Table 3.
Genotypic (above) and phenotypic (below) correlation coefficients for the F3 biparental population drought tolerance traits evaluated in two experiments.
Table 3.
Genotypic (above) and phenotypic (below) correlation coefficients for the F3 biparental population drought tolerance traits evaluated in two experiments.
| HL | GSNH | GSPH | RL | GSNR | GSPR | TL | |
|---|---|---|---|---|---|---|---|
| HL | 0.48 | 0.34* | 0.80* | 0.53* | 0.38* | 0.41 | |
| GSNH | -0.04 | 1.0* | 1.0* | 1.0* | 0.99* | 0.99* | |
| GSPH | -0.04 | 1.0* | 1.0* | 0.99* | 1.0* | 0.99* | |
| RL | 0.27* | 0.17* | 0.17* | 1.0* | 1.0* | 1.0* | |
| GSNR | -0.02 | 0.98* | 0.97* | 0.18* | 1.0* | 0.97* | |
| GSPR | -0.02 | 0.97* | 0.98* | 0.18* | 1.0* | 0.97* | |
| TL | 0.07 | 0.73* | 0.73* | 0.63* | 0.75* | 0.58 |
* Significative correlations that exceed twice their standard error. HL: Hypocotyls length (cm); GSNH: Germinated seeds (n hypocotyls); GSPH: Germinated seeds (% hypocotyls); RL: Root length (cm); GSNR: Germinated seeds (n roots); GSPR: Germinated seeds (% roots); TL: Total length (cm).
Disclaimer/Publisher’s Note: The statements, opinions and data contained in all publications are solely those of the individual author(s) and contributor(s) and not of MDPI and/or the editor(s). MDPI and/or the editor(s) disclaim responsibility for any injury to people or property resulting from any ideas, methods, instructions or products referred to in the content. |
© 2024 by the authors. Licensee MDPI, Basel, Switzerland. This article is an open access article distributed under the terms and conditions of the Creative Commons Attribution (CC BY) license (http://creativecommons.org/licenses/by/4.0/).
Copyright: This open access article is published under a Creative Commons CC BY 4.0 license, which permit the free download, distribution, and reuse, provided that the author and preprint are cited in any reuse.


