
Submitted:
17 December 2024
Posted:
19 December 2024
You are already at the latest version
Abstract
It is known that bioconjugation makes it possible to generate nanovaccines by combining gold nanoparticles (AuNPs) with immunogenic epitopes. Such is the case of the KKFKPEIAIRPKVRD peptide (P) identified under immunoinformatic studies from the tridimensional structure of the hemagglutinin of the human influenza A H1N1 pandemic strain virus. The P was conjugated with gold nanoparticles (AuNPs), and their optical AuNPs-P complex properties were verified by UV/VIS and surface-enhanced Raman scattering measurements. The spectra of the AuNP-P complex at peptide concentrations at 0.5 to 0.7 µg/mL increase the dispersion of the Lys and Arg (positively charged). Thus, results suggest that these P concentrations are optimal for making AuNP-P complex due to their favored non-bond (electrostatic) interactions, which allow the binding P on the negative surface from AuNPs. Additionally, bioconjugation at these concentrations and the stability of the bioconjugates after 10 months were demonstrated by transmission electron microscopy studies. Subsequently, molecular dynamics simulations were used to analyze the assembly between the P and AuNPs and the binding mode at the atomic level. Finally, the AuNP-P complex was administered intranasally in BALB/c mice to then measure IgG in serum and IgA in nasal washings. The increased levels of IgG and IgA demonstrate the usefulness of AuNP- P complex administered intranasally.
Keywords:
bioconjugation
; influenza epitope
; immunogenic peptide
; gold nanoparticles
Introduction
Among the biological applications of colloidal gold nanoparticles (AuNPs) had been reported due to their affinity for luminescence labels in the diagnostic field and as probes in light and electron microscopy (Horisberger 1992; Sonvico et al., 2005; Jennings et al., 2007). Noble metal nanoparticles exhibit unique optical properties due to their surface plasmon resonance (SPR). The SPR absorption band of silver and AuNPs strongly depends on their size, shape, and aggregation (Slocik et al., 2005). Nanoparticles (NPs) are similar in size to common biomolecules like proteins and genes, have strong absorbing and scattering properties, and are easy to prepare (Adegboyega et al., 2007, Kogan et al.,2007). Their surface can be enhanced for aqueous solubility, biocompatibility, and biorecognition, which permits the interaction between metals and biomolecules (De la Fuente et al., 2005). Specifically, AuNPs are synthesized in water and subsequently linked to biomolecules that have been used in drug delivery, gene transfer, bioprobes (immunocytochemical probes) in tissue analysis, and studies of biological processes at the nanoscale (McLean et al., 2004, Chen et al., 2008, Oh et al., 2011).
On the other hand, peptides are capable of stimulating the immune system and are involved in the molecular recognition of antibodies, which are relevant in the field of clinical diagnosis of infectious diseases and in the design of vaccines (Raman et al., 2006). Besides, peptides can be attached (conjugated) to a single nanoparticle, making individual targeting signals more accessible to cell receptors or allowing them to participate in ligand-receptor interactions (Brewer et al., 2005). Specifically, conjugation of AuNPs with peptides and proteins (bioconjugation) not only affords the molecules' stabilization but also allows biocompatible functionalities for further biological interactions. Although gold is an inert metal, its effect on normal cell proliferation cannot be underestimated because metallic NPs used in therapy and diagnosis must be nontoxic, biocompatible, and stable in biological media (Tkachenko et al., 2003; Wangoo et al., 2008). Immunoinformatic studies used informatic tools with highly complex algorithms, including artificial intelligence, which allow to select immunogenic epitopes (peptides) that can be used for conjugation. Many successful examples of immunological molecules exist and can be used to improve the immunological response or as biosensors.
Conjugated molecules are obtained from the union of negative charge on the gold colloids, (synthesized by citrate reduction) having affinity for positively charged peptides and proteins at neutral or physiological pH, and some evidence supports that nanoparticle covered by peptides increases stability and biocompatibility (Norde 1986; Hayat 1989; Hermanson 2008). Proteins and peptides can adsorb strongly to colloidal gold to form a stable conjugate, retaining its biological property (El-Sayed et al., 2005) as well as their high stability and water solubility (Lévy et al., 2004).
In this paper we report the bioconjugation of an immunogenic peptide (P): KKFKPEIAIRPKVRD (Carrillo et al. 2015) on the negative surface of AuNPs. The obtained AuNP-P were characterized by transmission electron microscopy (TEM), UV/VIS, and Raman spectroscopy techniques. Additionally, we perform molecular dynamics (MD) simulations using a polarizable gold surface as parameterized in the AuNP force field (Iori et al., 2009) to corroborate the conjugation between the P and AuNP in water at the atomic level, following a strategy that combined five independent 100 ns-long, revealing that the peptide was absorbed into this simulation time scale through interactions in agreement with those reported elsewhere (Ramezani et al., 20015). Finally, the peptide was bound to AuNP noncovalently to make an AuNP-P complex. It was subsequently administered intranasally in BALB/c mice, IgG and IGA immunoglobulins were determined in serum and nasal wash, respectively. The obtained results demonstrate a general strategy for generating a stable bioconjugate capable of inducing antibodies response in serum and nasal mucosa in mice models.
Materials and Methods
Peptide. The P (KKFKPEIAIRPKVRD) selection was made using the structural epitope prediction server PEPOP (Moreau et al., 2008) and was reported (Carrillo et al in 2015). The P was purchased and received as crude material from Mimotopes (Minneapolis, MN and Clayton, Victoria, Australia). The P was diluted to 1 mg/1 mL in PBS pH 7.4.
Synthesis ofAuNPs. Tetrachloroauric acid trihydrate 99.5% (HAuCl4 3H2O) as precursor purchased from Sigma-Aldrich, sodium citrate dehydrate (Na3C6O7 2H2O) as a reducing agent was from JT Baker. Citrate-reduction or chemical reduction was used in the synthesis of AuNPs (20 nm). It is based on the use of sodium citrate, which reduces ions of a metal salt in this case tetrachloroauric acid (HAuCl4) in zero valence atoms in the presence of heat. This method involved the preparation of 1 mL of tetrachloroauric acid (HAuCl4) at 4% in deionized water, then 0.5 mL was added to this solution to 200 mL of deionized water and brought to boiling, the solution was kept under constant stirring. Once the sample began to boil, 3 mL of sodium citrate were added to 1%; then, the addition of sodium citrate began to darken and turn bluish-gray or purple. After 30 min, the reaction was completed, and the solution's final color was a deep red wine, indicating that the colloidal solution of AuNPs was obtained. After the solution was cooled, the AuNPs were centrifuged at 3500 rpm for 40 min, the supernatant was removed, and the nanoparticles were re-suspended to 4 mL with deionized water.
Conjugation of peptide withAuNPs. P was linked to the surface of AuNPs by adding a constant volume of this molecule in solution at several concentrations on a fixed volume of the colloidal solution (Wang et al., 2005). The volume ratio between the solutions of P and colloid was 1:9, to obtain AuNP-P complex solutions at several concentrations of P from 0.1 to 1 µg/mL. Each AuNP-P complex solution was incubated at room temperature for 5 min to be measured by UV-vis spectroscopy, Raman, and TEM techniques.
UV/VIS spectroscopy. UV/VIS absorption spectra were recorded at room temperature with a Thermo Scientific Evolution 606 spectrophotometer. A volume of 500 µL of each colloidal solution (control and AuNP-P complexes) was placed on a quartz cuvette to obtain the absorption spectra for all the samples in the 300-900 nm spectral interval. Origin software was used to calculate the first derivative of the UV/VIS absorption spectra.
Raman spectroscopy. A Raman spectrometer Thermo Scientific Smart DRX in the backscattering acquisition mode was used to obtain the surface enhanced Raman scattering (SERS) spectra of both AuNP and AuNP-P complexes. The wavelength of the laser used as an excitation source was 785 nm, and power was supplied to the sample of 10 mW. To obtain an efficient SERS signal, the colloidal samples were centrifuged at 6000 rpm for 10 min, and after removing the supernatant, the concentrated sample was deposited on the surface of a monocrystalline silicon substrate to be analyzed then with the Raman spectrometer.
Transmission electron microscopy. This technique was used to observe the morphology of the AuNPs and AuNP-P complexes. Images obtained of the particles were acquired using a JEOL GEM 100 CX II system operating at 80kV. A drop of the colloidal sample was placed on a carbon-coated copper mesh grid, to be slowly evaporated and analyzed by TEM.
MD simulations of the peptide. A three-dimensional (3D) model of the P was built using PEP-FOLD (Shen et al., 2014; Thévenet et al., 2012). This 3D model was submitted to 100 ns-long MD simulation to obtain the most populated conformer. MD simulations were carried out with Gromacs 4.6.5 package (van der Spoel et al., 2005) and using OPLS-AA/L force fields (Jorgensen et al., 1996). After MD simulation, a P was embedded in a dodecahedral box containing the SPC water model (Hess et al., 2006) and neutralized using Cl- ions; the water model extended 1 nm between the P and the edge of the box. The solvated system was equilibrated by performing energetic minimization using steepest descent through 1000 steps followed by one ns equilibration at 300 K where the solvent was allowed to relax whereas the protein was restrained. MD simulations was run under NPT ensemble at 300 K using V-rescale algorithm and 1 bar pressure using Parrinello-Rahman (Pronk et al., 2013). LINCS algorithm (Hess at al., 1997), was used to constrain all bonds including hydrogen atoms and the SETTLE algorithm (Miyamoto et al., 1992) was used to constrain the water molecules. The time step for the simulations was two femtoseconds (fs). Van der Waals forces were treated using a cutoff of 1.2 nm. The particle mesh Ewald method (Darden et al., 1993) was used to treat the long-range electrostatic forces, and the coordinates were saved every 0.5 ps.
MD simulations of the AuNP-P complex. AuNP-P simulations were performed with the Gromacs 4.6.5 package (van der Spoel et al., 2005) using the AuNP force field (Iori et al., 2009) with OPLS-AA/L parameters (Jorgensen et al., 1996). AuNP-P complex was solvated in a 30 Å3 length cubic water box using the SPC water model (Hess et al., 2006) and neutralized using Cl- ions. Systems were energy minimized through 1000 steps, followed by 1 ns of equilibrium, and 100 ns of production runs. The lengths of bonds were constrained with the LINCS algorithm (Hess at al., 1997). Bulk and surface gold atoms were frozen during all simulations, but gold dipole charges were left free. MD simulations were carried out at constant temperature (T = 300 K) and volume. 2 fs integration time step and Nose-Hoover thermostat (Hoover et al., 1985) were used under periodic boundary conditions. Particle-Mesh-Ewald (Darden et al., 1993) algorithms for long range electrostatics above 1.1 nm and switch cutoff 0.9-1.0 nm for van der Waals interactions was used. Five independent runs were performed for the AuNP-P complex, each starting with the most populated P conformation obtained through 100-ns-long MD simulation above described placed in different distances (between 1.2-1.5- nm) from the AuNP.
Analysis of MD simulations. Radius of gyration (RG) and superficial accessible surface area (SASA) was calculated for the P, after removing overall translational and rotational motions. Most populated conformations were obtained through a conformational clustering analysis using the g_cluster algorithm with the gromos method (Lindahl et al., 2001) and a cutoff of 0.40 nm to evaluate the map of interactions most dominant along the last 50-ns-long MD simulation. Analyses of MD simulations were performed using GROMACS 4.6.5 package tools (Berendsen et al., 1995; Van Der Spoel et al., 2005). Images and structural representations were prepared using PyMOL v0.99 (DeLano, PyMOL 0.99 (Delano 2002).
Animals. All animals were handled in accordance with Mexican federal regulations for animal experimentation and care (NOM-062-ZOO-1999, Ministry of Agriculture, Mexico City, Mexico) and approved by the Institutional Animal Care and Use Committee. In all experiments, 8–12 week-old male BALB/c mice and weighing 25–30 g were used.
Immunization. Each experimental group contained 5 animals that were immunized i.n., previously, they were lightly anesthetized with ethyl ether. The doses were applied on days 1, 7 and 14 with 30 µg/µL. To each group: (i) P, (ii) AuNP-P complex and (iii) control group (vehicle) were administered. All mice were sacrificed by cervical dislocation 7 days after the last immunization (21 days after first immunization). Serum and nasal washes were collected and antibodies for P in serum and mucosal samples were measured by an indirect enzyme linked immunosorbent assay (ELISA) for all our experimental groups.
ELISA. The levels of anti-P antibodies in the serum and nasal wash samples were evaluated by the ELISA technique. 96 well plates were coated with 2 μg/mL of the P or AuNP-P complex in 0.1 M of carbonate buffer (NaHCO3 / Na2CO 3) pH 9.6) and incubated overnight at 4 °C, then washed three times with PBS-Tween, blocked with 50 μL of 6% skim milk in PBS-Tween and incubated 2 h at 37 °C; the plates were washed again three times with PBS-Tween and incubated overnight at 4 °C with samples (50 μL): sera in a 1: 100 dilution for all groups and undiluted nasal washings (50 μL). Subsequently, the plates were washed three times with PBS-Tween and 50 μL and peroxidase mouse anti-IgG (Thermo scientific) or anti-IgA (Zymed Laboratories, San Francisco, CA) were added at a 1: 5000 or 1: 500 dilutions, respectively, the antibodies were incubated for 2 h at 37 °C. The plates were then washed again three times with PBS-Tween and 100 μL of the developer solution (2,2'-azino-bis (3-ethylbenzothiazoline-6-sulfonic acid) diammonium salt in phosphate-citrate buffer 0.2 and 0.1 M, respectively pH = 5) in the presence of H2O2. The plates were incubated 1 h at 37 °C and the absorbance at 405 nm (A405) was measured in a Multiscan Ascent (Thermo Labsystems) microplate reader. Samples were analyzed in duplicate.
Calculations and statistics. In the Figures, bars represent mean A405 values for antibody levels from each experimental group and standard deviations (SD). The data obtained were statistically analyzed by means of a Unifance Analysis of Variance (ANOVA) and then a Tukey post hoc test with the PRISM computer program (GraphPad). A significance level with P <0.05, was considered to establish that there was a significant difference between the groups.
Results
P design and charge distribution calculation.The P (KKFKPEIAIRPKVRD) used for the conjugation was obtained from the 3D structure of influenza A H1N1 hemagglutinin protein by using epitope predicting software (Carrillo et. al. 2015).
The net electrical charge of the P (Z_Peptide) as a function of pH and 1 mM salt concentration (Figure 1a). The calculated isoelectric point of the P is close to IP = 11. Figure 1b shows the contribution of the residues.
AuNP-P complex. Several concentrations of P were prepared using the methods mentioned elsewhere (Wang et al., 2005). The color changes of the mixture (AuNP + P) is the first evidence of AuNP-P complex when the concentration of P becomes very high, the mixture turns into a dark purple to blue-gray color, and the original ruby red disappears. For this case, very small black particles appear in the mixture. However, as the concentration of P diminishes, the obtained colloidal solution begins to show the ruby red coloration characteristic of the AuNPs solution used as a control. We observe that for P concentrations between 0.5 and 0.7 µm/mL couple to AuNP still retains its ruby red coloring, but with a lightly darker tone and never show the small black color particles. AS 05).
UV/VIS spectra of P and AuNP-P complex. The UV/VIS spectrum of AuNPs (control) consists of a unique absorption band at 520 nm (Figure 2A), which arises from the surface plasmon resonance (SPR) absorption.
We have used a simple and fast method to evaluate the average size of AuNPs (Haiss et al., 2007). This method uses the information of the UV/VIS spectrum obtained experimentally as the intensity of the SPR absorption at 520 nm, and the intensity of the absorption at 450 nm.
The particle size was calculated by:
d = exp(B1ASPR/A450 - B2)
Where (ASPR) is the absorbance of the surface plasma resonance, and (A450) is the absorbance at 450 nm. B1 is the inverse of the slope of the linear fit between (Aspr/A450) and ln (d), whereas B2 is the interception. Using experimental data reported in (Haiss et al., 2007), B1=3.0 and B2=2.2. The calculation of particle diameter using equation 1 allows estimate the size ofAuNPs. From the UV/VIS spectrum of the AuNPs used in this work ASPR=1.491 and A450=0.869, thus using eq. (1) the estimated average size is d=19 nm.
Figure 2B shows the UV/VIS spectrum of the AuNPs and the spectra of the AuNP-P complex at several concentrations of P from 0.1 – 1.0 µg/mL. It can be observed that the line shape of the spectrum of the AuNPs (control) changes as the concentration of P increases, beginning with a little shift to long wavelengths (for 0.1 µg/mL) and also a widening of the absorption signal resulting from the non-bonds interactions of the P on the AuNP surface. After 0.8 µg/mL a second band near 607 nm is more evident due to the aggregation of the AuNP-P complexes. This effect is more accentuated for high concentrations of P (> 0.8 µg/mL).
P at > 0.8 µg/mL shows the line shape of the first derivative is distorted because of the presence of the second band at 607 nm, which leads to the aggregation of the AuNP-P complexes. The last can be observed as a discoloration of the colloidal solutions. Thus, an adequate conjugation can be achieved for P < 0.8 µg/mL, where the line shape of the spectrum of the conjugated is very similar to the spectra of AuNPs (control) (Figure 2C).
SERS spectra of AuNP-P complex.Once obtained the AuNP-P complex present in colloidal state at several concentrations of P, they were centrifuged and deposited on monocrystalline silicon substrates, as indicated in the experimental section, to obtain the SERS spectra by Raman spectroscopy. The Raman spectra of P at 1 µg/mL deposited on the monocrystalline silicon substrate do not show any signal from the P due its low concentration (Figure 3). Only two bands at 520 cm-1 (from optical single mode) and 960 cm-1 (from two phonon processes) of the crystal silicon are observed (Rojas-Lopez et al., 2006, Rojas-Lopez et al., 2010, Liu et al., 2002). The Raman spectrum of P at 1 mg/mL is showing a band at 1436 cm-1 which is due to deformations of -NH3 species of Lys (Aliaga, et al, 2009). For AuNP (Figure 3), the SERS spectrum shows vibrational modes associated mainly with silicon oxides arising from the surface of the monocrystalline substrate, such as the bands at 630, 1054, and 2126 cm-1 (Liu et al., 2002).
For low concentrations of P (0.1 and 0.3 µg/mL), the SERS spectra of the conjugate are very similar to AuNPs, possibly because there are not enough molecules covering the surface of the AuNP. However, for 0.5 and 0.7 µg/mL, the SERS spectra of the conjugate show intense bands arising from the AuNP-P complex. The band at 1355-1374 cm-1 is associated with vibrations of the aliphatic chain of CH2 from the amino acids (Aliaga et al., 2010). The next band at 1436 cm-1 is assigned to deformations of NH3+ species from the Lys, whereas the bands at 1560 and 1638 cm-1 could be ascribed to an asymmetric stretching of the -COO- groups (Aliaga, et al, 2009).
Transmission electron microscopy of AuNP-P complex. The quasi quasi-spherical or icosahedrical nature of AuNPs are used to prepare the AuNP-P complexes (Figure 4A-B). The average size of these particles is near 20 nm, which is consistent with the estimated size (19 nm) obtained using equation 1 and the UV/VIS spectrum. The morphological appearance of the conjugates AuNP-P complex at several scales (Figure 4C-G). The P layer covering each AuNP can be observed. In this case, the P concentration used to make the AuNP-P complexes was 0.5 µg/mL, because the first derivative of UV/VIS and Raman results suggest this P concentration is the most viable to form the AuNP-P complexes.
MD simulations of the AuNP-P complex. 100-ns-long MD simulation of the P shows that it reaches equilibrated values into the first 50, where their initial RG and SASA values of 1.1 ± 0.08 nm and 21.5 ± 0.70 nm2, respectively, decreased during the MD simulations, reaching converged RG and SASA values of 0.80 ± 0.03 nm and 19.25 ± 0.90 nm2. Then, a cluster analysis was performed to obtain the most populated conformation that may be considered as the thermodynamically most favorable conformations corresponding to that predominantly in a physiological context. Based on the most populated P conformer, five independent MD simulations were carried out for the AuNP-P complex where the P corresponded with its most populated conformation present through 100-ns-long MD simulation (see methods) was placed in different distances that oscillated between 1.2-1.5- nm from the AuNP. Analysis of the RG value for the P absorbed onto AuNP indicates that the P maintains compactness during its coupling with AuNP (Figure 5). In contrast, the lower SASA value (Table 1) observed for the absorbed P compared with the free P (19.25 ± 0.90 nm2) corroborates a lesser surface area available to be solvated due to the association between the P and AuNP.
Measuring IgG and IgA levels in Immunized Mice
The measurement IgG in serum of mice immunized with AuNPs, P or AuNP-P complex show significant difference between P and AuNP-P complex compared to the AuNPs, with a value of *** p < 0.001 (Figure 6A). However, no significant difference was found when comparing the group immunized with the P and with AuNP-P complex (ns). Additionally, IgA were determined in nasal washes from the immunized mice (Figure 6B). No significant difference was found between the group immunized with the P and the AuNP-P complex. However, a difference was found when comparing both with the control with a p value <0.001.
Discussion
Electrostatic interactions between the positive charged P and the negative charged AuNPs could play an essential role in the AuNP-P complex stability. Therefore, it was important to study the ionization state of each type of titratable residue depending on the solution conditions. A mean Monte Carlo simulation for structural stabilization (Metropolis et al., 1954) and a titration scheme for chemical stabilization can be estimated to calculate the P titration curve (Texeira et al., 2010). The P is represented by a freely-jointed chain of rigid spheres connected by harmonic bonds. The counterions and salt are described explicitly, and the solvent (water) is modeled as a dielectric continuum (Narambuena et al., 2014).
The electrical charge depends on the pH, and for this system was IP = 11. It is known that pH values lower than the IP provide a positive charge. Therefore, the P has a significant positive charge, due to the contribution of Lys and Arg (Figure 1b). This suggests that these charge positive groups can interact with the citrate groups on the surface of AuNPs through salt bridge interactions, even at the isoelectric point of the nanoparticle (Brewer et al., 2005). Other types of interactions, such as hydrophobic and hydrogen bonds, could contribute to the stability of the conjugate. Regarding the conjugation of the P on the AuNPs, it is well known that the permanence of the ruby red color of the colloidal solution is related to a stabilized state of the conjugated, whereas a change in the coloration to blue-gray is directly related to the aggregation of the AuNP caused by an excess of charge provided by the P, which neutralize the charges the surface of the AuNPs (De la FuenteAS 05). We suggest that the interaction is based on the charge attraction between the AuNPs and the P. In our case, the AuNPs were synthesized by the citrate reduction method; thus, a layer of citrate groups covered the surface of each nanoparticle, providing a negative charge. In this way, several amino acids of the P could be linked to a AuNPs through a positively charged from Lys and Arg), which interacts with the citrate of the AuNPs surface (Brewer et al., 2005; McLean et al., 2004).
The chemical characterization of AuNPs coincides with the reports of UV/VIS and SPR techniques (Moreira-Alvarez, Bereli N). Additionally, the size of the AuNP was calculated (Haiss et al., 2007), and the estimated average size was d = 19 nm.
When the AuNPs were conjugated with the P, there was found in this work that at higher P concentrations there were color changes in the solution. It is well known that the negative charged surface of the AuNPs is neutralized by some part of the peptide positively charged, because high peptide concentrations can accentuate this effect and consequently cause aggregation (Raman et al., 2006). When this condition is reached the conjugated AuNPs are aggregated and the colloidal single-AuNP condition disappears. This fact can be also observed from the first derivative of the UV/VIS spectra of the AuNP-P complex (Figure 2C). Therefore, the adequate conjugation of the peptide with the AuNPs must be at < 0.8 µg/mL. According to the SERS spectra, the Lys and Args interact with the surface of AuNPs adopting different conformations and orientations onto the surface (Ma H, Zhang, Madzharova F,), enhancing their intensity in this interval of concentration of P (0.5-0.7) µg/mL. This observation can be used as evidence of the immobilization of P on the surface of AuNPs. For high concentrations of P (0.8 and 1.0 µg/mL), the intensity of the SERS signals diminishes notably due to the aggregation effect of AuNP by the neutralizing its negative charges. The last is consistent with the observation of a second band in the UV/VIS spectra attributed to the formation of aggregates (Raman et al., 2006), which is more evident for high concentrations of P (0.8-1.0) µg/mL. Therefore, the interval of P concentrations between 0.5 and 0.7 µg/mL represent the optimal conditions to obtain a stable AuNP-P complex by using this hemagglutinin P. The icosahedral nature of the AuNPs is shown in the TEM photographs and the average size coincides with what has been reported (approximately 20 nm) (analytical chemistry 2018). The obtained AuNP-P complex could be especially useful for diagnostic or immunologic therapy in nanomedicine (Huang Y, Higino T,).
Analysis of the five MD simulations showed that, in all cases, the P was adsorbed onto the AuNP within the first 40 to 60 ns, through a residue map (Table 1) that includes charged residues (Lys and Glu) and hydrophobic (Phe, Pro, Ile), a residue that has been reported to be important in conjugation with AuNP (Broncolini et al., 2012). Overall, the P is rapidly adsorbed according to these MD simulations, was stable on the AuNP surface, and shows no tendency to unfold, supporting the experimental findings.
The AuNP-P complex was administered in BALB/c mice, it was found that it did not modify the titer of IgG and IgA in serum and nasal washes, respectively, compared to the P, but the response of P is not affected by AuNP, suggesting that P is delivered. The above is important because P was administered intranasally, which is different from the subcutaneous route reported by Carrillo et al. (Carrillo et al ). In vaccines against respiratory viruses, the induction of IgA in the mucosa is important, since it is the first defense before the IgG found in serum (Zorgi NE, Kawai A). This is the contribution of this work, where there were proposed AuNP-P complex, characterized by various techniques, including stability after 10 months. It was also tested in an animal model by intranasal administration. To date, intranasal AuNPs have been used in few investigations (Salazar-González, Tao W, Wang C). This work supports the use of the intranasal route since both IgG and IgA are induced either AuNP-P or P.
Conclusions
This work achieved a bioconjugation (AuNP-P complex) of a hemagglutinin peptide from influenza A H1N1 virus with AuNP. The usefulness of the AuNP-P complex was demonstrated when administered intranasally in BALB/c mice, and the induction of immunoglobulins in serum and nasal mucosa was detected. Therefore, the application of conjugation of nanoparticles and peptides as potential vaccines that induce antibody response is supported.
Acknowledgments
The authors thanks funding supports COFAA-IPN, IPN-EDI, CONACYT-254600 and 782, SIP 20150322, SIP 20150301, 20240516, 20242949, CYTED: 214RT0482, and ICyTDF. Special thanks to Patricia Aley Medina for technical assistance in electronic microscopy.
Conflicts of Interest
All contributed authors declare no potential conflict of interest with respect to authorship, research and/or publication of this paper.
References
- Adegboyega KO, Chen PC, Xiaohua H, El-Sayed IH, El-Sayed MA (2007) Peptide-Conjugated Gold Nanorods for Nuclear Targeting. Bioconjugate Chem 18:1490-1497. [CrossRef]
- Aliaga AE, Osorio-Roman I, Garrido C, Leyton P, Carcamo J, E. Clavijo E, Gomez-Jeria JS, Diaz FG, Campos-Vallette MM (2009) Surface enhanced Raman scattering study of L-lysine. Vibr. Spect. 50:131-135. [CrossRef]
- Aliaga AE, Garrido C, Leyton P, Diaz FG, Gomez-Jeria JS, Aguayo T, Clavillo E, Campos-Vallete MM, Sanchez-Cortes S (2010) SERS and theoretical studies of arginine. Spectrochem. Acta Part A 76:458-463. [CrossRef]
- Berendsen HJC, Postma JPM, van Gunsteren WF, Di Nola A, Haak, JR (1984) Molecular dynamics with coupling to an external bath. J Chem Phys 81:3684–3690. [CrossRef]
- Brancolini G, Kokh DB, Calzolai L, Wade RC, Corni S (2012) Docking of ubiquitin to gold nanoparticles. ACS Nano 6:9863-78. [CrossRef]
- Brewer SH, Glomm WR, Johnson MC (2005) Probing BSA binding to citrate-coated gold nanoparticles and surfaces. Langmuir 20:9303-7. [CrossRef]
- Carrillo-Vazquez JP, Correa-Basurto J, Garcia-Machorro J, Campos-Rodriguez R, Moreau V, Rosas-Trigueros JL, Reyes-Lopez CA, Rojas-Lopez M, Zamorano-Carrillo A (2015) A continuous peptide epitope reacting with pandemic influenza AH1N1 predicted by bioinformatic approaches. J Mol Recognition 28:553-564. [CrossRef]
- Chen YS, Hung YC, Lin WH, Huang GS (2010) Assessment of gold nanoparticles as a size-dependent vaccine carrier for enhancing the antibody response against synthetic foot-and-mouth disease virus peptide. Nanotechnology 21:195101. [CrossRef]
- Darden T, York D, Pedersen L (1993) Particle Mesh Ewald - An n.log(N) Method for Ewald Sums in large Systems. J Chem Phys 98: 10089–10092. [CrossRef]
- De la Fuente JM, Berry CC (2005) Tat Peptide as an Efficient Molecule To Translocate Gold Nanoparticles into the Cell Nucleus. Bioconjugate Chem 16:1176–1180. [CrossRef]
- El-Sayed IH, Huang X, El-Sayed MA (2005) Surface plasmon resonance scattering and absorption of anti-EGFR antibody conjugated gold nanoparticles in cancer diagnostics: applications in oral cancer. Nano Lett 5:829-34. [CrossRef]
- Haiss W, Thanh N, Aveyard J, Fernig DG (2007) Determination of size and concentration of gold nanoparticles from UV–Vis spectra. Anal Chem 79:4215–4221. [CrossRef]
- Hayat MA (1989) Colloidal Gold: Principles, Method and Application, Vol. 1. Academic Press Inc, New York.
- Hermanson G (2008) Bioconjugate Techniques 2nd ed.: Academic Press Elsevier, San Diego.
- Hess B, van der Vegt NF (2006) Hydration Thermodynamic Properties of Amino Acid Analogues: A Systematic Comparison of Biomolecular Force Fields and Water Models. J Phys Chem B 110:17616–17626. [CrossRef]
- Hess B, Bekker H, Berendsen HJ, Fraaije JG (1997) LINCS: a linear constraint solver for molecular simulations. J Comput Chem 18:1463-1472.
- Hoover WG (1985) Canonical dynamics: Equilibrium phase-space distributions. Phys Rev A 31:1695–1697. [CrossRef]
- Horisberger M. (1992) Colloidal gold and its application in cell biology. Int Rev Cytol 136: 227-287. [CrossRef]
- Iori F, Di Felice R. Molinari E, Corni S (2009) GolP: An Atomistic Force-Field to Describe the Interaction of Proteins with Au(111) Surfaces in Water. J Comput Chem 30:1465–1476. [CrossRef]
- Jennings T, Strouse G (2007) Past, present, and future of gold nanoparticles. Bio-Applications of Nanoparticles. Adv Exp Med Biol 620:34-47. [CrossRef]
- Jorgensen WL, Maxwell DS, TiradoRives J (1996) Development and Testing of the OPLS All-Atom Force Field on Conformational Energetics and Properties of Organic Liquids. J Am Chem Soc 118:11225–11236. [CrossRef]
- Kogan MJ, Olmedo I, Hosta L, Guerrero AR, Cruz LJ, Albericio F (2007) Peptides and metallic nanoparticles for biomedical applications. Nanomedicine 2:287–306. [CrossRef]
- Lévy R, Thanh NTK, Doty RC, Hussain I, Nichols RJ, Schiffrin DJ, Brust M (2004) Rational and combinatorial design of peptide capping ligands for gold nanoparticles. J Am Chem Soc 126:10076-10084. [CrossRef]
- Liu FM, Ren B, Yan JW, Mao BW, Tian ZQ (2002) Initial oxidation processes on hydrogenated silicon surfaces studied by in situ Raman spectroscopy. J Electrochem Soc 149:G95-G99. [CrossRef]
- McLean JA, Stumpo KA, Russell DH (2005) Size-selected (2-10 nm) gold nanoparticles for matrix assisted laser desorption ionization of peptides. J Am Chem Soc15:5304-5305. [CrossRef]
- Metropolis N, Rosenbluth AW, Rosenbluth MN, Teller AH, Teller E (1954) Equation of State Calculations by Fast Computing Machines, The Journal of Chemical Physics 21:1087-1092.
- Miyamoto S, Kollman PA (1992) Settle-An analytical version of the shake and rattle algorithm for rigid water models. J Comput Chem 13: 952–962. [CrossRef]
- Moreau V, Fleury C, Piquer D, Nguyen C, Novali N, Villard S, Laune D, Granier C, Molina F (2008) PEPOP: computational design of immunogenic peptides. BMC Bioinformatics 9: 71.
- Narambuena CF, Leiva EPM (2014) Monte Carlo Studies in Polyelectrolyte Solutions: Structure and Thermodynamics. In: Polyelectrolytes Thermodynamics and Rheology. 349-379.
- Norde, W (1986) Adsorption of proteins from solution at the solid–liquid interface. Adv Colloid Interface Sci 25: 267-340. [CrossRef]
- Oh E, Delehanty JB, Sapsford KE (2011) Cellular uptake and fate of PEGylated gold nanoparticles is dependent on both cell-penetration peptides and particle size. ACS Nano 8:6434–6448. [CrossRef]
- Parrinello M, Rahman A (1981) Polymorphic transitions in single crystals: A new molecular dynamics method. J Appl Phys 52:7182–7190. [CrossRef]
- Pronk S, Pall S, Schulz R, Larsson P, Bjelkmar P, Apostolov R, Shirts MR, Smith JC, Kasson PM, Van der Spoel D, Hess B, Lindahl E (2013) GROMACS 4.5: a highthroughput and highly parallel open source molecular simulation toolkit. Bioinformatics 29: 845-854. [CrossRef]
- Raman S, Machaidze G, Lustig A (2006) Structure-based design of peptides that self-assemble into regular polyhedral nanoparticles. Nanomedicine 2:95-102. [CrossRef]
- Ramezani F, Habibi M, Rafii-Tabar H, Amanlou M (2015) Effect of peptide length on the conjugation to the gold nanoparticle surface: a molecular dynamic study. Daru 23:9. [CrossRef]
- Rojas-López M, Orduña-Díaz A, Delgado-Macuil R, Gayou VL, Pérez-Blanco RE, Torres-Jacome A, Olvera-Hernández J (2006) Morphological transformation and kinetic analysis in the aluminum-mediated a-Si:H crystallization. J Non-Cryst Solids 352:281-284. [CrossRef]
- Rojas-López M, Orduña-Díaz A, Delgado-Macuil R, Gayou VL, Bibbins-Martínez M, Torres-Jácome A, Treviño-Palacios CG (2010) a-Si:H crystallization from isothermal annealing and its dependence on the substrate used. Mat Sci Engineering B 174:137–140.
- Shen Y, Maupetit J, Derreumaux P, Tufféry P (2014)Improved PEP-FOLD approach for peptide and miniprotein structure predictionJ Chem Theor Comput 10:4745-4758. [CrossRef]
- Slocik JM, Stone MO, Naik RR (2005) Synthesis of gold nanoparticles using multifunctional peptides. Small 11:1048-52. [CrossRef]
- Sonvico F, Dubernet C, Colombo P, Couvreur P (2005) Metallic colloid nanotechnology, applications in diagnosis and therapeutics. Curr Pharm Des 11:2091. [CrossRef]
- Teixeira AAR, Lund M, Barroso da Silva FL (2010) Fast Proton Titration Scheme for Multiscale Modeling of Protein Solutions J Chem Theory Comput 10:3259-3266. [CrossRef]
- Thévenet P, Shen Y, Maupetit J, Guyon F, Derreumaux P, Tufféry P (2012)PEP-FOLD: an updated de novo structure prediction server for both linear and disulfide bonded cyclic peptides. Nucleic Acids Res 40:288-293. [CrossRef]
- Tkachenko AG, Xie H, Coleman D, Glomm, W (2003) Multifunctional gold nanoparticle-peptide complexes for nuclear targeting. J Am Chem Soc 125:4700–4701. [CrossRef]
- Van der Spoel D, Lindahl E, Hess B, Groenhof G, Mark AE, Berendsen HJC (2005) GROMACS: Fast, Flexible, and Free. J Comput Chem 26:1701–1718. [CrossRef]
- Wang Z, Lévy R, Fernig DG, Brust M (2005) The peptide route to multifunctional gold nanoparticles. Bioconjug Chem 3:497-500. [CrossRef]
- Wangoo N, Bhasin KK, Mehta SK, Suri CR (2008). Synthesis and capping of water-dispersed gold nanoparticles by an amino acid: bioconjugation and binding studies. J Colloid Interface Sci 323:247-254. [CrossRef]
- Xu R, Ekiert DC, Krause JC, Rong H (2010) Structural basis of preexisting immunity to the 2009 H1N1 pandemic influenza virus. Science 5976:357-60. [CrossRef]
- Moreira-Alvarez B, Larraga-Urdaz AL, Fuentes-Cervantes A, Fernandez-Sánchez ML, Costa-Fernández JM, Encinar JR. AF4-UV/VIS-MALS-ICPMS/MS for the characterization of the different nanoparticulated species present in oligonucleotide-gold nanoparticle conjugates. Talanta. 2023 May 1;256:124309. doi: 10.1016/j.talanta.2023.124309. Epub 2023 Jan 26. PMID: 36753887. [CrossRef]
- Bereli N, Bakhshpour M, Topçu AA, Denizli A. Surface Plasmon Resonance-Based Immunosensor for Igm Detection with Gold Nanoparticles. Micromachines (Basel). 2021 Sep 10;12(9):1092. doi: 10.3390/mi12091092. PMID: 34577735; PMCID: PMC8468630. [CrossRef]
- Ma H, Zhang S, Yuan G, Liu Y, Cao X, Kong X, Wang Y. Surface-Enhanced Raman Spectroscopy (SERS) Activity of Gold Nanoparticles Prepared Using an Automated Loop Flow Reactor. Appl Spectrosc. 2023 Oct;77(10):1163-1172. doi: 10.1177/00037028231196907. Epub 2023 Aug 31. PMID: 37654053. [CrossRef]
- Madzharova F, Heiner Z, Kneipp J. Surface-Enhanced Hyper Raman Spectra of Aromatic Thiols on Gold and Silver Nanoparticles. J Phys Chem C Nanomater Interfaces. 2020 Mar 19;124(11):6233-6241. doi: 10.1021/acs.jpcc.0c00294. Epub 2020 Feb 25. PMID: 32395194; PMCID: PMC7208179. [CrossRef]
- Huang Y, Li P, Zhao R, Zhao L, Liu J, Peng S, Fu X, Wang X, Luo R, Wang R, Zhang Z. Silica nanoparticles: Biomedical applications and toxicity. Biomed Pharmacother. 2022 Jul;151:113053. doi: 10.1016/j.biopha.2022.113053. Epub 2022 May 17. PMID: 35594717. [CrossRef]
- Higino T, França R. Drug-delivery nanoparticles for bone-tissue and dental applications. Biomed Phys Eng Express. 2022 May 6;8(4). doi: 10.1088/2057-1976/ac682c. PMID: 35439740. [CrossRef]
- Analytical Chemistry 2018 90 (5), DOI: 10.1021/acv090i005_1172472. [CrossRef]
- Zorgi NE, Meireles LR, Oliveira DBL, Araujo DB, Durigon EL, Andrade Junior HF. Isolated specific IgA against respiratory viruses, Influenza or SARS-CoV-2, present in the saliva of a fraction of healthy and asymptomatic volunteers. Clinics (Sao Paulo). 2022 Jan-Dec;77:100105. doi: 10.1016/j.clinsp.2022.100105. Epub 2022 Sep 6. PMID: 36116267; PMCID: PMC9444893. [CrossRef]
- Kawai A, Yamamoto Y, Nogimori T, Takeshita K, Yamamoto T, Yoshioka Y. The Potential of Neuraminidase as an Antigen for Nasal Vaccines To Increase Cross-Protection against Influenza Viruses. J Virol. 2021 Sep 27;95(20):e0118021. doi: 10.1128/JVI.01180-21. Epub 2021 Aug 11. PMID: 34379511; PMCID: PMC8475506. [CrossRef]
- Salazar-González JA, González-Ortega O, Rosales-Mendoza S. Gold nanoparticles and vaccine development. Expert Rev Vaccines. 2015;14(9):1197-211. doi: 10.1586/14760584.2015.1064772. Epub 2015 Jul 7. PMID: 26152550. [CrossRef]
- Tao W, Hurst BL, Shakya AK, Uddin MJ, Ingrole RS, Hernandez-Sanabria M, Arya RP, Bimler L, Paust S, Tarbet EB, Gill HS. Consensus M2e peptide conjugated to gold nanoparticles confers protection against H1N1, H3N2 and H5N1 influenza A viruses. Antiviral Res. 2017 May;141:62-72. doi: 10.1016/j.antiviral.2017.01.021. Epub 2017 Feb 2. PMID: 28161578; PMCID: PMC5572660. [CrossRef]
- Wang C, Zhu W, Wang BZ. Dual-linker gold nanoparticles as adjuvanting carriers for multivalent display of recombinant influenza hemagglutinin trimers and flagellin improve the immunological responses in vivo and in vitro. Int J Nanomedicine. 2017 Jul 4;12:4747-4762. doi: 10.2147/IJN.S137222. PMID: 28740382; PMCID: PMC5503497. [CrossRef]
Figure 1.
UV/VIS spectra of AuNPs (control) synthesized and used in this work. Parameters A450 and ASPR were used to estimate the particle size according to the model proposed by Haiss et al., 2007. Charge of P (Z peptide and Z residue) at different pH. a) total charge of the P b) Charge of the component residues of the peptide.
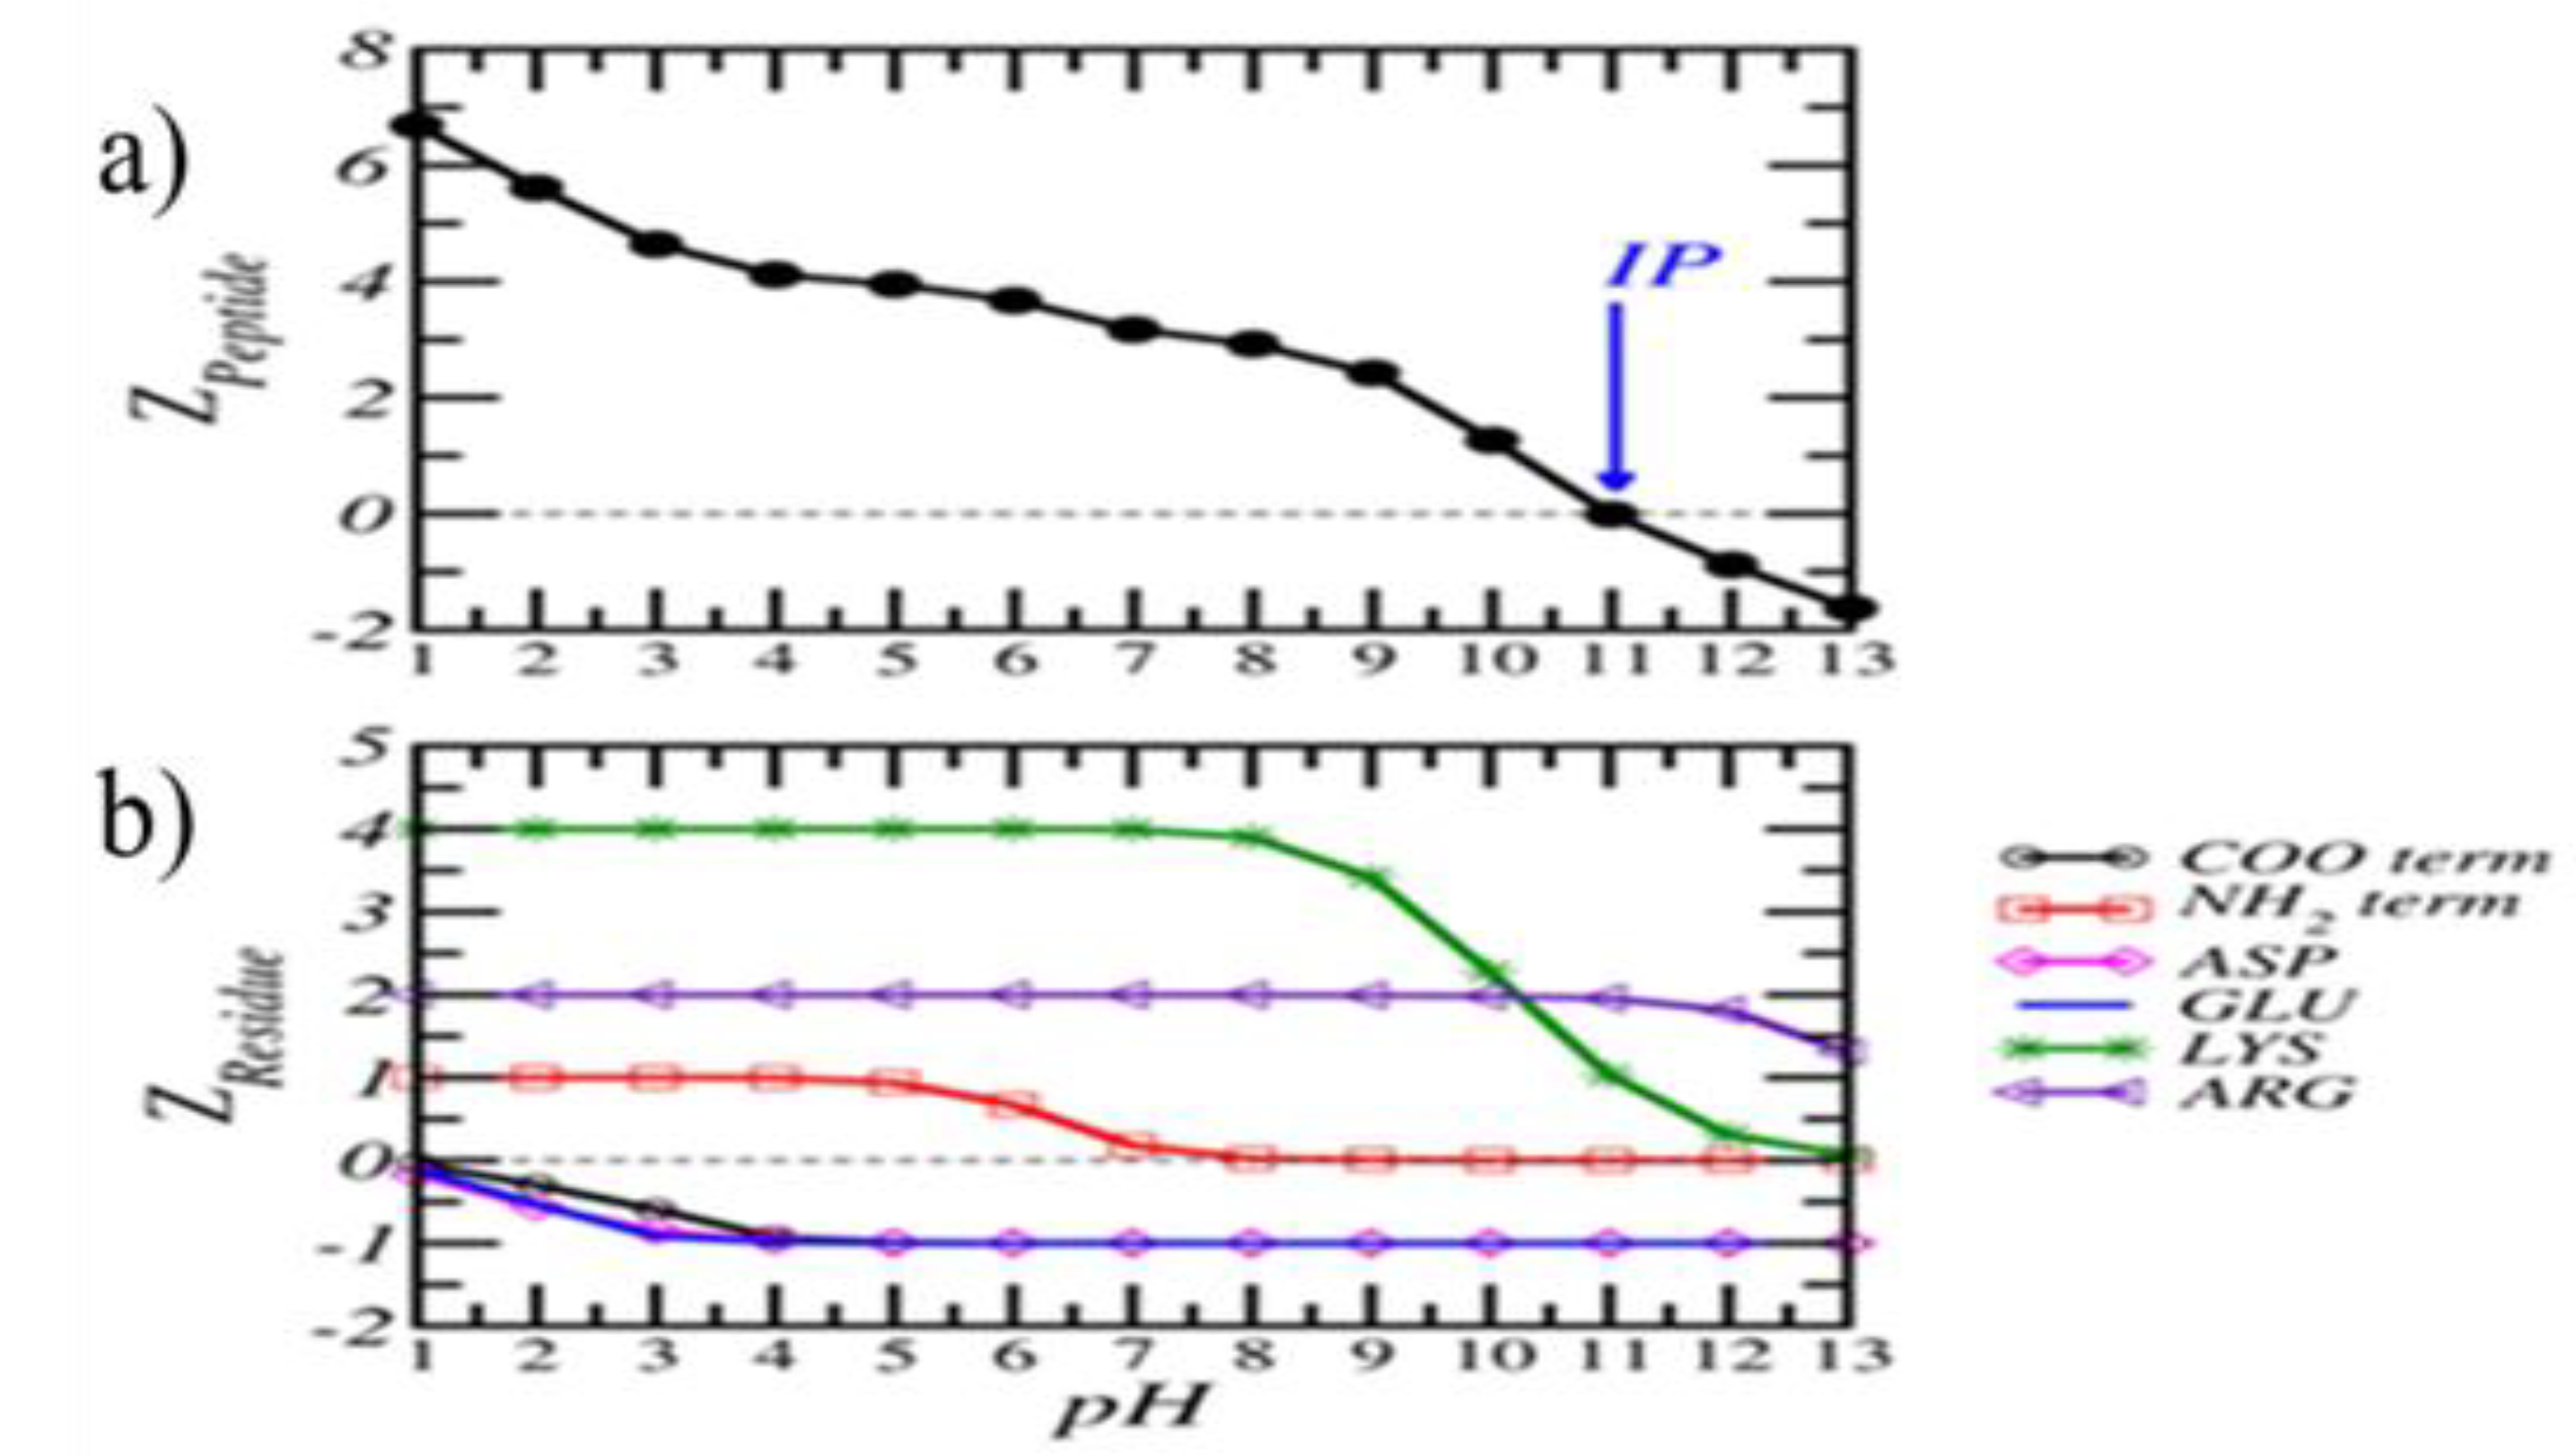
Figure 2.
A) UV/VIS spectra of AuNPs (control) and AuNP-P complex with P at 0.1 – 1.0 µg/mL. Parameters A450 and ASPR were used to estimate the particle size according to the model proposed by Haiss et al., 2007. B) UV/VIS spectra of the AuNP-P complex with P at 0.1 to 1.0 µg/mL 3) C) First derivative of UV/VIS spectra of AuNP-P complex with P at 0.1 to 1.0 µg/mL which are pH dependence of the P charges (Zpeptide and ZResidue) in solution.
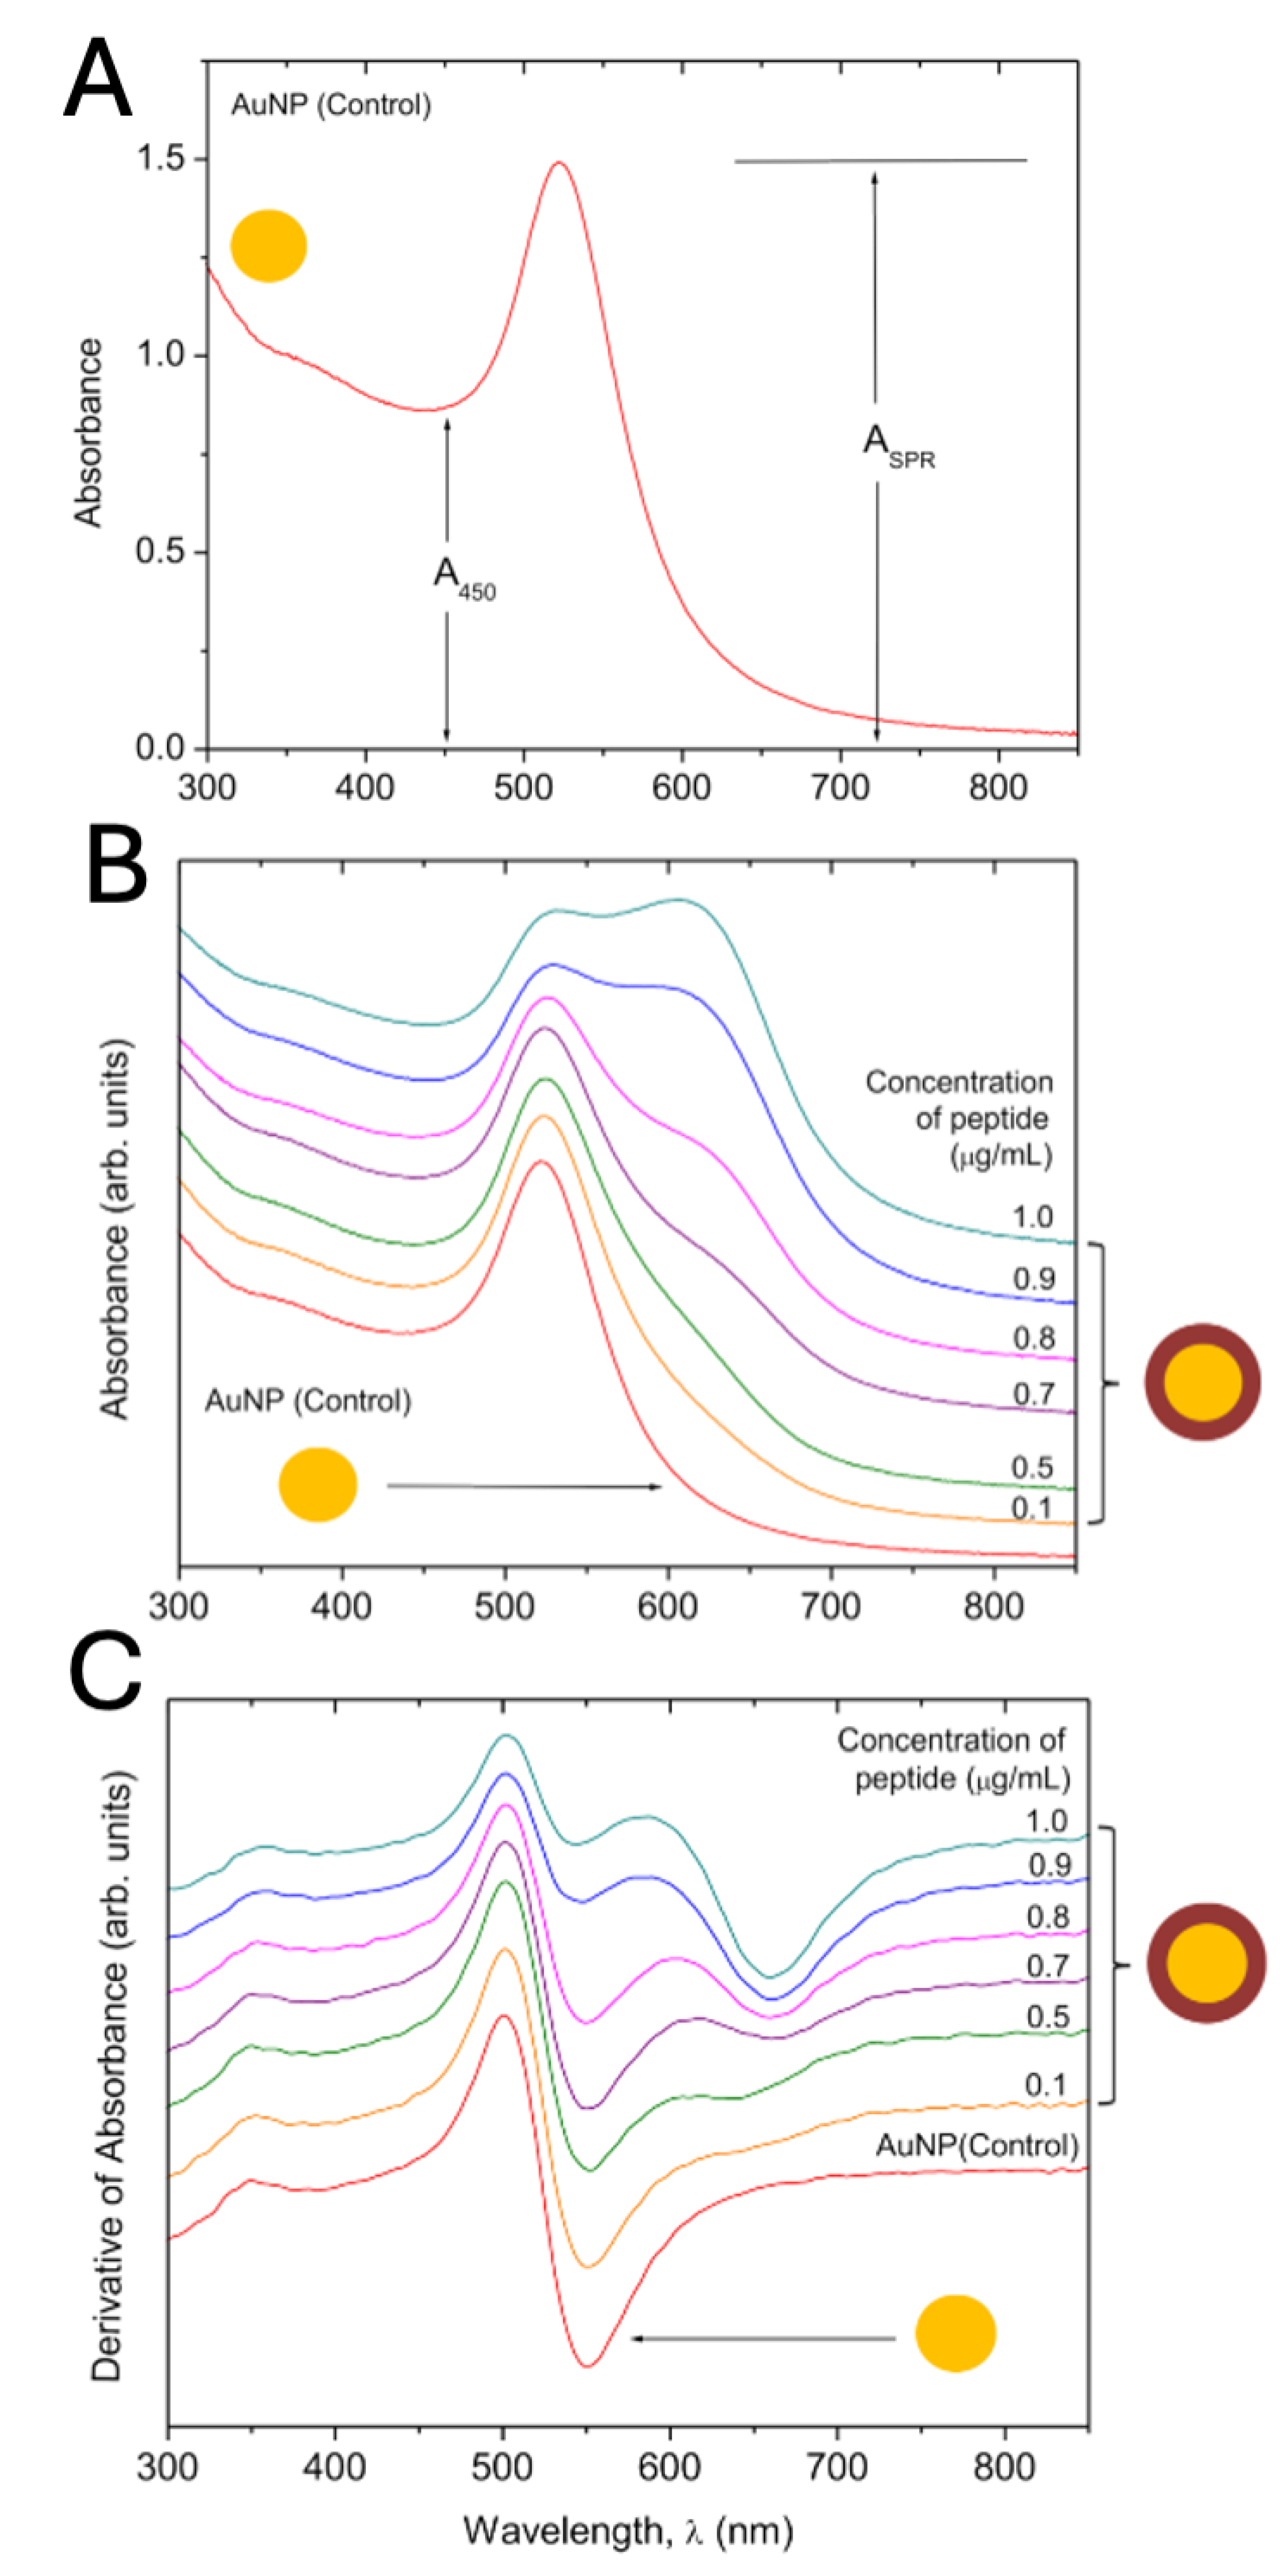
Figure 3.
SERS spectra of AuNP-peptide conjugate at several peptide concentrations (from 0.1 to 1.0 µg/mL).
Figure 3.
SERS spectra of AuNP-peptide conjugate at several peptide concentrations (from 0.1 to 1.0 µg/mL).
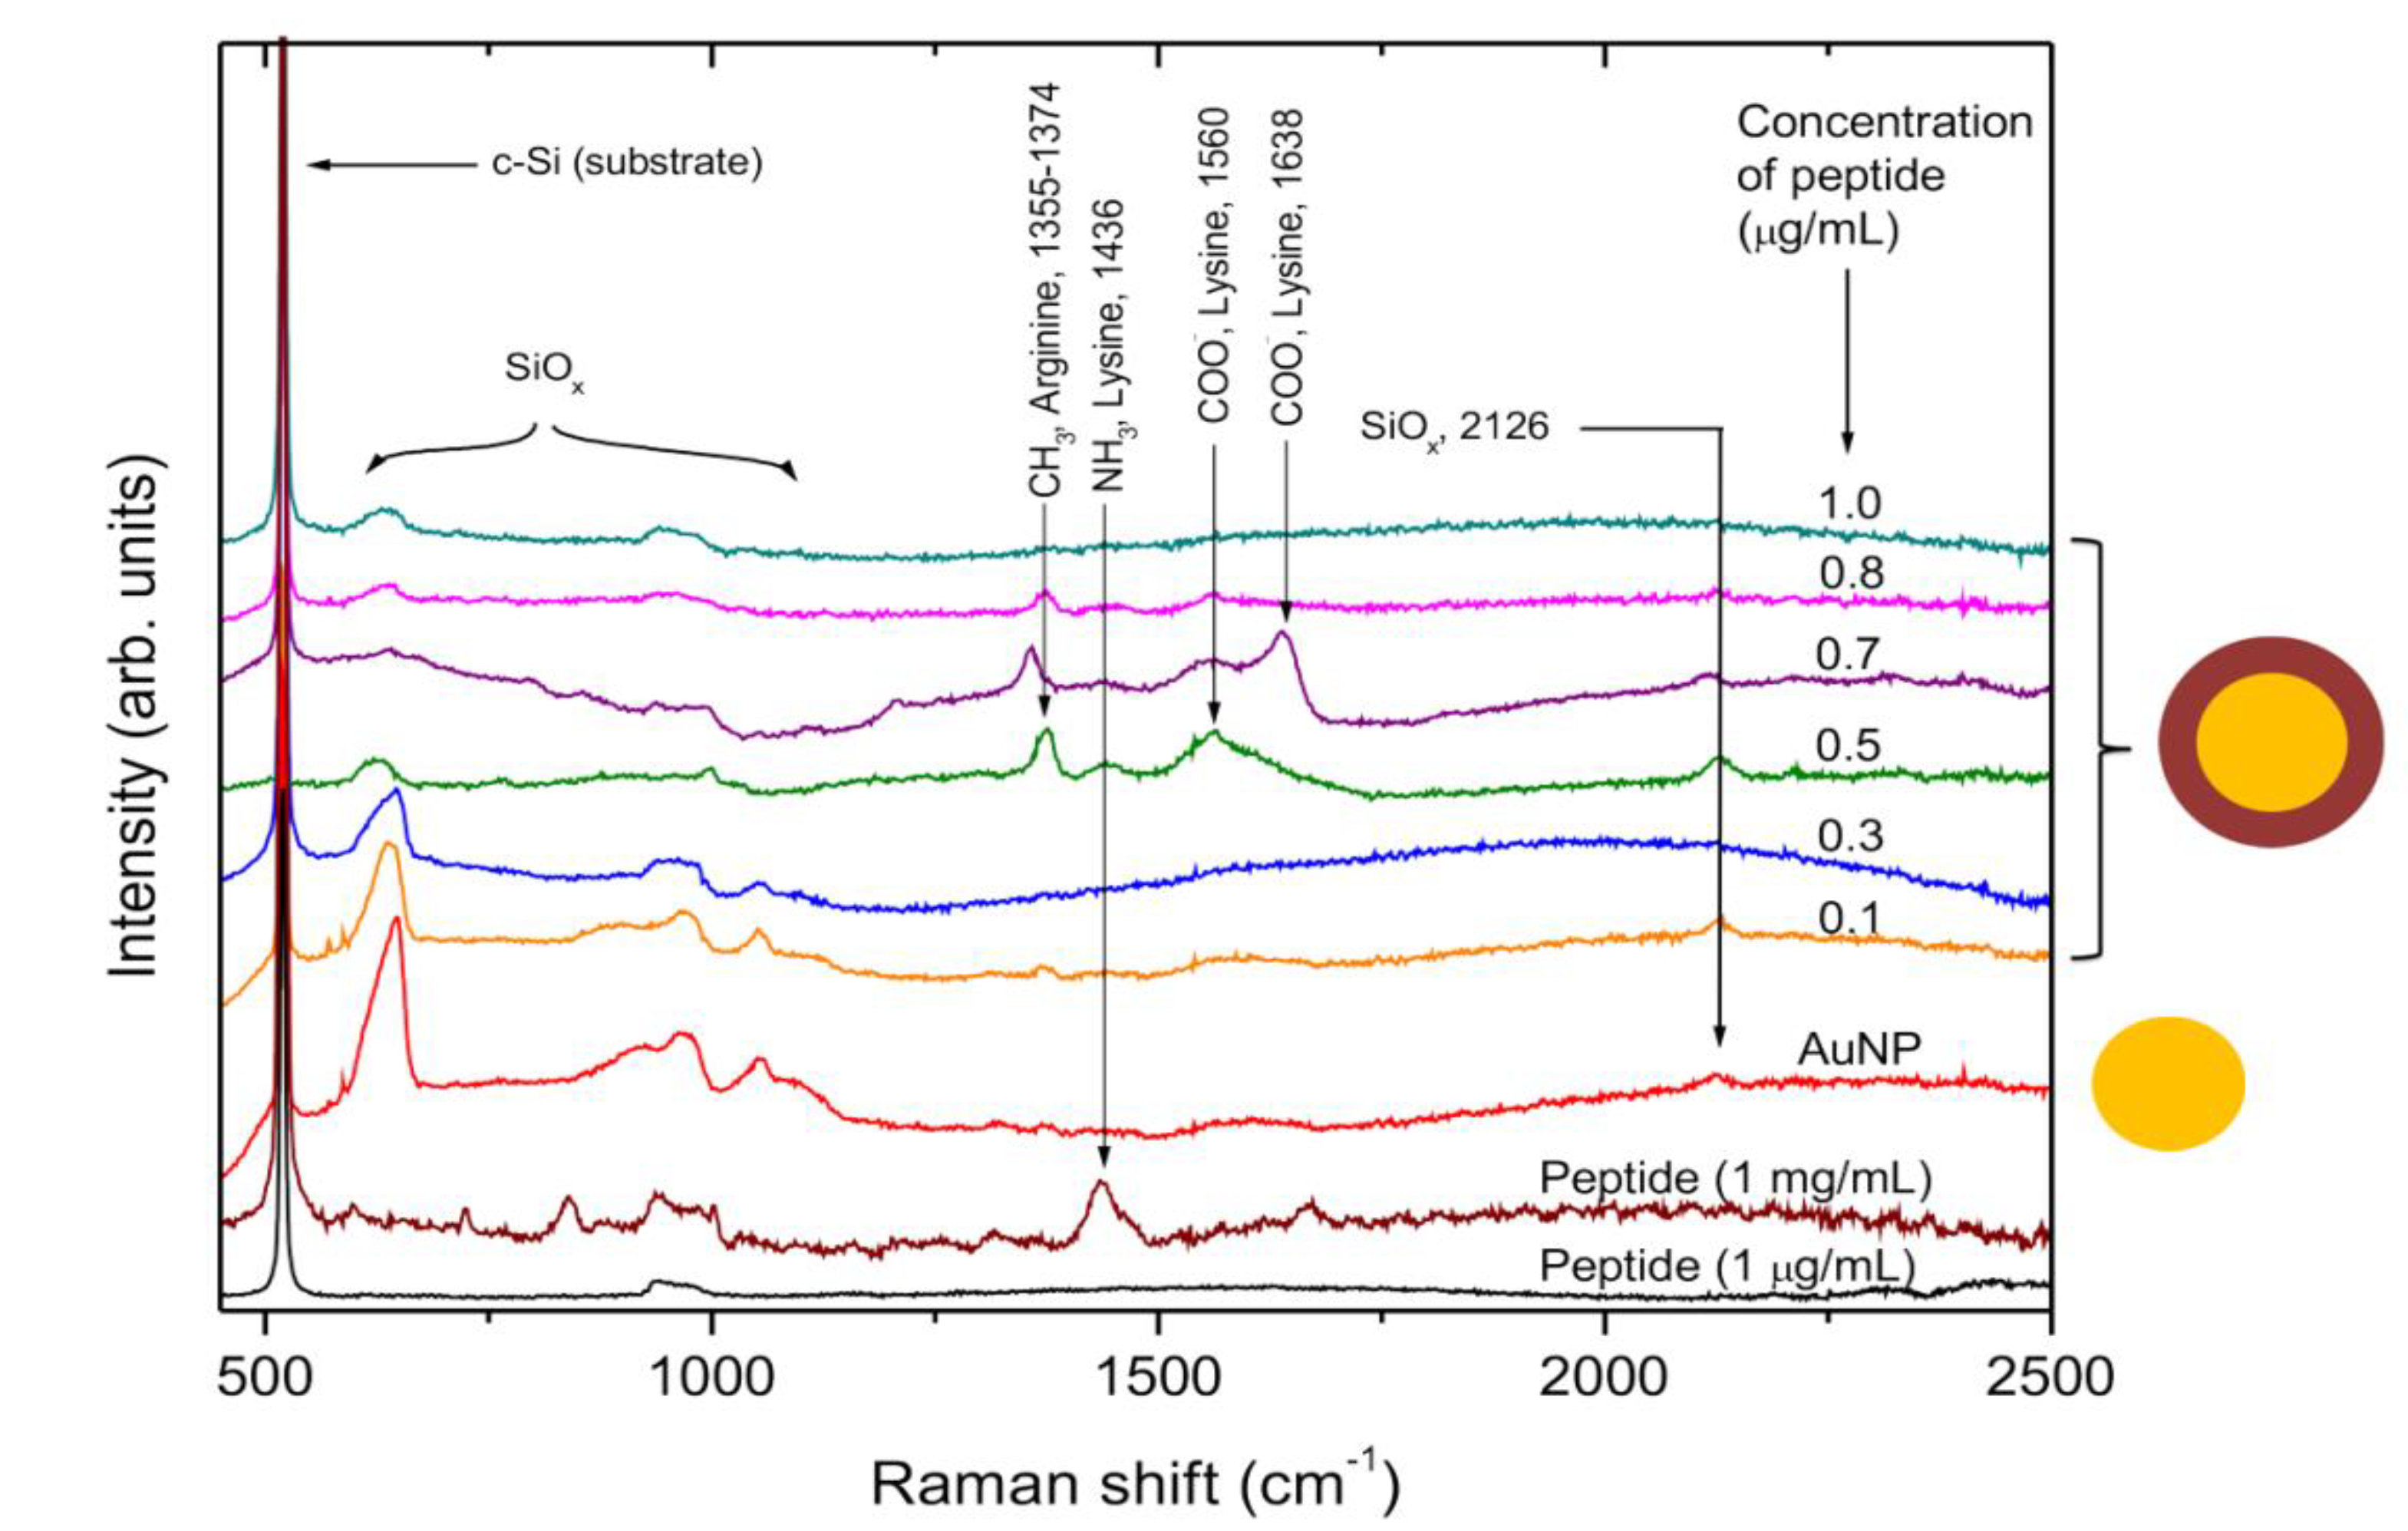
Figure 4.
TEM of AuNPs and AuNP-P complex. A) AuNP B) Zoom AuNp C) AuNP-Pe complex, P at 0.5 µg/mL D) and E) Zoom of AuNP-P complex with P at 0.5 µg/mL F) AuNP-P complex after 10 months, P at 0.5 µg/mL G) Zoom of the AuNP-P complex after 10 months, P at 0.5 µg/mL.
Figure 4.
TEM of AuNPs and AuNP-P complex. A) AuNP B) Zoom AuNp C) AuNP-Pe complex, P at 0.5 µg/mL D) and E) Zoom of AuNP-P complex with P at 0.5 µg/mL F) AuNP-P complex after 10 months, P at 0.5 µg/mL G) Zoom of the AuNP-P complex after 10 months, P at 0.5 µg/mL.
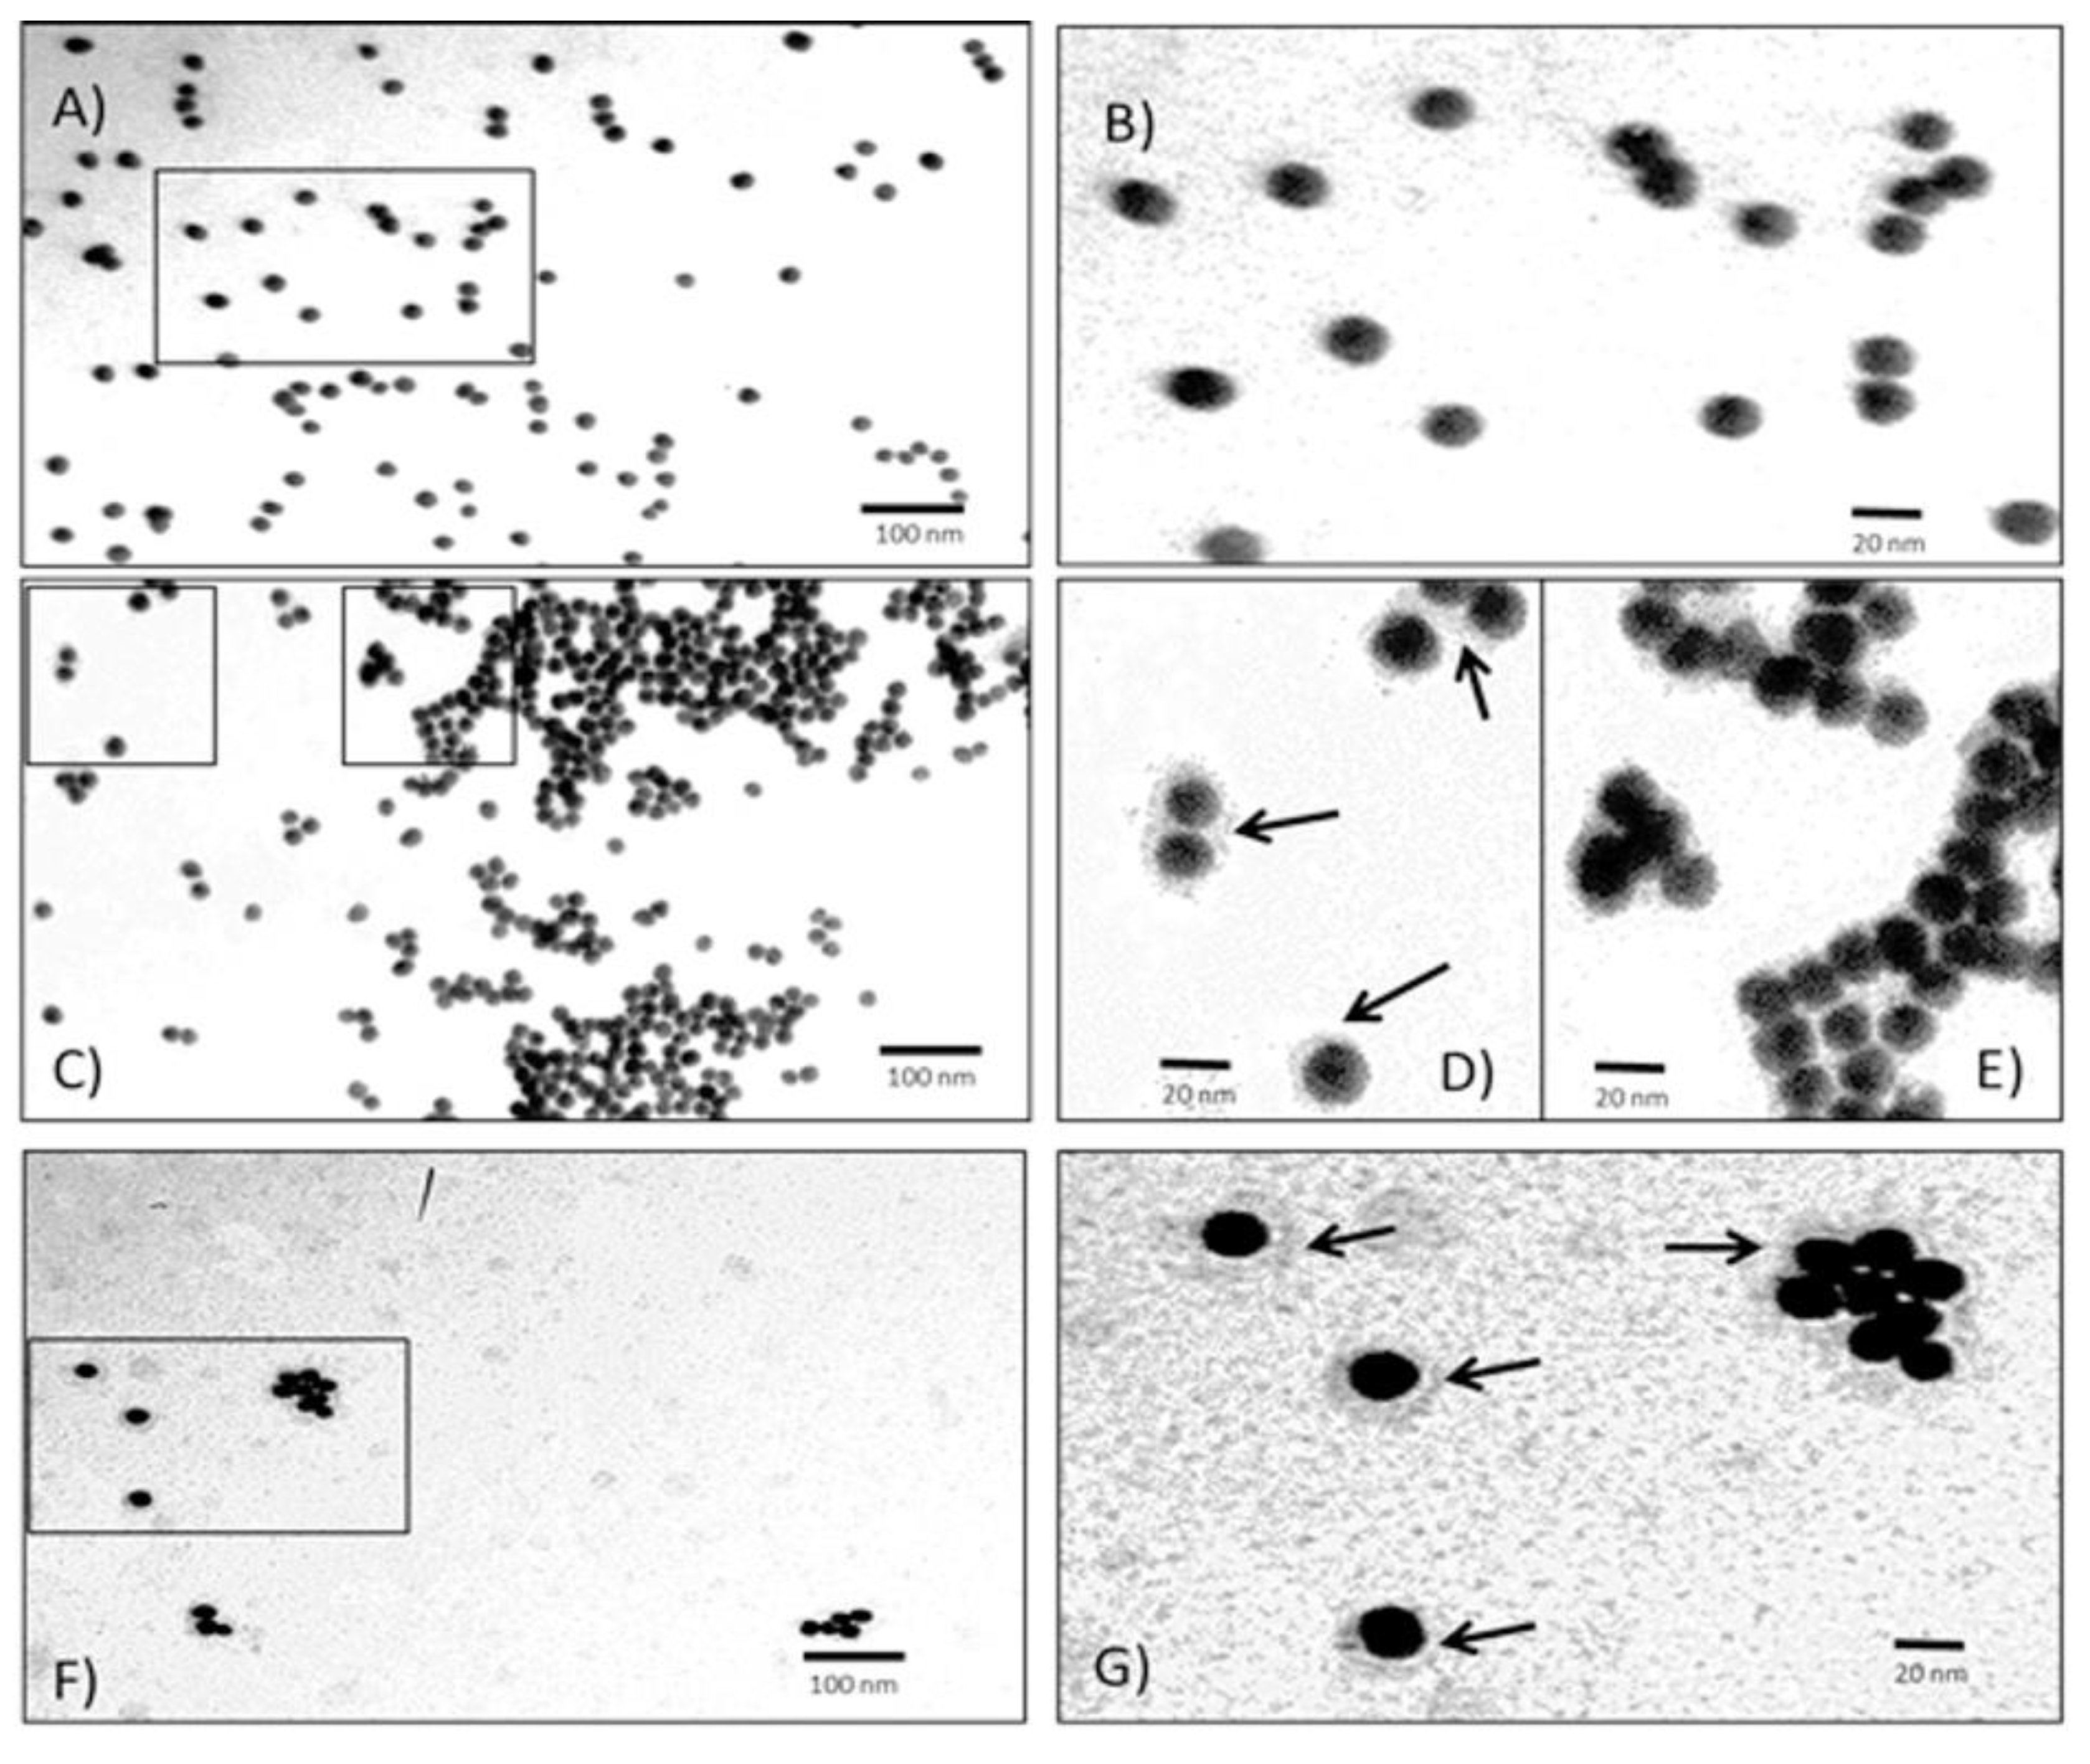
Figure 5.
3D structure from the final conformations of the MD simulation which depict the adsorption of P on AuNP (1 1 1).
Figure 5.
3D structure from the final conformations of the MD simulation which depict the adsorption of P on AuNP (1 1 1).
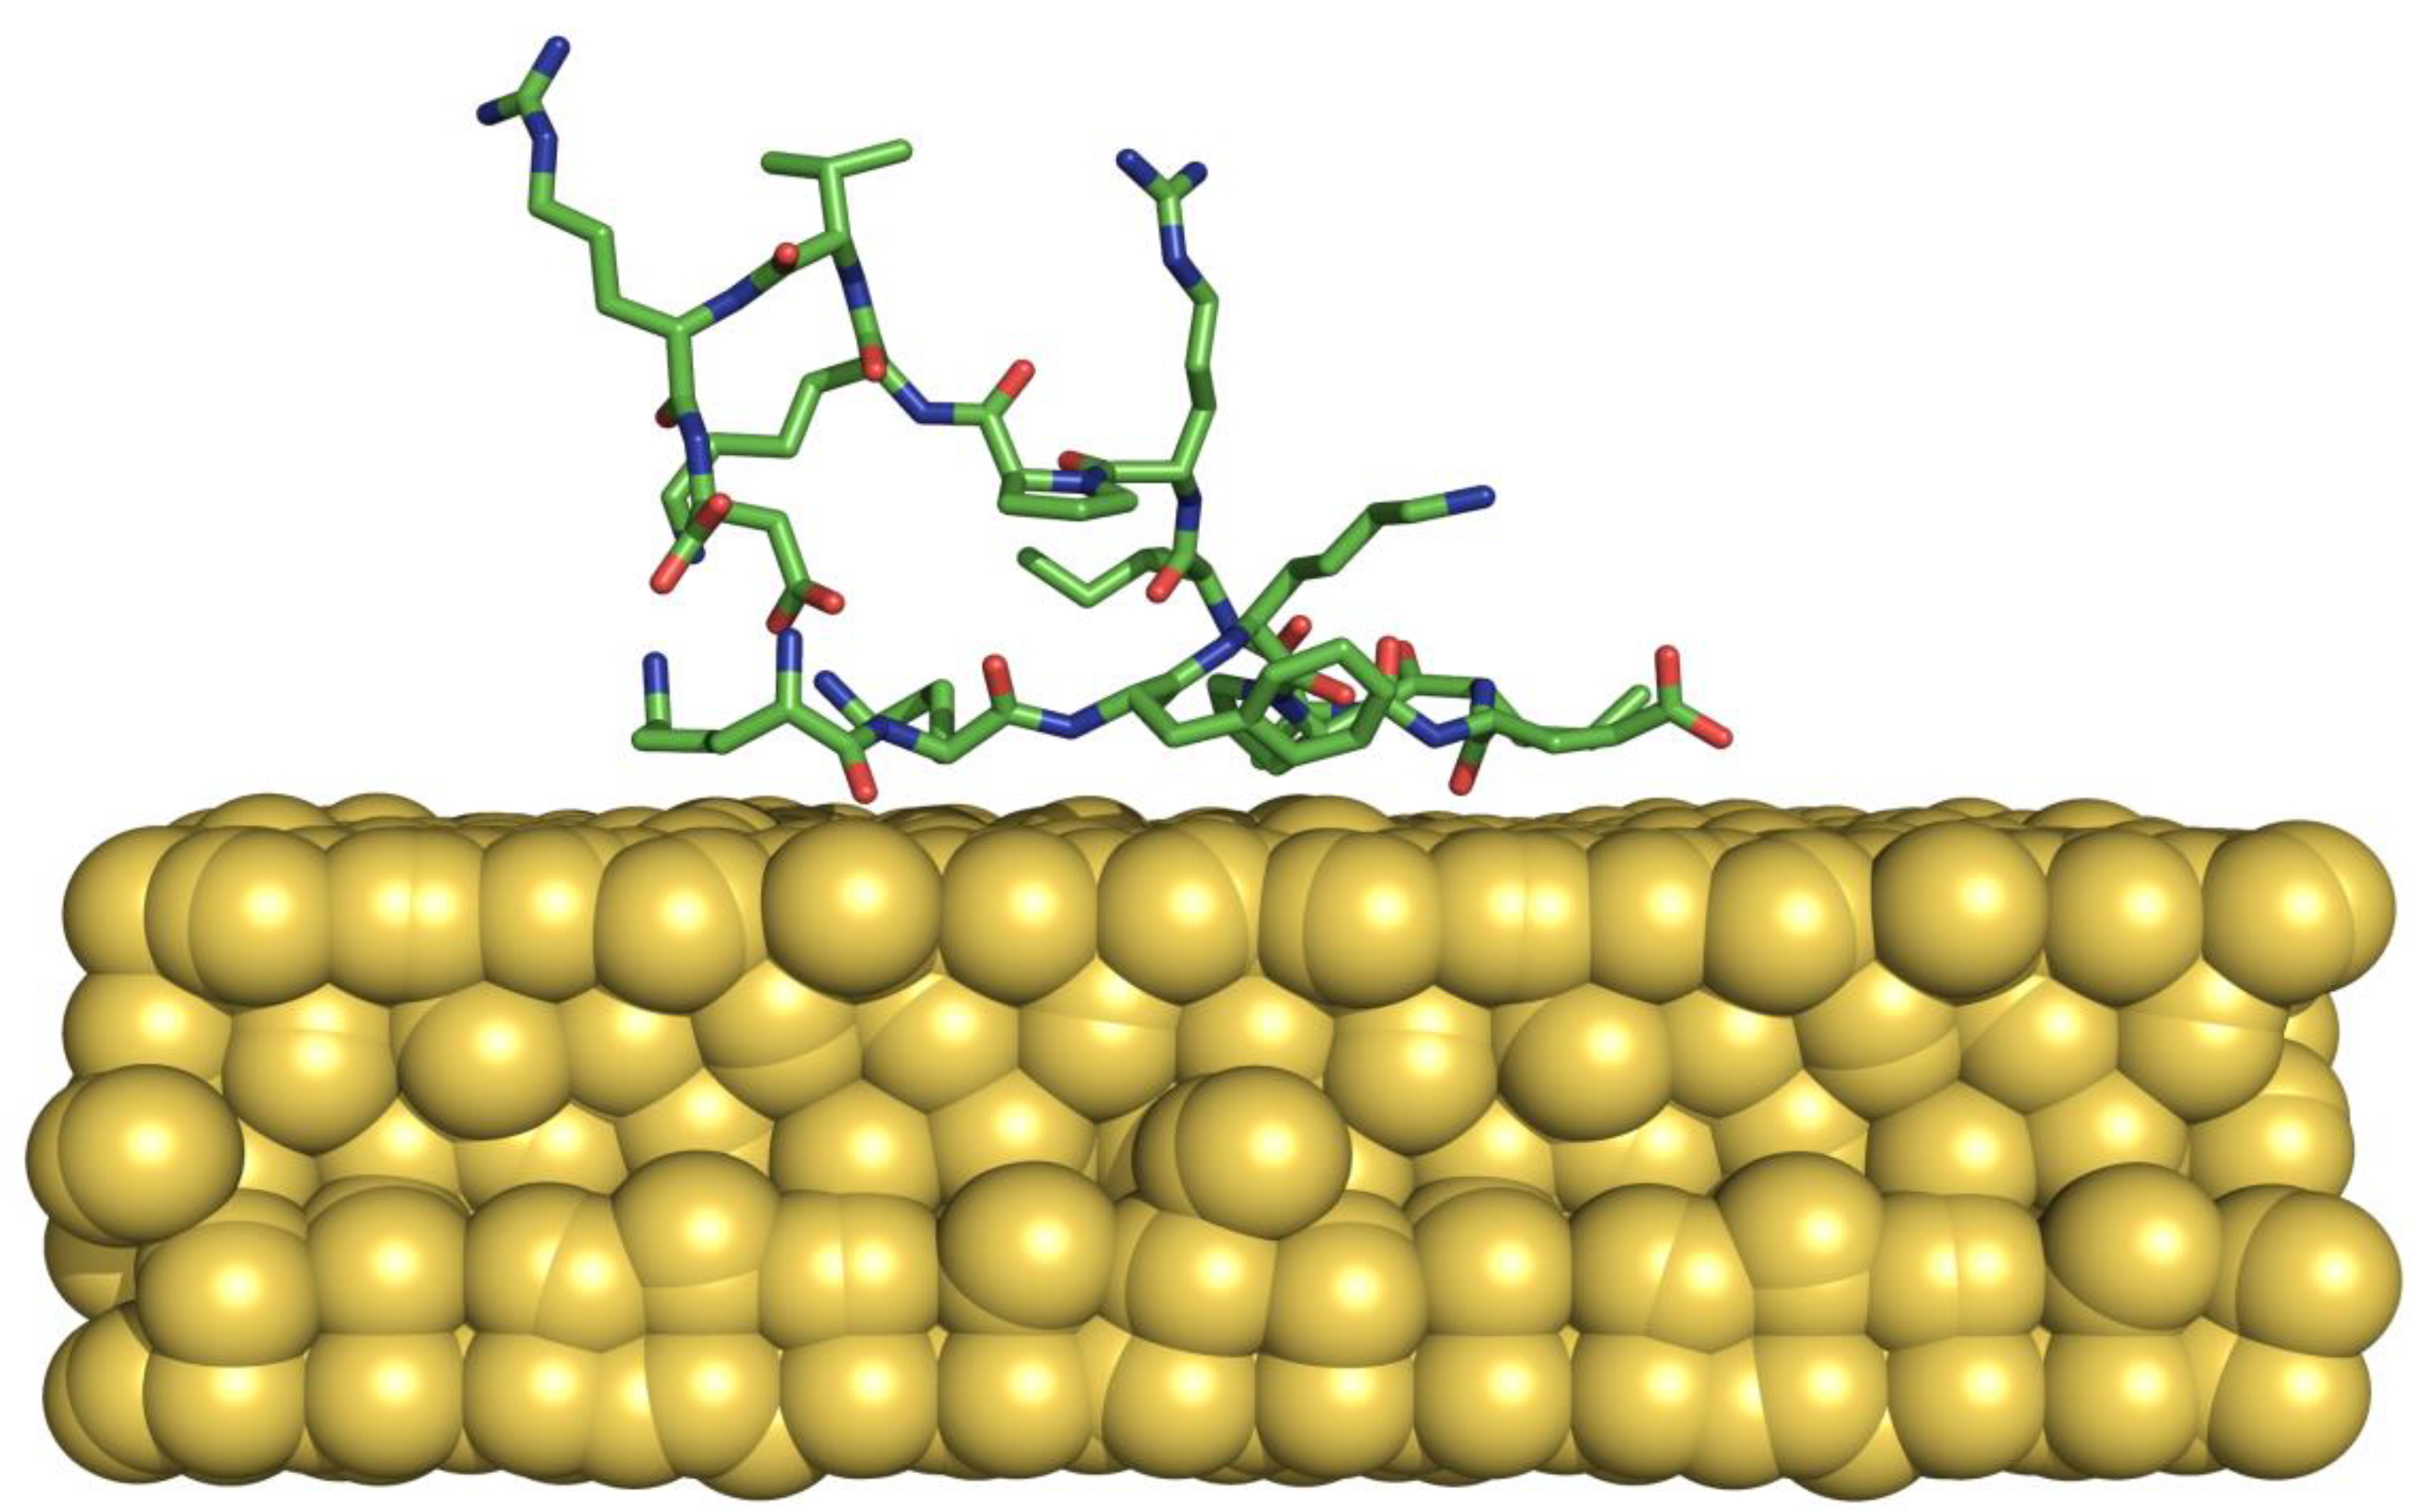
Figure 6.
IgG and IgA levels of mice immunized with AuNPs, P (A) or AuNPs-P complex (A+Au) A) IgG from serum B) IgA in nasal washes. ***Indicates significant difference of p <0.001 and ns no significant difference.
Figure 6.
IgG and IgA levels of mice immunized with AuNPs, P (A) or AuNPs-P complex (A+Au) A) IgG from serum B) IgA in nasal washes. ***Indicates significant difference of p <0.001 and ns no significant difference.
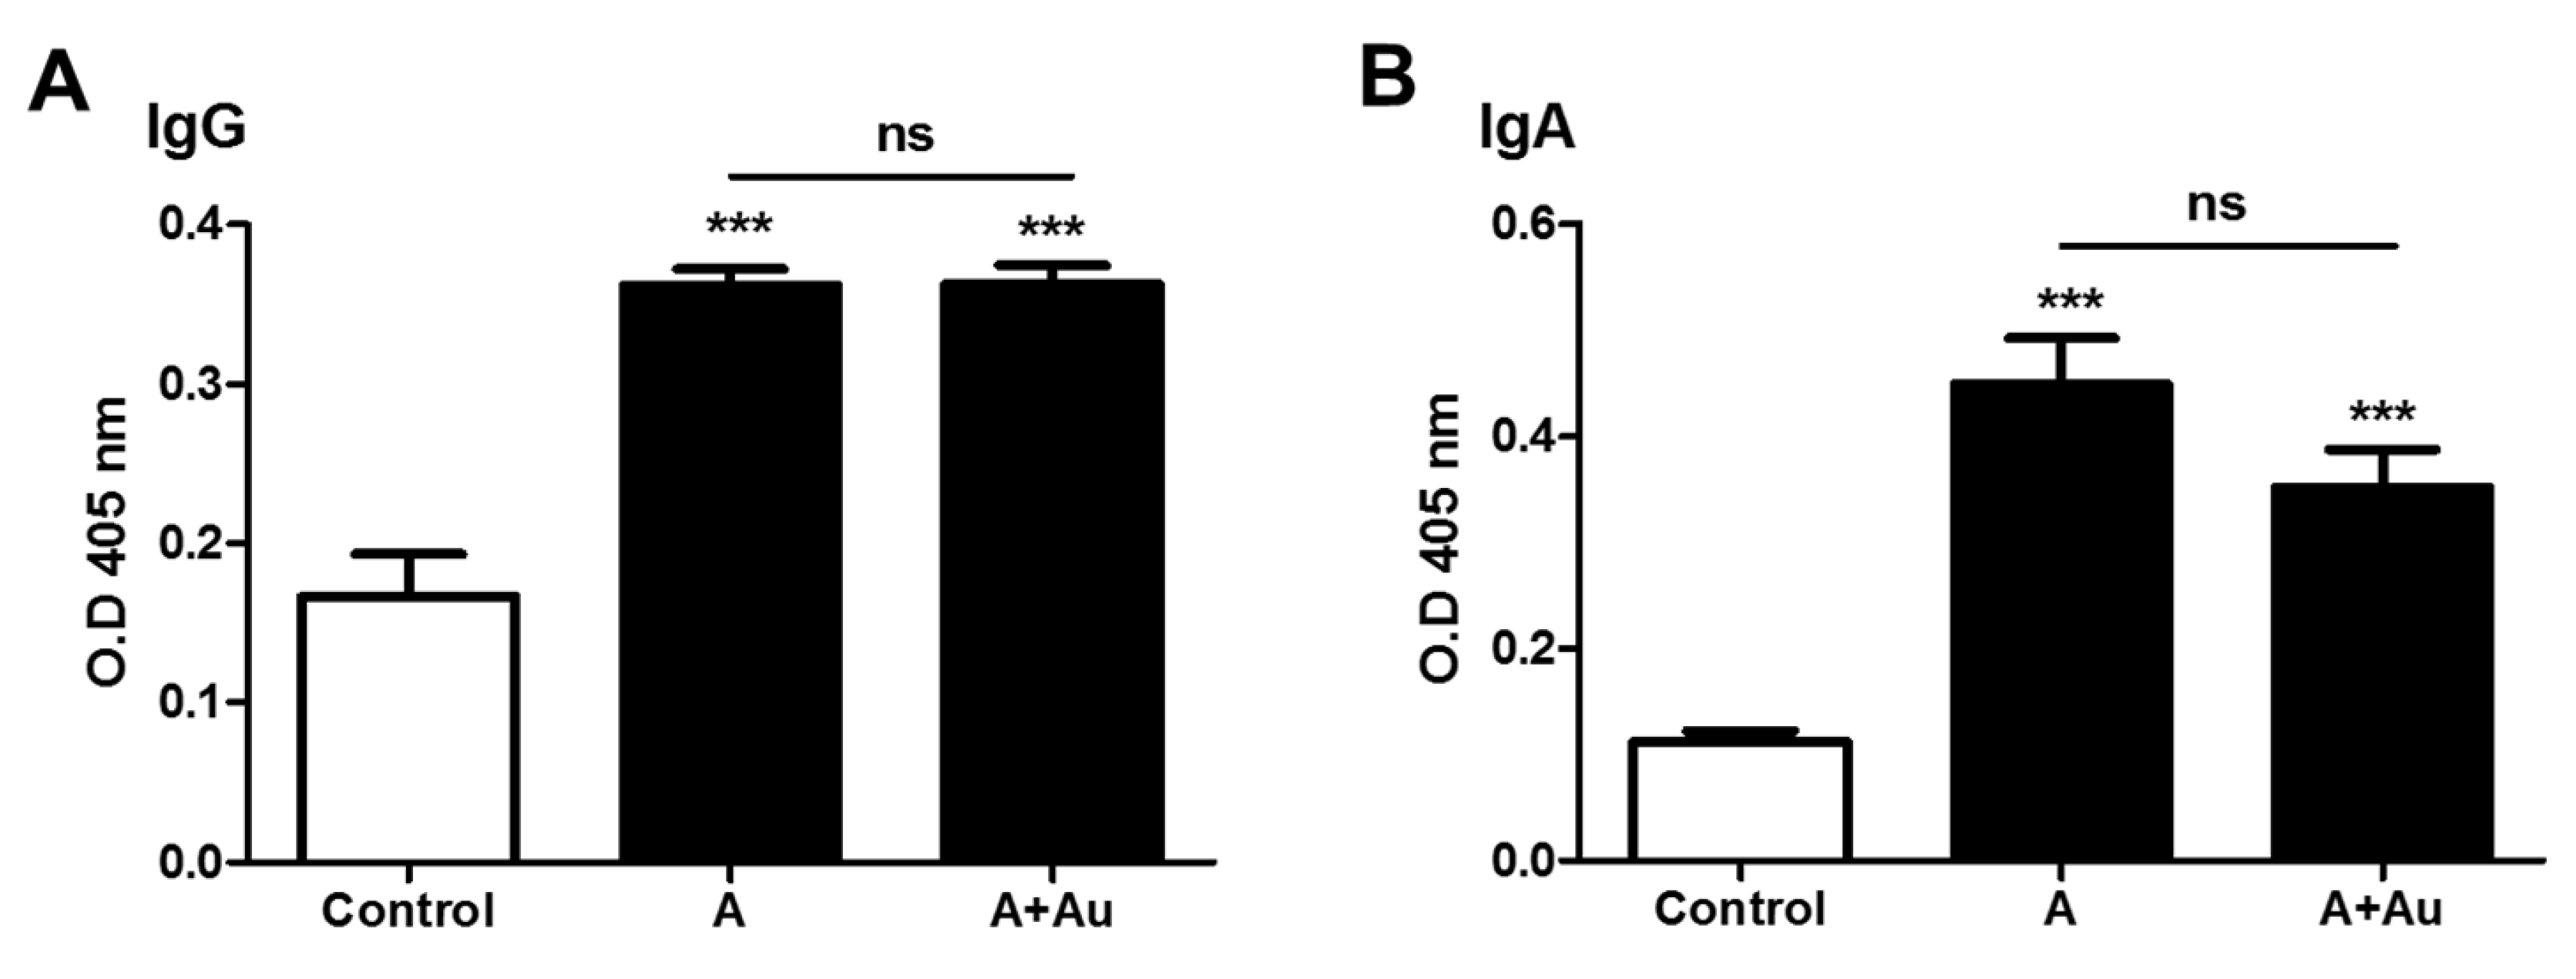

Table 1.
Geometrical parameters of P adsorbed on AuNP and map of residues of the conjugated system.
| Run | RG (nm) | SASA (nm2) | Contact Residues |
|---|---|---|---|
| Run 1 | 0.81± 0.02 | 16.8 ± 0.70 | Lys1, Lys2, Phe3, Pro5, Glu6, Ile7, Ala8 |
| Run 2 | 0.85 ± 0.03 | 16.4 ± 0.83 | Phe3, Pro5, Glu6, Ile9, Arg10, Pro11, Lys12, Arg15 |
| Run 3 | 0.83 ± 0.03 | 16.4 ± 0.83 | Lys2, Phe3, Lys4, Pro5, Ile7, Ile9 |
| Run 4 | 0.82 ± 0.01 | 16.8 ± 0.72 | Lys1, Lys2, Phe3, Pro5, Glu6, Ala8, Ile9, Pro11 |
| Run 5 | 0.79±0.020 | 15.9 ± 0.80 | Phe3, Pro5, Ile7, Ile9, Pro11, Lys12, Val13 |
Disclaimer/Publisher’s Note: The statements, opinions and data contained in all publications are solely those of the individual author(s) and contributor(s) and not of MDPI and/or the editor(s). MDPI and/or the editor(s) disclaim responsibility for any injury to people or property resulting from any ideas, methods, instructions or products referred to in the content. |
© 2024 by the authors. Licensee MDPI, Basel, Switzerland. This article is an open access article distributed under the terms and conditions of the Creative Commons Attribution (CC BY) license (http://creativecommons.org/licenses/by/4.0/).
Copyright: This open access article is published under a Creative Commons CC BY 4.0 license, which permit the free download, distribution, and reuse, provided that the author and preprint are cited in any reuse.


