1. Introduction
Most of agronomic traits of interest to breeders are quantitative and polygenic, that is, they are governed by many genes of small effect [
1]. Genome-wide association studies (GWAS) are a leading approach for complex trait dissection and identification of genomic segments or superior alleles that underlie phenotypic variation, that can be used for breeding [
2].
The first studies on GWAS marked a significant advancement in genetics by enabling researchers to identify genetic variants associated with complex traits and diseases across the entire genome [
3,
4]. Subsequently, multi-trait models showed that the power to detect QTLs increases [
5,
6,
7]. Bolormaa et al. [
8], reported in dairy cattle that the multivariate analyses uncovered SNP associations that were not discovered by the univariate analyses and that the benefit of a multiple-trait analysis increased if the traits were highly correlated. Cappa et al. [
7], showed in lodgepole pine that multitrait GWAS provided a substantial increment in the number of significant SNP markers identified and in the potential of identifying pleiotropic effects of individual genes, confirming the statistical power of these models.
Many methods are being developed in GWAS, and a commonly used approach involves converting genomic breeding values from GBLUP into estimated marker effects through a linear transformation, as described by [
9]. One limitation of this method is that it only includes phenotypes of genotyped individuals. Particularly in tree breeding populations, but also in crops and livestock populations, only a fraction of individuals are genotyped. Thus, the GBLUP methods were extended to include the information of non-genotyped individuals in prediction analysis, which is known as single-step genomic best linear unbiased prediction (ssGBLUP) [
10,
65]. Applying this method, marker effects, variance explained by segments and the p-values associated are estimated simultaneously for all markers while accounting for population structure using the pedigree and genomic relationship for all individuals in the population [
12,
13]. This methodology is based on an infinitesimal model, which assumes equal variance for all single nucleotide polymorphism (SNP) marker-QTL (Quantative Trait loci) associated effects, resulting in an identical genomic relationship matrix for all traits within a population [
10].
Several models are used to test the significance of single nucleotide polymorphism (SNP) effects [
14], as is the case with EMMAX (Efficient Mixed-Model Association eXpedited). This method fits a mixed model to account for relatedness and population structure while testing SNP associations [
15]. However, SNPs within a genomic segment can be highly correlated with each other and jointly influence the phenotype, which makes the effect of a single SNP difficult to be identified [
16]. Therefore, GWAS based on testing genomic windows have been proposed to overcome this problem with the use of Bayesian approaches, which include all marker effects simultaneously [
13,
17]. The advantages of using windows of consecutive SNPs can capture the effect of a QTL better than a single SNP, particularly due that SNPs may be in linkage disequilibrium (LD) with a QTL and are useful to discriminate important effects from statistical noise [
18,
19]. Several works used windows of different size [
8,
13,
20] but the optimal window size may also be a function of effective population size [
21].Fragomeni et al. [
22], identified windows of 20 SNP that explained major portions of genetic variance for growth in chicken and showed small individual SNP variances, with just a few SNPs explaining more than 0.5% of the total variance. Sigdel et al. [
23] following a Single-step genomic BLUP methodology utilized windows of 2.0 Mb SNP to identify genomic regions and putative candidate genes implicated in milk production under thermoneutral and heat stress conditions and founded genomic regions that explained between 0.6% up to 5.7% of the total variance explained.
In tree breeding, most GWAS models have been applied for quantitative traits, such as volume, categorical traits like forkings, survival, stem straightness, are also analyzed as quantitative traits with or without transformation [
24,
25], but due to the lack of specific analysis tools, methods designed for binary and quantitative traits have been used to analyze categorical data, which is inappropriate and can result in erroneous results [
26]. Wright [
27] developed the threshold concept to map a normally distributed underlying variable to the observed ordered categorical phenotypes. Gianola and Foulley [
28] developed the threshold mixed effects model, which has become popular for pedigree-based genetic evaluation of ordinal categorical traits. Misztal et al. [
29] affirm that threshold models have been applied in animal breeding for traits with categorical data.
In this study, the aim was to identify genomic regions associated with quantitative traits (growth) and categorical traits (heteroblasty) in a multitrait threshold linear model using the single-step GWAS methodology in a tree breeding population of Eucalyptus globulus.
2. Materials and Methods
2.1. Study Population
The study population belongs to the E. globulus tree improvement program of INIA Uruguay. It consists of parents and six progeny tests. The parents consists of two seed orchards that include parents of six progeny test. The two seed orchards that include parents and no selected tree were installed in 1996 at a first generation, and a second generation installed in 2002.
2.2. Phenotypic Information
The phenotypic information comes from progeny tests installed in typical
E. globulus plantation areas in southeastern Uruguay, in the departments of Lavalleja and Rocha. The first progeny test is composed by half-sib families, represented by 3853 individuals belonging to 194 open pollinated families (OP), installed in 2011 (see more details in Quezada et al. [
30]). The other five progeny tests are composed of full-sib families, represented by 6051 individuals belonging to 137 controlled mattings (CM), installed between 2015 and 2019 (
Table 1). The OP comes mainly from the first generation seed orchard and the CM from the second generation seed orchard.
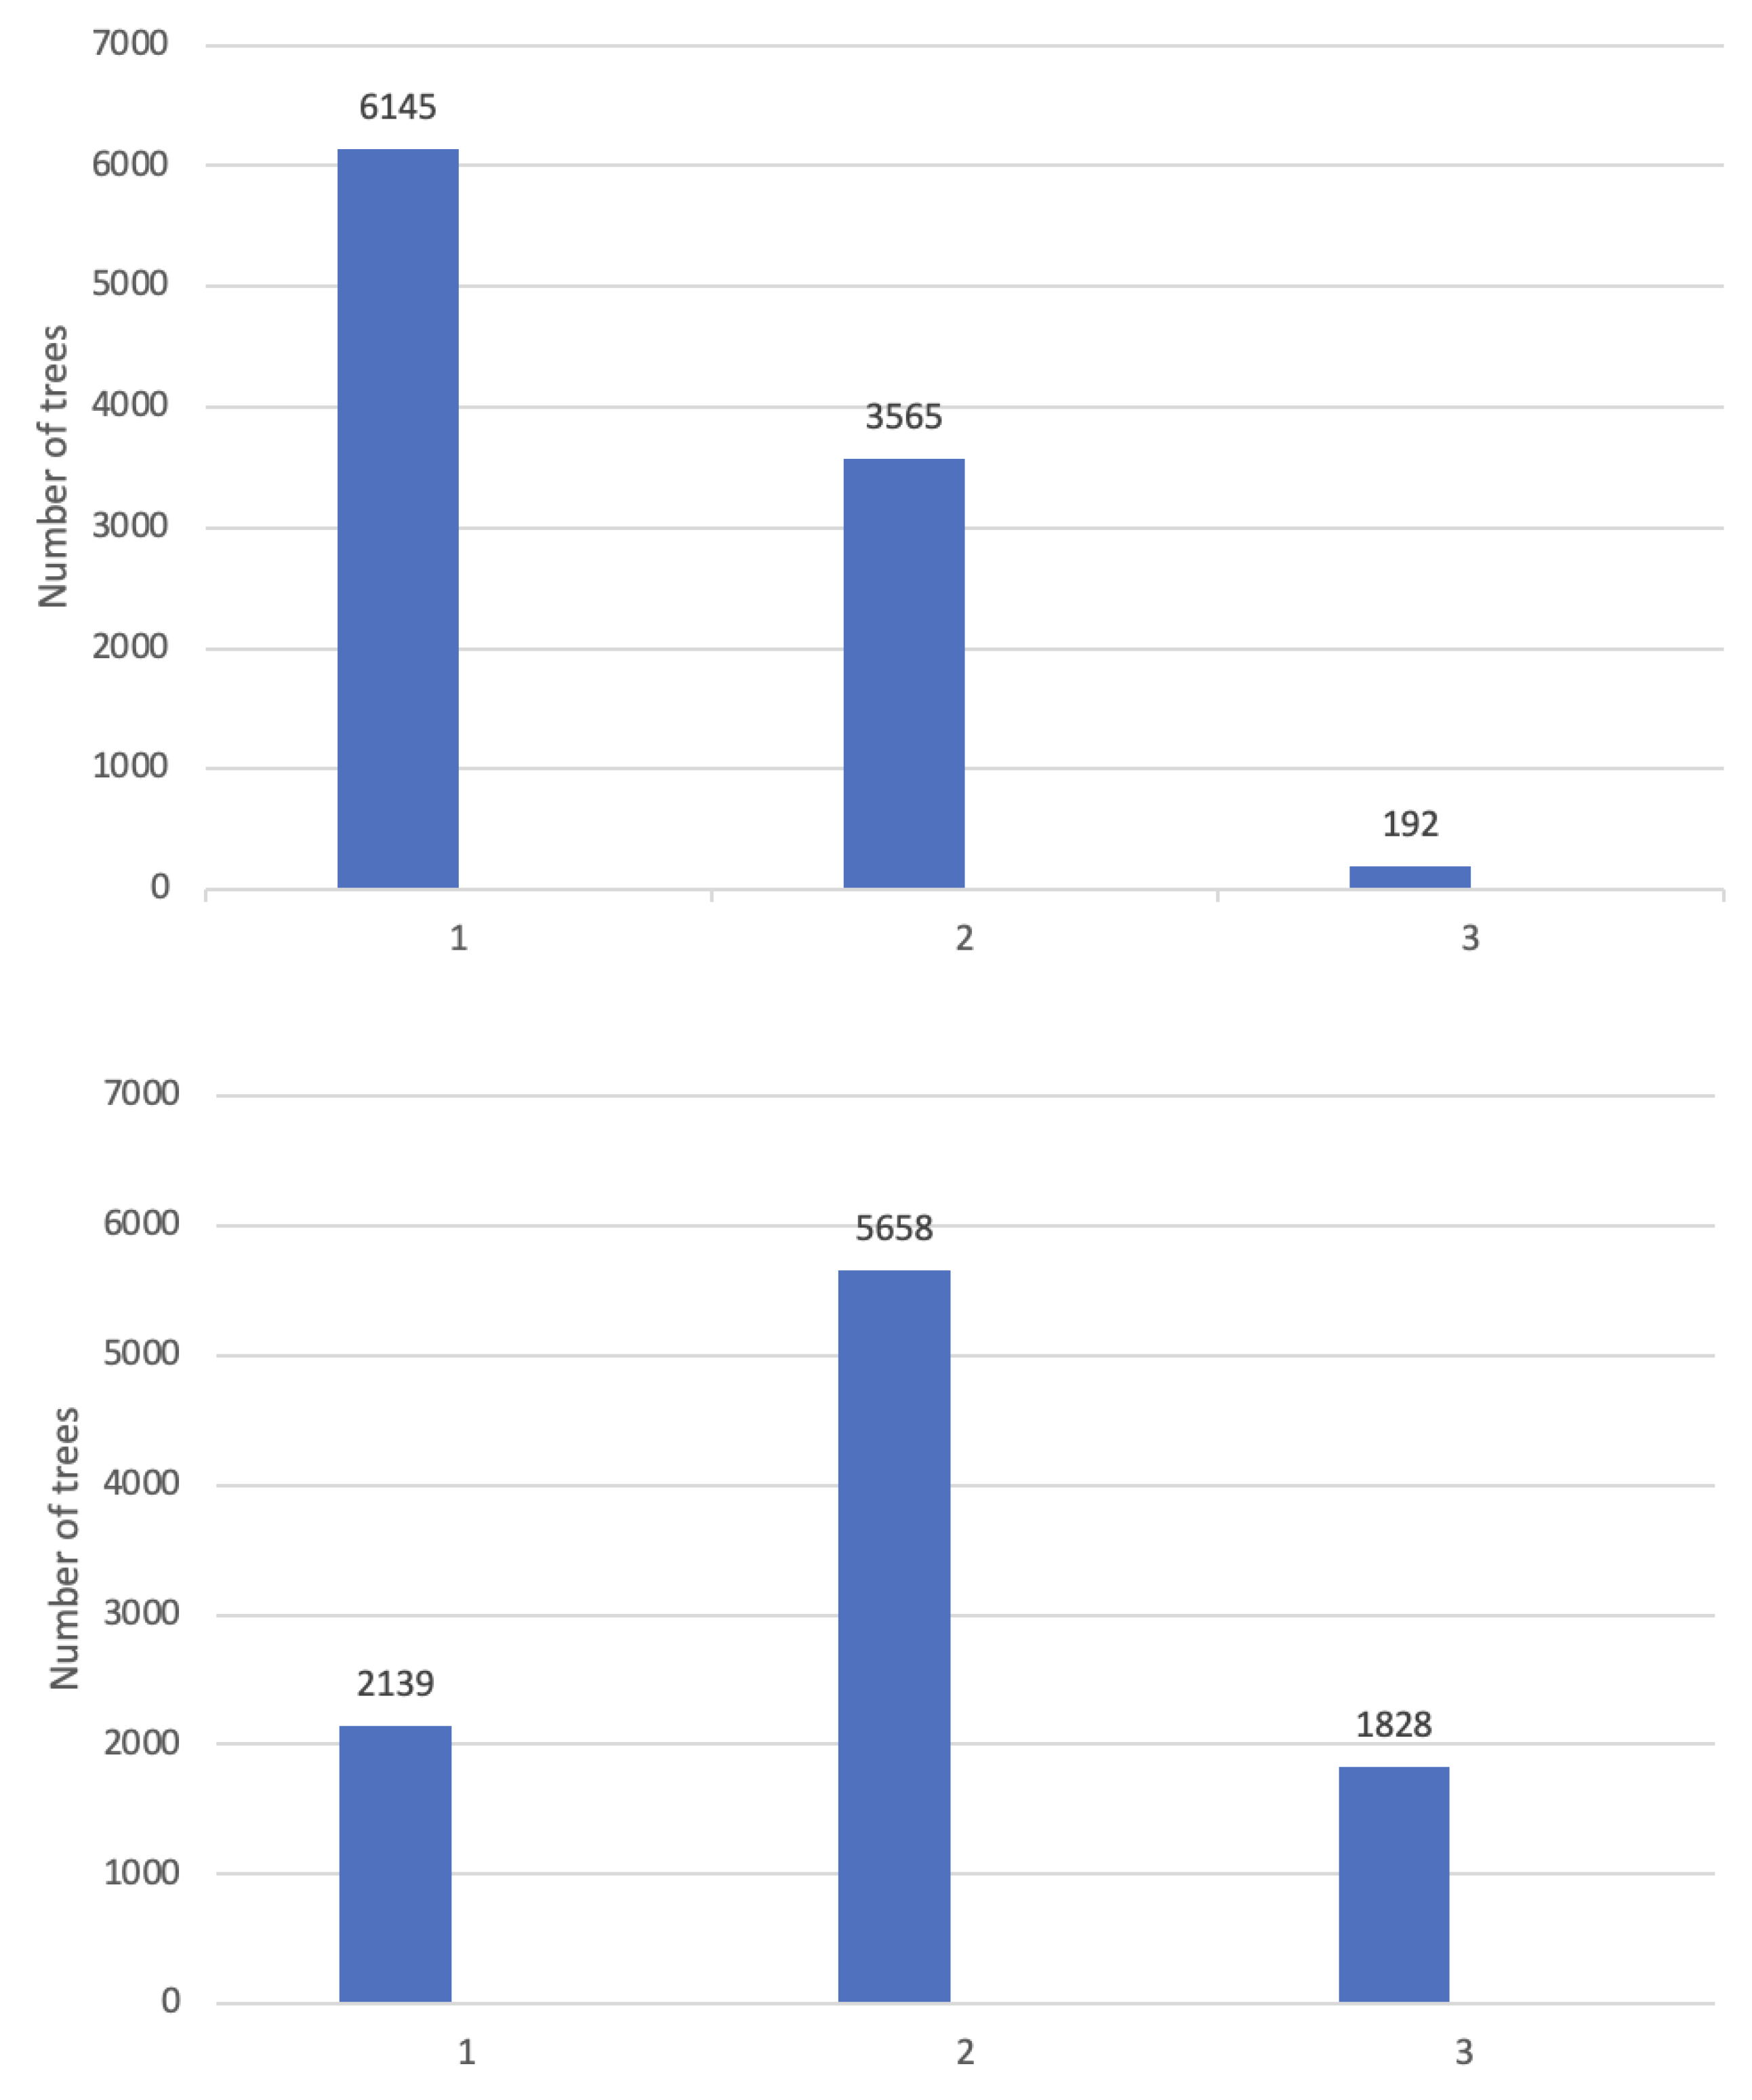
Tree growth was measured as total height (TH) and diameter at breast height (DBH) at 14 and 21 months, respectively. The precocity of change from juvenile to adult foliage (ADFO) was also assessed at 14 and 21 months of age. ADFO was calculated as the percentage of the crown with adult foliage, using a visual scale with percentage intervals of 10%. The distribution of data in the different categories was not uniform and therefore, they were grouped for analysis into three categories:1 = no adult foliage, 2 = up to 50% adult foliage, and 3 = more than 50% adult foliage. The ADFO was considered as a categorical trait, while TH and DBH as quantitative traits. At 14 months, most individuals had only juvenile foliage. At 21 months, most of individuals had up to 50% adult foliage. In both assessments, the proportion of individuals with more than 50% adult foliage was low (
Figure 1).
2.3. Genotypic Information
The genotypic information is made up with a total of 2409 individuals including parents and progenies (OP and CM) (
Table 1). The genotyping was carried out with the Eucalyptus EUchip60K SNPs chip [
31]. The marker data was filtered to select markers with call rate >0.95 and a minor allele frequency (MAF) >0.05, and individuals with call rate >0.80, using PREGSF90 software [
32], obtaining 15821 effective markers and 2359 individuals. Pedigree correction was conducted using the seekparent program from the BLUPF90 family [
33]. The SNP-density plot was generated using the R package CMPlot [
34].
To analyze the genetic diversity of the parents, half-sibs and full-sibs, the principal component analysis (PCA) was carried out using PREGSF90 of BLUPF90 family of programs [
32] and the three different groups were represented by different colors using ggplot [
35] R package [
36]. The PCA was explored based on H matrix [
37].
2.4. Single-Step GWAS Model (ssGWAS)
A multi-trait linear-threshold model was developed following the single-step genomic selection methodology [
10], using a transformation of the genomic breeding values (
a) to estimate SNP effects through equivalent models [
38]. The multi-tratit linear threshold ssGWAS model was estimated using variance and covariance matrices between the traits and residual errors specified by Equation (1):
where
y is the vector of phenotypes (TH, ADFO at 14 months, DBH and ADFO at 21 months),
b is the vector of fixed effects, including the overall mean of sites and blocks (within site), with incidence matrix
X, p is the vector of random plot effects, with incidence matrix W, a is the vector of random genetic additive effects of the individual trees, with incidence matrix
Z, and
e is the vector of random residuals. The variance structure was defined as:
where H is the numerator relationship matrix; G
0, P
0 and R
0 are 4 × 4 matrices of (co)variances for additive genetics, plot effects and residual variances corresponding to each trait. I is the identity matrix and ⊗ = the direct matrix product. H is constructed by combining information from markers and pedigree information [
37].
The inverse of the relationship matrix that combines pedigree and genomic information (H
-1) was derived by Aguilar et al. [
10] defined by Equation (2):
where A
-1 and A
−122 are the inverse of the pedigree relationship matrices for all individuals and only for the genotyped individuals, respectively, and G
-1, estimated according VanRaden [
39], is the inverse of the genomic relationship matrix.
Variance components were estimated using GIBBSF90 [
40]. For variance components, the Gibbs sampling process comprised 300000 rounds and 1 every 50th sample was stored. After discarding the first 10000 samples as burn-in, posterior means were calculated.The genetic correlations for all traits was estimated as follows by Equation (3):
where σ
2i and
are the additive genetic variance for the traits.
The narrow sense heritability for all traits was estimated as follows by Equation (4):
where σ
2a is the additive genetic variance, σ
2p is the plot variance, and σ
2e is the residual variance.
The SNP effects were estimated using the Equation (5):
where F is the matrix of gene content adjusted for observed allele frequencies and p
j is the allele frequency of the ith SNP, G
-1 is the inverse of the genomic relationship matrix and
is a vector of genomic breeding values only for genotyped individuals. The variance explained for each QTL were estimated as suggested by [
12]. The ssGWAS models were fitted with POSTGF90 of BLUPF90 family software [
41].
Windows genetic variance was computed following Peters et al. [
42] where breeding values partial for each window were estimated and then the variance of these breeding values was calculated. The size of window used in this study was of 0.2 Mb, this is because the LD for
E. globulus, estimated previously by Quezada et al. [
43] is the 0.2 Mb, approximately. Only the windows with estimated variance higher than 1% were considered.
3. Results
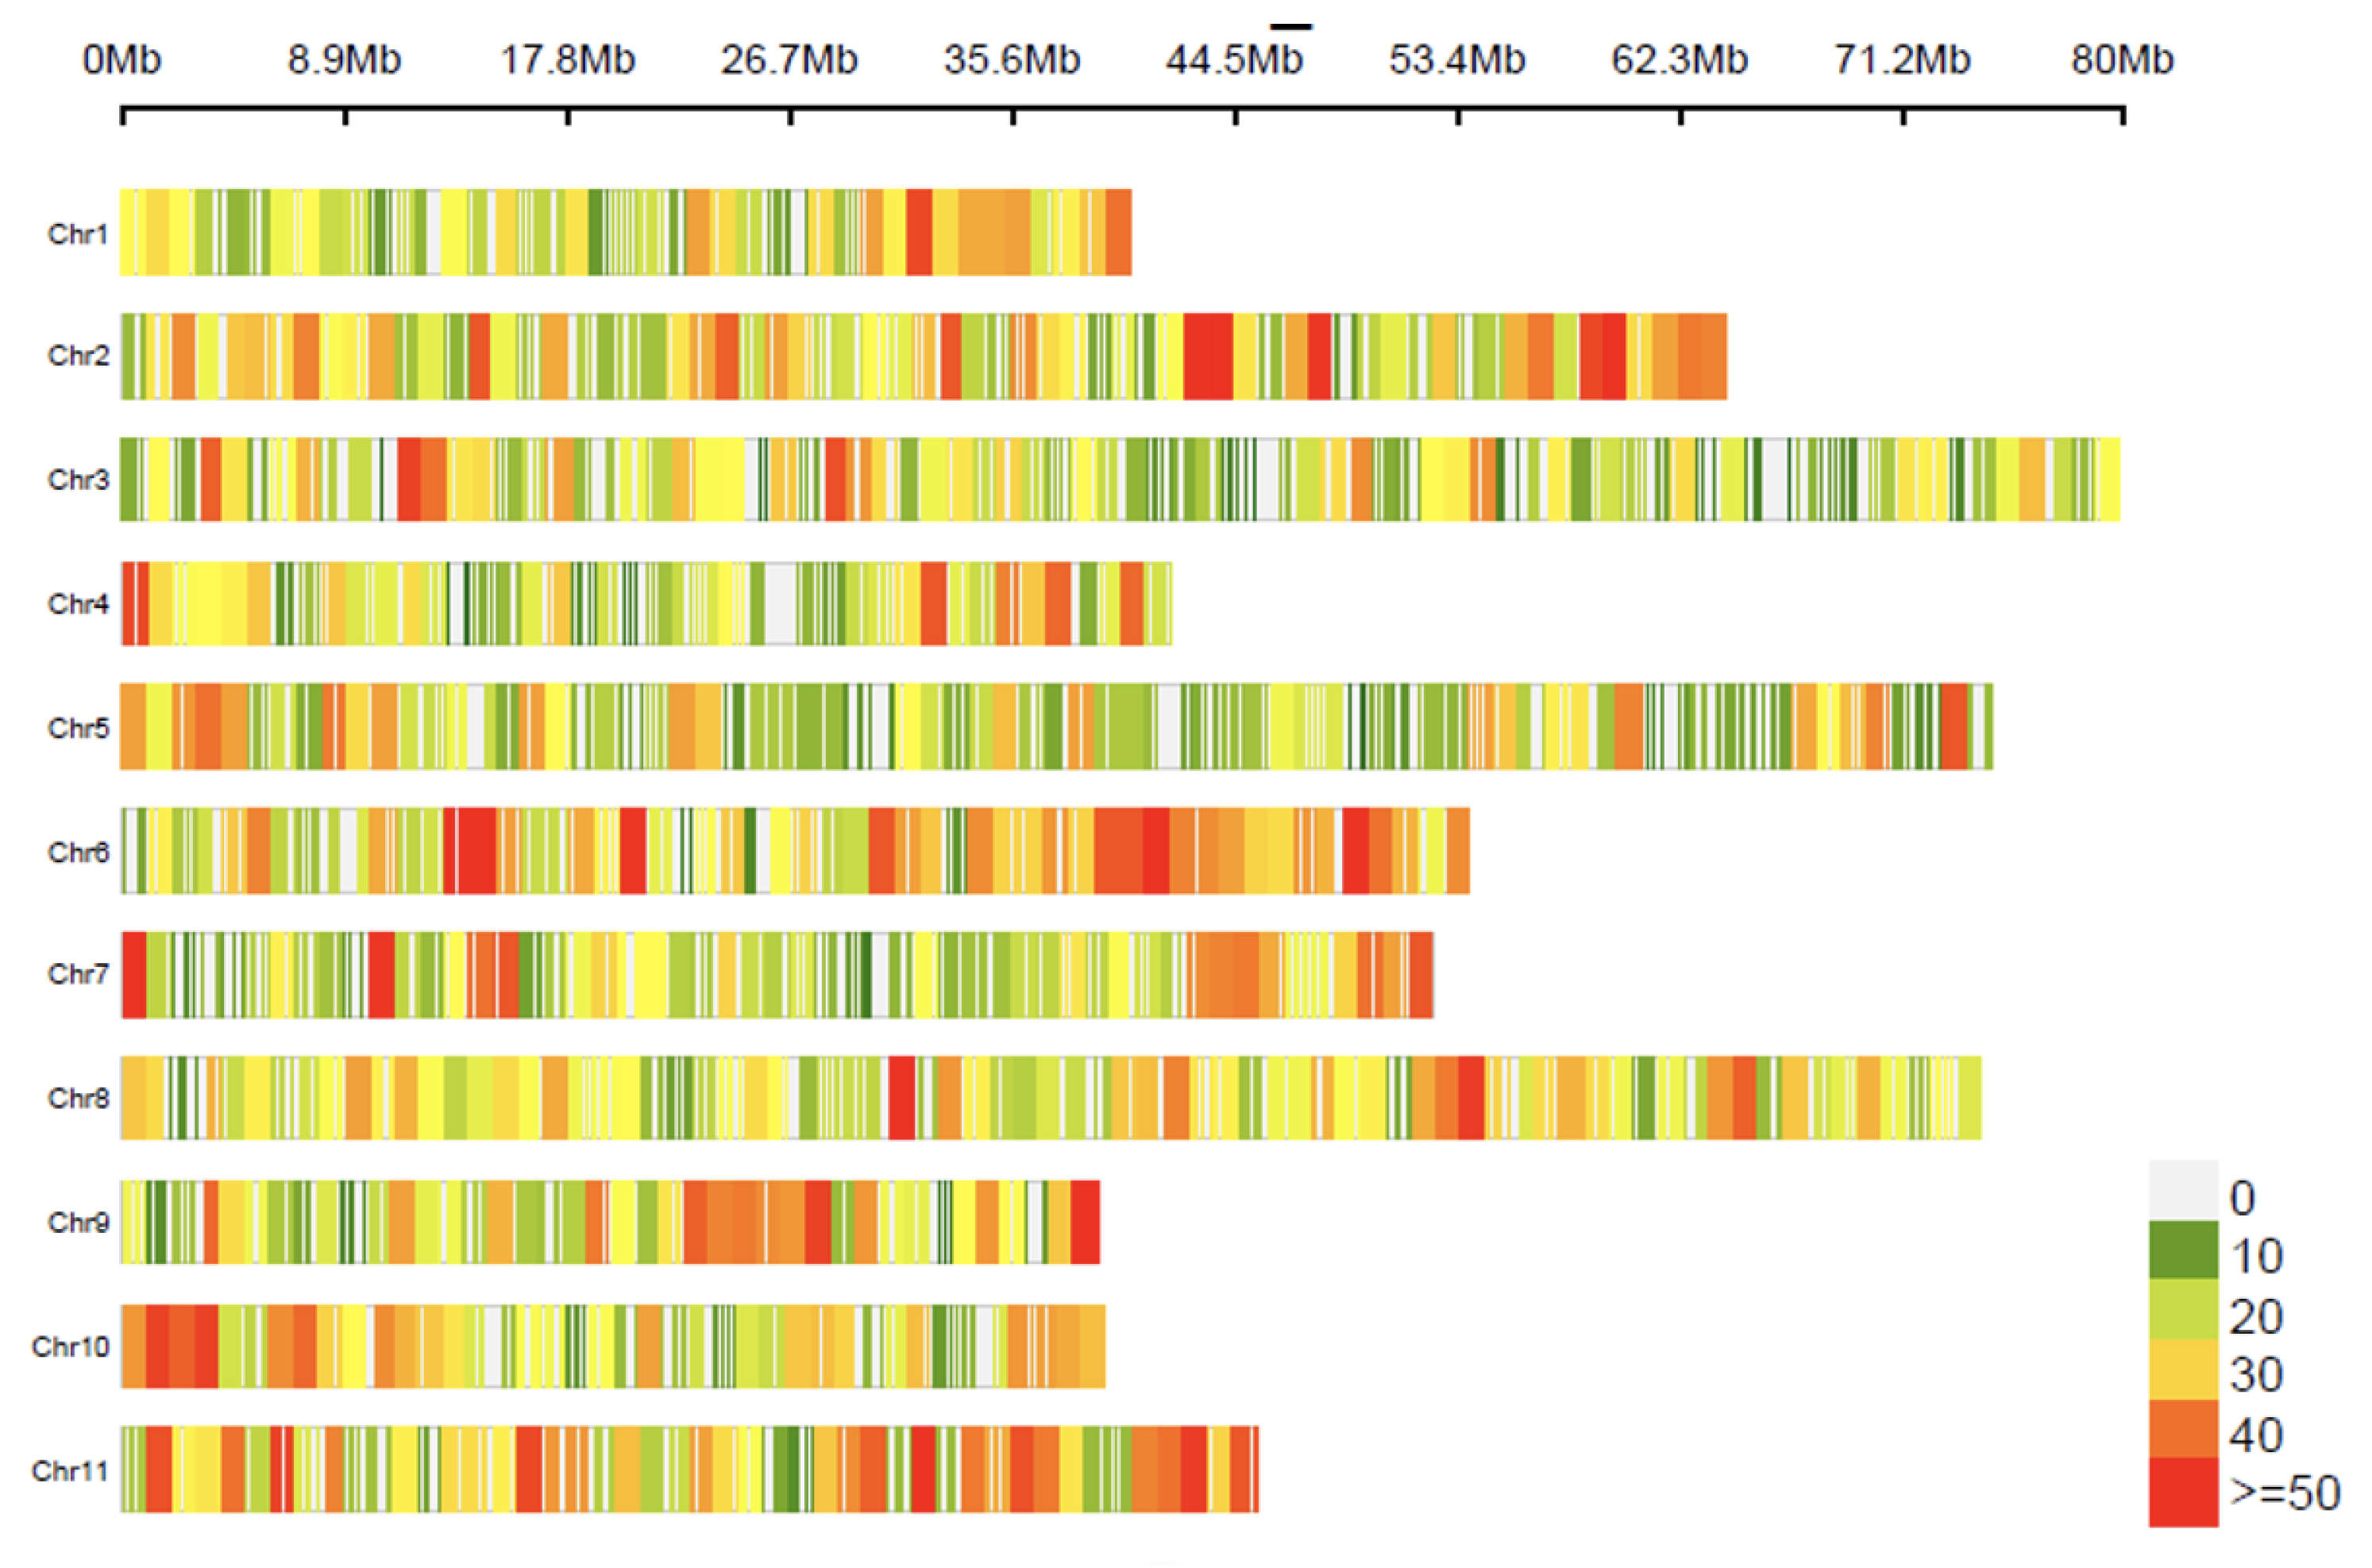
The SNP markers were distributed throughout the 11 chromosomes according to the
E. grandis reference genome, where the number of SNPs is summed within adjacent 1 Mb windows (
Figure 2). Chromosomes 1, 4, 9 and 10 were those that presented the fewest markers and chromosomes 3, 5 and 8 those that presented the most.
3.1. Genomic Information
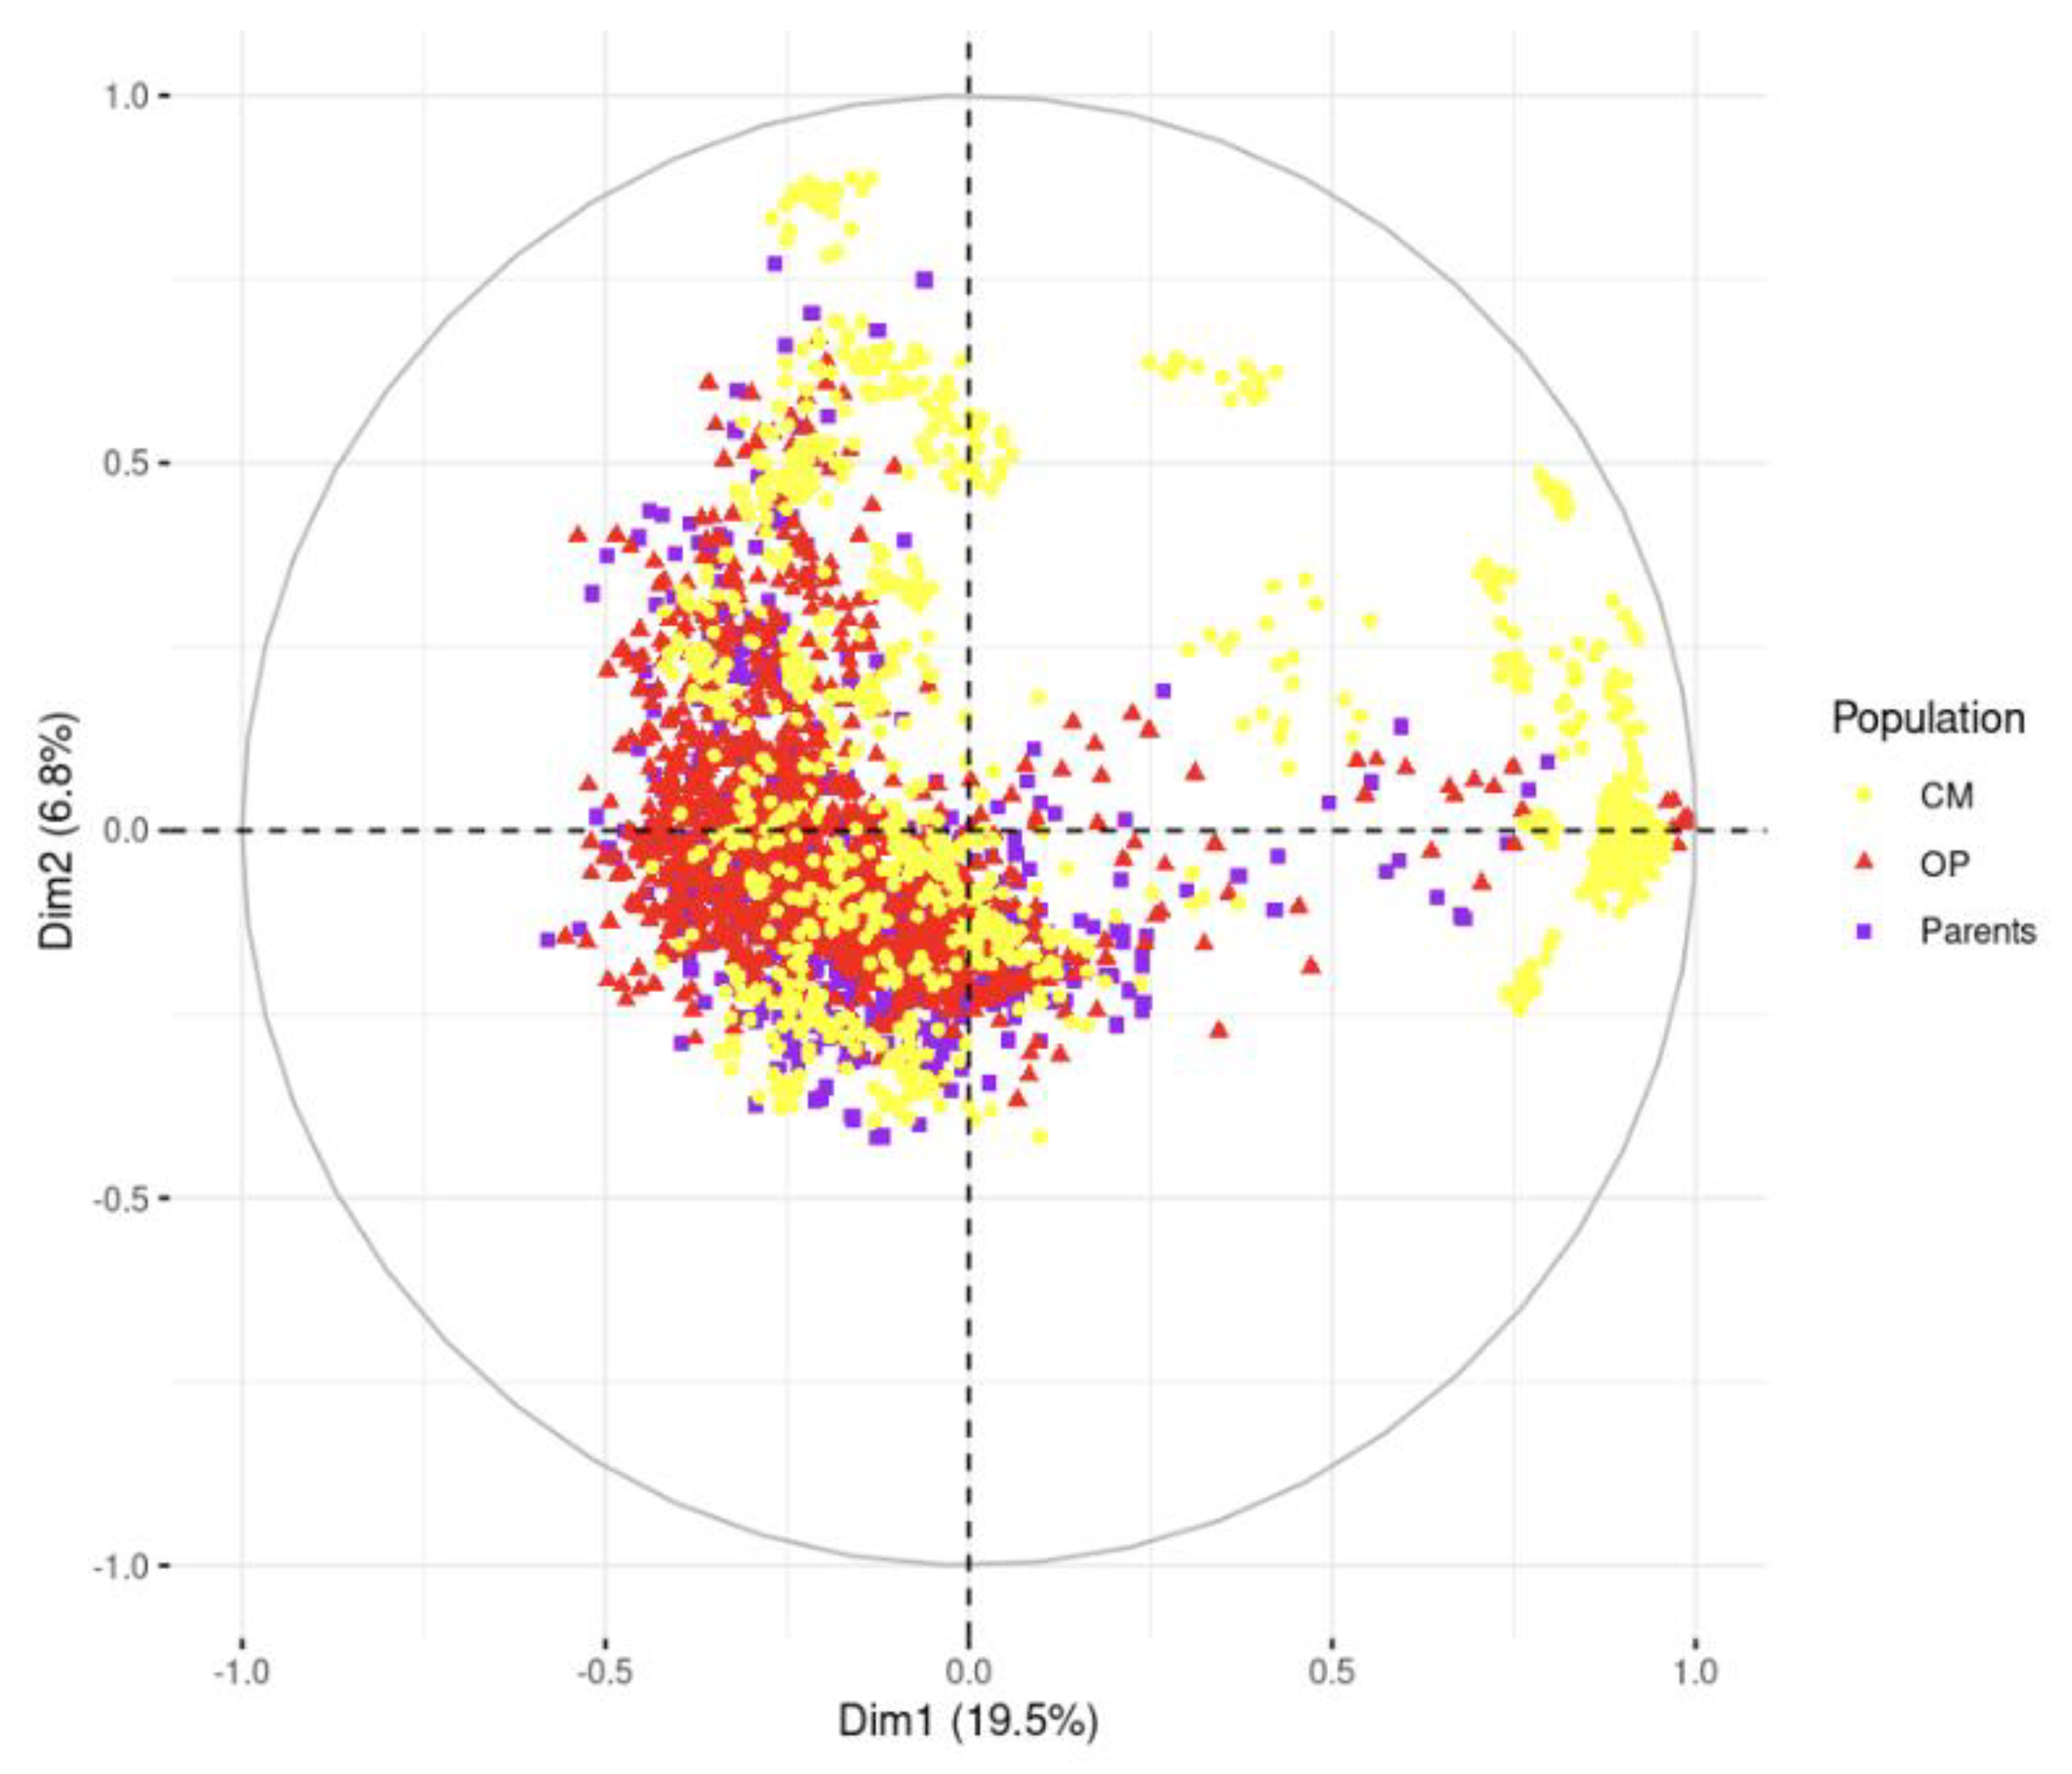
The PCA showed the diversity and population structure present in the studied population (
Figure 3). The first two principal components explained 19.5% and 6.8% of the total variation, respectively.
3.2. Multitrait Threshold Linear Model ssGWAS
The genetic correlations for all traits were positive, moderate to high, ranging from 0.51 to 0.97 (
Table 2). DBH exhibited the strongest correlation with all traits. The biggest correlation presented ADFO between 14 and 21 months. The heritabilities estimated were high for disease resistance traits (ADFO 14 and ADFO21), and lower for HT and DBH, being DBH moderately higher than HT. The heritability varied from 0.37 to 0.84.
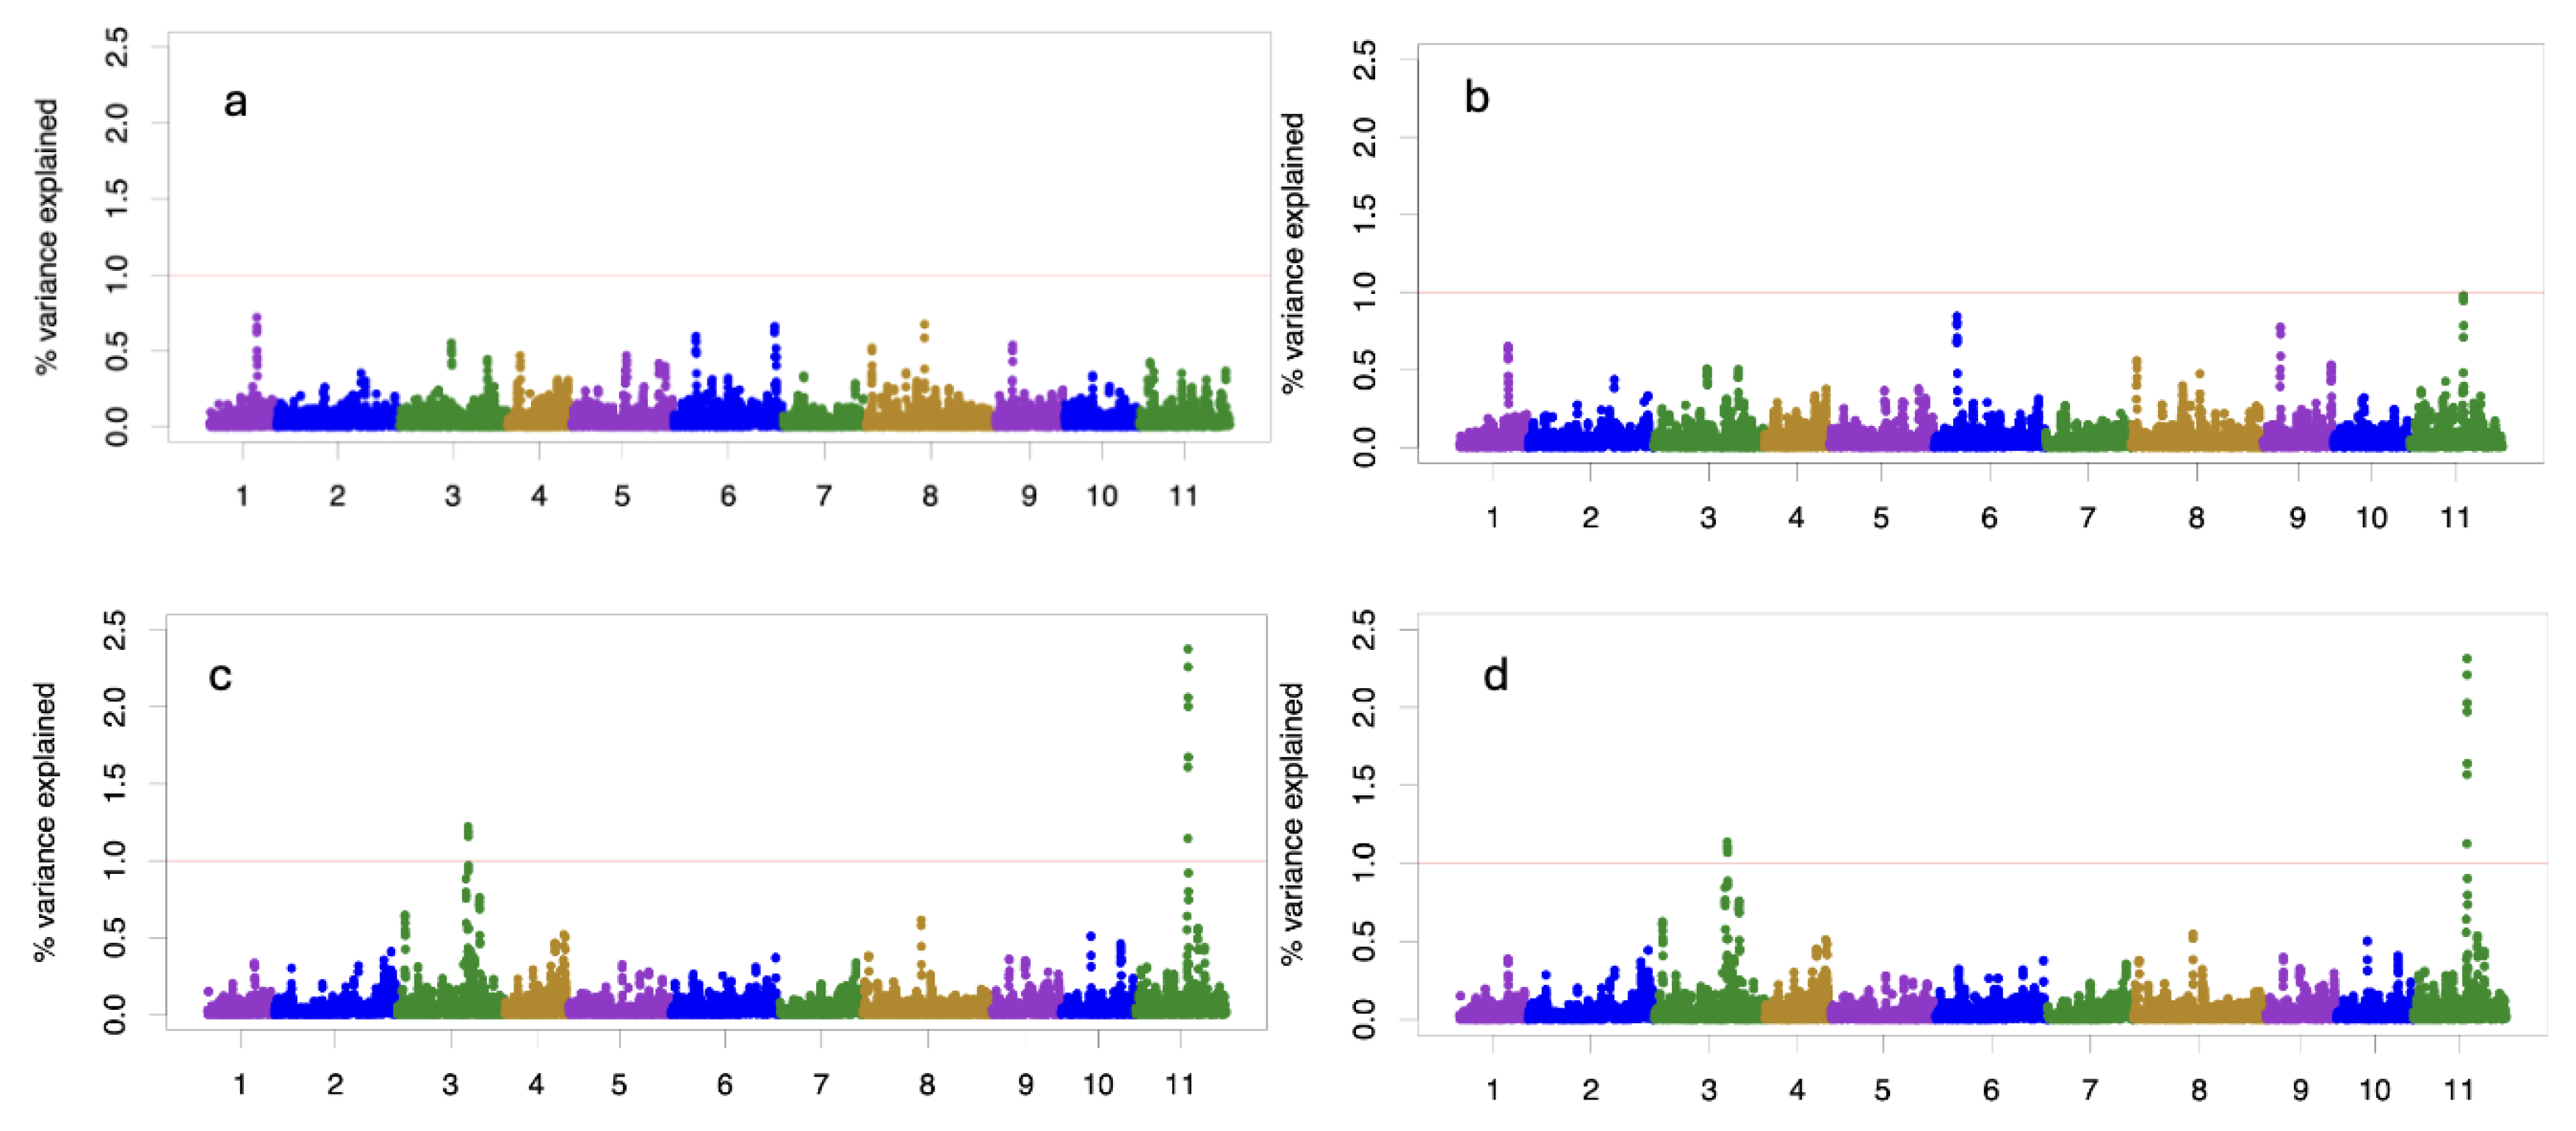
The windows are overlapping with a mean of 12 snps, from 4 to 22 snps per windows 0.2 Mb. The variance explained by 0.2 Mb window for the growth traits (TH and DBH) is less than 1.0% with homogenous distribution across all chromosomes (
Figure 4). The variance explained for the windows for ADFO14 and ADFO21 is greater than 1% in chromosomes 3 and 11, reaching 2.5 % of the variance explained in the chromosome 11.
3.3. QTL Identifications
In growth traits, no QTL were found that explained more than 1% of the variance. However, two genomic regions (QTLs) were found related with precocity of vegetative change (ADFO) measured at different ages (14 and 21 months). These genomic regions explained more than 1% of total variance (
Table 3). These QTLs are in the chromosome 3 and 11, ranging between 14 to 17 SNPs per window 0.2Mb, respectively.
4. Discussion
In several countries foliar diseases had caused devastating damages in young plantations of
E. globulus and the sustainability of this species depends on the rapid development of resistant genetic stock [
44]. Some studies have focused on this issue, such as those by Giorello et al.[
45] and Quezada et al. [
43], evaluating heteroblasty as a form of escape to
Teratosphaeria nubilosa. This study represents an additional step toward identifying genomic regions that code for complex traits, such as growth and escape from
T. nubilosa, in
E. globulus. Despite the population in study is not a diverse panel, associations between SNPs and phenotype were found. Although less genetic variation is available in an operational breeding population, associations found should be considerably more useful to inform practical breeding decision [
46,
47]. In this work, we were able to evaluate the performance of multi-trait linear-threshold ssGWAS approach by window in operational breeding populations.
The estimation of genetic parameters plays a crucial role in the management of seed orchards and provides valuable guidance for developing the evaluation and selection strategy for the next generation of improvement [
48,
49]. Positive and high genetics correlations (r
g 0.97) between ADFO measuring in two stages (14 and 21 months) is a strong indicative that is posible evaluate in an early stage (14 months), being ADFO at 14months a good indicative of ADFO at 21 months, reducing time of measuring. The estimated of heritabilities for ADFO suggested a strong genetic control, 0.84 and 0.86 for ADFO14 and ADFO21, respectively. [
43] studied the same traits in
E.globulus and reported similar results for heritability 0.68, 0.66 and 0.77 for ADFO at 14, 21 and 26 months, respectively. These results confirm the strong genetic control in this trait and suggested that the expected responses to selection for resistance disease are relatively favorable. HT and DBH showed a lower genetic control with h
2 0.37 and 0.53, respectively. According with other works in
E. globulus that reported similar heredabilities for TH and DBH, varing from 0.20 to 0.43 for TH and 0.20 to 0.50 for DBH [
30,
50].
The multi-trait threshold ssGWAS was useful for identifying markers contained in genomic regions that explained more than 1% variance for disease resistance traits (ADFO14 and ADFO21). Fernando et al. [
51], affirm that most GWA studies are based on inferences involving joint tests on all the SNP markers within a narrow genomic region, recognizing that single SNP marker associations may be fraught by low statistical power, problems with multicollinearity or both. Quezada et al. [
43], suggest that ssGWAS is a powerful model in detecting regions associated to the escape to
T. nubilosa, showing a greater number of significant SNP associations than Single-SNP and GBLUP-GWAS models. Porter and O’ Reilly [
52] reported that multi-trait GWAS can be used to analyze multiple traits simultaneously and was developed to increase statistical power and identify pleiotropic loci. Additionally, Fernandes et al. [
53] affirm that multi-trait GWAS is a useful addition to the suite of statistical models that are commonly used to gain insight into the genetic architecture of agronomically important traits. Misztal et al. [
54] suggested the ssGWAS is a potentially useful tool for GWAS when the population contains large number of genotypes and especially if models of analyses are complex.
The growth traits (TH and DBH) showed a typical polygenic behavior where the entire genome contributed to their variation, but no genomic region explained more than 1% of the total variation. This result confirms what has been reported in other studies, corroborating the complex architecture of growth traits and the pleiotropic effect among loci for growth traits [
55,
56]. Rocha et al. [
56] found significant associations in
E. grandis between DBH, TH and volume measured in different years of data sampling, indicating a strong pleiotropic effect on trait association. ADFO traits showed less polygenic behavior than growth traits, being the genomic regions of chromosomes 3 and 11 which presents the larger effects. These results confirm what was reported in the literature, where chromosomes 3 and 11 are the main responsible for disease traits in
Eucalyptus spp [
43,
45,
57]. Therefore, there is strong evidence that studying both chromosomes (3 and 11) we can understand better the control of heteroblasty.Quezada et al. [
43] reported QTLs related with ADFO in similar genomic regions studied in this work. The main genes they found linked to most SNPs associated with precocity of vegetative change (ADFO at 14 and 21 months) were in chromosome 3, between position 48526965 and 50801384 Mb. The chromosome 11 contains two genes related to biotic stress resistance, miR157 precursor and Glutathione transferase GST 23, between 29630035 and 29646703 Mb, being these genomic regions relevant to ADFO.
The multi-trait threshold linear ssGWAS allowed the identification of genomic regions (chromosomes 3 and 11) involved in escape to foliar pathogens that coincide with what has been reported in the literature [
43,
58,
59,
60]. These regions contain genes that lead the resistance against biotic stresses, including defense responses to fungus infection [
61,
62]. The miR156 and miR157 has been recognized as the major regulator of vegetative change in plants, promoting juvenility due to high expression in seedlings and decreasing during the development, causing difference in the timing of vegetative phase change [
43,
45,
63,
64,
65].
5. Conclusions
This study enabled the estimation of genetic correlations and narrow sense heretabilities for disease and growth traits. It also showed that multi-trait threshold linear ssGWAS model allowed the identification of genomic regions that codify for traits related resitance desease, such as adult foliage portion in canopy, as a escape way of infect for T. nubilosa. Allowing for a focus on and deeper exploration of these genomic regions to understand the behavior of these types of traits. In contrast with growth traits (TH and DBH) that showed a typical polygenic behavior, and no genomic region explained more than 1% of the total variation.
Author Contributions
Conceptualization, M.G., I.A., M.Q., and G.B.; methodology, M.G., I.A.; formal analysis, M.G.; writing—original draft preparation, M.G.; writing—review and editing, I.A, M.Q, and G.B.; supervision, I.A. All authors have read and agreed to the published version of the manuscript.
Funding
The funding of this work came from INIA Uruguay (National Institute of Agricultural Research) and ANII (National Association of Investigation and Innovation Research).
Data Availability Statement
The data presented in this study is available on request from the corresponding author.
Acknowledgments
Thanks to INIA Uruguay and ANII by funded this work. .
Conflicts of Interest
The authors declare no conflict of interest.
References
- Spindel, J.E.; Begum, H.; Akdemir, D.; B. Collard, E.; Redoña, J.L.; Jannink; McCouch, S. Genome-wide prediction models that incorporate de novo GWAS are a powerful new tool for tropical rice improvement. Heredity 2016, 116,395–408. [CrossRef]
- Tibbs C.; Zhang, L.; Yu, J. Status and prospects of genome-wide association studies in plants. Plant Genome 2021, 1–17. [CrossRef]
- Hirschhorn, J. N.;Daly, M. J. Genome-wide association studies for common diseases and complex traits. Nature Reviews Genetics 2005, 6, 95-108. [CrossRef]
- Hirschhorn, J. N.; Altshuler, D. The genetics of common diseases. Nature Reviews Genetics 2002, 3, 247-258. [CrossRef]
- Bolormaa, S.; Pryce, J. E.; Reverter, A.; Zhang, Y.; Barendse, W.; Kemper, K.; Goddard, M. E. A multi-trait, meta-analysis for detecting pleiotropic polymorphisms for stature, fatness and reproduction in beef cattle. PLoS Genetics 2014, 10, e1004198.
- Zhang, W.; Gao, X.; Shi, X.; Zhu, B.; Wang, Z.; Gao, H.; Chen, Y. PCA-based multiple-trait GWAS analysis: a powerful model for exploring pleiotropy. Animals 2018, 8, 239.
- Cappa, E. P.; Chen, C.; Klutsch, J. G; Sebastian-Azcona, J.; Ratcliffe, B.; Wei, X.; El-Kassaby, Y. A. Multiple-trait analyses improved the accuracy of genomic prediction and the power of genome-wide association of productivity and climate change-adaptive traits in lodgepole pine. BMC Genomics 2022, 23, 536.
- Bolormaa, S.;Pryce, J. E.; Hayes, B. J.; Goddard, M. E. Multivariate analysis of a genome-wide association study in dairy cattle. Journal of Dairy Science 2010, 93, 3818-3833.
- Gualdrón Duarte, J. L.; Cantet, R. J.; Bates, R. O.; Ernst, C. W.; Raney, N. E.; Steibel, J. P. Rapid screening for phenotype-genotype associations by linear transformations of genomic evaluations. BMC Bioinf 2014. 15, 1–11. [CrossRef]
- Aguilar, I.; Misztal, I.; Johnson, D.; Legarra, A.; Tsuruta, S.; Lawlor, T. Hot topic: a unified approach to utilize phenotypic, full pedigree, and genomic information for genetic evaluation of Holstein final score1. J. Dairy Sci 2010. 93, 743–752. [CrossRef]
- Christensen, OF.; Lund, MS. Genomic prediction when some animals are not genotyped. Genet Sel Evol 2010, 42. [CrossRef]
- Aguilar, I.; Legarra, A.; Cardoso, F.; Masuda, Y.; Lourenco, D.; Misztal, I. Frequentist p-values for large-scale-single step genome-wide association, with an application to birth weight in American Angus cattle. Genet. Sel 2019. Evol. 51, 1–8. [CrossRef]
- Wang, H.; Misztal, I.; Aguilar, I.; Legarra, A.; Muir, W. M. Genome-wide association mapping including phenotypes from relatives without genotypes. Genet. Res. 2012, 94, 73–83. [CrossRef]
- Sullivan, P. F.; Van Langevelde, S. Statistical Methods for Genome-Wide Association Studies. In Handbook of Statistical Genetics; Balding, D.J.; Bishop, M.; Cannings, C.; Wiley, 2013, 2, 1023–1045.
- Wu, H.; Zhao, H. Efficient mixed-model association analysis for genome-wide association studies. Nature Methods 2010, 7, 510-515. [CrossRef]
- Hayes, B.; Goddard, M. Genome-wide association and genomic selection in animal breeding. Genome 2010, 53(11), 876-883.
- Legarra, A.; Ricard, A.; Varona, L. GWAS by GBLUP: single and multimarker EMMAX and Bayes factors, with an example in detection of a major gene for horse gait. G3: Genes, Genomes, Genetics 2018, 8, 2301-2308.
- Habier, D.; Fernando, R. L.; Kizilkaya, K.; and Garrick, D. Extension of the Bayesian alphabet for genomic selection. BMC Bioinformatics 2011,12-186. [CrossRef]
- Sun, X.; Habier, D.; Fernando, R. L.; Garrick, D. J.; and Dekkers, J. C. M. Genomic breeding value prediction and QTL mapping of QTLMAS2010 data using Bayesian methods. BMC Genet 2011, 5. [CrossRef]
- Peters, S. O.; Kizilkaya, K.; Garrick, D. J.; Fernando, R. L.; Reecy, J. M.; Weaber, R. L. Bayesian genome-wide association analysis of growth and yearling ultrasound measures of carcass traits in Brangus heifers. J. Anim. Sci 2012, 90, 3398–3409. [CrossRef]
- Goddard, M. Genomic selection: prediction of accuracy and maximisation of long term response. Genetica 2009,136, 245–257. [CrossRef]
- Fragomeni, B. D. O.; Misztal, I.; Lourenco, D. L.; Aguilar, I.; Okimoto, R.; Muir, W. M. Changes in variance explained by top SNP windows over generations for three traits in broiler chicken. Frontiers in Genetics 2014, 5, 332.
- Sigdel, A.; Abdollahi-Arpanahi, R.; Aguilar, I.; Peñagaricano, F. Whole genome mapping reveals novel genes and pathways involved in milk production under heat stress in US Holstein cows. Frontiers in genetics 2019, 10, 928.
- Jurcic, E. J.; Villalba, P. V.; Pathauer, P. S.; Palazzini, D. A.; Oberschelp, G. P.; Harrand, L.; Cappa, E. P. Single-step genomic prediction of Eucalyptus dunnii using different identity-by-descent and identity-by-state relationship matrices. Heredity 2021, 127, 176-189.
- González, M.; Resquín, F.; Balmelli, G. Performance of Eucalyptus tereticornis provenances in subtropical climate. Agrociencia Uruguay 2022, 26(NSPE2).
- Bi, W.; Zhou, W.; Dey, R.; Mukherjee, B.; Sampson, J. N.; Lee, S. Efficient mixed model approach for large-scale genome-wide association studies of ordinal categorical phenotypes. The American Journal of Human Genetics 2021, 108, 825-839.
- Wright S. An analysis of variability in number of digits in an inbred strain of guinea pigs. Genetics 1934, 19: 506-536.
- Gianola, D.; Foulley, J.L. Sire evaluation for ordered categorical data with a threshold model. Genet Sel Evol 1983, 15, 201-224.
- Misztal, I.; Gianola, D.; Foulley, J. L. Computing aspects of a nonlinear method of sire evaluation for categorical data. Journal of Dairy Science 1989, 72, 1557-1568.
- Quezada, M.; Aguilar, I.; Balmelli, G. Genomic breeding values prediction including populational selfing rate in an open-pollinated Eucalyptus globulus breeding population. Tree Genet Genomes 2022,18-10. https:// doi. org/ 10. 1007/ s11295- 021- 01534-7.
- Silva-Junior, O. B.; Faria, D. A.; Grattapaglia, D. A flexible multi- species genome-wide 60K SNP chip developed from pooled resequencing of 240 Eucalyptus tree genomes across 12 species. New Phytol 2015, 206, 1527–1540. [CrossRef]
- Aguilar, I.; Tsuruta, S.; Masuda, Y.; Lourenco, D. A. L.; Legarra, A.; Misztal, I. BLUPF90 suite of programs for animal breeding with focus on genomics. In Proceedings of the World Congress on Genetics Applied to Livestock Production, Auckland, Australia, 2018.
- Misztal, I.; S. Tsuruta.; T. Strabel.; B. Auvray.; T. Druet. BLUPF90 and related programs (BGF90). In 7th World Congress on Genetics Applied to Livestock Production, CD-ROM Communication, Montpellier, France, 2002.
- Yin, L.; Zhang, H.; Tang, Z.; Xu, J.; Yin, D.; Zhang, Z.; Yuan, X.; Zhu, M.; Zhao, S.; Li, X.; Liu, X. rMVP: A Memory-efficient, Visualization-enhanced, and Parallel-accelerated Tool for Genome-wide Association Study. Genomics Proteomics Bioinformatics 2021,19,619-628. [CrossRef]
- Wickham, H. ggplot2: Elegant Graphics for Data Analysis, Springer-Verlag, 2016.
- R Core Team. R: A language and environment for statistical computing. R Foundation for Statistical Computing, Vienna, Austria. 2023. URL https://www.R-project.org/.
- Legarra, A.; Aguilar, I.; Misztal, I. A relationship matrix including full pedigree and genomic information. J Dairy Sci 2009, 92, 4656–4663.
- Strandén, I.; Garrick, DJ. Technical note: derivation of equivalent computing algorithms for genomic predictions and reliabilities of animal merit. J Dairy Sci 2009, 92, 2971–5. [CrossRef]
- VanRaden, P. Efficient methods to compute genomic predictions. J. Dairy Sci 2008, 91, 4414–4423. [CrossRef]
- Tsuruta, S.; Misztal, I. THRGIBBSF90 for estimation of variance components with threshold and linear models. In Proceedings 8th World Congress Genetics Applied to Livestock Production, CD-ROM communication, Belo Horizonte, Brazil, 2006.
- Aguilar, I.; Misztal, I.; Tsuruta, S.; Legarra, A.; Wang, H. PREGSF90 – POSTGSF90: computational tools for the implementation of single-step genomic selection and genome-wide association with ungenotyped individuals in BLUPF90 programs. In Proceedings,10th World Congress on Genetics Applied to Livestock Production, Vancouver, Canada, 2014.
- Peters, O.; Kizilkaya, K.; Garrick, J.; Fernando, L.; Reecy, M.; Weaber, L. Bayesian genome-wide association analysis of growth and yearling ultrasound measures of carcass traits in Brangus heifers. J. Anim. Sci 2012. 90,3398–3409. [CrossRef]
- Quezada, M.; Giorello, F. M.; Da Silva, C. C.; Aguilar, I.; Balmelli, G. Single-step genome-wide association study for susceptibility to Teratosphaeria nubilosa and precocity of vegetative phase change in Eucalyptus globulus. Frontiers in Plant Science 2023, 14, 1124768.
- Balmelli, G.; Simeto, S.; Marroni, V.; Altier, N.; Diez, J. J. Genetic variation for resistance to Mycosphaerella leaf disease and Eucalyptus rust on Eucalyptus globulus in Uruguay. Australas. Plant Pathol 2014. 43, 97–107. [CrossRef]
- Giorello, F. M.; Farias, J.; Basile, P.; Balmelli, G.; Da Silva, C. C. Evaluating the potential of XP-GWAS in Eucalyptus: Leaf heteroblasty as a case study. Plant Gene 2023, 36, 100430.
- Begum, H.; Spindel, J.E.; Lalusin, A.; Borromeo, T.; Gregorio, G.; Hernandez, J.; Virk, P.; Collard, B.; McCouch, S.R. Genome-wide association mapping for yield and other agronomic traits in an elite breeding population of tropical rice (Oryza sativa). PLoS ONE 2015,10, e0119873.
- Resende, R. T.; Resende, M. D. V.; Silva, F. F.; Azevedo, C. F.; Takahashi, E. K.; Silva-Junior, O. B.; Grattapaglia, D. Regional heritability mapping and genome-wide association identify loci for complex growth, wood and disease resistance traits in Eucalyptus. New Phytologist 2017, 213, 1287-1300.
- Klápště, J.; Ismael, A.; Paget, M.; Graham, N. J.; Stovold, G. T.; Dungey, H. S.; Slavov, G. T. Genomics-enabled management of genetic resources in radiata pine. Forests 2022, 13, 282.
- Gonzalez, M.; Resquin, F.; Balmelli, G. Estimation of genetic parameters for productive traits in Eucalyptus tereticornis and implications for breeding. Bosque 2023, 44, 493-502. [CrossRef]
- Haristoy, G.; Bouffier, L.; Fontes, L.; Leal, L.; Paiva, J. A.; Pina, J. P.; Gion, J. M. Genomic prediction in a multi-generation Eucalyptus globulus breeding population. Tree Genetics & Genomes 2023, 19, 8.
- Fernando, R.; Toosi, A.; Wolc, A.; Garrick, D.; Dekkers, J. Application of whole-genome prediction methods for genome-wide association studies: a Bayesian approach. Journal of Agricultural, Biological and Environmental Statistics 2017, 22, 172-193.
- Porter, H. F.; O’Reilly, P. F. Multivariate simulation framework reveals performance of multi-trait GWAS methods. Sci. Rep 2017, 7, 1–12. [CrossRef]
- Fernandes, S. B.; Casstevens, T. M.; Bradbury, P. J.; Lipka, A. E. A multi-trait multi-locus stepwise approach for conducting GWAS on correlated traits. The Plant Genome 2022, 15, e20200.
- Misztal, I.; Wang, H.; Aguilar, I.; Legarra, A.; Tsuruta, S.; Lourenco, D. A. L.; Fernando, R. GWAS using ssGBLUP. In Proceedings of the 10th World Congress on Genetics Applied to Livestock Production, Vancouver, Canada, 2014.
- Müller, B. S.; de Almeida Filho, J. E.; Lima, B. M.; Garcia, C. C.; Missiaggia, A.; Aguiar, A. M. Independent and joint-GWAS for growth traits in Eucalyptus by assembling genome-wide data for 3373 individuals across four breeding populations. New Phytol 2019, 221, 818–833. [CrossRef]
- Rocha, L. F.; Benatti, T. R.; de Siqueira, L.; de Souza, I. C. G.; Bianchin, I.; de Souza, A. J.; Tambarussi, E. V. Quantitative trait loci related to growth and wood quality traits in Eucalyptus grandis W. Hill identified through single- and multi-trait genome-wide association studies. Tree Genetics & Genomes 2022, 18, 38.
- Jordan, G. J.; Potts, B. M.; Chalmers, P.; Wiltshire, R. J. Quantitative genetic evidence that the timing of vegetative phase change in Eucalyptus globulus ssp. globulus is an adaptive trait. Aust. J. Bot 2000, 48, 561–567. [CrossRef]
- Dielen, A. S.; Badaoui, S.; Candresse, T.; German-Retana, S. The ubiquitin/26s proteasome system in plant–pathogen interactions: a never-ending hide-and-seek game. Mol. Plant Pathol 2010, 11, 293–308. [CrossRef]
- Gardiner, S. A.; Boddu, J.; Berthiller, F.; Hametner, C.; Stupar, R. M.; Adam, G. Transcriptome analysis of the barley–deoxynivalenol interaction: evidence for a role of glutathione in deoxynivalenol detoxification. Mol. Plant-Microbe Interact 2010, 23, 962–976. [CrossRef]
- Yadav, V.; Wang, Z.; Yang, X.; Wei, C.; Changqing, X.; Zhang, X. Comparative analysis, characterization and evolutionary study of dirigent gene family in cucurbitaceae and expression of novel dirigent peptide against powdery mildew stress. Genes 2021, 12, 326. [CrossRef]
- Nagpure, A.; Choudhary, B.; Gupta, R. K. Chitinases: in agriculture and human healthcare. Cr. Rev. Biotech 2014, 34, 215–232. [CrossRef]
- Rodrıǵuez, A.; Shimada, T.; Cervera, M.; Alquézar, B.; Gadea, J.; Gómez-Cadenas, A. Terpene down-regulation triggers defense responses in transgenic orange leading to resistance against fungal pathogens. Plant Physiol 2014, 164, 321–339. [CrossRef]
- Poethig, R. S. The past, present, and future of vegetative phase change. Plant Physiol 2010, 154, 541–544. [CrossRef]
- Hudson, C. J.; Freeman, J. S.; Jones, R. C.; Potts, B. M.; Wong, M. M.; Weller, J. L. Genetic control of heterochrony in Eucalyptus globulus. G3 Genes Genomes Genet 2014, 4, 1235–1245. [CrossRef]
- Manuela, D.; Xu, M. Juvenile leaves or adult leaves: determinants for vegetative phase change in flowering plants. Int. J. Mol. Sci, 2020, 21, 1–16. [CrossRef]
|
Disclaimer/Publisher’s Note: The statements, opinions and data contained in all publications are solely those of the individual author(s) and contributor(s) and not of MDPI and/or the editor(s). MDPI and/or the editor(s) disclaim responsibility for any injury to people or property resulting from any ideas, methods, instructions or products referred to in the content. |
© 2024 by the authors. Licensee MDPI, Basel, Switzerland. This article is an open access article distributed under the terms and conditions of the Creative Commons Attribution (CC BY) license (http://creativecommons.org/licenses/by/4.0/).