
Submitted:
17 December 2024
Posted:
19 December 2024
You are already at the latest version
Abstract
The field experiment was carried out at the Vytautas Magnus University Experimental Station (54°52′N, 23°49′E) in 2020, 2021 and 2022. The soil used for the field experiment was PLb-g4 Endohipogleyic-Eutric Planasol. The research aimed to investigate the effects of different nitrogen fertilisation rates and biological preparations on yield structure elements and partial factor productivity of nitrogen in maize (Zea mays L.) grown for grain production. The factors studied were: factor A – nitrogen (N) fertiliser rates: 1) 100 kg ha-1, 2) 140 kg ha-1, 3) 180 kg ha-1; Factor B – use of bio-fertilisers: 1) No biological preparations (BP) used, 2) Biological preparation AB, 3) Biological preparations AB+C, 4) Biological preparations AB+H. The research showed that the yield of maize grain was significantly increased not only by increasing the rates of nitrogen fertilization but also by using biological preparations. The highest maize grain yield (11.5 t ha-1) was obtained in 2020 using N180 fertilisation in combination with biological preparations AB+H. In all cases, the biological preparations and their combinations significantly increased the maize grain yield compared to the control field (no use of BP). The biological preparations in combination with N significantly increased the weight of 1000 grains and thus the grain yield per plant. The highest maize grain yield per plant (154.6 g) was obtained in 2020 using N180 fertilisation in combination with biological preparations AB+H. In most cases, positive, strong, very strong and statistically significant correlations were observed between the different rates of nitrogen fertilisation and the indicators studied: r = 0.76–0.94 (P < 0.01, P < 0.05). No statistically significant correlation was found between nitrogen fertilisation rates and the number of grains per cob (P > 0.05). The highest partial factor productivity of nitrogen fertiliser (92.0 kg of maize kg-1 of N) was obtained in 2020 using N100 fertilisation in combination with AB+H. Increasing the nitrogen fertiliser rates and not using biological preparations resulted in a decrease in the partial factor productivity of nitrogen fertiliser.
Keywords:
Zea mays L.
; fertilization
; nitrogen fertilizer
; biological preparations
; productivity
; nitrogen partial factor productivity
1. Introduction
Maize (Zea mays L.) is the second most important widely grown crop after wheat, making a significant contribution to global food security [1]. However, maize productivity is limited by abiotic stresses, among other factors. Stress caused by abiotic factors accounts for 50% of yield losses in crop production, with nutrient stress or unbalanced plant nutrition being one of the main factors [2,3,4]. Climate change is altering soil fertility characteristics such as optimum nutrient and moisture content, soil temperature, organic matter content and microbiota population and activity. The resulting challenges call for sustainable agro-technologies that improve soil productivity while maintaining environmental and human health [5]. The use of chemical fertilisers causes soil and water contamination, making environmental protection one of the main objectives of healthy food production [6]. Some organic crop production technologies ensure nutrient uptake efficiency through the use of biostimulants without increasing nutrient inputs [7]. Plant biostimulants are substances or microorganisms that enhance nutrient uptake efficiency and metabolism, such as plant-enhancing biomaterials, plant probiotics and biostimulants. The most commonly used biostimulants in crop production are algal extracts, humic substances, amino acids and plant growth-promoting bacteria, which can modify plant physiological processes in a way that can benefit plant growth or development or stress response [8].
Szczepanek and Wilczewski [9] claim that humic acids improve nutrient availability from the soil and mitigate plant responses to abiotic stress, however, their effectiveness depends on soil conditions and formula composition. To optimise the use of biostimulants, it is necessary to quantify their potential isolated and combined effects. Biostimulants can be effective under laboratory conditions but may not be effective enough under field conditions due to interactions between biostimulants and soil properties, plant physiological characteristics, soil microflora and meteorological conditions [10,11]. Different plant responses to biostimulants can be caused by single, multiple or combined applications and concentrations [12]. Canellas et al. [13] found that the combined use of humic substances and endophytic diazotrophic bacteria increased maize grain yield by 65% compared to 20% for bacteria alone. The discrepancies in the effectiveness of biostimulants across different experimental sites, seasons and/or years require proper evaluation [14].
Nitrogen is an essential nutrient for maize, which determines grain yields, in particular through its role in photosynthesis and other biological processes. However, the use of nitrogen in maize production technologies is a major concern due to the negative impact of excess use on groundwater quality [15,16]. Excess nitrogen use in Europe results in annual environmental costs of US$ 78-357 billion [17,18].
A strong focus is placed on growth substances that can contribute to increasing the productivity and biological value of plants, especially under adverse climatic conditions. In a plant, five key growth hormones interact with each other: auxins, cytokinins, gibberellins, ethylene, and abscisic acid. Auxins are the most important as they are involved in all plant physiological processes, root bud formation, cell division and tropisms [19]. Cytokinins affect cell division, which in turn affects plant growth, but they also stimulate lateral buds and inhibit the ageing of organs and plant tissues. Gibberellins interrupt plant dormancy, stimulate cell division and promote plant growth [20,21].
Researchers are studying the effects of cytokinins on the anatomical structure of leaves. Microscopic observations of plant leaves showed that the effect of cytokinins led to mesophyll cell enlargement and intensive lignification of leaf-reinforcing tissues, and the formation of larger amounts of leaf vascular bundles [22]. Cytokinins stimulate the opening of leaf stomata in mature and ageing leaves and affect CO2 diffusion. Phytohormones from the cytokinin group stimulate the division and formation of chloroplast ultrastructure [23]. The positive effect of cytokinins on photosynthesis is also attributed to the fact that they delay leaf ageing. This phenomenon has been observed in many plant species treated with exogenously applied phytohormones and in genetically modified plants with elevated levels of endogenous cytokinins [24]. Cytokinins block or slow down the ageing process of plants by inhibiting chlorophyll degradation and the breakdown of the green pigment, thus helping to maintain the vitality of the leaves. Cytokinins have also been proven to affect the vital functions of the plant and serve as an indispensable element [25,26].
Numerous attempts have been made to find ways to inhibit urease activity to slow down the hydrolysis process. One of the best ways to reduce nitrogen loss and slow down the rate of hydrolysis is to use urease inhibitors. Urease inhibitors have been shown to increase the efficiency of urea [27,28].
The ability of nitrogen-fixing microorganisms to fix nitrogen in a non-symbiotic manner has been further investigated. Scientific reports have shown the occurrence of these organisms in the rhizosphere of maize (Zea mays L.) and other plant roots [29].
Scientists argue that free-living nitrogen-fixing bacteria are important contributors to nitrogen availability and can replace or supplement chemical fertilisers and produce secondary metabolites, especially phytohormones and exopolysaccharides, which are not present in chemical fertilisers [30]. Nitrogen-fixing bacteria allow producers to reduce chemical fertiliser rates and indirectly reduce the spread of some pathogens [30]. Jadhav and Sayyed [31] suggest that this corresponds to the ability of nitrogen-fixing bacteria to degrade the cell wall of a fungal pathogen, which may be related to the synthesis of hydrolytic enzymes [32].
Nitrogen-fixing bacteria products are presented as bio-fertilisers and can increase the productivity of crops. The use of nitrogen-fixing bacteria represents the application of biotechnology to support the development of agricultural practices that reduce pollution and improve soil quality. Nitrogen-fixing bacterial products can play an important role in replenishing nutrient reserves available to plants [33].
Paenibacillus polymyxa is widely recognised as a plant growth-promoting bacterium that directly benefits plants by improving atmospheric nitrogen fixation, phosphorus solubility and plant iron uptake in the soil as well as phytohormone production. This could reduce dependence on chemical fertilisers, which currently are the source of environmental conflicts and appear to be harmful to humans. Paenibacillus polymyxa is mainly used as a functional microbial species for the production of biofertilisers. Over the last couple of years, the use of Paenibacillus polymyxa has gained increasing momentum. The most recent discovery in the microbial industry related to this bacterium is the production of bioactive compounds such as exopolysaccharides [34,35,36].
The integrated use of biological preparations in agricultural technology can contribute to more sustainable agriculture, reduced environmental pollution and high agricultural productivity. The research aimed to investigate the effects of different rates of nitrogen fertilisation and biological preparations on yield structure elements and nitrogen partial factor productivity in maize (Zea mays L) grown for grain production.
2. Materials and Methods
2.1. Research Location and Arrangement of the Experiment
The research object was a maize (Zea mays L.) crop fertilized using different rates of nitrogen fertilizer and treated with biological preparations.
The field experiment was carried out at Vytautas Magnus University Experimental Station (54°52′ N, 23°49′ E) from 2020 to 2022. The soil of the field experiment was Eutric Endogleyic Planosol (World Reference Base (WRB)), a moderate clay loam on sandy light loam covered with moraine clay [37].
The plow layer was 23–27 cm thick. The soil was neutral (pH ~ 6.7), with a medium humus content of ~ 2.86 %, medium calcium content of ~ 154 mg kg-1, and high phosphorus content of ~ 266 mg kg-1.
The field experiment was conducted with 36 plots, each with an initial (gross) area of 66 m2 (width 5.5 m, length 12 m). The area of the reference (net) field was 45 m2 (width 4.5 m, length 10 m). The field experiment was carried out in 3 replicates, with the plots arranged in a randomised manner in replicate blocks. 2 factors were studied: factor A – nitrogen (N) fertiliser rates: 1) 100 kg ha-1, 2) 140 kg ha-1, 3) 180 kg ha-1; factor B – use of biological preparations: 1) No biological preparations (BP) used, 2) Biopreparation AB, 3) Biopreparations AB+C, 4) Biopreparations AB+H.
Maize was sown on 27 April in 2020, 11 May in 2021 and 08 May in 2022. The early maturing hybrid maize variety P7326 (breeding company DuPont Pioneer) was used. Seed rate: 80,000 seeds ha-1. Row spacing: 75 cm. PK fertilisers were applied in all fields before sowing of maize in all years of the study: double superphosphate Ca(H2PO4)2H2O) at a rate of 60 kg ha-1 P2O5; potassium chloride KCl at a rate of 60 kg ha-1 K2O. In each year of the study, the maize crop was sprayed at stage BBCH 16 with the herbicide containing the active ingredients mesotrione 75 g l-1 + nicosulfuron 30 g l-1 – 1.0 l ha-1.
Characteristics of the use of Factors A and B studied in the field experiment:
Factor A – different rates of nitrogen (N) fertiliser:
1. (N100) 238 l ha-1 KAS-32 (solution of urea CO(NH2)2 and ammonium nitrate NH4NO3) applied to the soil surface immediately after sowing;
2. (N140) 333.2 l ha-1 KAS-32 (solution of urea CO(NH2)2 and ammonium nitrate NH4NO3) applied to the soil surface immediately after sowing;
3. (N180) 428.4 l ha-1 KAS-32 (solution of urea CO(NH2)2 and ammonium nitrate NH4NO3) applied to the soil surface immediately after sowing.
Factor B – use of biological preparations (BP):
1. (Without BP) biological preparations were not used;
2. (AB) biological preparation – nitrogen bacteria Paenibacillus polymyxa (1.0 l ha-1) applied to the soil surface immediately after sowing in combination with KAS-32;
3. (AB+C) biological preparations – nitrogen bacteria Paenibacillus polymyxa (1.0 l ha-1) applied to the soil surface immediately after sowing in combination with KAS-32 and Cytokinin (N – 0.33%, P2O5 – 0.15%, K2O – 0.2%, moisture – 97.6%, organic matter – 1.7%, pH 6–7, phytohormones, cytokinin series 11 mg l-1 (EMA), auxins 0.05 mg l-1 (EMA), vitamins, trace elements, proteins, carbohydrate) (0.7 l ha-1) sprayed at the 6 leaf stage;
4. (AB+H) biological preparations – nitrogen bacteria Paenibacillus polymyxa (1.0 l ha-1) and humic acids (15% suspension of humic and fulvic acids, pH 4–5) (1.0 kg ha-1) applied to the soil surface immediately after sowing in combination with KAS-32.
When the maize had reached physiological maturity, i.e. when the black dot appeared on the kernel at the point of attachment to the cob, plant samples were taken from each field, randomly selecting 10 plants and sampling according to the methodology used in the field experiments to determine yield and yield structure elements of maize grain. The cobs were dried in a drying chamber at a temperature of 65 ± 5°C to constant dry matter, dehusked and threshed, the grains were weighed, and the following parameters were calculated and assessed: grain yield (t ha-1), average grain yield per plant (g), number of grains in the cob (pcs.), and weight of 1000 grains (g). PFPN = YN/FN, where YN is the yield with applied N (kg ha−1), and FN is the amount of N applied (kg ha−1) [38].
2.2. Statistical Analysis
Statistical data analysis was performed using computer applications ANOVA and STAT from the statistical software package SELEKCIJA [39]. The research data were statistically evaluated using the method of two-way analysis of variance. The significance of the differences between the treatments was assessed using the F-criterion and the LSD test. Significant interactions of the studied factors were identified; therefore, the averages are not presented when analyzing the research data. The differences between the means of treatments without the same letters (a, b, c...) are significant (P < 0.05). The reliability of the regression coefficient was determined according to Fisher’s (F) criterion, and the correlation was determined according to Stewart’s (t) criterion: At P ≤ 0.05, the dependence was statistically significant at the 95% level of probability; at P ≤ 0.01, the dependence was statistically significant at the 99% level of probability [40].
2.3. Weather Conditions
Temperatures in April 2020 were close to the long-term norm, with only 4.0 mm of precipitation (Figure 1). Temperatures in May were 2.7 °C below the long-term norm and precipitation was 32.7 mm above the long-term norm. The monthly HTK was 4.26 (excess humidity). In June, the temperature was 2.9 °C above the long-term norm and precipitation was 22.4 mm above the norm, with an HTK of 1.74 (excess humidity). In July, the temperature was 1.3 °C below the long-term norm and precipitation was 36.2 mm less than the norm, with an HTK of 1.12 (optimum humidity). The temperature in August was 1.4 °C above the long-term norm, with an HTK of 1.61 (excess humidity). The temperature in September was 2.3 °C above the long-term norm with only 13.3 mm of precipitation, with the HTK of 0.30 (very dry). October precipitation was close to the long-term norm and the temperature was 3.5 °C above the long-term norm.
In 2021, the temperature in April was 0.7 °C below the long-term norm. May was cool and rainy with temperatures 1.8 °C below the long-term norm and precipitation 59.9 mm above the long-term norm. The monthly HTK was 4.04 (excess humidity). June and July were hot and dry. The HTK for these months was 0.69 (arid). August was cooler than normal, with precipitation 33.3 mm above the long-term norm. The monthly HTK was 2.40 (excess humidity). September was cooler and drier than normal (HTK 1.05). The temperature in October was 1.3 °C above the long-term norm and the precipitation was 23.8 mm below the long-term norm.
April 2022 was 0.7 °C colder than normal. Monthly precipitation was close to the long-term norm. May was cold and wet with temperatures 2.2 °C below the long-term norm, precipitation 22.3 mm below the long-term norm, and HTK of 3.3 (excess humidity). The temperature in June was 1.6 °C above the long-term norm, and precipitation was close to the long-term norm, with an HTK of 1.46 (optimum humidity). In July, the temperature was 0.8 °C lower than the long-term norm and precipitation was close to the long-term norm, with an HTK of 1.80 (excess humidity).
August was unusually hot and dry with monthly temperatures 3.6 °C above the long-term norm, and precipitation 50.2 mm below the long-term norm, with the HTK of 0.60 (arid). September was 1.5 °C colder, and October was 3.4 °C warmer than usual. During these months, precipitation was 34.0 and 33.3 mm below the long-term norm, with HTKs of 0.88 and 0.87 (insufficient humidity).
3. Results
3.1. Effects of the Factors Studied on Maize Grain Yield
During the years studied, increases in nitrogen fertiliser rates without the use of biological preparations significantly increased maize grain yields (Figure 2). The highest maize grain yield (8.8 t ha-1) was obtained in 2020 with N180 fertilisation. Biological preparations increased the efficiency of nitrogen fertilisers. During the experiment, a substantial increase in maize grain yield was observed when AB was applied in combination with N100 compared to N100 alone. Significantly higher efficiency of nitrogen-fixing bacteria was observed in all years of the research when maize was fertilised with N100, N140, and N180 fertilisation rates. The highest maize grain yield (10.9 t ha-1) was obtained in 2020 with N180 fertilisation rate in combination with AB. However, the data from the experiment show that there were no significant differences between the N140 and N180 fertilisation rates.
The combination of nitrogen-fixing bacteria and phytohormones (AB+C) showed significant differences compared to the control field, however, no significant differences were found between AB+C and AB, except in 2022 when used in combination with the N140 fertilisation rate. The highest grain yield (11.1 t ha-1) using AB+C was obtained in 2020 when used in combination with the N180 fertilisation rate, however, there was no significant difference compared to N140, and no significant difference was observed when compared to N140 and using AB.
When nitrogen-fixing bacteria were used in combination with a humic acid preparation (AB+H) and fertilisation rate N100, a substantial increase in grain yield was observed compared to fertilisation rate N100 without the use of biological preparations (BP). The highest grain yield (11.5 t ha-1) was obtained in 2020 when fertilisation rate N180 was combined with AB+H, but no significant difference was found when comparing N180 with N140, with significant differences only in the years 2021 and 2022.
The correlation and regression analysis revealed positive, strong, very strong and statistically reliable correlations were observed in all cases between the different nitrogen fertilisation rates (x – kg ha-1) and maize grain yield: r = 0.85–0.93, P < 0.01 (Table 1).
3.2. Effects of the Factors Studied on Maize Grain Yield per Plant
The experiment showed a significant increase in maize grain yield per plant in 2020 when AB was applied in combination with nitrogen fertiliser (N100) compared to the maize crop not treated with biological preparations. When fertilised at the N100 fertilisation rate, the highest maize grain yield per plant (131.8 g) was obtained using the nitrogen AB+H combination (Figure 3).
Increased rates of nitrogen fertilisation (N140 and N180) resulted in a significant increase in maize grain yield per plant compared to the N100 fertilisation rate. The highest maize grain yield per plant in 2020 (154.6 g) was observed when the N180 fertilisation rate was used in combination with AB+H. The data from the experiment show no significant difference between N140 and N180 fertilisation rates when used in combination with AB+C or AB+H. A significant increase in maize grain yield per plant was observed when the N100 fertilisation rate was used in combination with AB+H as compared to the N140 fertilisation rate without the use of biological preparations.
The experiment conducted in 2021 showed similar trends as in 2020. Increased nitrogen fertilisation rates increased maize grain yield per plant, but no significant difference was observed between N100 and N140 and between N140 and N180 when no biological preparations were applied. Significant differences were observed in all cases where the N100 fertilisation rate was used in combination with biological preparations. Fertilisation rate N140 in combination with AB resulted in a significant increase in plant grain yield per plant, but no significant difference was observed between AB and AB+C.
AB+H significantly increased grain yield per plant as compared to the N140 fertilisation rate without the use of biological preparations. As in previous years, the highest grain yield per plant (136.7 g) was observed with N180 fertilisation rate in combination with AB+H. When using the N180 fertilisation rate, no significant difference was detected between AB, AB+C and AB+H.
The experiment conducted in 2022 showed similar trends as in 2020 and 2021. The highest (145.6 g) average plant grain yield was observed with N180 fertilisation rate in combination with AB+H. Plant productivity was significantly higher compared to the N180 fertilisation rate without the use of biological preparations, however, no significant differences were found between AB+H and AB and AB+C treatments. When using the N140 fertilisation rate, no significant differences were detected between the combinations of biological preparations, however, in each studied case there was a significant increase in the average grain yield per plant compared to the control field. When using the lowest nitrogen fertilisation rate (N100), each of the cases studied showed a significant increase in average grain yield per plant as compared to the control field. No significant differences were found between AB and AB+C.
The studied biological preparations increased the efficiency of nitrogen fertilisers during the years of the experiment.
The correlation and regression analysis revealed positive, strong, very strong and statistically reliable correlations were observed in all cases between the different nitrogen fertilisation rates (x – kg ha-1) and maize grain yield per plant: r = 0.83–0.94, P < 0.01 (Table 2).
3.3. Effects of the Factors Studied on the 1000-grain Weight of Maize
The highest 1000-grain weight of maize (311 g) was recorded in 2020 when maize was treated with N180 fertilisation rate in combination with (AB+H) (Figure 4). In other cases, no significant differences were found between the different combinations of nitrogen fertiliser and biological preparations. A significant increase in 1000 grain weight was observed in 2020 and 2022 when maize was treated with N100 fertilisation rate in combination with AB as compared to nitrogen fertilisation without the use of BP. In all years of the study, there was a significant increase in 1000 grain weight of maize using N140 fertilisation rate in combination with AB as compared to nitrogen fertilisation without the use of BP.
The correlation and regression analysis revealed positive, strong, very strong and statistically reliable correlations were observed in all cases between the different nitrogen fertilisation rates (x – kg ha-1) and 1000-grain weight of maize: r = 0.76–0.91, (P < 0.01, P < 0.05). Only in 2020, statistically insignificant dependencies were found when no biological preparations were used (P > 0.05) (Table 3).
3.4. Effects of the Factors Studied on the Number of Maize Grains per Cob
The highest number of maize grains per cob (498) was found when maize was treated using N180 fertilisation rate in combination with AB+H.
The data in Figure 5 show that the nitrogen fertilisation rates and combinations of biological preparations studied did not have a significant effect on the number of grains per cob. An upward trend in the number of grains can only be seen with the use of biological preparations.
A correlation–regression analysis of nitrogen fertilisation rates (x – kg ha-1) and y (2020; 2021; 2022) – number of grains per cob – showed no statistically significant correlation (P > 0.05).
3.5. Effects of Factors Studied on Partial Factor Productivity of Nitrogen
Evaluation of the effects of fertilisation rates and biological preparations used in the experiment on the partial factor nitrogen efficiency showed that when maize was fertilised using N100 fertilisation rate in combination with AB, AB+C and AB+H, the partial factor nitrogen productivity in 2020 was 86.0, 88.2 and 92.0 kg per maize grain kg-1 N respectively. Figure 6 shows a decrease in the partial factor productivity of nitrogen fertiliser when increasing the nitrogen fertilisation rates without the use of biological agents.
When nitrogen fertiliser was applied alone, the partial factor productivity of nitrogen varied considerably depending on the meteorological conditions of the year. The lowest nitrogen efficiency (46.1 kg maize grain per kg-1 N) was observed in 2021 when using the N180 fertilisation rate without the use of BP. With AB, the highest partial factor productivity of nitrogen (86.0 kg maize grain per kg-1 N) was observed when using the N100 fertilisation rate. Using the same fertilisation rate in combination with AB+C and AB+H, the partial factor productivity of nitrogen was 88.2 and 92.0 kg maize grain per kg-1 N respectively. The data show that, depending on the meteorological conditions of the year, the partial factor productivity of nitrogen tended to decrease but not significantly. Increasing the nitrogen fertilisation rate without the use of biological agents resulted in a decrease in nitrogen efficiency.
The correlation and regression analysis revealed negative very strong and statistically reliable negative correlations were found between the different nitrogen fertilisation rates (x – kg ha-1) and the partial factor productivity of nitrogen in terms of maize grain yield in all years of the study: r = -0.94 – -0.98, P < 0.01 (Table 4).
4. Discussion
The experiments we have carried out show that stable maize grain yields depend on the choice of cultivation technologies and their application to specific soil and climate conditions. Intensive farming technologies can have a negative impact on soil fertility, leading to environmental degradation and reduced plant yields and production quality. Biological fertilisers can offer an alternative to conventional inputs used in crop production.
Volatilisation, denitrification and leaching cause significant losses of nitrogen, therefore the main goal of this research is to improve maize productivity by improving the efficiency of nitrogen fertilisers through the use of nitrogen-fixing bacteria, phytohormones and humic acids. The data from the experiment suggest that, depending on the meteorological conditions of the year of production, a lower fertilisation rate can be chosen when using biological preparations.
Biofertilisers composed of nitrogen-fixing bacteria have been proposed as a substitute for (or in addition to) mineral nitrogen fertilisers in crop production to improve the availability of nutrients in the soil, to provide certain metabolites during the vegetative period of the plants, and to reduce the fertilisation rate [41]. This can be achieved by using soil microbes, in particular, the plant growth-promoting nitrogen-fixing bacteria Paenibacillus polymyxa MVY–024 (AB).
According to the relevant literature, the genus Paenibacillus has more than 100 species with valid names. Approximately 20 members of the genus Paenibacillus have been reported to have the capacity of fixing nitrogen [42]. The plant rhizosphere provides a habitat for functional micro-organisms, encompassing a complex and dynamic zone of interactions between networks of organisms and their plant hosts. A large part of strains isolated from the plant rhizosphere can directly or indirectly stimulate plant growth, development and evolution. These strains are called plant growth-promoting rhizobacteria. These bacteria can stimulate plant growth in a variety of ways, including fixing nitrogen from the atmosphere, solubilising phosphorus, synthesising siderophores, synthesising antimicrobial agents (antibiotics, bacteriocins and small peptides) and plant hormones such as indole, cytokinins or gibberellins [43].
Some Paenibacillus species may affect plant growth by one or more of these mechanisms. Environmentally friendly strains of Paenibacillus are the best option for replacing chemical fertilisers because of their wide host range and their ability to release plant growth-promoting substances and produce a variety of antimicrobial substances. Paenibacillus strains can increase the productivity of agricultural plants, including aboveground and root biomass [44].
Recently, ways to increase plant productivity have gone beyond nitrogen fertilisers to include foliar fertilisation, which is commonly used to correct nutrient deficiencies as plants develop. In addition to micronutrient fertilisers, plant growth regulators (phytohormones) have become widely used.
Singh et al. [45] suggest that the effect of each phytohormone may depend on the concentration or activity of another phytohormone, a mechanism known as cross-signalling. A mixture of different hormones used as foliar fertilisers can have either a detrimental or a beneficial effect on the plant, and studies have shown that different plant hormones (auxins and cytokinins) induce responses such as tillage improvement, although in most cases the responses are dependent on the varieties studied.
It is also difficult to predict how a plant may respond to phytohormones applied at early stages of vegetation, as tissue sensitivity may vary between plant species, and the thresholds of benefit or harm are strictly dependent on the rates of fertilisers and formulations applied, as well as on biotic and abiotic factors [46].
The experiment revealed that combinations of nitrogen-fixing bacteria (AB), phytohormones (C) and humic acids (H) significantly increased maize grain yield, while AB+C in combination with N140 fertilisation rate in 2021 showed no significant effect on grain yield. The data from the experiment suggest that, as reported by [46], the efficacy of biological preparations and their combinations (AB and AB+C) can be linked to fertilisation rates and environmental factors.
In terms of the partial factor productivity of nitrogen fertiliser, it was found that the studied biological preparations significantly increased the partial factor productivity of nitrogen fertiliser as compared to the control field when used in combination with the N100 fertilisation rate. When increasing fertilisation rates to N180 and using AB, no significant difference was found in 2021 and 2022 compared to the control field. Our findings are consistent with the biostimulatory effects of nitrogen-fixing bacteria, phytohormones, and humic acids on plant growth and development described in other studies [47]. During the experiment, in all cases, AB+H significantly increased the partial factor productivity of nitrogen fertiliser compared to the control field. As reported by [46], humic acids are active at relatively low concentrations, so the use of AB+H biological preparations resulted in an increase in the partial factor productivity of nitrogen fertiliser compared to the control field where BP was not applied. Souza et al. [47] also point out that the positive effect on plant condition is more likely to be caused by the use of phytohormones or other biological preparations, or by the large-scale reprogramming of genes involved in various plant growth processes.
It can be concluded that biological preparations play an important role in improving the efficiency of nitrogen fertilisers, however, increasing the nitrogen fertiliser rates up to N140 and N180 results in a decrease in the efficiency of biological preparations. The use of biological preparations in combination with lower nitrogen fertilisation rates allows a more efficient use of nitrogen fertiliser, leading to more sustainable and productive agricultural practices.
5. Conclusions
In all cases, the biological preparations and their combinations significantly increased maize grain yield compared to the control field (no use of biological preparations). The highest maize grain yield (11.5 t ha-1) was obtained in 2020 using the N180 fertilisation rate in combination with nitrogen–fixing bacteria and humic acids (AB+H). The biological preparations in combination with N significantly increased the 1000-grain weight and thus the grain yield per plant. Positive, strong, very strong and statistically reliable correlations were found in most cases between the different N fertilisation rates and the parameters studied: r = 0.76–0.94 (P < 0.01, P < 0.05). No statistically significant correlation was found between nitrogen fertilisation rates and the number of grains per cob (P > 0.05).
The highest partial factor productivity of nitrogen fertiliser (92.0 kg maize grain per kg-1 N) was observed in 2020 when maize was fertilised using the N100 fertilisation rate in combination with AB+H. Increasing the nitrogen fertilisation rate without the use of biological preparations resulted in a decrease in the partial factor productivity of nitrogen fertiliser. The highest partial factor productivity of nitrogen in all years of the study was obtained using the N100 fertilisation rate in combination with biological preparations. Very strong negative and statistically reliable correlations were found: r = -0.94 – -0.98, P < 0.01.
In summary, biological preparations have a significant potential to increase the efficiency of nitrogen fertilisers by stimulating the activity of the soil microbiota, improving plant nitrogen uptake and reducing fertiliser losses to the environment. Based on the results of the studies carried out and the experience gained, it would be worth further examining the combinations of different micro-organisms and their interactions with nitrogen fertilisers, and exploring combinations that bind nitrogen-fixing micro-organisms with phosphorus mobilisers or mycorrhizae, which can further improve the efficiency of nitrogen fertiliser. Continued research and the integrated use of biological preparations can contribute to building a more sustainable farming system, reducing environmental pollution and maintaining high agricultural productivity.
References
- Erenstein, O.; Jaleta, M.; Sonder, K.; Mottaleb, K.; Prasanna, B.M. Gobal maize production, consumption and trade: trends and R&D implications. Food Secur. 2022, 14, 1295–1319. [Google Scholar]
- Széles, A.; Horváth, E.; Simon, K.; Zagyi, P.; Huzsvai, L. Maize production under drought stress: nutrient supply, yield prediction. Plants 2023, 12, 3301. [Google Scholar] [CrossRef]
- Nassar, M.A.A.; El-Magharby, S.S.; Ibrahim, N.S.; Kandil, E.E.; Abdelsalam, N.R. Productivity and quality variations in sugar beet induced by soil application of K-Humate and foliar application of biostimulants under salinity condition. J. Soil Sci. Plant Nutr. 2023, 23, 872–3887. [Google Scholar] [CrossRef]
- Rácz, D.; Szőke, L.; Tóth, B.; Kovács, B.; Horváth, É.; Zagyi, P.; Duzs, L.; Széles, A. Examination of the productivity and physiological responses of maize (Zea mays L.) to nitrapyrin and foliar fertilizer treatments. Plants 2021, 10, 2426. [Google Scholar] [CrossRef]
- Ocwa, A.; Harsányi, E.; Széles, A.; Holb, J.; Szabó, S.; Rátonyi, T.; Mohammed, S. A bibliographic review of climate change and fertilization as the main drivers of maize yield: implications for food security. Agric. Food Secur. 2023, 12, 2–18. [Google Scholar] [CrossRef]
- Popescu, G.C. Biostimulants and agri-environment measures in order to increase the agricultural sustainability. Symposium on Advanced Engineering Technologies, 2019. 15–19.
- Ördög, V.; Stirk, W.A.; Takacs, G.; Pothe, P.; Illes, A.; Bojtor, C.; Szeles, A.; Toth, B.; Van Staden, J.; Nagy, J. Plant biostimulating effects of the cyanobacterium Nostoc piscinale on maize (Zea mays L.) in field experiments. S. Afr. J. Bot. 2021, 140, 153–160. [Google Scholar] [CrossRef]
- Halpern, M.; Bar-Tal, A.; Ofek, M.; Minz, D.; Muller, T.; Yermiyahu, U. The use of biostimulants for enhancing nutrient uptake. Adv. Agron. 2015, 130, 141–174. [Google Scholar]
- Szczepanek, M.; Wilczewski, E. Maize response to soil-applied humic substances and foliar fertilization with potassium. J. Anim. Plant Sci. 2016, 26, 1298–1303. [Google Scholar]
- Efthimiadou, A.; Katsenios, N.; Chanioti, S.; Giannoglou, M.; Djordjevic, N.; Katsaros, G. Effect of foliar and soil application of plant growth promoting bacteria on growth, physiology, yield and seed quality of maize under Mediterranean conditions. Sci. Rep. 2020, 10, 1–11. [Google Scholar] [CrossRef]
- Tripaldi, C.; Novero, M.; Di Giovanni, S.; Chiarabaglio, P.M.; Lorenzoni, P.; Meo Zilio, D.; Palocci, G.; Balconi, C.; Aleandri, R. Impact of mycorrhizal fungi and rhizosphere microorganisms on maize grain yield and chemical composition. Pak. J. Agric. Sci. vol. 2017, 54, 857–865. [Google Scholar]
- Długosz, J.; Piotrowska-Długosz, A.; Kotwica, K.; Przybyszewska, E. Application of multi-component conditioner with clinoptilolite and ascophyllum nodosum extract for improving soil properties and Zea mays L. growth and yield. Agronomy 2020, 10, 1–22. [Google Scholar] [CrossRef]
- Canellas, L.P.; Balmori, D.M.; Médici, L.O.; et al. A combination of humic substances and Herbaspirillum seropedicae inoculation enhances the growth of maize (Zea mays L.). Plant Soil 2013, 366, 119–132. [Google Scholar] [CrossRef]
- Torun, H.; Toprak, B. Arbuscular Mycorrhizal Fungi and K-Humate combined as biostimulants: changes in antioxidant defense system and radical scavenging capacity in Elaeagnus angustifolia. J. Soil Sci. Plant Nutr. 2020, 20, 2379–2393. [Google Scholar] [CrossRef]
- Asibi, E.A.; Chai, Q.; Coulter, J.A. Mechanisms of Nitrogen Use in Maize. Agronomy 2019, 9, 775. [Google Scholar] [CrossRef]
- Zayed, O.; Hewedy, O.A.; Abdelmoteleb, A.; Mohammed, A.; Youssef, M.S.; Roumia, A.F.; Seymour, D.; Ze-Chun, Y. Nitrogen Journey in Plants: From Uptake to Metabolism, Stress Response, and Microbe Interaction. Biomolecules 2023, 25, 1443. [Google Scholar] [CrossRef] [PubMed]
- Hirel, B.; Tétu, T.; Lea, P.J.; Dubois, F. Improving nitrogen use efficiency in crops for sustainable agriculture. Sustainability 2011, 3, 1452–1485. [Google Scholar] [CrossRef]
- Wichern, F.; Mayer, J.; Joergensen, R.G.; Müller, T. Release of C and N from roots of peas and oats and their availability to soil microorganisms. Soil Biol. Biochem. 2007, 39, 2829–2839. [Google Scholar] [CrossRef]
- Talla, S.K.; Panigrahy, M.; Kappara, S.; Nirosha, P.; Neelamraju, S.; Ramanan, R. Cytokinin delays dark-induced senescence in rice by maintaining the chlorophyll cycle and photosynthetic complexes. J. Exp. Bot. 2016, 67, 1839–1851. [Google Scholar] [CrossRef] [PubMed]
- Márquez, G.; Alarcón, M.V.; Salguero, J. Cytokinin Inhibits Lateral Root Development at the Earliest Stages of Lateral Root Primordium Initiation in Maize Primary Root. J. Plant Growth Regul. 2019, 38, 83–92. [Google Scholar] [CrossRef]
- Wybouw, B.; De Rybel, B. Cytokinin–a developing story. Trends Plant Sci. 2019, 24, 177–185. [Google Scholar] [CrossRef] [PubMed]
- Janečková, H.; Husičková, A.; Lazár, D.; Ferretti, U.; Pospíšil, P.; Špundová, M. Exogenous application of cytokinin during dark senescence eliminates the acceleration of photosystem II impairment caused by chlorophyll b deficiency in barley. Plant Physiol. Biochem. 2019, 136, 43–51. [Google Scholar] [CrossRef] [PubMed]
- Kudo, T.; Kiba, T.; Sakakibara, H. Metabolism and long-distance translocation of cytokinins. J. Integr. Plant Biol. 2010, 52, 53–60. [Google Scholar] [CrossRef]
- Kusaba, M.; Tanaka, A.; Tanaka, R. Stay-green plants: What do they tell us about the molecular mechanism of leaf senescence. Photosynth. Res. 2013, 117, 221–234. [Google Scholar] [CrossRef] [PubMed]
- Burr, C.A.; Sun, J.; Yamburenko, M.V.; Willoughby, A.; Hodgens, C.; Boeshore, S.L.; Elmore, A.; Atkinson, J.; Nimchuk, Z.L.; Bishopp, A. The HK5 and HK6 cytokinin receptors mediate diverse developmental pathways in rice. Development. 2020, 147, 1–12. [Google Scholar] [CrossRef]
- Schaller, G.E.; Street, I.H.; Kieber, J.J. Cytokinin and the cell cycle. Curr. Opin. Plant Biol. 2014, 21, 7–15. [Google Scholar] [CrossRef] [PubMed]
- Drulis, P.; Kriaučiūnienė, Z.; Liakas, V. The Effect of combining N-fertilization with urease inhibitors and biological preparations on maize biological productivity. Agronomy 2022, 12, 2264. [Google Scholar] [CrossRef]
- Drulis, P.; Kriaučiūnienė, Z.; Liakas, V. The influence of different nitrogen fertilizer rates, urease inhibitors, and biological preparations on maize grain yield and yield structure elements. Agronomy 2022, 12, 741. [Google Scholar] [CrossRef]
- Mazid, M.; Khan, T.A. Future of Bio-fertilizers in Indian agriculture: An Overview. Int. J. Agric. Food Res. 2014, 3, 10–23. [Google Scholar] [CrossRef]
- Hindersah, R.; Kamaluddin, N.N.; Samanta, S.; Banerjee, S.; Sarkar, S. Role and perspective of Azotobacter in crops production. STJSSA 2020, 21, 170–179. [Google Scholar] [CrossRef]
- Jadhav, H.P.; Sayyed, R.Z. Hydrolytic enzymes of rhizospheric microbes in crop protection. MOJ Cell Sci. Rep. 2016, 3, 135–136. [Google Scholar]
- Romero-Perdomo, F.; Abril, J.; Camelo, M.; Moreno-Galvįn, A.; Pastrana, I.; Rojas-Tapias, D.; Bonilla, R. Azotobacter chroococcum as a potentially useful bacterial biofertilizer for cotton (Gossypium hirsutum): Effect in reducing N fertilization. Rev. Argent. Microbiol. 2017, 49, 377–383. [Google Scholar] [CrossRef]
- Hindersah, R.; Kalay, M.; Talahaturuson, A.; Lakburlawal, Y. Nitrogen fixing bacteria azotobacter as biofertilizer and biocontrol in long bean. Agric. 2018, 30, 25–32. [Google Scholar] [CrossRef]
- Daud, N.S.; Din, A.R.J.M.; Rosli, M.A.; Azam, Z.M.; Othman, N.Z.; Sarmidi, M.R. Paenibacillus polymyxa bioactive compounds for agricultural and biotechnological applications. Biocatal. Agric. Biotechnol. 2019, 18, 101092. [Google Scholar] [CrossRef]
- Huang, P.; Zhang, J.; Zhu, A.; Li, X.; Ma, D.; Xin, X.; et al. Nitrate accumulation and leaching potential reduced by coupled water and nitrogen management in the Huang-Huai-Hai Plain. Sci. Total Environ. 2018, 610, 1020–1028. [Google Scholar] [CrossRef] [PubMed]
- Fixen, P.; Brentrup, F.; Bruulsema, T.; Garcia, F.; Norton, R.; Zingore, S. Nutrient/fertilizer use efficiency; measurement, current situation and trends. In P. Drechsel, et al., (Eds.), Managing water and fertilizer for sustainable agricultural intensification. International Fertilizer Industry Association (IFA), international Water Management Institute (IWMI), International Plant Nutrition Institute (IPNI), and International Potash Institute (IPI) 1st ed, Paris, France, 2014, pp. 8–38.
- IUSS Working Group WRB. World Reference Base for Soil Resources. International soil classification system for naming soils and creating legends for soil maps. 4th edition. International Union of Soil Sciences (IUSS), Vienna, Austria, 2022. Adetunji, A.
- Dobermann, A.R. Nitrogen use efficiency-state of the art. Agronomy--Faculty Publications 2005, 316, 1–17. [Google Scholar]
- Tarakanovas, P.; Raudonius, S. Agronominių tyrimų duomenų statistinė analizė taikant kompiuterines programas ANOVA, STAT, SPLIT-PLOT iš paketo SELEKCIJA ir IRRISTAT. Akademija, 2003, pp. 56.
- Raudonius, S. Application of statistics in plant and crop research: important issues. Zemdirbystė 2017, 104, 377–382. [Google Scholar] [CrossRef]
- Leite, L.F.C.; Mendonça, E.S.; Machado, P.L.O.A. Influence of organic and mineral fertilisation on organic matter fractions of a Brazilian Acrisol under maize/common bean intercrop. Soil Res. 2007, 45, 25–32. [Google Scholar] [CrossRef]
- Wang, L.Y.; Li, J.; Li, Q.X.; Chen, S.F. Paenibacillus beijingensis sp. nov., a nitrogen-fixing species isolated from wheat rhizosphere soil. Antonie Van Leeuwenhoek 2014, 104, 675–683. [Google Scholar] [CrossRef]
- Mohamed, I.; Eid, K.E.; Abbas, M.H.H.; Salem, A.A.; Ahmed, N.; Ali, M.; Shah, G.M.; Fang, C. Use of plant growth promoting Rhizobacteria (PGPR) and mycorrhizae to improve the growth and nutrient utilization of common bean in a soil in fected with white rot fungi. Ecotoxicol. Environ. Saf. 2019, 171, 539–548. [Google Scholar] [CrossRef]
- Singh, T.; Bisht, N.; Ansari, M.M.; Mishra, S.K.; Chauhan, P.S. Paenibacillus lentimorbus alleviates nutrient deficiency-induced stress in Zea mays by modulating root system architecture, auxin signaling, and metabolic pathways. Plant Cell Rep. 2024, 43, 49. [Google Scholar] [CrossRef] [PubMed]
- Singh, A.; Yajnik, K.N.; Mogilicherla, K.; Singh, I.K. Deciphering the role of growth regulators in enhancing plant immunity against herbivory. Physiol. Plant. 2024, 176, 1–13. [Google Scholar] [CrossRef] [PubMed]
- Faccin, D.; Di Piero, R.M. Extracts and fractions of humic substances reduce bacterial spot severity in tomato plants, improve primary metabolism and activate the plant defense system. Physiol. Mol. Plant Pathol. 2022, 121, 101877. [Google Scholar] [CrossRef]
- Souza, A.C.; Olivares, F.L.; Peres, L.E.P.; Piccolo, A.; Canellas, L.P. Plant hormone crosstalk mediated by humic acids. Chem. Biol. Technol. Agric. 2022, 9, 29. [Google Scholar] [CrossRef]
Figure 1.
Meteorological conditions, Kaunas Weather Station, 2020–2022.
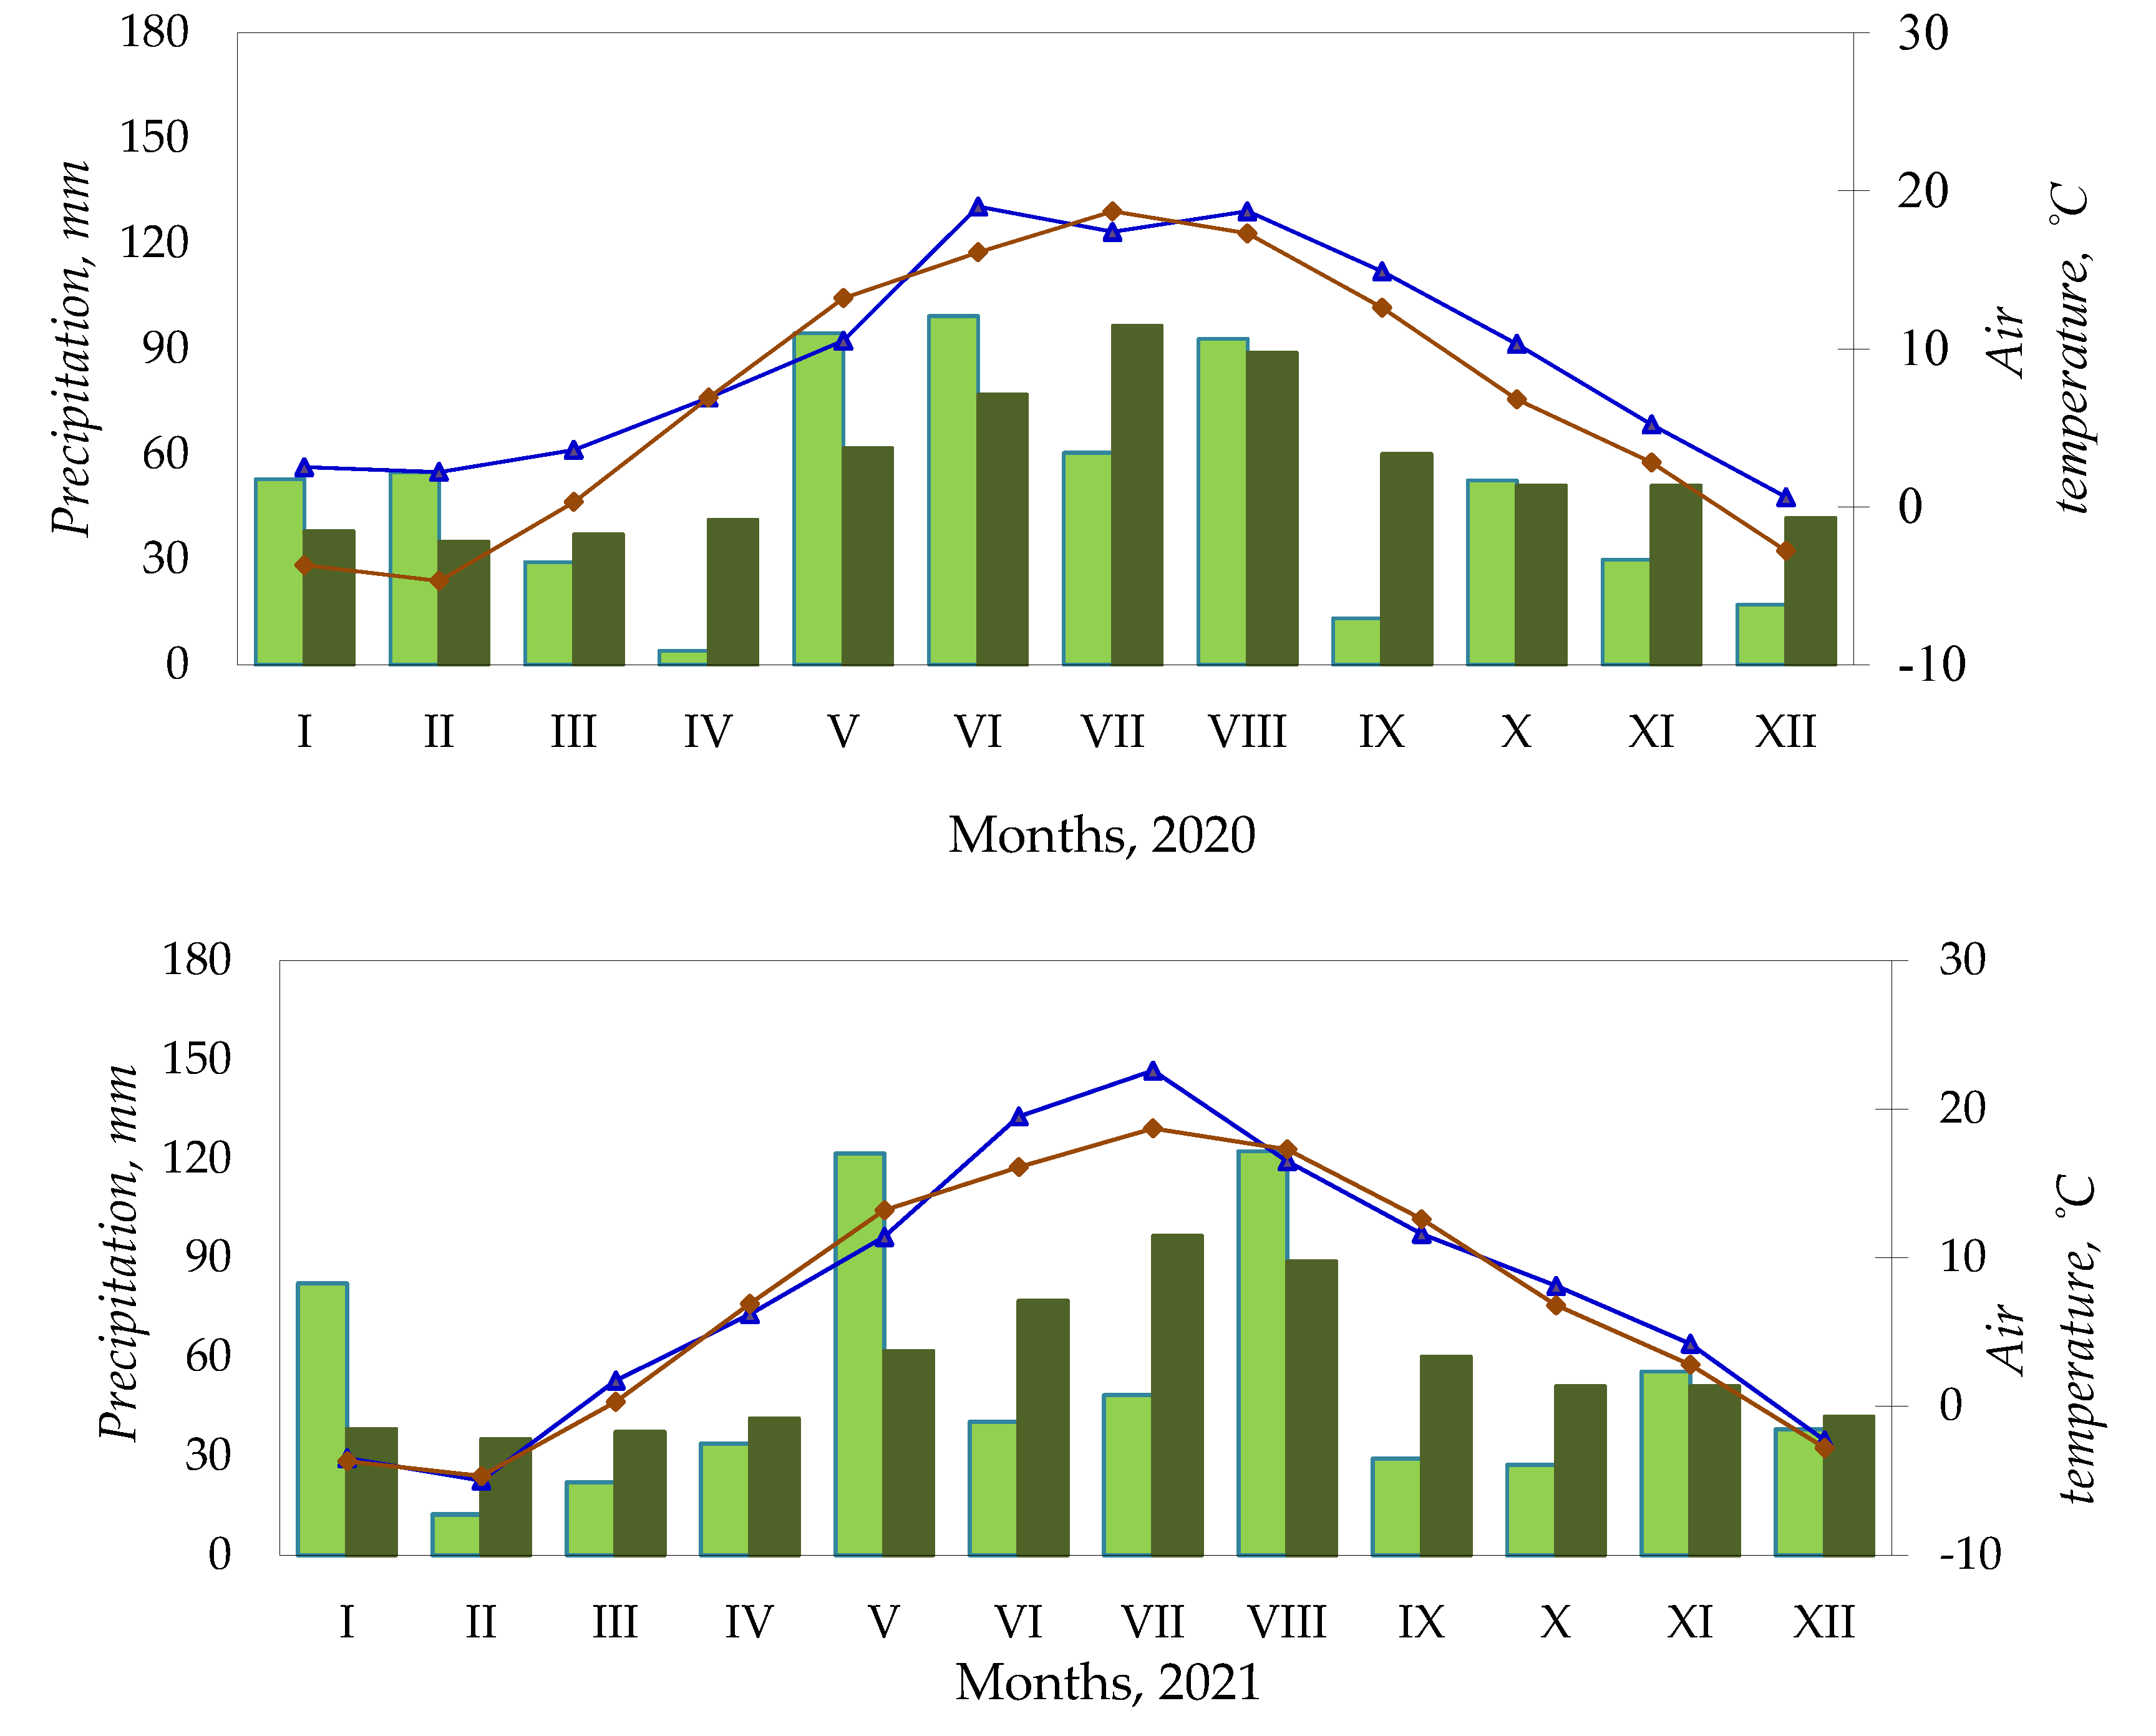
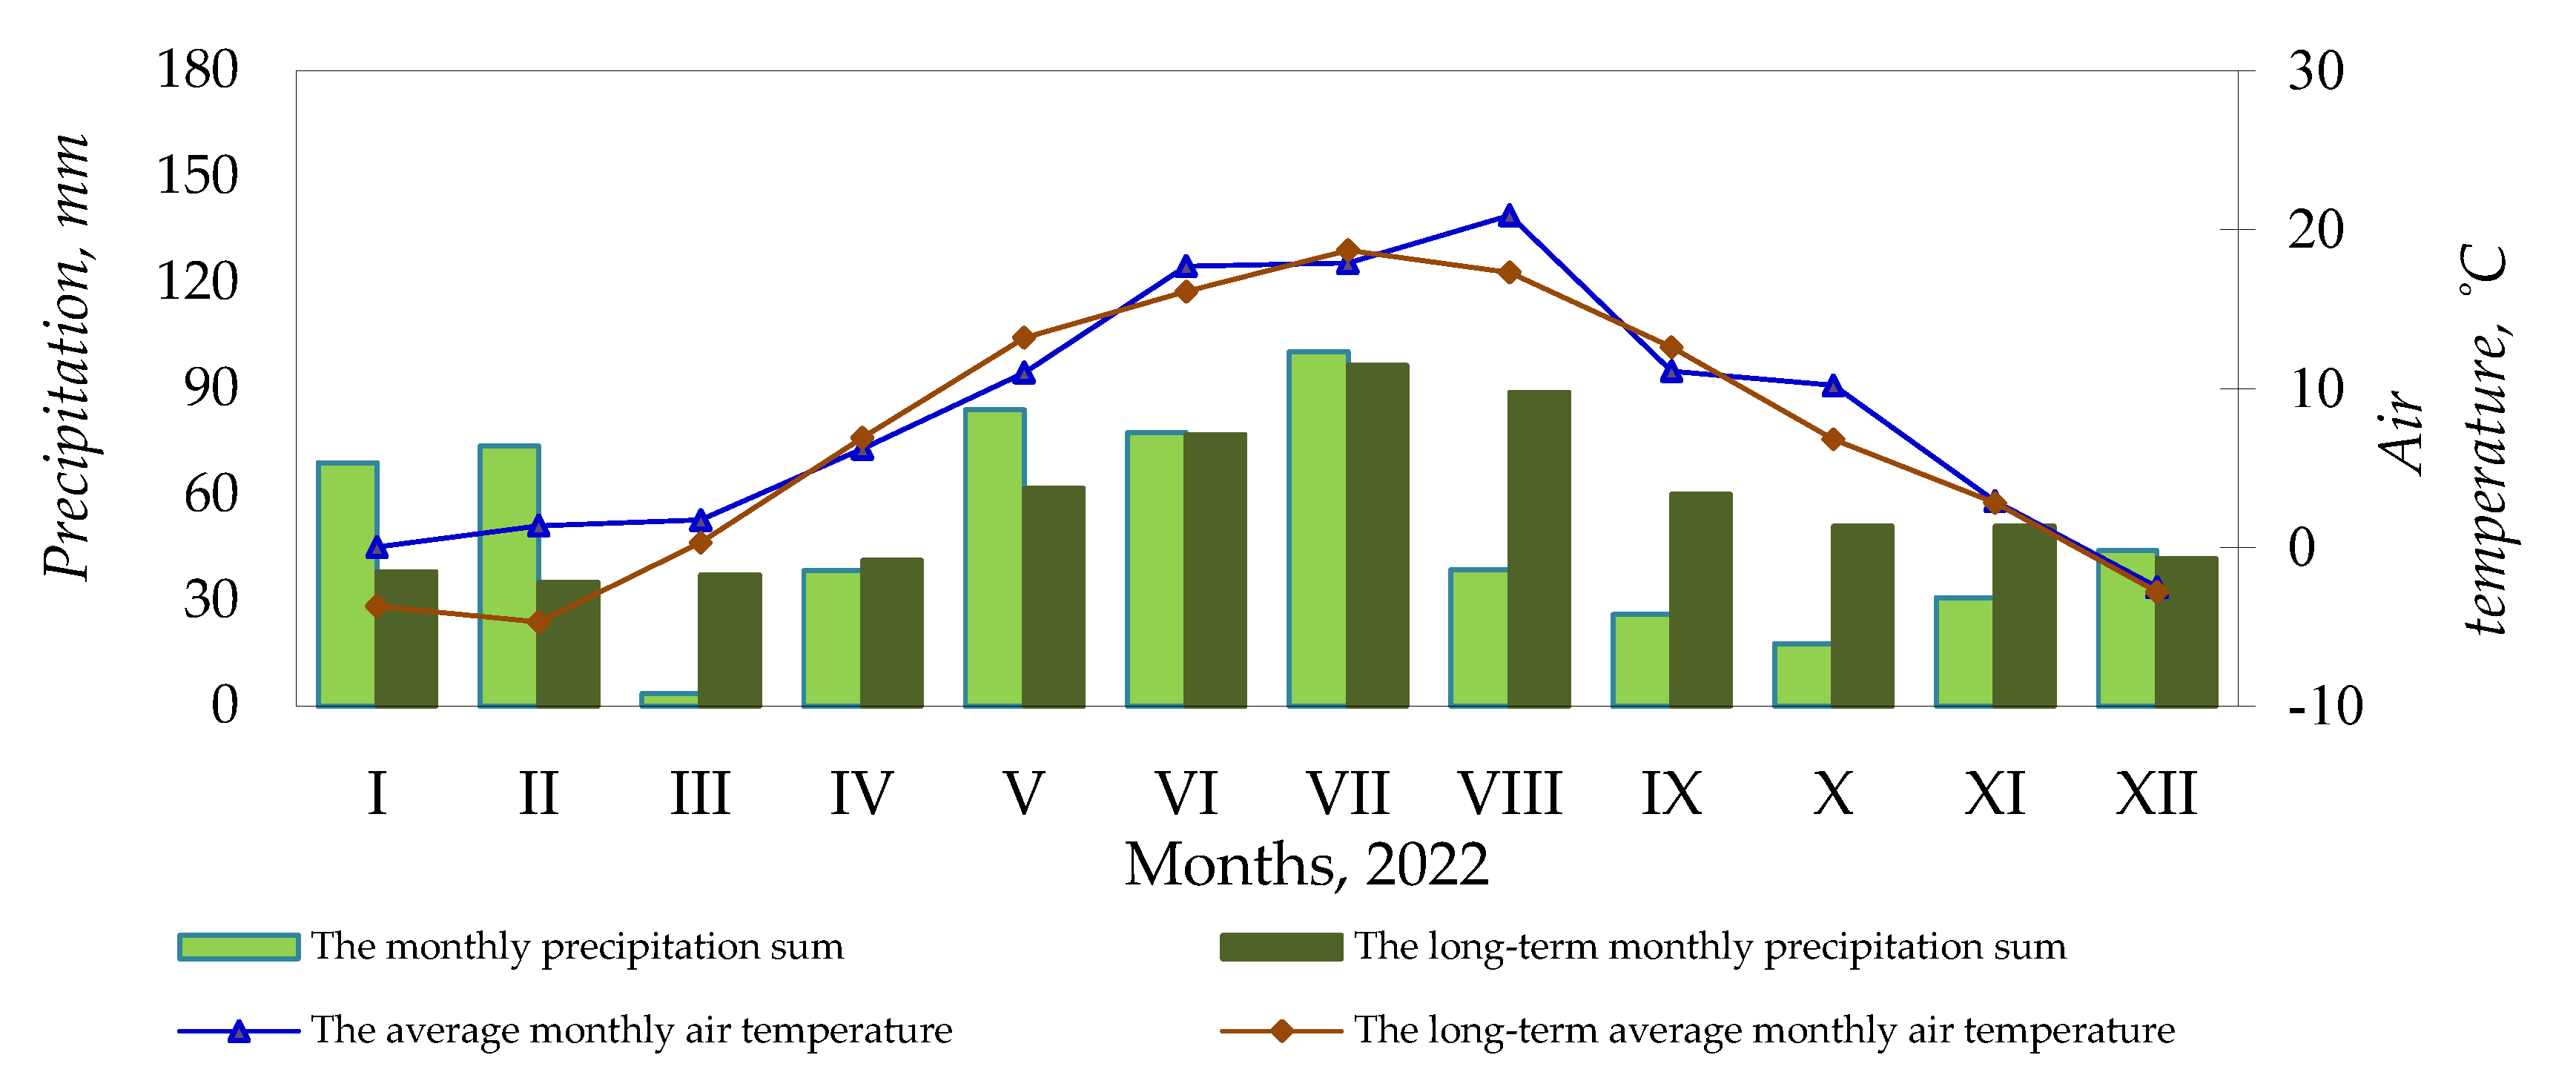
Figure 2.
Effects of nitrogen fertilisation rates and biological combinations on maize grain yields, 2020–2022. Note: abbreviations (for Factor B): Factor B – use of biological preparations (BP): (Without BP) no biological preparations were used; (AB) biological preparation – nitrogen bacteria (1.0 l ha-1) applied to the soil surface immediately after sowing in combination with KAS-32; (AB+C) biological preparations – nitrogen bacteria (1.0 l ha-1) applied to the soil surface immediately after sowing in combination with KAS-32, and Cytokinin (0.7 l ha-1) spread at the 6 leaf stage; (AB+H) biological preparations – nitrogen bacteria (1.0 l ha-1) and humic acids (1.0 kg ha-1) applied to the soil surface immediately after sowing in combination with KAS-32. The differences between the means of the treatments without the same letters are significant (P < 0.05). Vertical lines represent errors of the means.
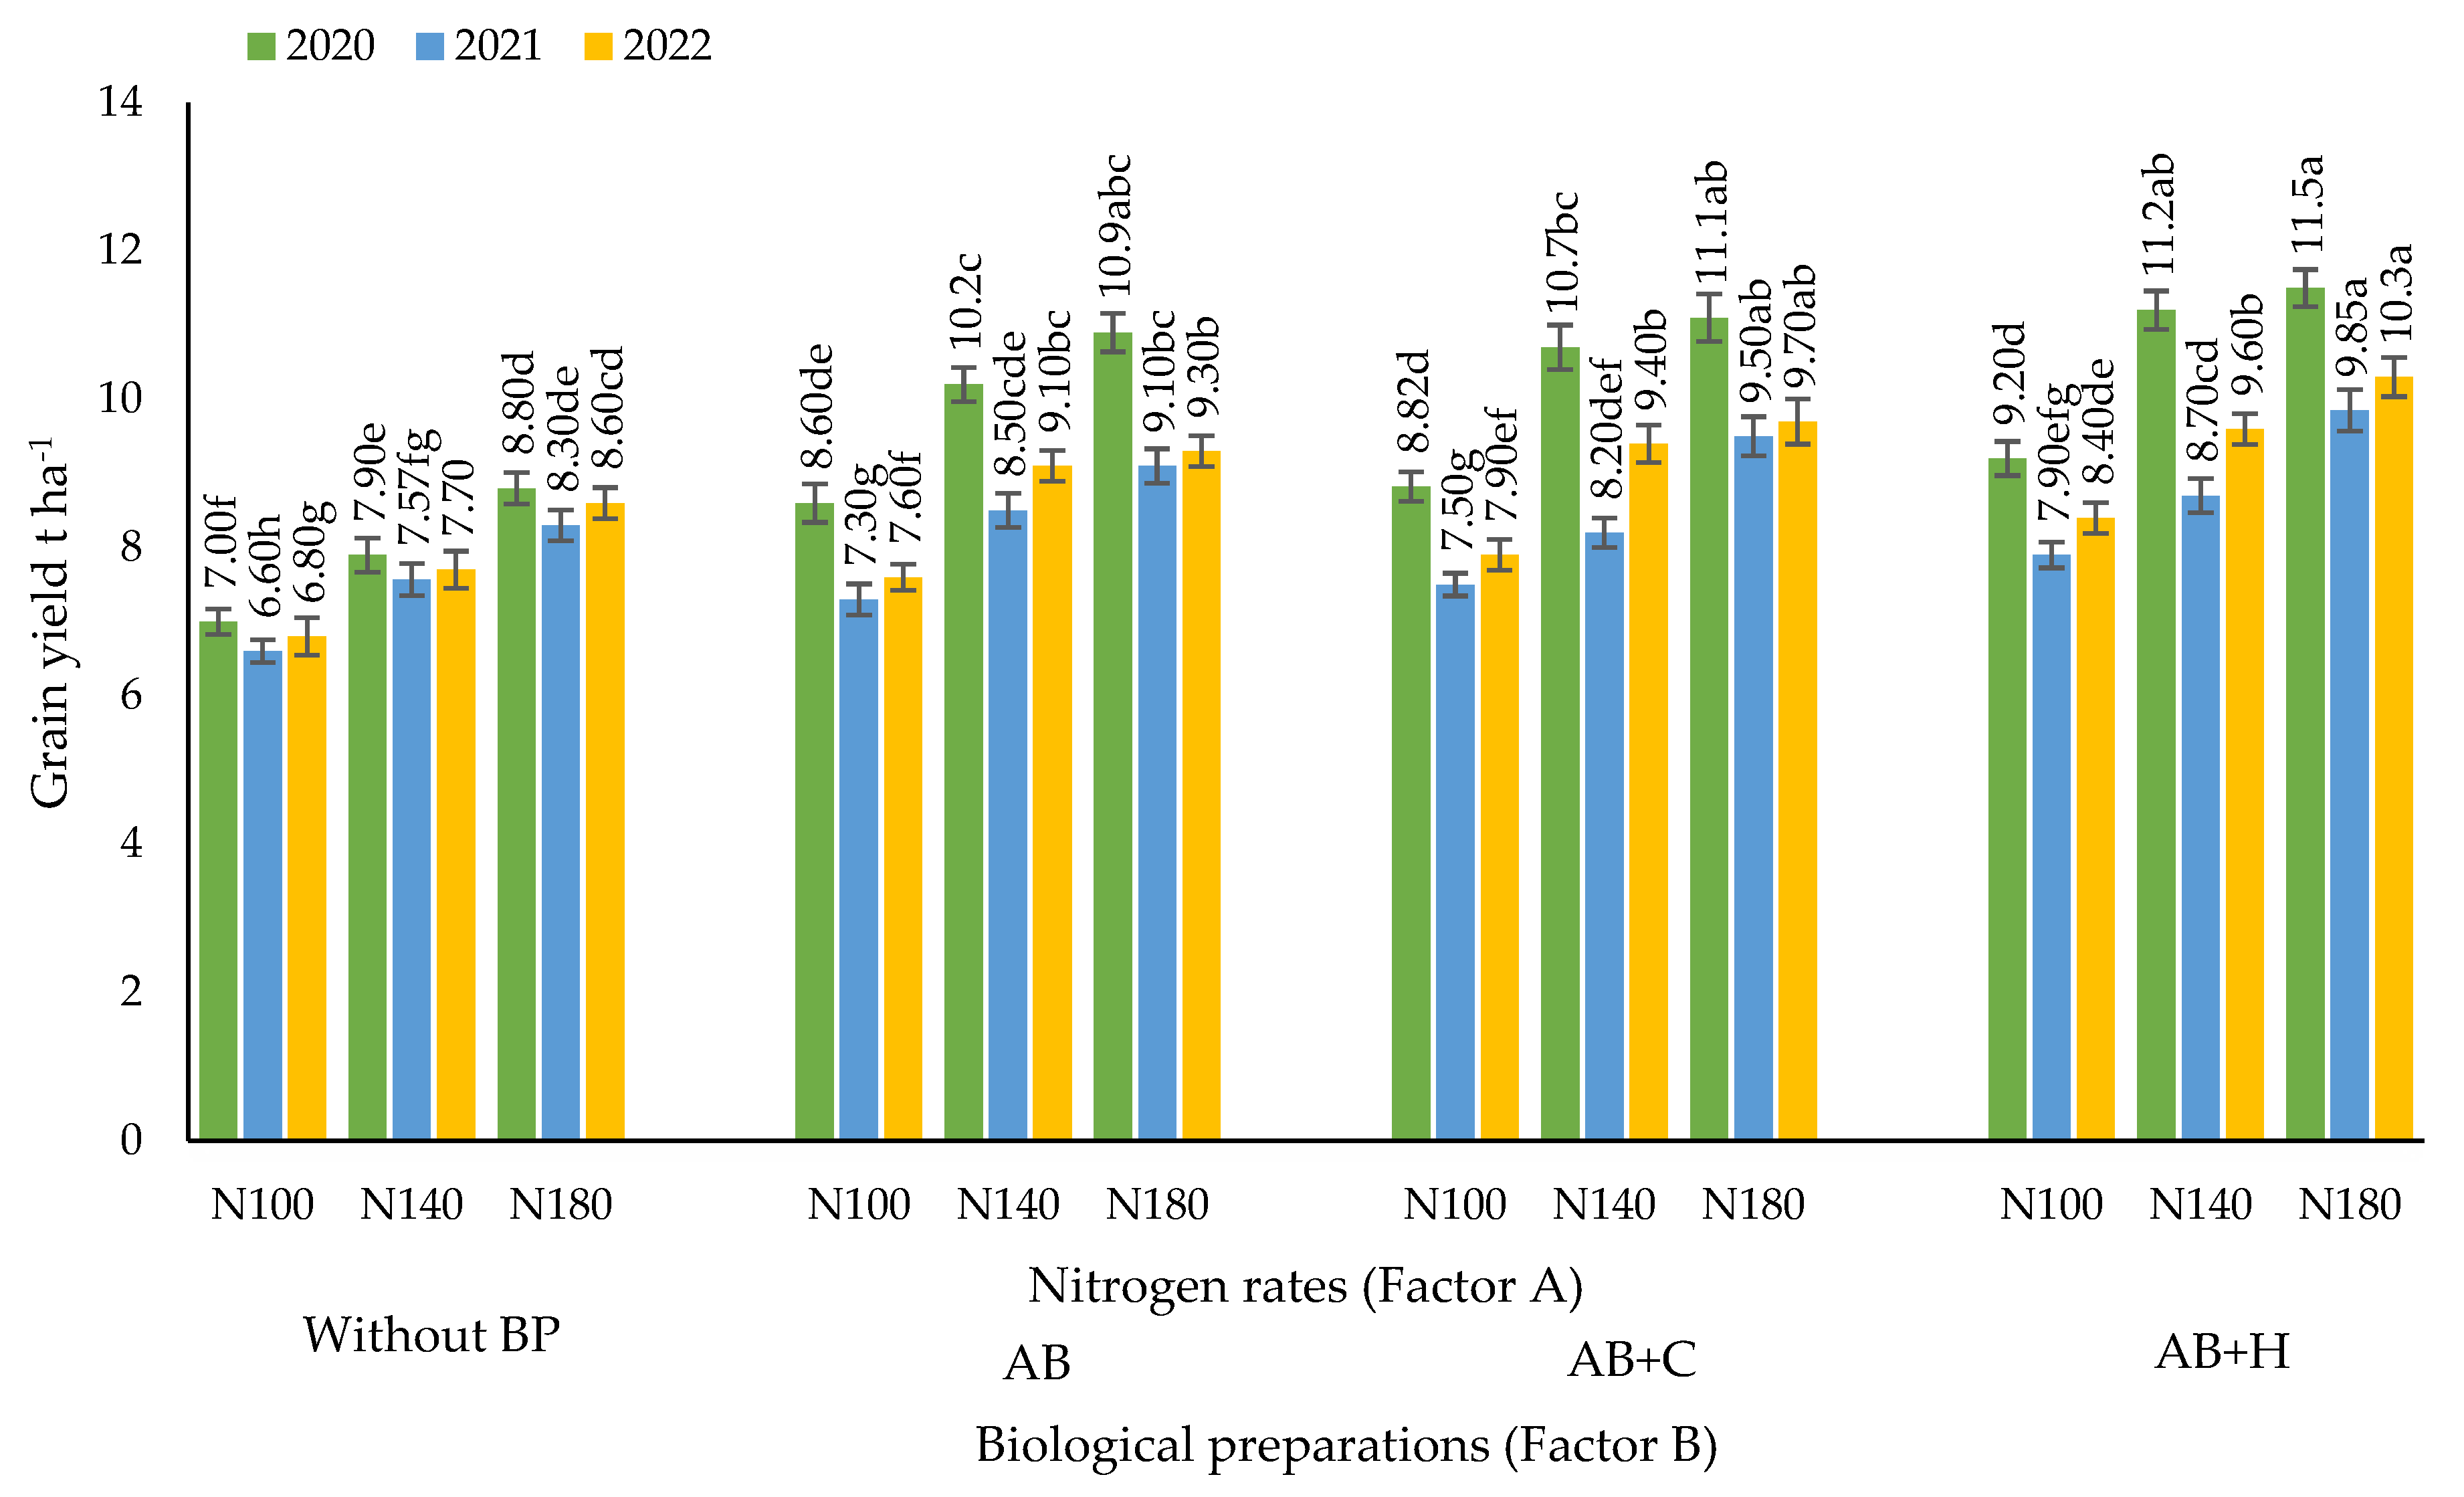
Figure 3.
Effects of nitrogen fertilisation rates and biological preparations on average maize grain yield per plant, 2020–2022. Note: Factor B – use of biological preparations (BP): (Without BP) no biological preparations were used; (AB) biological preparation – nitrogen bacteria (1.0 l ha-1) applied to the soil surface immediately after sowing in combination with KAS-32; (AB+C) biological preparations – nitrogen bacteria (1.0 l ha-1) applied to the soil surface immediately after sowing in combination with KAS-32, and Cytokinin (0.7 l ha-1) spread at the 6 leaf stage; (AB+H) biological preparations – nitrogen bacteria (1.0 l ha-1) and humic acids (1.0 kg ha-1) applied to the soil surface immediately after sowing in combination with KAS-32. The differences between the means of the treatments without the same letters are significant (P < 0.05). Vertical lines represent errors of the means.
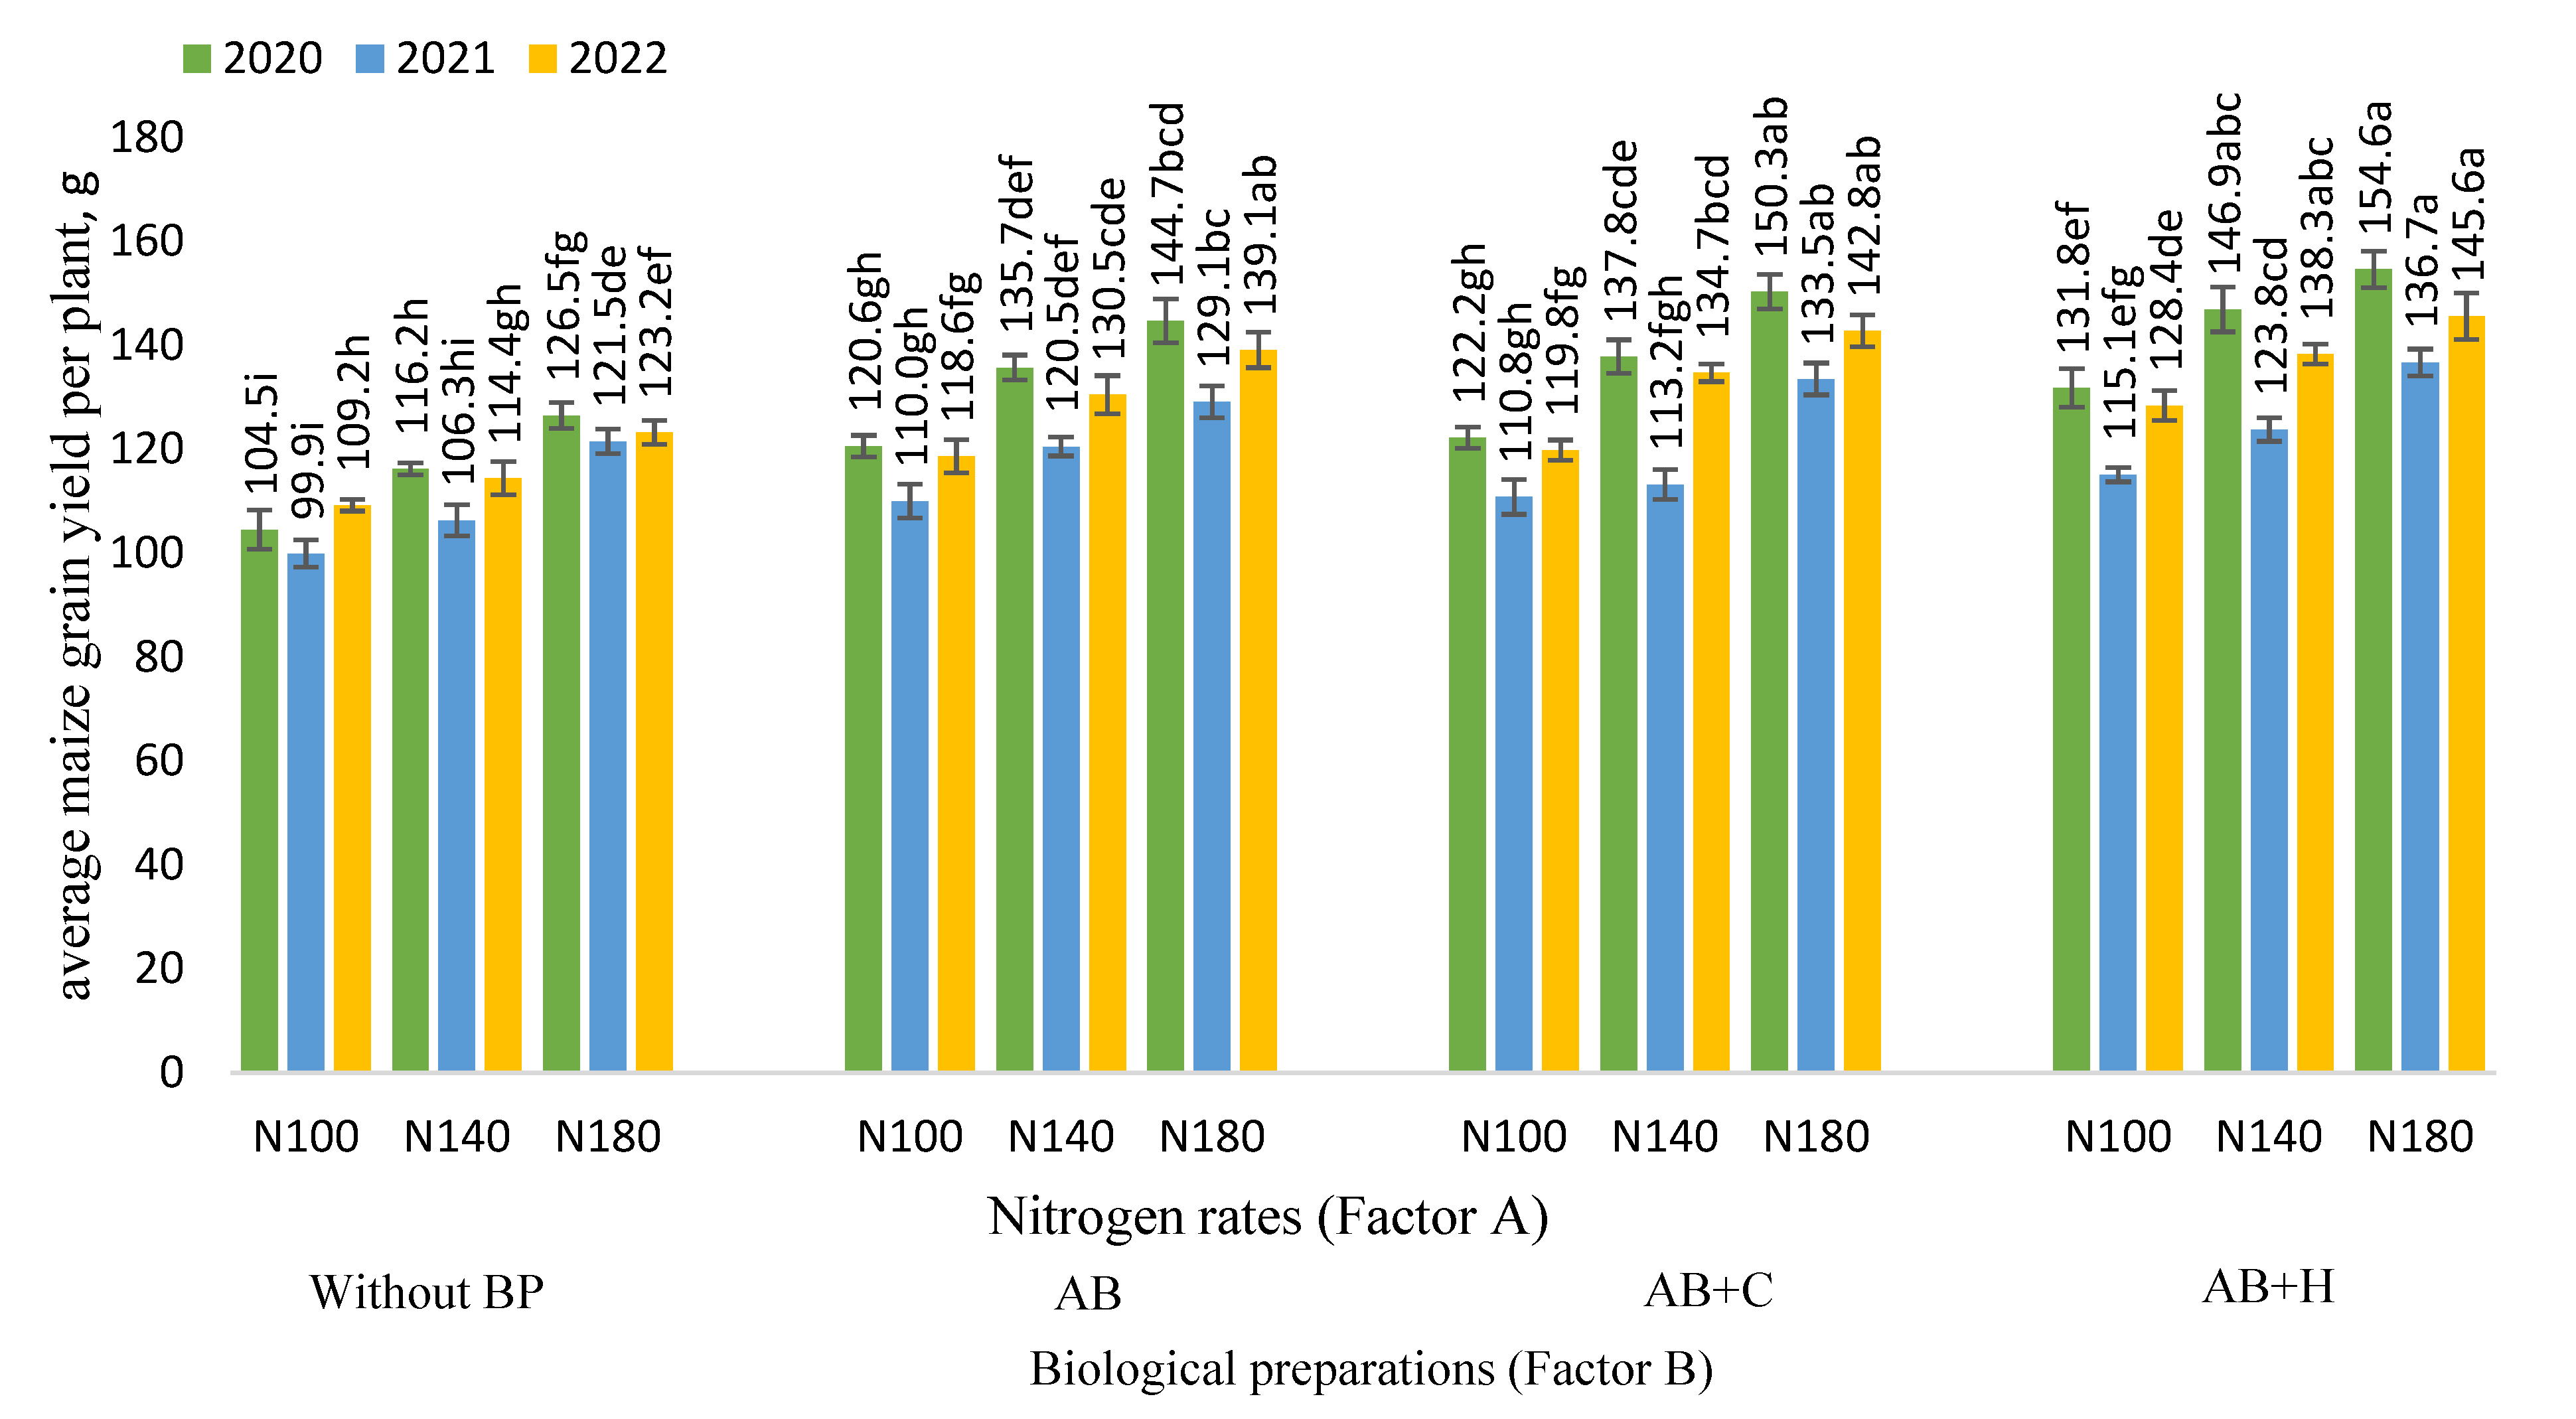
Figure 4.
Effects of nitrogen fertilisation rates and biological preparations on the 1000-grain weight of maize, 2020–2022. Note: Factor B – use of biological preparations (BP): (Without BP) no biological preparations were used; (AB) biological preparation – nitrogen bacteria (1.0 l ha-1) applied to the soil surface immediately after sowing in combination with KAS-32; (AB+C) biological preparations – nitrogen bacteria (1.0 l ha-1) applied to the soil surface immediately after sowing in combination with KAS-32, and Cytokinin (0.7 l ha-1) spread at the 6 leaf stage; (AB+H) biological preparations – nitrogen bacteria (1.0 l ha-1) and humic acids (1.0 kg ha-1) applied to the soil surface immediately after sowing in combination with KAS-32. The differences between the means of the treatments without the same letters are significant (P < 0.05). Vertical lines represent errors of the means.
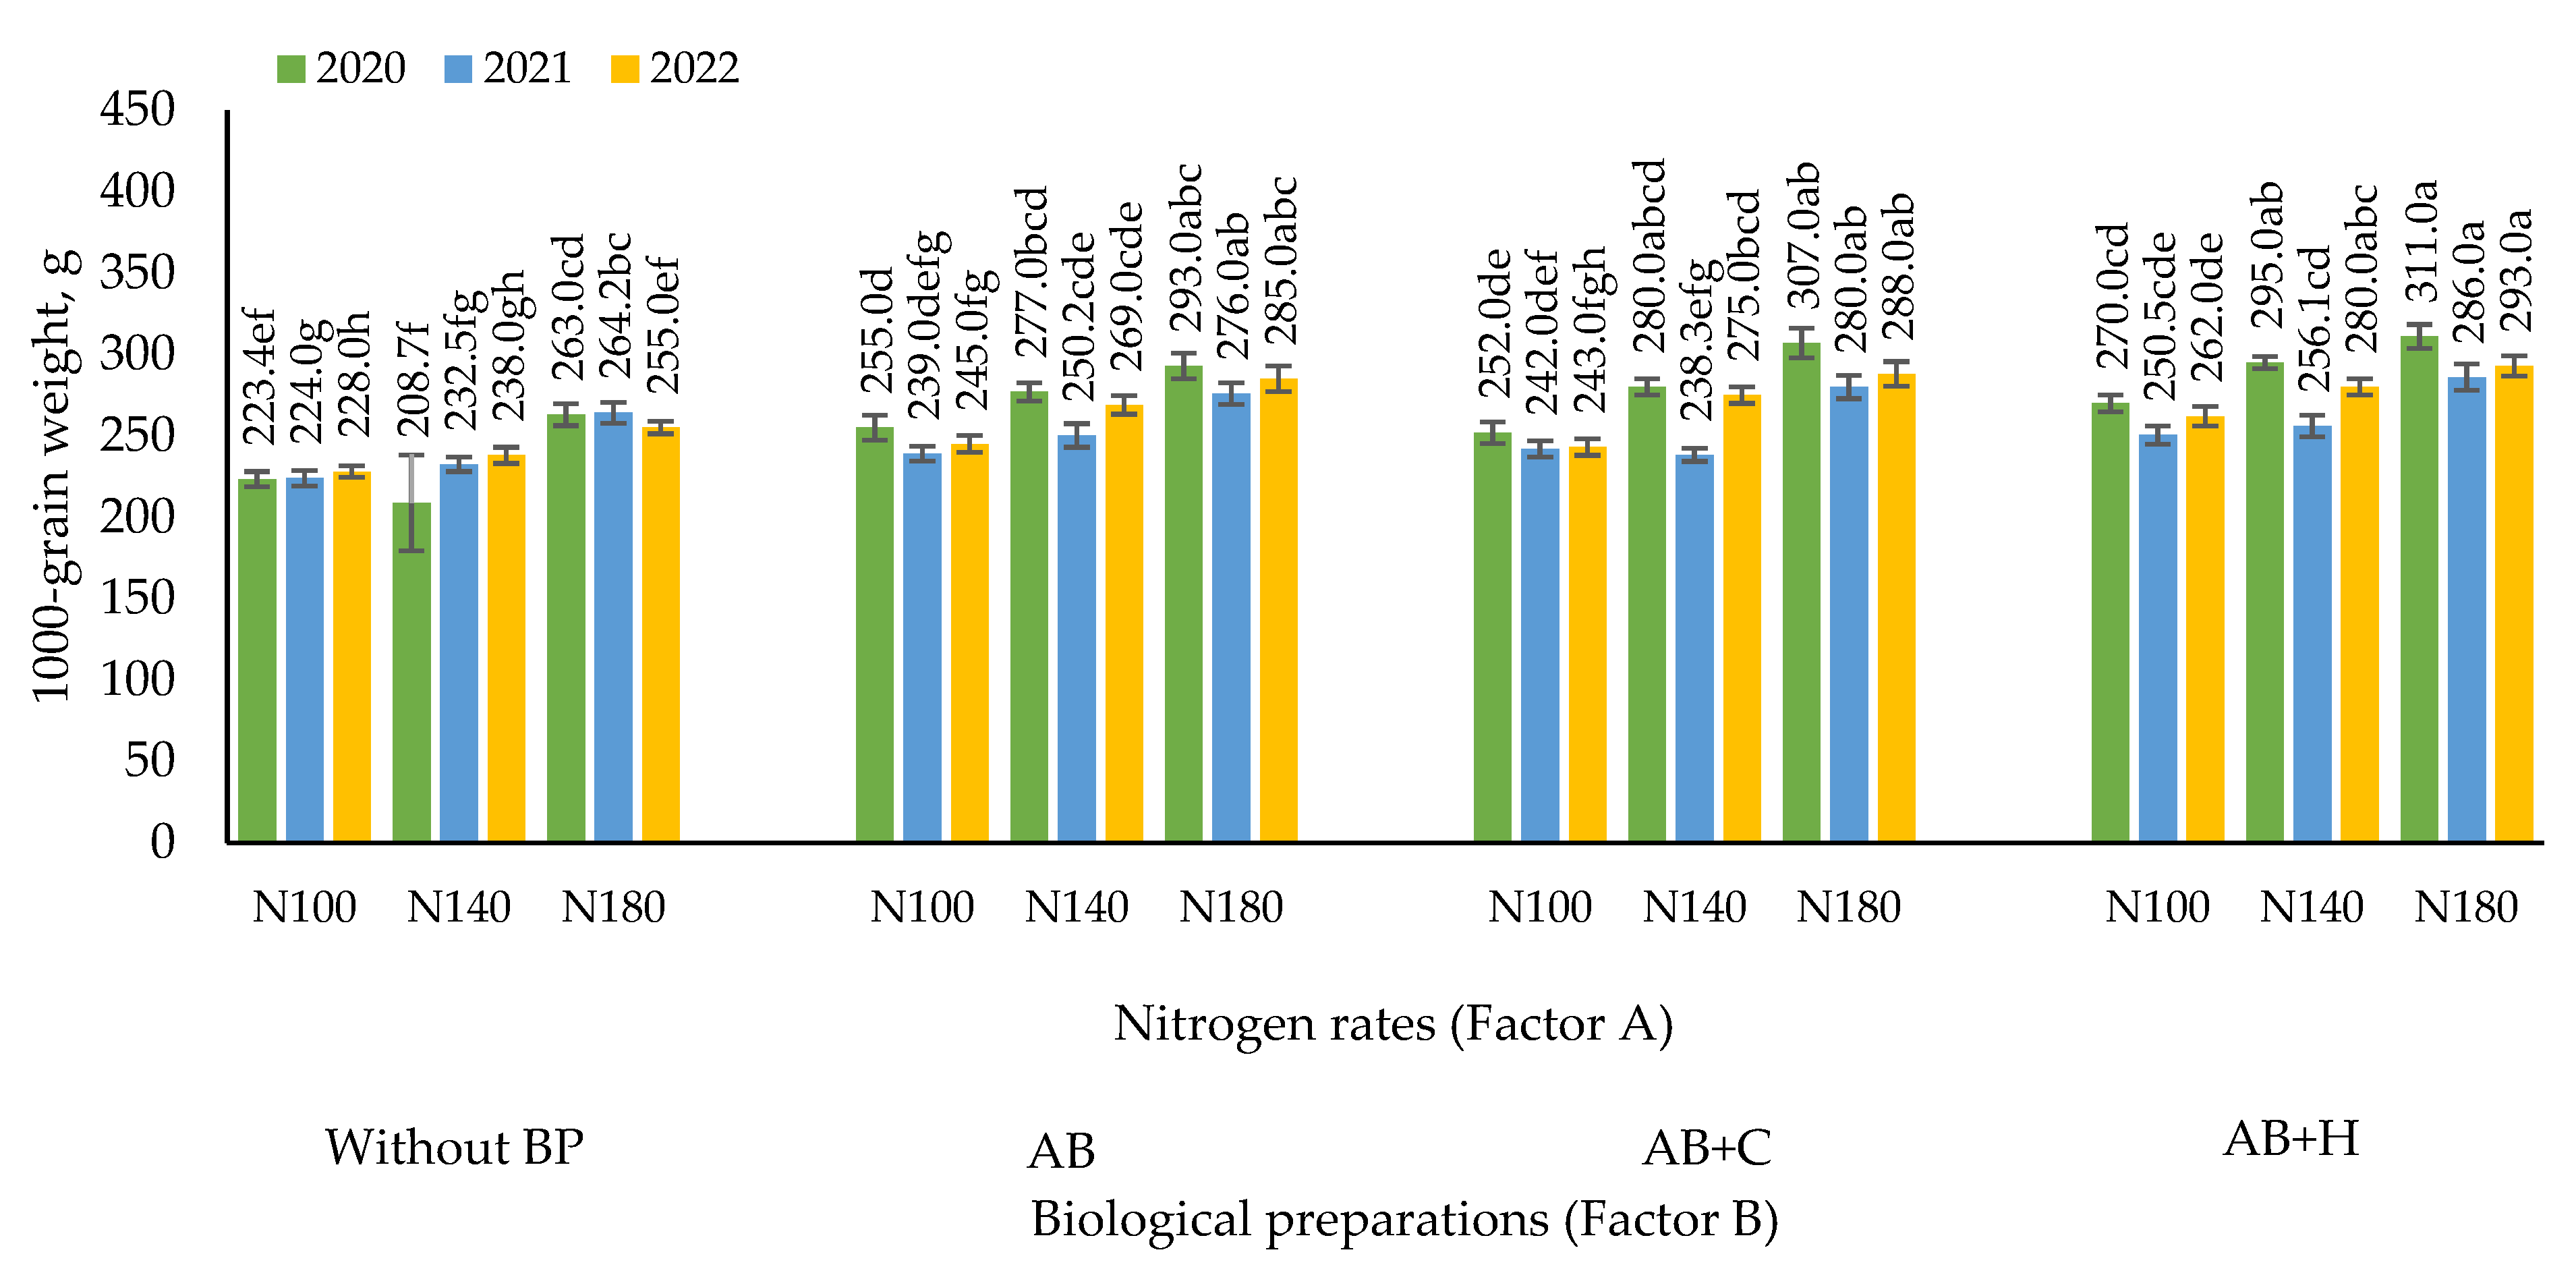
Figure 5.
Effects of nitrogen fertilisation rates and biological preparations on the number of maize grains per cob, 2020–2022. Note: Factor B – use of biological preparations (BP): (Without BP) no biological preparations were used; (AB) biological preparation – nitrogen bacteria (1.0 l ha-1) applied to the soil surface immediately after sowing in combination with KAS-32; (AB+C) biological preparations – nitrogen bacteria (1.0 l ha-1) applied to the soil surface immediately after sowing in combination with KAS-32, and Cytokinin (0.7 l ha-1) spread at the 6 leaf stage; (AB+H) biological preparations – nitrogen bacteria (1.0 l ha-1) and humic acids (1.0 kg ha-1) applied to the soil surface immediately after sowing in combination with KAS-32. The differences between the means of the treatments without the same letters are significant (P < 0.05). Vertical lines represent errors of the means.
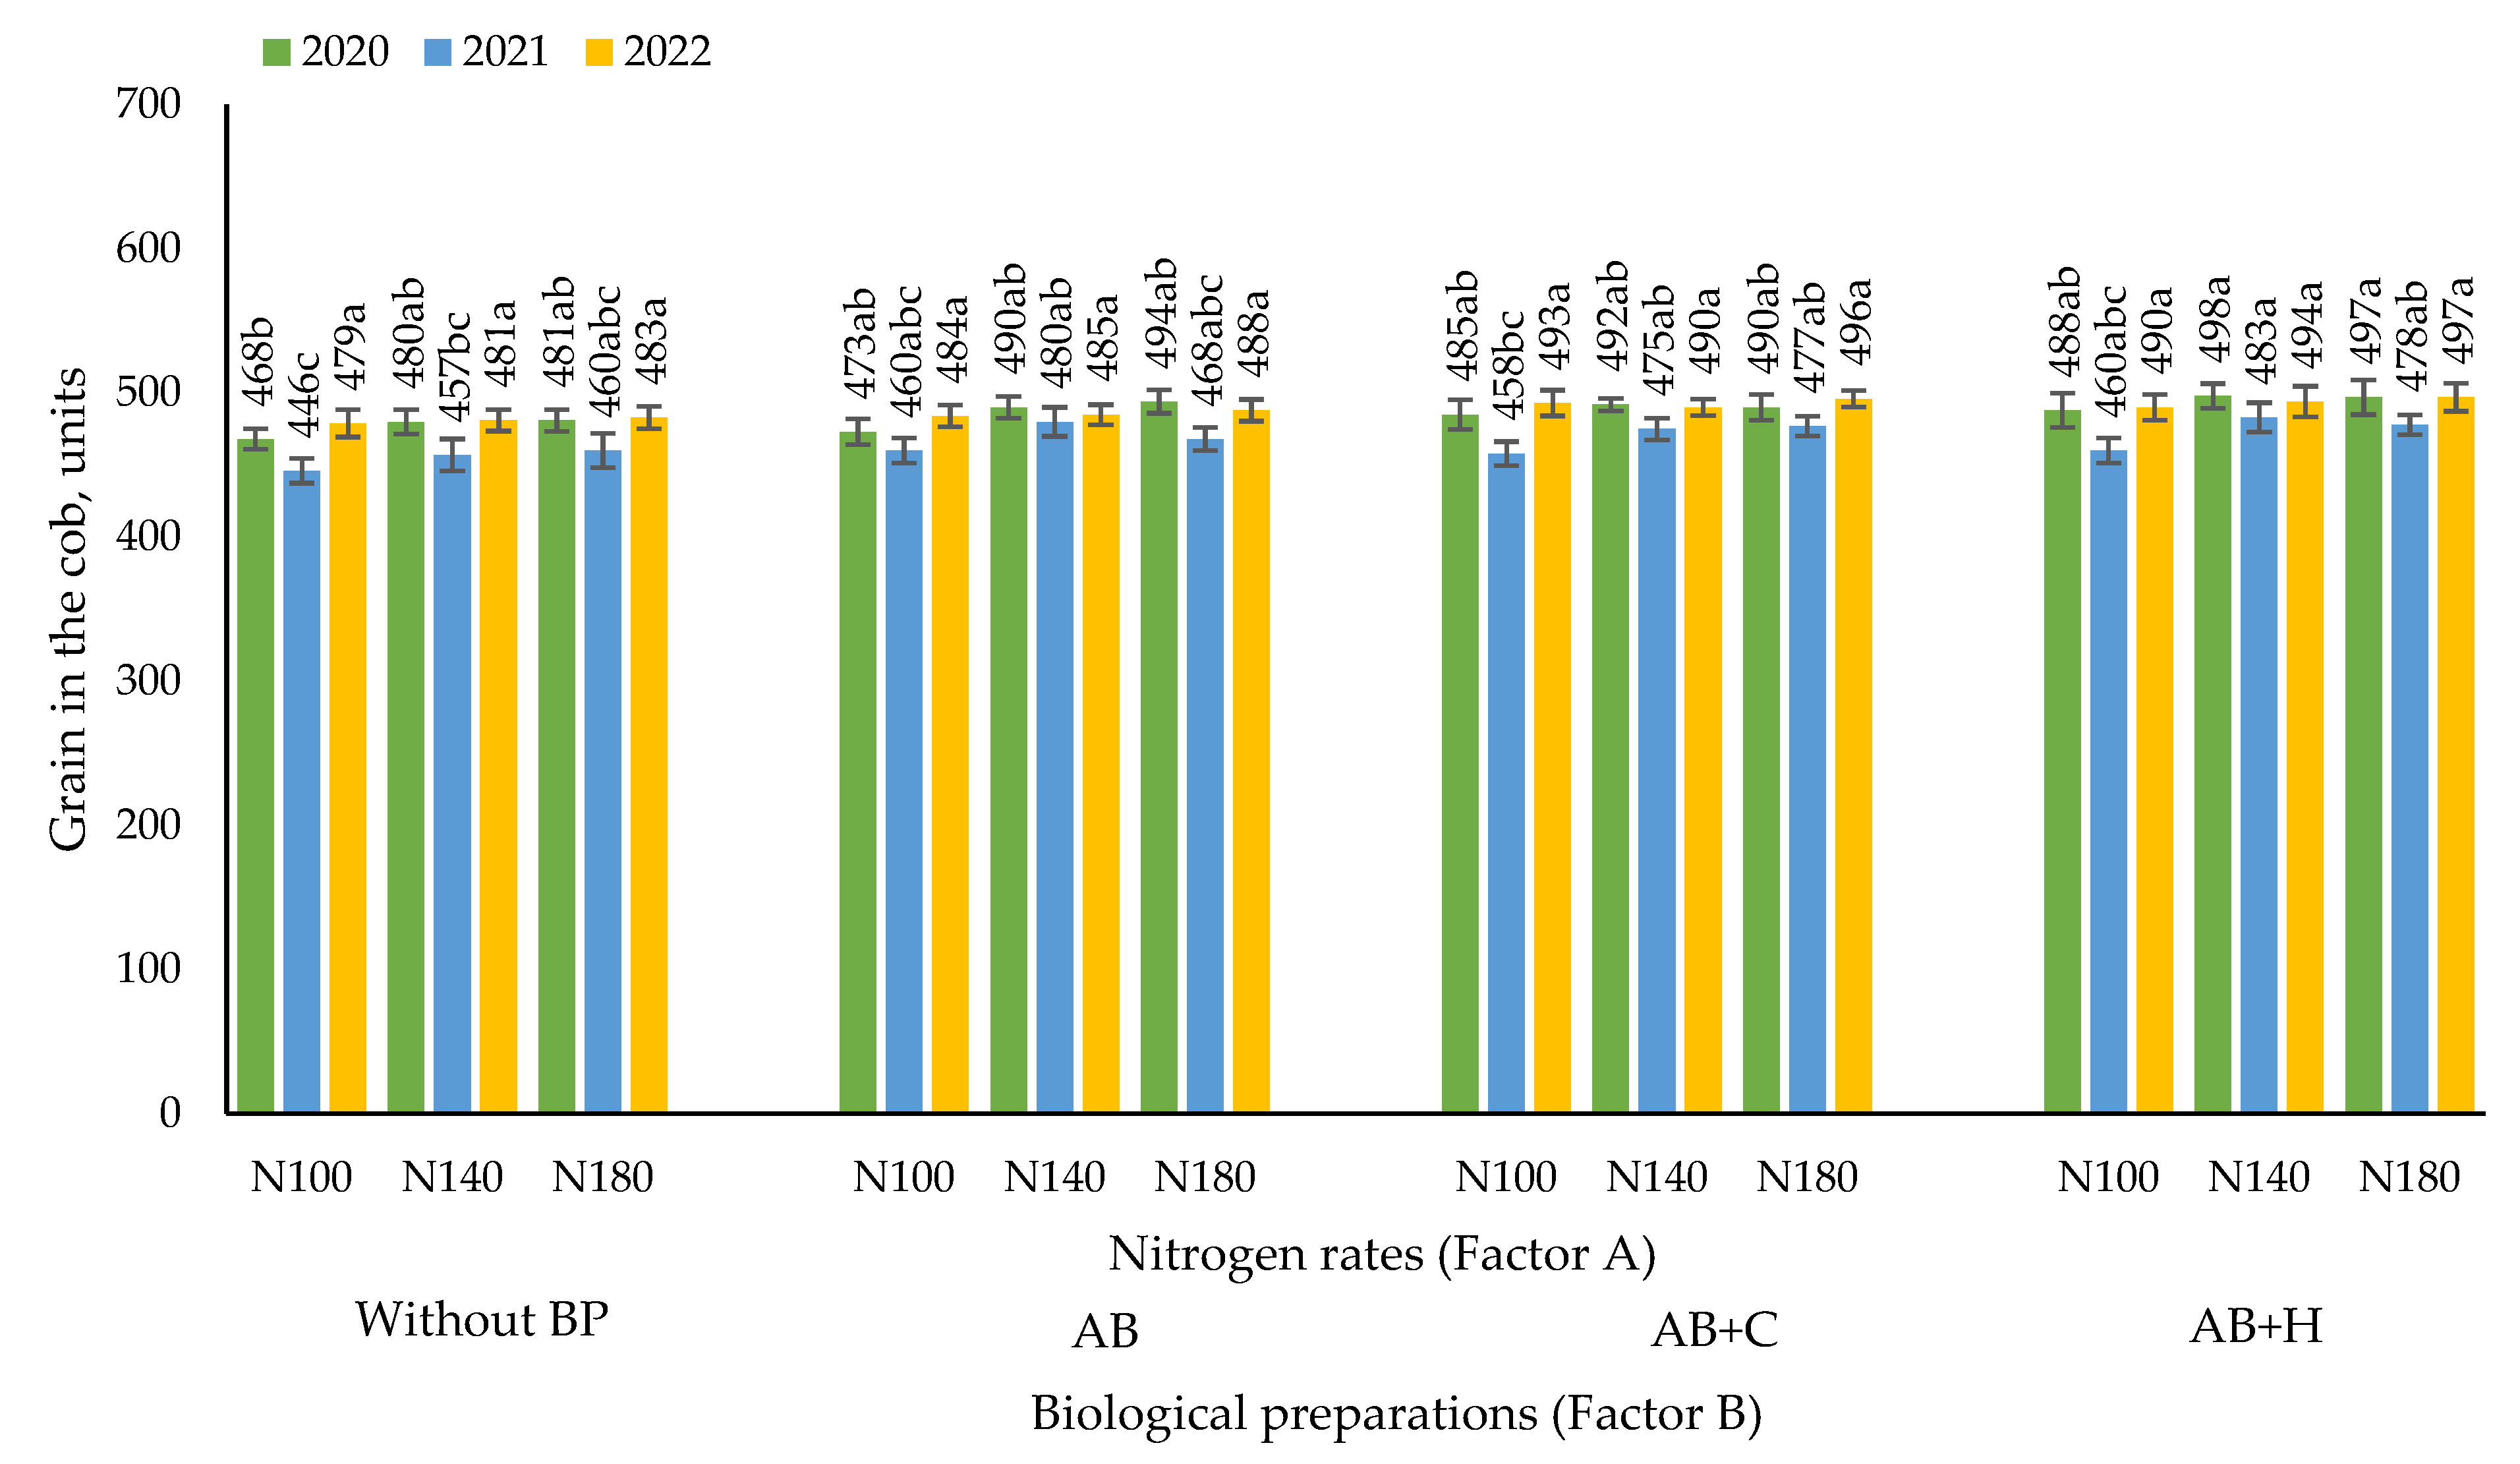
Figure 6.
Partial factor productivity of nitrogen in relation to maize grain yield, 2020–2022. Note: Factor B – use of biological preparations (BP): (Without BP) no biological preparations were used; (AB) biological preparation – nitrogen bacteria (1.0 l ha-1) applied to the soil surface immediately after sowing in combination with KAS-32; (AB+C) biological preparations – nitrogen bacteria (1.0 l ha-1) applied to the soil surface immediately after sowing in combination with KAS-32, and Cytokinin (0.7 l ha-1) spread at the 6 leaf stage; (AB+H) biological preparations – nitrogen bacteria (1.0 l ha-1) and humic acids (1.0 kg ha-1) applied to the soil surface immediately after sowing in combination with KAS-32. The differences between the means of the treatments without the same letters are significant (P < 0.05). Vertical lines represent errors of the means.
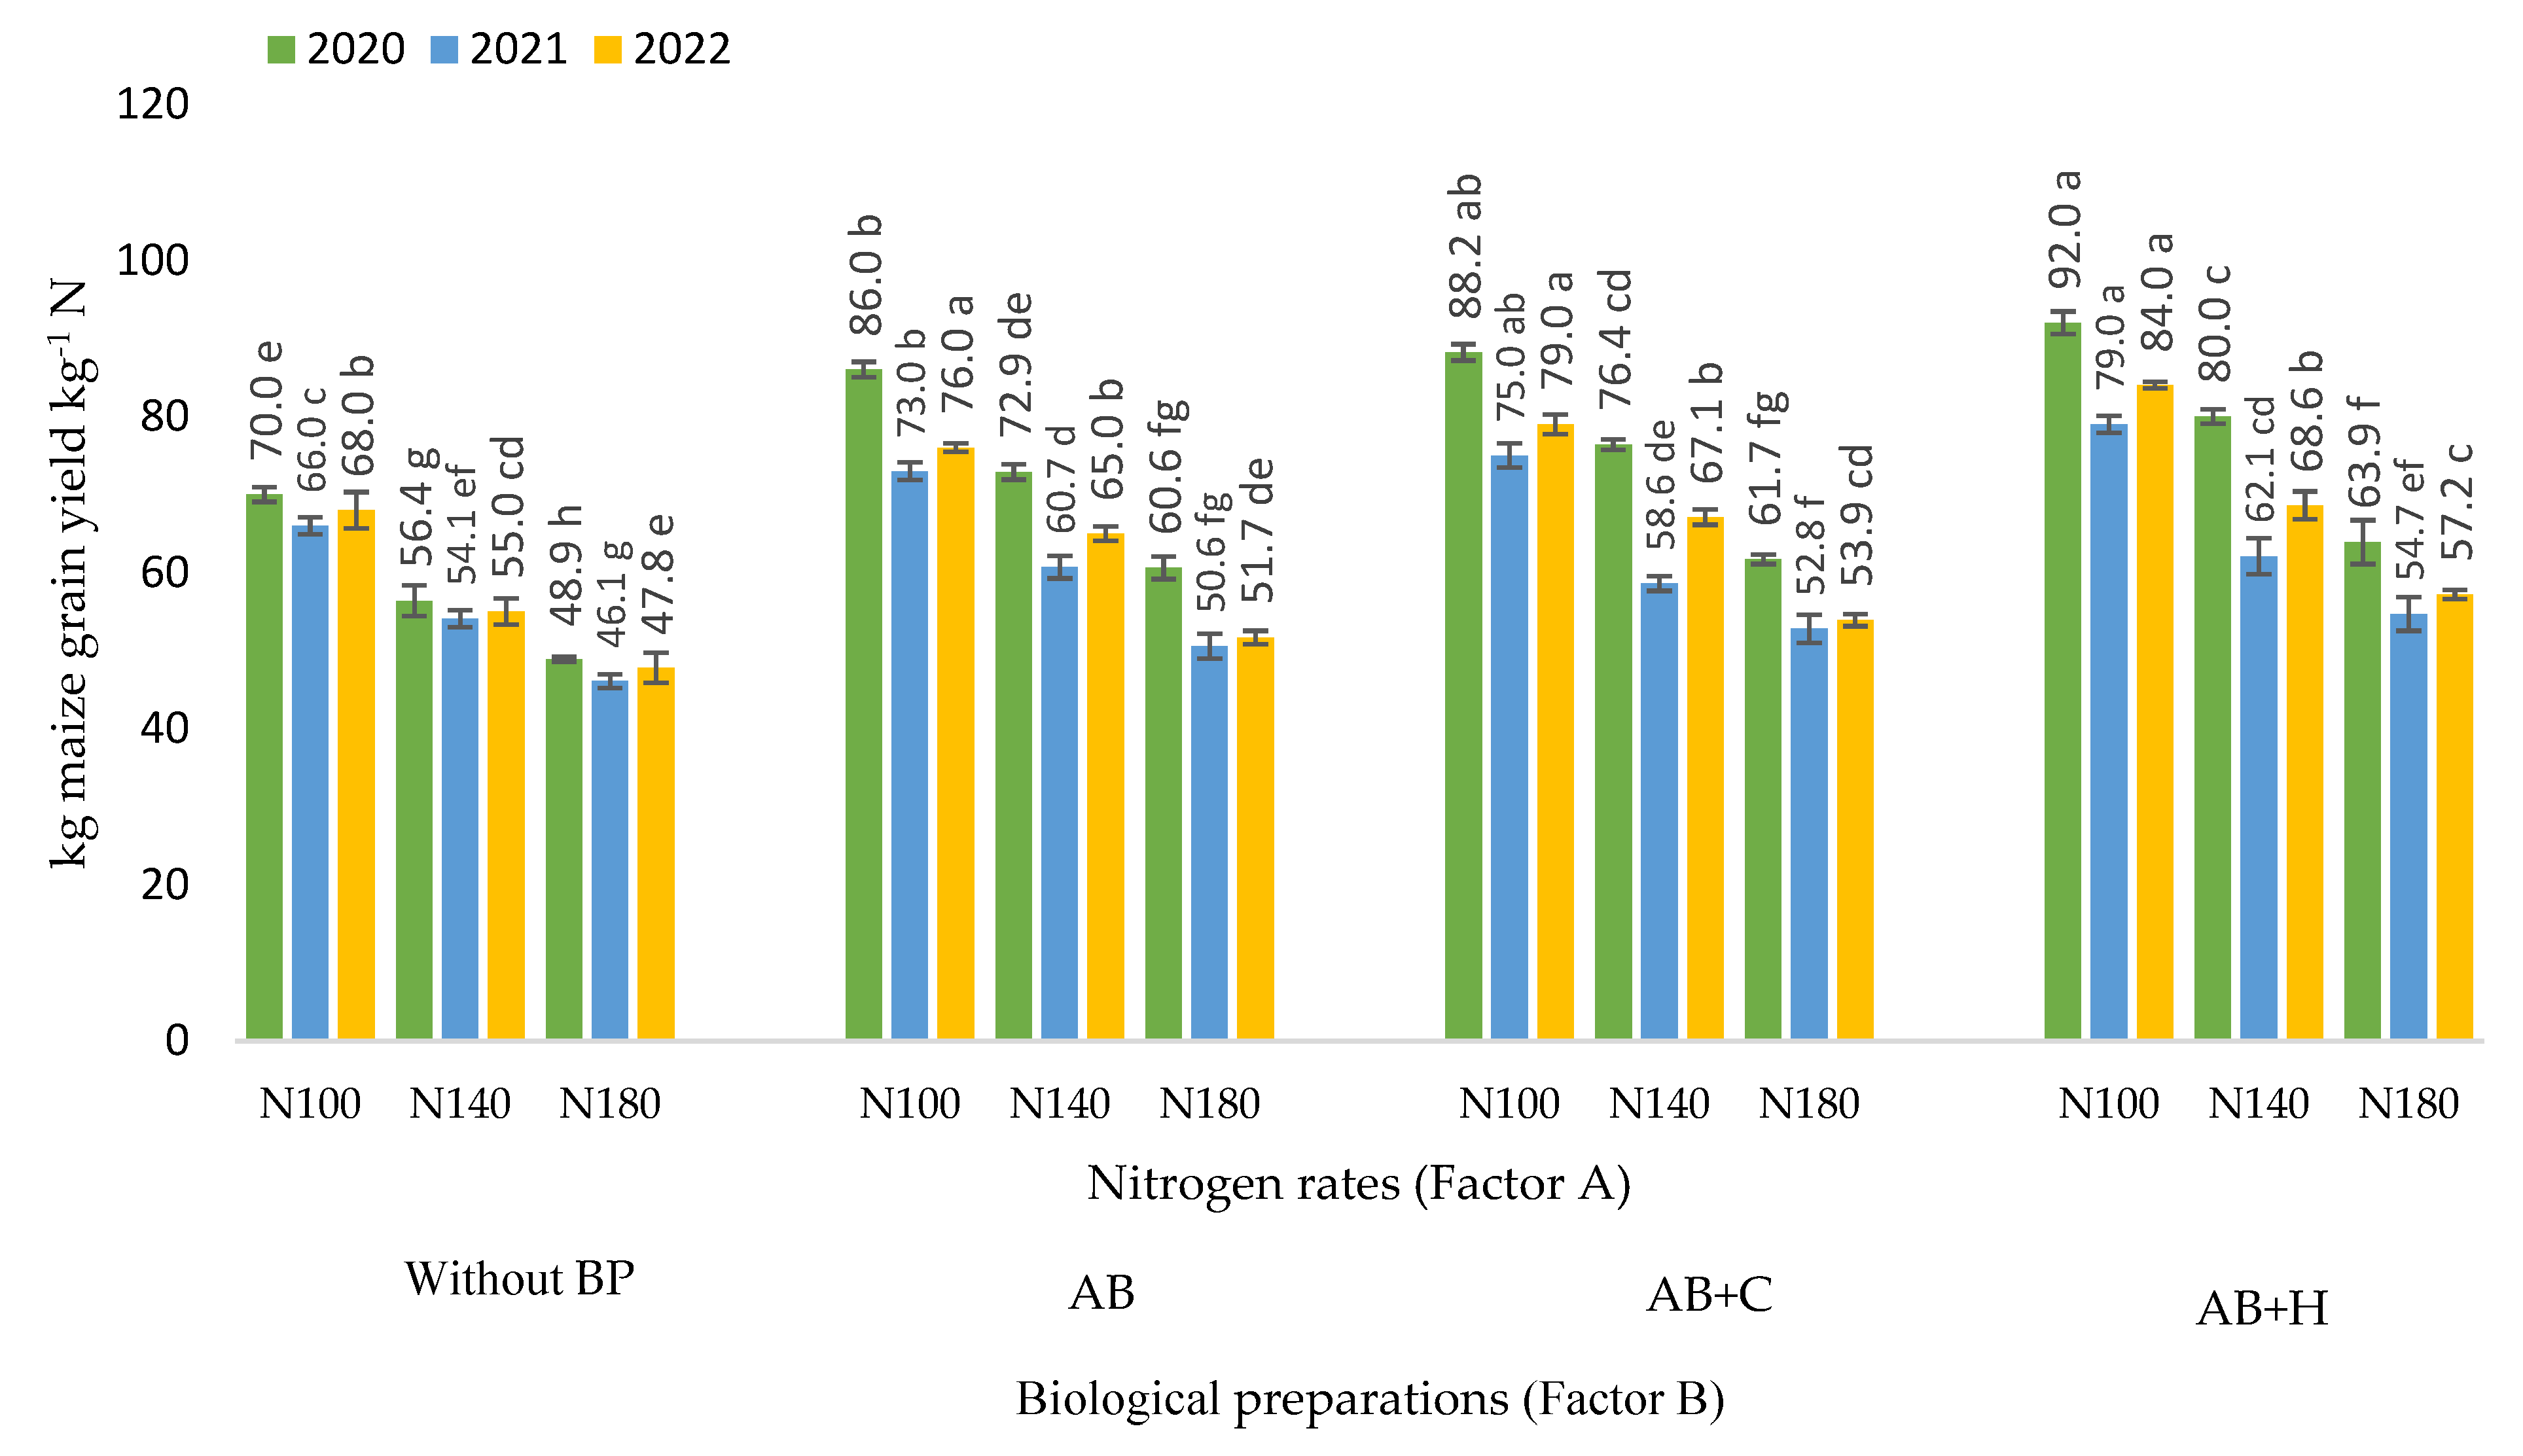

Table 1.
Dependence of maize grain yield on nitrogen fertilisation rates (Factor A: x – kg ha-1), 2020–2022.
Table 1.
Dependence of maize grain yield on nitrogen fertilisation rates (Factor A: x – kg ha-1), 2020–2022.
| Dependent variables y |
Factor B | Regression equation |
Correlation coefficient r |
Coefficient of determination r2 |
Probability level |
|---|---|---|---|---|---|
|
y(2020) – grain yield (t ha-1) |
Without BP | y = 4.75 + 0.02x | 0.93 | 0.86 | P < 0.01 |
| AB | y = 5.88 + 0.03x | 0.91 | 0.83 | P < 0.01 | |
| AB+C | y = 6.22 + 0.03x | 0.87 | 0.76 | P < 0.01 | |
| AB+H | y = 6.61 + 0.03x | 0.87 | 0.76 | P < 0.01 | |
|
y(2021) – grain yield (t ha-1) |
Without BP | y = 4.52 + 0.02x | 0.93 | 0.86 | P < 0.01 |
| AB | y = 5.15 + 0.02x | 0.91 | 0.83 | P < 0.01 | |
| AB+C | y = 4.90 + 0.03x | 0.93 | 0.86 | P < 0.01 | |
| AB+H | y = 5.40 + 0.02x | 0.92 | 0.85 | P < 0.01 | |
|
y(2022) – grain yield (t ha-1) |
Without BP | y = 4.55 + 0.02x | 0.91 | 0.83 | P < 0.01 |
| AB | y = 5.69 + 0.02x | 0.86 | 0.74 | P < 0.01 | |
| AB+C | y = 5.85 + 0.02x | 0.85 | 0.72 | P < 0.01 | |
| AB+H | y = 6.11 + 0.02x | 0.91 | 0.83 | P < 0.01 |
Note: Factor B – use of biological preparations (BP): (Without BP) no biological preparations were used; (AB) biological preparation – nitrogen bacteria (1.0 l ha-1) applied to the soil surface immediately after sowing in combination with KAS-32; (AB+C) biological preparations – nitrogen bacteria (1.0 l ha-1) applied to the soil surface immediately after sowing in combination with KAS-32, and Cytokinin (0.7 l ha-1) spread at the 6 leaf stage; (AB+H) biological preparations – nitrogen bacteria (1.0 l ha-1) and humic acids (1.0 kg ha-1) applied to the soil surface immediately after sowing in combination with KAS-32.
Table 2.
Dependence of maize grain yield per plant on nitrogen fertilisation rates (Factor A: x – kg ha-1), 2020–2022.
Table 2.
Dependence of maize grain yield per plant on nitrogen fertilisation rates (Factor A: x – kg ha-1), 2020–2022.
| Dependent variables y |
Factor B | Regression equation | Correlation coefficient r |
Coefficient of determination r2 |
Probability level |
|---|---|---|---|---|---|
|
y(2020) – maize grain yield per plant (g) |
Without BP | y = 77.3 + 0.28x | 0.92 | 0.85 | P < 0.01 |
| AB | y = 91.5 + 0.30x | 0.91 | 0.83 | P < 0.01 | |
| AB+C | y = 87.5 + 0.35x | 0.94 | 0.88 | P < 0.01 | |
| AB+H | y = 104.5 + 0.28x | 0.85 | 0.72 | P < 0.01 | |
|
y(2021) – maize grain yield per plant (g) |
Without BP | y = 71.4 + 0.27x | 0.90 | 0.81 | P < 0.01 |
| AB | y = 86.4 + 0.24x | 0.89 | 0.79 | P < 0.01 | |
| AB+C | y = 79.4 + 0.28x | 0.84 | 0.71 | P < 0.01 | |
| AB+H | y = 87.5 + 0.27x | 0.94 | 0.88 | P < 0.01 | |
|
y(2022) – maize grain yield per plant (g) |
Without BP | y = 91.0 + 0.18x | 0.86 | 0.74 | P < 0.01 |
| AB | y = 93.5 + 0.26x | 0.86 | 0.74 | P < 0.01 | |
| AB+C | y = 92.2 + 0.29x | 0.93 | 0.86 | P < 0.01 | |
| AB+H | y = 107.3 + 0.22x | 0.83 | 0.69 | P < 0.01 |
Note: Factor B – use of biological preparations (BP): (Without BP) no biological preparations were used; (AB) biological preparation – nitrogen bacteria (1.0 l ha-1) applied to the soil surface immediately after sowing in combination with KAS-32; (AB+C) biological preparations – nitrogen bacteria (1.0 l ha-1) applied to the soil surface immediately after sowing in combination with KAS-32, and Cytokinin (0.7 l ha-1) spread at the 6 leaf stage; (AB+H) biological preparations – nitrogen bacteria (1.0 l ha-1) and humic acids (1.0 kg ha-1) applied to the soil surface immediately after sowing in combination with KAS-32.
Table 3.
Dependence of the 1000-grain weight of maize on nitrogen fertilisation rates (Factor A: x – kg ha-1), 2020–2022.
Table 3.
Dependence of the 1000-grain weight of maize on nitrogen fertilisation rates (Factor A: x – kg ha-1), 2020–2022.
| Dependent variables y |
Factor B | Regression equation | Correlation coefficient r |
Coefficient of determination r2 |
Probability level |
|---|---|---|---|---|---|
|
y(2020) – 1000-grain weight of maize (g) |
Without BP | - | - | - | P > 0.05 |
| AB | y = 208.5 + 0.48x | 0.84 | 0.71 | P < 0.01 | |
| AB+C | y = 183.4 + 0.69x | 0.91 | 0.83 | P < 0.01 | |
| AB+H | y = 220.2 + 0.51x | 0.90 | 0.81 | P < 0.01 | |
|
y(2021) – 1000-grain weight of maize (g) |
Without BP | y = 169.9 + 0.50x | 0.87 | 0.76 | P < 0.01 |
| AB | y = 190.3 + 0.46x | 0.85 | 0.72 | P < 0.01 | |
| AB+C | y = 186.9 + 0.48x | 0.76 | 0.58 | P < 0.05 | |
| AB+H | y = 202.1 + 0.44x | 0.79 | 0.62 | P < 0.05 | |
|
y(2022) – 1000-grain weight of maize (g) |
Without BP | y = 193.1 + 0.34x | 0.88 | 0.77 | P < 0.01 |
| AB | y = 196.3 + 0.50x | 0.87 | 0.76 | P < 0.01 | |
| AB+C | y = 189.9 + 0.56x | 0.89 | 0.79 | P < 0.01 | |
| AB+H | y = 224.1 + 0.39x | 0.84 | 0.71 | P < 0.01 |
Note: Factor B – use of biological preparations (BP): (Without BP) no biological preparations were used; (AB) biological preparation – nitrogen bacteria (1.0 l ha-1) applied to the soil surface immediately after sowing in combination with KAS-32; (AB+C) biological preparations – nitrogen bacteria (1.0 l ha-1) applied to the soil surface immediately after sowing in combination with KAS-32, and Cytokinin (0.7 l ha-1) spread at the 6 leaf stage; (AB+H) biological preparations – nitro-gen bacteria (1.0 l ha-1) and humic acids (1.0 kg ha-1) applied to the soil surface immediately after sowing in combination with KAS-32.
Table 4.
Dependence of partial factor productivity of nitrogen on nitrogen fertilisation rates (factor A: x – kg ha-1), 2020–2022.
Table 4.
Dependence of partial factor productivity of nitrogen on nitrogen fertilisation rates (factor A: x – kg ha-1), 2020–2022.
| Dependent variables y |
Factor B | Regression equation | Correlation coefficient r |
Coefficient of determination r2 |
Probability level |
|---|---|---|---|---|---|
|
y(2020) – kg maize grain kg-1 N |
Without BP | y = 95.4 – 0.26x | -0.96 | 0.92 | P < 0.01 |
| AB | y = 117.6 – 0.32x | -0.97 | 0.94 | P < 0.01 | |
| AB+C | y = 121.8 – 0.33x | -0.97 | 0.94 | P < 0.01 | |
| AB+H | y = 127.8 – 0.35x | -0.97 | 0.94 | P < 0.01 | |
|
y(2021) – kg maize grain kg-1 N |
Without BP | y = 90.2 – 0.25x | -0.97 | 0.94 | P < 0.01 |
| AB | y = 100.6 – 0.28x | -0.97 | 0.94 | P < 0.01 | |
| AB+C | y = 100.9 – 0.28x | -0.94 | 0.88 | P < 0.01 | |
| AB+H | y = 107.8 – 0.30x | -0.95 | 0.90 | P < 0.01 | |
|
y(2022) – kg maize grain kg-1 N |
Without BP | y = 92.3 – 0.25x | -0.94 | 0.88 | P < 0.01 |
| AB | y = 106.8 – 0.30x | -0.98 | 0.96 | P < 0.01 | |
| AB+C | y = 110.6 – 0.31x | -0.97 | 0.94 | P < 0.01 | |
| AB+H | y = 116.8 – 0.34x | -0.97 | 0.94 | P < 0.01 |
Note: abbreviations (for Factor B): Factor B – use of biological preparations (BP): (Without BP) no biological preparations were used; (AB) biological preparation – nitrogen bacteria (1.0 l ha-1) applied to the soil surface immediately after sowing in combina-tion with KAS-32; (AB+C) biological preparations – nitrogen bacteria (1.0 l ha-1) applied to the soil surface immediately after sowing in combination with KAS-32, and Cytokinin (0.7 l ha-1) spread at the 6 leaf stage; (AB+H) biological preparations – nitro-gen bacteria (1.0 l ha-1) and humic acids (1.0 kg ha-1) applied to the soil surface immediately after sowing in combination with KAS-32. The differences between the means of the treatments without the same letters are significant (P < 0.05). Vertical lines represent errors of the means.
Disclaimer/Publisher’s Note: The statements, opinions and data contained in all publications are solely those of the individual author(s) and contributor(s) and not of MDPI and/or the editor(s). MDPI and/or the editor(s) disclaim responsibility for any injury to people or property resulting from any ideas, methods, instructions or products referred to in the content. |
© 2024 by the authors. Licensee MDPI, Basel, Switzerland. This article is an open access article distributed under the terms and conditions of the Creative Commons Attribution (CC BY) license (http://creativecommons.org/licenses/by/4.0/).
Copyright: This open access article is published under a Creative Commons CC BY 4.0 license, which permit the free download, distribution, and reuse, provided that the author and preprint are cited in any reuse.


