1. Introduction
The chemical composition of a fertilizer and its placement in time and space can strongly influence crop production and fertilizer use efficiency. Fertilizer uptake can be increased by placing the fertilizer closer to the roots and timing the fertilizer application to the crop’s demand. At the same time, crops can optimize their root placement through nutrient tropism, i.e. growing roots towards the fertilizer, and root proliferation, i.e. growing more roots in areas with greater nutrient availability. Root proliferation is well known from the images of Drew [
1] which show the proliferation response of barley to localized placements of phosphate, nitrate, ammonium, and potassium. This seems a logical response to take up nutrients but, using a
15N labeling study, Vuuren et al. [
2] concluded that the proliferation response of roots into a patch did not increase total N uptake very much. The question arose why do plants bother? The answer given was that the proliferation response mostly provides a competitive advantage by depleting a patch faster [
3,
4]. This questions how valuable this response is to agriculture and how it might be harnessed through breeding and management of fertilizers.
Schneider and Lynch [
5] suggested that root proliferation is mostly useful in low-nutrient soils, but not in fertilized agricultural fields since the metabolic costs would be ‘too high’. They claim that it would be better for the crop to invest in growing deeper roots. Drew’s images seem to promote this idea, as they show poor rooting of the deeper layer compared to the control treatment [
1]. As Drew kept the concentrations constant, however, the control treatment had much more fertilizer and grew a larger plant [
1]. In a large meta-analysis of fertilizer placements, Nkebiwe et al. [
6] concluded that localized placement tends to increase yield compared to broadcasting and that localized placement can promote deep rooting. Although this does not prove that the proliferation response is useful, root architectural modeling studies have suggested that without it, plants cannot take up concentrated fertilizer as the concentrations are well above the saturation point of the nutrient transporters (e.g. [
7,
8,
9]). Thus, to increase uptake locally, they need to increase the root surface area through increasing the local root length density. In search of the optimal proliferation response, Croft et al. [
10] concluded that it depends on several factors related to resources, competition, and mycorrhizal colonization. One important factor is that the nutrient patch provides a stable supply of nutrients and does not move to other locations, e.g., via leaching or diffusion.
To achieve sustainable and circular agriculture, it is essential to enhance nutrient uptake efficiency and to utilize fertilizers derived from waste, especially wastewater. An important source of three plant-relevant (macro-)nutrients is struvite, a precipitate consisting of MgNH
4PO
4·6H
2O or MgKPO
4·6H
2O [
11]. This mineral can be recovered from domestic wastewater, ensuring the nutrient recycling of N and P. Struvite is a slow-release fertilizer with a strongly pH-dependent dissolution rate [
12]. Roots acidify the rhizosphere by exuding organic acids and protons; a process enhanced by ammonium uptake as the plant needs to maintain electrical neutrality and balances the uptake of anions versus cations by pumping protons. The cation-anion balance is determined by the type of nitrogen taken up. Studies have shown that combining struvite with an additional ammonium fertilizer can improve the fertilizer uptake [
13]. We hypothesize that the pH-dependent slow-release properties of struvite help to localize the fertilizer and minimize environmental losses. This controlled release also supports a root proliferation response, allowing roots sufficient time to absorb nutrients before fertilizer diffuses from the area of increased root length density.
Cassava (
Manihot esculenta) is an economically relevant crop grown for its large high-starch content storage roots in predominantly tropical regions including Sub-Saharan Africa, Southeast Asia, and parts of Latin America. [
14]. Edible varieties contribute significantly to food security in African and South American countries, especially in Nigeria, Congo, and Brazil (UN Food and Agriculture Organization (FAO)), whereas higher-yielding bitter varieties are grown in Southeast Asia for the well-developed starch industry. Cassava is typically grown on nutrient-poor and drought-prone sandy loam soils. As it can yield comparatively well in low-input agriculture but responses well to fertilization. Planted from stem cuttings in the rainy season, its 9-12 month cropping cycle typically ends at the end of the dry season. Deep rooting and a low and slowly developing leaf area index make the crop highly nutrient and water-efficient. It also means that cassava needs a long time to establish. Its canopy often does not close till the end of the third month and the roots progress towards deeper layers at a slow pace of about 1 cm a day [
15,
16,
17,
18]. Fertilization can thus promote faster crop establishment and yield [
19,
20,
21]. Furthermore, continuous cultivation can deplete the soil of nutrients.
Although cassava grows deep roots, its root system is coarse and sparse compared to other crops [
22]. It is often suggested that cassava’s nutrient uptake efficiency is primarily due to its symbiotic association with mycorrhizal fungi, and several studies have demonstrated a positive response to mycorrhizal inoculation (e.g. [
23]). However, symbiosis is not the sole factor behind cassava’s nutrient efficiency. We wondered if cassava’s root architectural plasticity may also play a significant role by placing more roots in soil domains with greater nutrient availability. Such a plasticity response offers potential to be harnessed in cropping systems. Cassava is typically cultivated on soil ridges, where fertilizer can be applied in strips within the ridge. For efficient nutrient uptake, cassava roots must grow towards the fertilizer strip and proliferate into the nutrient-rich zone. Understanding this dynamic could help optimize fertilization strategies for the crop.
To explore these dynamics, we addressed the following key questions: i) can cassava roots proliferate into nutrient hotspots, and can this root response be harnessed to improve nutrient uptake when struvite is locally placed? ii) to what extent does struvite fertilizer spread in sandy, low-sorbing soils when concentrated in a hotspot, and how does this affect nutrient availability? Finally, we examined whether localized fertilization with struvite compromises deep rooting, or whether cassava can maintain deep root development while responding to concentrated nutrient zones.
By addressing these questions, we aimed to explore the potential of struvite as an effective and sustainable fertilizer for cassava, while evaluating how root plasticity and targeted fertilization can be used to enhance nutrient use efficiency in cassava cropping systems, particularly in marginal sandy soils.
2. Materials and Methods
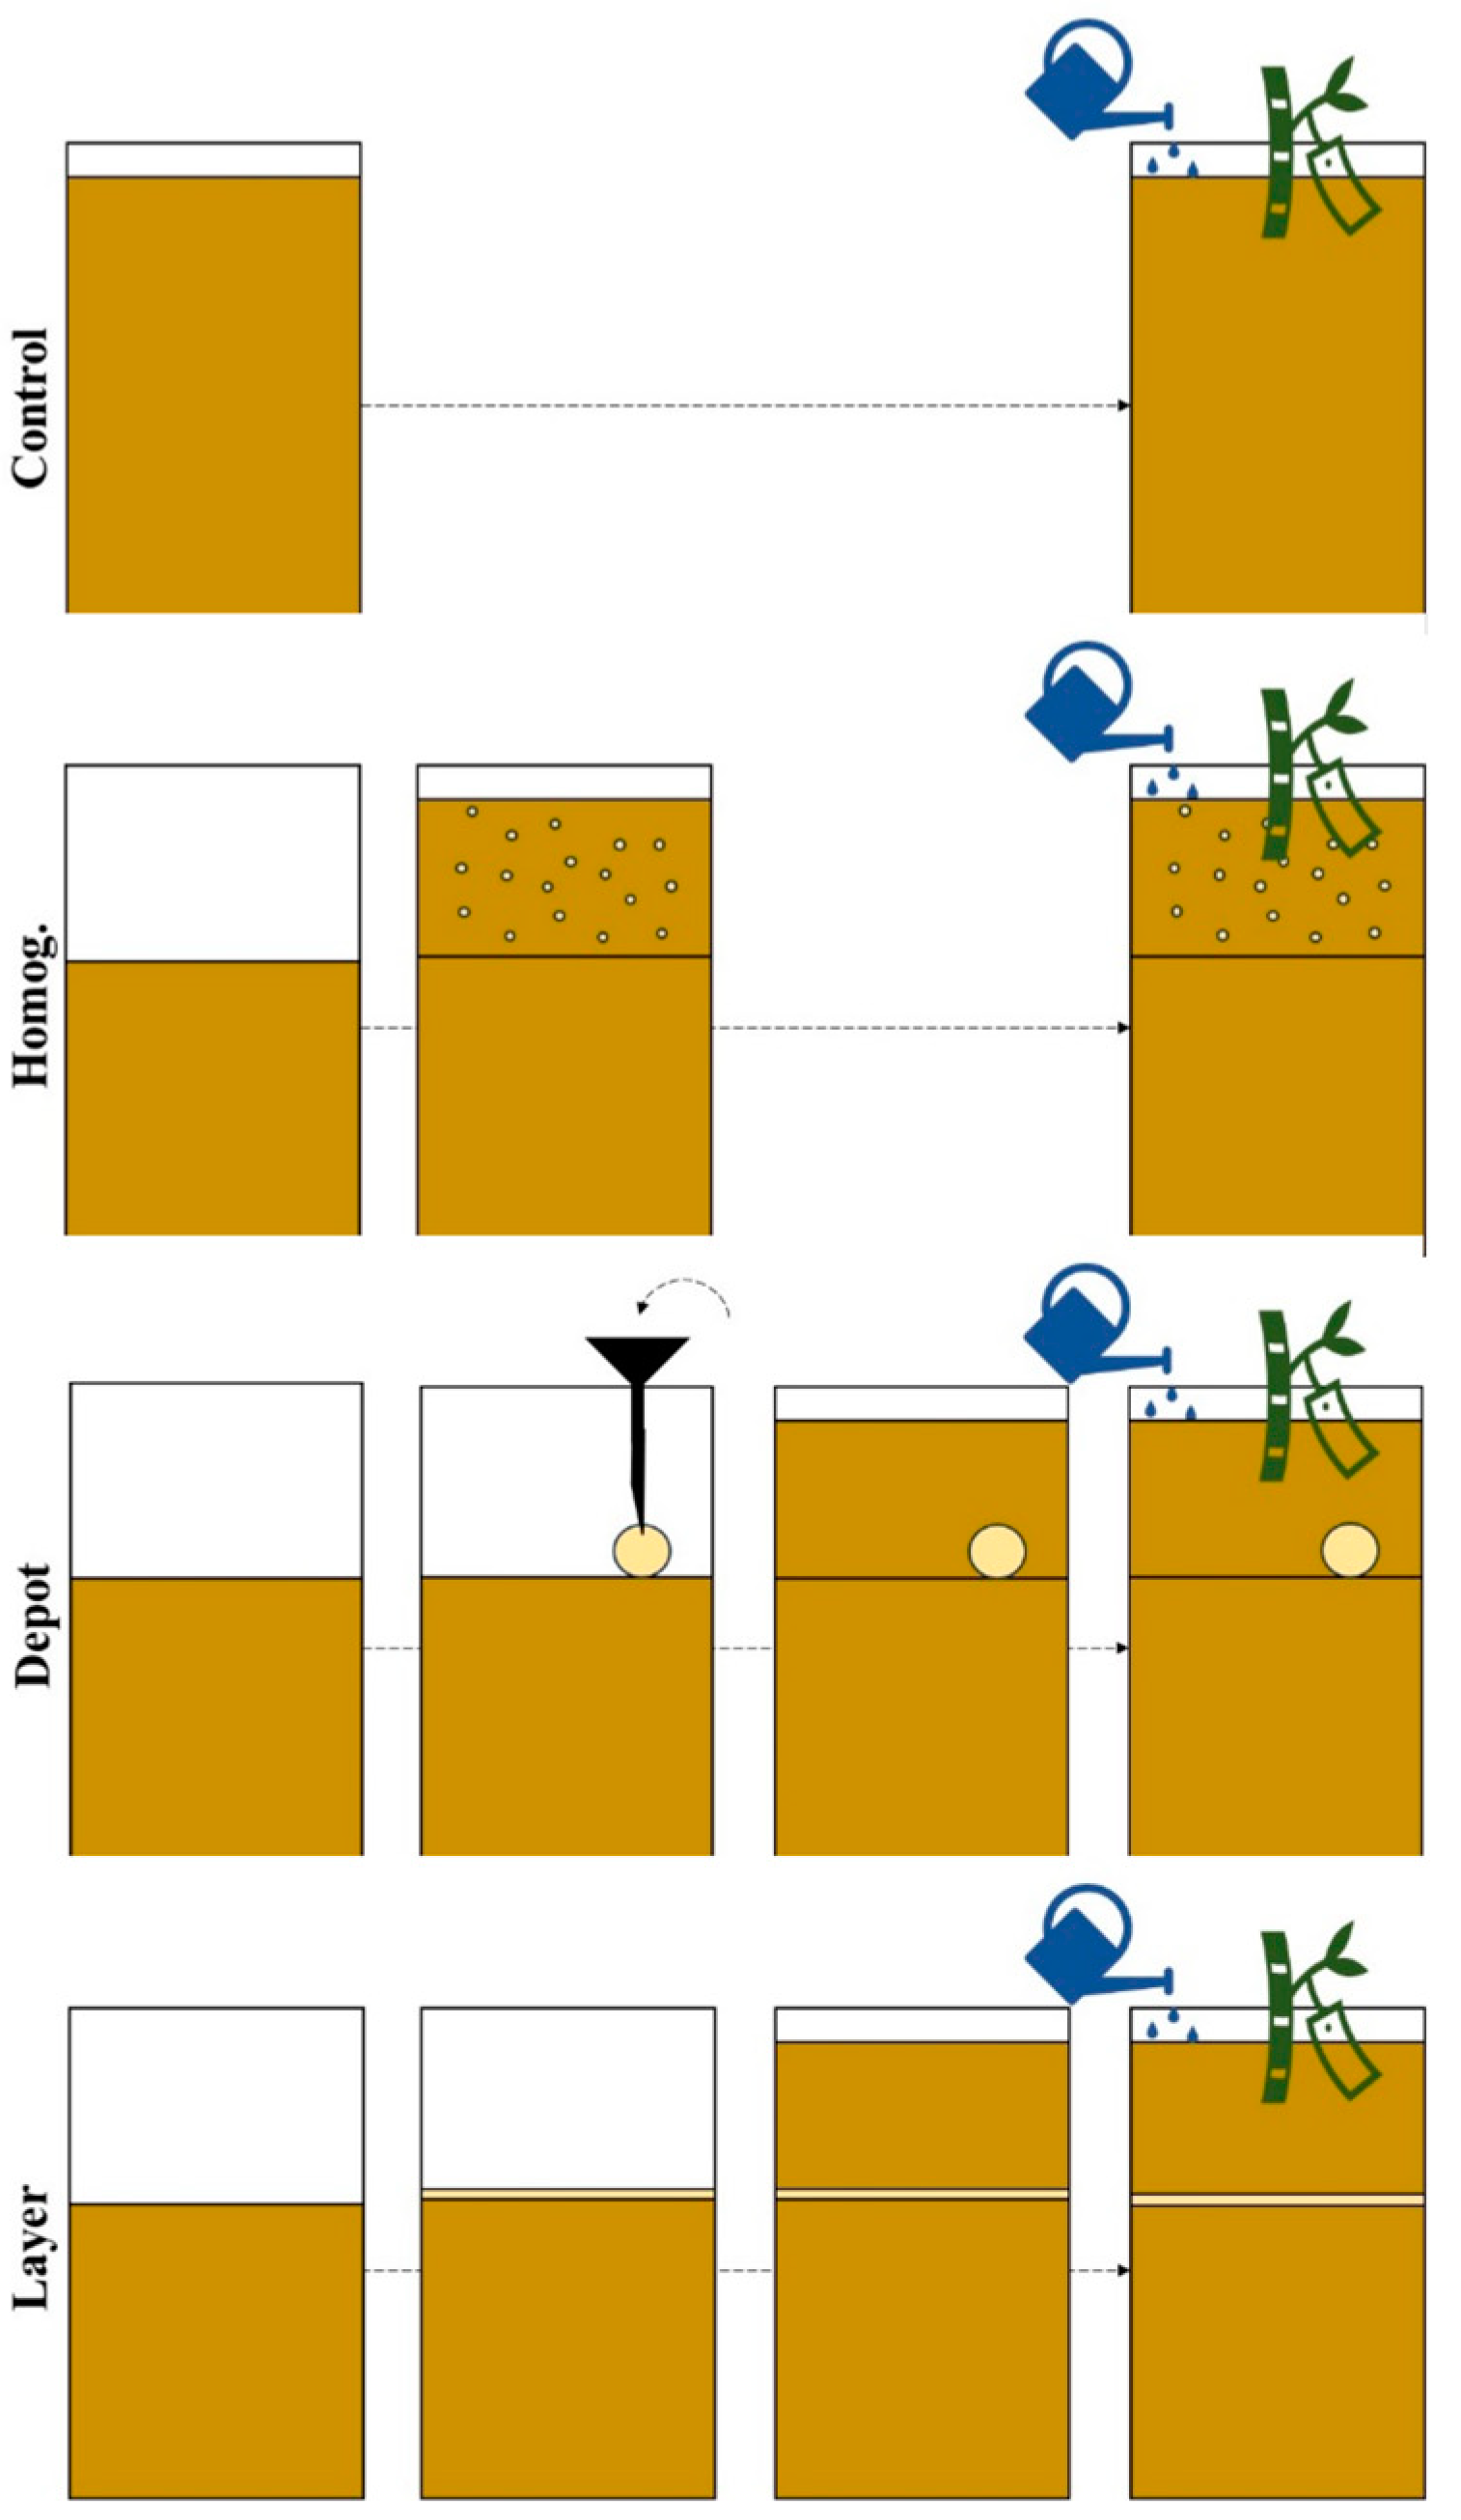
A greenhouse experiment was conducted using cassava plants, cultivar Rayong 9, grown in rhizoboxes to assess the impact of varying struvite placements, used as a slow-release fertilizer as illustrated in
Figure 1. The study focused on evaluating the shoot and root growth parameters, root distribution and architectural responses to different fertilizer concentration patterns. Two controls were included: an unfertilized control and a homogeneously fertilized control, referred to as ‘control’ and ‘homogenized’ respectively.
To investigate strip fertilization effects, the rhizoboxes were positioned either parallel or perpendicular to the strip. Due to the flat design of the rhizobox, the parallel orientation ensured that roots would inevitably encounter the fertilizer strip, simulating uniform nutrient availability. In contrast, the perpendicular orientation created a concentrated nutrient hotspot, requiring roots to actively grow towards and proliferate within this localized zone. These configurations were designated as ‘layer’ (parallel) and ‘depot’ (perpendicular) treatments.
In total, three fertilization treatments were applied, all with the same total amount of nutrients but varying placement and local nutrient concentration: ‘depot,’ representing the most concentrated fertilizer placement, ‘layer’, with an intermediate concentration, and ‘homogenized’, the least concentrated. This experimental approach enabled a comprehensive analysis of root system plasticity and nutrient uptake efficiency in response to different spatial distributions of struvite.
2.1. Rhizobox Preparation and Experimental Set-Up
Previous studies with other crops proved flat rhizoboxes, also called rhizotrons or rhizoboxes, useful for studying root responses to localized fertilizer [
24,
25]. The used rhizoboxes (600x300x30 mm, 5.4 l) were filled with previously dried and homogenized sand and a dried and sieved nutrient-depleted peat-based substrate (“Nullerde,” Einheitserde/Patzer Erden, Germany; 1:1 vol. %), and struvite fertilizer according to one of four treatments (
Figure 1). The mixture without fertilizer was very low in nutrients with N, P, K, Mg values of 70, 30, 130, 130 mg kg
-1, respectively, but with sufficient micronutrients. In the ‘unfertilized control’ treatment, rhizoboxes were filled up to 2 cm below the upper edge with the sand-peat substrate. For the homogenized treatment, rhizoboxes were filled up to 20 cm below the top. The residual space was then filled with the sand-peat substrate previously mixed with 3 g struvite (CrystalGreen®, 100 SGN grade (1.0 mm), OSTARA, Vancouver BC, Canada; containing 150 mg of nitrogen (N); 366 mg of phosphorus (P); 300 mg of magnesium (Mg), according to the provider’s analysis (w/w): total nitrogen (ammoniacal-N): 5.0%, phosphorus pent-oxide (P
2O
5): 28.0% (12.2% P), total magnesium oxide (MgO): 16.7% (10.0% Mg)). For the ‘depot’ treatment, rhizoboxes were filled up to 20 cm below the top. Then, a depot of 3 g of struvite was carefully placed on the substrate at a 5 cm distance from the right border, holding it temporarily in locating with a rubber tube, and the residual space was filled with the unfertilized substrate. For the ‘layer’ treatments, rhizoboxes were filled as aforementioned up to 20 cm below the top. Subsequently, 3 g of struvite was homogeneously spread across the entire surface and on top of this thin layer, 20 cm of unfertilized substrate was placed. Thus, all fertilized treatments received the same total amount of struvite, but the fertilizer was most concentrated in the depot and least in the ‘homogenized’ treatment. All treatments were replicated 3 times in a fully randomized design.
2.2. Plant Material and Planting
One stem cutting of approx. 20 cm of cassava (Manihot esculenta, cult. Rayong 9) was placed centrally, vertically, and approximately 10 cm into the substrate in each rhizobox. Stem cuttings were obtained directly from donor plants previously grown in the same greenhouse.
2.3. Growth Conditions
The substrate was watered close to saturation, and all rhizoboxes were placed at an angle of 45° in a semi-controlled greenhouse with day/night temperatures of 29/24 degrees Celsius (°C), a relative air humidity of 75%, and a daily light integral of approximately 15 mol.m-2.day-1, supported on darker days by supplemental lights. Plants grew over a total period of eight weeks. Watering was conducted whenever necessary, keeping the substrate at approximately 50% water holding capacity (corresponding to a volumetric soil water content of approximately 25%).
2.4. Shoot Measurements
Before final harvest, SPAD measurements were acquired from three fully developed leaves with a Chlorophyll Meter SPAD-502Plus (Konica Minolta, Langenhagen, Germany). Eight weeks after planting, the freshly developed shoots were cut off and divided into leaves and stems, excluding the original cutting. Leaves were scanned with a Li-Cor 3100c leaf area meter. Subsequently, the shoot biomass was dried at 60°C until constant weight after which dry mass was determined with a scale.
2.5. Substrate Nutrient Concentrations
After harvesting the shoots, the rhizoboxes were opened and from each box 13 substrate samples from the in and around the fertilized regions were collected, according to
Appendix A Figure A1 and as the basis for the heat map in
Figure 2. The scheme was set up to evaluate the potential spreading of nutrients in the substrate via diffusion and advection. The extracted substrate samples were homogenized after drying at 70°C in a drying oven. A subsample of approximately 50 mg substrate was extracted using microwave-assisted acid extraction (H-Cl, H-NO
3). We analyzed the P, K, and Mg concentrations using inductively coupled plasma optical emission spectrometry (ICP-OES; Thermo Scientific iCAP6500, Dreieich, Germany). Another substrate sub-sample was analyzed for its N concentration using an elemental analyzer (Leco TCH 600, Mönchengladbach, Germany).
2.6. Root-Washing and Measurements
A custom-made root-washing device carrying a nail board was inserted into rhizoboxes before root washing, and the back of the rhizobox was carefully removed. The root-washing device was designed to hold the roots in place during washing (
Appendix B Figure B1; Compared to [
26,
27]) and was made of a plastic grid with nails mounted in an aluminum frame. Nails were placed every 13 mm in a rectangular plastic grid. Construction details are provided in
Appendix B. This root-washing device, which is simple and inexpensive to reproduce, allowed the used substrate to be washed away quickly and, at the same time, guaranteed that the roots remained in place (
Appendix B Figure B2 and
Figure B3).
After washing, three random root sections from three layers, i.e., 20 cm below the top (layer a), 20-25 cm below the top (layer b), and 25 – 60 cm below the top (layer c) were cut out. Each root section contained a section of an adventitious root with its lateral branches and was stored in 50% (v/v) ethanol solution at 4°C and later scanned with WinRHIZO using the link analysis to obtain lateral root traits.
Next, the root washing frame was turned over onto an even surface and, with a light tap, let the roots slide off onto a smooth surface which was scanned for total root length analysis with the current version of GROWSCREEN-Root [
28].
Finally, the root biomass, except for the sub-samples placed in alcohol, was collected, oven-dried, and weighed just as the shoot biomass.
2.7. Plant Nutrient Analysis
After determining the plants’ biomass, shoot and root dry matter were ground with a ball mill (Retsch MM400, Haan, Germany). A sub-sample was digested using microwave-assisted acid digestion with nitric acid and water peroxide and analyzed for its P, K, and Mg content using inductively coupled plasma optical emission spectrometry (ICP-OES; Thermo Scientific iCAP6500, Dreieich, Germany). Another ball-milled subsample was analyzed for its C, H, and N content using an elemental analyzer (Leco TCH 600, Mönchengladbach, Germany).
2.8. Roots Length Determination
After root washing, the software GROWSCREEN-Root [
28] was used to analyze the final root images from the rhizoboxes. Briefly, the primary, secondary, and tertiary roots were marked using the colors green, red, and blue, respectively. Thus, the root length per root class and depth layer were obtained.
2.9. Lateral Root Traits Using WinRHIZO
The collected root sections that were stored in alcohol were analyzed with WinRHIZO Pro V 2020a software (Regent Instruments Inc., Canada) using the ‘link analysis’. Roots were removed from ethanol solution, carefully washed in water, spread out in a tray with water, and scanned. The link analysis identifies ‘II’ links, which corresponds to the distances between forks, i.e. branches, and we assumed that the median length of all II links is a good estimate of the interbranching distances (IBD) as defined in the root handbook by Freschet et al. [
29]. Note that we had very few root crossings, which would otherwise also result in ‘II’ links. The authors also recommend determining the unbranched root apex, which is the root apex with the cell stretching zone behind it. We assumed that the median length of the EI links in the link analysis is a reasonable estimate of this trait for the lateral roots (including the higher-order lateral roots). We took care to keep the root sections intact and were not crossing, which was evident from a low crossing count, and a close agreement between the number of tips and the number of forks. Thus, we assumed we could estimate the average lateral root length by dividing the total length by the number of root tips.
2.10. Calculations
We calculated the ‘root mass fraction’ (RMF, g g
-1) as the ratio between the ‘root dry mass’ and the ‘total plant dry mass’; the ‘root length density’ (RLD cm cm
-3) as the ratio between ‘root length’ and ‘soil volume’ for a given sample; and ‘specific root length’ (SRL, cm g
-1) as the ratio of root length to root dry mass. We estimated the net light use efficiency (nLUE, g Mj
-1) as the ratio of the ‘plant dry mass’ to the ‘integral of intercepted photosynthetic active radiation over time’. To compute this, we assumed an exponential increase of leaf area (LA) over time with a starting leaf area of 1.8 cm
2 and assumed a negligible effect of self-shading (exponential fit and initial leaf area supported by unpublished data). Thus,
with t being the full growth period of 56 days.
2.11. Statistical Analysis
All data were analyzed with R. We fitted linear models when comparing treatments and mixed linear models with the REML method when analyzing the subsampling of the boxes at specific locations, indicating the nested structure of the error terms. Means were computed with the “emmeans package” using REML and analyzed using ANOVA and Tukey’s honest sign. distance. Log transformations were applied where appropriate and plots were plotted with a log-transformed y-axis accordingly.
3. Results & Discussion
3.1. Root Length Density Distribution Is Associated with Nutrient Placement
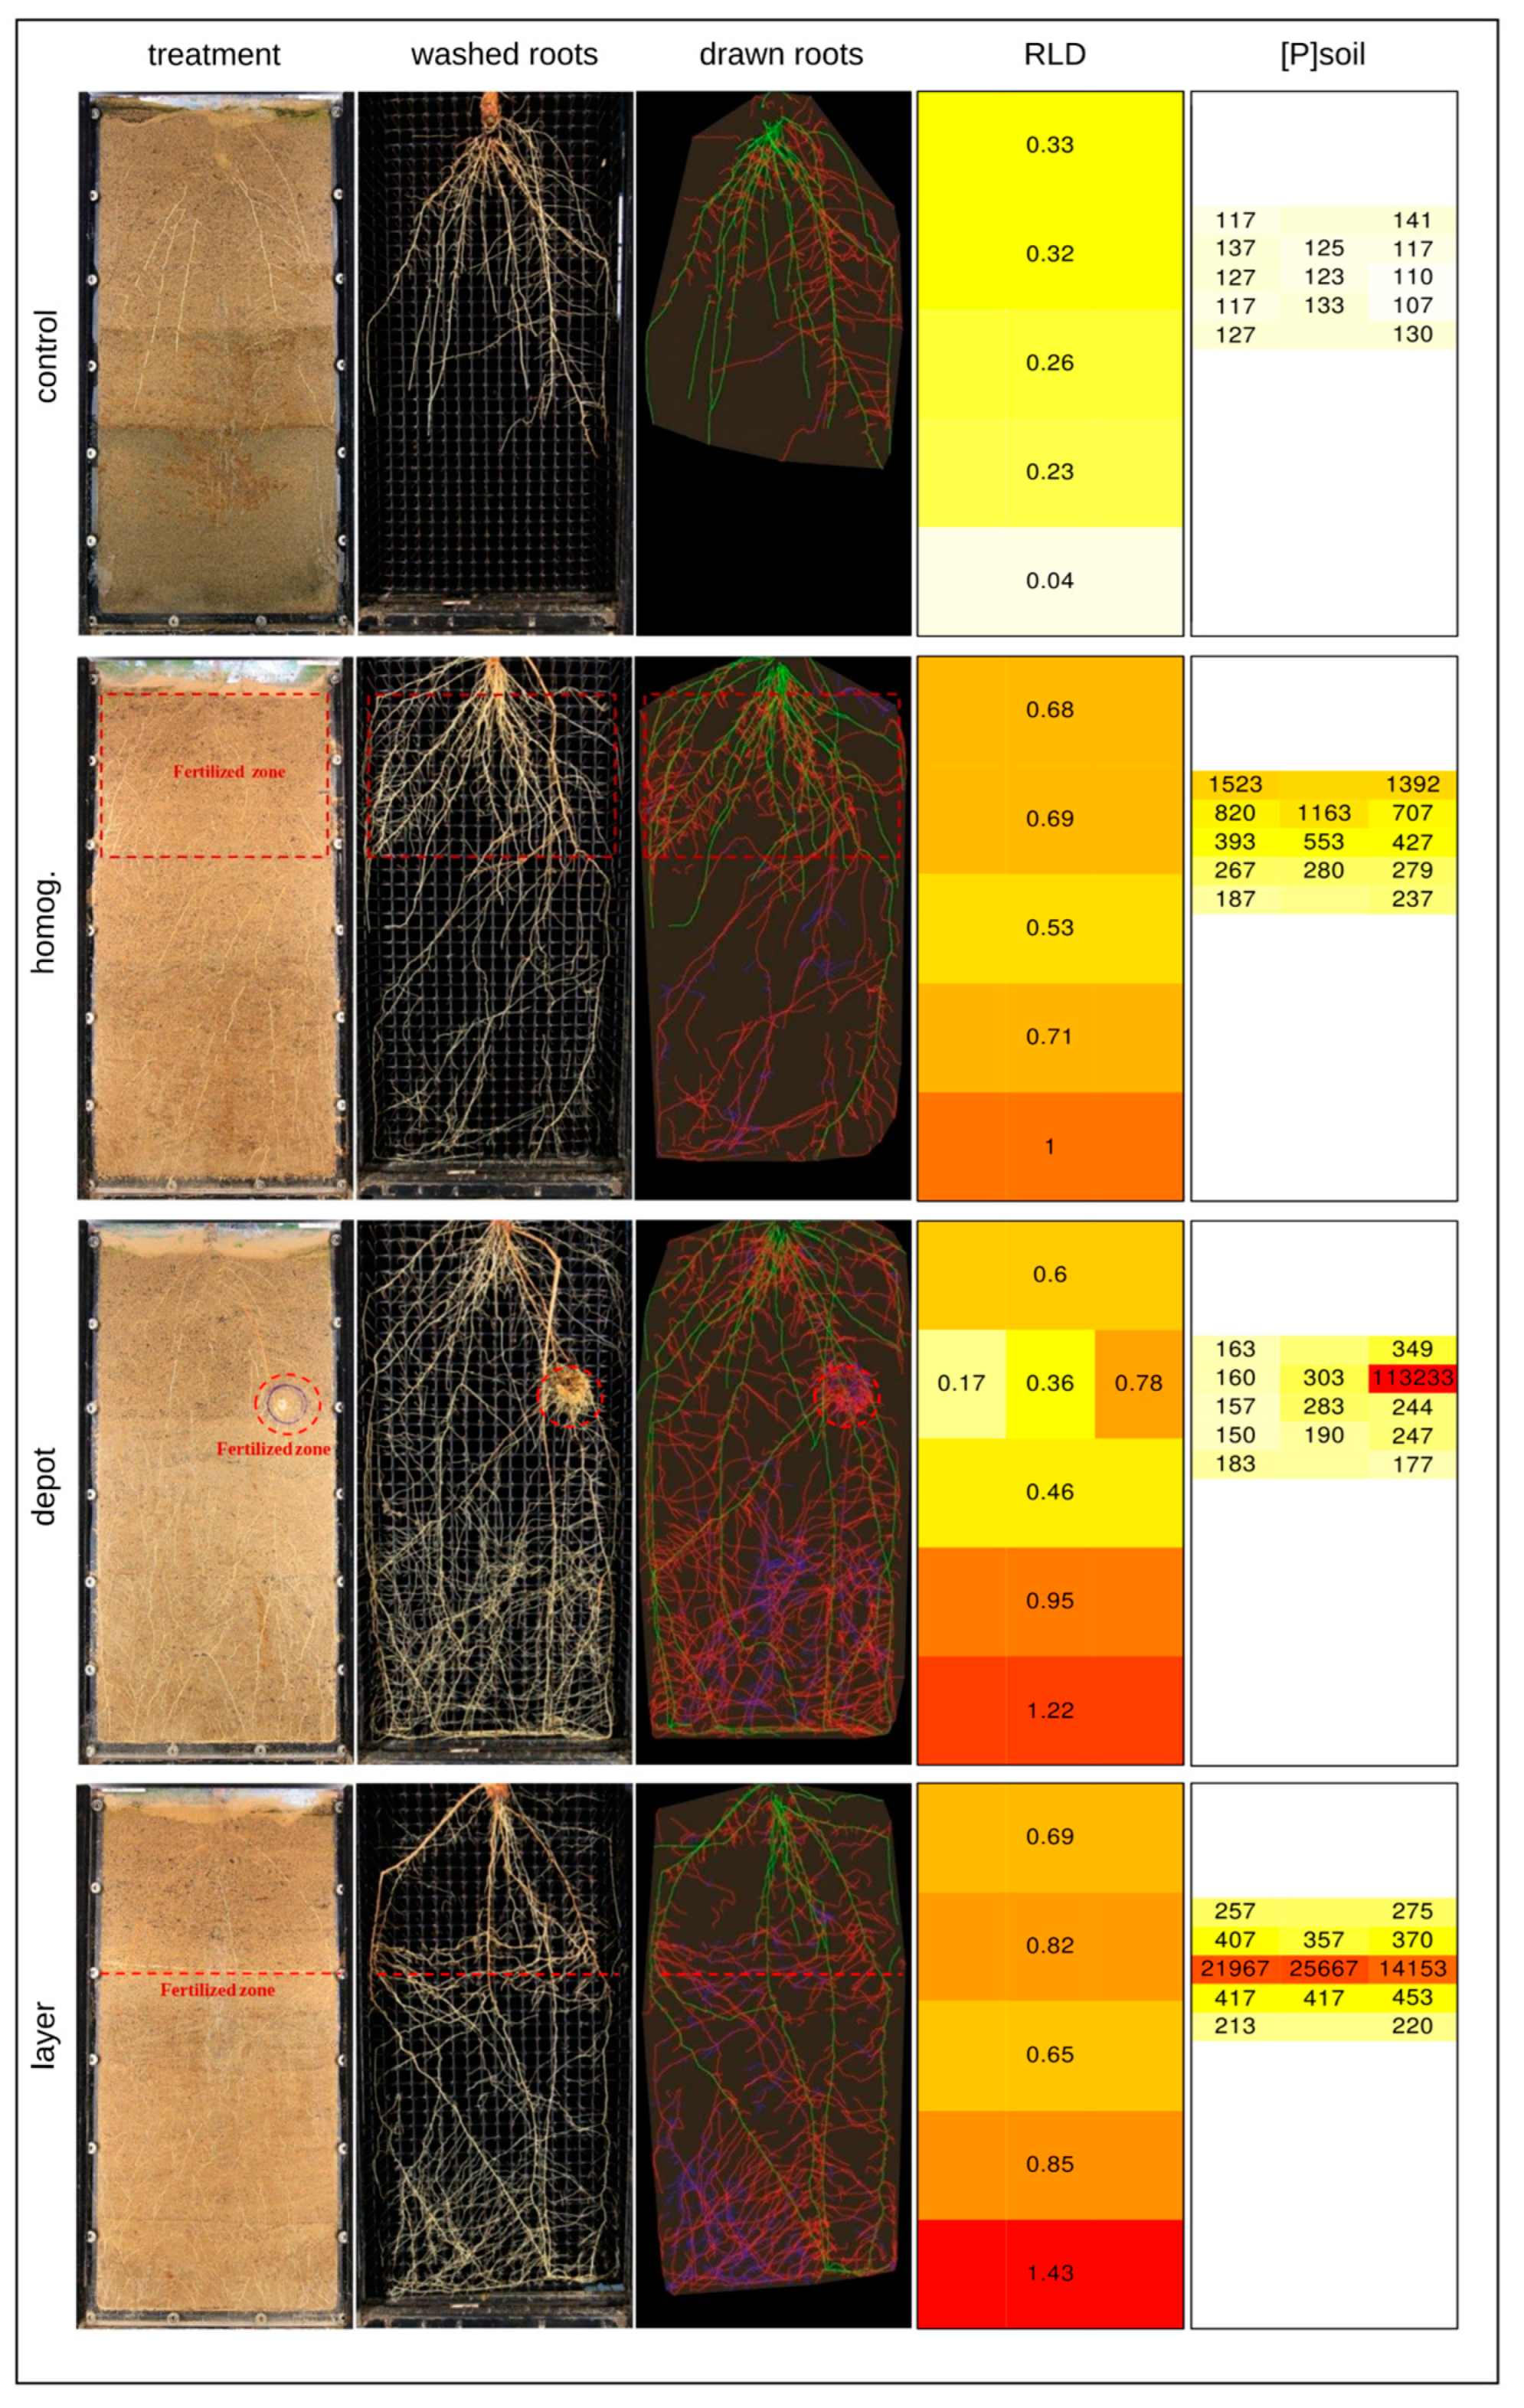
Root growth was strongly affected by fertilization with significantly more root length in the fertilized compared to the unfertilized conditions (
Figure 2). The placement of roots in the box was associated with the placement of the fertilizer. However, fertilized boxes also had more roots in the unfertilized lower layers, where root growth was obstructed by the bottom of the rhizotron. Fertilization thus clearly led to deep rooting, and this was especially pronounced in the ‘depot’ and ‘layer’ treatments.
3.2. Nutrients Did Not Spread Much
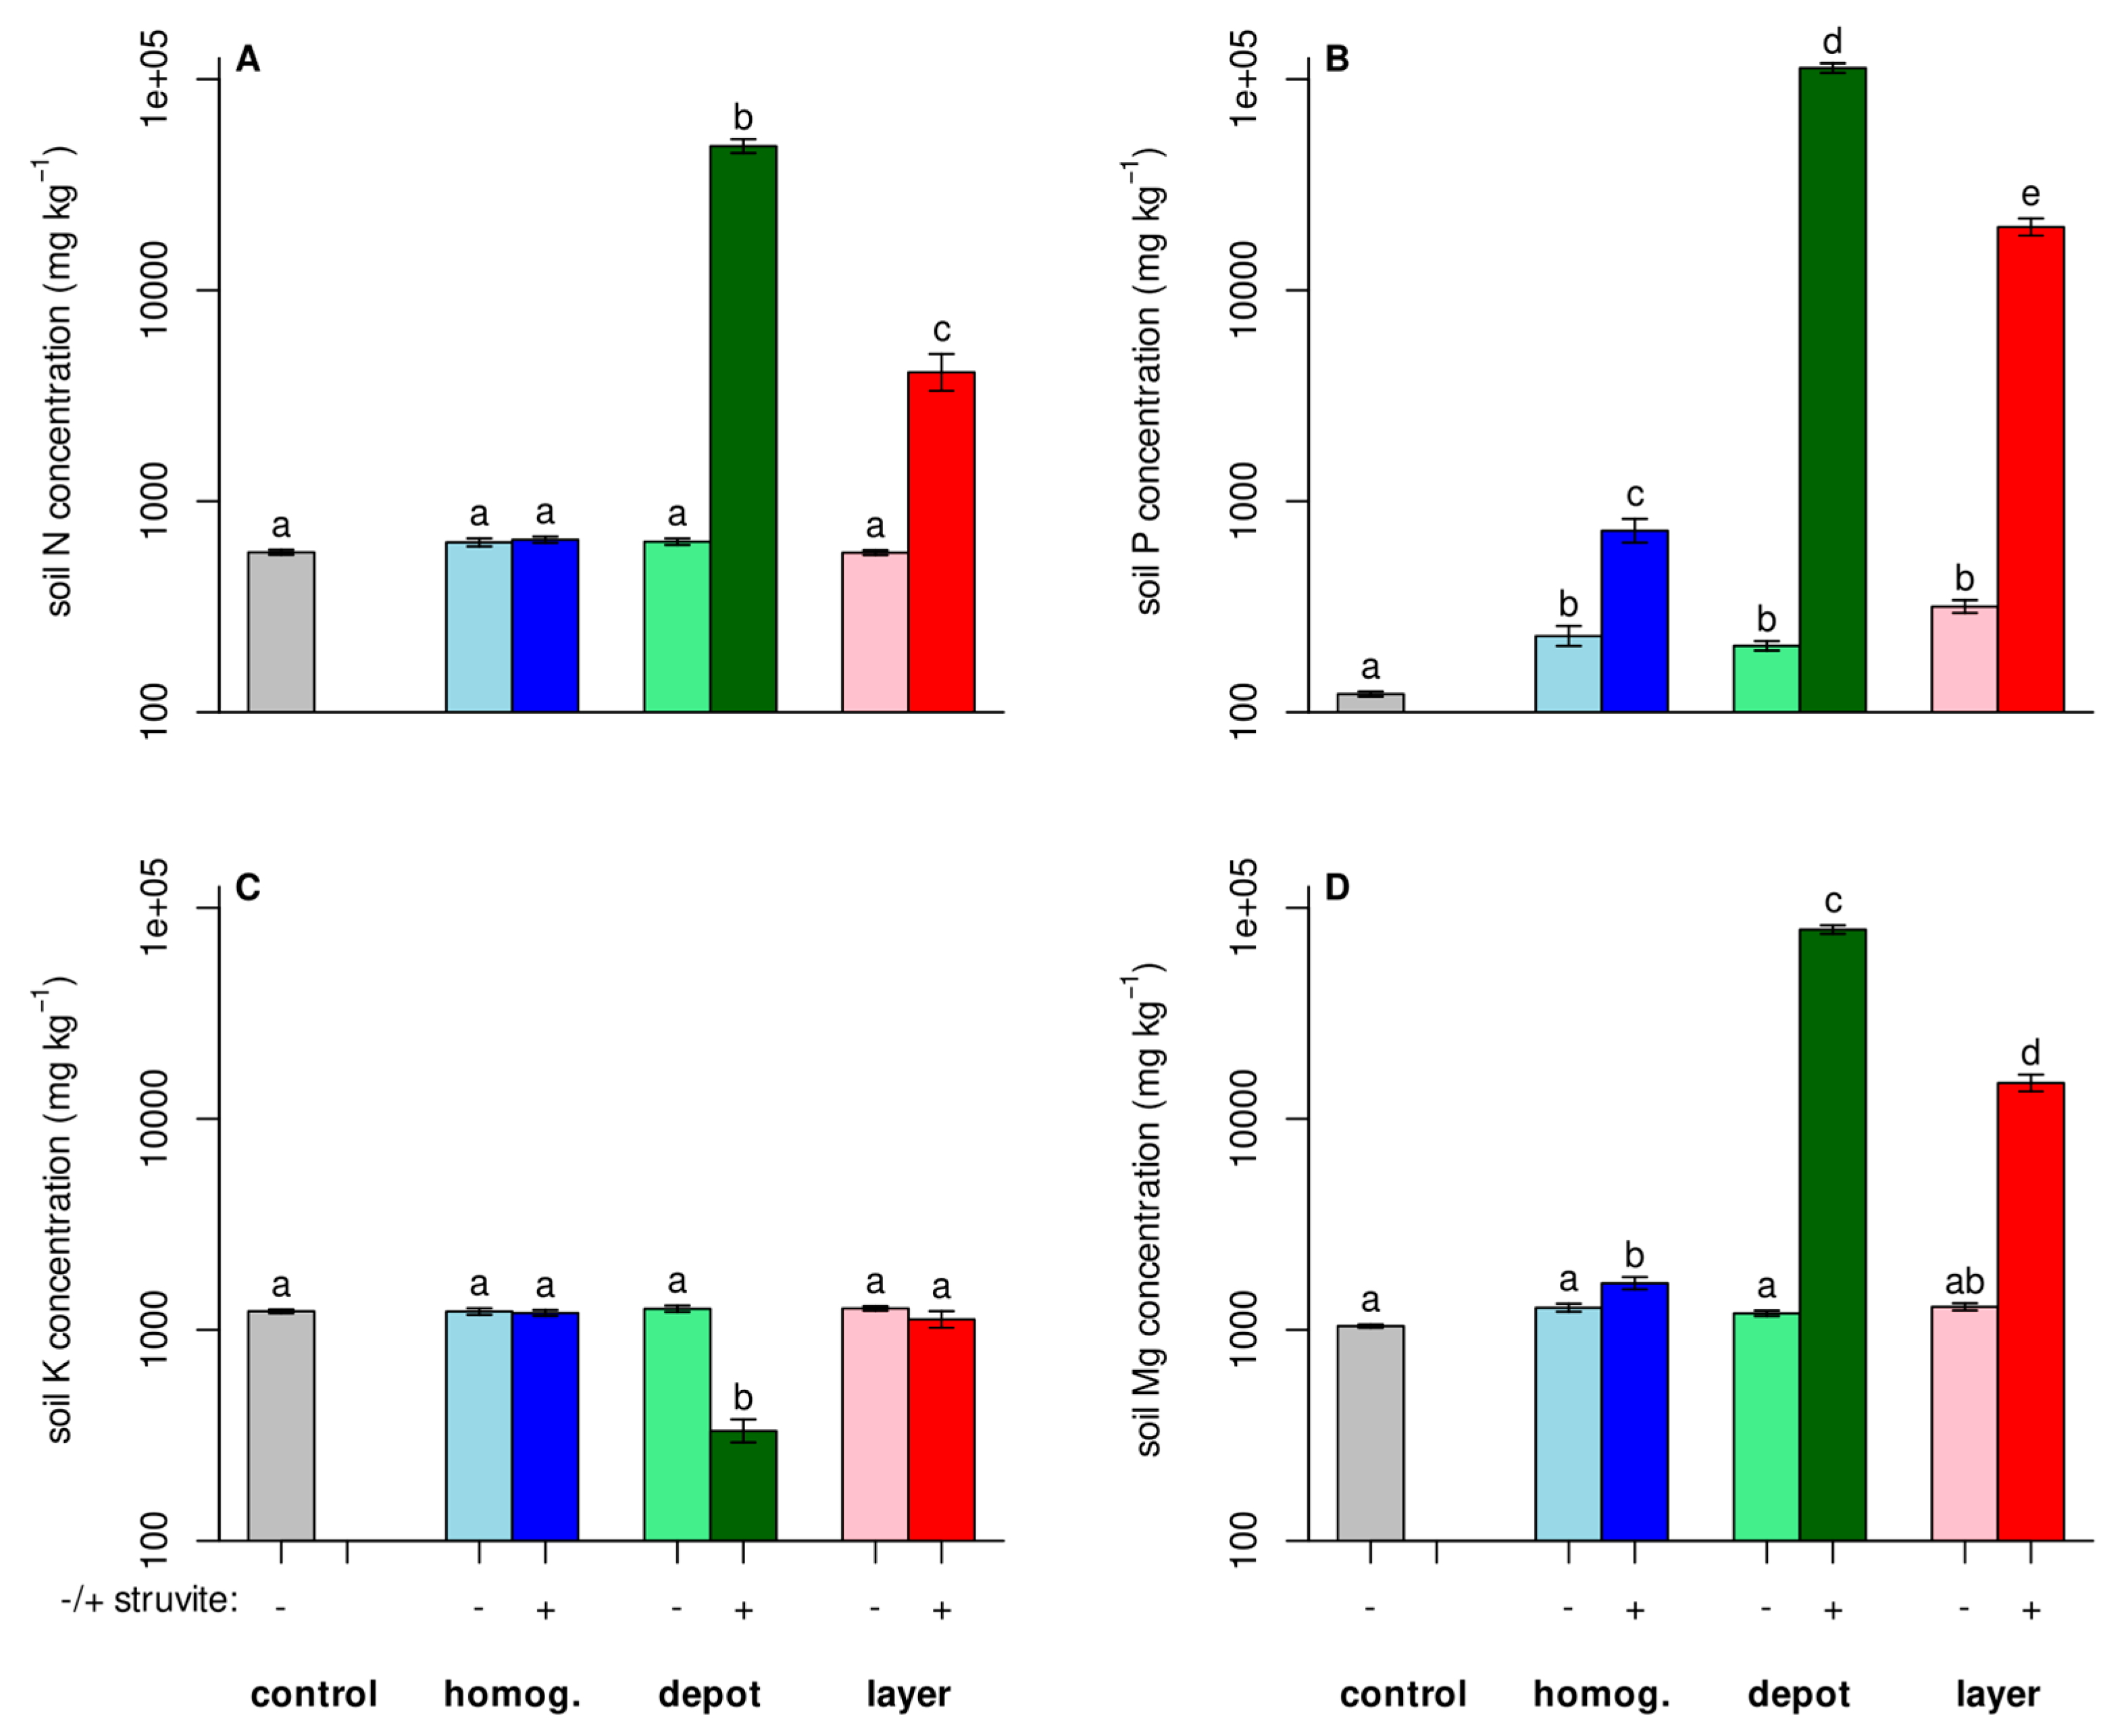
Although the roots proliferated where the fertilizer was placed, we verified that the fertilizer did not spread through the box. The heat maps for the P fertilizer (
Figure 2) show slightly higher concentrations in locations neighboring the fertilizer placement. But overall, samples from unfertilized locations did not differ significantly from unfertilized soil in N, P, or Mg content (
Figure 3). As a control, K concentrations were also measured and they did not differ in any location or box, except for the sample taken in the depot, where the potassium concentration was lower. At that location pure struvite was placed, replacing the soil substrate. The used struvite contained no potassium. Overall, significant amounts of residual fertilizer remained in location at the end of the experiment, confirming findings of Rech et al. [
30]. This suggests that struvite could continue to feed the plants much longer as this fertilizer did not diffuse far into the soil as suggested by Talboys et al. [
31] and Rech et al. [
30]. Although crop response to struvite might depend on soil pH and crop, our cassava experiment showed that struvite is suited for cassava production. However, the recovery of struvite requires specific conditions and resources, such as magnesium, which may not be readily available or cost effective in all casava producing regions. This can limit the scalability and economy feasibility of struvite production and use (reviewed by Yesigat et al. [
32]).
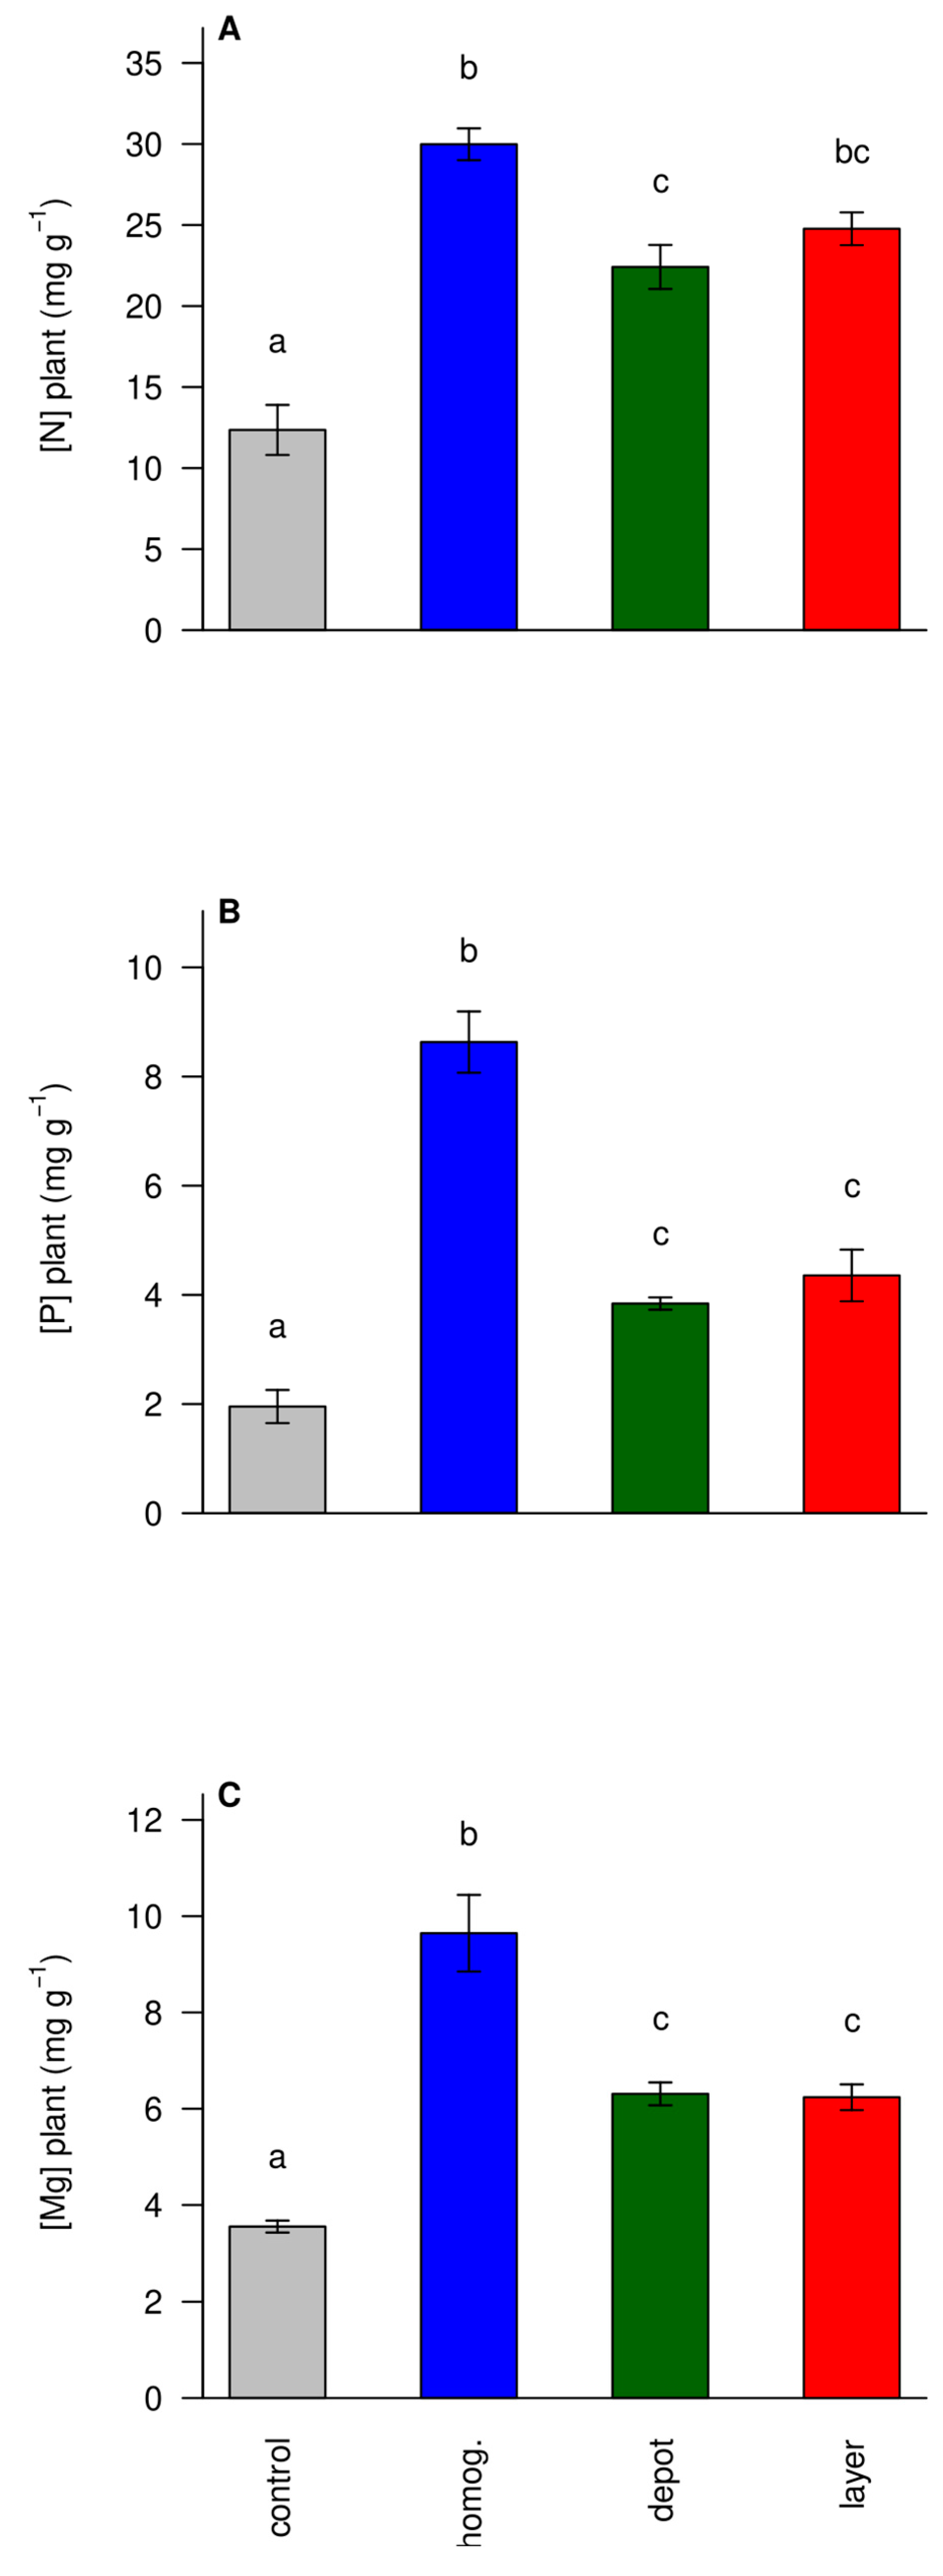
3.3. Fertilization Increased Nutrient Concentrations in the Biomass
Fertilization increased the N, P, and Mg concentrations in the plant biomass significantly (
Figure 4). The highest concentrations were achieved with the homogeneous spreading of fertilizer, which made the nutrients available to the plant from day one. In contrast, in the ‘layer’ and ‘depot’ treatments the plants had to grow towards the fertilizer and had to proliferate roots into it. This led to somewhat lower nutrient concentrations (and less total uptake, data not shown) compared to the ‘homogenized’ treatment, but to significantly higher concentrations in the ‘unfertilized control’.
3.4. Unfertilized Plants Were Small and Had Signs of N Deficiency
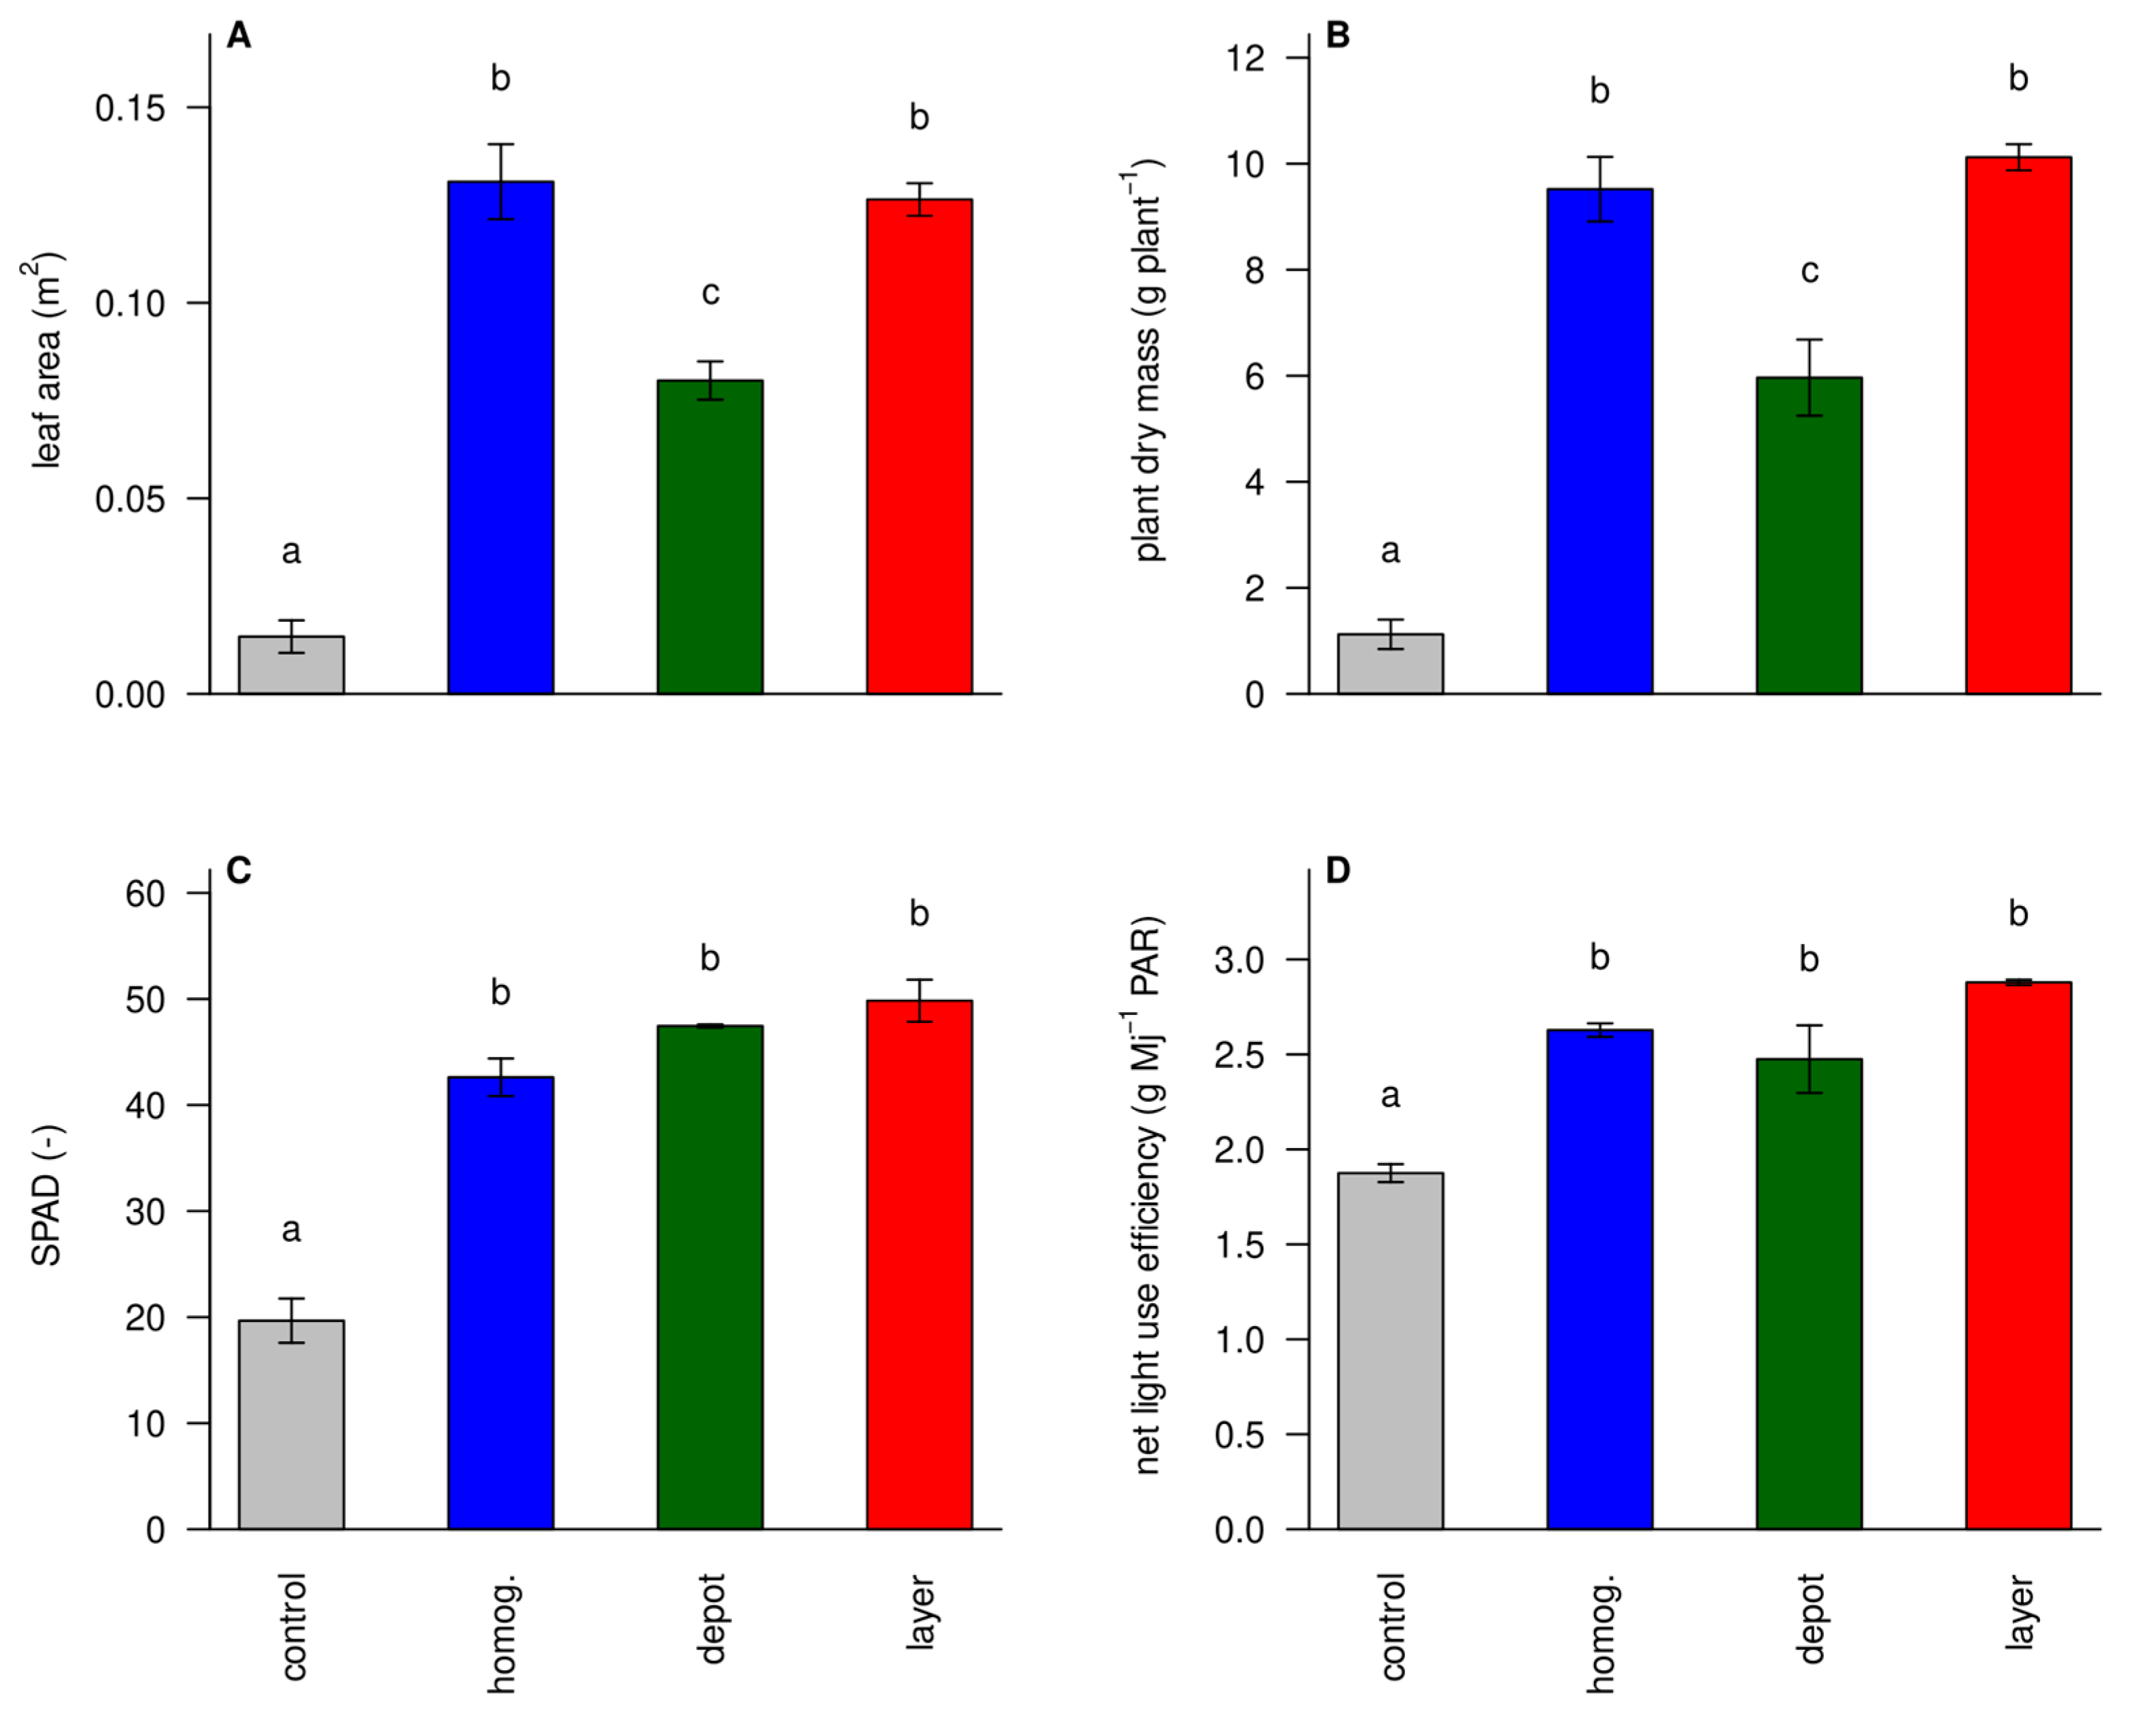
The total leaf area and biomass production was low in the ‘unfertilized control’, and highest in the ‘homogenized’ and ‘layer’ treatments (
Figure 5AB). The ‘depot’ treatment had more biomass than the ‘unfertilized control’, but less than the other treatments. The nutrient concentrations of the ‘unfertilized control’ (
Figure 4) were critically low for N, suggesting that these plants suffered mostly from nitrogen deficiency. By visual evaluation, small leaves, slow leaf appearance, thin stems, and light green color supported this conclusion. SPAD values, a measure for leaf greenness and chlorophyl content, were indeed low in the control plants (
Figure 5C). Low chlorophyll leads to low photosynthesis rates and the estimated net light use efficiency was indeed reduced in the ‘unfertilized control’ plants (
Figure 5D). Mahakosee et al. [
33] report solar radiation use efficiency values of 1-1.5 which, assuming PAR/solar radiation = 0.45, correspond to 2.2-3.3 on the y-scale of
Figure 5D. This suggests that the control treatment had truly low-efficiency values.
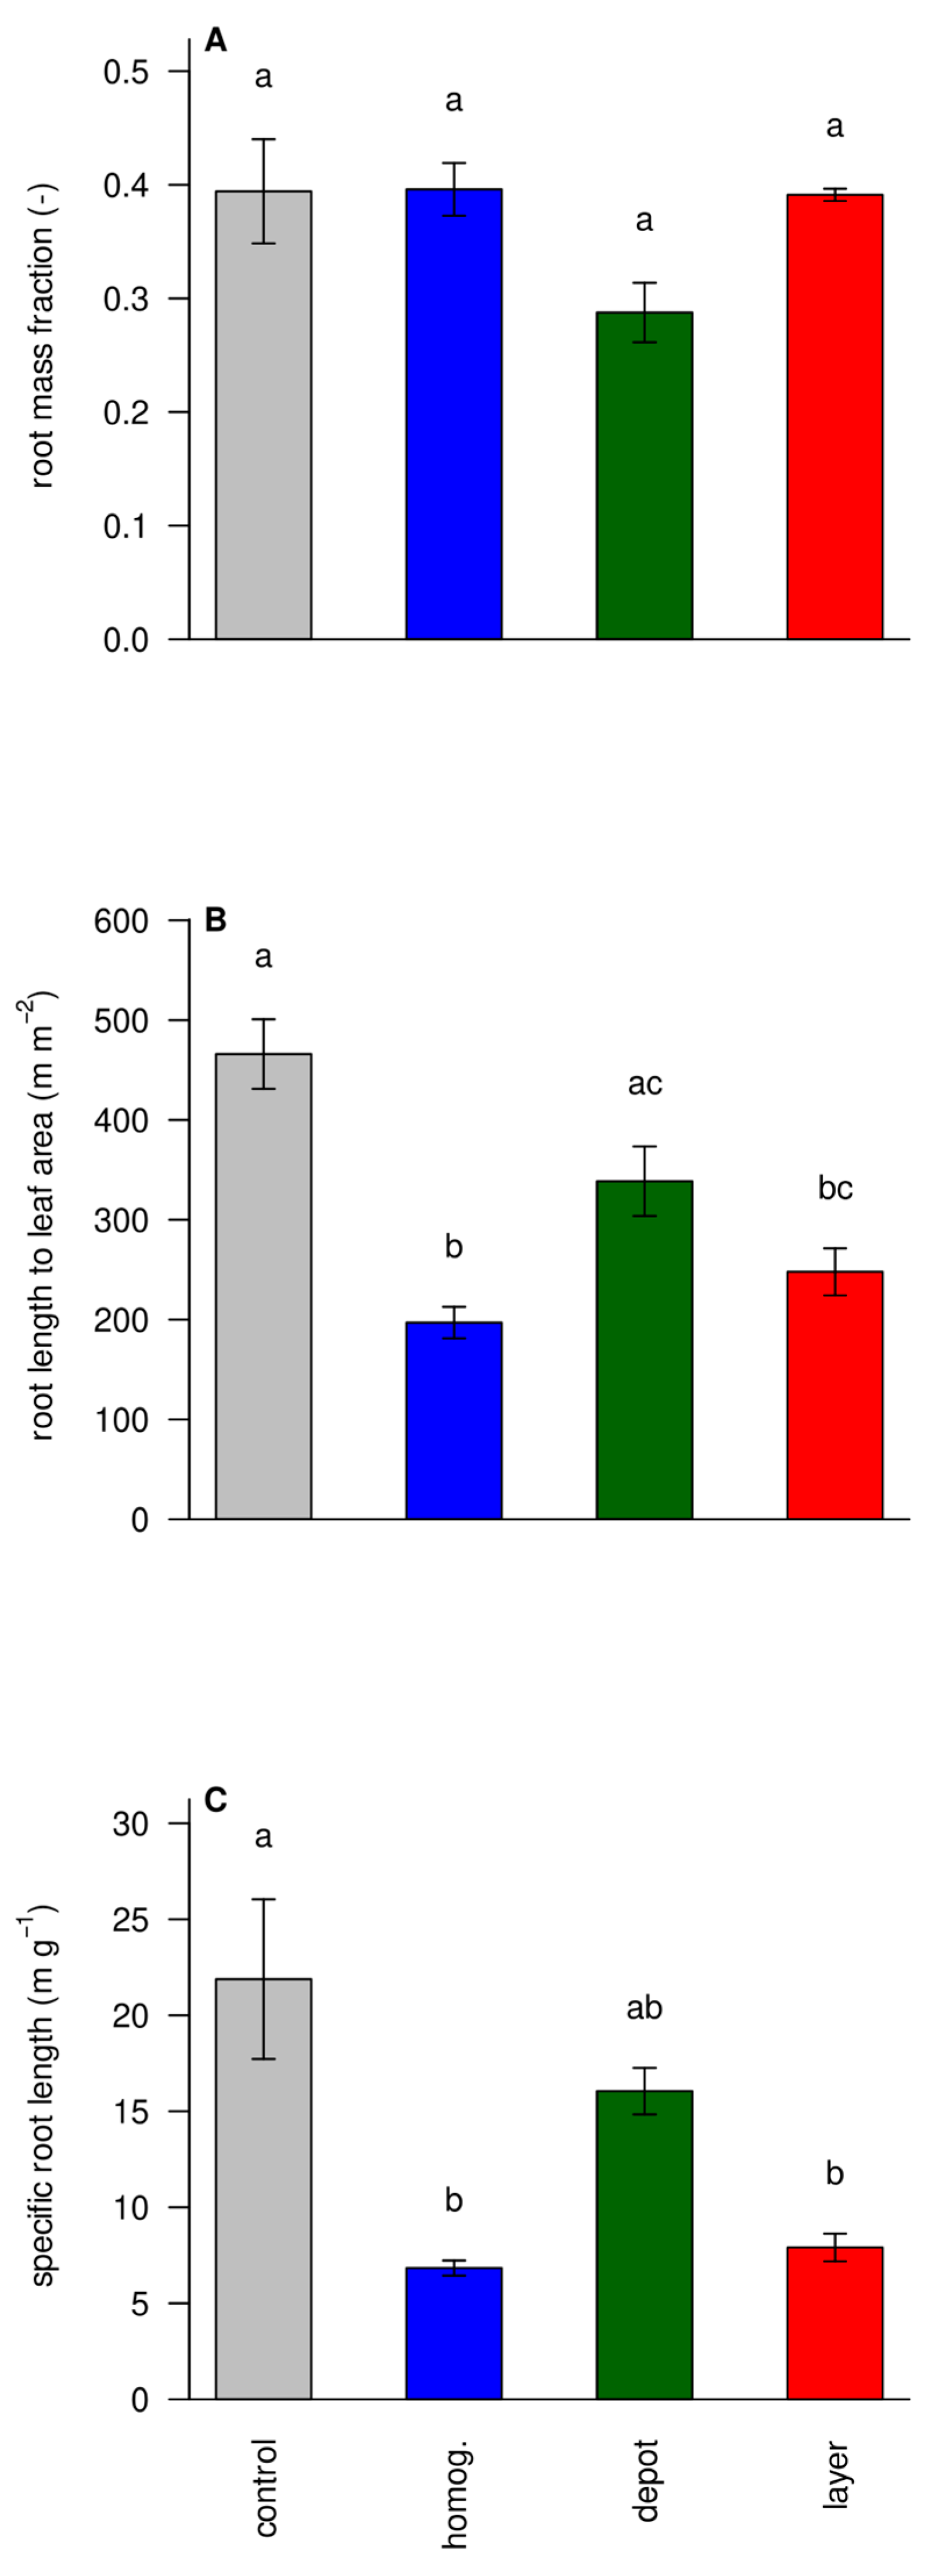
3.5. Functional Ratios Show Less Stress in the ‘Homogenized’ and ‘Layer’ Treatments
Low nutrient availability typically alters the allocation between root and shoot resulting in a larger root mass fraction [
34]. The root mass fraction (and its counterpart root to shoot ratios), however, did not differ among treatments (
Figure 6A). Although commonly used to indicate a functional equilibrium between root and shoot, we postulate that the RMF is a bad measure in a crop that forms storage roots as one would have to distinguish the heavier storage roots from the fine roots, which is difficult in younger plants [
22]. Furthermore, RMF does not take changes in specific leaf area or specific root length into account. The functional balance between root and shoot is proposedly better described by the ratio of their respective surface areas [
35]. Determining root surface area reliably is challenging, and we took root length as a proxy and computed the root length to leaf surface area ratio (
Figure 6B). Indeed, ‘unfertilized control’ plants had a much greater root length to leaf surface area ratio than ‘homog.’ fertilized plants, whereas ‘depot’ and ‘layer’ were in between, indicating that concentrating nutrients tended to make nutrient uptake harder. Presumably, because it renders much of the root length outside the nutrient hotspots ineffective. The specific root length is the root length per root dry mass and is strongly related to the ratio of fine roots (accounting for most length) and thick roots (accounting for most mass) and a measure of the metabolic efficiency of the root system.
Figure 6C shows that plants responded to low nutrient availability by increasing their SRL.
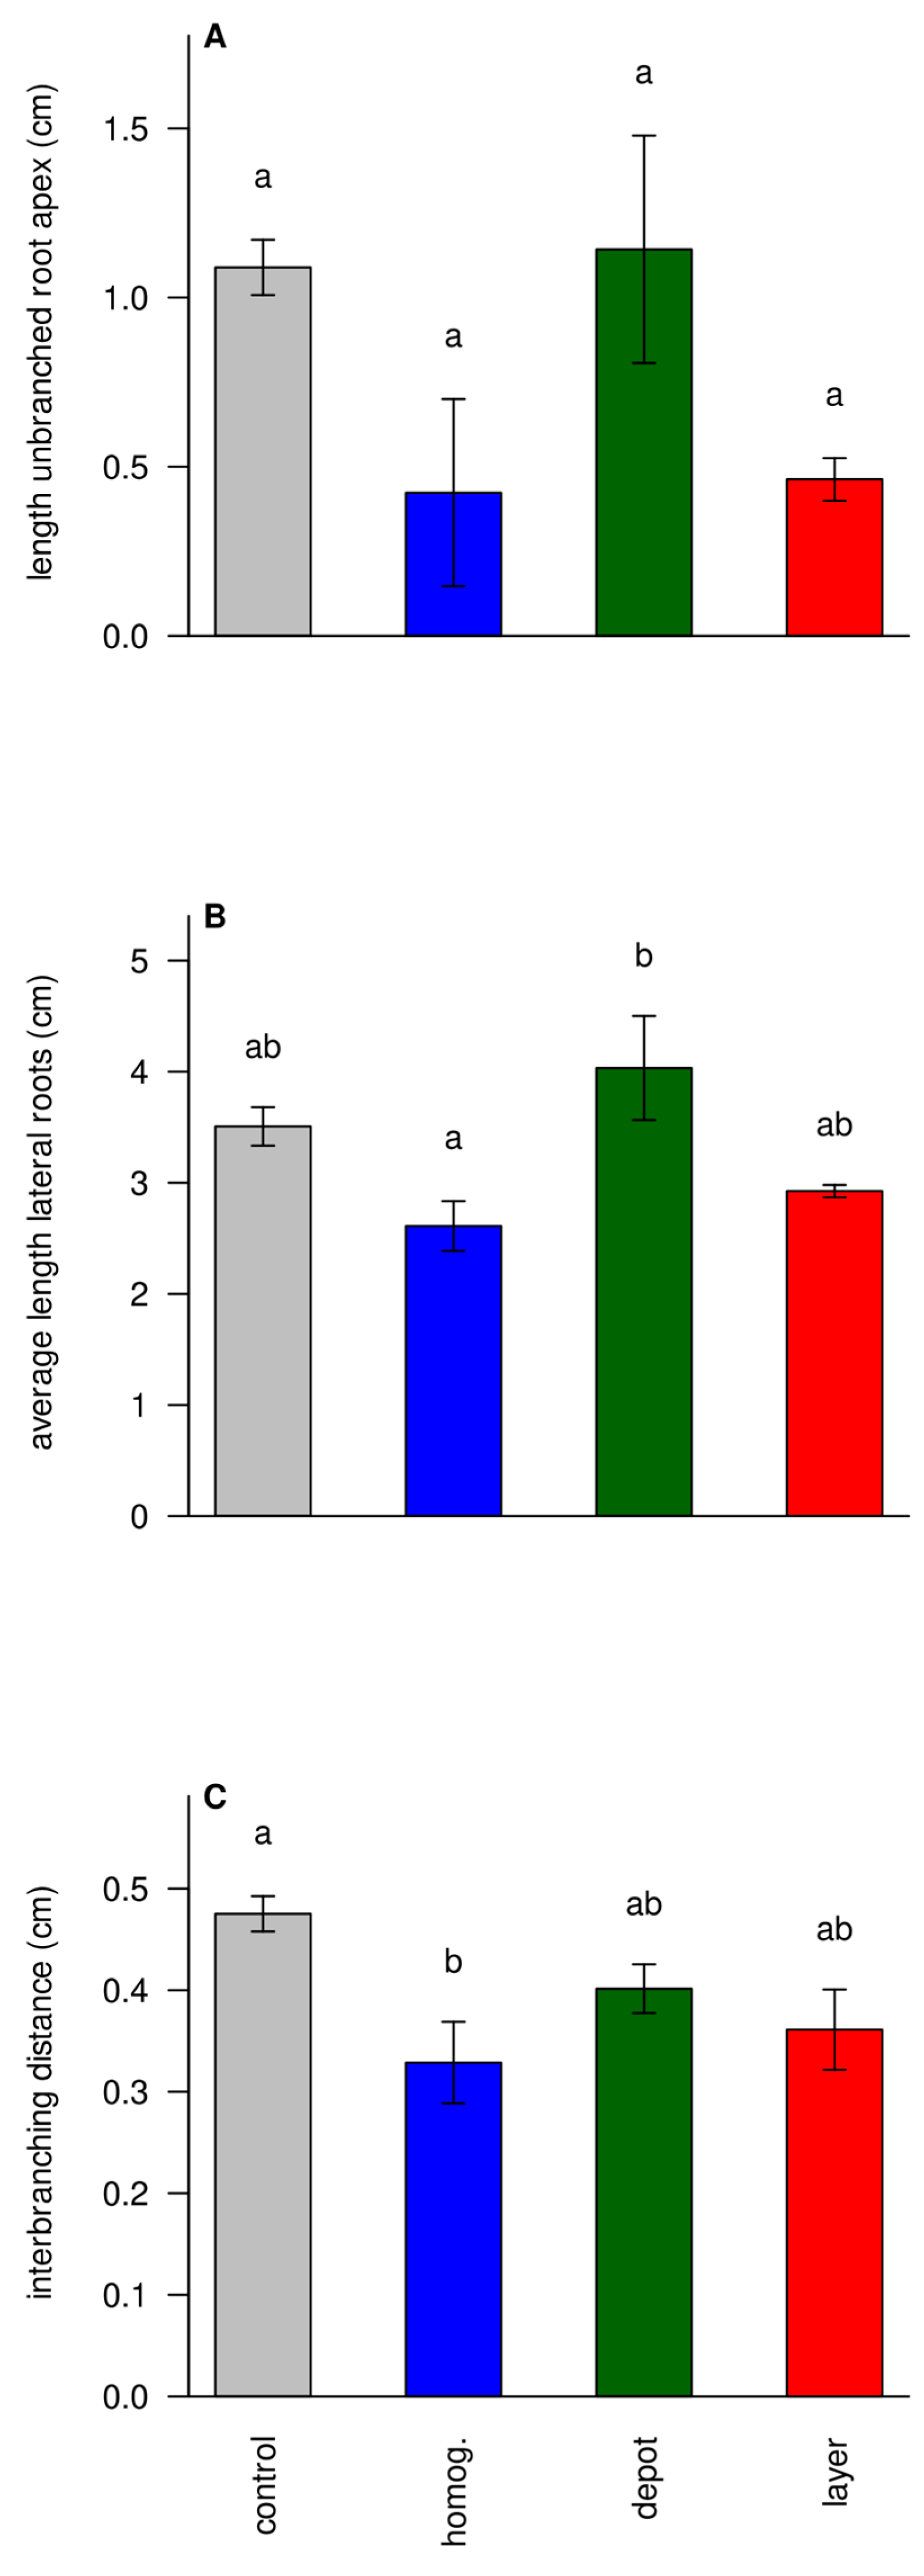
3.6. Struvite Increases Foraging Intensity
Changes in specific root length hint at changes in root architecture. From subsamples, the length of the unbranched root apex was estimated. This length seemed longer in ‘unfertilized’ and ‘depot’ treatments, although it was hard to establish significance for this trait (
Figure 7A). Still, longer unbranched root apices suggest faster root elongation of individual lateral root tips[
29]. The individual lengths of lateral roots followed a similar pattern, consistent with this theory (
Figure 7B). Finally, the interbranching distances, i.e. the median distance between branches, also showed the same pattern (
Figure 7C). Altogether, this suggests that unfertilized plants and ‘depot’-fertilized plants, which had most of their roots in unfertilized soil, tended to have less branched but more elongated lateral roots resulting in sparser root systems, aimed at soil exploration, rather than local foraging intensity.
4. Conclusions
To our knowledge, this is the first report that describes how cassava proliferates roots in areas of increased nutrient availability. When nutrients are highly concentrated in a ‘depot’ the response can be quite strong, as shown in
Figure 2. It has been suggested that such a response is metabolic expensive and might go at the cost of growing deeper roots. However, this was not observed. Rather, the ‘layer’ and ‘depot’ treatments had the highest root length densities in the deepest part of the rhizotron and achieved a higher specific root length than the ‘homogenized’ treatment, suggesting greater metabolic efficiency. It has sometimes been questioned if nutrient movement in soil is so fast that a proliferation response would be late in capturing the nutrients. Although this might be the case for highly soluble nutrients, it was not the case for struvite which moved little during the 8-week experiment and might act as a slow-release fertilizer as suggested by Talboys (2016). This publication belongs to the growing body of manuscripts that show that struvite was effective in increasing plant growth and nutrient concentrations [
36,
37]. We demonstrated that it can be used to fertilize cassava efficiently. Being a wastewater-recovered mineral with slow-release properties that disperses very slowly in soil, it may be useful in the sustainable production of this long-season crop with less risk of leaching during heavy rain seasons. Furthermore, continuous cassava cultivation depletes the soil of important nutrients and therefore, we suggest that a belowground strip application in the ridges may be a particularly interesting application of struvite for cassava cultivation, especially continuous cassava production.
Author Contributions
Conceptualization and design of research by N.D.J., R.B., A.S.G., T.W., and J.A.P.; execution of experiments and measurements by R.B., A.S.G., V.B., H.B., and N.D.J.; Data analysis by R.B., A.S.G., B.O., A.A., S.B., M.M.-L., and J.A.P.; visualization, R.B., A.S.G., B.O., A.A., S.B., and J.A.P.; supervision, N.D.J., J.A.P.; project administration, J.A.P., T.W.; funding acquisition, J.A.P., T.W.; writing of manuscript—original draft preparation by R.B., A.S.G., N.D.J., C.R., J.A.P., with input of all coauthors; writing—review and editing by all authors.
Funding
This research was funded by the project DIRECTION (DLR, BMBF,01DP21004) and by the Helmholtz Association (POF IV: 316 2171, Bio-logical and environmental resources for sustainable use) A.S.G. acknowledges financial support by The São Paulo Research Foundation (FAPESP, grant number 2021/10104-1). R.B. acknowledges financial support by FAPESP (grant numbers 2020/12210-3; 2023/01549-8) and FINEP (grants 01.22.0274.00 and 01.22.0080.00 Ref. 1219/21). C.R. acknowledges CNPq INCT Circularity in Materials grant #406925/2022. H.B. acknowledges funding by the Academy for International Agricultural Research (ACINAR). ACINAR, commissioned by the German Federal Ministry for Economic Cooperation and Development (BMZ), is being carried out by ATSAF (Council for Tropical and Subtropical Agricultural Research) e.V. on behalf of the Deutsche Gesellschaft für Internationale Zusammenarbeit (GIZ) GmbH.
Data Availability Statement
Acknowledgments
We would like to thank Sabine Willbold, Jennifer Pelikan, Nadine Wettengl, and Daniela Gesekus, ZEA-3, Forschungszentrum Jülich, for the elemental analyses. We thank OSTARA for providing CrystalGreen® struvite for our studies.
Conflicts of Interest
The authors declare no conflicts of interest.
Appendix A. Substrate Sampling Scheme in the Rhizotrons
Figure A1.
An overview of the 13 different sampling spots in the rhizotron from which substrate was taken for elemental analysis. The horizontal line marks a depth of 20 cm representing the region of the different struvite applications, i.e., either as ‘layer’ at a depth of 20 cm, a ‘depot’ at a 5 cm distance from the right border, and in a depth of 20 cm, and a ‘homogenized’ fertilizer treatment where the struvite was thoroughly mixed with the substrate before filling the remaining 20 cm of the rhizotron to the top edge. For each treatment, 3 g struvite (CrystalGreen®, 100 SGN grade (1.0 mm), OSTARA, Vancouver BC, Canada; containing 150 mg of nitrogen (N); 366 mg of phosphorus (P); 300 mg of magnesium (Mg), according to the provider’s analysis (w/w): total nitrogen (ammoniacal-N): 5.0%, phosphorus pentoxide (P
2O
5): 28.0% (12.2% P), total magnesium oxide (MgO): 16.7% (10.0% Mg)) was used. Thus, all fertilized treatments received the same total amount of struvite but the fertilizer was most concentrated in the depot (sampling spot 5, see
Figure 2) and least in the ‘homogenized’ treatment (sampling spots 1-8, see also
Figure 2). The same sampling scheme was also applied to the unfertilized ‘control’. Sampling was conducted throughout all rhizotrons.

Appendix B. Root-Washing Device
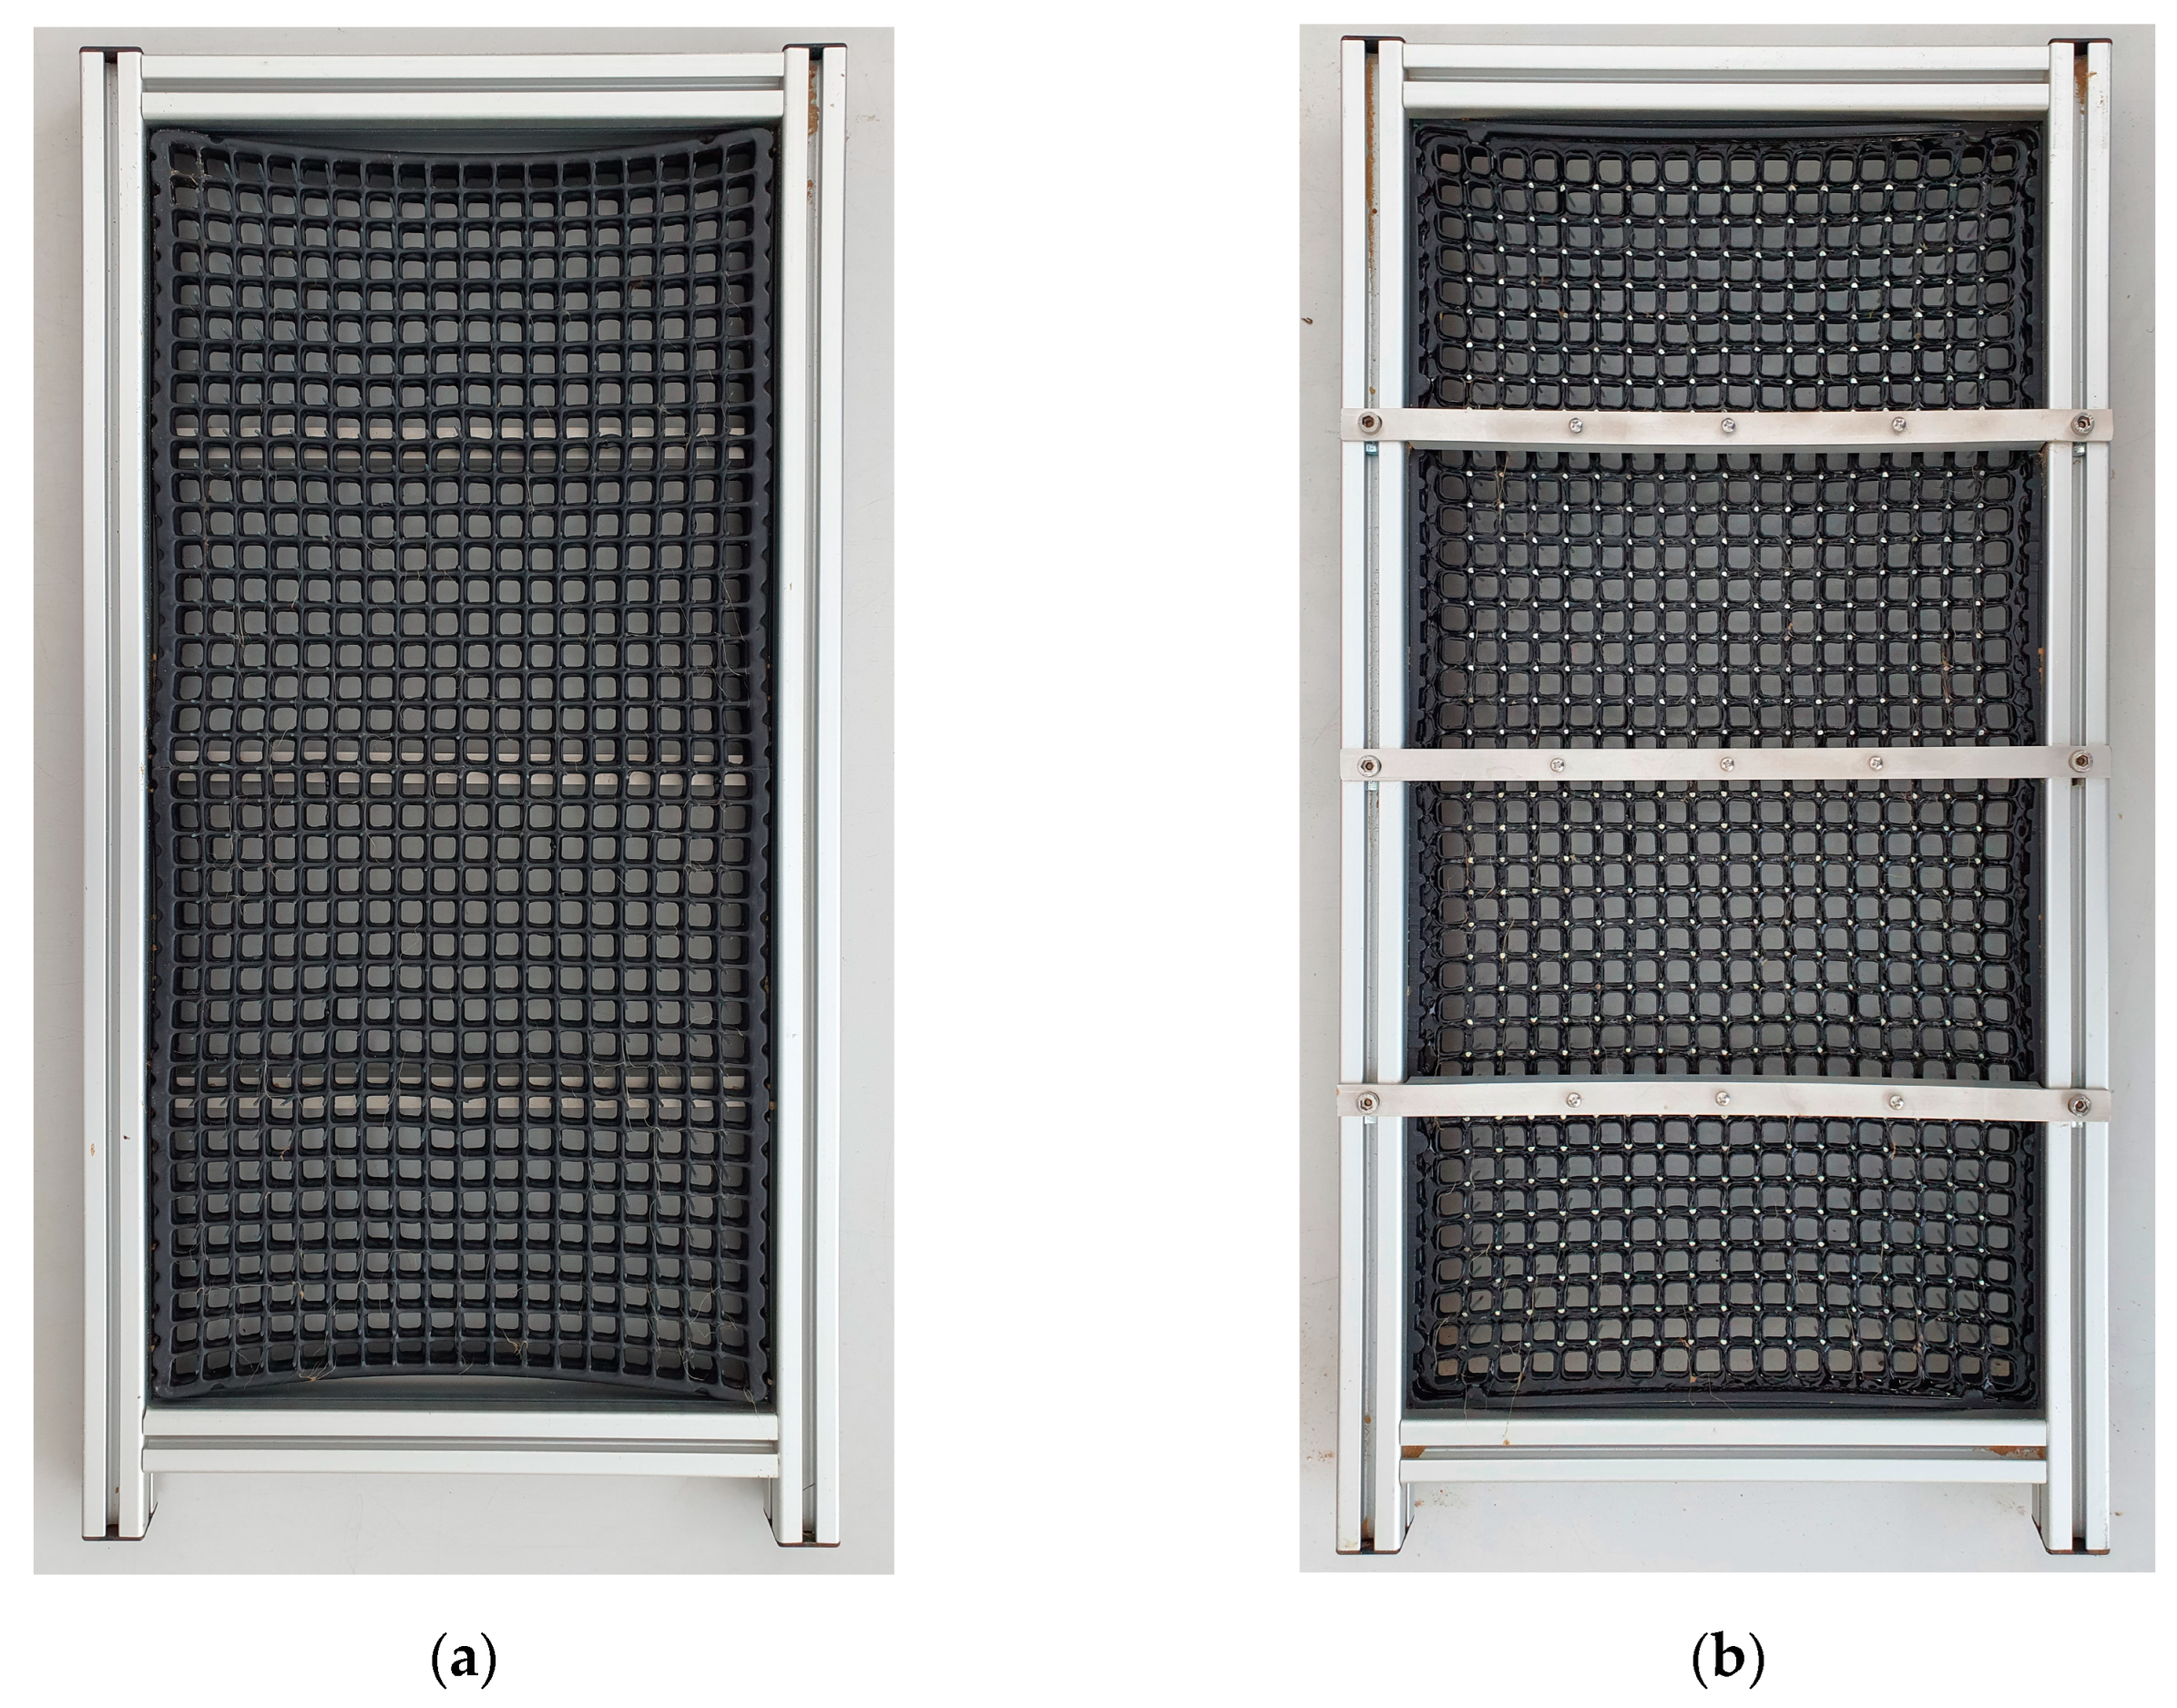
To facilitate root washing and root sampling in the various depth layers, a simple root-washing device was developed in accordance with the rhizobox dimensions of 600x300x30 mm. Initially, a commercially available 576 multi-pot tray QuickPot® QP D 576 (
https://www.herkuplast.com/de/programm/QuickPot/D%2526auml%253Bnenma%2526szlig%253B/QP%2BD%2B576.html; HerkuPlast, Kubern GmbH, Ering am Inn, Germany) with the dimensions of 310x530 mm was used. The upper openings of the square holes have an edge length of 13x13 mm and extend 30 mm downwards to a circular outlet with a diameter of 8 mm. As those trays are designed to hold back substrate, which is unwanted in the washing set-up, the lower end including the round hole was cut off using a hot wire reducing the depth from 30 to 15 mm and widening the opening drastically. Standard iron nails of 1.4x25 mm size have been pushed into 1.3 mm holes drilled centrally at the intersections of the openings to avoid splitting the material, but still holding them firmly. Subsequently, this first device was optimized for the used rhizoboxes, as described below. To cover the rhizotrons’ entire possible rooting depth (600 mm), two of the 576 multi-pot trays were cut to size and fused by using TANGIT PVC-U special glue (Henkel, Düsseldorf, Germany). To avoid rust this time, stainless steel nails (1.4 x 25 mm, Werner Hesse GmbH, Werl, Germany) have been inserted as described before. To prevent the nails from being pushed back when pressed into the rooted substrate, nails were fixed in place by filling all the gaps in the back of the tray with a two-component liquid adhesive (ACRIFIX® 2R 0190, Röhm GmbH, Weiterstadt, Germany). However, we observed that the adhesive had severely attacked the plastic of the multi-pot tray, so epoxy resin or sealing compounds, for example, could be an alternative here, given the compatibility with the materials used. The entire tray was fitted into a stable aluminum frame using 30x30 mm ITEM aluminum profiles (item Industrietechnik GmbH, Solingen, Germany,
Figure B1(a)) while the back of the tray was stabilized with three screw-mounted aluminum rails (359x15x15 mm,
Figure B1(b)).
Figure B1.
(a) front view of the root wash frame; nails were inserted centrally at the intersections of the openings before fixing them from the back with a liquid adhesive. (b) back side of the root wash frame.
Figure B1.
(a) front view of the root wash frame; nails were inserted centrally at the intersections of the openings before fixing them from the back with a liquid adhesive. (b) back side of the root wash frame.
This optimized root-washing device, which is simple and inexpensive to reproduce, allows the used substrate to be washed out quickly and easily and, at the same time, guarantees that the roots remain at their naturally grown angle as far as possible. Subsequently, roots can easily be removed from the tray using scissors at the desired depth horizons or sampling points for appropriate root sampling. Turning the root washing frame over onto an even surface and tapping it slightly allows the roots to fall off easily, allowing for their further analysis as a whole for, e.g., scanning of the roots or for other operations.
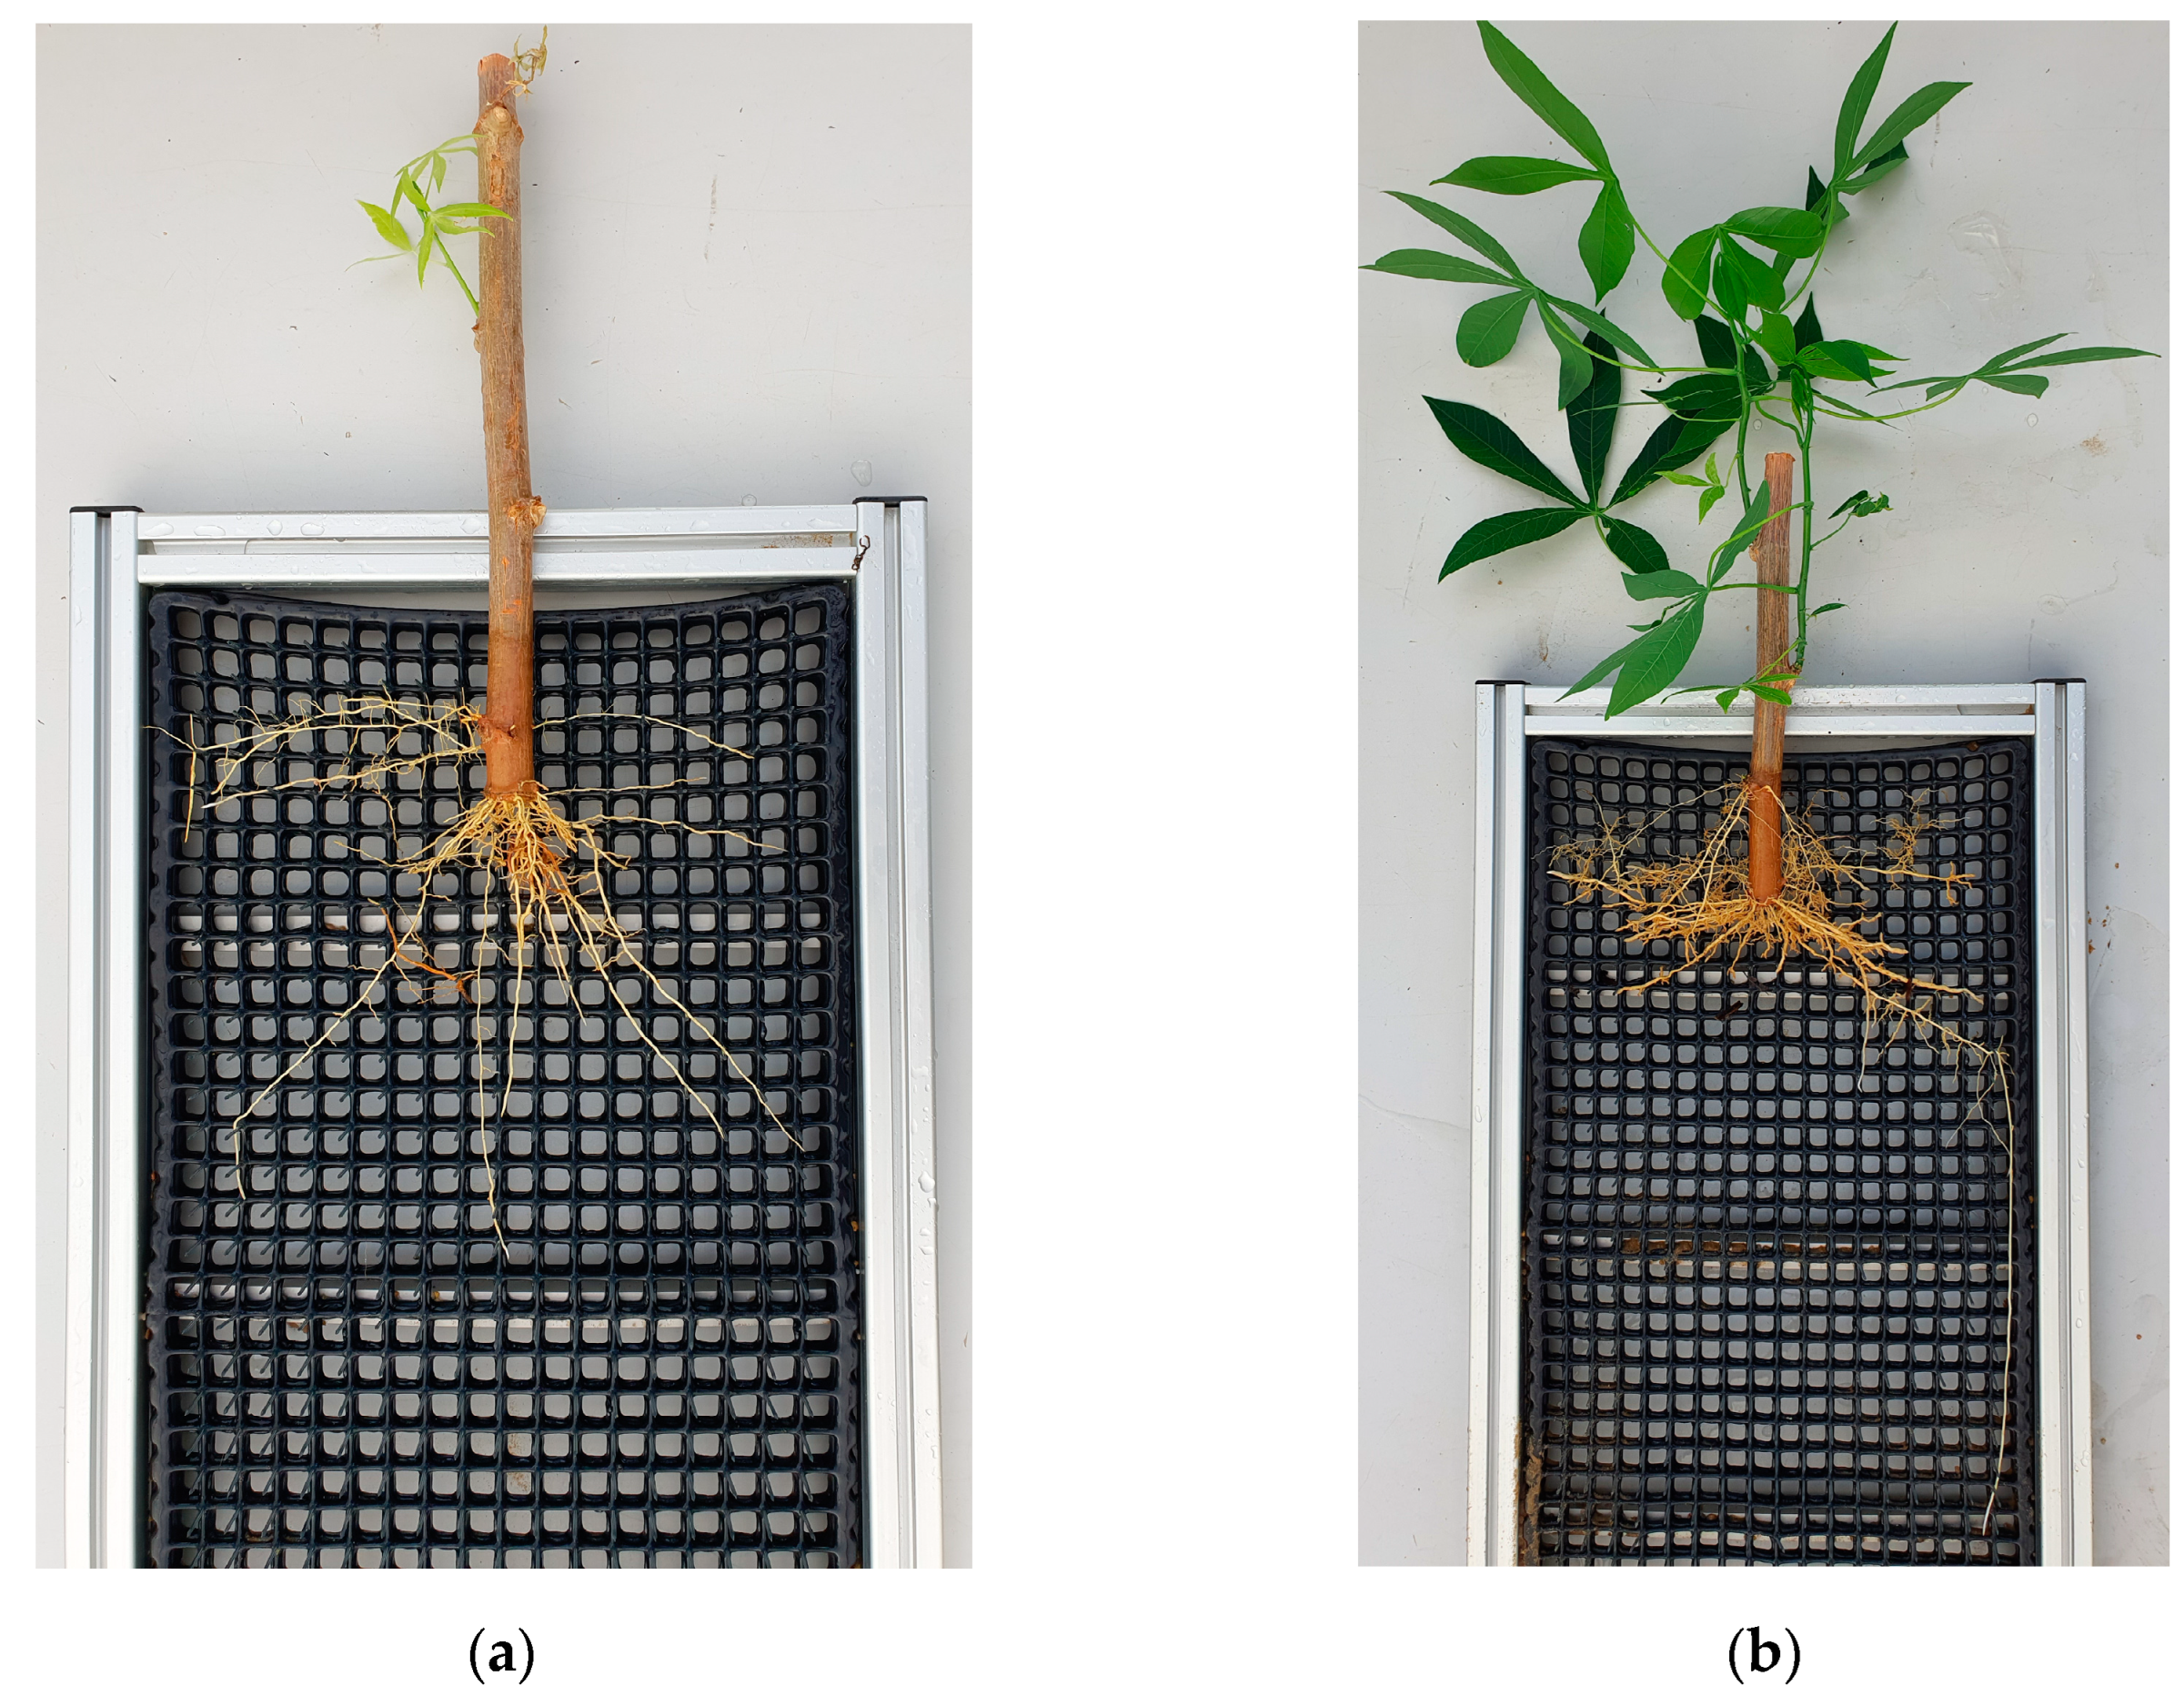
Figure B2.
Visual impressions of cassava root growth in the rizhotrons in relation to the growth time. After flushing away the substrate, the root-washing device guaranteed that the roots remained in place. Images were taken after (a) 58 days of growth without additional nutrient supplementation; and (b) 58 days of growth with additional nutrient supplementation.
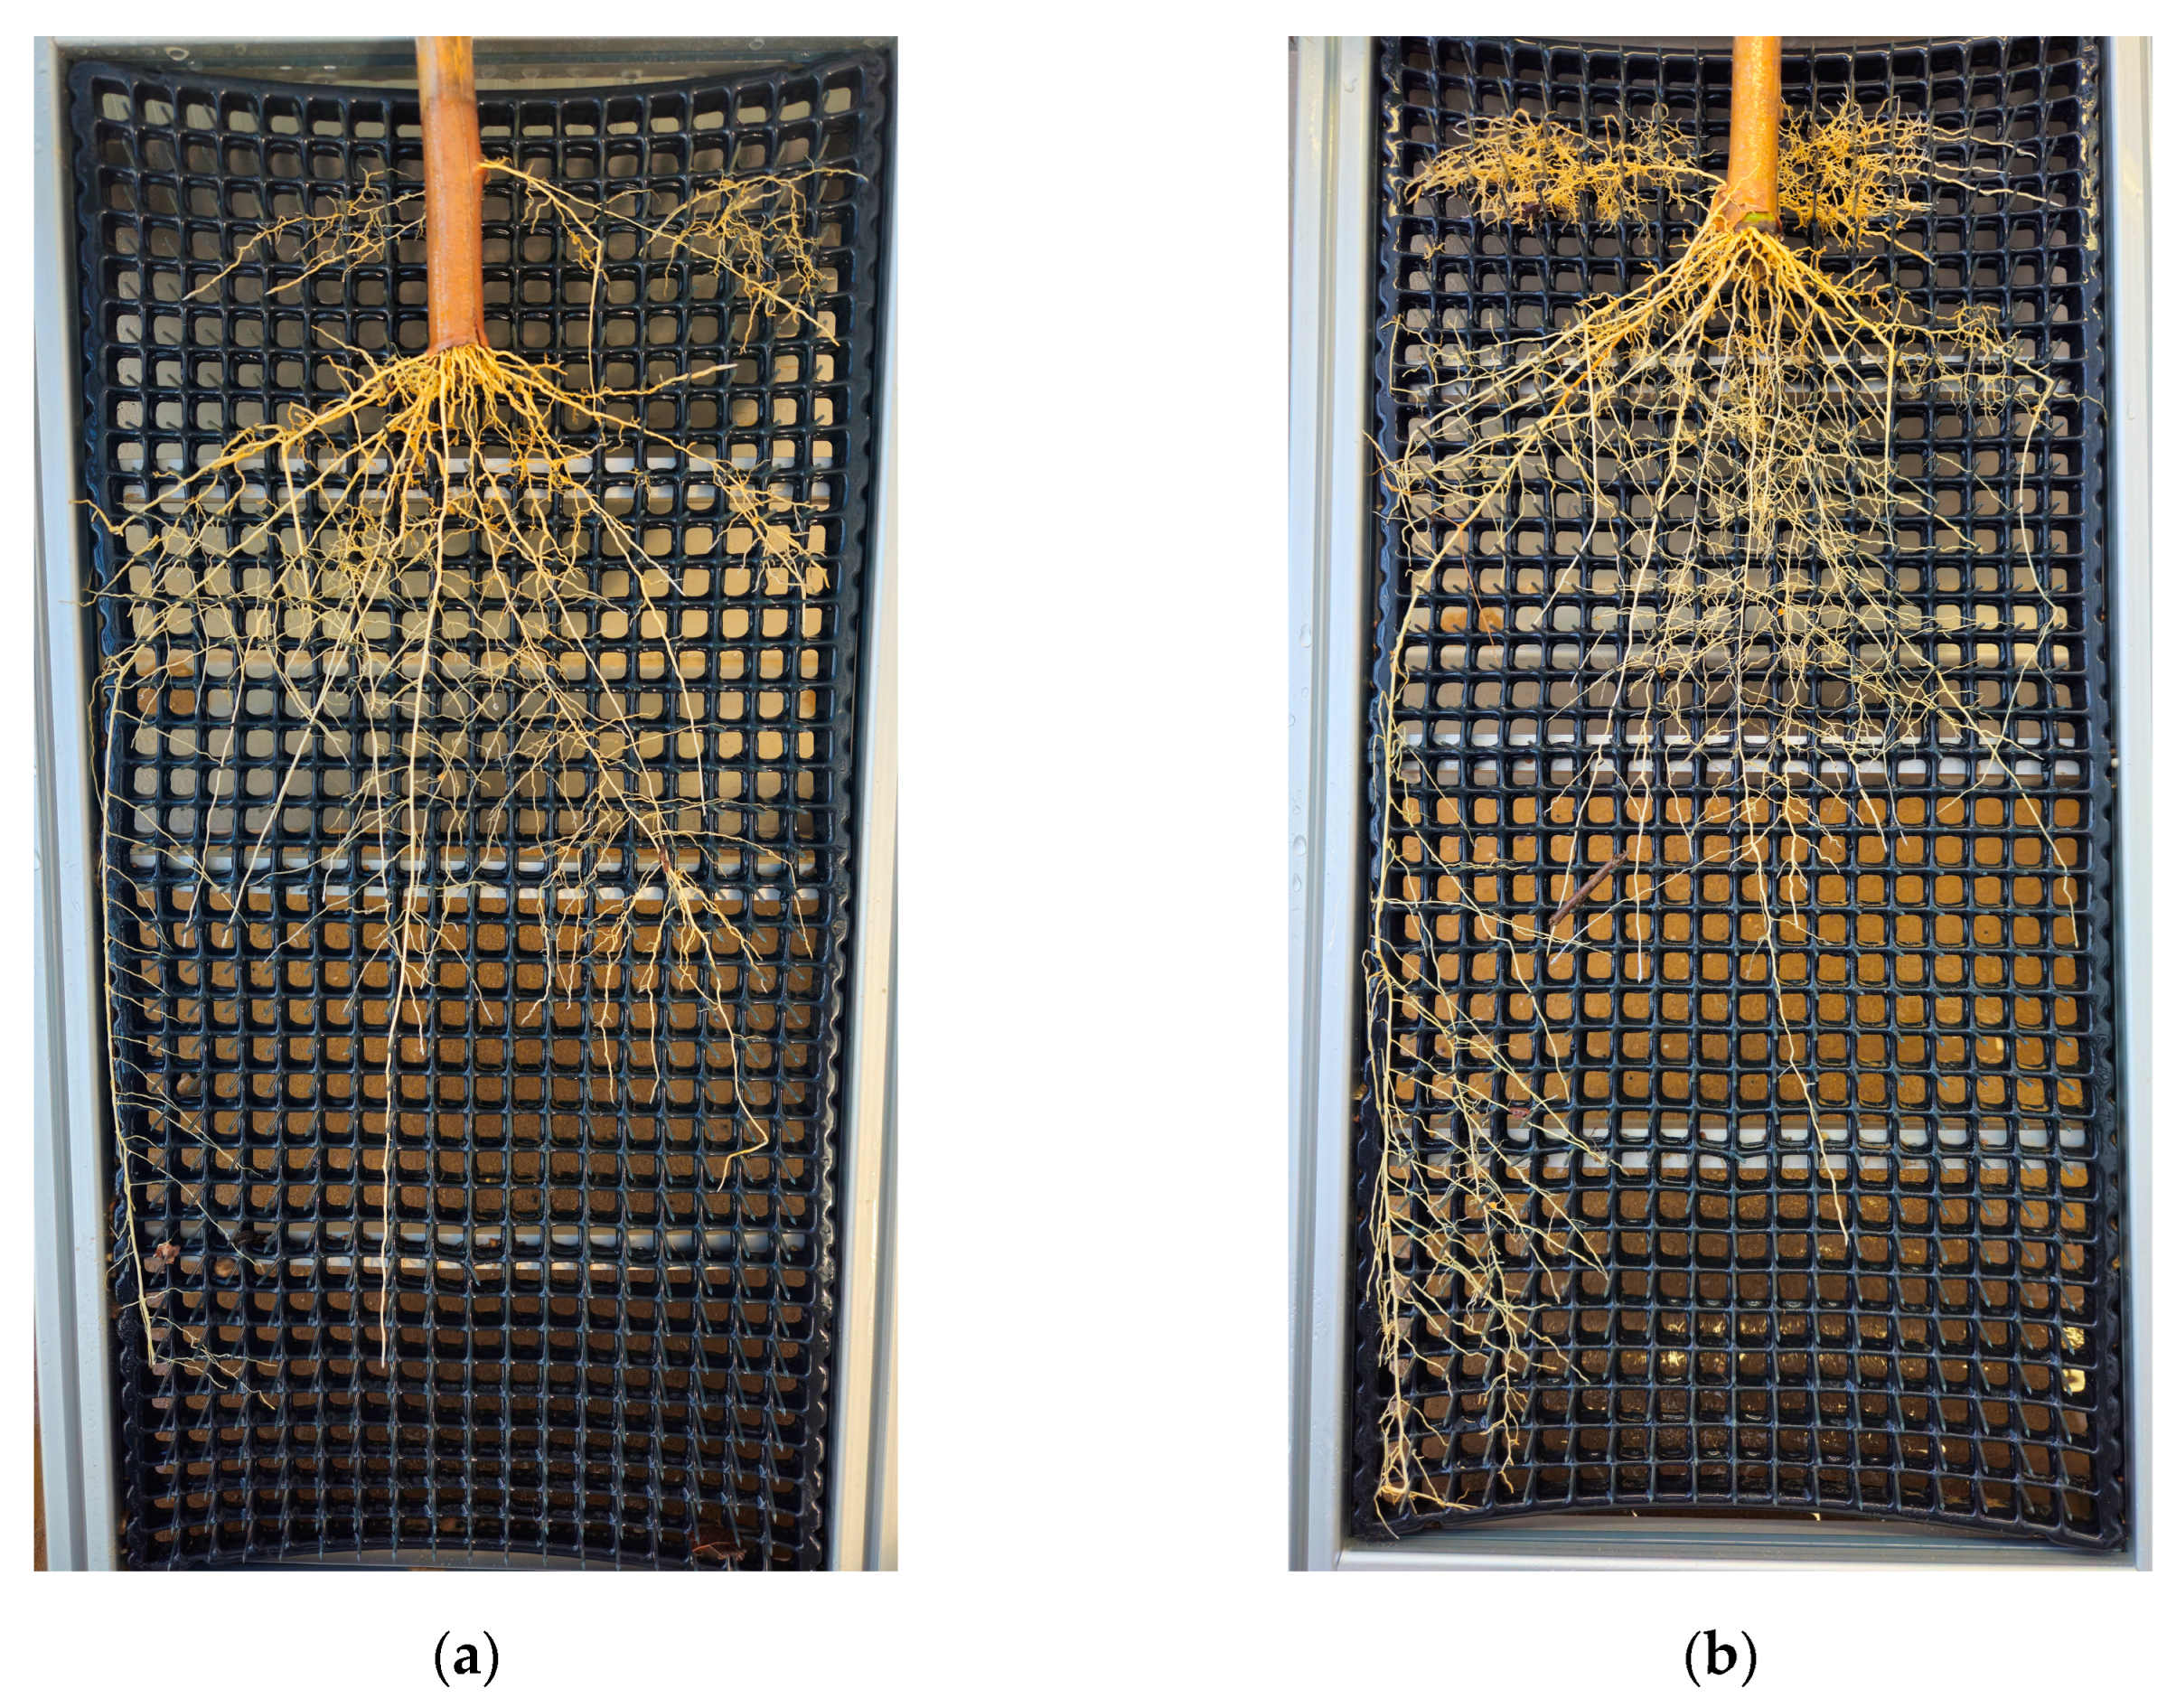
Figure B3.
Visual impressions of cassava root growth in the rizhotrons in relation to the growth time. After flushing away the substrate, the root-washing device guaranteed that the roots remained in place. Images were taken after (a) 62 and (b) 65 days of growth, both with additional nutrient supplementation.
References
- Drew, M.C. Comparison of the Effects of a Localized Supply of Phosphate, Nitrate, Ammonium and Potassium on the Growth of the Seminal Root System, and the Shoot, in Barley. New Phytol 1975, 75, 479–490. [Google Scholar] [CrossRef]
- van Vuuren, M.M.I.; Robinson, D.; Griffiths, B.S. Nutrient Inflow and Root Proliferation during the Exploitation of a Temporally and Spatially Discrete Source of Nitrogen in Soil. Plant Soil 1996, 178, 185–192. [Google Scholar] [CrossRef]
- Robinson, D.; Hodge, A.; Griffiths, B.S.; Fitter, A.H. Plant Root Proliferation in Nitrogen–Rich Patches Confers Competitive Advantage. Proceedings of the Royal Society of London. Series B: Biological Sciences 1999, 266, 431–435. [Google Scholar] [CrossRef]
- Zhu, Y.-H.; Weiner, J.; Li, F.-M. Root Proliferation in Response to Neighbouring Roots in Wheat (Triticum Aestivum). Basic and Applied Ecology 2019, 39, 10–14. [Google Scholar] [CrossRef]
- Schneider, H.M.; Lynch, J.P. Should Root Plasticity Be a Crop Breeding Target? Front. Plant Sci. 2020, 11. [Google Scholar] [CrossRef]
- Nkebiwe, P.M.; Weinmann, M.; Bar-Tal, A.; Müller, T. Fertilizer Placement to Improve Crop Nutrient Acquisition and Yield: A Review and Meta-Analysis. Field Crops Research 2016, 196, 389–401. [Google Scholar] [CrossRef]
- Chen, Y.L.; Dunbabin, V.M.; Postma, J.A.; Diggle, A.J.; Siddique, K.H.M.; Rengel, Z. Modelling Root Plasticity and Response of Narrow-Leafed Lupin to Heterogeneous Phosphorus Supply. Plant Soil 2013, 372, 319–337. [Google Scholar] [CrossRef]
- Robinson, D. Root Proliferation, Nitrate Inflow and Their Carbon Costs during Nitrogen Capture by Competing Plants in Patchy Soil. Plant and Soil 2001, 232, 41–50. [Google Scholar] [CrossRef]
- Gleeson, S.K.; Fry, J.E. Root Proliferation and Marginal Patch Value. Oikos 1997, 79, 387–393. [Google Scholar] [CrossRef]
- Croft, S.A.; Hodge, A.; Pitchford, J.W. Optimal Root Proliferation Strategies: The Roles of Nutrient Heterogeneity, Competition and Mycorrhizal Networks. Plant Soil 2012, 351, 191–206. [Google Scholar] [CrossRef]
- Borges, R.; Baika, L.M.; Grassi, M.T.; Wypych, F. Mechanochemical Conversion of Chrysotile/K2HPO4 Mixtures into Potential Sustainable and Environmentally Friendly Slow-Release Fertilizers. Journal of Environmental Management 2018, 206, 962–970. [Google Scholar] [CrossRef] [PubMed]
- Hertzberger, A.J.; Cusick, R.D.; Margenot, A.J. A Review and Meta-Analysis of the Agricultural Potential of Struvite as a Phosphorus Fertilizer. Soil Science Society of America Journal 2020, 84, 653–671. [Google Scholar] [CrossRef]
- Robles-Aguilar, A.A.; Pang, J.; Postma, J.A.; Schrey, S.D.; Lambers, H.; Jablonowski, N.D. The Effect of pH on Morphological and Physiological Root Traits of Lupinus Angustifolius Treated with Struvite as a Recycled Phosphorus Source. Plant and soil 2019, 434, 65–78. [Google Scholar] [CrossRef]
- Fathima, A.A.; Sanitha, M.; Tripathi, L.; Muiruri, S. Cassava (Manihot Esculenta) Dual Use for Food and Bioenergy: A Review. Food and Energy Security 2023, 12, e380. [Google Scholar] [CrossRef]
- Connor, D.J.; Cock, J.H.; Parra, G.E. Response of Cassava to Water Shortage I. Growth and Yield. Field Crops Research 1981, 4, 181–200. [Google Scholar] [CrossRef]
- Adiele, J.G.; Schut, A.G.T.; van den Beuken, R.P.M.; Ezui, K.S.; Pypers, P.; Ano, A.O.; Egesi, C.N.; Giller, K.E. A Recalibrated and Tested LINTUL-Cassava Simulation Model Provides Insight into the High Yield Potential of Cassava under Rainfed Conditions. European Journal of Agronomy 2021, 124, 126242. [Google Scholar] [CrossRef]
- El-Sharkawy, M.A.; Cock, J.H. Response of Cassava to Water Stress. Plant Soil 1987, 100, 345–360. [Google Scholar] [CrossRef]
- Lal, R.; Maurya, P.R. Root Growth of Some Tropical Crops in Uniform Columns. Plant Soil 1982, 68, 193–206. [Google Scholar] [CrossRef]
- Biratu, G.K.; Elias, E.; Ntawuruhunga, P. Does the Application of Mineral and Organic Fertilizer Affect Cassava Tuber Quality? An Evidence from Zambia. Journal of Agriculture and Food Research 2022, 9, 100339. [Google Scholar] [CrossRef]
- Birindwa, D.; Van Laere, J.; Munyahali, W.; De Bauw, P.; Dercon, G.; Kintche, K.; Merckx, R. Early Planting of Cassava Enhanced the Response of Improved Cultivars to Potassium Fertilization in South Kivu, Democratic Republic of Congo. Field Crops Research 2023, 296, 108903. [Google Scholar] [CrossRef]
- Imakumbili, M.L.E.; Semu, E.; Semoka, J.M.R.; Abass, A.; Mkamilo, G. Managing Cassava Growth on Nutrient Poor Soils under Different Water Stress Conditions. Heliyon 2021, 7. [Google Scholar] [CrossRef]
- Punyasu, N.; Thaiprasit, J.; Kalapanulak, S.; Saithong, T.; Postma, J.A. Modeling Cassava Root System Architecture and the Underlying Dynamics in Shoot–Root Carbon Allocation during the Early Storage Root Bulking Stage. Plant Soil 2024. [Google Scholar] [CrossRef]
- Thanni, B.; Merckx, R.; Hauser, S.; Soretire, A.; Honnay, O. Multiple Taxa Inoculants of Arbuscular Mycorrhizal Fungi Enhanced Colonization Frequency, Biomass Production, and Water Use Efficiency of Cassava (Manihot Esculenta). Int Microbiol 2024, 27, 1219–1230. [Google Scholar] [CrossRef] [PubMed]
- Nabel, M.; Schrey, S.D.; Poorter, H.; Koller, R.; Nagel, K.A.; Temperton, V.M.; Dietrich, C.C.; Briese, C.; Jablonowski, N.D. Coming Late for Dinner: Localized Digestate Depot Fertilization for Extensive Cultivation of Marginal Soil With Sida Hermaphrodita. Front. Plant Sci. 2018, 9. [Google Scholar] [CrossRef] [PubMed]
- Valle, S.F.; Giroto, A.S.; Guimarães, G.G.F.; Nagel, K.A.; Galinski, A.; Cohnen, J.; Jablonowski, N.D.; Ribeiro, C. Co-Fertilization of Sulfur and Struvite-Phosphorus in a Slow-Release Fertilizer Improves Soybean Cultivation. Front. Plant Sci. 2022, 13. [Google Scholar] [CrossRef] [PubMed]
- Koyama, T.; Murakami, S.; Karasawa, T.; Ejiri, M.; Shiono, K. Complete Root Specimen of Plants Grown in Soil-Filled Root Box: Sampling, Measuring, and Staining Method. Plant Methods 2021, 17, 97. [Google Scholar] [CrossRef]
- van der Bom, F.J.T.; Williams, A.; Borrell, A.K.; Raymond, N.; Bell, M.J. Phosphorus Management Is Key to Effective Deployment of Root Ideotypes in Complex Soil Environments. Plant Soil 2023, 489, 323–340. [Google Scholar] [CrossRef]
- Nagel, K.A.; Putz, A.; Gilmer, F.; Heinz, K.; Fischbach, A.; Pfeifer, J.; Faget, M.; Blossfeld, S.; Ernst, M.; Dimaki, C.; et al. GROWSCREEN-Rhizo Is a Novel Phenotyping Robot Enabling Simultaneous Measurements of Root and Shoot Growth for Plants Grown in Soil-Filled Rhizotrons. Funct. Plant Biol. 2012, 39, 891–904. [Google Scholar] [CrossRef] [PubMed]
- Freschet, G.T.; Pagès, L.; Iversen, C.M.; Comas, L.H.; Rewald, B.; Roumet, C.; Klimešová, J.; Zadworny, M.; Poorter, H.; Postma, J.A.; et al. A Starting Guide to Root Ecology: Strengthening Ecological Concepts and Standardising Root Classification, Sampling, Processing and Trait Measurements. New Phytologist 2021, 232, 973–1122. [Google Scholar] [CrossRef] [PubMed]
- Rech, I.; Withers, P.J.A.; Jones, D.L.; Pavinato, P.S. Solubility, Diffusion and Crop Uptake of Phosphorus in Three Different Struvites. Sustainability 2019, 11, 134. [Google Scholar] [CrossRef]
- Talboys, P.J.; Heppell, J.; Roose, T.; Healey, J.R.; Jones, D.L.; Withers, P.J.A. Struvite: A Slow-Release Fertiliser for Sustainable Phosphorus Management? Plant Soil 2016, 401, 109–123. [Google Scholar] [CrossRef]
- Yesigat, A.; Worku, A.; Mekonnen, A.; Bae, W.; Feyisa, G.L.; Gatew, S.; Han, J.-L.; Liu, W.; Wang, A.; Guadie, A. Phosphorus Recovery as K-Struvite from a Waste Stream: A Review of Influencing Factors, Advantages, Disadvantages and Challenges. Environmental Research 2022, 214, 114086. [Google Scholar] [CrossRef]
- Mahakosee, S.; Jogloy, S.; Vorasoot, N.; Theerakulpisut, P.; Holbrook, C.C.; Kvien, C.K.; Banterng, P. Light Interception and Radiation Use Efficiency of Cassava under Irrigated and Rainfed Conditions and Seasonal Variations. Agriculture 2022, 12, 725. [Google Scholar] [CrossRef]
- Lopez, G.; Ahmadi, S.H.; Amelung, W.; Athmann, M.; Ewert, F.; Gaiser, T.; Gocke, M.I.; Kautz, T.; Postma, J.; Rachmilevitch, S.; et al. Nutrient Deficiency Effects on Root Architecture and Root-to-Shoot Ratio in Arable Crops. Front. Plant Sci. 2023, 13, 1067498. [Google Scholar] [CrossRef] [PubMed]
- Körner, C.; Renhardt, U. Dry Matter Partitioning and Root Length/Leaf Area Ratios in Herbaceous Perennial Plants with Diverse Altitudinal Distribution. Oecologia 1987, 74, 411–418. [Google Scholar] [CrossRef]
- Weissengruber, L.; Möller, K.; Puschenreiter, M.; Friedel, J.K. Long-Term Soil Accumulation of Potentially Toxic Elements and Selected Organic Pollutants through Application of Recycled Phosphorus Fertilizers for Organic Farming Conditions. Nutr Cycl Agroecosyst 2018, 110, 427–449. [Google Scholar] [CrossRef]
- Wollmann, I.; Gauro, A.; Müller, T.; Möller, K. Phosphorus Bioavailability of Sewage Sludge-Based Recycled Fertilizers. Journal of Plant Nutrition and Soil Science 2018, 181, 158–166. [Google Scholar] [CrossRef]
|
Disclaimer/Publisher’s Note: The statements, opinions and data contained in all publications are solely those of the individual author(s) and contributor(s) and not of MDPI and/or the editor(s). MDPI and/or the editor(s) disclaim responsibility for any injury to people or property resulting from any ideas, methods, instructions or products referred to in the content. |
© 2025 by the authors. Licensee MDPI, Basel, Switzerland. This article is an open access article distributed under the terms and conditions of the Creative Commons Attribution (CC BY) license (https://creativecommons.org/licenses/by/4.0/).