Preprint
Article

This version is not peer-reviewed.

Electrochemical Method for the Assay of Organic Peroxides Directly in Acetonitrile

A peer-reviewed article of this preprint also exists.

Submitted:

16 December 2024

Posted:

18 December 2024

You are already at the latest version

Abstract

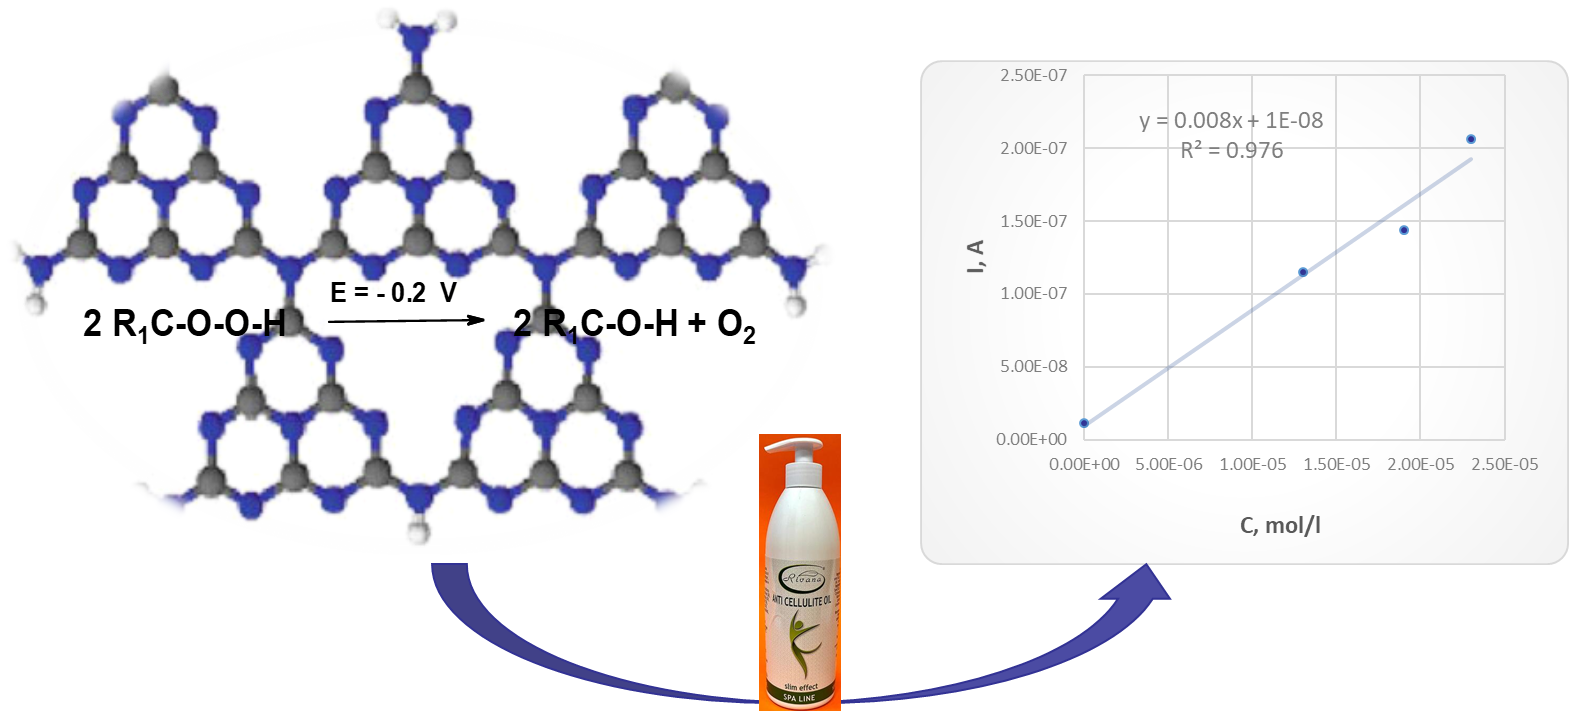
Lipid peroxidation is a major process that determines the quality of various oil samples during their use and storage, in which the primary products are hydroperoxides (HP’S). HP’S are very stable compounds at ambient conditions and are harmful to human health. Therefore, the eval-uation of the degree of oil oxidation is an excellent tool for ensuring food safety. Тhe peroxide value (PV) is the main parameter for quality control of oils. Herein, we propose an alternative electrochemical method to the most widely used classical iodometric titration for determining the PV. Our approach is based on the electrochemical quantification of hydroperoxides/peroxides in an organic solvent medium (acetonitrile and organic ammonium salt) using a composite electro-catalyst-glassy carbon electrode modified with 2D-nanomaterial graphitic carbon nitride doped with Co3O4. Calibration was made by standard addition method using benzoyl peroxide (BPO) as a model peroxide compound, dissolved in chloroform and added to fresh Rivana brand an-ti-cellulite oil used as a model oil sample. Calibration plots showed a linear response and very good reproducibility of the analytical result (R2˃0.99). Further, in term of accuracy, the method showed good results, since the BPO quantitative analysis was close to the theoretical response. In addition, the accuracy of the electrochemical method was compared with that of the standard iodometric titration method for determining the PV of vegetable fats (according to Bulgarian State Standard, BSS EN ISO 3960:2017). Finally, using the electrochemical method, the concentration of peroxides was determined in a real sample - an anti-cellulite oil of the trademark Rivana with an expired shelf life.

Keywords: 
;  ;  ;  ;  

1. Introduction

Organic peroxides are considered very harmful compounds because when they come into contact with bodily tissues such as the gastrointestinal tract, epidermis or mucous membranes, they tend to form free radicals responsible for the development of severe health problems such as chronic inflammation, ulcers or proliferating tumors. Therefore, the precise control of peroxides content in commercial products containing lipids - pharmaceutical, cosmetic or food products - is of key importance [1]. The generation of organic peroxides ex vivo is due to the processes of lipid peroxidation of oils, which are often also components of drugs, cosmetics or foods, as they are oxidized in the air in the presence of daylight [2]. This process of autooxidation is a free radical chain reaction and takes place in three steps- initiation, propagation and termination. The primary products of this process are hydroperoxides, which are relatively stable at room temperature and can be used to estimate the degree of lipid oxidation of oil samples [3]. The main indicator of primary oxidation processes in oils and for the amount of peroxides in oil-containing samples is the peroxide value (PV). The amount of peroxides indirectly serves to determine the degree of rancidity of the oils due to their autooxidation [4].
Тhere are different methods for quantitative determination of PV like instrumental and titrimetric approaches. Various rapid, selective and accurate instrumental techniques have been developed for estimating PV in oil samples, such as: spectroscopic, chromatographic and electrochemical methods [5]. The most widely used technique for quantification of PV is based on infrared radiation. Fourier transform infrared spectroscopy (FTIR) has attracted increasing interest in the last few years as it is non-destructive and requires minimal sample preparation [6]. FTIR is an excellent tool for the determination of peroxides in various oils, because the intensity of the bands in the infrared spectrum is directly proportional to the concentration of peroxides in the sample [7]. The powerful combination of FTIR and chemometric methods is often used for estimation of olive oil freshness and oil oxidation, as well as for monitoring of the fatty acid content in virgin olive oil [8,9,10]. Determination of PV by FTIR uses different methodologies such as near-infrared spectroscopy region (4000-1200 cm-1) and FTIR with Attenuated Total Reflection (ATR) equipment [11]. Direct quantification of peroxides in oil samples by FTIR in NIR is difficult due to low sensitivity and complex calibration using multivariate approach. However, FTIR with an ATR mode gives accurate results with a low signal-to-noise ratio, requires small sample volume and is excellent tool for viscous oil samples analyses [11]. Whereas the FTIR-ATR method may not be suitable for very viscous oils because high viscosity can lead to difficulties in obtaining a reproducible sample thickness, which can affect the accuracy of the measurements [12]. In addition, one of the main disadvantages of FTIR-ATR approach is its low sensitivity. This drawback can be overcame using multispectral identification methods, which are increasingly used in food analysis, e.g. the combination of FTIR and Raman spectroscopy [13]. FTIR spectra are generated by molecular vibrations and rotational frequencies, while Raman spectra are а result from molecular scattering, which is inelastic scattering of incident IR light from the sample [17–19]. Thus, multispectral FTIR-Raman identification technique could provide rich information about the content of oil samples, but the problem with overlapping of analyte bands with those of other substances in the sample cannot be ignored. Therefore, it is necessary to combine FTIR and Raman spectroscopy with chemometric methods [16].
Among the instrumental techniques, UV-Vis spectroscopic approaches are widely used for determining PV in edible oils. These approaches are frequently based on the oxidation of Fe (II) to Fe (III) by hydroperoxides in acidic medium, which then reacts with different reagents, resulting in color complexes such as Fe(III)- thiocyanate and Fe(III)- xylenol orange, absorbing light in the visible region of the electromagnetic spectrum [14]. These methods are simple and low cost, but their accuracy is easily affected by the content of carotenoids in oils. Hence, it is necessary to extract carotenoids from the solution containing Fe(III)-thiocyanate or Fe(III)- xylenol orange complexes using organic solvents before PV determination [15,16].
Fluorescence and chemiluminescence are emerging spectroscopic techniques for qualitative and quantitative determination of organic peroxides in oil samples due to their high sensitivity, rapidness and robust information content [5]. In addition, fluorescence spectroscopy (FS) has significant advantages in terms of wide dynamic range, selective detection and non-destructiveness. However, several shortcomings of FS limit its practical applications, such as specific sample preparation through extraction or derivatization аnd the need for specific excitation sources [17]. In contrast, in the chemiluminescense method, no external light source for excication is used, which simplifies the instrumentation. Additionally, sample preparation in chemiluminescense spectroscopy (CS) is not so complex and this technique allows real time monitoring of changes in peroxide levels during reactions. The main drawback of CS is the need to carry out specific chemical reactions that produce light, which also limits the application of the method to different oil samples.
More recent research has focused on applying 1H nuclear magnetic resonance (NMR) spectroscopy for PV determination in edible oils, because of its simplicity and time efficiency [5]. The chemical specificity of the NMR spectrum is the major advantage of this technique over other spectroscopic methods [17] as the NMR (1H) spectra of fatty acids and their derivatives can be fully assigned [18,19,20]. However, all currently available instruments based on the NMR technique use expensive high-field super-conducting magnets, as well as probes requiring cryogenic cooling and specially trained personnel to operate the instrument. Hence, none of the above mentioned spectroscopy-based instrumental methods seems to be a suitable candidate for routine and low-cost analysis in industrial settings [17].
Among the methods for PV determining of oil samples, chromatographic techniques such as gas (GC) and high pressure liquid chromatography (HPLC) are characterized by a number of advantages- excellent selectivity, low LOD’s, wide detection range and less sample consumption [21]. However, some major shortcomings limit the practical applications of chromatographic techniques for real-time oil oxidation monitoring such as expensive instruments, complex and time-consuming sample preparation before GC and HPLC, the high cost for analysis of a single sample, as well as long expensive work and complex data processing after HPLC [22].
Аll considered instrumental techniques are accurate, rapid and sensitive, but require relatively expensive instrumentation and highly trained personnel.
The most frequently used method in laboratory practice in Bulgaria for PV determination is the conventional method of iodometric titration in a mixed aqueous-non-aqueous medium. This approach is widely applied as a classical analytical method due to its simplified operation and low-hardware requirements [23]. The method is based on the reaction between peroxides in sample with KI resulting in the formation of molecular iodine, which is titrated using sodium thiosulfate solution. Starch is used as an indicator, which changes the color of the solution from colorless to blue-violet in the presence of iodine released from the sample. When titrating the water sample with sodium thiosulphate, the sample is discolored when the equivalence point is reached \BSS EN ISO 3960-2017\. Although, the titrimetric method is simple, low-cost and routine, several shortcomings restrict its application, such as the need for special sample preparation (dissolving oil samples in organic toxic solvents - trichloromethane, toluene and ether, extraction, and titration in mixed medium), the process is affected by a number of factors such as the nature of the reagents, temperature, extraction time, etc. In the titration of crude oils, the equivalence point is difficult to distinguish because of the dark color of the oil samples [23,24]. Оther disadvantages are the high LODs and narrow detection range [23].
Recently, electrochemical techniques belonging to the group of instrumental approaches, have attracted increasing interest due to a number of advantages such as simplicity, low-cost, high sensitivity, selectivity and portability [25,26,27,28,29]. А relatively new electrochemical method for PV determination in edible oils is based on a change in electrical conductivity in an aqueous medium during a reaction between KI and hydroperoxides in the oil sample [6]. This approach has high reproducibility, but its accuracy is low. In the pursuit of in situ monitoring of lipid oxidation and miniaturization of the instrumentation, electrochemical portable sensors like electronic nose (E-nose) and electronic tongue (E-tongue) have been developed. The latter represent simple, rapid, inexpensive and highly efficient portable miniaturized devices for lipid oxidation monitoring [30]. The E-nose method was used to study the flavor qualities of oils, while the E-tongue approach was applied to monitor the PV of olive oil during storage [31,32,33]. However, such portable miniature devices are still in the early stages of research. Further research is needed on their long-term storage stability and biocompatibility [23].
In the recent decades, there has been an intensive development of electrode modification techniques for various applications, such as solar energy conversion and storage [34], selective electroorganic synthesis [35], molecular electronics [36], electrochromic display devices [37], protection from corrosion [38] and electroanalysis [39]. The rapid development of experimental chemistry and the desire of scientists to develop fast and accurate methods for the determination of the oils oxidation extent, led to the idea of emerging materials such as 2D disulfides of transition metals, metal-organic frameworks, covalent organic frameworks, halide perovskites, etc., to be introduced into the basis of various analytical techniques, including in the modification of electrode surfaces [40].
After the discovery of monolayer graphene in 2004 [41], 2D carbon-based nanomaterials have attracted the attention of many researchers in various fields ranging from electronics to biomedicine [42]. Their unique catalytic properties and high surface-to-volume ratio make them suitable for a wide range of applications, such as environmental catalysis [43], drug delivery carriers [44], sensing and energy applications [45]. Often, carbon-based nanomaterials are combined with other materials, resulting in nanocomposites that significantly improve the sensitivity and selectivity of modified surfaces, as a result of the synergistic effect between them. 2D nanomaterials provide features such as increased electroactive surface area, additional catalytic centers, and tunable structure [46]. It was found that the addition of nitrogen atoms is the most effective approach to improve the electrocatalytic activity of carbon materials [47]. Carbon nitride-based compounds with a high N-to-C ratio are new generation materials that are used to develop electrocatalysts [48]. Graphitic carbon nitride (g-C3N4) is a non-metallic, graphene-like 2D material composed of covalent bonds (C-N), forming a π-conjugated polymer with a high molecular weight and unique electronic structure determining its semiconductor properties [49]. g-C3N4 is a multifunctional, heterogeneous, non-metallic catalyst [50], the main drawback of which is its low specific surface area. A known approach to increase the specific surface area of g-C3N4 is its doping with transition metal oxides in the form of ultrafine dispersion, which distribute between g-C3N4 nanosheets and prevent their agglomeration [51,52]. Transition metal oxides (TMOs) possess good electrical and photocatalytic properties due to their size, shape and larger surface area [52].
An earlier study of our group demonstrated that a composite comprising Co3O4-g-C3N4 and Nafion used as a modifying phase of glassy carbon surfaces possesses excellent electrocatalytic activity in the reduction of water-soluble hydroperoxides [53]. Unfortunately, most naturally formed hydroperoxides are insoluble in water and their direct evaluation has to be performed under non-aqueous conditions. Therefore, the aim of this study is to explore the electrochemical activity of composite-modified glassy carbon electrode in acetonitrile with respect to water-insoluble peroxides and hydroperoxides and to develop on its basis a simple method with rapid response for the quantification of organic peroxides directly in a non-aqueous medium. In characterisation of the analytical performance of the discussed electrocatalytic method classical iodometric titration was used as a reference.

2. Results

2.1. Optimisation of the Operating Conditions
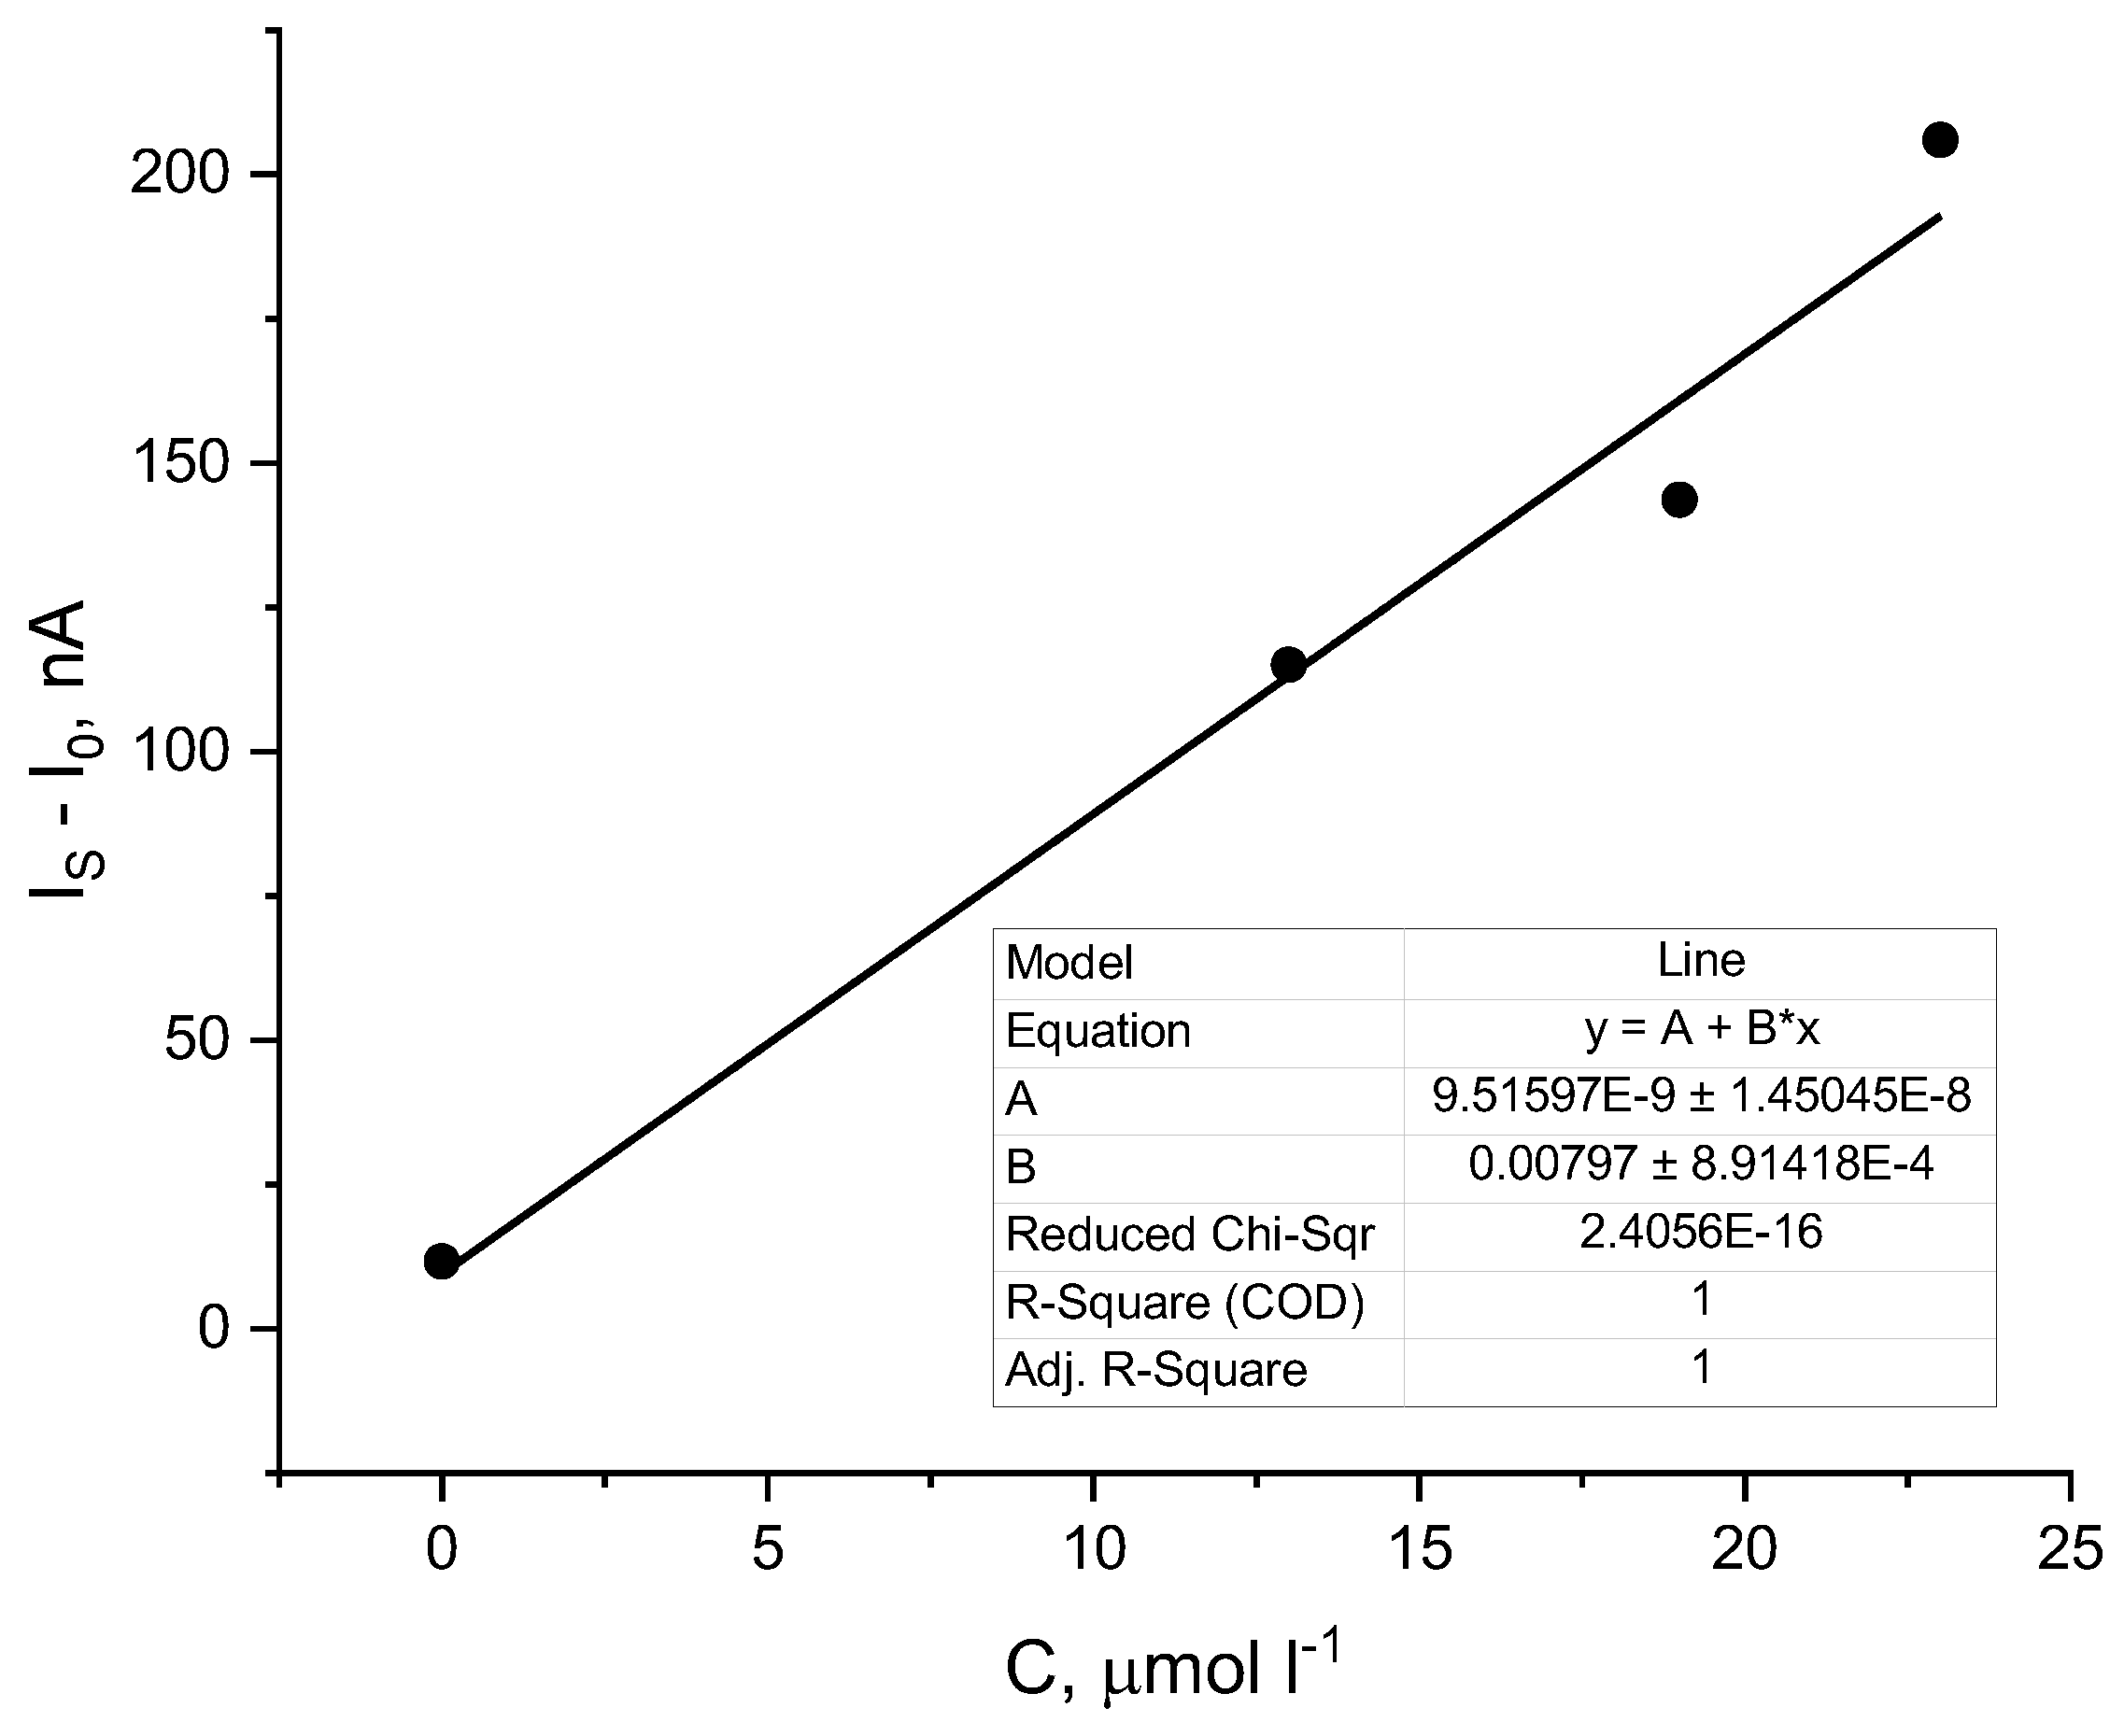
Electrochemical studies in a non-aqueous medium have a number of limitations such as: low conductivity, limited solubility of electrolyte salts, high noise and the impossibility of using conventional reference electrodes, however, non-aqueous electrochemistry allows the redox properties of a number of insoluble in water organic compounds to be studied. Keeping this in mind, our further electrochemical studies were performed in the aprotic organic solvent acetonitrile containing 0.1 M of the electrochemically inert electrolyte tetrabutyl ammonium perchlorate (TBAP) to increase the electrical conductivity of the medium.
The electrochemical behavior of the Co3O4 -doped g-C3N4/Nafion modified electrode (Co-g-C3N4/Naf) was investigated by cyclic voltammetry. Figure 1 compares the cyclic voltammograms (CVs) of the electrode - catalyst recorded in the absence and presence of benzoyl peroxide (BPO). This peroxide was chosen as a model analyte because it is non-hygroscopic solid and its solutions in organic solvents can be prepared with exact concentrations, and hence – to be used as analytical standards. The background CV – i.e. the voltammogram recorded in the absence of peroxides (black solid line) suggests that the catalytic layer possess catalytic activity towards oxygen, which is dissolved in the acetonitrile, as the I-E curve possesses an “oxygen tail” appearing over the potential region between -0.4 and -0.6 V vs. Ag|Ag+.
When portions of BPO standard solution are added to the electrolyte in the cell, an electrochemical reduction of the peroxide occurs (red, blue and purple solid lines). Upon scanning in the negative direction in BPO present, a reduction wave is observed, starting at a potential of 0.3 V (vs. Ag|Ag+ pseudo-reference electrode) and reaching a broad peak at -0.2 V, which upon further change of the potential passes into a second wave of reduction. As the concentration of the model peroxide increases, the reduction maximum gradually shifts to more negative potentials.
The polarization dependences suggest the possibility for quantification of the selected organic peroxide by means of chronoamperometry at a constant working potential of -0.2 V that can be done on the basis of a calibration plot. Chronoamperometric experiments performed at a constant potential of -0.2 V (vs. Ag|Ag+) showed a stepwise change in the reduction current upon addition of portions of peroxide, reaching steady-state values within 10 seconds (Figure 2, left). The calibration graph obtained on the basis of the chronoamperometric record shows a linear dependence of the signal versus the peroxide concentration up to 50 μM. It should be noted that at low concentrations (up to about 2 µM) a deviation from linearity is observed, which is probably due to the weak electrode signal over this concentration range, which in turn leads to considerable errors of the determination.
The calibration equation obtained from the linear regression analysis is:
I
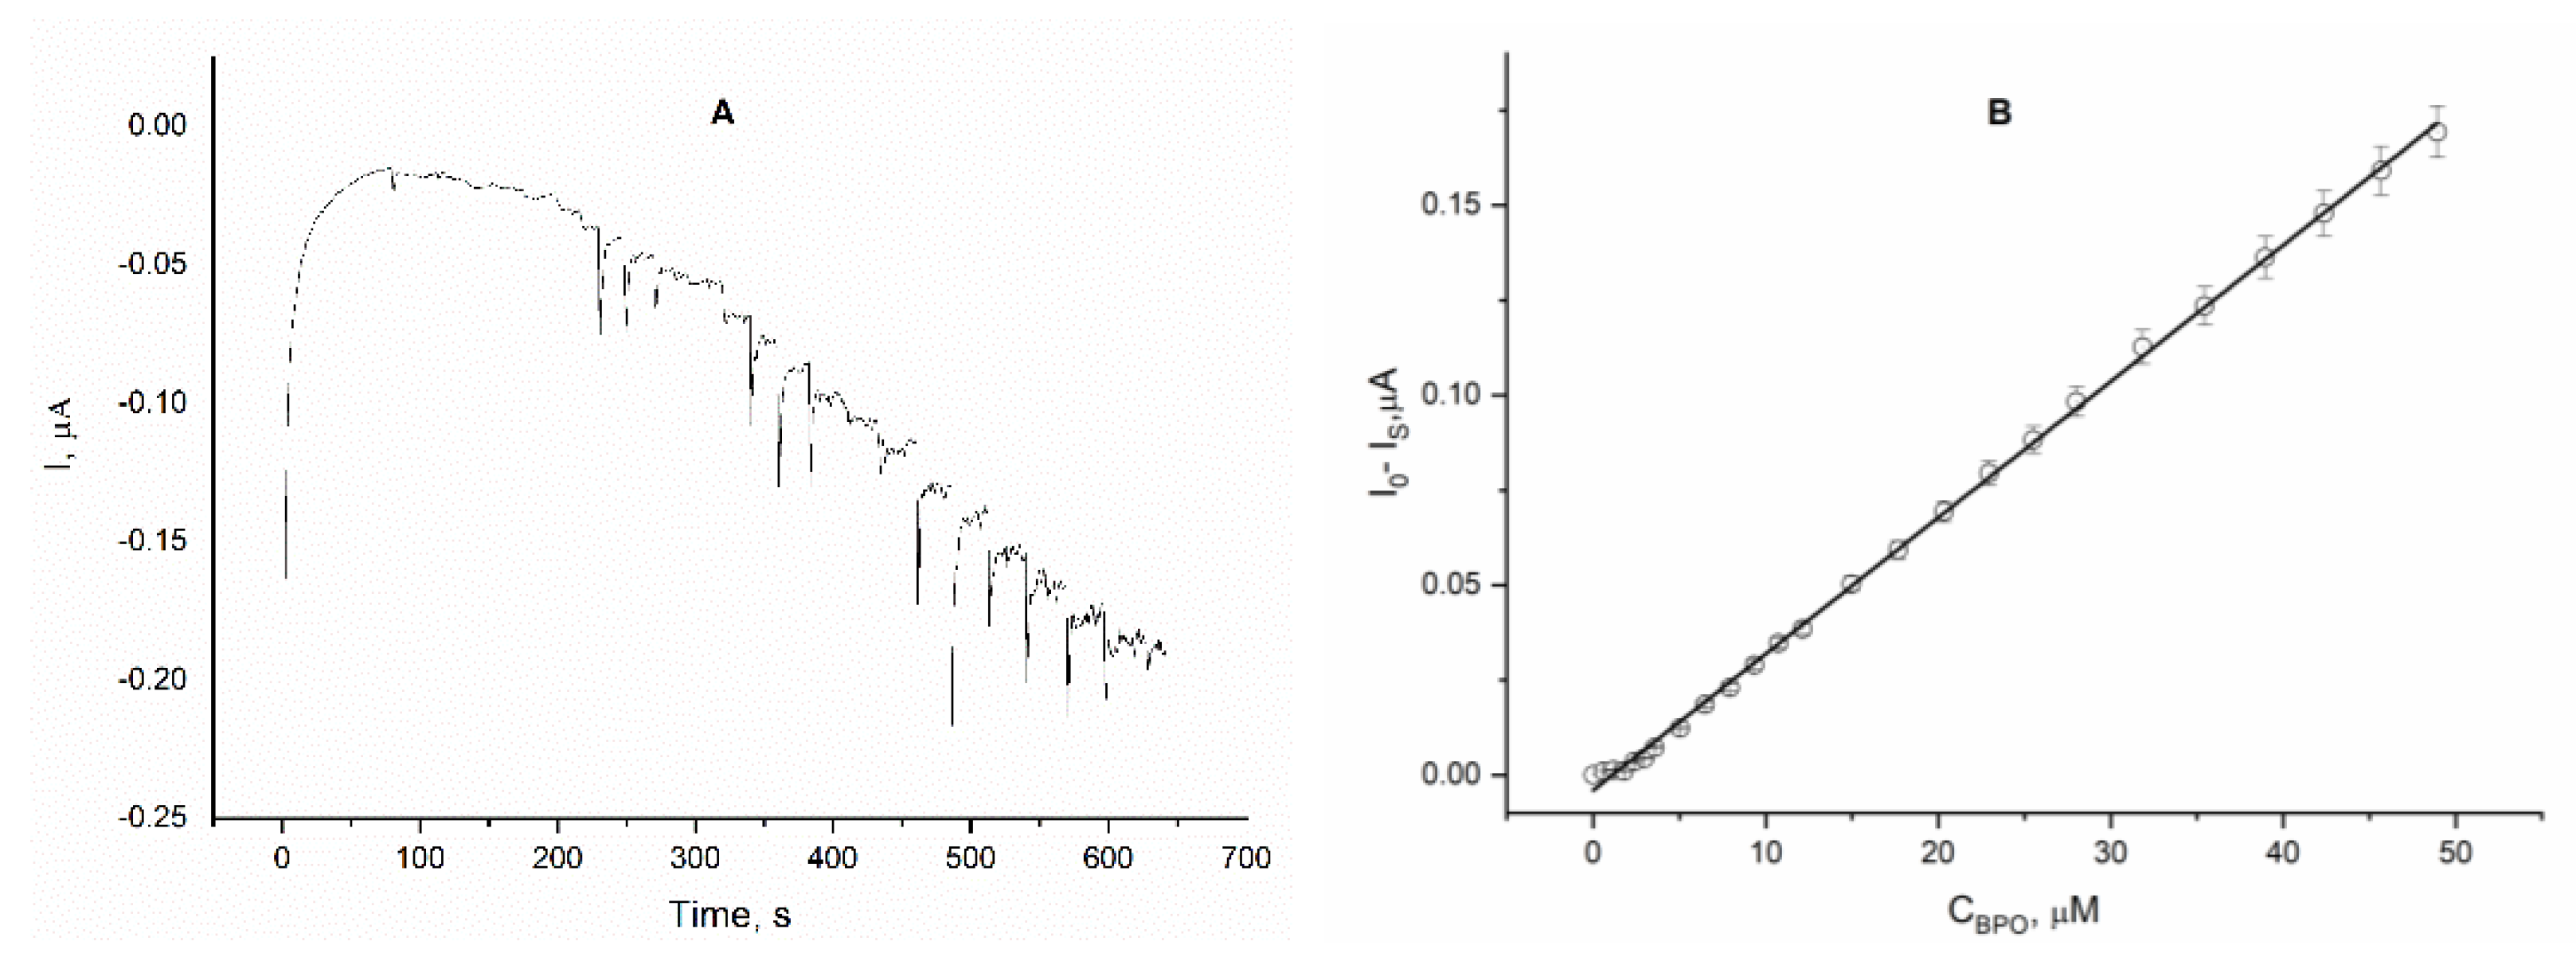
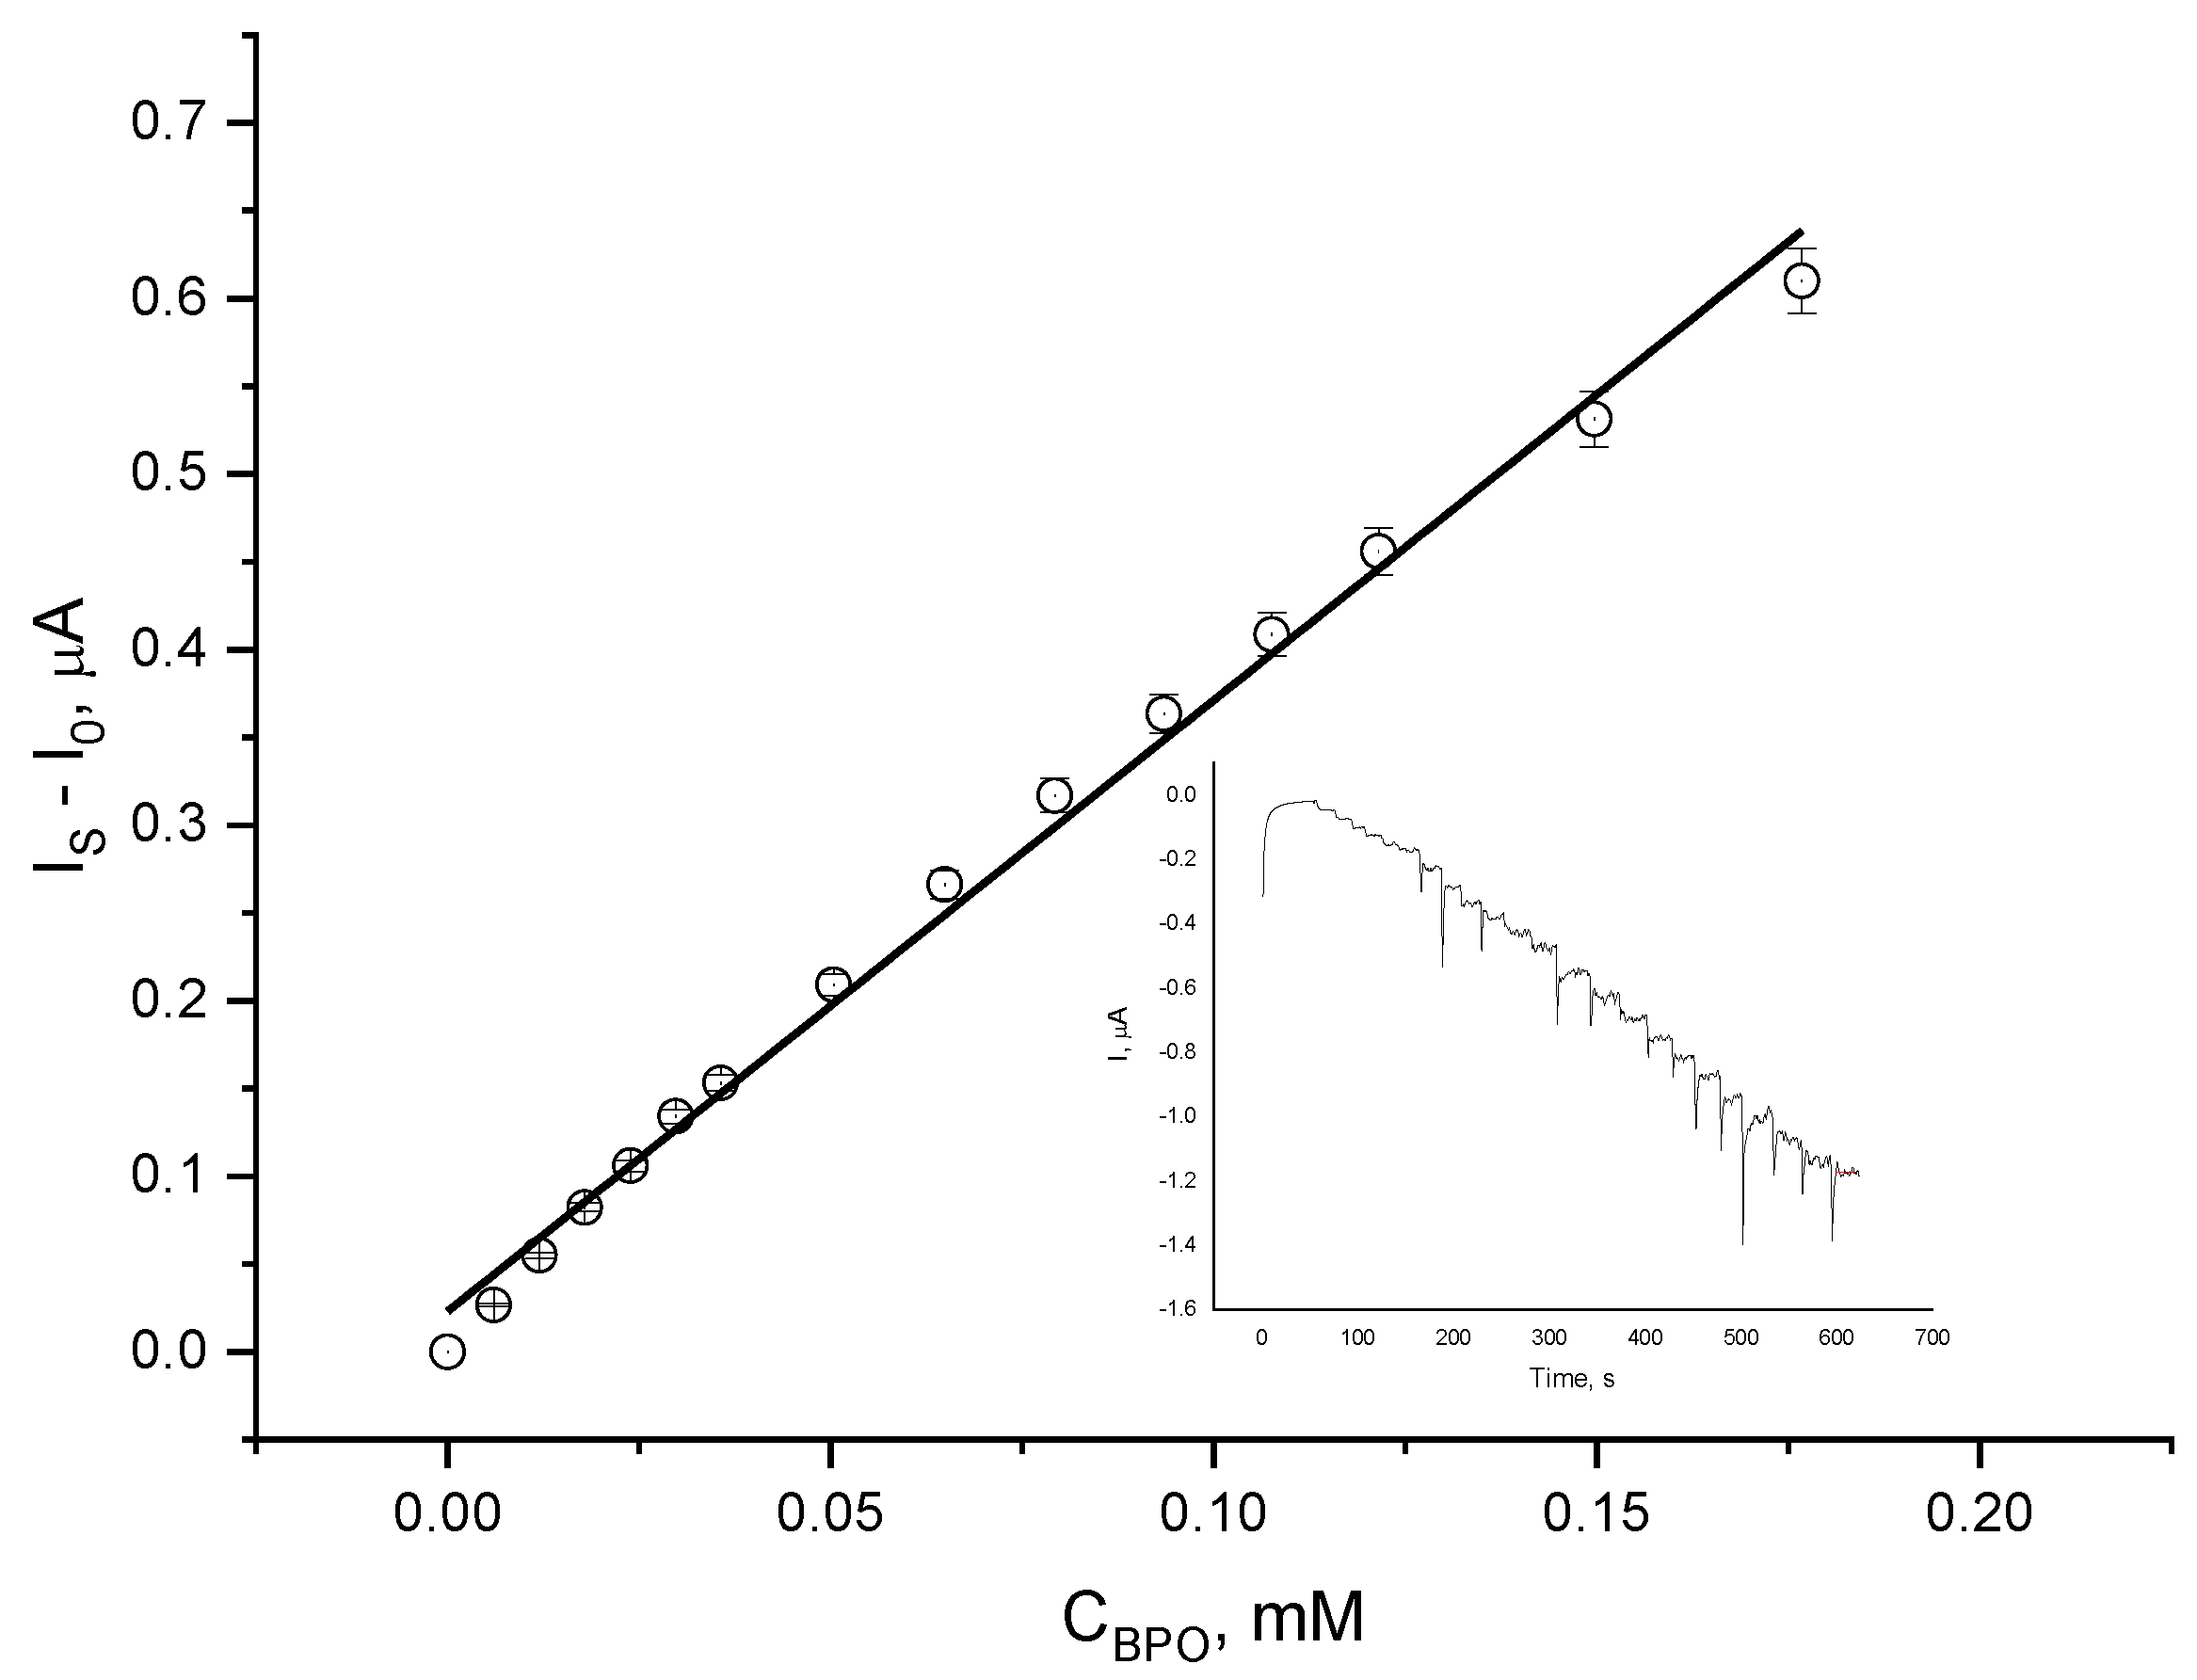
S – I 0 = (-3,962.10-9 ± 4,9483.10-10) + (3,59.10-3 ±2,12994.10-5) *C BPO
I
where: I S - steady state signal in the presence of the peroxide, µA;
I
0 – background current, µA;
C
BPO – concentration of BPO, µM.
Keeping in mind that the designed peroxide electrode is to be used for assaying peroxide value (PV) in vegetable oils, several other peroxides have been tested as possible standards for quantification of peroxides under non-aqueous medium by applying the same approach. In Figure 3 are depicted the cyclic voltammograms of the catalytic peroxide electrode in the absence and presence of varying concentrations of dilauroyl peroxide – a solid aliphatic peroxide compound. The CVs recorded manifest similar behavior as observed under equivalent conditions in the presence of BPO as a model peroxide. However, the electrochemical reduction of the aliphatic peroxide compound took place with much lower rate at the chosen operating potential of –0.2 V, which indicates that the reduction proceeds with a considerable overpotential as compared with the electrochemical reduction of benzoyl peroxide. It is plausible, that the bulkier molecule of dilauroyl peroxide adsorbs stronger on the electrode surface thus blocking it to a great extent. These results indicate that the choice of BPO as a standard for calibration is reasonable and further studies were implemented using BPO standard solutions.
Furthermore, the catalytic peroxide electrode was used to determine the concentration of peroxides in a real sample – a mixture of vegetable and essential oils with expired shelflife (anti-cellulite massage oil Rivana, Bulgaria). For this purpose, the electrochemical behavior of the electrode - catalyst upon addition of anti-cellulite oil dissolved in chloroform (CHCl3) was investigated by cyclic voltammetry run over the range of potentials from -0.6 to 0.6 V (vs. Ag|Ag+). Addition of aliquots of the real sample solution to the working medium resulted in a pronounced reduction wave (visible in the reverse scan) starting at a potential of 0.18 V and reaching a plateau between -0.2 V and -0.4 V (Figure 4). The presence of this reduction wave gave us a reason to further explore the opportunity to determining the amount of organic peroxides in the real sample by means of chronoamperometry at constant potential.
Chronoamperometric measurements were performed (Figure 5, inset) at a constant potential of -0.2V (vs. Ag|Ag+) while adding aliquots of the standard peroxide (BPO) solution to the operating medium. The calibration plot shows a linear dependence of the electrode response versus BPO concentration (correlation coefficient of 0.993). To account for the effect of the real sample constituents, the standard 3 mM BPO solution was dissolved in chloroform to which 0.4 g of fresh non-peroxidized oil was added.

2.2. Analytical Performance of the Catalytic Peroxide Electrode

In order to evaluate the accuracy of the electrochemical method for the determination of PV, calibration standard solutions of BPO as a model peroxide were prepared in an interval of low (1, 2, 3, 6, 10 μM) and high (50,100, 200, 300, 400 μM) peroxide concentrations. The signals of all standard solutions of BPO in CHCl3 were measured. For this purpose, 0.5 ml are taken from each standard solution and nearly 0.4 g of fresh anti-cellulite oil was dissolved in them. The results obtained (Figure 6) show a good agreement of the experimentally obtained values with the theoretically calculated ones, with high correlation coefficients (R² = 0.995 and R² = 0.994, respectively).
The slopes of the linear dependencies (1.255 and 1.059, respectively) indicate a deviation of the measured values from the expected ones with 25.5% for the low concentrations (from 0.5 to 5 μM) and 5.9% for the range from 25 to 200 μM. These results indicate that if the oil contains 2.0 mmol/kg peroxides, 2.51 mmol/kg will be detected in the low concentration range (˂ 5 µM). Similarly, if the oil contains 20 mmol/kg peroxides, 21.2 mmol/kg will be detected in the concentration range 25 -200 µM. On the other hand, the response is linear and shows good reproducibility (R2>0.99) of the analytical result.
Further, expected and measured μmol BPO levels were converted into expected and measured peroxide values (PVs), respectively, which are compared in Fig.7.
А similar positive deviation of the measured from the expected values for PV is observed, which for the low concentration interval is 25.3 %, and for the wide one is 8.7 %.
The accuracy of the electrochemical method in a wide concentration range was compared with that of the conventional titrimetric approach for the determination of PV. For this purpose, known amounts of the BPO spiked at different concentrations to fresh anti-cellulite oil was measured. Regardless of the concentration of BPO, the electrochemical response was linear and showed good reproducibility (R2>0.99). In contrast, the iodometric titration for all BPO amounts demonstrated significant deviations between measured and expected peroxide values (0.7795 was the line’s slope in the iodometric titration, in comparison with 1.0874 in the electrochemical method) (Figure 8) (Table 1). These results imply that if the oil sample contains 20 mmol/kg peroxides, 15.6 mmol/kg peroxides will be detected by iodometric titration and 21.7 mmol/kg peroxides – by electrochemical method. Probably, the low reproducibility of the titrimetric method compared to the electrochemical one is due to the extraction step of the sample pretreatment that is a part of the titrimetric method.
Finally, the peroxide value of the real sample containing a mixture of easily oxidizable vegetable oils was determined by the standard addition method. According to this method, the intercept of the calibration line corresponds to the signal of the real sample (Figure 9). Dividing this signal by the slope of the line, one obtains the concentration of peroxides in the electrochemical cell of 1.25.10-6 M. Taking into account the dilution and mass of the real sample, we get that the real sample contains 276 μmol of peroxides, which corresponds to PV = 739.75 ± 64,36 meq O2 kg-1. Therefore, the vegetable oils contained in the real sample are highly oxidized.

3. Discussion

The iodometric titration is an easy conventional way to determine the PV. However, this method is labor-intensive, time-consuming, requires a lot of reagents and large amounts of sample and organic solvents. In addition, its accuracy and reproducibility strongly depend on reaction conditions –e.g. light, temperature, skills of operator, sodium thiosulfate decomposition, etc. Furthermore, the iodine released in the organic phase can participate in side reactions such as oxidation by dissolved in the solution oxygen or interaction with unsaturated lipids. These interfering processes can lead to overestimation or underestimation of PV.
Unlike iodometric titration, the electrochemical method, developed by our research group, allows the analysis of lipid samples directly in acetonitrile. Its accuracy and reproducibility far exceed the ones of iodometric titration, and skipping the extraction step considerably shorten the sample preparation. Due to the simplicity of operating with electrical signals and the compact sizes of the equipment, the electrochemical method represents a good alternative of traditional instrumental analysis (e.g. by HPLC or FTIR) in the same time providing a simple, accurate, rapid, and reproducible analysis of PV with very small amounts of sample required. In addition to that, our electrochemical approach ensures high accuracy over a wide range of PV (from 1 to 540 meq kg-1). Hence, the analytical method developed on the basis of the catalytic peroxide electrode has a significant potential to be used as an alternative to most of the known methods for determining the peroxide values of in lipid-containing samples.

4. Materials and Methods

4.1. Materials

The following reagents and chemicals were used in the present studies: dibenzoyl peroxide, p.a., dilauroyl peroxide, p.a., dicumyl peroxide, p.a., di-tertbutylperoxide, p.a., (Acros Organics) used in the form of solutions with an initial concentration of 0,3 M or 3 mM in chloroform; Nafion™ 117, a 5% suspension in water-alcohol mixture (Sigma-Aldrich, MI, USA); ultrapure solvents acetonitrile (CH3CN) and chloroform (CHCl3) with specification p.a. (Fisher Chemical, ThermoFisher Scientific, USA); quaternary ammonium salt (tetrabutylammonium perchlorate - TBAP, Acros Organics).
Anti-cellulite oil from the Rivana brand (Bulgaria) was tested as a real sample. Both fresh and with expired shelf life products were used. The mixture contains: Vitis Vinifera Seed Oil, Citrus Paradisi Peel oil, Cimbopogon Schoenanthus Oil, Rosmarinus Officinalis Oil, Juniperus Communis Oil, Linalool, Limonene, Geraniol, Citral.
Electrode material: Commercially available glassy carbon materials were used as working electrodes. The electrodes are cylinders of chemically resistant polymers with a length of 6 cm and an outer diameter of 6 mm, in which an embedded cylinder of glassy carbon with a diameter d = 3 mm (visible surface area 0.071 cm2, manufactured by CHI, Austin, TX, USA) or with a diameter d = 2 mm (visible surface area 0.031 cm2, manufactured by Metrohm, Utrecht, The Netherlands). The glassy carbon material is connected to a metal current lead, which serves to connect it to the electrochemical apparatus.

4.2. Apparatus and Measurments

All electrochemical measurements were performed in a conventional three – electrode cell (working volume 20-100 ml, Metrohm-Autolab), with catalyst – modified disc of glassy carbon (GCE) as working electrode, a Ag|Ag+ reference electrode and a platinum foil as auxiliary electrode. An electrochemical workstation PGSTAT Autolab 302N (Metrohm, Switzerland) with Nova 2.1.6 software has been used in all experiments. Cyclic voltammograms (CVs) were recorded at a scan rate of 20 mV s-1. Chronoamperometric measurements were performed under constant stirring.

4.3. Synthesis of Co-Doped g-C3N4

The synthesis of the Co-doped g-C3N4 was carried out in one step method by thermal polycondensation on protonated melamine in the presence of cobalt salts, which further are thermally decomposed to a spinel cobalt oxide (Co3O4) [54]. To reach 5% of Co by weight in the final catalyst, a certain amount of Co (NO3)2·6H2O was dissolved in 50 cm3 of methanol and added to the protonated melamine, under continuous stirring at 50 deg. until evaporation of the МеOH. The obtained solid was dried at 60oC for 10 h and calcined at 550oC for 2 h.

4.4. Modification of Working Electrode

The modifying phase was prepared as described previously [53], in brief: 1 – 2 mg of graphitic carbon nitride, doped with tricobalt tetroxide (with a Co3O4 content of 5 wt.% to 8 wt.%) were added to 1 ml of an aqueous suspension of the ionomer NafionTM (with a concentration of 0.2%) and dispersed ultrasonically for 30 minutes. Then, a 5 µL drop of the resulting composite electrocatalyst is applied to the surface of the cleaned glassy carbon electrode and air-dried for 16 – 24 hours at room temperature.
The Co-g-C3N4/ Nafion catalytic electrode, can be used to perform analysis up to 10 times within 1 day and stored for one year or more. It is stored dried, after washing with ultrapure water, in air and at room temperature, capped with a plastic protector. Before use after long storage (more than 3 days), the catalytic electrode is reactivated by placing it in the electrolysis cell filled with background electrolyte (0.1 M tetrabutylammonium perchlorate dissolved in acetonitrile), connecting it in a three-electrode configuration together with reference and auxiliary electrodes to the electrochemical workstation and treating it by cyclic voltammetry over the potential range from -0.4 V to +0.6V for at least three cycles, after which it is calibrated twice according to the description (section 4.6.).The background electrolyte with a concentration of 0.1 M was prepared by dissolving tetrabutylammonium perchlorate in acetonitrile.

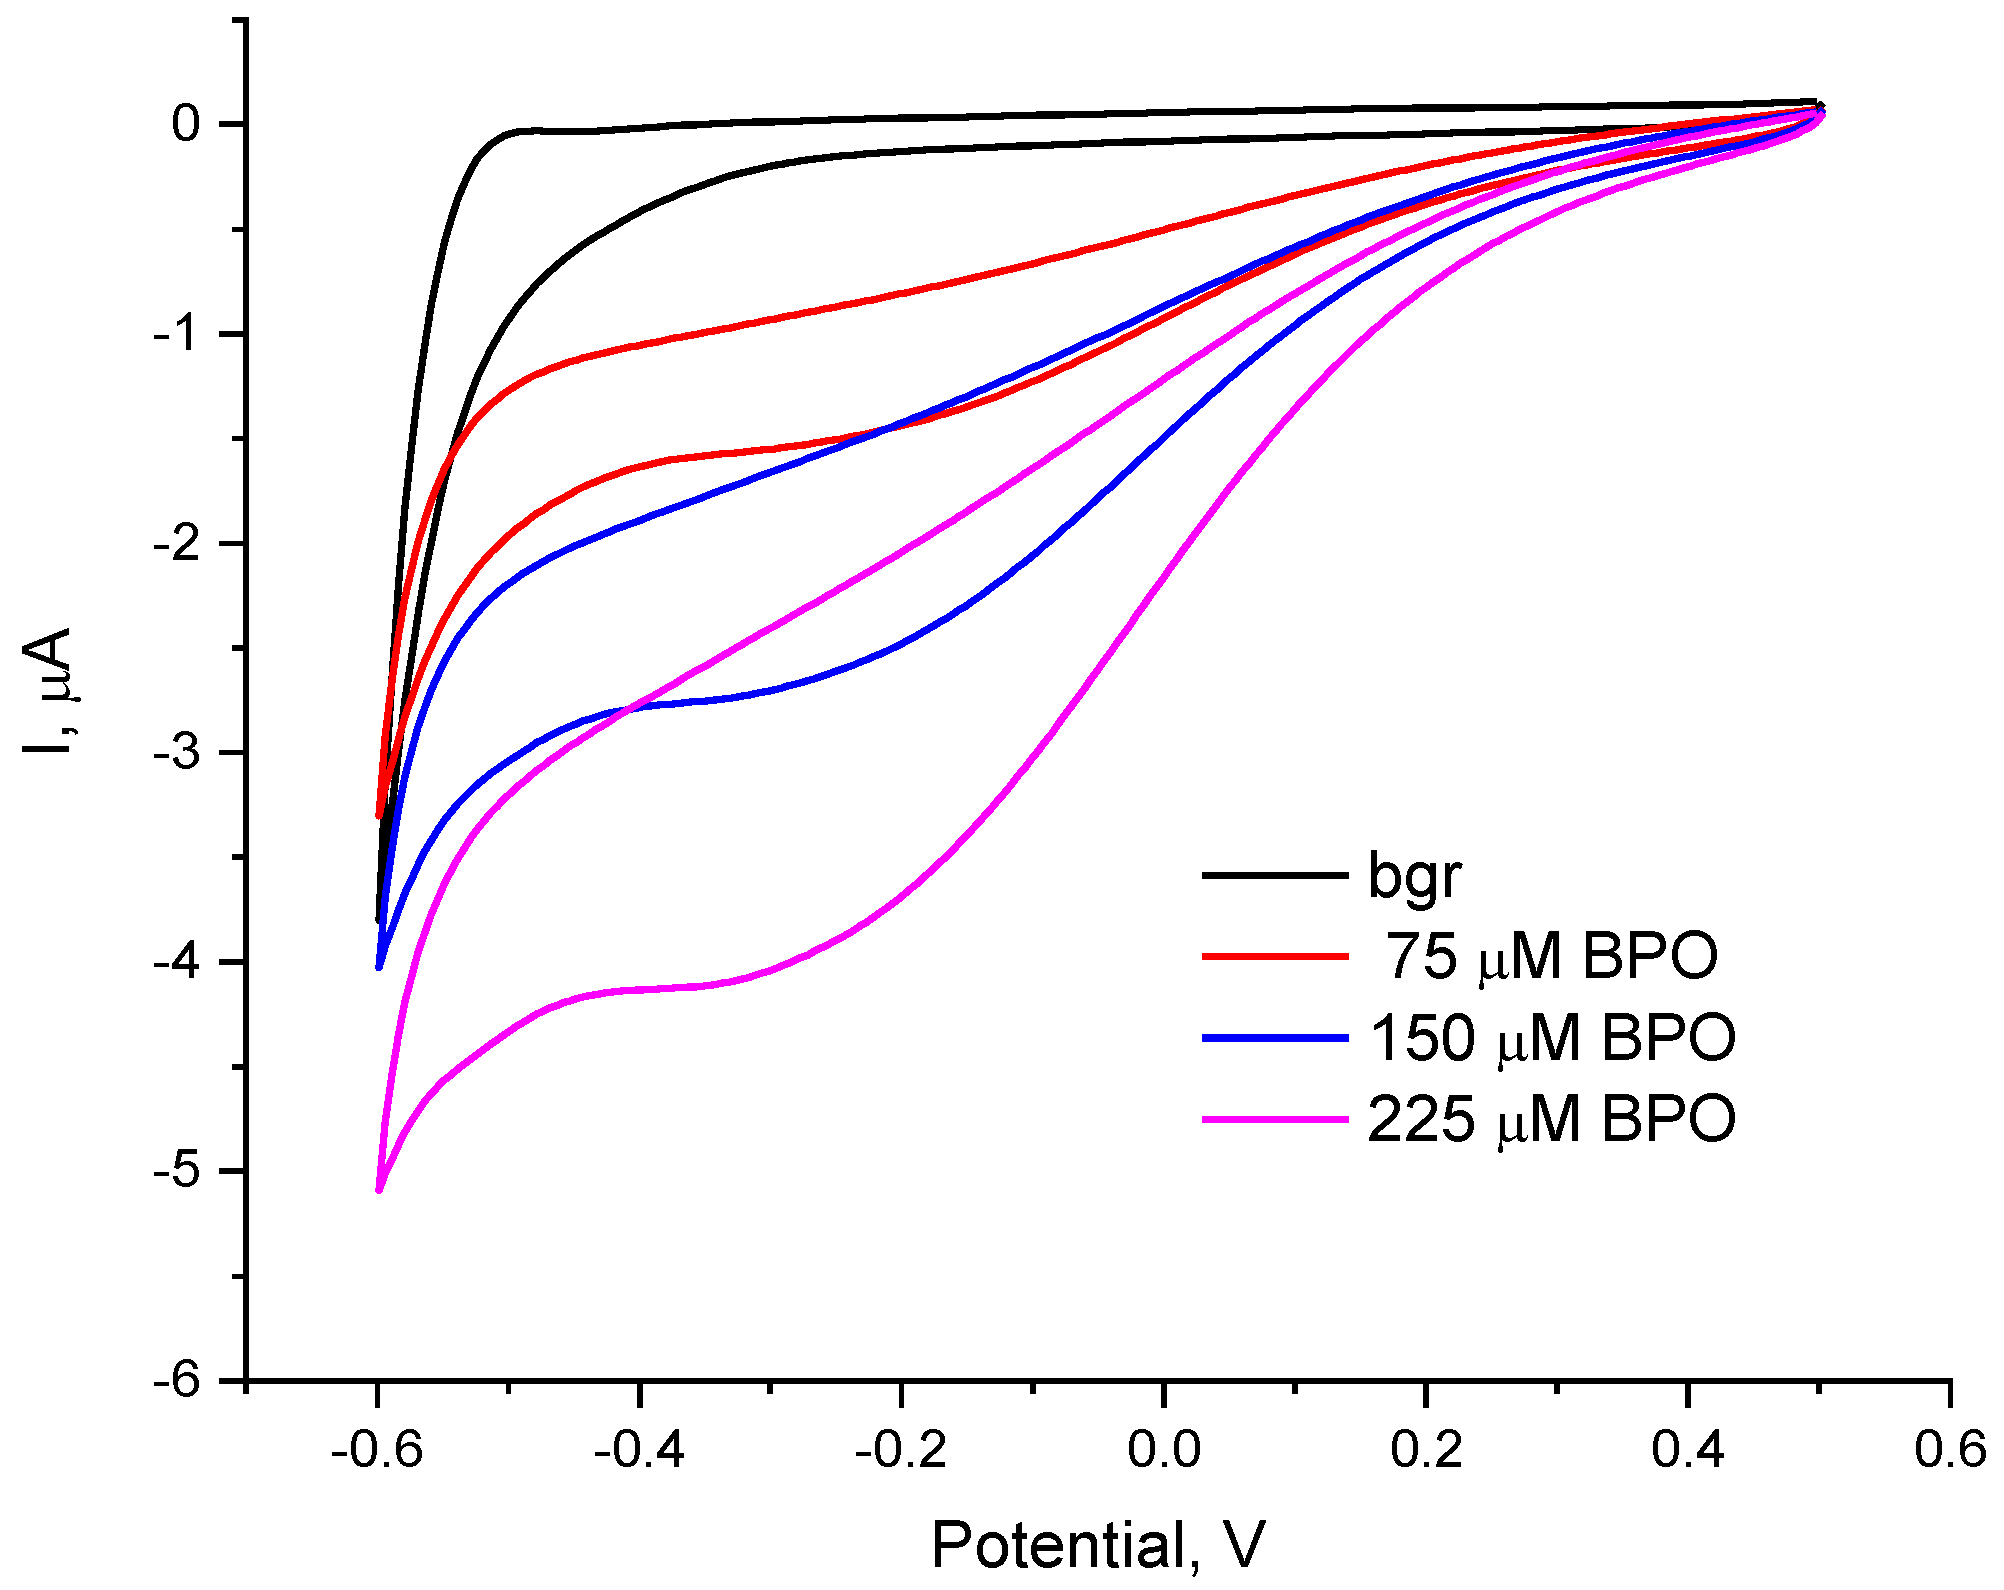
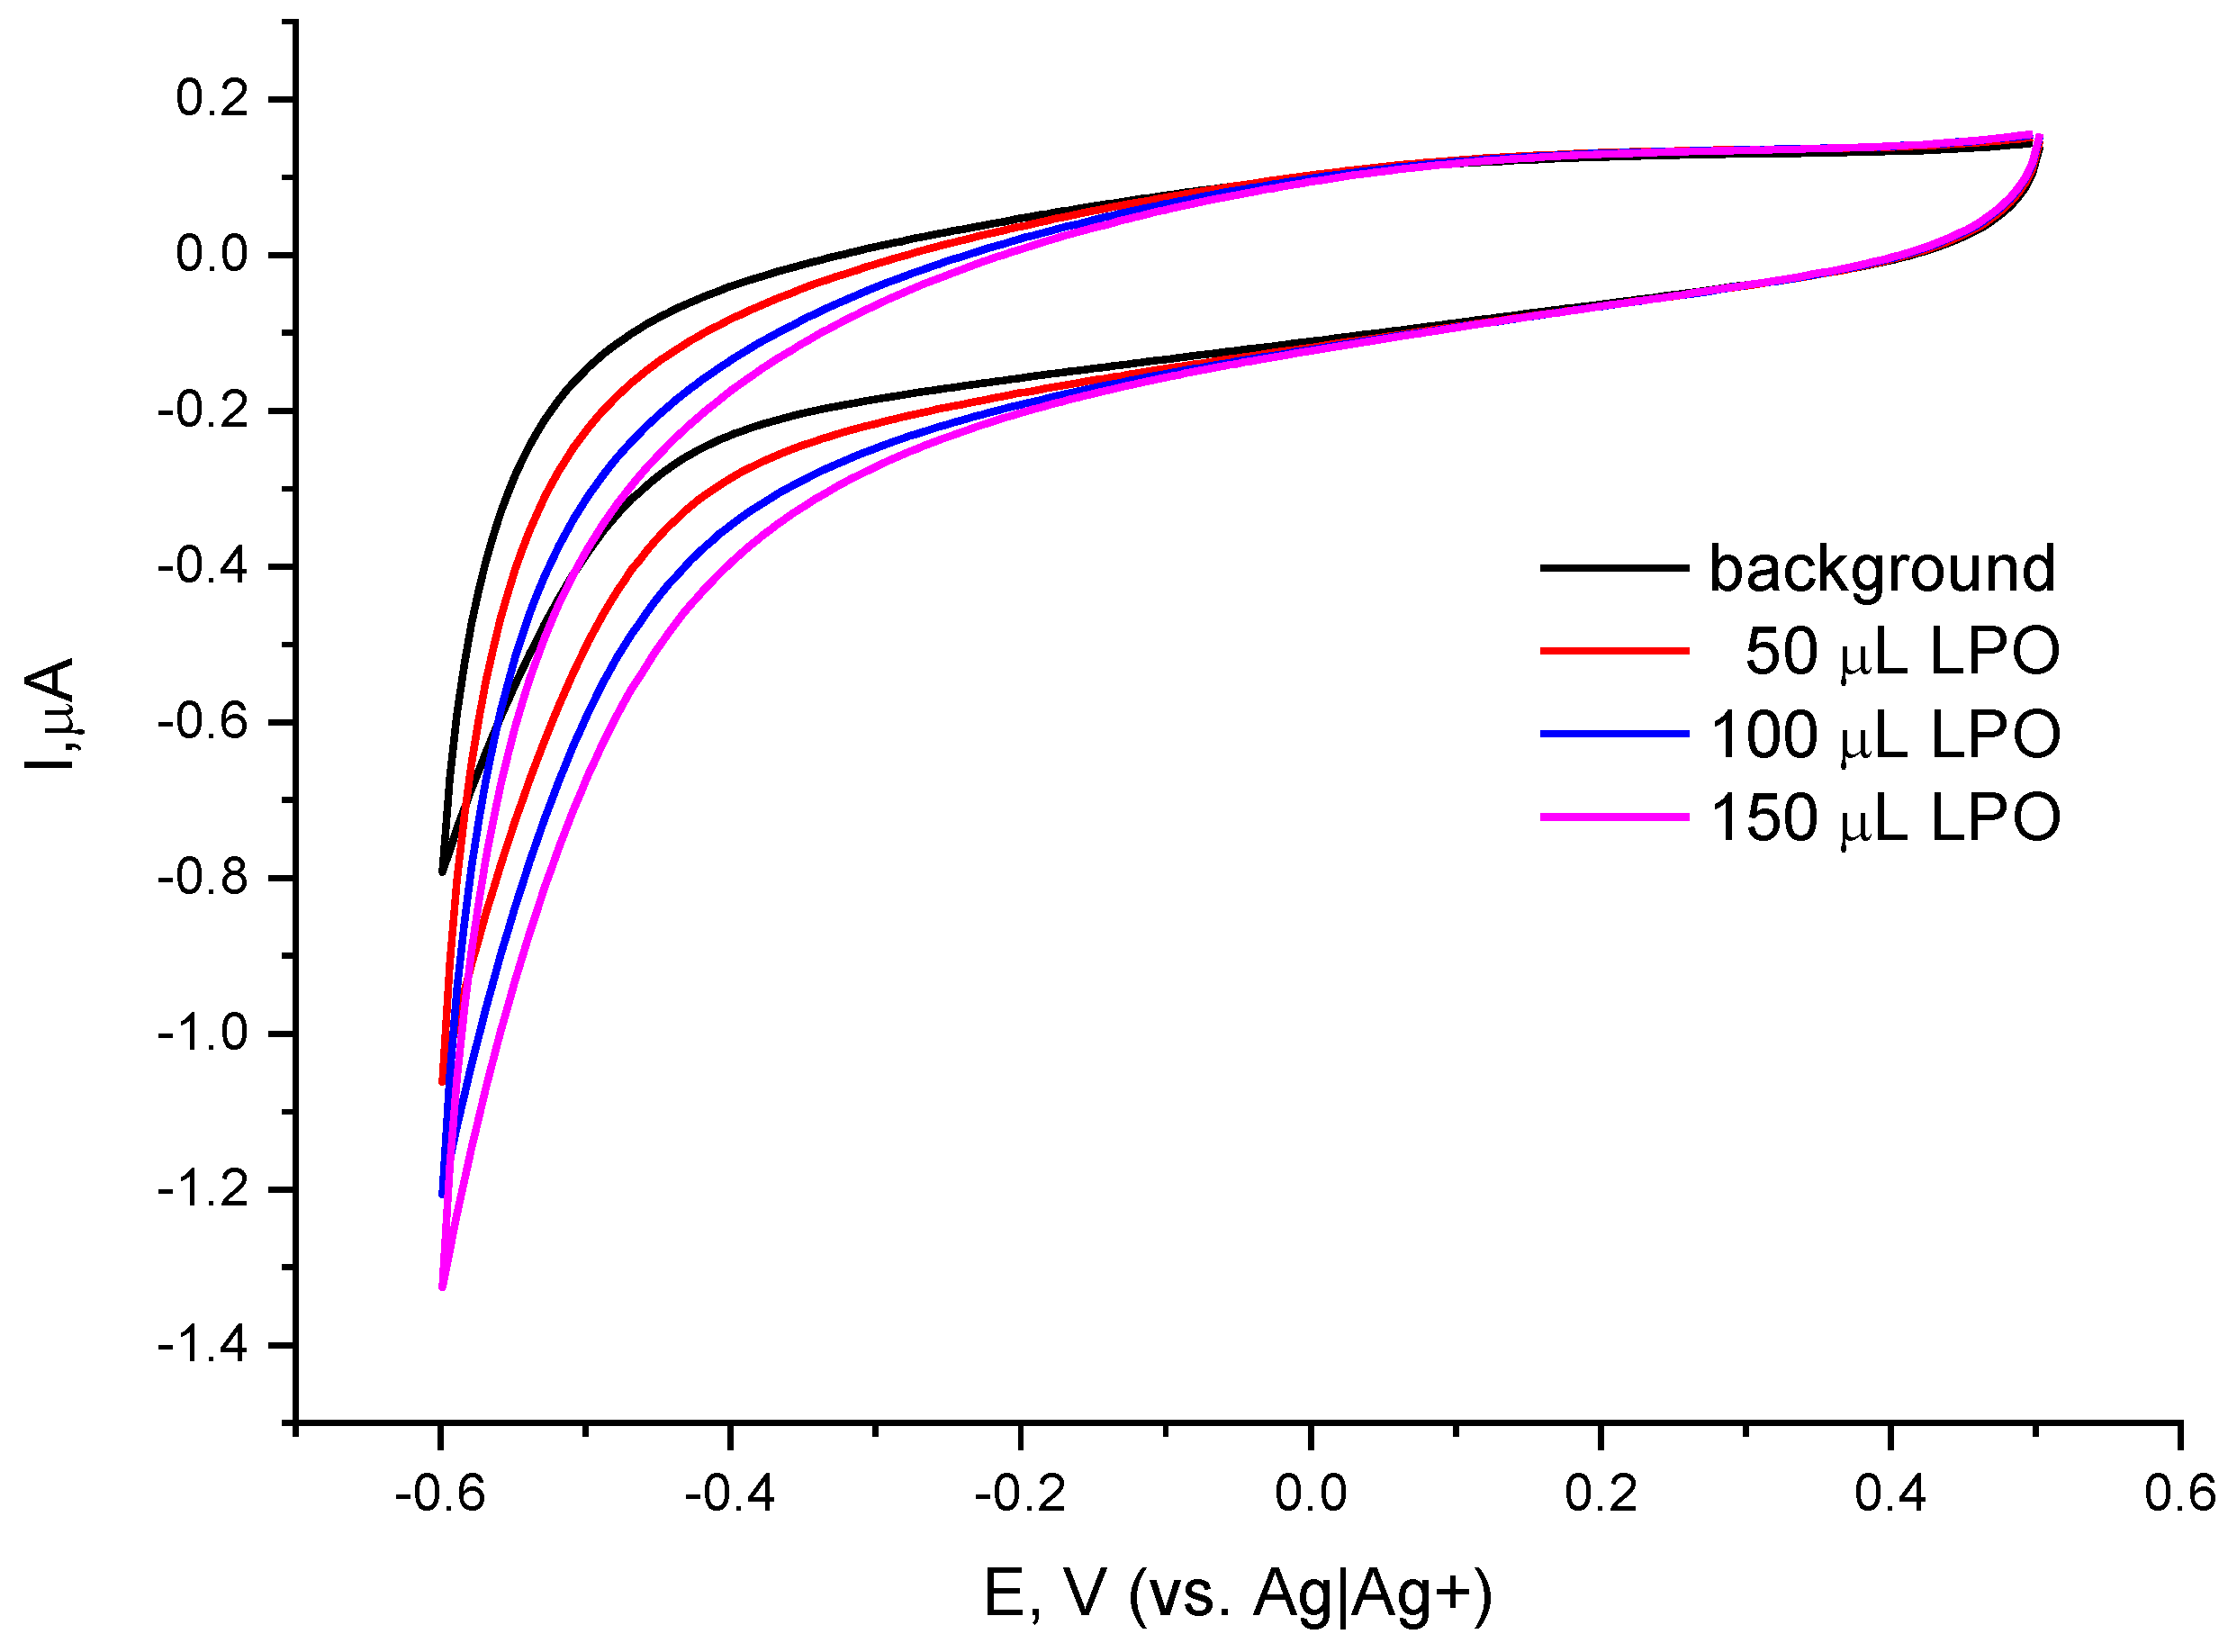
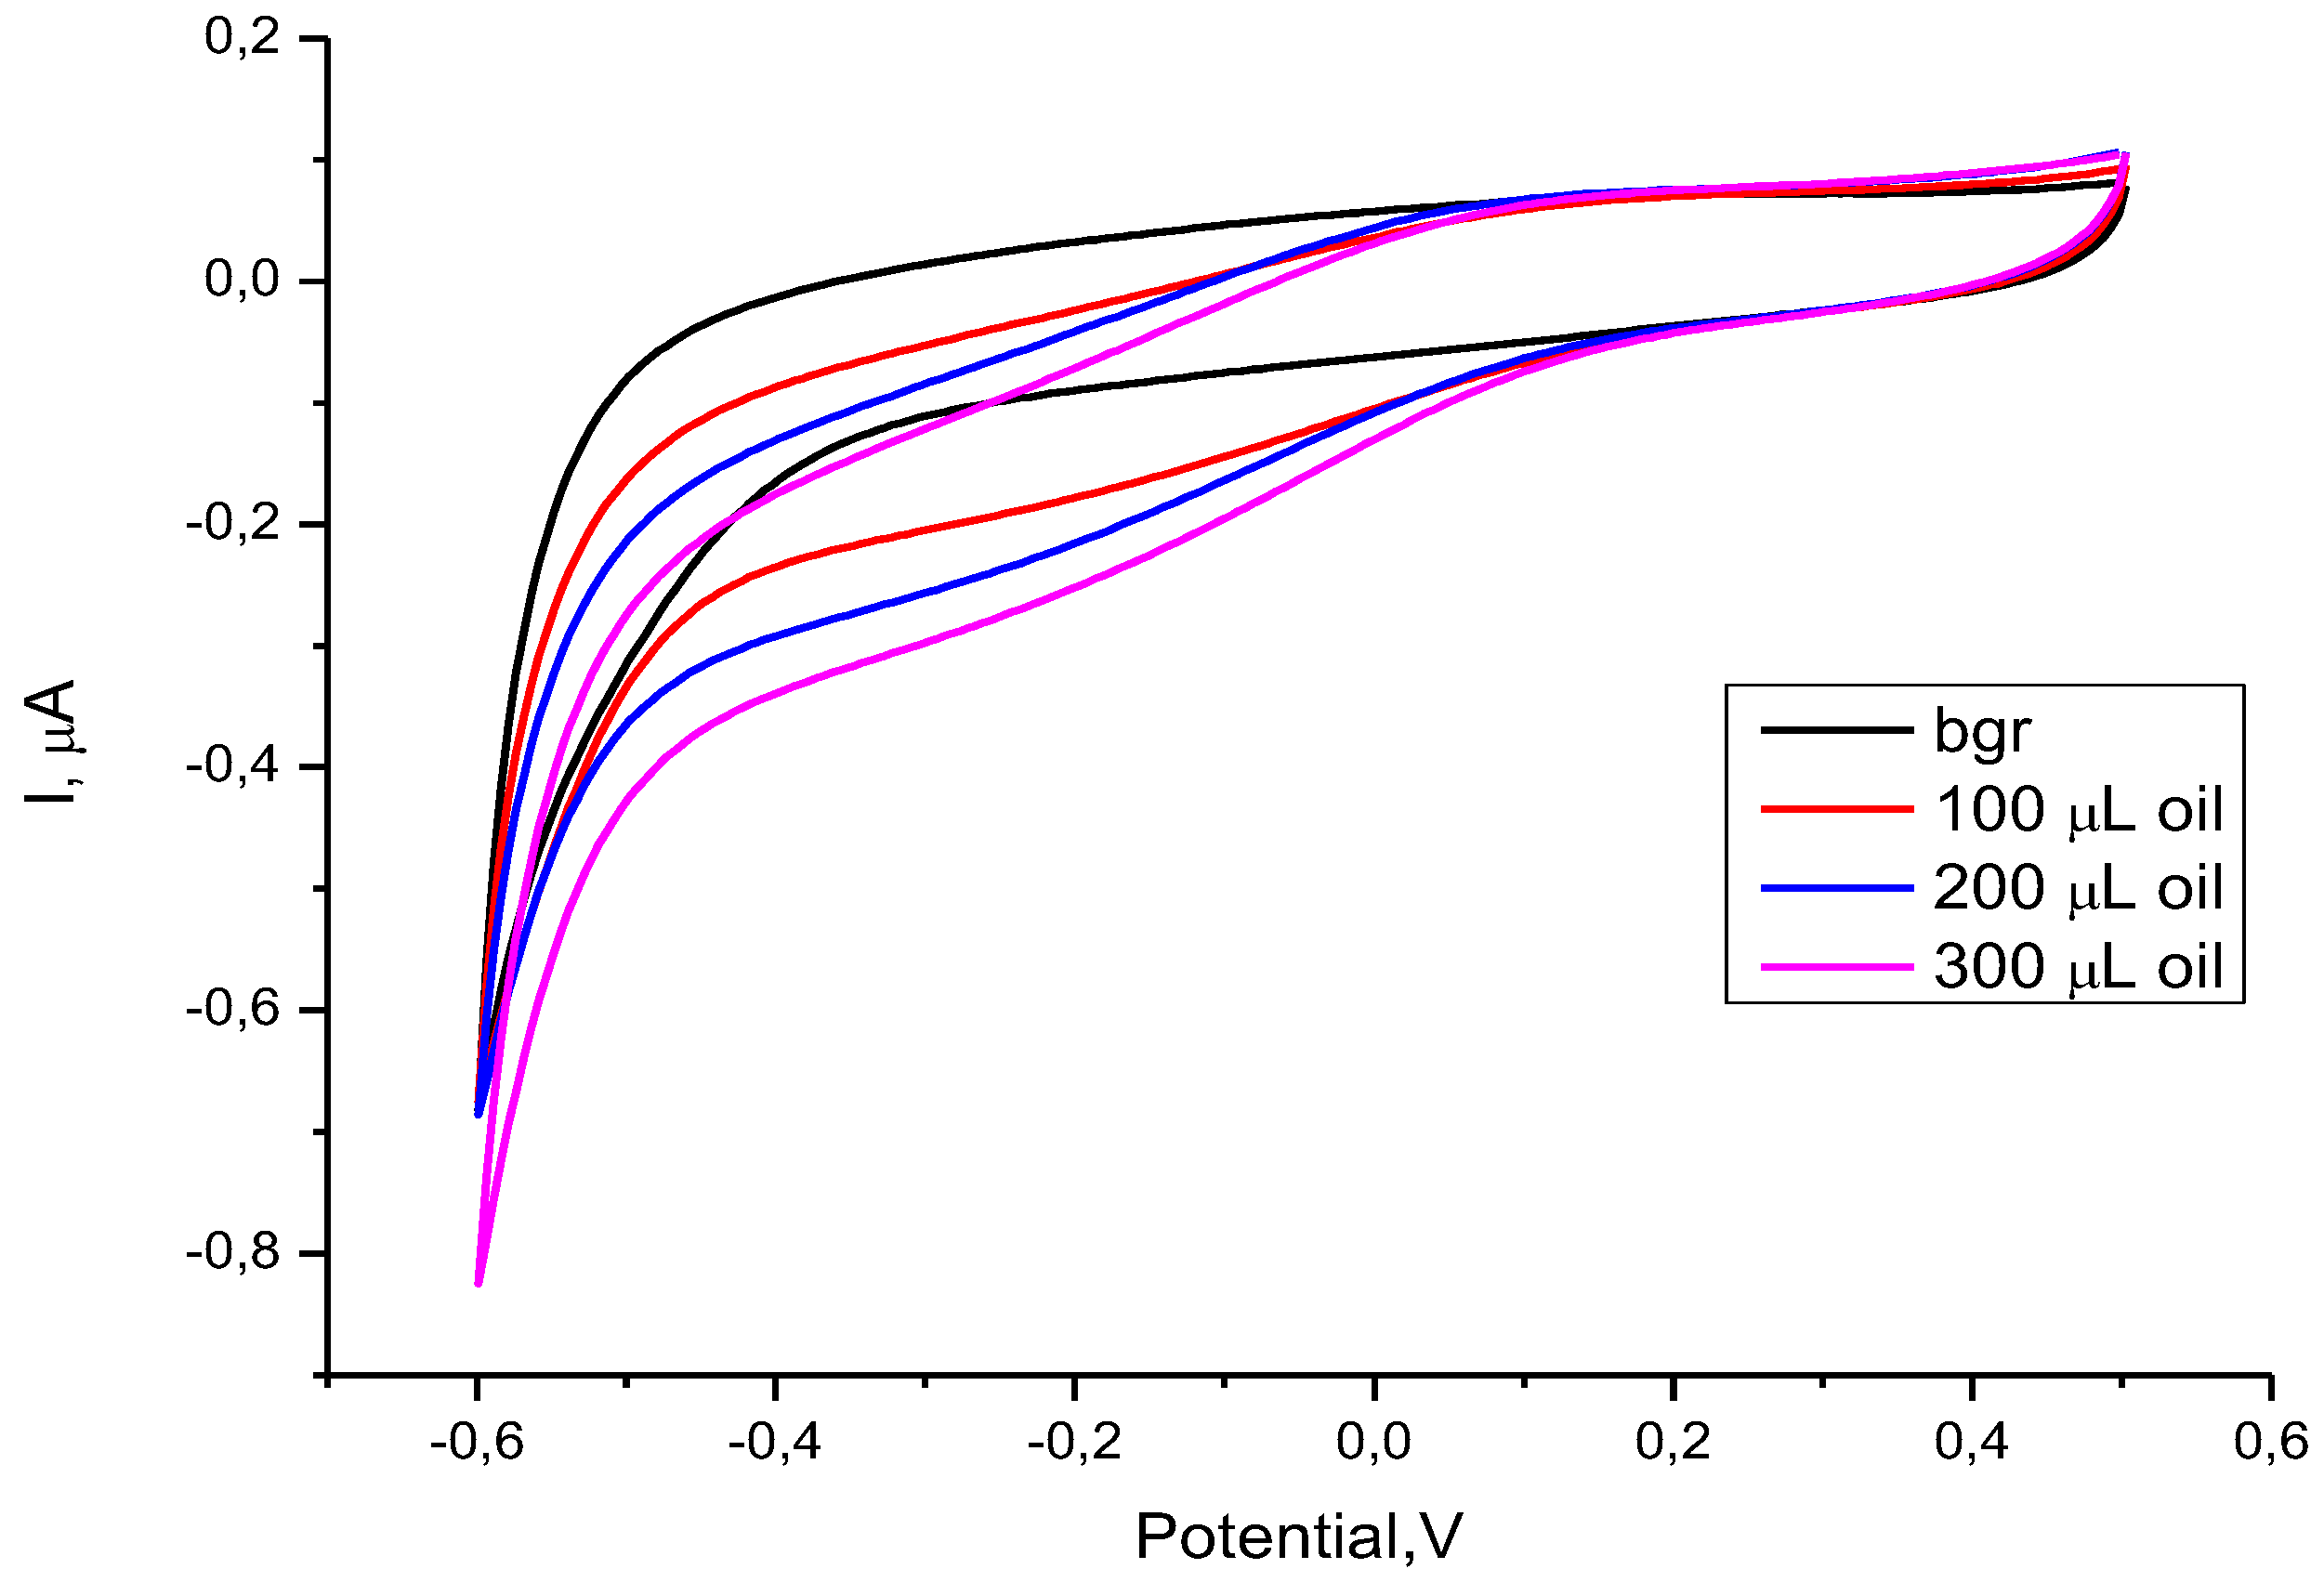
4.5. Study of the Electrocatalytic Activity of Co-g-C3N4/Nafion – Modified GCE

The Co-g-C3N4/Nafion – modified GCE working electrode, the reference electrode Ag|Ag+, and the auxiliary electrode – platinum foil, were positioned in a standard single-compartment electrochemical cell with a working volume of 10-50 ml without, 10 ml of background electrolyte – 0.1 M tetrabutylammonium perchlorate, dissolved in acetonitrile is added and the electrodes are connected to a DC source - the electrochemical workstation, through which the set DC voltage is controlled and the current strength is measured. The working potential is set to -200 mV and the establishment of a stationary background current of about 0.2 - 0.5 µA is awaited. Then, 20 to 50 µl of the analyte are added to the background electrolyte in the cell under continuous stirring. The increase in the concentration of the analyte containing organic peroxide in the electrochemical cell is achieved by successive addition to the solution in the electrolysis cell of equal volumes of the analyte. After each increase in the concentration of the analyte, 5 to 10 seconds for the signal to reach a steady-state value are necessary to read the current strength. The peroxide concentration in the analyte is determined using a previously prepared calibration curve.

4.6. Preparation of the Calibration Curve

A calibration curve of BPO at different concentrations was made by preparing a stock solution with concentrations of 0,003 М or 0,3 М in chloroform. In order to cover the largest possible concentration range, several aliquots of 20 µl, and then several times of 50 µl of the standard solution were added to the background electrolyte in the cell under continuous stirring at 450-550 rpm. The linear range of the calibration graph is up to 0.2 mM and above, i.e. exceeding a concentration of 48.45 mg/l.

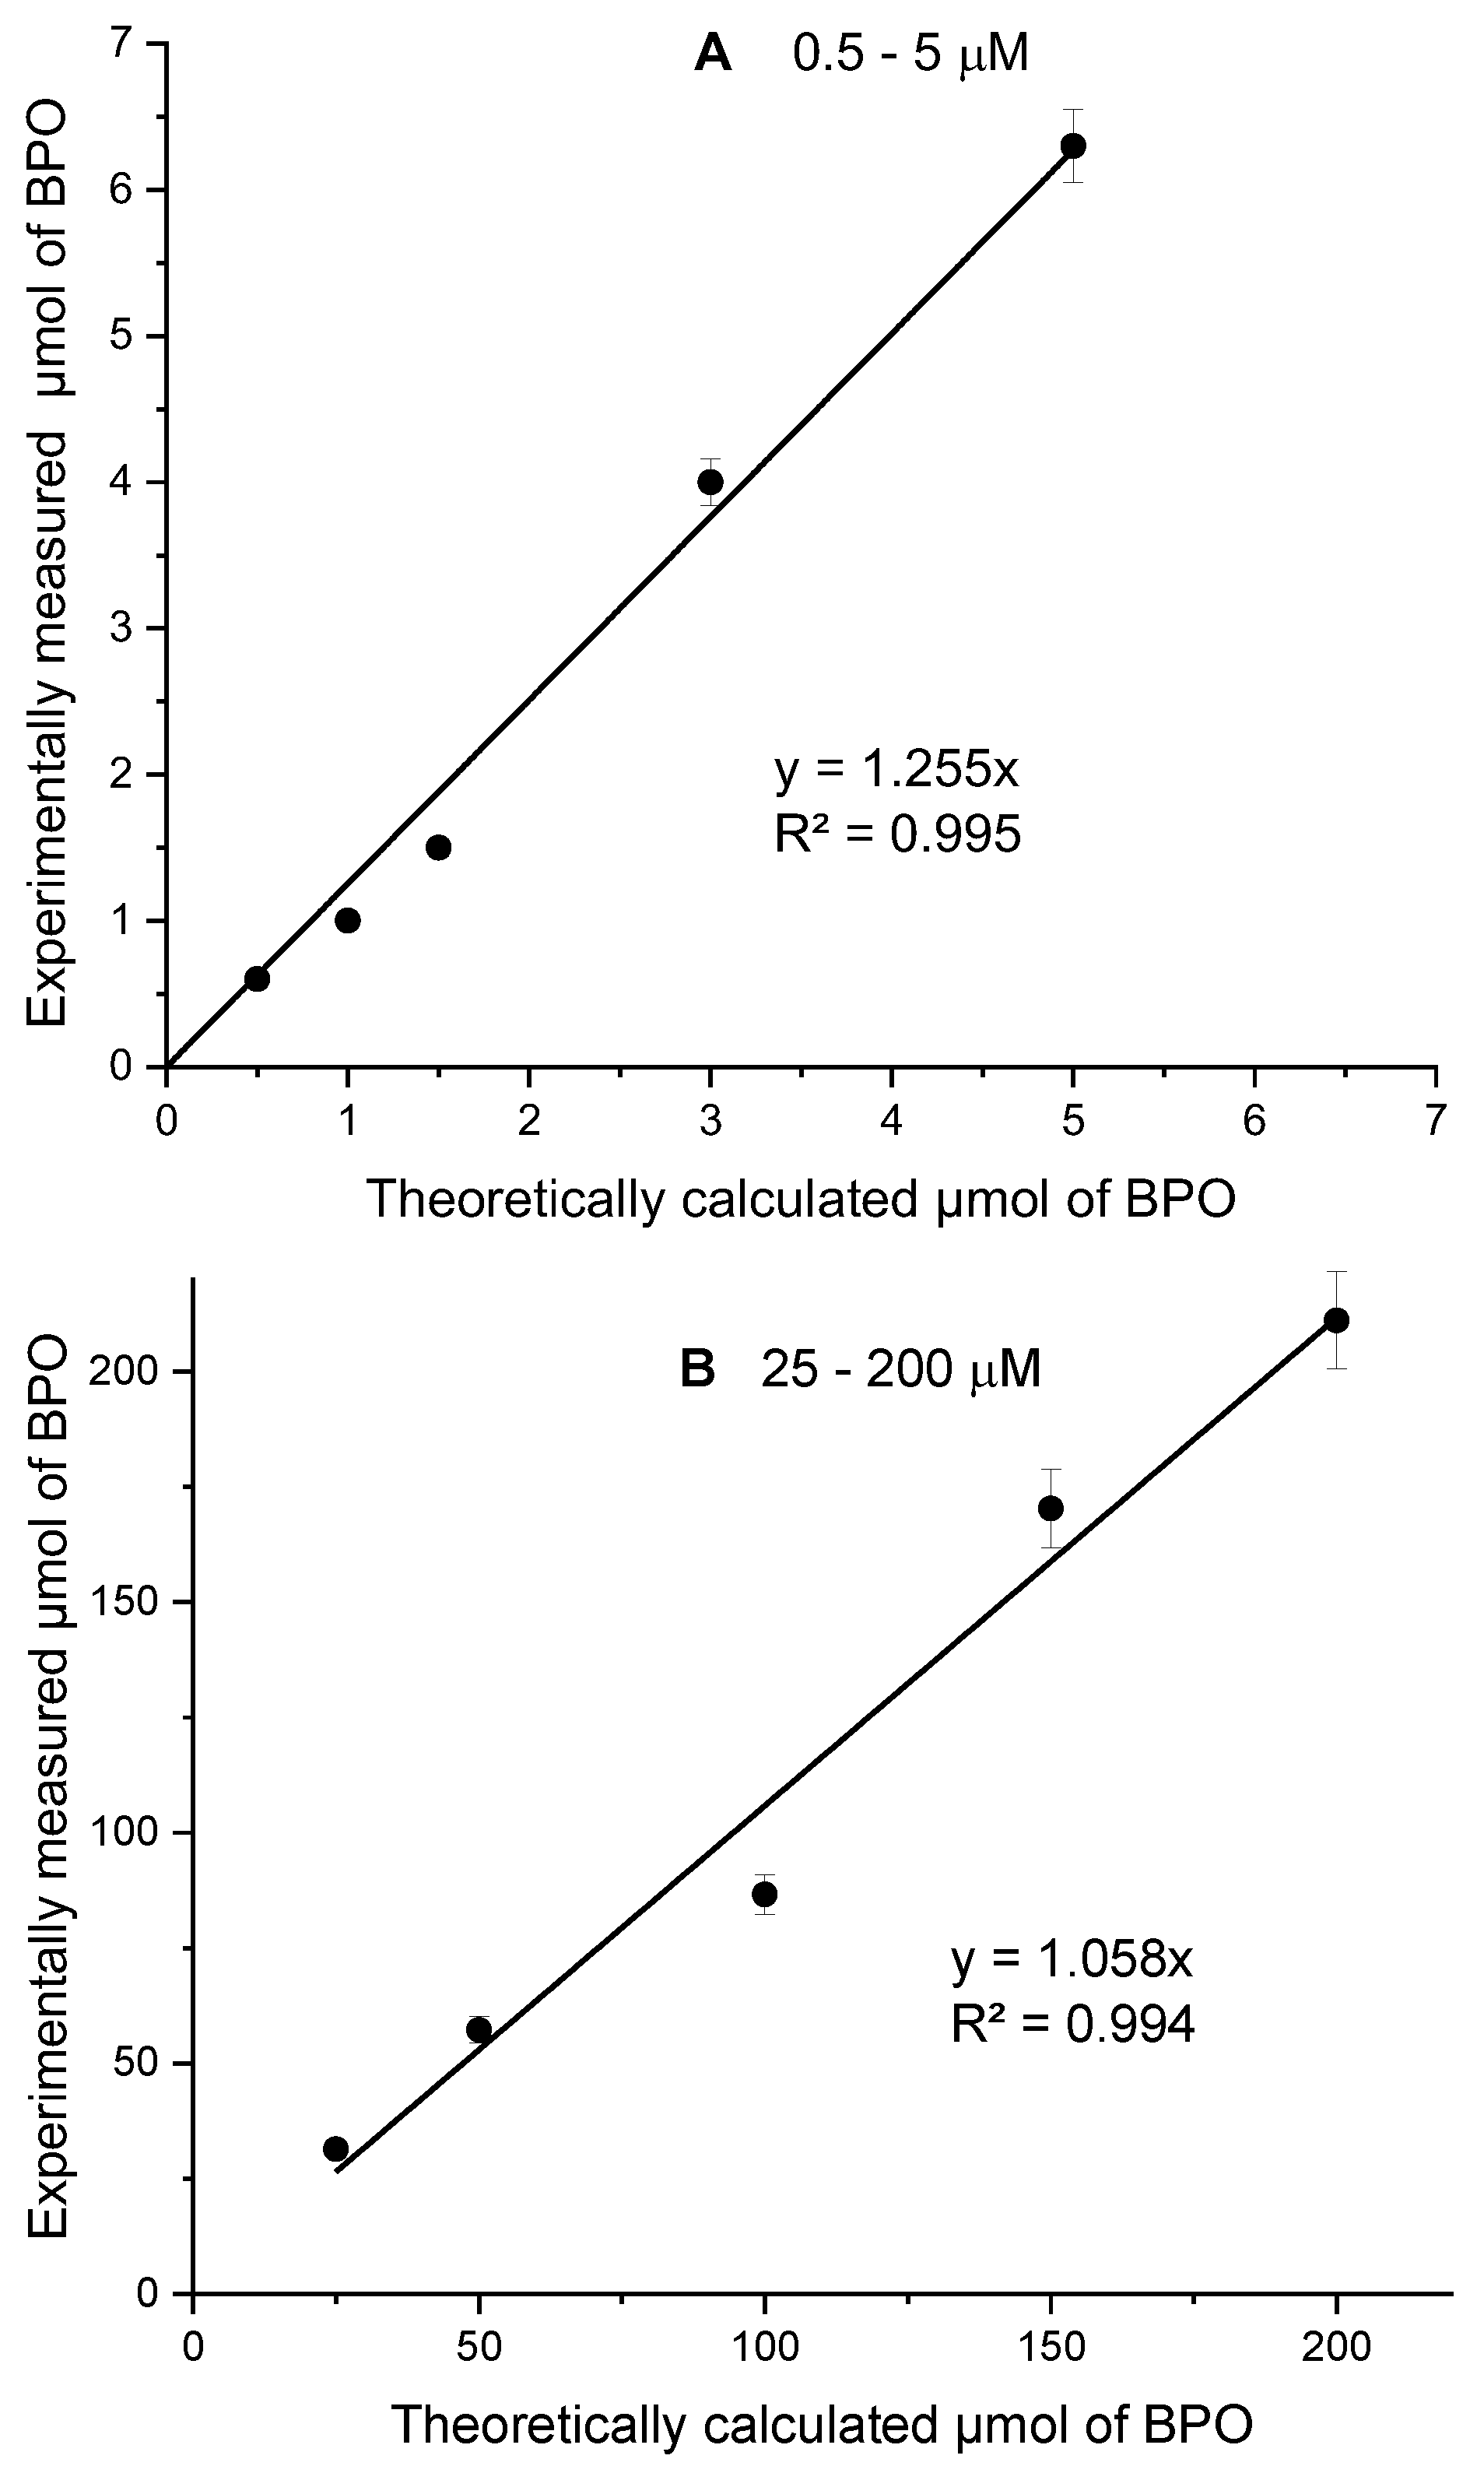
4.7. Assessment of the Accuracy of the Method Over the Range of Low Peroxide Concentrations

Initially, the catalytic electrode is calibrated with 0.003 M BPO/CHCl3 added to fresh oil (anti-cellulite oil - Rivana, peroxide-free) according to the following procedure:
1. Preparation of a stock solution with a concentration of 0.03 M BPO in CHCl3
2. Weighing of 0.4 g (0.5 ml) peroxide-free anti-cellulite oil and dissolving it into 0.03 M BPO/CHCl3 solution. This solution is designated as BPO/CHCl3/fresh oil.
3. Dilution of 0.03 M BPO/CHCl3/fresh oil 10 times with CHCl3 to a final concentration of 0.003 M BPO/CHCl3/fresh oil.
4. Calibration is performed at a working potential of -0.2 V with the following portions of 0.003 M BPO/CHCl3/fresh oil: 5 x 20 μl, then 6 x 50 μl are added.
5. All measurements were performed as described in section (4.5.), strictly following the procedure. The regression equation of the calibration plot is: Y= -2.62. 10-9+0.00272x.
Further, standard solutions of benzoyl peroxide (BPO) in chloroform (CHCl3) with concentrations: 1, 2, 3, 6, 10 mM were prepared by diluting 0.5 M BPO in CHCl3. The standard solutions have a final volume of 10 ml. The signals of all listed standard solutions of BPO in CHCl3 were measured. For this purpose, 0.5 ml of each standard solution is taken and 0.4 g of peroxide-free anti-cellulite oil (Rivana) is dissolved in them according to Table 2.
The aliquot portion taken for analysis from each standard solution was 0.1 ml.

4.8. Assessment of the Accuracy of the Electrochemical Method in a Wide Concentration Range

First, a calibration of the catalytic electrode was performed with 0.003 M BPO/CHCl3 added to fresh oil (anti-cellulite oil - Rivana, peroxide-free) following the procedure described in section 4.6.
Then, standard solutions of BPO/CHCl3 were prepared with concentrations: 50,100, 200, 300, 400 mM by dilution of 0.5 M BPO/CHCl3. The standard solutions have a final volume of 2 ml. Their signals were measured, taking 0.5 ml of each standard solution and dissolving ~0.4 g of fresh anti-cellulite oil in them according to the Table 3.
The standard solutions from St1 to St5 were pre-diluted and then a 0.1 ml aliquot portion was taken from the already diluted solutions for analysis. The regression equation from the calibration graph is: Y= 2,30. 10-8+0,00348x

4.9. Peroxide Value (PV) Measurement of the Anti-Cellulite Oil by Iodometric Titration

The PV measurement of oil samples of fresh anti-cellulite oil from the brand Rivana was done by iodometric titration according to the Bulgarian state standard (BSS EN ISO 3960:2017). Typically, 0.1000-0.2000 g of vegetable oil is weighed with an accuracy of 0.0002 in a 100 ml Erlenmeyer flask and 5 ml of chloroform and 2.5 ml of acetic acid are added. The flask is shaken until the oil is completely dissolved and 1 ml of 50% KI solution (freshly prepared) is added. The sample is left for 5 minutes in the dark, then 15-20 ml of distilled water and a few drops of 1% starch solution are added until a blue-purple color appears. Then, the sample is titrated with 0.002 N sodium thiosulfate solution slowly and with continuous homogenization by shaking until the color disappears in the aqueous (upper) layer.
For each sample tested, two parallel measurments were made and the arithmetic mean value is taken as the final result.
The same procedure is done for a blank sample, in which only the reagents without vegetable oil are present.
The peroxide value (PV) was calculated according to:
P V = ( V V o ) .0 , 002.1000 m ,   m e q . O 2 / k g
where:
V-
volume of 0,002 N Na2S2O3 in cm3, used to titrate the vegetable oil sample.
V-
Vo- volume of 0,002 N Na2S2O3 in cm3, used to titrate the blank sample.
V-
0,002- the concentration in normality of the Na2S2O3 solution
V-
m- the mass of vegetable oil

4.10. Determination of Peroxide Concentration in a Real Sample - Highly Rancid Anti-Cellulite Oil From the TRADEMARK RIVANA

The following procedure was applied:
Four 1ml samples are taken from the initial solution of rancid oil.
An initial standard solution of BPO/CHCl3 with a concentration of 10 mM is prepared.
Standard solutions were prepared according to Table 4 and the catalytic electrode was calibrated using the standard addition method.
The signals of all standard solutions were measured, with the aliquot portion for analysis being 0.1 ml.

4.11. Calculus

The intercept in the calibration graph corresponds to the signal of the real sample. Therefore, if we divide this signal by the sensitivity, we will get the concentration of peroxides in the sample: 10-8/0.008=1.25×10-6 M peroxides in the sample. Therefore, this signal must be divided by the sensitivity from the calibration plot, which gives the concentration of peroxides in the sample: 1.10-8/0.008=1.25×10-6 M peroxides in the sample. To account for the dilution of 0.1 ml of sample after its introduction into the cell containing 10 ml of electrolyte, the concentration of peroxides must be multiplied by the dilution factor (DF=100). Therefore: 1.25.10-6 M peroxides x 100=1.25×10⁻⁴ M peroxides are present in 0.1 ml of sample. Since an injection of the rancid oil (1.300 g) is dissolved with chloroform to a final volume of 15 ml, the concentration of peroxides in these 15 ml of undiluted oil should be found the following way:
  • 1,25.10-4 M × 0.1 ml of the sample = х × 14,9 ml sample
  • х =1,86×10⁻² M peroxides in 15 ml sample
  • The number of moles of peroxides in this 15 ml sample is calculated:
  • n=M.V=1,86.10-2mol/l × 15.10-3 liters= 2.76×10⁻⁴ mol peroxides
  • The number of moles is converted to μmol:
  • mol→106 μmol
  • 2.76×10⁻⁴ mol = 276 μmol
From the data obtained when studying the accuracy of the method in a wider range of PV we know that 200 μmol correspond to PV=536 meq/kg, then 276 μmol shall be equall to PV=739.75 ± 64.65 meq/kg. Therefore, the sample containing a mixture of vegetable oils is very rich in peroxides and is highly peroxidized (rancid).

5. Patents

This research resulted in a Bulgarian patent application No 113803 (BG/P/2023/113803).

Author Contributions

Conceptualization, N.D. and M.S.; methodology, M.P.; software, M.P.; validation, M.P., and V.I.; formal analysis, V.I.; investigation, M.P. and V.I.; resources, N.D.; data curation, M.P. and V.I.; writing—original draft preparation, V.I.; writing—review and editing, N.D..; visualization, V.I.; supervision, N.D.; project administration, N.D.; funding acquisition, N.D. All authors have read and agreed to the published version of the manuscript.

Funding

This research was funded by Bulgarian National Science Fund, grant number KP-06-N39/8.

Institutional Review Board Statement

Not applicable.

Informed Consent Statement

Not applicable.

Data Availability Statement

All data supporting this research are deposited at the Patent Office of the Republic of Bulgaria (application No BG/P/2023/113803).

Acknowledgments

Authors gratefully acknowledge the financial support from the BNSF (grant KP-06- N39/8). Electrochemical studies were performed thanks to the research infrastructure of the Center for Competence “Personalized Innovative Medicine, PERIMED (BG Program “Science and Education for Smart Growth” grant BG05M2OP001-1.002-0005-C01)”.

Conflicts of Interest

The authors declare no conflicts of interest.

References

  1. Wang, D.; Bao, A.; Yuan, Y.; Wang, Y.; Li, L.; Song, G.; Yuan, T.; Gong, J. Whey protein isolate-stabilized gardenia fruit oil nanoemulsions: Ultrasonic preparation, characterization and applications in nutraceuticals delivery. Ind Crops Prod 2024, 212, 118345. [Google Scholar] [CrossRef]
  2. Sun, X.; Wang, J.; Dong, M.; Zhang, H.; Li, L.; Wang, L. Food spoilage, bioactive food fresh-keeping films and functional edible coatings: Research status, existing problems and development trend. Trends Food Sci. Technol. 2022, 119, 122–132. [Google Scholar] [CrossRef]
  3. Kasaikina, O. T.; Krugovov, D. A.; Mengele, E. A. Unusual antioxidant effects in multiphase and complex systems. Eur. J. of Lipid Sci. Technol. 2017, 119(6), 1600286. [Google Scholar] [CrossRef]
  4. Hori, K.; Koh, F. H.; Tsumura, K. A. Metabolomics approach using LC TOF-MS to evaluate oxidation levels of edible oils. Food Anal. Methods 2019, 12(8), 1799–1804. [Google Scholar] [CrossRef]
  5. Zhang, N.; Li, Y.; Wen, S.; Sun, Y.; Chen, J.; Gao, Y.; Sagymbek, A.; Yu, X. Analytical methods for determining the peroxide value of edible oils: A mini- review. Food Chem. 2021, 358, 129834. [Google Scholar] [CrossRef] [PubMed]
  6. Yi, Y.; Yao, J.; Xu, W.; Wang, L.-M.; Wang, H.-X. Investigation on the quality diversity and quality-FTIR characteristic relationship of sunflower seed oils. RSC Adv. 2019, 9(47), 27347–27360. [Google Scholar] [CrossRef] [PubMed]
  7. Liang, P.; Chen, C.; Zhao, S.; Ge, F.; Liu, D.; Liu, B.; Fan, Q.; Han, B.; Xiong, X. Application of Fourier Transform Infrared Spectroscopy for the Oxidation and Peroxide Value Evaluation in Virgin Walnut Oil. Int. J. Spectrosc. 2013, 8, 1–5. [Google Scholar]
  8. Sinelli, N.; Cosio M., S.; Gigliotti, C.; Casiraghi, E. Preliminary study on application of mid infrared spectroscopy for the evaluation of the virgin olive oil ‘freshness’. Anal. Chim. Acta 2007, 598, 128–134. [Google Scholar] [CrossRef]
  9. Maggio R., M.; Kaufman T., S.; Carlo M., D.; Cerretani, L. Monitoring of fatty acid composition in virgin olive oil by Fourier transformed infrared spectroscopy coupled with partial least squares. Food Chem. 2009, 114, 1549–1554. [Google Scholar] [CrossRef]
  10. Guillen M., D.; Cabo, N. Fourier transform infrared spectra data versus peroxide and anisidine values to determine oxidative stability of edible oils. Food Chem. 2002, 77, 503–510. [Google Scholar] [CrossRef]
  11. Deyrieux, C.; Villeneuve, P.; Barea, B.; Decker E., A.; Guiller, I.; Salaun F., M.; Durand, E. Measurement of peroxide values in oils by triphenylphosphine/triphenylphosphine oxide (TPP/TPPO) assay coupled with FTIR-ATR spectroscopy: comparison with iodometric titration. Eur. J. Lipid Sci. Technol. 2018, 120, 1800109–1800119. [Google Scholar] [CrossRef]
  12. Yu, X. , Vandevoort, F., Sedman, J. Determination of peroxide value of edible oils by FTIR spectroscopy with the use of the spectral reconstitution technique. Talanta 2007, 74, 241–246. [Google Scholar] [CrossRef]
  13. Liu, H.; Chen, Y.; Shi, C.; Yang, X.; Han, D. FT-IR and Raman spectroscopy data fusion with chemometrics for simultaneous determination of chemical quality indices of edible oils during thermal oxidation. LWT 2020, 119, 108906. [Google Scholar] [CrossRef]
  14. Muste, S.; Racolta, E.; Semeniuc C., A.; Man, S.; Birou, A.; Mureȿan, V.; Chircu, C. Determination of Peroxide Value in Sunflower Halva using a Spectrophotometric Method. Bulletin UA SVM Agriculture 2010, 67, 334–339. [Google Scholar]
  15. DeLong J., M.; Prange R., K.; Hodges D., M.; Forney C., F.; Bishop M., C.; Quilliam, M. Using a modified ferrous oxidation–xylenol orange (FOX) assay for detection of lipid hydroperoxides in plant tissue. J. Agric. Food Chem. 2002, 50(2), 248–254. [Google Scholar] [CrossRef]
  16. Abuzaytoun, R.; Budge, S.; Hansen L., T.; MacKinnon, S. ) Modification of the ferrous oxidation-xylenol orange method for determination of peroxide value in highly pigmented sea cucumber viscera lipid. JAOCS 2020, 97(5), 509–516. [Google Scholar] [CrossRef]
  17. Parker, T.; Limer, E.; Watson, A.D.; Defernez, M.; Williamson, D.; . Kemsley E., K. 60 MHz 1H NMR spectroscopy for the analysis of edible oils. TRAC 2014, 57, 147–158. [Google Scholar]
  18. Alonso-Salces, R.M.; Holland, M.V.; Guillou, C. H-1-NMR fingerprinting to evaluate the stability of olive oil. Food Control 2011, 22, 2041–2046. [Google Scholar] [CrossRef]
  19. Knothe, G.; Kenar, J.A. Determination of the fatty acid profile by H-1-NMR spectroscopy, Eur. J. Lipid Sci. Technol. 2004, 106, 88–96. [Google Scholar] [CrossRef]
  20. Guillen, M.D.; Ruiz, A. Edible oils: discrimination by H-1 nuclear magnetic resonance.
  21. J. Sci. Food Agric. 2003, 83, 338-346.
  22. Liu, X.; Wang, S.; Tamogami, S.; Chen, J.; Zhang, H. An evaluation model for the quality of frying oil using key aldehyde detected by HS-GC/MS. Foods 2022, 11, 2413. [Google Scholar] [CrossRef] [PubMed]
  23. Sharma, A.; Bhardwaj, A.; Khanduja, G.; Kumar, S.; Bagchi, S.; Kaur, R.; Sharma, M.; Singla, M.; Ravinder, T.; Bhondekar, A.; Devi, B.L.A. Determination of Hexanal using static headspace GC-FID method and its correlation with oxidative rancidity in edible oils, Food Anal. Methods 2022, 15, 2652–2663. [Google Scholar]
  24. Lu, Y.; Xiong, R.; Tang, Y.; Yu, N.; Nie, X.; Zhang, L.; Meng, X. An overview of the detection methods to the edible oil oxidation degree: Recent progress, challenges, and perspectives. Food Chem. 2025, 463, 141443. [Google Scholar] [CrossRef]
  25. Chen, J.; Cai, D.; Zhang, Y. Rapid determination of lipid peroxidation using a novel pyridoxamine-participating ferrous oxidation-sulfosalicylic acid spectrophotometric method. Food Chemistry 2016, 211, 637–644. [Google Scholar] [CrossRef] [PubMed]
  26. Manikanta M., P.; Nikam R., R.; Tigari, G.; Mallana N., B. Novel nickel (II) phthalocyanine/reduced graphene oxide: an electrochemical sensing platform for analysis of hydroquinone and chloramphenicol in environmental samples. Anal. Methods 2024, 16, 1770–1784. [Google Scholar]
  27. Jyothi, S.P.; Vinod, D.; Chandran, D.; Antherjanam, S.; Saraswathyamma, B.; Balaraman, V.; Rajamani, R. Poly-4-amino-6-chloro-1,3-benzene disulfonamide decorated pencil graphite electrode for the simultaneous electrochemical quantification of catechol and hydroquinone. J. Appl. Electrochem. 2024, 54, 1819–1831. [Google Scholar] [CrossRef]
  28. Aryan, Z.; Khajehsharifi, H.; Shahrokhian, S. AuNPs-Ultrathin/Graphitic-C3N4 nanosheets as a sensitive platform for electrochemical detection and determination of dopamine. Microchem. J. 2024, 198, 110087. [Google Scholar] [CrossRef]
  29. Wang, R.; Liu, S.; Song, X.; Jiang, K.; Hou, Y.; Cheng, Q.; Miao, W.; Tian, L.; Ren, Y.; Xu, S. Polypyrrole/α-Fe2O3 Hybrids for Enhanced Electrochemical Sensing Performance towards Uric Acid. Coatings 2024, 14, 227. [Google Scholar] [CrossRef]
  30. Suriyaprakash, J.; Thangavelu, I.; Huang, Y.; Hu, Z.; Wang, H.; Zhan, Y.; Wu, L.; Shan, L. Precise surface molecular engineering of 2D-Bi2S3 enables the ultrasensitive simultaneous detection of dopamine, epinephrine, serotonin and uric acidSurf. Interfaces 2024, 46, 104021. [Google Scholar]
  31. Cosio, M. S.; Ballabio, D.; Benedetti, S.; Gigliotti, C. Evaluation of different storage conditions of extra virgin olive oils with an innovative recognition tool built by means of electronic nose and electronic tongue. Food Chem. 2007, 101(2), 485–491. [Google Scholar] [CrossRef]
  32. Rodrigues, N.; Dias, L. G.; Veloso, A. C. A.; Pereira, J. A.; Peres, A. M. Monitoring olive oils quality and oxidative resistance during storage using an electronic tongue. LWT 2016, 73, 683–692. [Google Scholar] [CrossRef]
  33. Rodrigues, N.; Marx, ´I. M. G.; Casal, S.; Dias, L. G.; Veloso, A. C. A.; Pereira, J. A.; Peres, A. M. Application of an electronic tongue as a single-run tool for olive oils’ physicochemical and sensory simultaneous assessment. Talanta 2019, 197, 363–373. [Google Scholar] [CrossRef]
  34. Majchrzak, T.; Wojnowski, W.; Dymerski, T.; Gębicki, J.; Namie´snik, J. Electronic noses in classification and quality control of edible oils: A review. Food Chem. 2018, 246, 192–201. [Google Scholar] [CrossRef]
  35. Fagiolari, L.; Sampò, M.; Lamberti, A.; Amici, J.; Francia, C.; Bodoardo, S.; Bella, F. Integrated energy conversion and storage devices: Interfacing solar cells, batteries and supercapacitors. Energy Storage Mater. 2022, 51, 400–434. [Google Scholar] [CrossRef]
  36. Pollok, D.; Waldvogel S., R. Electro-organic synthesis-a 21stcentury technique. Chem. Sci. 2020, 11, 12386–12400. [Google Scholar] [CrossRef]
  37. McCreery, The merger of electrochemistry and molecular electronics. Chem. Rec. 2012, 12, 149–163. [CrossRef] [PubMed]
  38. Kraft, Electrochromism: a fascinating branch of electrochemistry. ChemTexts 2019, 5, 1–18. [CrossRef]
  39. Peng, B.; Hongliang, L.; Guochen, Z.; Minrui, R.; Lili, C.; Hanjie, G.; Yanpeng, X. Robust Super-Hydrophobic Coating Prepared by Electrochemical Surface Engineering for corrosion protection. Coatings 2019, 9, 452. [Google Scholar] [CrossRef]
  40. Díaz-Cruz, J.M.; Serrano, N.; Pérez-Ràfols, C.; Ariño, C.; Esteban, M. Electroanalysis from the past to the twenty-first century: challenges and perspectives. J. Solid State Electrochem. 2020, 24, 2653–2661. [Google Scholar] [CrossRef] [PubMed]
  41. Zhao, Z.; Cai, D.; Shao, Y.; Tian, J.; Wang, L.; Dong, Y. (). Detection of di(2- ethylhexyl) phthalate in edible vegetable oils using a sensitive aptasensor based on carbon nanomaterials and copper metal-organic framework. J. Food Compos. Anal. 2023, 123, 105510. [Google Scholar] [CrossRef]
  42. Novoselov K., S.; Geim A., K.; Morozov S., V.; Jiang, D.; Zhang, Y.; Dubonos S., V.; Grigorieva I., V.; Firsov A., A. Electric field effect in atomically thin carbon films. Science (New York, N.Y.) 2004, 306, 666–669. [Google Scholar] [CrossRef]
  43. Tan, C.; Cao, X.; Wu, X.-J.; He, Q.; Yang, J.; Zhang, X.; Chen, J.; Zhao, W.; Han, S.; Nam, G.-H.; Sindoro, M.; Zhang, H. Recent Advances in Ultrathin Two-Dimensional Nanomaterials, Chem. Rev. 2017, 117, 6225–6331. [Google Scholar]
  44. Mamba, G.; Mishra, A.K. Graphitic carbon nitride (g-C3N4) nanocomposites: A new and exciting generation of visible light driven photocatalysts for environmental pollution remediation. Appl. Catal. B Environ. 2016, 198, 347–377. [Google Scholar] [CrossRef]
  45. Hu, T.; Mei, X.; Wang, Y.; Weng, X.; Liang, R.; Wei, M. Two-dimensional nanomaterials: fascinating materials in biomedical field. Sci. Bull. 2019, 64, 1707–1727. [Google Scholar] [CrossRef]
  46. Moraes, L.P.R.; Mei, J.; Fonseca, F.C.; Sunet, Z. Two-dimensional metal oxide nanomaterials for sustainable energy applications. INC 2020, 39–72. [Google Scholar]
  47. Joshi, N.; Hayasaka, T.; Liu, Y.; Liu, H.; Oliveira, O.N.; Lin, L. A review on chemiresistive room temperature gas sensors based on metal oxide nanostructures, graphene and 2D transition metal dichalcogenides. Microchim. Acta 2018, 185, 213. [Google Scholar] [CrossRef] [PubMed]
  48. Wang, M.; Wu, Z.; Dai, L. Graphitic carbon nitrides supported by nitrogen-doped graphene as efficient metal-free electrocatalysts for oxygen reduction. JEAC 2015, 753, 16–20, 2015. [Google Scholar] [CrossRef]
  49. Jiang, S.; Zhang, Z.; Yang, N.; Li, L.; Wei, Z. Probing the Interaction between Nitrogen Dopants and Edge Structures of Doped Graphene Catalysts for the Highly Efficient Oxygen Reduction Reaction. J. Phys. Chem. C 2022, 126, 19113–19121. [Google Scholar] [CrossRef]
  50. Ong, W.J.; Tan, L.L.; Ng, Y.H.; Yong, S.T.; Chai, S.P. Graphitic Carbon Nitride (g-C3N4)-Based Photocatalysts for Artificial Photosynthesis and Environmental Remediation: Are We a Step Closer To Achieving Sustainability. Chem. Rev. 2016, 116, 7159–7329. [Google Scholar] [CrossRef]
  51. Wang, X.; Maeda, K.; Thomas, A.; Takanabe, K.; Xin, G.; Carlsson, J.M.; Domen, K.; Antonietti, M. A metal-free polymeric photocatalyst for hydrogen production from water under visible light. Nat. Mater 2009, 8, 76–80. [Google Scholar] [CrossRef]
  52. Li, J.; Fang, J.; Ye, P.; Wu, D.; Wang, M.; Li, X.; Xu, A. Peroxymonosulfate activation by iron oxide modified g-C3N4 under visible light for pollutants degradation. JPPA 2017, 342, 85–93. [Google Scholar]
  53. Agnihotri, A.S.; Varghese, A.; Nidhin, M. Transition metal oxides in electrochemical and bio sensing: A state-of-art review. Appl. Surf. Sci. Advances 2020, 4, 100072. [Google Scholar] [CrossRef]
  54. Pimpilova, M.; Ivanova-Kolcheva, V.; Stoyanova, M.; Dimcheva, N. 2D Nanomaterial—Based Electrocatalyst for Water Soluble Hydroperoxide Reduction. Catalysts 2022, 12, 807. [Google Scholar] [CrossRef]
  55. Ziyatdinova, G; Guss, E.; Yakupova, E. Electrochemical sensors based on the electropolymerized natural phenolic antioxidants and their analytical application. Sensors 2021, 21, 8385. [Google Scholar] [CrossRef]
Figure 1. Cyclic voltammograms of Co-g-C3N4/Nafion/GCE in the absence and presence of BPO/ACN; background electrolyte 0.1 M TBAP in acetonitrile, reference electrode Ag|Ag+; scan rate 20 mV/s.
Preprints 143054 g001
Figure 2. Chronoamperometric record (left) and calibration plot (right) of an electrode modified with Co-g-C3N4/Naf. upon addition of aliquots of 0.003M BPO; background electrolyte: 0.1 M solution of TBAP in acetonitrile, reference electrode Ag|Ag+; working potential: - 0.2 V.
Preprints 143054 g002
Figure 3. Cyclic voltammograms of Co-g-C3N4/Nafion/GCE in the absence and presence of lauroyl peroxide (LPO) in ACN; background electrolyte 0.1 M TBAP in acetonitrile, reference electrode Ag|Ag+; scan rate 20 mV/s.
Preprints 143054 g003
Figure 4. Cyclic voltammograms of Co-g-C3N4/Nafion/GCE in the absence and presence of oil (dissolved in CHCl3); background electrolyte 0.1 M TBAP in ACN, reference electrode Ag|Ag+; scan rate 20 mV.s-1.
Preprints 143054 g004
Figure 5. Chronoamperometric record (inset) and calibration plot of a Co-g-C3N4/Nafion modified electrode upon addition of aliquots of 0.003M BPO (dissolved in CHCl3 /oil); background electrolyte: 0.1 M TBAP in ACN, reference electrode Ag| Ag+; potential: - 0.2 V.
Preprints 143054 g005
Figure 6. Correlation dependences of measured versus theoretical amounts of peroxide (BPO) in a real oil sample enriched with peroxides in a narrow (0.5-5 μM) and in a wider (25-200 μM) range of peroxide concentrations (in μmol l-1).
Preprints 143054 g006
Figure 7. Correlation dependences of measured versus expected amounts of O2 in a real oil sample enriched with benzoyl peroxide in a low (1 – 13 meq kg-1) and in high (60- 550 meq kg-1) range of peroxide concentrations, expressed in meq/kg.
Preprints 143054 g007
Figure 8. Measured vs. expected peroxide value of a real sample spiked with known amounts of BPO analyzed using the titrimetric method (BSS EN ISO 3960:2017) – left, and using the electrochemical method - right.
Preprints 143054 g008
Figure 9. Determination of the real sample PV by the method of standard addition: after adding the sample, three more aliquots of the external standard solution were added (standard peroxide solution – BPO in chloroform to which the real sample was added) to the electrochemical cell.
Preprints 143054 g009
Table 1. Comparison of the accuracy of the electrochemical method and the classical titrimetric method for the determination of PV.
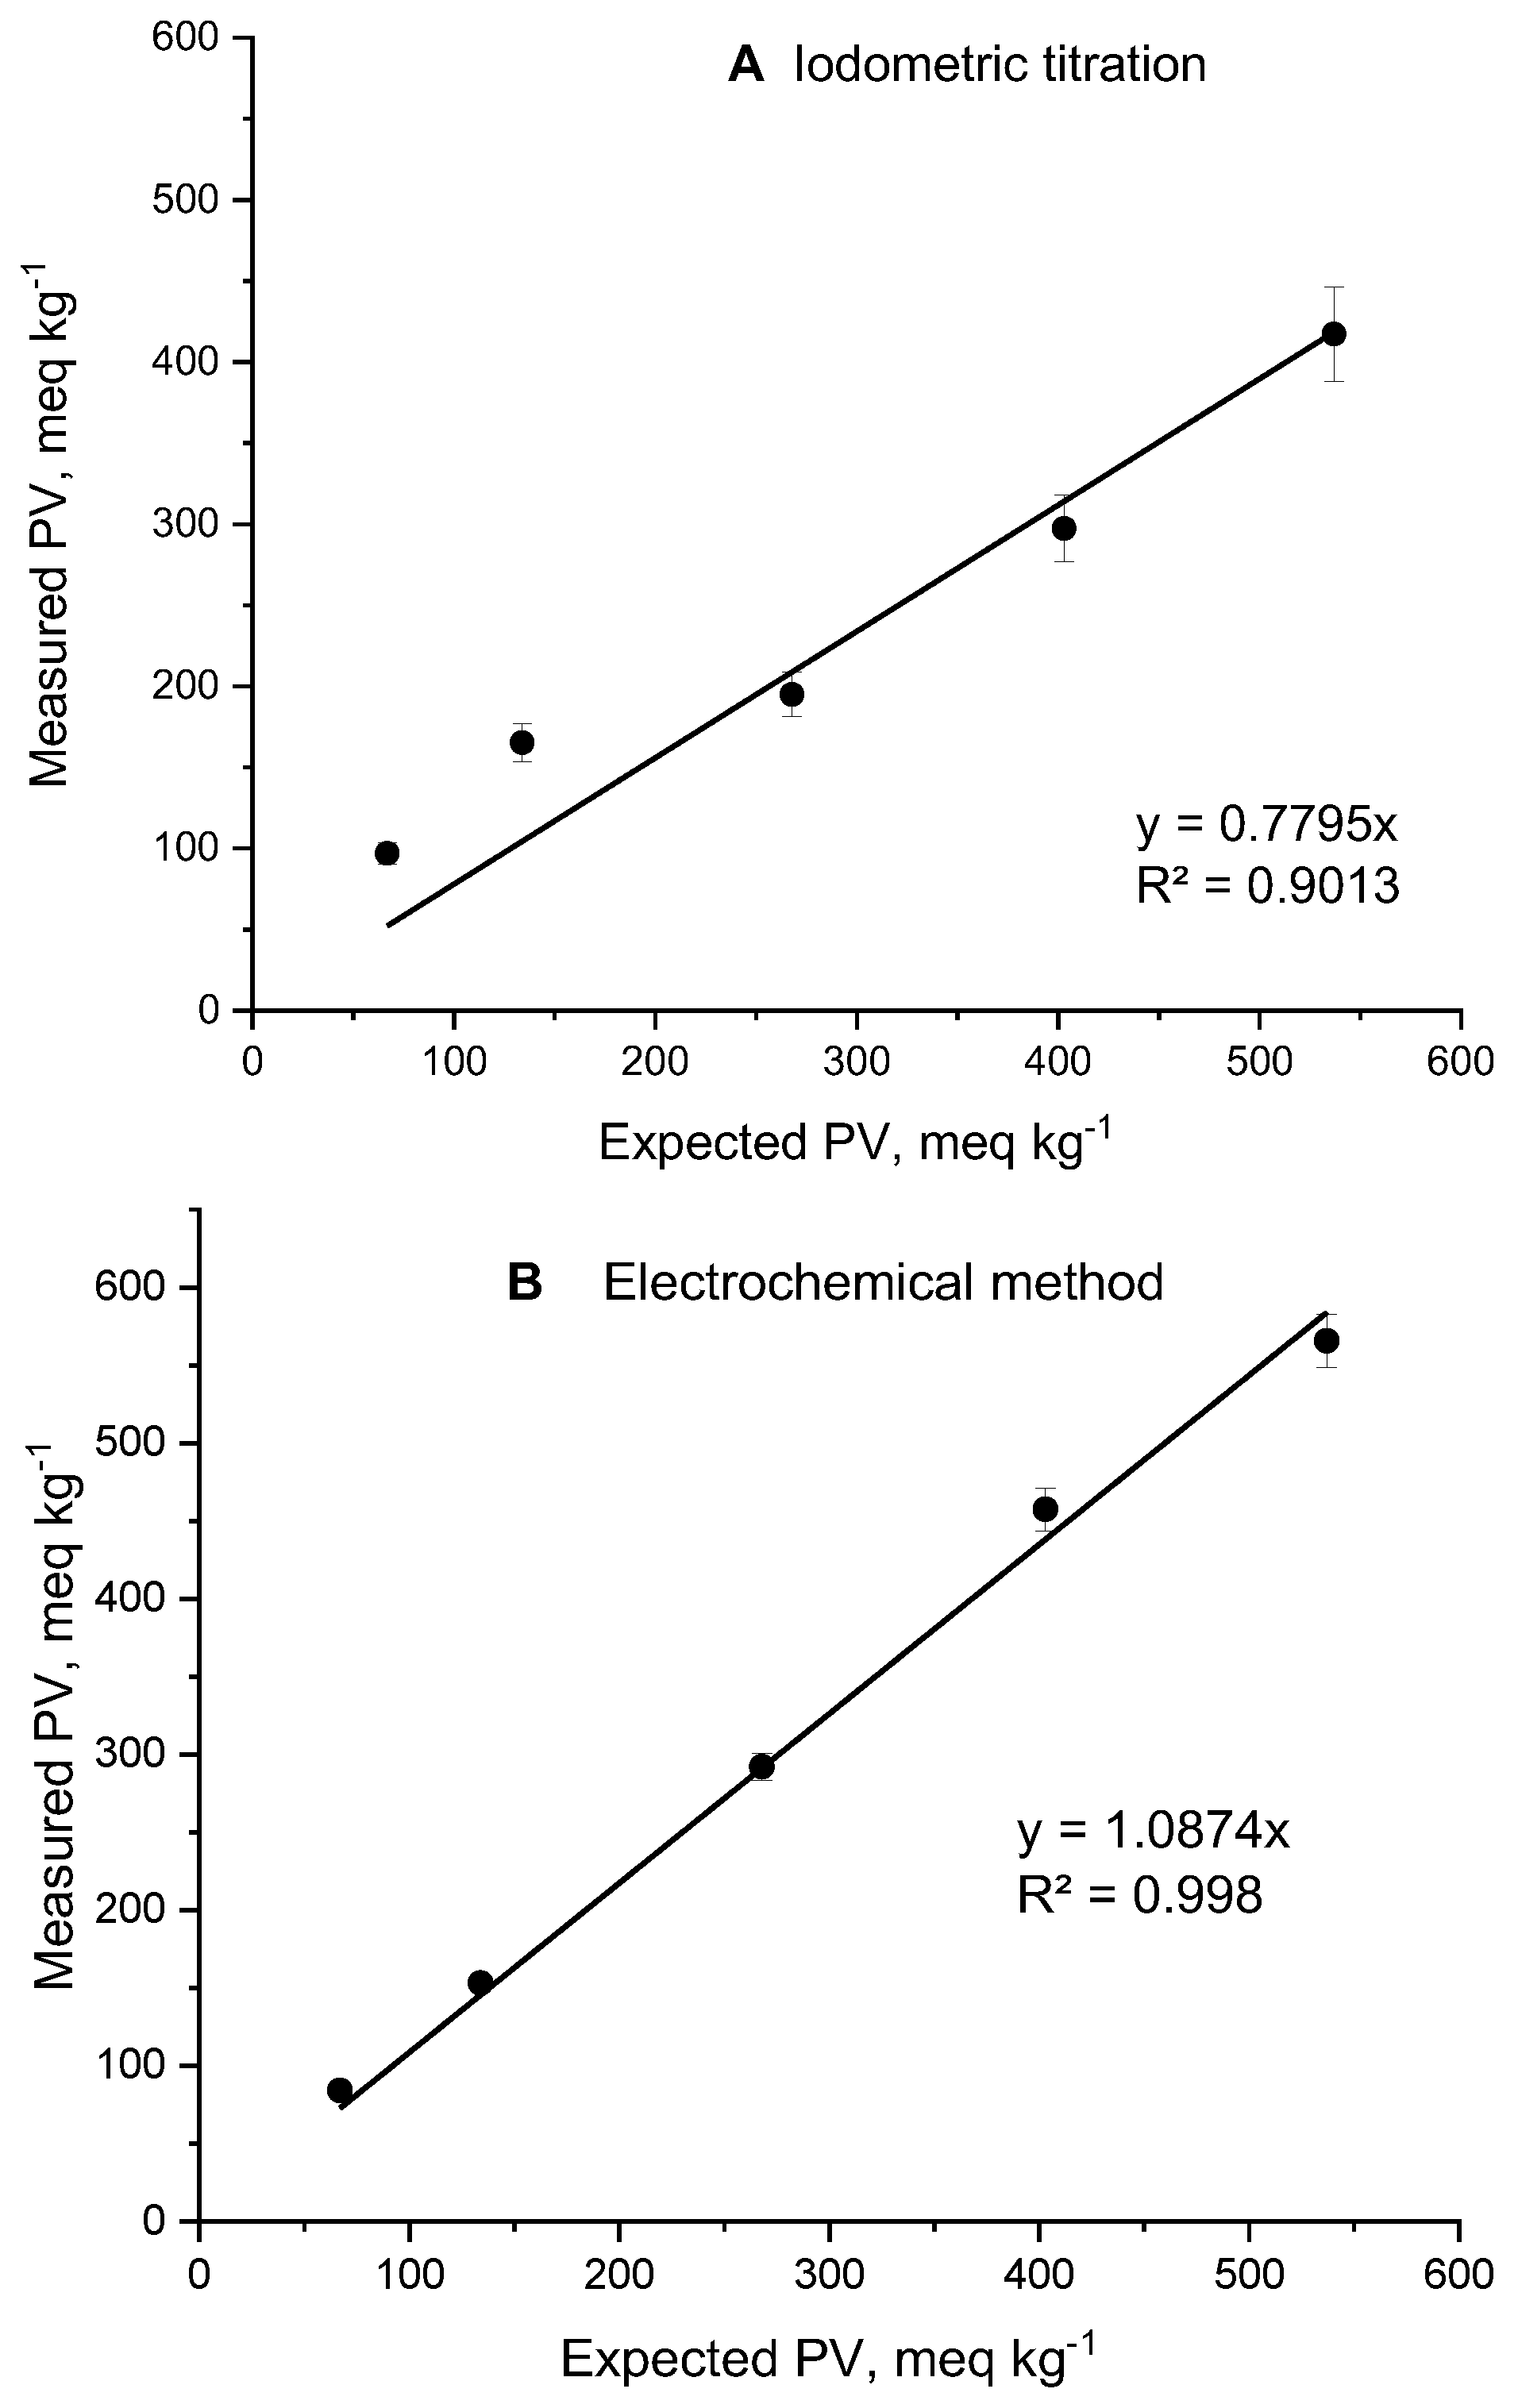
Expected PV, meq O2/kg
(standard solution)
Measured PV,
meq O2/kg by
titrimetric method
Deviation of the titrimetric value from the expected, in % Measured PV, meq O2/kg by
electrochemical method
Deviation of the electrochemically measured PV from the expected, in %
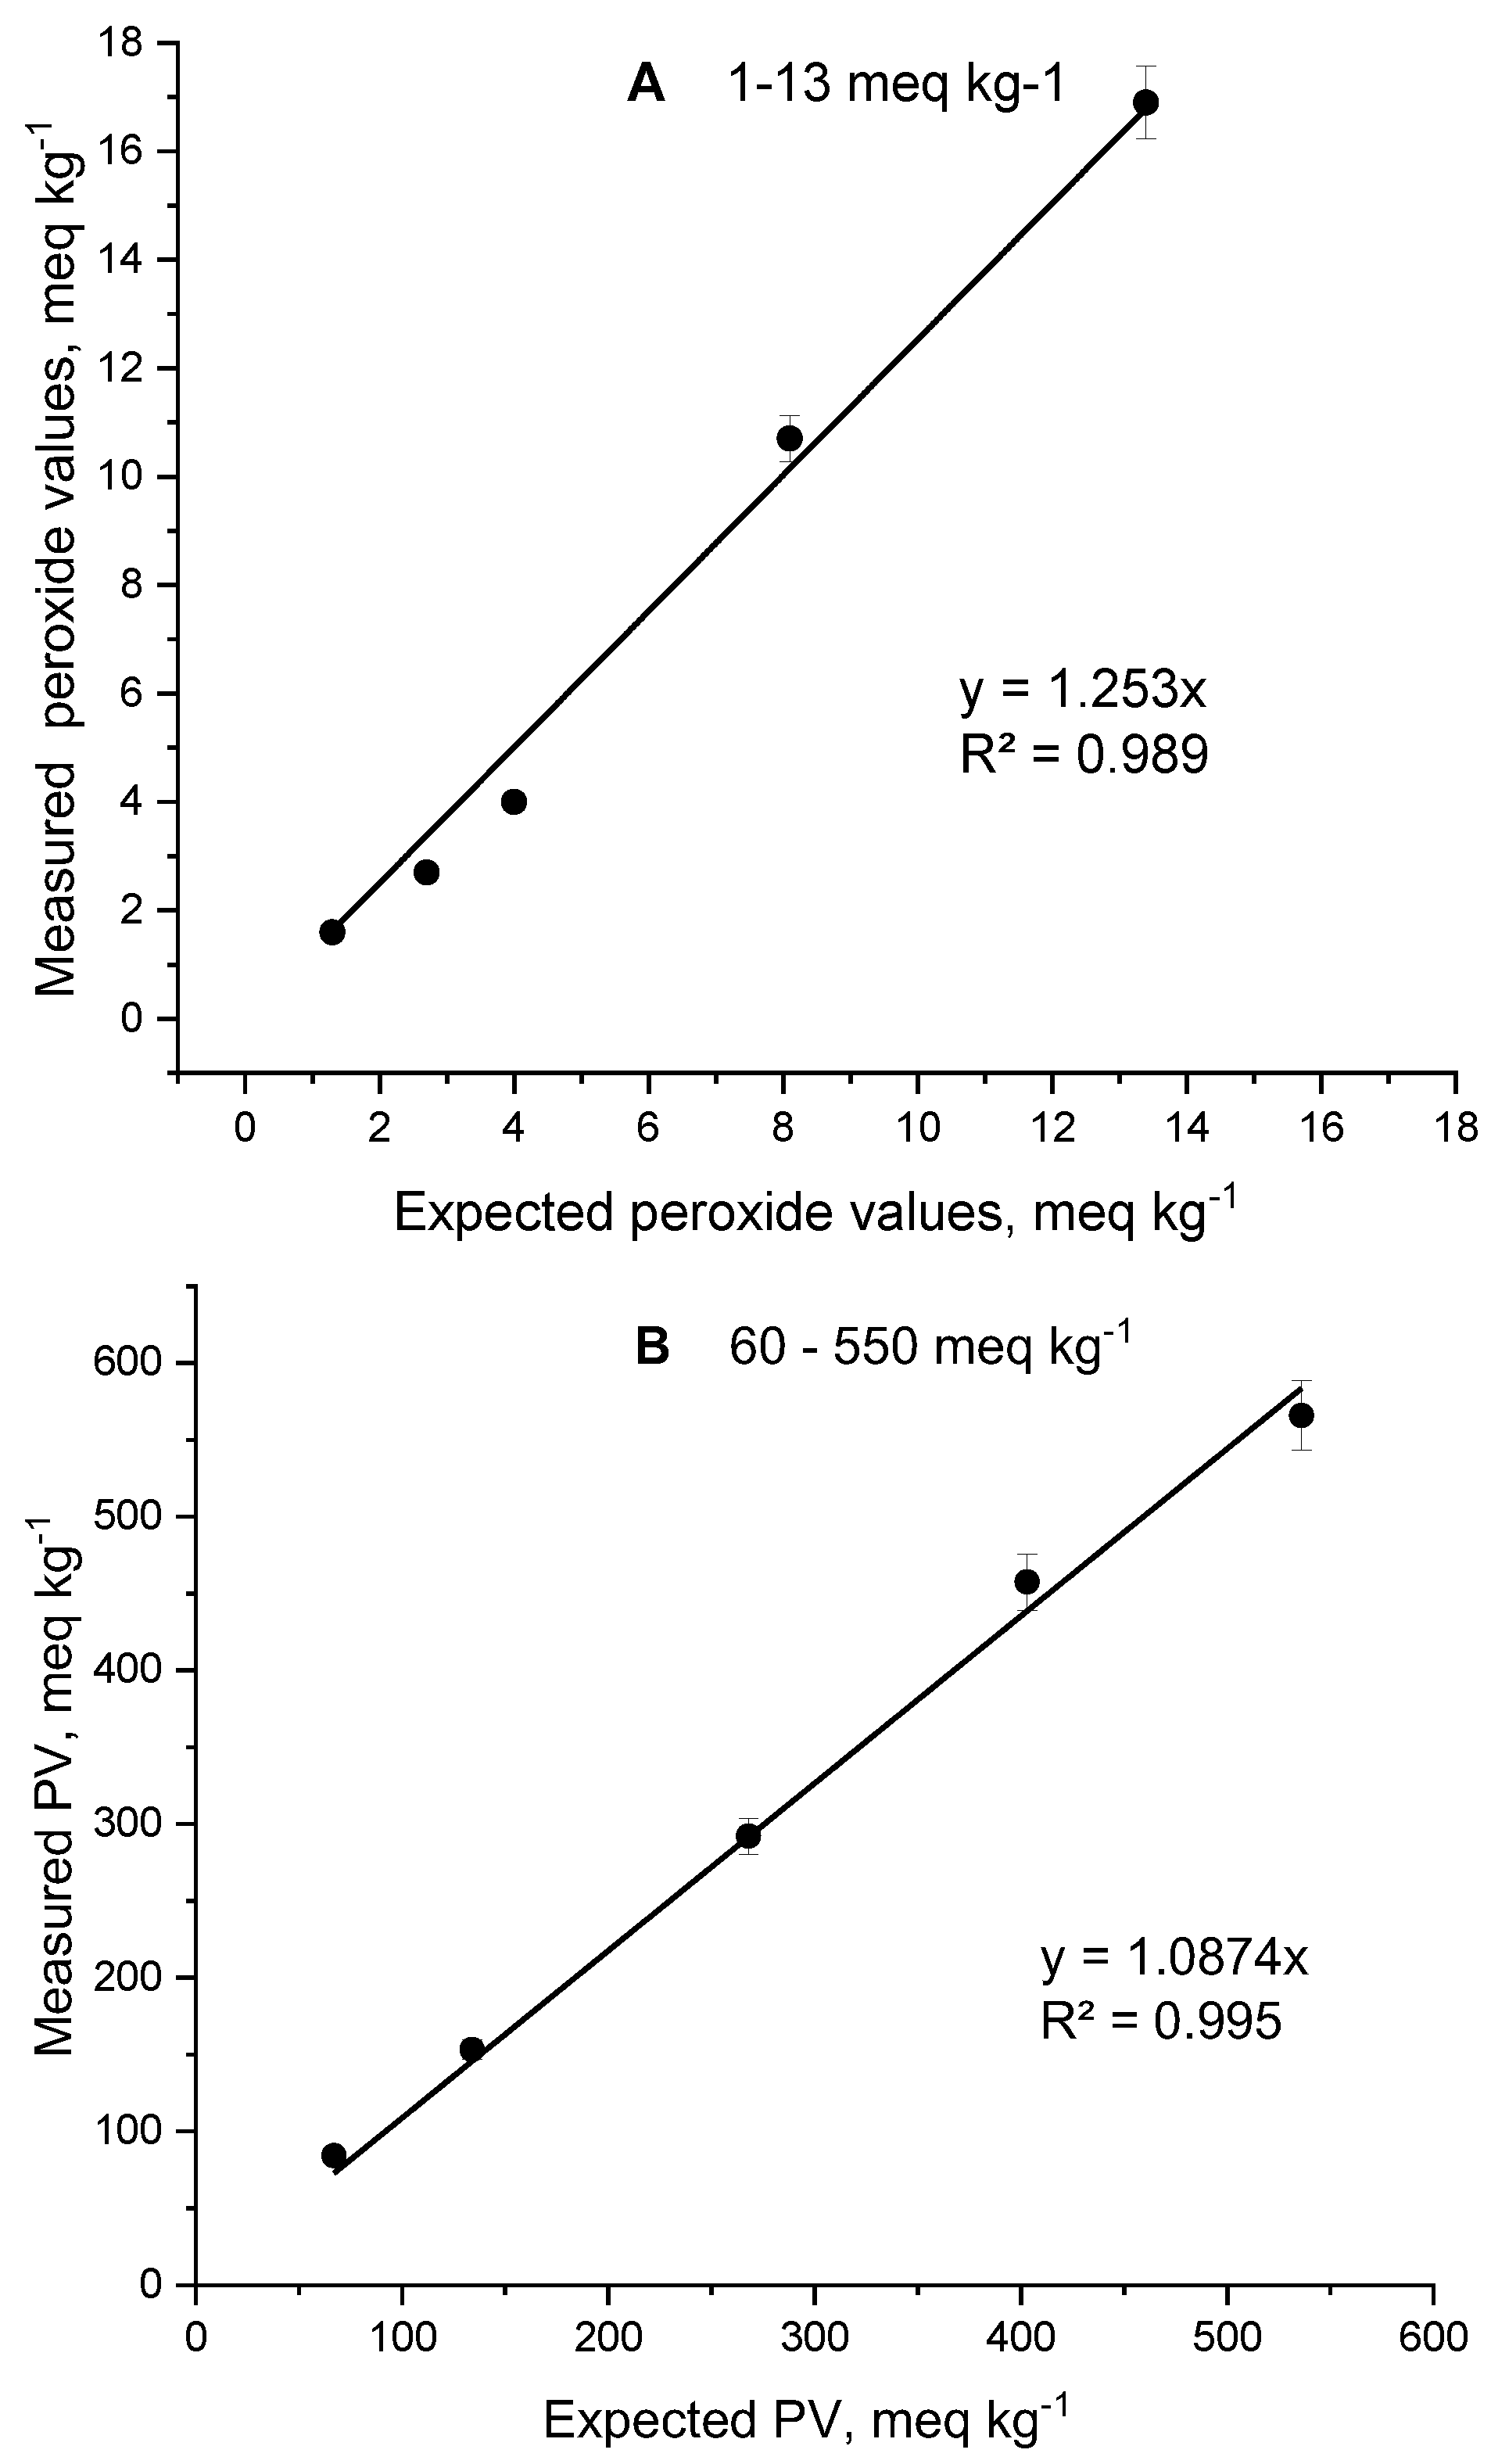
67 97.0 +44.78 84.2 +25.67
134 165.3 +23.36 153.3 +14.40
268 195.0 -27.24 292.1 +8.99
403 297.4 -26.20 457.5 +13.52
537 417.3 -22.29 565.8 +5.36
Table 2. Standards used for calibration of the catalytic peroxide electrode.
Standard solution Volume (BPO/CHCl3), ml with the given concentration, Mass of the weighed oil, g
St1 0.5 ml 1mM BPO/CHCl3 0.4000 ±0.0075
St2 0.5 ml 2mM BPO/CHCl3 0.4000 ±0.0075
St3 0.5 ml 3 mM BPO/CHCl3 0.4000 ±0.0075
St4 0.5 ml 6 mM BPO/CHCl3 0.4000 ±0.0075
St5 0.5 ml 10 mM BPO/CHCl3 0.4000 ±0.0075
Table 3. Scheme for preparing standard solutions.
Standard
solution
Volume (BPO/CHCl3) with certain concentration, ml DF*
Mass of the weighed oil, g
St0 0.5 ml chloroform 1 0.4000 ±0.0075
St1 0.5 ml 50mM BPO/CHCl3 4 0.4000 ±0.0075
St2 0.5 ml 100 mM BPO/CHCl3 10 0.4000 ±0.0075
St3 0.5 ml 200 mM BPO/CHCl3 20 0.4000 ±0.0075
St4 0.5 ml 300 mM BPO/CHCl3 30 0.4000 ±0.0075
St5 0.5 ml 400 mM BPO/CHCl3 50 0.4000 ±0.0075
* DF -dilution factor.
Table 4. Standard solutions prepared for applying the standard addition method.
Standart solution Volume of a highly rancid anti-cellulite oil- Rivana, ml Volume of a standard 10 mM BPO/CHCl3 solution, ml
St 0 0.1 0.000
St1 1.0 0.150
St2 1.0 0.200
St3 1.0 0.250
St4 1.0 0.300
Disclaimer/Publisher’s Note: The statements, opinions and data contained in all publications are solely those of the individual author(s) and contributor(s) and not of MDPI and/or the editor(s). MDPI and/or the editor(s) disclaim responsibility for any injury to people or property resulting from any ideas, methods, instructions or products referred to in the content.
Copyright: This open access article is published under a Creative Commons CC BY 4.0 license, which permit the free download, distribution, and reuse, provided that the author and preprint are cited in any reuse.
Prerpints.org logo

Preprints.org is a free preprint server supported by MDPI in Basel, Switzerland.

Subscribe

Disclaimer

Terms of Use

Privacy Policy

Privacy Settings

© 2025 MDPI (Basel, Switzerland) unless otherwise stated