
Submitted:
16 December 2024
Posted:
18 December 2024
You are already at the latest version
Abstract
Hepatocellular carcinoma (HCC) is the final sequel of prolonged chronic hepatitis B. Integrated networks among cancer cells and various stromal cells exist in the HCC tumor microenvironment (TME) and have a profound impact on the progression of this disease. Emerging evidence depicts that extracellular vesicles (EVs) released by the cells are the potent mediators in this partnership. These vesicles carry cell-specific active molecules such as protein, nucleic acids (DNA, coding and non-coding RNAs), lipids, etc. In this respect, the impact of the hepatitis B virus (HBV) on the packaging of cargo molecules of the infected hepatocytes and its effect on the disease progression has not been investigated. Thus, proteomics analysis was performed in triplicates with the EV protein content of HBV-infected HepG2.2.15, and HepG2-control cells using label-free LC-MS/MS technology and observed 2293 and 677 proteins respectively suggesting HBV-induced 3.4fold more accumulation of proteins in the EVs. Among these, 512 proteins were differentially enriched in the EVs of HepG2.2.15 cells. Pathway analysis performed with 103 proteins which showed intracellular abundance depicted that DNA repair, RNA metabolism, and Golgi trafficking proteins were enriched in the EVs of HepG2.2.15 cells. Protein-protein network and Hub gene analysis identified 10 nodal proteins that could interact with all other proteins in the network. Subsequently, integrated transcription factor (TF)-mRNA- miRNA network analysis and validation revealed that most hub genes were commonly transcriptionally activated by TFDP1-TF. At the same time, miR-1-3p suppressed their expression, suggesting their importance in developing cancer therapeutics.
Keywords:
proteome
; extracellular vesicles
; EVs
; hepatitis B virus
; HBV
1. Introduction
Chronic hepatitis B (CHB) is one of the major health burdens worldwide. Liver cirrhosis (LC) and hepatocellular carcinoma (HCC) are the two ultimate deadly consequences of prolonged CHB [1,2]. Host-virus interactions including viral protein induced immune suppression are the critical players for persistence of CHB. Effective anti-viral or inhibitors of virus specific reverse transcriptase may restrict the viral copy number but it fails to re-establish the original immune milieu resulting progression of CHB towards end stage liver diseases [3,4]. The latest Globocan statistics disclosed liver cancer as third leading cause of cancer related mortality (Globocan’23) because only 5% of early-diagnosed patients with small tumors (multiple nodule of <3 cm in size or one nodule of <5 cm in size) are eligible for curative therapy while multi-tyrosine kinase inhibitors are offered to the advanced patients that extend life expectancy but for 3–6 months only [5,6]. Hence, it is utmost important to understand the pathophysiology of the disease to improve the current therapy regime of advanced HCC patients.
Tumor microenvironment (TME) which composed of tumor cells, stromal cells, infiltrated immune cells, extracellular matrix, cytokines, chemokines, growth factors conjointly promote immune evasion, metastasis and chemo-resistance of HCC [7,8]. In this regard, studies with extra-cellular vesicles (EVs) clearly depicted the role of small EVs like exosomes, which carry cell-specific nucleic acids (DNA, mRNA and miRNA, lncRNA, CirRNA etc.), protein, lipid, etc., participate between cell-to-cell communications in TME [9,10]. Exosomes are phospholipid bilayer-enclosed EVs of size 30–150 nm released by every cell type after fusion of intracellular vesicles to the cell membrane [11]. Thus, these EVs contain specific surface markers such as CD63, CD81, TSG101, ALIX, HSP70, along with the cell type specific markers such as Asialo glycoprotein receptor 1 (ASGR1), observed only on hepatocyte derived EVs [12]. Content of EVs, particularly miRNAs are used as a promising early diagnostic biomarker for various cancers and to relay messages between cells in the TME as well [12,13,14,15,16,17,18,19]. Enrichment of miR-21 in the fibroblast through EVs from HCC cells activate quiescent fibroblasts into cancer associated fibroblasts (CAFs), and promotes secretion of fibrogenic and angiogenic factors such as TGFβ, MMPs, VEGF, etc. [20]. Similar studies have reported M2 polarization of macrophages in tumor milieu by accepting miRNA from EVs of cancer cells through activation of NFκβ pathway [21]. A very few studies have also depicted EVs mediated protein transfer from cancer cells to immune cells that induces polarization of M1 macrophage to anti-inflammatory M2 cells [22].
Here, we have reported for the first time the complete proteome profile of the EVs derived from HBV integrated HepG2.2.15 cell line and compared with HepG2-control cell line to study the impact of HBV on the loading of cargoes to the EVs. The data was compared with the intracellular transcriptome data to classify enrichment of HBV induced intracellularly overexpressed proteins into the EVs, which might have role in TME and HCC progression. As transcriptional regulators are emerging as promising drug targets [23,24], a protein-protein interaction network and integrated transcription factors (TFs)-mRNA-miRNA analysis had been executed to determine hub proteins and to identify their common regulators respectively. Further functional validation revealed that TFDP1-TF could commonly induce expression of 70% of the hub gene while 50% genes were targeted by a common tumor suppressor miRNA, miRNA-1-3p. Thus, detailed mechanistic investigation of the role of these factors in tumor microenvironment may further confirm their potential in HCC therapy.
2. Results
2.1. Comparative Proteome Analysis of EVs Derived from HepG2.2.15 and HepG2-vec Cell Lines
EVs released from HepG2.2.15 and HepG2-vector cells cultured in the exo-free media were isolated using kit form Exocan Private Ltd. Immuno-blot analysis with anti-CD63, anti-Alix antibodies and nanoparticle tracking analysis confirmed the quality and quantity of the EVs (Figure 1a,b). To identify the cellular proteins enriched in the EVs of HBV infected hepatocytes, total protein was isolated using kit and subjected to proteomics analysis (LC/MS) in triplicates. The proteome profiling revealed that total 2293 and 677 proteins were retrieved in the EVs of HepG2.2.15 and HepG2-vec cells respectively implicating number of proteins released in presence of HBV infection were 3.4fold more than the control cells. Next, comparing with the intracellularly upregulated proteins, only 87 proteins were noticed to have differential expression (DE) (|Log2FC|>1, p value < 0.05) in HepG2.2.15 derived EVs than HepG2-vector. Other proteins were remained unaltered intracellularly. Among these 87 proteins, 80 proteins were upregulated in the EVs of HepG2.2.15 cells (>2fold), while 7 proteins were enriched in the EVs of HepG2 cells (>2fold). In addition, 432 proteins were explicitly enriched in the EVs of HepG2.2.15 cells which were absent in HepG2 cells. Thus, total 512 proteins were accumulated in the EVs of HepG2.2.15 cells (Figure 1c). The hierarchical heatmap represents the total DE proteins in the EVs (p < 0.05) (Figure 1d).
2.2. Pathway Analysis with the EV Enriched Proteins
Now, 512 DE proteins were subjected to Gene Ontology (GO) and REACTOME pathway enrichment analysis. GO analysis depicted the biological processes, cellular locations and molecular functions of the EV enriched proteins. Interestingly, biological processes revealed that these proteins were mostly contributed to protein depolymerization, RNA splicing and mRNA processing (UPF2, TCERG1, TBL3, PDCD11, CSTF3, DDX23, DHX16, LUC7L3, THOC2, THOC5) and DNA repair (LIG1, POLD1, EXO1, MLH1, MLH3, MSH3, MSH6) (Figure 2a). Hence, EVs were packaged with nuclear exported and cytosol enriched proteins (Figure 2b,c). In depth molecular function analysis with REACTOME also resonated this result. In addition to RNA metabolism and DNA mismatch repair pathways, proteins functioning in membrane trafficking and vesicle mediated transport (TMF1, RALGAPB, MYO5A, COG1, TRIP11, KIF21A, KIF1B, COPG2) pathways were also loaded in the EVs of HepG2.2.15 cells (Figure 2d).
2.3. Protein-Protein Interaction (PPI) Network Construction and Selection of Hub Genes
Next, the enriched proteins in the EVs of HepG2.2.15 cells were validated with the protein profile of tumor tissue of HBV-HCC (n = 110) vs. adjacent tissue (n = 98) and the data revealed that 103 EV enriched proteins were overexpressed in the liver tissue of HBV-HCC patients. To gain further insight, high degree hub protein(s) were determined with these 103 DE proteins using STRING and Cytoscape tools setting medium confidence score of the PPI at 0.700. The first-order PPI web created an extensive network comprising of 63 nodes and 87 edges with an enrichment P value of 1.11 × 10⁻¹⁶ (Figure 3a). The node proteins exhibited to have significant role in numerous regulatory pathways simultaneously interacting with more partners. Next, the maximal clique centrality (MCC) methods were used to select the hub genes from the PPI network using the CytoHubba plugin with default parameters in Cytoscape. The topological network parameters of MCC identified the highest-ranked 10 hub genes such as PRPF6, XAB2, DHX16, IK, RNF113A, POLD1, MSH6, PDCD11, MSH3 and UTP14A (Figure 3b and Supplementary Table S2).
2.4. Validation and Determination of Impact of the Hub Genes in HCC
Hence, the expression of 10 hub genes were verified in TCGA liver cancer dataset. A significant upregulation of all 10 genes was observed in LIHC tumor compared to adjacent normal. Furthermore, Kaplan-Meier curve analysis and log rank P values for 10 hub genes depicted that except MSH3 the expression level of 9 genes were significantly associated with overall survival of HCC patients (P < 0.05) (Figure 4a). To reinforce the HBV specific hub gene expression, we have reanalyzed the expression of these 9 genes in HBV vs. non-HBV samples of TCGA-LIHC and 4 hub genes namely PRPF6, RNF113A, POLD1 and MSH6 was observed significantly enriched exclusively in HBV infected samples (Supplementary Figure S1). Next, we validated the data by qRT-PCR with intracellular total RNA of HepG2.2.15 and HepG2-vector cells and Huh7 transfected with HBV genome vs. Huh7-control considering that the EV-enriched proteins were overexpressed intracellularly. Out of 7 validated genes, 5 genes showed significant upregulation in presence of HBV (p < 0.05) while two genes (XAB2 and PDCD11) remain unchanged (Figure 4b,c).
2.5. Transcription Factor (TF)-miRNA-mRNA Interaction Network Analysis and Validation
Transcriptional regulators are now emerging as drug targets for cancers [25]. Thus, to understand the mechanism of upregulation of the hub oncogenes, we sought to gain insight into those TFs which could upregulate the hub genes by analyzing ChIPseq data of ENCODE and miRNet2.0. Top five TFs (TFDP1, SP1, NRF1, ZFX, and GTF2E2) were noted to activate commonly the expression of 50–60% of hub genes and TFDP1 showed the highest hit (Figure 5a). To predict their significance in HCC progression, gene expression and survival curve was analysed using TCGA-LIHC data and observed higher expression of each TF in HCC compared to normal. Survival data also supported the fact that high expression of TFs were positively associated with poor prognosis of HCC over the period for 5 years (Figure 5b). In vitro verification of TFDP1 expression disclosed that TFDP1 was overexpressed upon HBV infection in Huh7 cells and anti-sense oligo (ASO) treatment suppressed its expression. Similarly, reduced expression of all 6 hub genes were noted in TFDP1-ASO treated cells (Figure 5c).
Next, miRNet2.0 was used to identify the list of miRNAs that could target these hub genes to understand the post transcriptional regulation. The search criteria were restricted to homo sapiens and only significantly downregulated miRNAs in HCC compared to normal were considered. We obtained a total of 20 miRNAs in HCC which were targeting 10 hub genes. Subsequently, a network was constructed with the top 4 miRNAs and 10 hub genes which depicted that hsa-miR-1-3p alone could target 7/9 of the hub genes, while let7b, miR-124-3p and mir-129-2-3p could target 5, 4 and 3 hub genes respectively (Table 1 and Figure 6a). The expressions and survival analyses were performed with LIHC datasets for these miRNAs and observed that all the four miRNAs were repressed in HCC compared to adjacent liver tissue and restoration of each miRNA showed significant survival of HCC patients (Figure 6b). Here, we validated the sponging efficiency of top miRNA, hsa-miR-1-3p by verifying the expression of the targeted hub genes (PRPF6, DHX16, POLD1, PDCD11, MSH6, XAB2) upon restoration of its expression in Huh7+HBV cells. A significant downregulation of the target genes compared to scramble miRNA transfected cells revealed their binding to the 3′UTR or coding sequences of the genes. (Figure 6c,d).
Finally, we validated the impact of TFDP1 and miR-1-3p in HCC progression by determining the cell proliferation, and expression of EMT and stemness markers in HBV infected Huh7 cells upon treatment of TFDP1-ASO and over expression of miR-1-3p. The data revealed that TFDP1-ASO treatment restricted proliferation of Huh7 cells infected with HBV where TFDP1 was overexpressed (Figure 7a). The expression of EMT and stemness markers were also reduced in same setting of transfection (Figure 7c,e). Restoration of miR-1-3p in Huh7 cells infected with HBV exhibited significantly lowered cell proliferation and reduced expression of both EMT and stemness markers. (Figure 7b,d,f).
Thus, our findings highlight the impact of TFDP1 and miR-1-3p on the enrichment of proteins in the EVs of HBV-HCC.
3. Discusssion
Despite limitation in isolation and characterization methods of EVs, utilization of its content as biomarkers for various diseases and as mediator of cell-to-cell communication in TME have been acknowledged widely [7,8]. Ample of evidences suggest that the enveloped viruses like HBV intervenes the molecular mechanism of EVs generation and exploits the cargoes in the EVs to infect the neighbouring cells [21]. HBV proteins could alter the EV components which includes viral DNA, proteins and cellular nucleic acids, proteins, lipid etc.[24]. Infectious HBV particles are also reported in the HBV infected cell derived EVs [26,27]. But the pattern of HBV infected hepatocyte derived EV content and its impact on disease progression remain unexplored. This is the first report of differentially enriched proteins in the EVs derived from HBV infected HCC cell line. Using label free proteomics analysis of HepG2.2.15 vs. HepG2-vector cells revealed HBV promotes RNA metabolism, DNA repair, and membrane trafficking proteins to be enriched in the EVs indicating viral protein mediated regulation on the externalization of the cellular proteins through EV synthesis and export. Among these numerous exported proteins, hub gene analysis predicted 10 proteins which had potential to interact with other proteins. Subsequently, integrated TF-mRNA-miRNA network analysis and in vitro validation established a common intracellular regulators of hub genes that have impact on TME and/or HCC progression depicting their importance in HCC therapy.
In our study, we assessed the protein content of HepG2.2.15 (HBV positive stable cell line) and HepG2-vector cell derived EVs of sizes 30–150 nm and a total of 2293 and 677 proteins were retrieved in the EVs of the two cell lines respectively suggesting HBV induced almost 3.4 fold more enrichment of proteins in the EVs. To our surprise, when we compared the protein content of the EVs with the intracellular proteins, only 20% showed overexpression in HBV-HCC than normal, while 80% proteins remained unaltered within the cell but managed to be enriched in the EVs of HBV-HCC; the mechanism of which needs to be explored. We focused on upregulated 20% (103 proteins) of the proteins attributing towards RNA metabolism, DNA repair, mRNA splicing etc. HBV usually hijacks host DNA repair machinery to repair its own relaxed circular genome upon entering into the hepatocyte to generate replication competent covalently closed DNA (cccDNA), and viral proteins transcriptionally upregulate the expression of DNA repair proteins [28].The coding and non-coding RNAs are usually escorted by the RNA binding proteins (RBPs) into the EVs [29], thus a large number of RBPs were loaded in the EVs of HBV-HCC. To understand the mechanism of uploading of selective proteins to the EVs, hub gene analysis was employed with intracellularly upregulated 103 proteins in HBV-HCC and identified 10 hub proteins. This data depicted that these 10 proteins might be the major players in intermingling with other proteins. Hence, it was important to understand the mechanism of their intracellular upregulation and exosomal enrichment. Thus, an integrated TF-mRNA-miRNA network analysis was performed. To determine the transcriptional regulation, we focused on 5 top upregulated TFs in HBV-HCC (TFDP1, SP1, NRF1, ZFX, and GTF2E2) which could commonly manipulate the hub genes. The top hit, TFDP1 which target 6/10 genes was validated in silico and in vitro after TFDP1-ASO treatment and all 6 genes were found to be reduced significantly. We were also interested to determine the post transcriptional regulation on 10 hub genes and network analysis predicted 20 down regulated miRNAs in HBV-HCC might be regulating the hub genes. We validated the top hit miRNA, miR-1-3p, which commonly targeting 7/10 genes. In silico validation in TCGA-LIHC dataset along with in vitro restoration in HBV-HCC cell lines and reduction of the hub gene expression revealed that miR-1-3p could be also a master regulator.
Thus, the overall study depicted that the DNA repair, RNA metabolism and Golgi trafficking proteins are mostly loaded in the EVs derived from HBV-HCC cell lines and these proteins are either overproduced by the intracellular machinery or proteins are escorted by other proteins into the EVs. The role of RBPs in this regard may be indispensable, though further characterization is required. Protein network analysis for the hub genes and their common regulators could be considered as cancer biomarker or the development of HBV-HCC therapeutic, though further functional validation is required.
4. Materials and Method
4.1. Maintenance of Cell Lines
Huh7, HepG2-Vector and HepG2.2.15 (HBV producing stable cells) cells were maintained in Dulbecco’s modified Eagle’s medium (DMEM, Himedia, #AL700A) containing 10% heat inactivated FBS (ThermoScientific, # 26140079), Penstrep glutamine (100X, ThermoScientific, # 10378-016) at 37 °C in a humidified chamber containing 5% CO2. HepG2.2.15 cell was a kind gift from Prof. Shyam Kottili, University of Maryland, USA.
4.2. Plasmid Information
The premiRNA clone of miR-1 in pRNAU6.1RNA/Neo vector was a kind gift from Prof. Raghunath Chatterjee, Indian Statistical Institute, Kolkata, India.
4.3. Cell Culture, and Transfection
The full-length, linear monomeric HBV DNA of subgenotype-D1 was released from pJET1.2/blunt vector by digestion with 1U of SapI/µg at 37 °C for 12 hours, followed by gel purified using QIAquick gel extraction kit (Qiagen, # 28704). Huh7 (2 × 10⁵) cells seeded on 24-well plates were individually transfected with 200 ng of the HBV/D1-monomer using Lipofectamine 2000 (Thermo Fisher Scientific, # 11668019). The culture medium was replaced with fresh DMEM at six hours post-transfection. Cells were harvested after 48h of transfection. 100 ng of pPremir-1 and TFDP1-anti-sense oligo (ASO) were transfected in Huh7 cells seeded in 24well and harvested after 48 h. Each experiment was set in triplicate and repeated twice.
4.4. Isolation of RNA and Quantitative RT-PCR
Total RNA was isolated using RNAiso Plus (Takara, # 9108/9109) and about 2.5 µg/0.5 µg of total RNA was used for cDNA synthesis for mRNA/miRNA using Verso cDNA synthesis kit (ThermoScientific # AB1453A)/miScript PCR Starter Kit (Qiagen, catalog#218193) following manufacturer’s protocols. qRT-PCR was performed with PowerUpTMSYBRTM Green PCR master mix (ThermoFisher) in QuantStudio7 (Thermo) and analysis was performed as fold change in expression of genes using the formula 2−ΔΔCt, where ΔCt = (CtGene − Ct Internal control). Sequences of primers are presented in Table 2.
4.5. Isolation of EVs
Both HepG2-vector and HepG2.2.15 cells were cultured in 3.5 mL of DMEM with 10% exosome depleted serum (Gibco, #A27208-03) for 72 h in T25 flask. Media was collected and centrifuged for 20 min at 5000 RPM to pellet down the cellular debris and other contaminants. The supernatant was filtered with 0.22 μm filter and subjected to EVs isolation using kit from ExoCan Healthcare Technologies Pvt. Ltd. following manufacturer’s protocol. Briefly, solution A (100 μL/4 mL media) and solution B (2 mL/4 mL media) were added, mixed and centrifuged at 5000 rpm for 1h. EVs pellet (soluble protein free) were washed twice with 1ml of PBS for 10 min and the final pellet was suspended in 200 μL of filtered PBS for subsequent analysis.
4.6. Isolation of EV Proteins
Isolated EVs were subjected to protein extraction using ExoLyseP (ExoCan Healthcare Technologies Pvt. Ltd, India) following manufacturer’s protocol. Briefly, 50 μL of lysis buffer (ExoLyseP) and 5 μL of protease inhibitor (10×) were added to resuspend the EVs pellet. The mixture was incubated at 95 °C for 10min and then chilled in ice for 5 min to lyse the EVs. The lysate was centrifuged at 8000 rpm for 5 min, collected supernatant and preserved at −80 °C freezer in small aliquot.
4.7. Western Blot Analysis
For Western blot analysis, EVs’ protein was quantified using Bradford reagent (Sigma, #B6916). About 25 μg of protein was boiled with 5× Laemmli buffer for 5 min prior to load on gel. Proteins were separated on 15% SDS-PAGE and transferred onto PVDF membrane (Amersham Biosciences, #GE10600023). After blocking with 5% skimmed milk, the membranes were incubated with primary anti-CD63 antibody (Novus,#NBP2,42225) and anti-Alix(Santa Cruz,#SC53538) at 1:1,000 dilution for overnight. It was then washed with TBS-T, and incubated with secondary antibody (Cell Signaling Technology #7076) at 1:5000 for 1 h at room temperature, washed and developed using chemi-luminescence kit (Pierce, #32106).
4.8. Proteomics Analysis: Exosomal Protein Quantification and Digestion
EV-protein was subjected to Liquid chromatography-mass spectrometry (LC-MS) analysis from Sandor Proteomics Private Limited, Hyderabad. In brief, equal amount of protein (100 μg) from respective EVs were diluted with 100 mM ammonium bicarbonate (NH4HCO3). The sample was briefly centrifuged, and treated with 250 mM DTT, vortexed gently and incubated at 95 °C for 1 h. Then Iodoacetamide (250 mM) was added, briefly vortexed and incubated in the dark at room temperature for 45 min. Trypsin was added and digested at 37 °C in a dry bath overnight. The resulting sample was vacuum dried and dissolved in 50 µL of 0.1% formic acid. After centrifugation at 10,000× g the supernatant was collected into a separate tube.
4.9. NanoUPLC-MSEacquisition
The nanoscale LC separation of tryptic peptides was performed using an ACQUITY UPLC system (Waters Corp., USA). The separation of all samples was performed on ACQUITY UPLC BEH C18 column (Waters, USA) (150 mm × 2.1 mm × 1.7 µm), an analytical reversed-phase column (Waters, USA). 10 µL injection volume was used on BEH C18 UPLC column for separation of peptides. The samples were initially transferred to the pre-column using an aqueous 0.1% formic acid with a flow rate of 30 mL/min for 1 min. Mobile phase A consisted of 0.1% formic acid in water, and mobile phase B consisted of 0.1% formic acid in acetonitrile. The peptides were separated using a gradient of 2–80% mobile phase B for 45 min. The column was re-equilibrated to the initial conditions for 15 min. All samples were analyzed in triplicates.
The tryptic peptides were analyzed using a Synapt G2 HDMS™ mass spectrometer (Waters, Manchester, UK) with a hybrid quadrupole/ion mobility/orthogonal acceleration time-of-flight (oa-TOF) geometry.
4.10. Data Processing and Protein Identification
The raw data acquired from the instrument was processed using PLGS software 3.0.2 (Supplementary Table S1) and each peptide sequence in FASTA format was matched against the UniProtKB/Swiss-Prot obliged sequences. The criteria considered for analysis were (i) peptide tolerance of 50 ppm, (ii) fragment tolerance of 100 ppm, and (iii) minimum number of fragments match for peptides and proteins were 2 and 5 respectively. Minimum number of peptide matches for proteins were two. One missed cleavage site was allowed, and the fixed modification of carbamidomethyl-C and oxidation of M were specified. The identification of the protein was performed with a maximum 5% False discovery rate (FDR) in at least three technical replicate injections. For identification and quantification of protein level, the observed intensity was normalized with the intensity of the identified peptides of the digested internal standard. Proteins with ≥ log2fold change were considered and protein tables generated by PLGS were merged. The raw file has been deposited to ProteomeXchange Consortium via The PRIDE partner repository with the dataset identifier PXD056246”.
4.11. In Silico Computational Analysis
Proteins identified in all three replicates of EVs derived from HepG2.2.15 vs. HepG2-vector were only counted in this study. Proteins identified in either two or one replicate of any sample were considered as background noise. After analysis, the data was validated using various public datasets such as (i) liver tissue proteomics of HBV-HCC patients, and (ii) Exocarta, a collection of exosomal components (mRNA, lncRNA, miRNA, circRNA, proteins) used to validate enrichment of proteins.
4.12. Bioinformatics Analysis
GO and KEGG pathway analysis were conducted to identify differentially expressed proteins at the biologically active pathways. “DAVID” was used to integrate functional genomic annotations.
4.13. Construction of PPI (protein-protein interaction) and Analysis of Hub Genes
PPI network with identified proteins was constructed using STRING. Genes scoring ≥ 0.4 were selected from the STRING database to build a network model visualized by Cytoscape (v3.7.2). The Maximal Clique Centrality (MCC) algorithm was used for identifying hub nodes in a co-expression network. A Cytoscape plugin, CytoHubba was used to determine each node's MCC and Hub genes were selected (Supplementary Table S2)
4.14. Survival Analysis and Gene Expression in Liver Cancer
UALCAN, an easy to use web portal was utilized for gene expression profiling and overall survival analysis (http://gepia.cancer-pku.cn/) by using TCGA-LIHC data. The survival-related hub genes with log-rank p < 0.05 were regarded as statistically significant. OncoDB, a popular database for oncovirus analysis was used.
4.15. Prediction of MicroRNAs and Transcription Factors (TFs) Interacting with Hub Genes
To predict miRNA and TFs targeting hub genes, miRNet 2.0 (https://www.mirnet.ca) database was considered. Binding of miRNAs to the target sequence was confirmed by RNA-hybrid analysis. The expression levels of miRNA in the miRNA-mRNA network were verified by CancerMIRNome (http://bioinfo.jialab-ucr.org/CancerMIRNome) by using TCGA-LIHC database.
4.16. Cell Proliferation
Huh7 cells were co-transfected with HBV and either premiR-1/scramble miRNA or anti-TFDP1 oligo/scramble oligo in 24 well. After 24 h, about 1000 cells were transferred to 96 well in triplicate and cell proliferation was quantified using WST1 Kit (Merck) at different time points.
4.17. Statistical Analysis
SPSS software was used to analyze data. Fisher’s exact test was performed to compare the enrichment of the differentially expressed proteins. Student’s t-test was used for gene expression analysis in GraphPad Prism. P value < 0.05 was taken as significant.
Supplementary Materials
The following supporting information can be downloaded at: www.mdpi.com/xxx/s1.
Author Contributions
Conceived the idea, designed experiments, analyzed data and drafted the manuscript, I.D. and S.B.; performed all of the assays, and bioinformatics analysis, I.D. and S.S.; RNA hybrid analysis, A.D.; read the manuscript critically, A.C. and S.D.; finalized the manuscript, S.B. All authors have read and agreed to the published version of the manuscript.
Funding
The Department of Biotechnology, Government of India supported this study through research grant #BT/PR32493/MED/29/1492/2020.
Institutional Review Board Statement
Not applicable.
Informed Consent Statement
Not applicable.
Data Availability Statement
The data presented in the manuscript for this study may be available upon request to the corresponding author.
Acknowledgments
Authors acknowledged Multidisciplinary Research Unit (MRU) of IPGME&R, Kolkata for providing instrument facility as required. I.D. and A.D. are the recipients of fellowships from University Grant Commission, Government of India and Department of Biotechnology, Government of India respectively.
Conflicts of Interest
The authors declare no conflict of interest.
Abbreviations:
| CHB | Chronic hepatitis B |
| HCC | Hepatocellular carcinoma |
| LC | Liver cirrhosis |
| HBV | Hepatitis B virus |
| MDSC | Monocyte derived suppressor cells |
| NK | Natural killer |
| EV | Extracellular vesicle |
| CAF | Cancer associated fibroblast |
| TF | Transcription factor |
| DE | Differential expression |
| GO | Gene ontology |
| ncRNA | Non-coding RNA |
| RBP | RNA binding protein |
References
- Russo FP, Zanetto A, Pinto E, Battistella S, Penzo B, Burra P, et al. (2022). Hepatocellular Carcinoma in Chronic Viral Hepatitis: Where Do We Stand? Int J Mol Sci. Jan 2;23(1):500.
- Stein LL, Loomba R. (2009). Drug targets in hepatitis B virus infection. Infect Disord Drug Targets. 9(2):105-16. [CrossRef]
- Cho HJ, Cheong JY. (2021). Role of Immune Cells in Patients with Hepatitis B Virus-Related Hepatocellular Carcinoma. Int J Mol Sci. 27;22(15):8011. [CrossRef]
- Sangro B, Sarobe P, Hervás-Stubbs S, Melero I. (2021). Advances in immunotherapy for hepatocellular carcinoma. Nat Rev Gastroenterol Hepatol. 18(8):525-543. [CrossRef]
- Pons F, Varela M, Llovet JM. (2005). Staging systems in hepatocellular carcinoma. HPB (Oxford). 7(1):35-41. [CrossRef]
- Isola AL, Chen S. (2017). EVs: The Messengers of Health and Disease. Curr Neuropharmacol. 15(1):157-165.
- Li Z, Zhang Z, Fang L, Zhao J, Niu Z, Chen H, et al.(2023). Tumor Microenvironment Composition and Related Therapy in Hepatocellular Carcinoma. J Hepatocell Carcinoma.10:2083-2099. [CrossRef]
- Sas Z, Cendrowicz E, Weinhäuser I, Rygiel TP. (2022). Tumor Microenvironment of Hepatocellular Carcinoma: Challenges and Opportunities for New Treatment Options. Int J Mol Sci.23(7):3778. [CrossRef]
- Barile L, Vassalli G. (2017). EVs: Therapy delivery tools and biomarkers of diseases. Pharmacol Ther. 174:63-78.
- Witwer KW, Wolfram J. (2021). Extracellular vesicles versus synthetic nanoparticles for drug delivery. Nat Rev Mater. 6(2):103-106. [CrossRef]
- Van Niel G, D'Angelo G, Raposo G. (2018). Shedding light on the cell biology of extracellular vesicles. Nat Rev Mol Cell Biol. 19(4):213-228. [CrossRef]
- Ghosh S, Bhowmik S, Majumdar S, Goswami A, Chakraborty J, Gupta S, et al. (2020) The exosome encapsulated microRNAs as circulating diagnostic marker for hepatocellular carcinoma with low alpha-fetoprotein. Int J Cancer. 147(10):2934-2947. [CrossRef]
- Wu SC, Kuo PJ, Rau CS, Wu YC, Wu CJ, Lu TH, et al. (2021). Subpopulations of EVs purified via different exosomal markers carry different microRNA contents. Int J Med Sci.18(4):1058-1066.
- Dai J, Su Y, Zhong S, Cong L, Liu B, Yang J, et al. (2020). EVs: key players in cancer and potential therapeutic strategy. Signal Transduct Target Ther. 5(1):145.
- Mashouri L, Yousefi H, Aref AR, Ahadi AM, Molaei F, Alahari SK. (2019). EVs: composition, biogenesis, and mechanisms in cancer metastasis and drug resistance. Mol Cancer.18(1):75. [CrossRef]
- Sandfeld-Paulsen B, Jakobsen KR, Bæk R, Folkersen BH, Rasmussen TR, Meldgaard P, Varming K, Jørgensen MM, Sorensen BS. Exosomal Proteins as Diagnostic Biomarkers in Lung Cancer. J Thorac Oncol. 2016 Oct;11(10):1701-10. [CrossRef]
- Tang Q, Xiao X, Li R, He H, Li S, Ma C. (2022). Recent Advances in Detection for Breast-Cancer-Derived EVs. Molecules. 27(19):6673. [CrossRef]
- Salciccia S, Frisenda M, Bevilacqua G, Gobbi L, Bucca B, Moriconi M, et al. (2023). Exosome Analysis in Prostate Cancer: How They Can Improve Biomarkers' Performance. Curr Issues Mol Biol. 45(7):6085-6096. [CrossRef]
- Fang X, Lan H, Jin K, Qian J. (2023). Pancreatic cancer and EVs: role in progression, diagnosis, monitoring, and treatment. Front Oncol.13:1149551.
- Zhou XL, Xu H, Liu ZB, Wu QC, Zhu RR, Liu JC. (2018). miR-21 promotes cardiac fibroblast-to-myofibroblast transformation and myocardial fibrosis by targeting Jagged1. J Cell Mol Med. 22(8):3816-3824. [CrossRef]
- Xu WX, Wang DD, Zhao ZQ, Zhang HD, Yang SJ, Zhang Q, et al. (2022). Exosomal microRNAs shuttling between tumor cells and macrophages: cellular interactions and novel therapeutic strategies. Cancer Cell Int.22(1):190. [CrossRef]
- Tan S, Tang H, Wang Y, Xie P, Li H, Zhang Z, et al. (2023). Tumor cell-derived EVs regulate macrophage polarization: Emerging directions in the study of tumor genesis and development. Heliyon.9(9):e19296.
- Wang J, Cao D, Yang J. (2020). EVs in Hepatitis B Virus Transmission and Related Immune Response. Tohoku J Exp Med. 252(4):309-320.
- Liu Z, Li Y, Wang Y, Bai X, Zhang Y. (2023). EVs in HBV infection. Clin Chim Acta. 538:65-69.
- Bushweller JH. Targeting transcription factors in cancer - from undruggable to reality. (2019). Nat Rev Cancer. Nov;19(11):611-624. [CrossRef]
- Jia X, Chen J, Megger DA, Zhang X, Kozlowski M, Zhang L, et al. (2017). Label-free Proteomic Analysis of EVs Derived from Inducible Hepatitis B Virus-Replicating HepAD38 Cell Line. Mol Cell Proteomics. 2017 Apr;16(4 suppl 1):S144-S160. doi: 10.1074/mcp.M116.063503. Epub 2017 Feb 27. [CrossRef]
- Wu Q, Glitscher M, Tonnemacher S, Schollmeier A, Raupach J, Zahn T, et al. (2023). Presence of Intact Hepatitis B Virions in EVs. Cell Mol Gastroenterol Hepatol.15(1):237-259.
- Wei, L., Ploss, A. (2021). Hepatitis B virus cccDNA is formed through distinct repair processes of each strand. Nat Commun 12, 1591. [CrossRef]
- Wang T, Zhang H. (2023). Exploring the roles and molecular mechanisms of RNA binding proteins in the sorting of noncoding RNAs into EVs during tumor progression. J Adv Res. S2090-1232(23)00368-5.
Figure 1.
Characterization of EVs and its enriched proteins. EVs isolated from HepG2.2.15 and HepG2-vector were subjected to (a) protein extraction and immune blot analysis with anti-CD63, anti alix antibody and (b) Nanoparticle tracking analysis (NTA). (c) The flow diagram of proteomics analysis was performed with exosome enriched proteins and (d) Hierarchical clustering analysis with differentially expressed (DE) proteins (log2fold change > ±1, p < 0.05) displayed in heatmap.
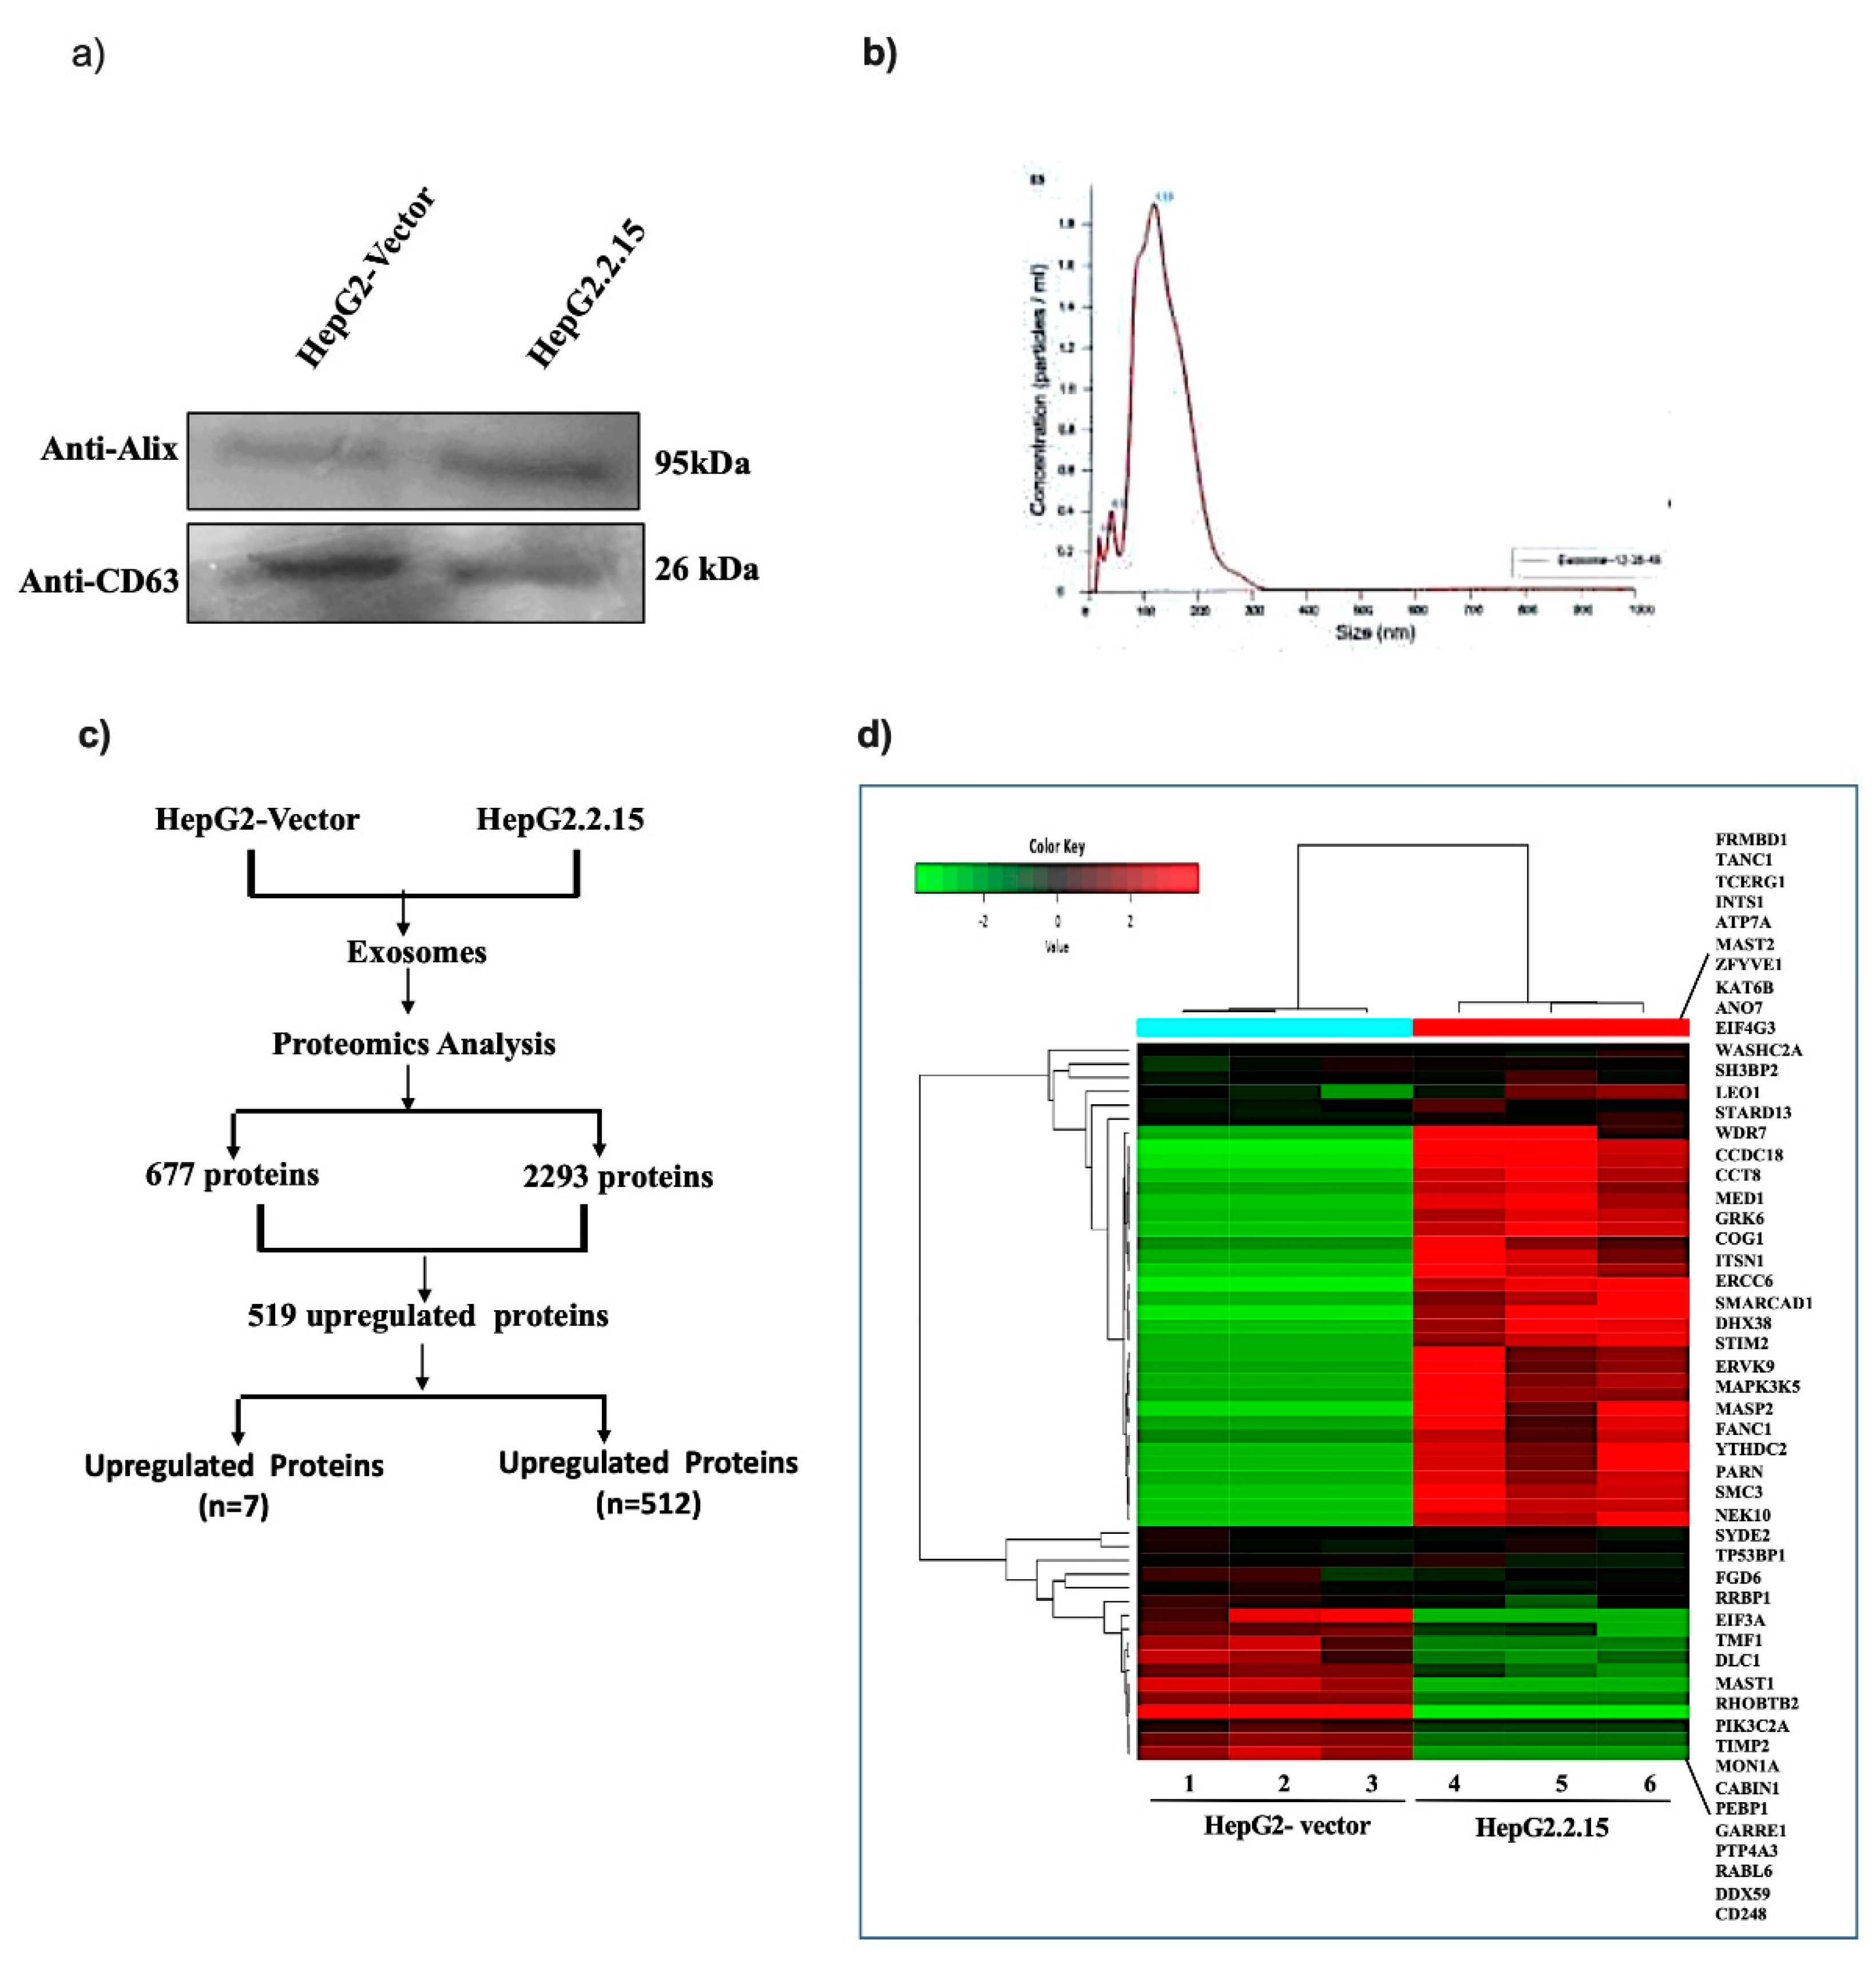
Figure 2.
Identification of pathways and molecular function of DE proteins. (a) Biological processes, (b) Cellular components, (c) Molecular function and (d) REACTOME pathway.
Figure 2.
Identification of pathways and molecular function of DE proteins. (a) Biological processes, (b) Cellular components, (c) Molecular function and (d) REACTOME pathway.
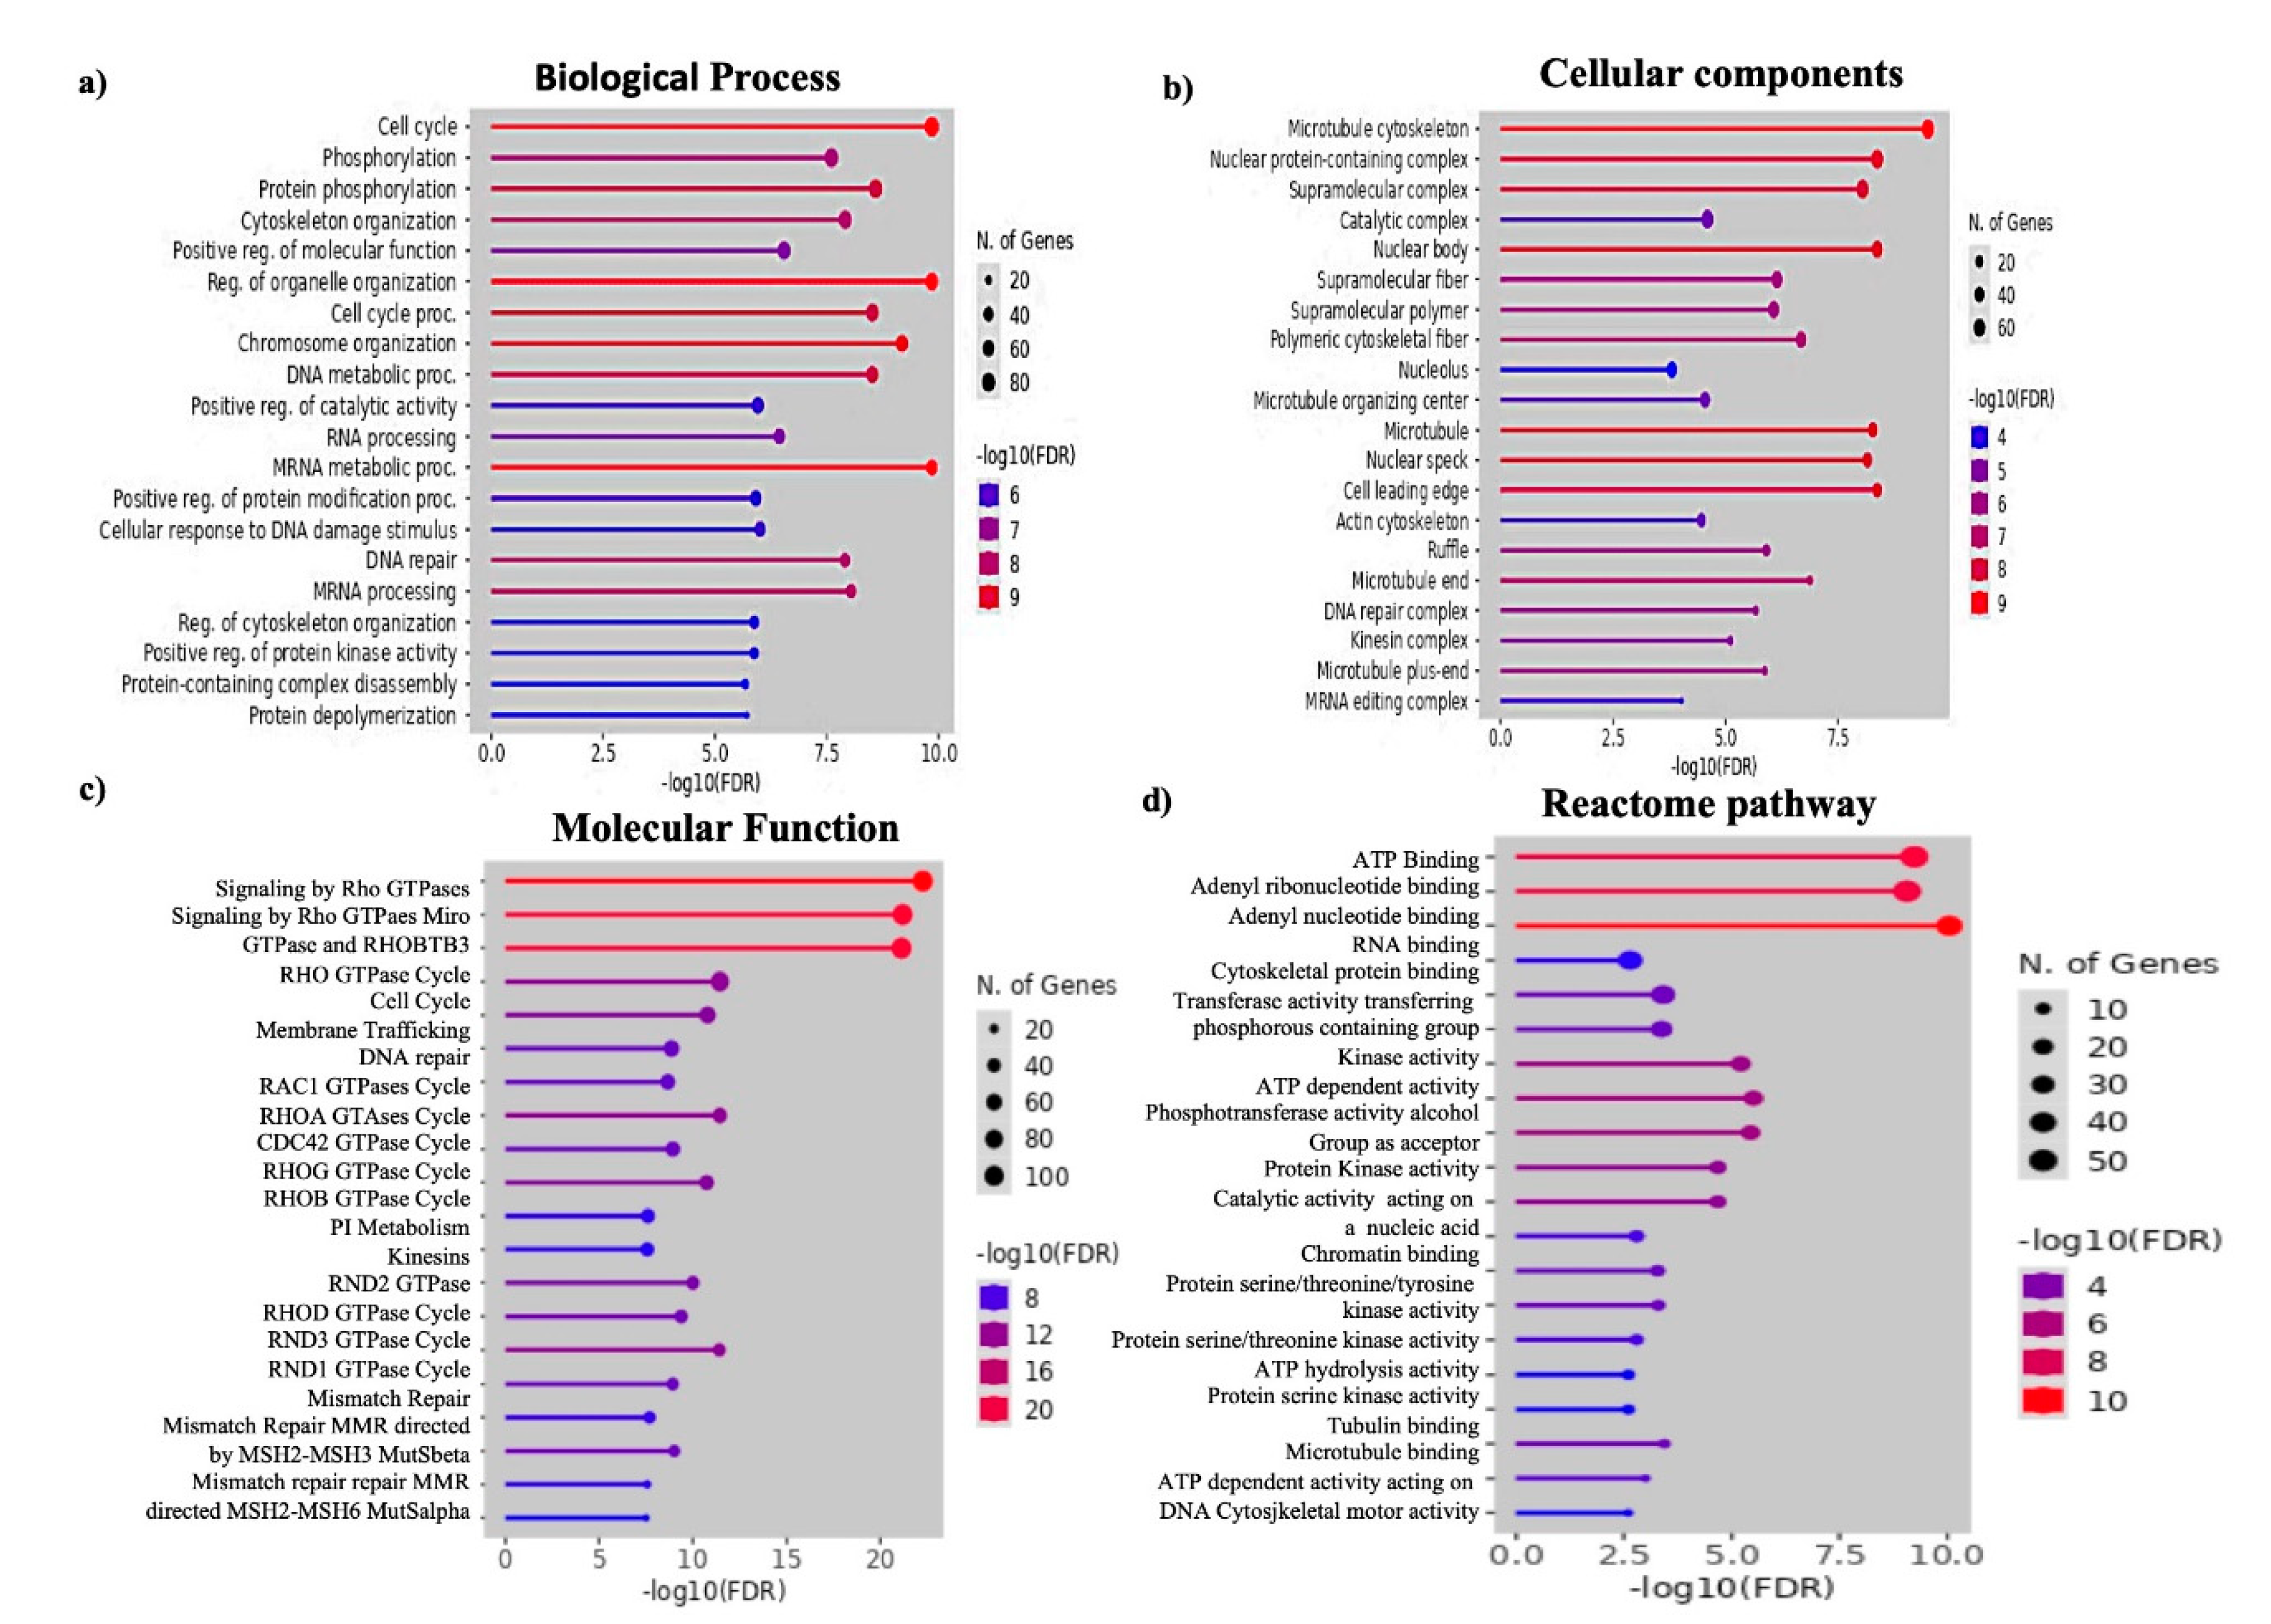
Figure 3.
Protein-Protein interaction network and Hub gene analysis. (a) STRING database was used to predict interactions among the DE proteins. Nodes represent the proteins in biological networks while edges communicate information about the link between nodes. (b) Hub gene analysis to identify the proteins that interact with myriads of proteins and most closely associated with the disease. Top ten hub genes are presented in the table.
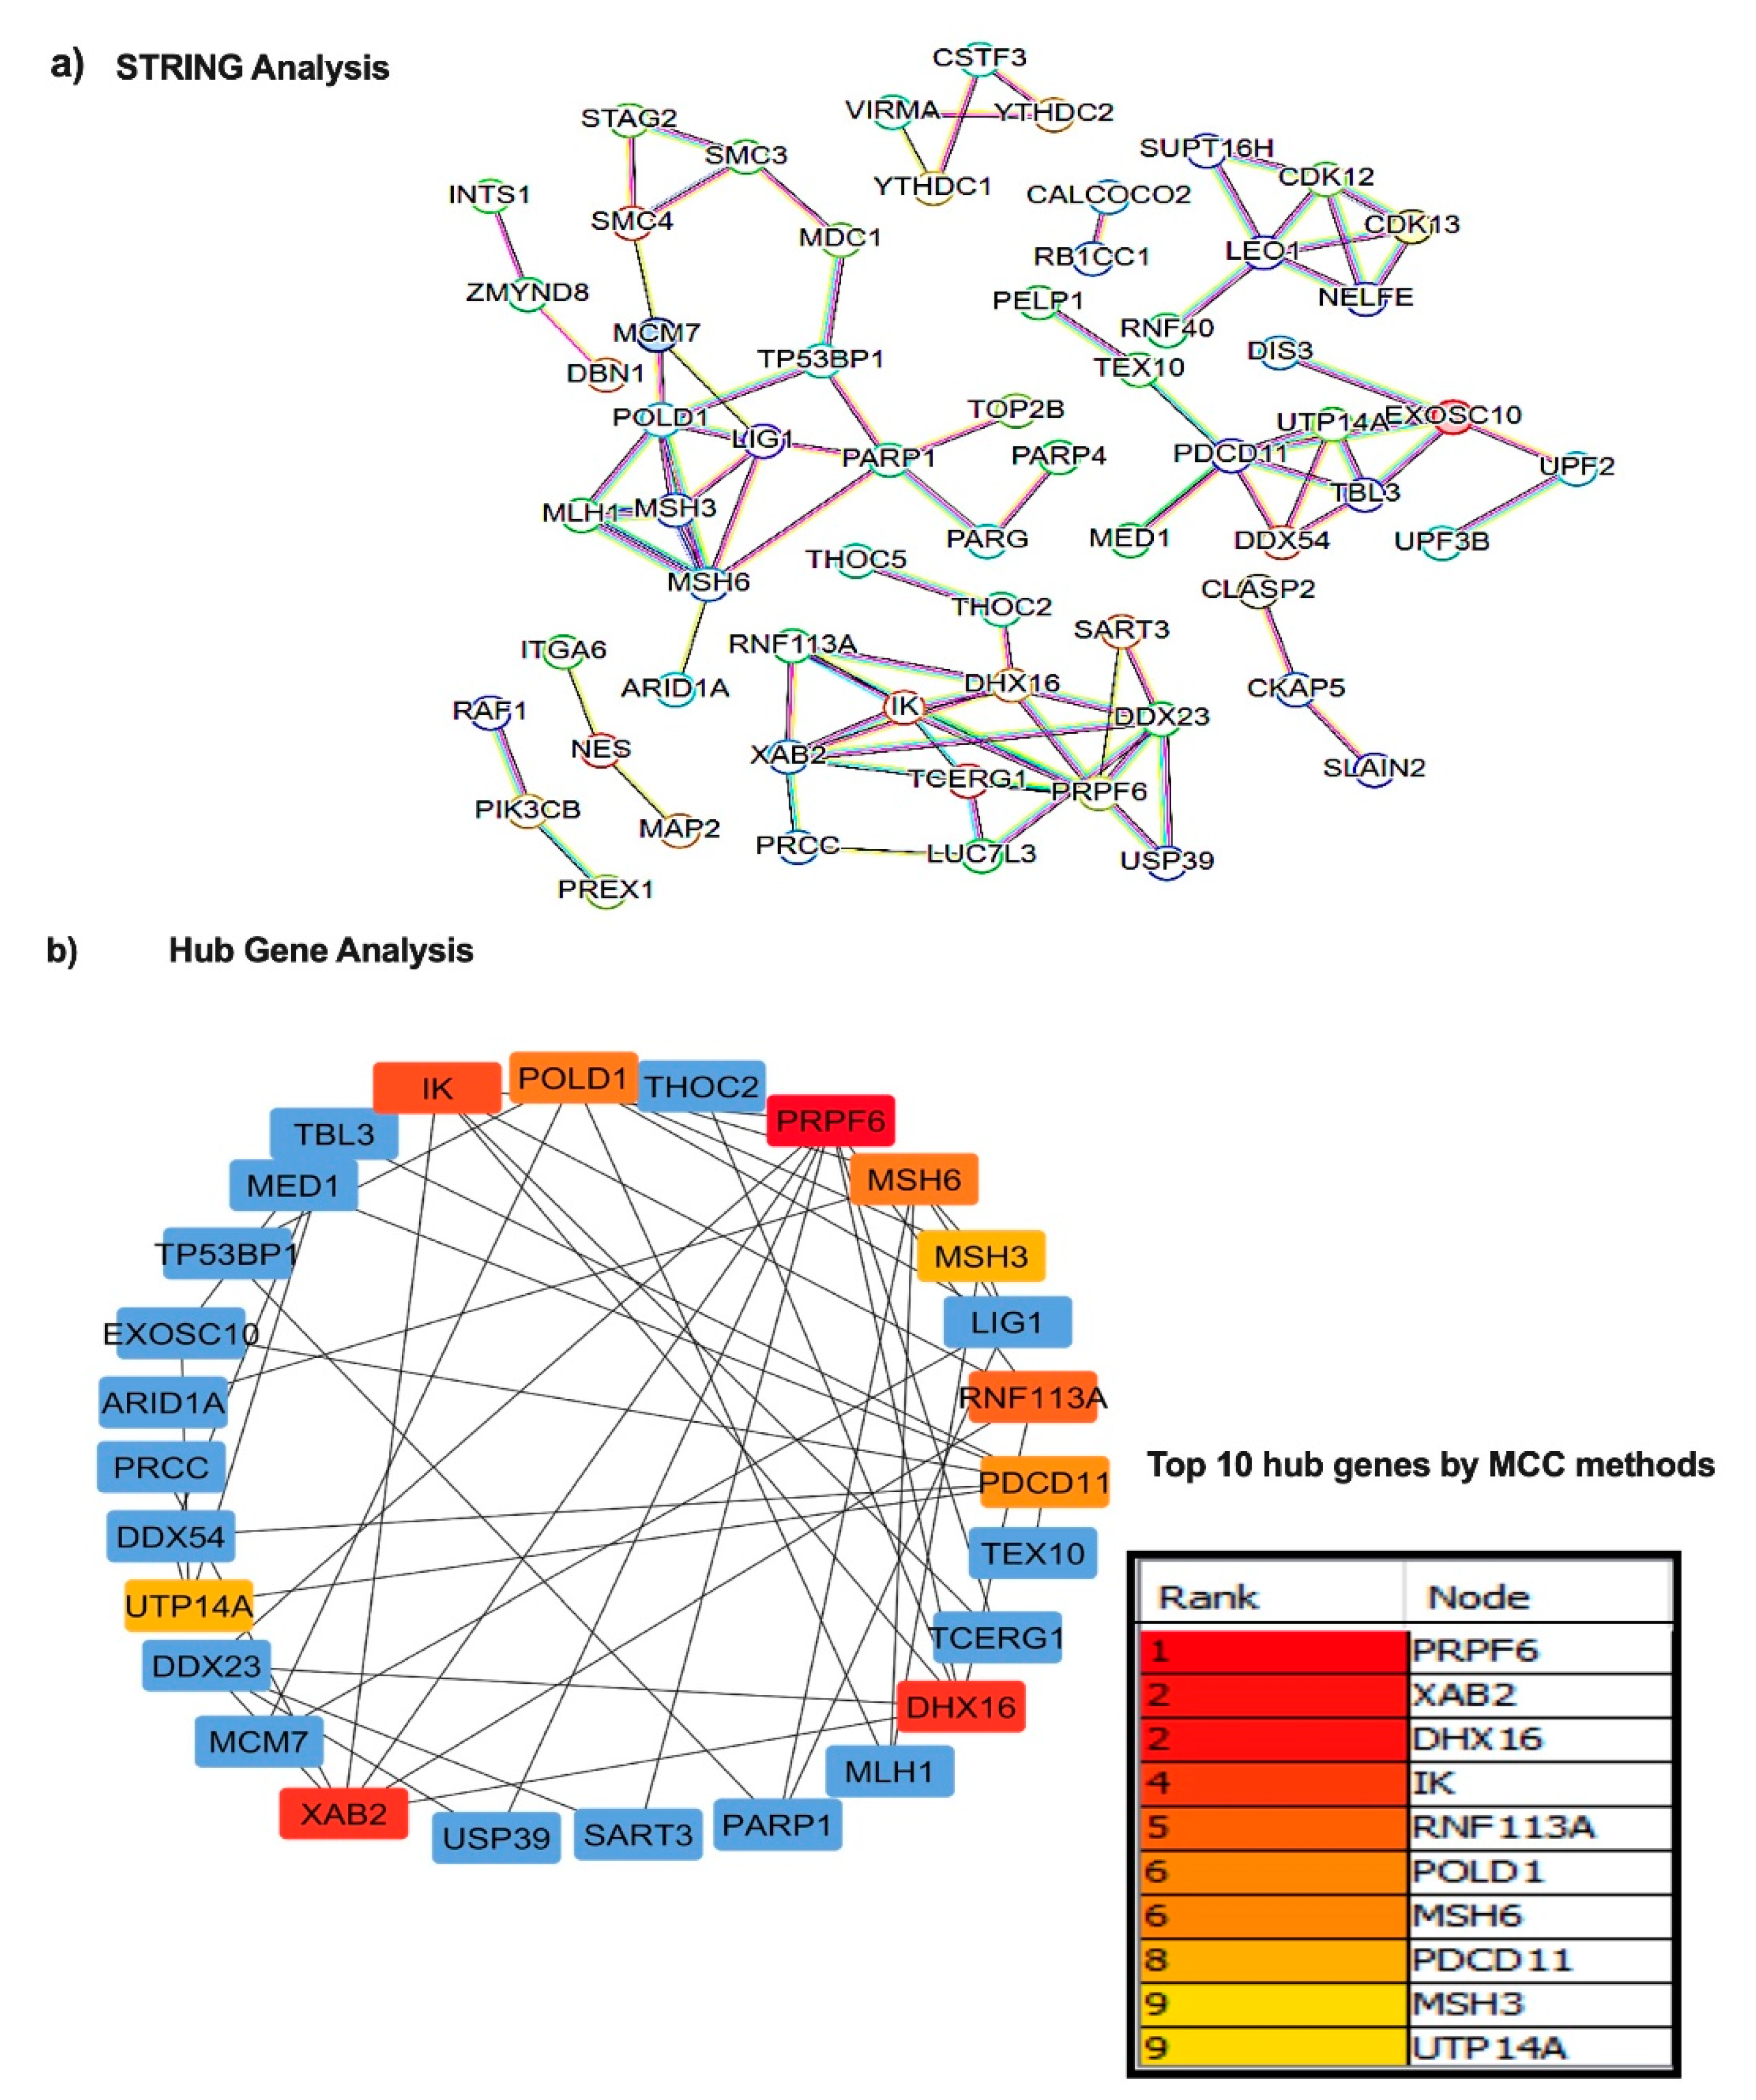
Figure 4.
Expression, survival curve analysis with Hub genes and validation. (a) TCGA-LIHC data was explored to determine the expression pattern of Hub genes in HCC vs. normal and also survival curve with high and low expressed Hub genes in HCC was analyzed. (b,c) Expression of 7 hub genes were validated in HepG2.2.15 vs. HepG2 cells and in Huh7+HBV vs. Huh7 respectively. p < 0.05 was considered significant. ** and *** mean p < 0.01 and 0.001 while ns depicts not significant.
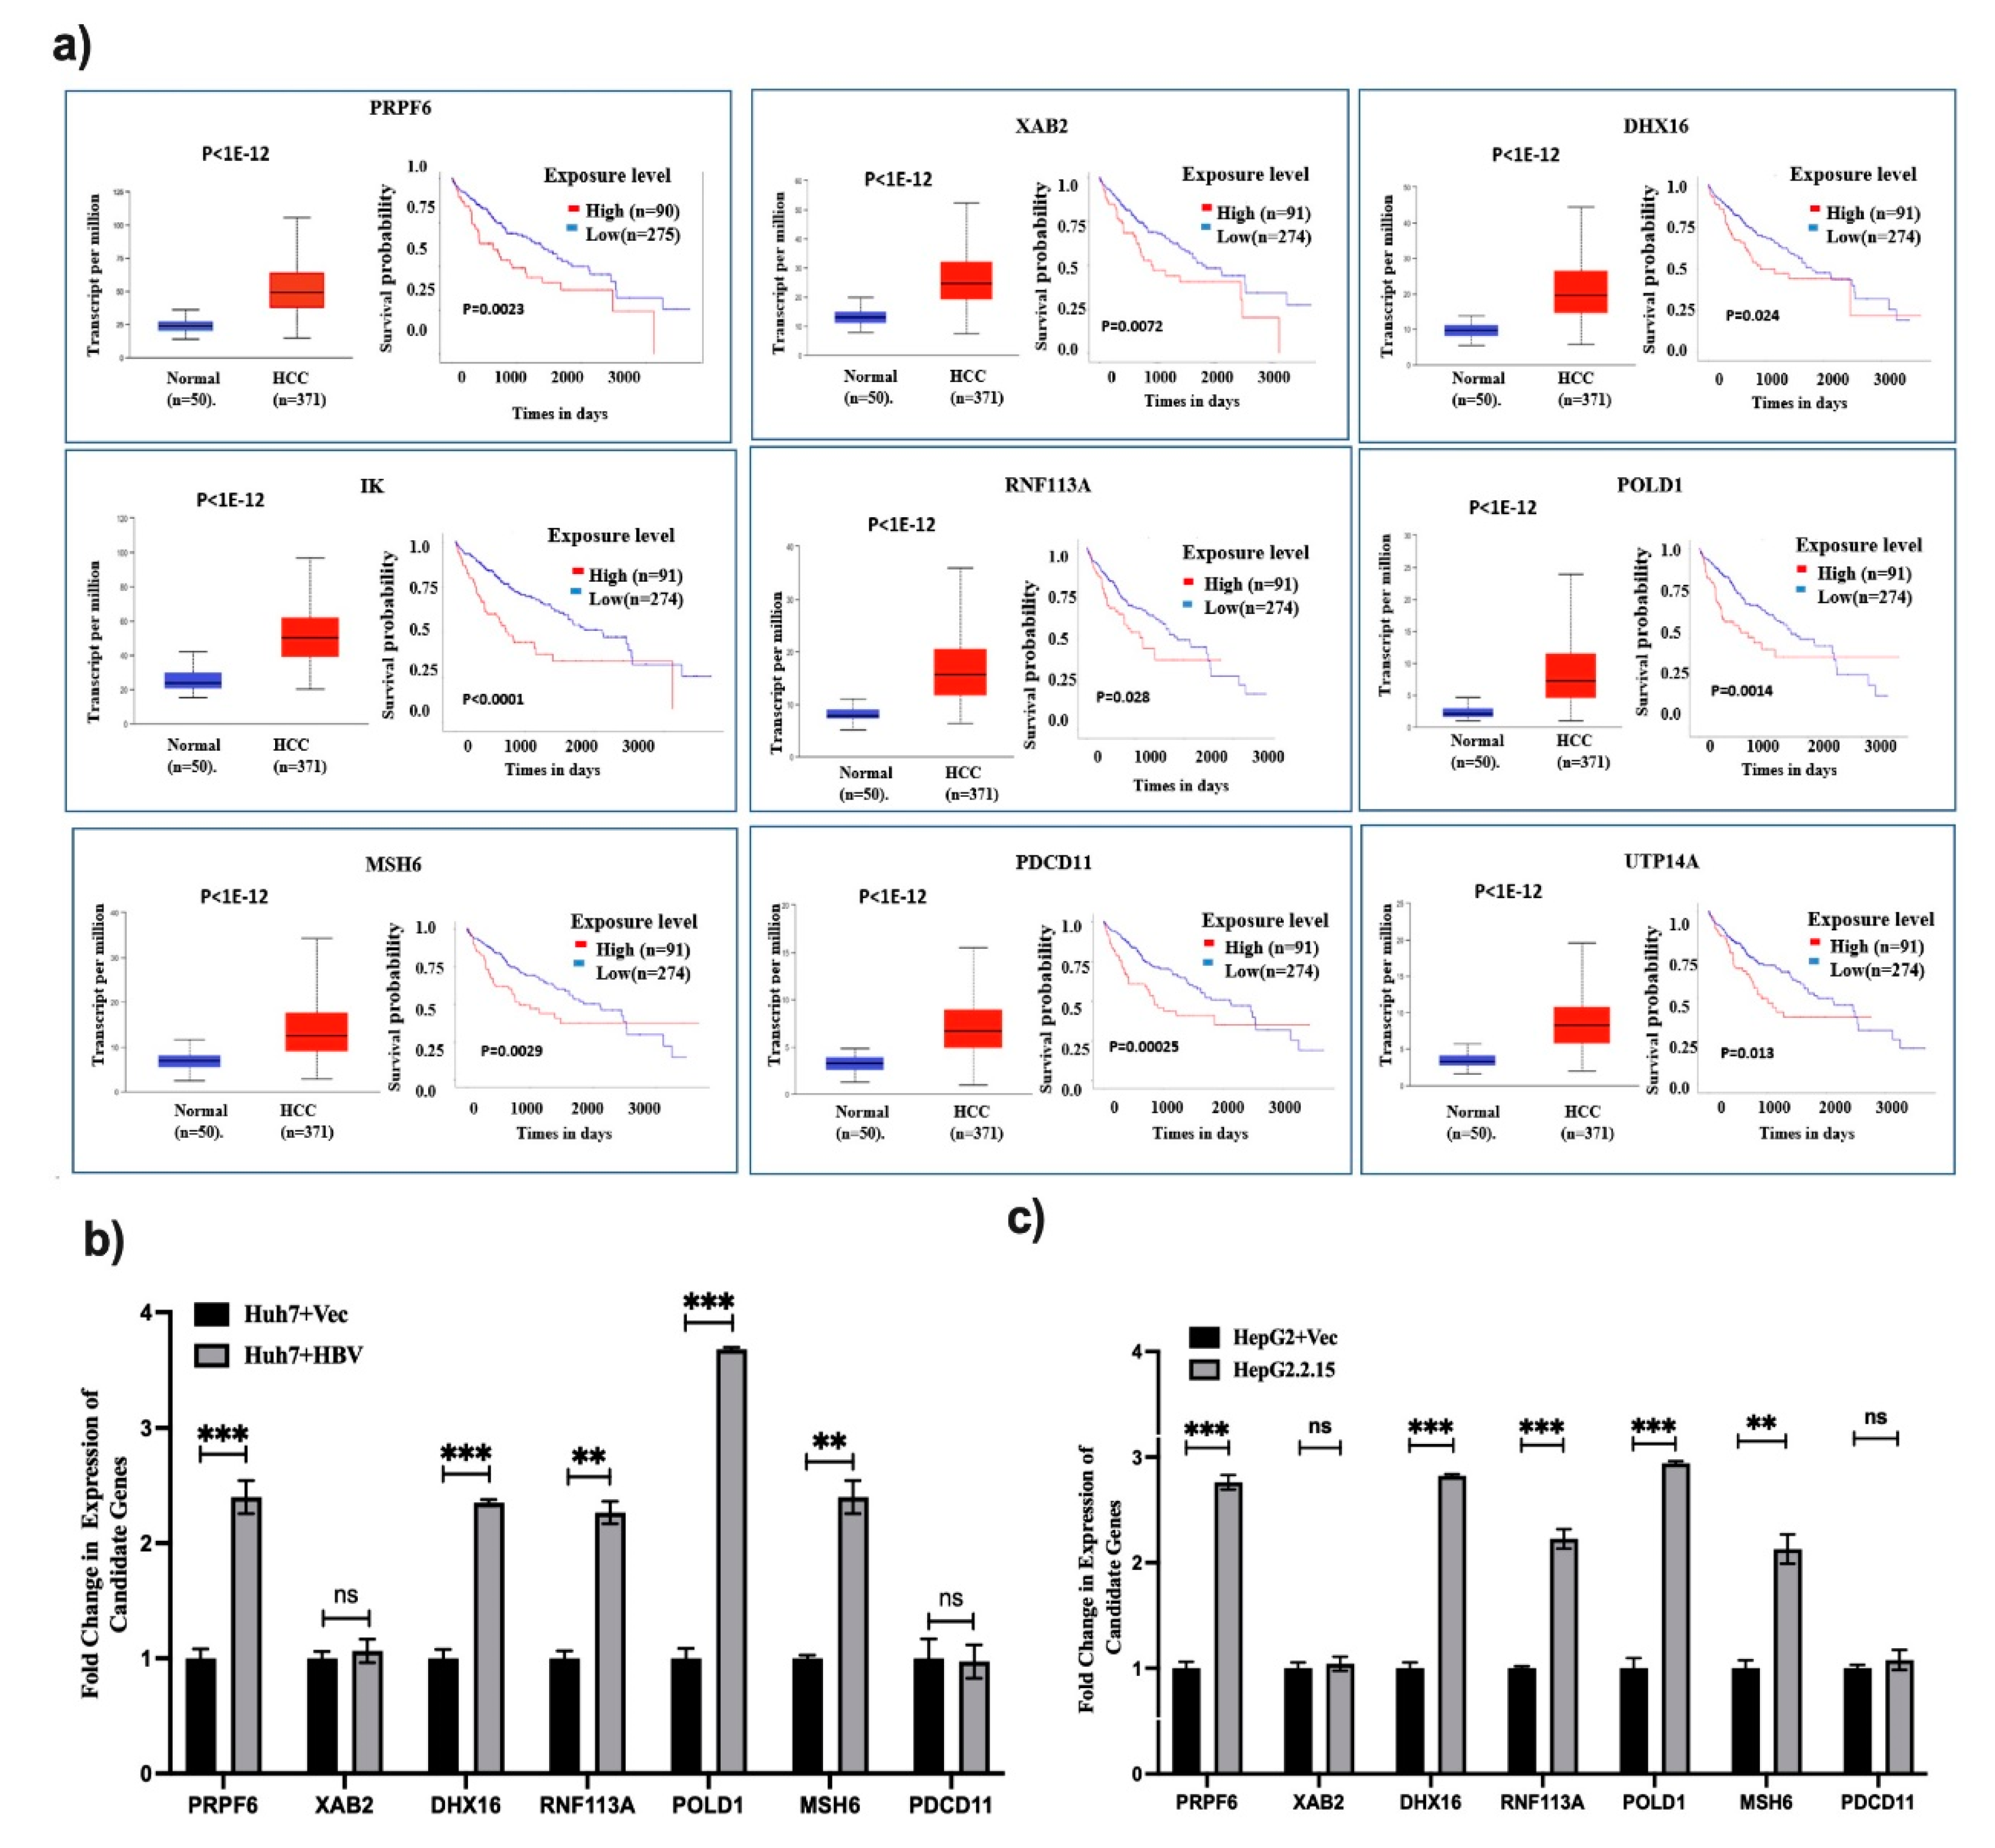
Figure 5.
Expression and survival curve analysis of TFs. (a) Transcription factors (TFs) which are commonly targeting Hub genes are presented in the table. (b) TCGA-LIHC data was explored to determine the expression pattern of top 5 TFs in HCC vs. normal and also survival curve with high and low expressed TFs in HCC was analyzed, and (c) qRT-PCR analysis of the hub genes after treating the Huh7 cells with anti-sense of TFDP1. P < 0.05 means significant. ** and *** indicate p < 0.01, and 0.001 respectively. ns means not significant.
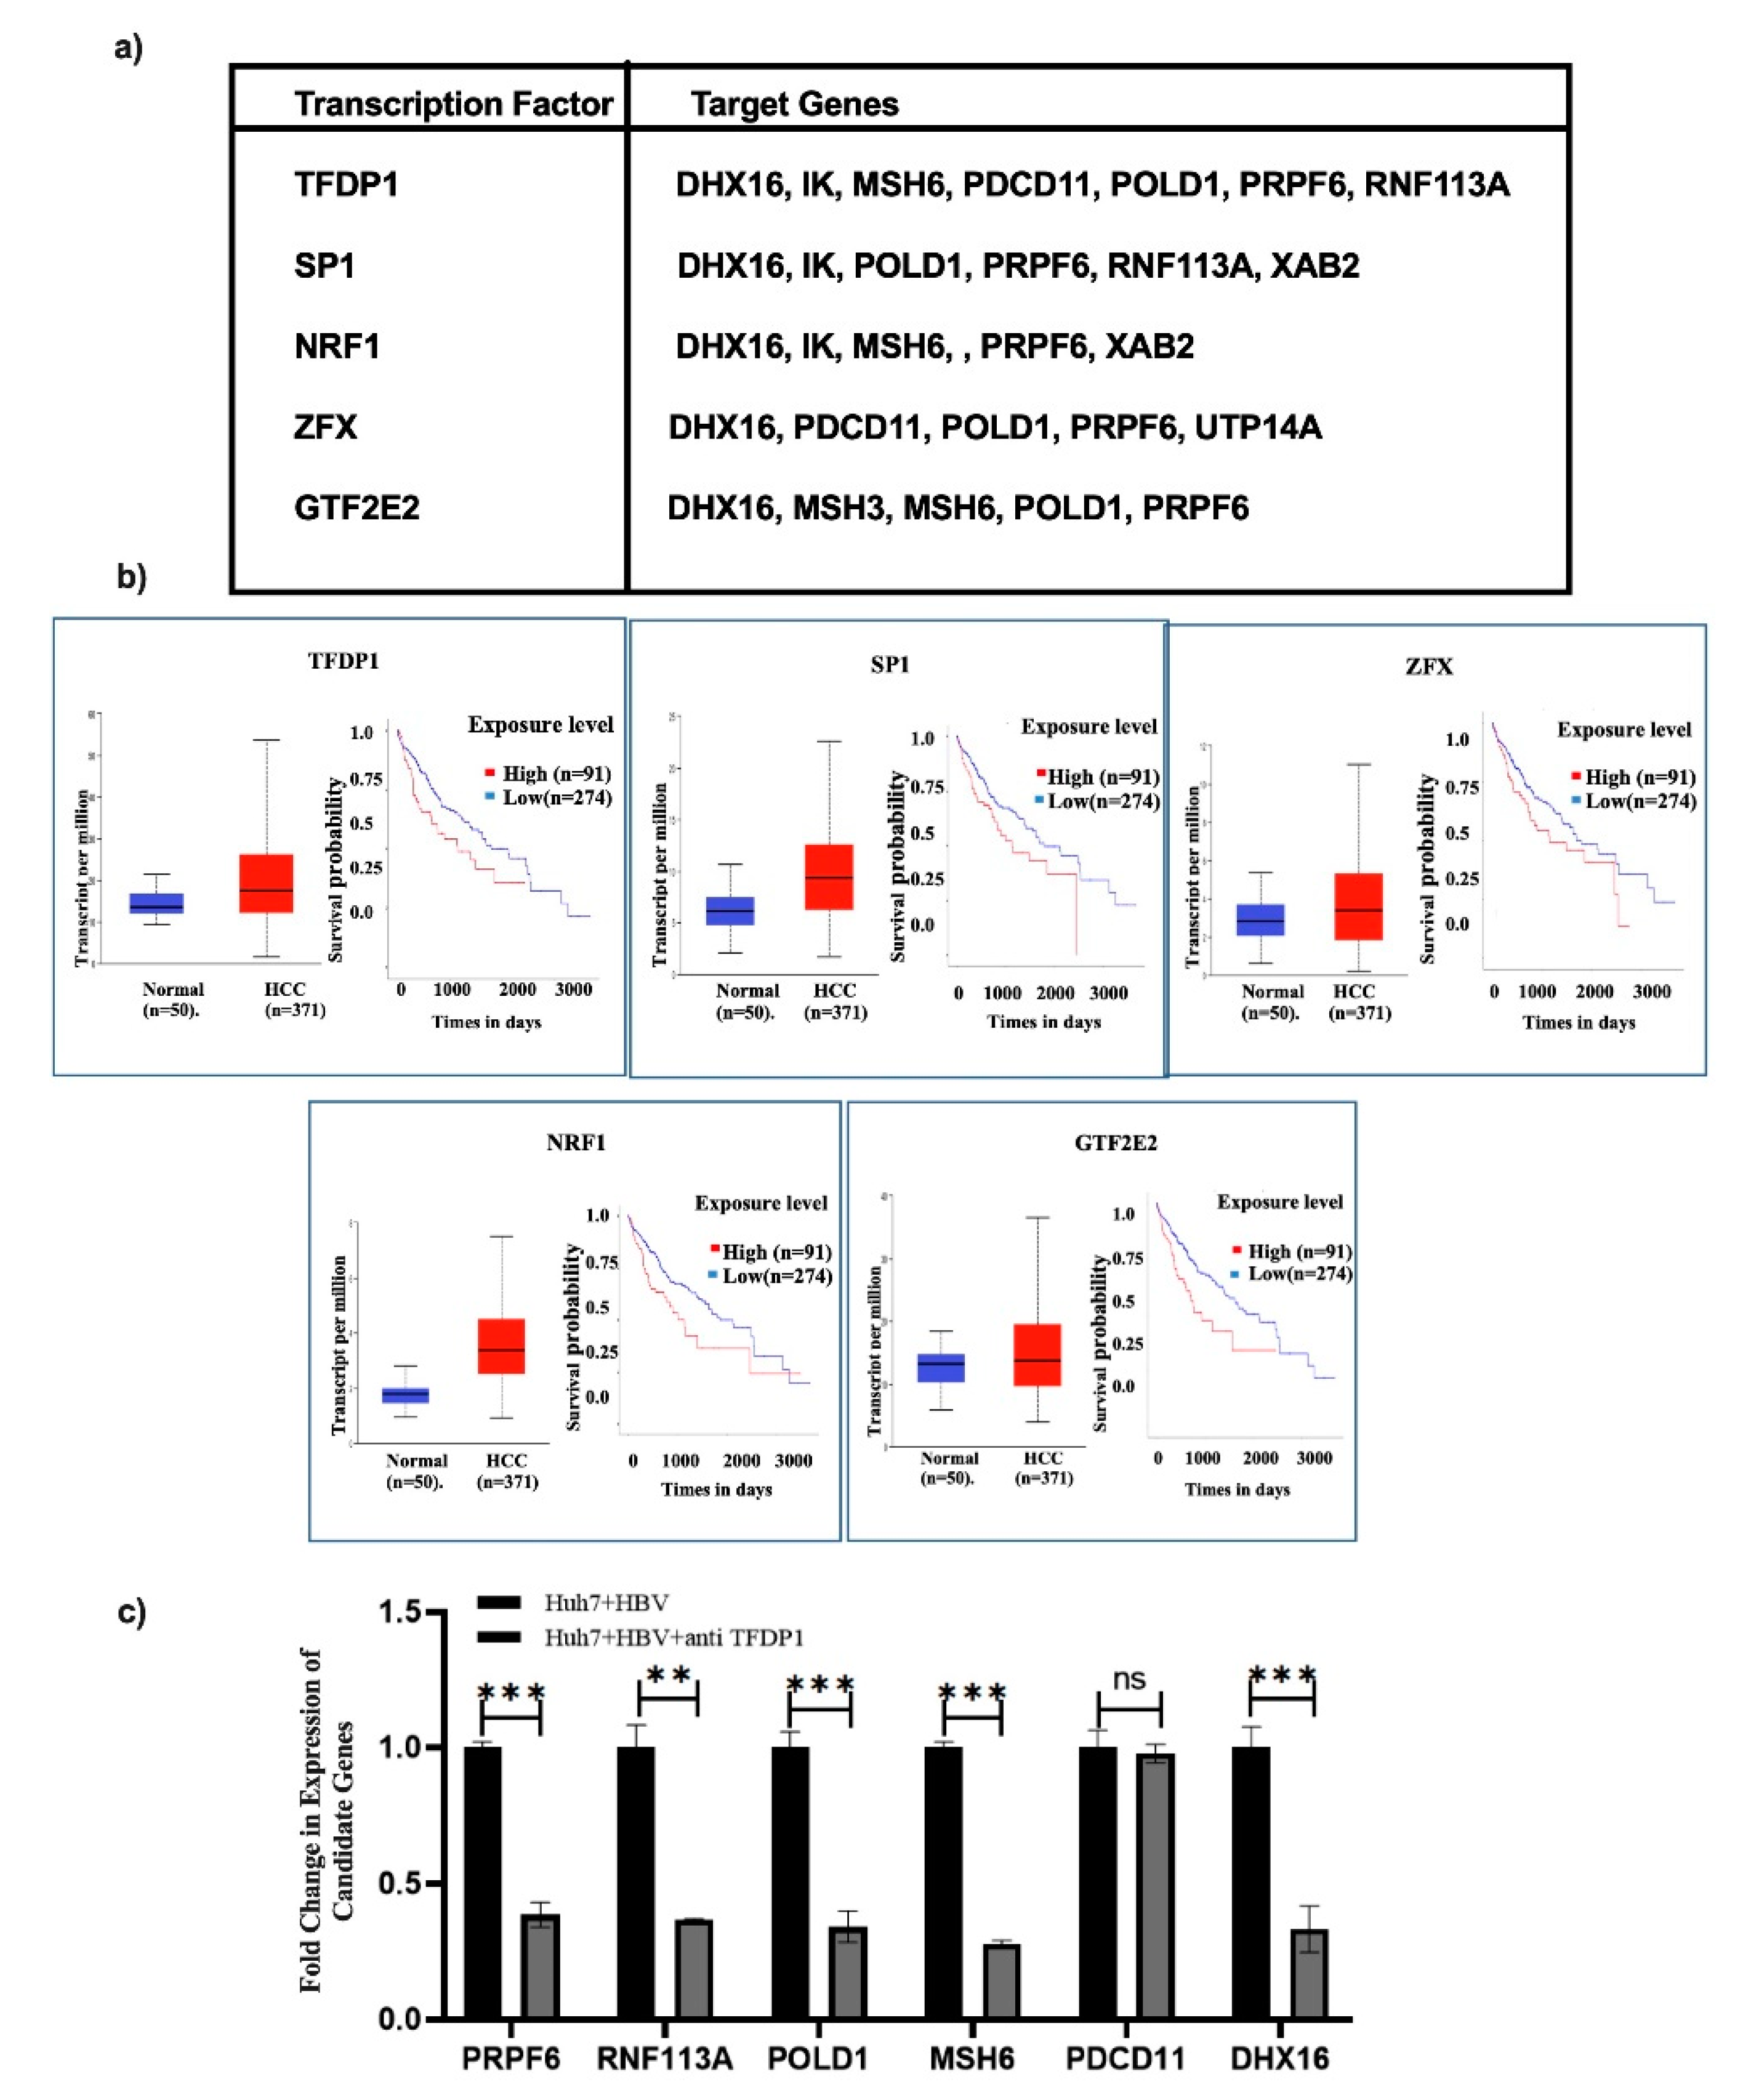
Figure 6.
Integrated analysis of Transcription factor (TF)-mRNA-miRNA: (a) miRNET was used to determine miRNAs targeting Hub genes and TFs upregulating Hub gene expressions. Blue and green squares represent miRNAs and TFs respectively while yellow squares are the Hub genes. (b) Expression and survival curve analysis was performed with three miRNAs using TCGA-LIHC data sets and (c) in silico binding of miR-1-3p to the 3’UTR of 5 hub genes and (d) qRT-PCR validation by in vitro transfection of miR-1 in Huh7+HBV cells. P<0.05 was taken as significant. **,*** mean p < 0.01 and 0.001 respectively.
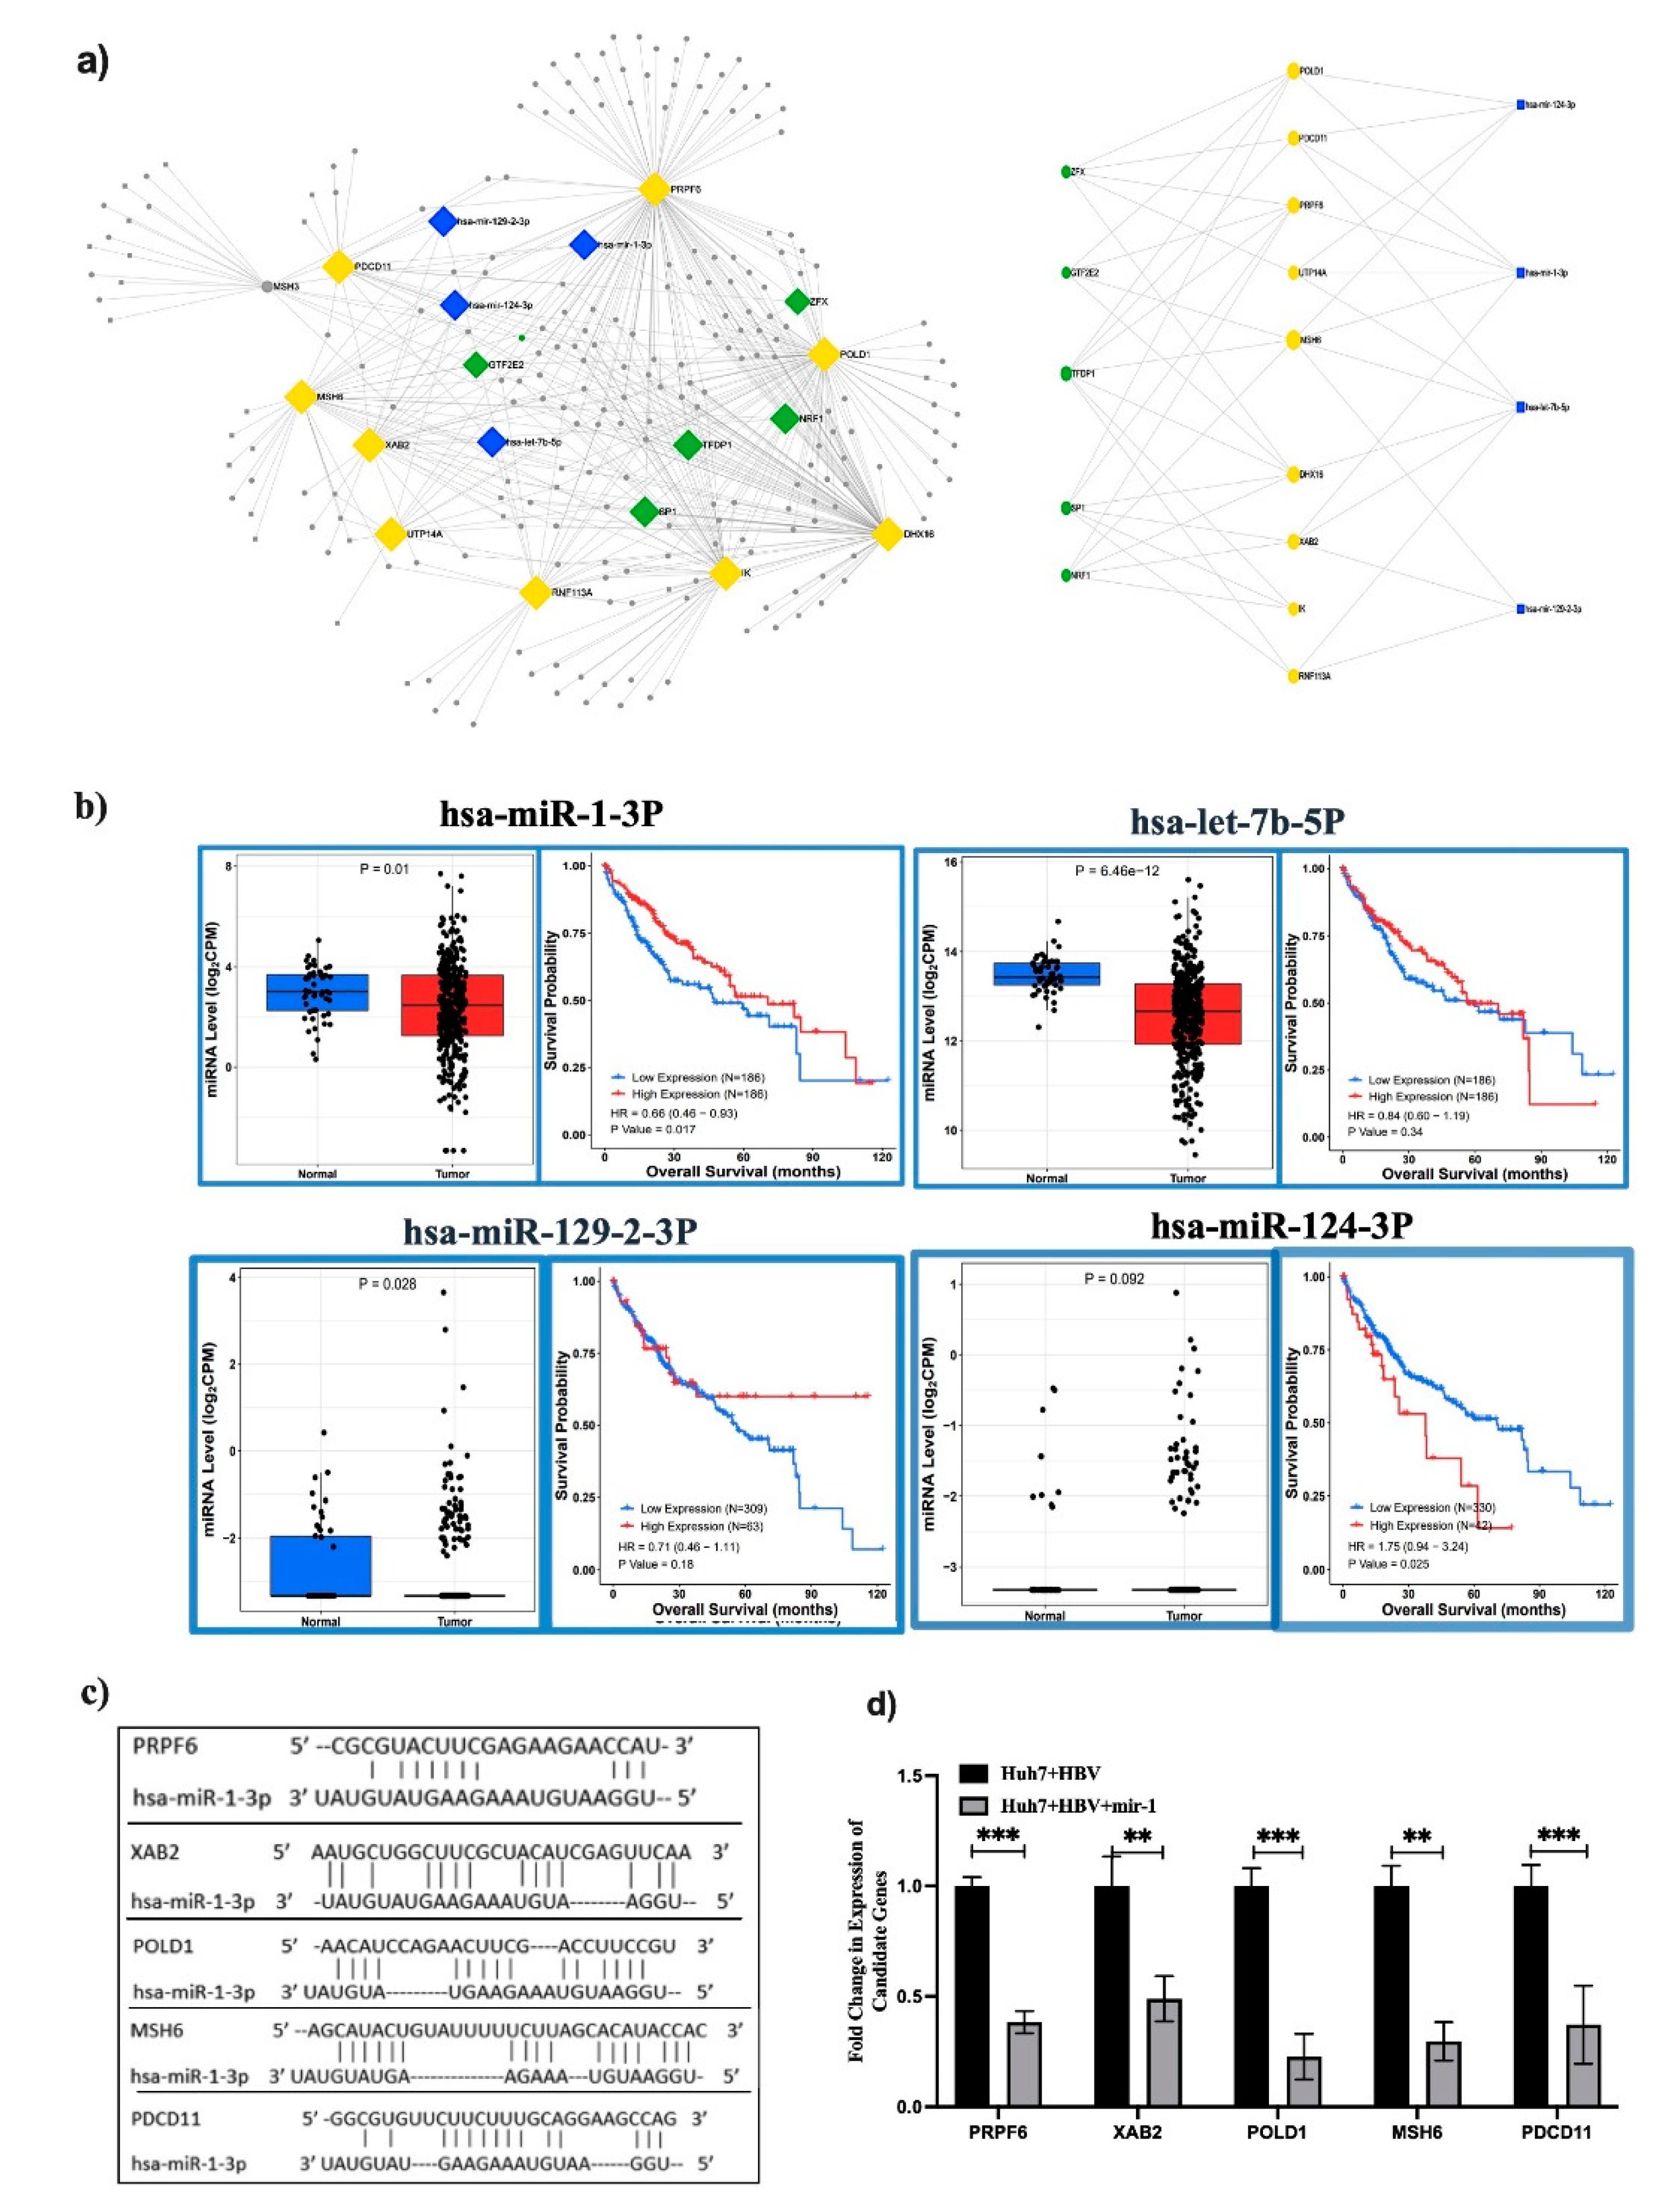
Figure 7.
Functional validation TFDP1 and miR-1: Huh7, Huh7+HBV and Huh7+HBV+ TFDP1-ASO or pPremiR-1 cells were compared using (a) Cell proliferation at different intervals, (b,c) expression of EMT and Stemness markers. **,*** mean p < 0.01 and 0.001 respectively.
Figure 7.
Functional validation TFDP1 and miR-1: Huh7, Huh7+HBV and Huh7+HBV+ TFDP1-ASO or pPremiR-1 cells were compared using (a) Cell proliferation at different intervals, (b,c) expression of EMT and Stemness markers. **,*** mean p < 0.01 and 0.001 respectively.
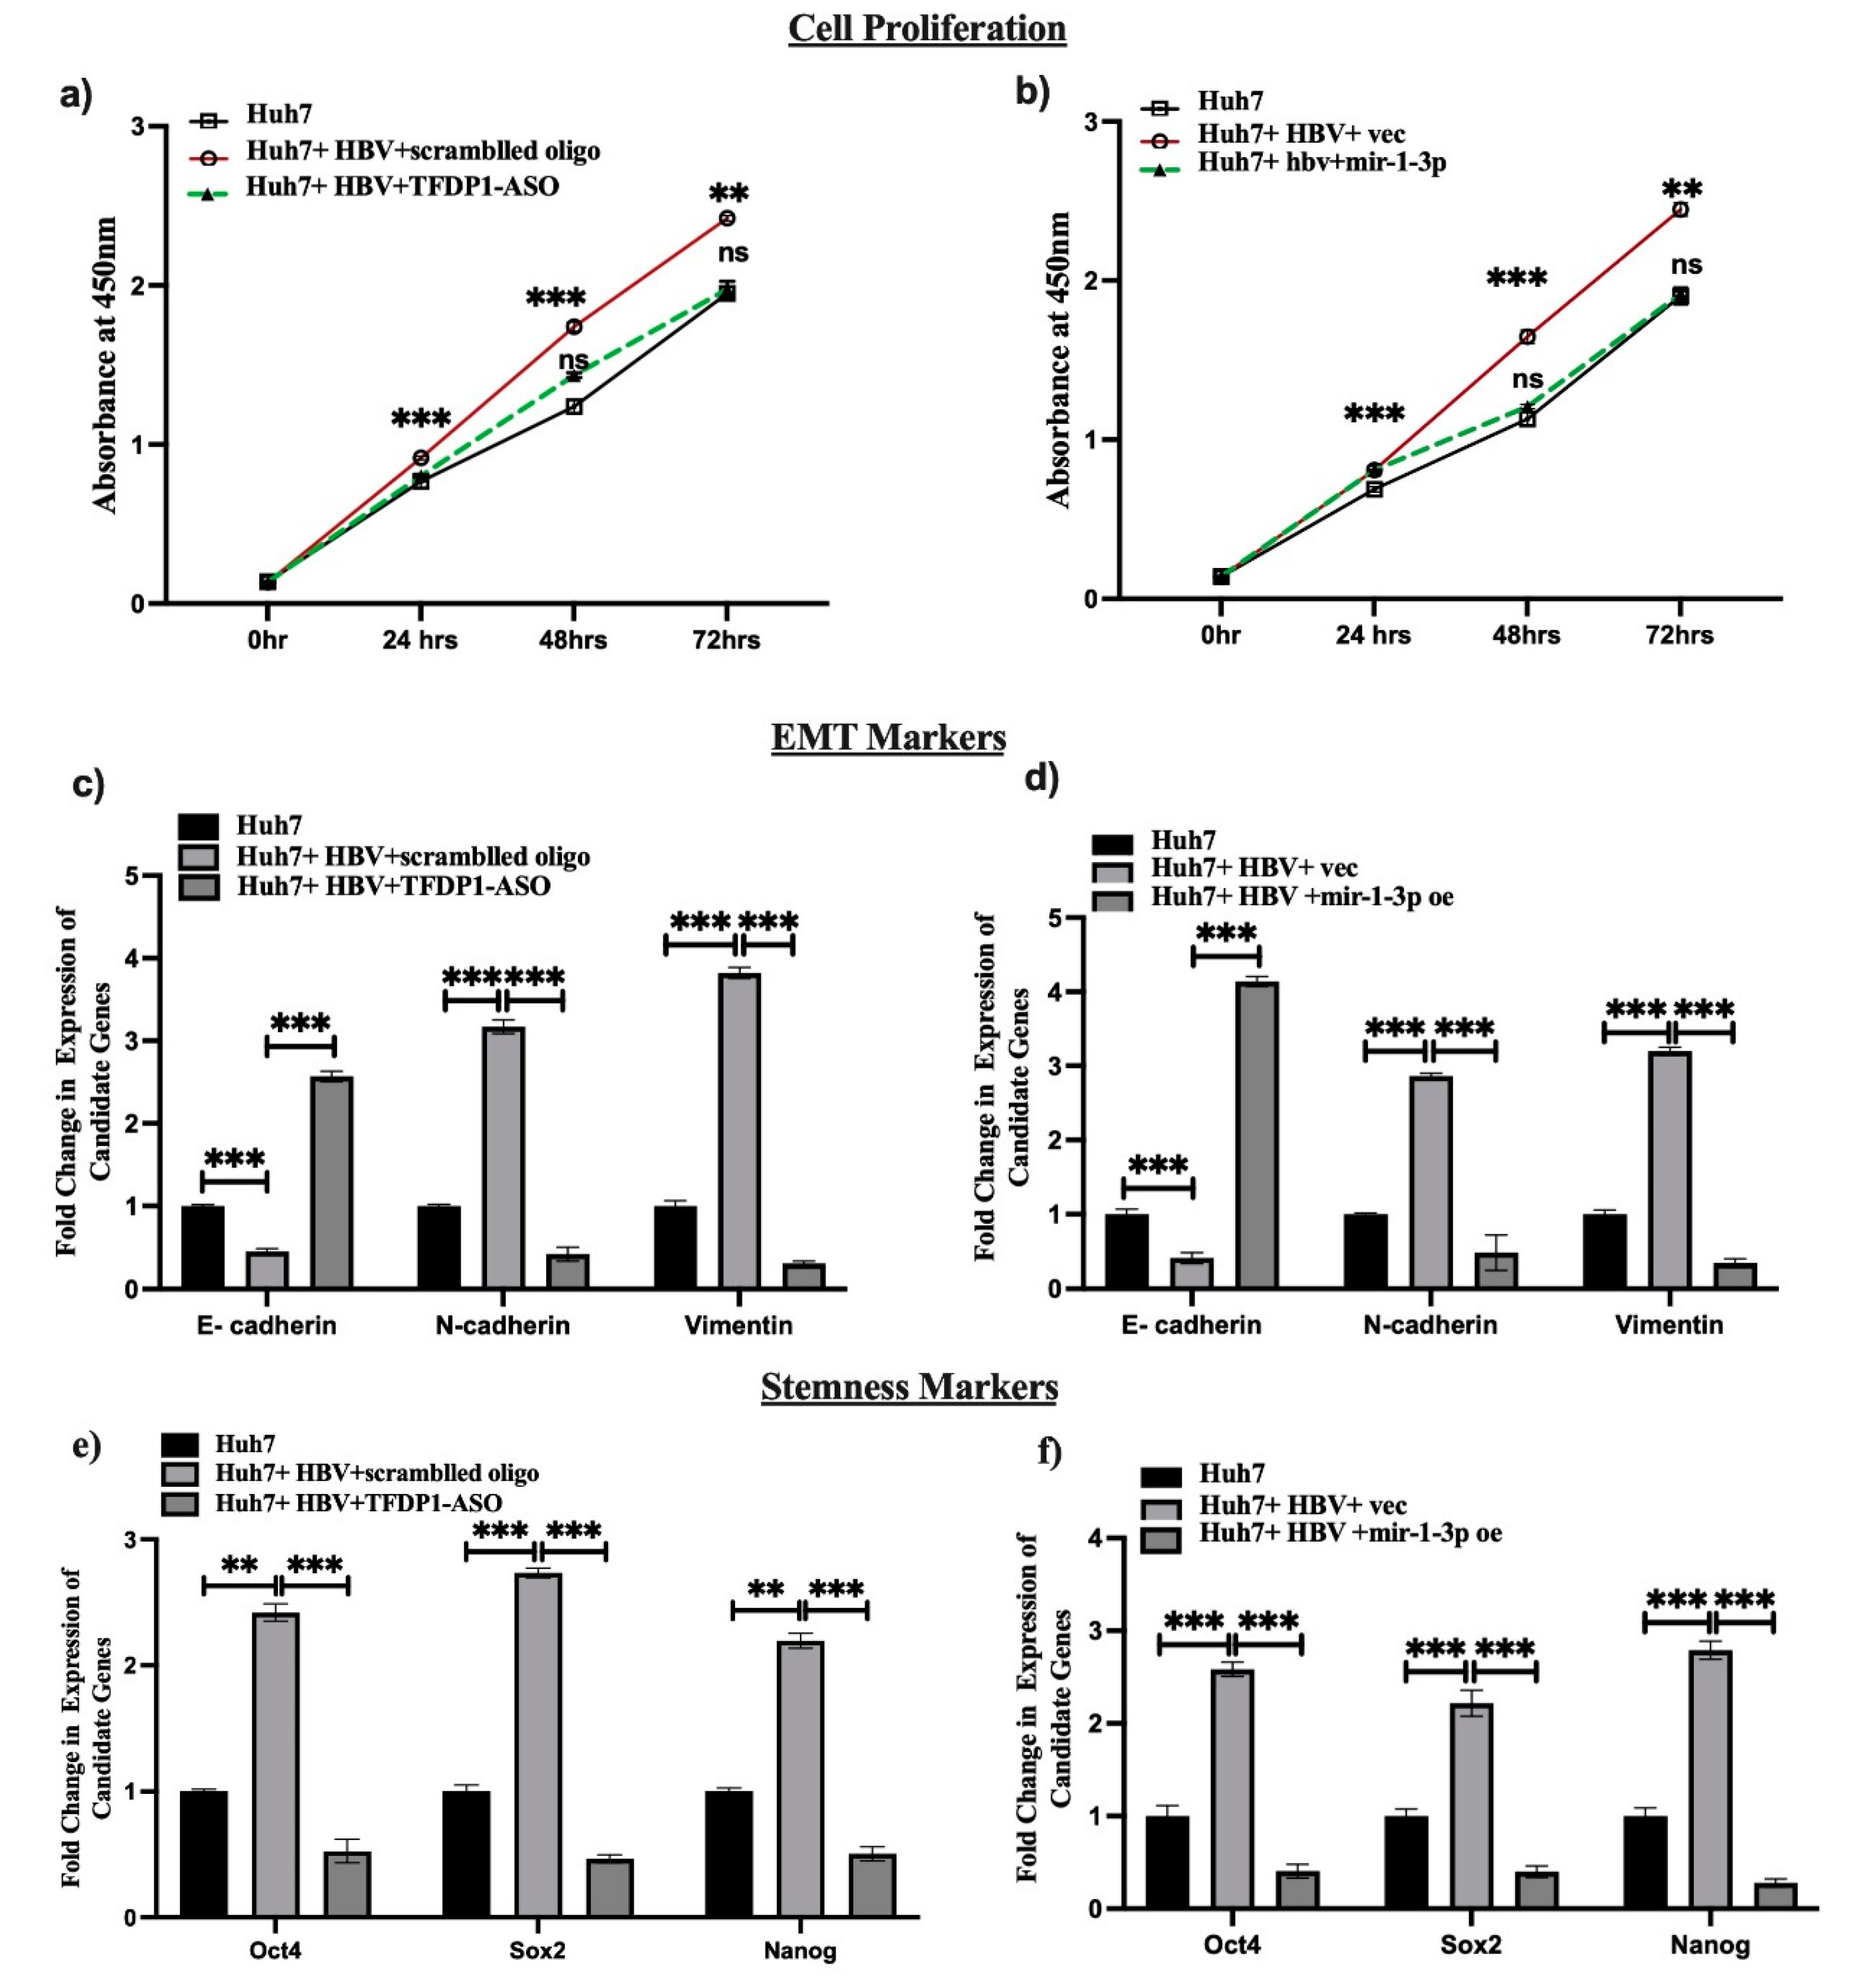

Table 1.
List of miRNAs targeting hub genes with high potential.
| miRNA ID | Target Genes | Experiment | Tissue |
|---|---|---|---|
| hsa-mir-1-3p | MSH6, POLD1, XAB2, PRPF6, MSH3, PDCD11, UTP14A | Proteomics, Microarrays, RNA-Seq, RPF-seq | Liver |
| hsa-let-7b-5p | DHX16, PDCD11, XAB2, MSH6, RNF113A,UTP14A | Proteomics, Microarrays, HITS-CLIP, PAR-CLIP | Liver |
| hsa-mir-124-3p | POLD1, MSH6, PDCD11, UTP14A | Microarrays, HITS-CLIP, RNA-Seq, | Liver |
| hsa-mir-129-2-3p | XAB2, MSH3, MSH6, RNF113A | Microarrays, HITS-CLIP | Liver |
Table 2.
List of primers used in the study.
| Primer Name | 5′-3′ sequence |
|---|---|
| PRPF6 F | GTGGAATGACGCCAGGACTGATG |
| PRPF6 R | CATTGATGTCTCCTCCGTGTGTC |
| DHX16 F | CTCGCCGAGAGTACCTGGCTAAG |
| DHX16 R | GGCATGTGGTAGCGATTGGTGGC |
| XAB2 F | GAAGCATCGCTGTGTGACCGACC |
| XAB2 R | GAGAGTGCTGCGTGATGGGCAG |
| RNF113A F | GAAGGCTGCACTGTGGTTCGAC |
| RNF113A R | CTGTGTCCAGCTCATAGACAGC |
| MSH6 F | CAAGTCTCCGGCGCTGAGTGATG |
| MSH6 R | CTCCGTTGAGGTTCTTCGCCTTG |
| PDCD11 F | CAACGGAGGAGTTGTTAGTCTG |
| PDCD11 R | CAGGCTCAGGTGCACAACTCTG |
| POLD1 F | GGGAACTCCTAGCCCTGACT |
| POLD1 R | TTCCGCACTGAGGTCTTCAC |
| TFDP1 F | CTTCATCATCGTCAACACCAGC |
| TFDP1 R | GAACCTGCCGTCGTGATGAACAC |
| TFDP1 Antisense oligo | CCGTTGGCTTCAATTAGACCGGCATC |
Disclaimer/Publisher’s Note: The statements, opinions and data contained in all publications are solely those of the individual author(s) and contributor(s) and not of MDPI and/or the editor(s). MDPI and/or the editor(s) disclaim responsibility for any injury to people or property resulting from any ideas, methods, instructions or products referred to in the content. |
© 2024 by the authors. Licensee MDPI, Basel, Switzerland. This article is an open access article distributed under the terms and conditions of the Creative Commons Attribution (CC BY) license (http://creativecommons.org/licenses/by/4.0/).
Copyright: This open access article is published under a Creative Commons CC BY 4.0 license, which permit the free download, distribution, and reuse, provided that the author and preprint are cited in any reuse.


