1. Introduction
Green and outdoor spaces play an important role in people's health and well-being. Spending time in parks, forests or near bodies of water helps to reduce stress, improve mental health and encourage physical activity [
1,
2,
3,
4,
5]. Physical activity helps to prevent many diseases and its benefits are widely recognized [
6,
7]. Exposure to nature also has positive effects on several aspects of health, including physical, social and mental health [
8,
9,
10,
11]. The concept of physical activity in an outdoor context combines these two public health themes.
The duration and frequency of physical activity and contact with nature are linked to the extent of their health benefits [
10]. Consequently, it is desirable for the population to have access to spaces that allow physical activity and the outdoors in their living environment, close to home. Considering inequalities in geographical access to outdoor spaces could encourage exposure to nature and be conducive to increasing physical activity in the population.
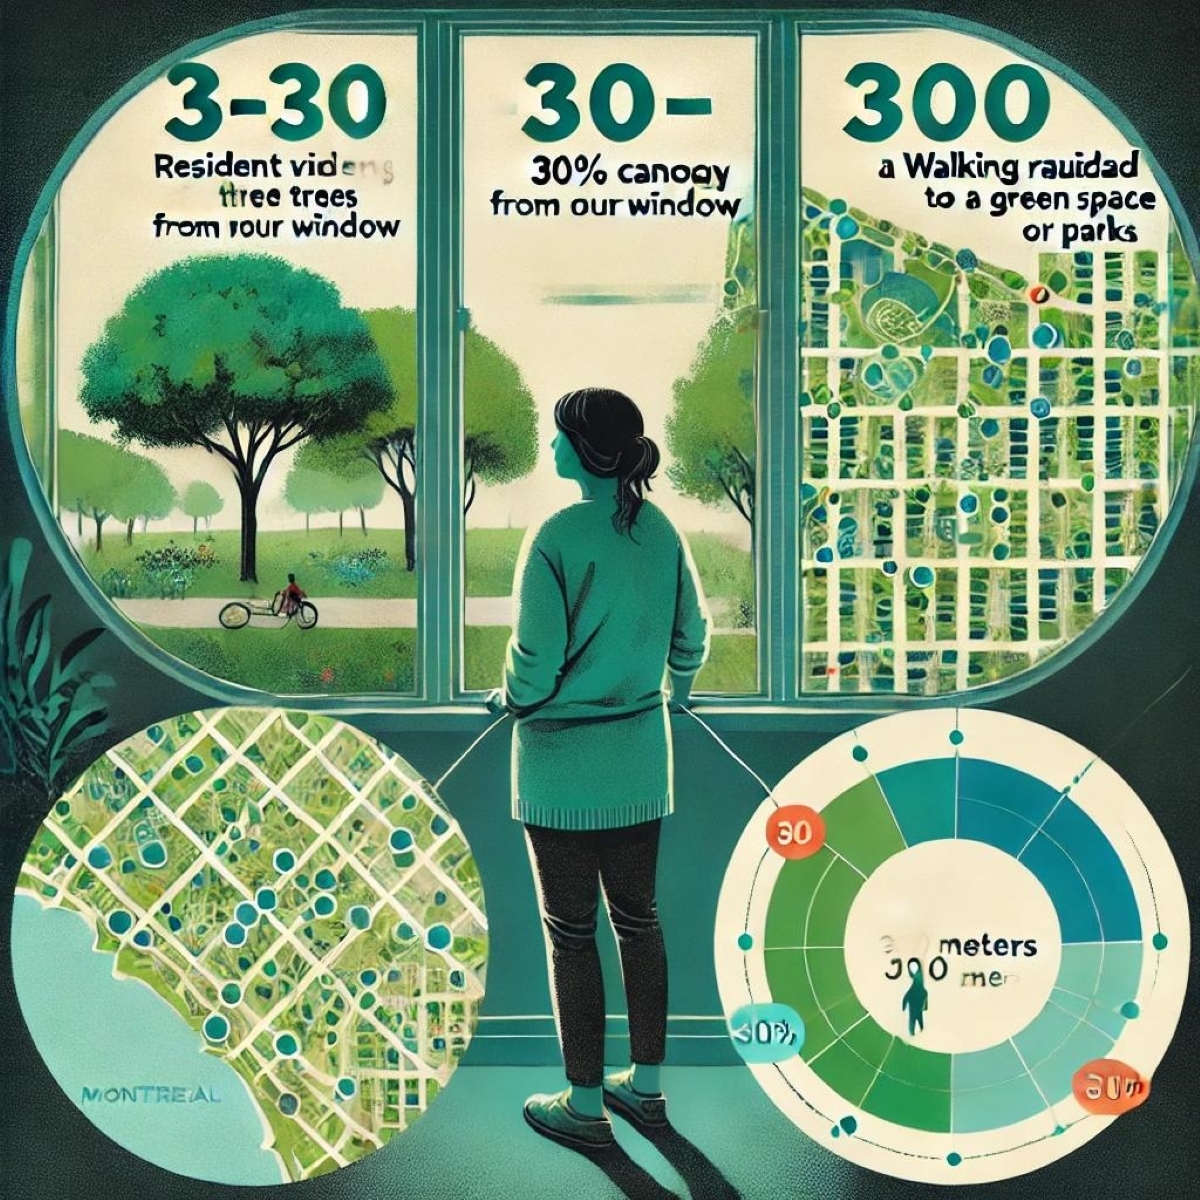
However, not all individuals have equitable access to outdoor spaces, and disparities may exist depending on various geographical and socio-economic factors (14-16). To address this issue, methodological approaches have been developed to quantify access and proximity to green spaces in urban environments. One recent approach is the concept of the ‘3-30-300’ indicator, which is based on three main objectives: everyone should be able to see at least three trees from their home, have 30% green cover in their neighborhood, and live within 300 meters of a park or green space (17,18).
The 3-30-300 index is a simple and intuitive approach to assessing access to green and outdoor spaces in the urban environment. The index is based on three criteria for measuring nature in living environments:
3 visible trees: every person should be able to see at least three trees from the windows of their home. This threshold is based on environmental psychology studies which show that the mere sight of nature, even through a window, can have soothing effects and improve mental well-being. The results of a study conducted by Roger Ulrich in 1984 revealed that hospital patients with a view of trees recovered more quickly and required less painkillers than those with a view of a wall [
12]. Since then, other research has confirmed that being able to see nature reduces stress, improves mood and promotes cognitive recovery [
5,
13]. The ‘3 trees’ concept is a practical way of ensuring that there is enough nature around homes to generate these beneficial effects [
5,
13,
14,
15,
16,
17].
30% tree canopy: the 30% threshold is based on ecological and environmental research which shows that sufficient tree cover is essential to ensure measurable benefits for air quality, temperature regulation and biodiversity. In cities, trees and vegetation play a key role in mitigating urban heat islands, sequestering carbon and filtering fine particles from the air. Studies suggest that vegetation cover below this level offers less protection against these environmental problems, while a percentage of around 30% is associated with a significant reduction in local temperatures and notable improvements in air quality and thermal comfort [
5,
13,
14,
15,
16,
17].
300 meters to a park or green space: this threshold comes from research in urban planning and public health, which shows that proximity to a green space directly influences the frequency and duration of physical activities, such as walking and leisure activities. Several studies have shown that immediate proximity to green spaces increases their use and therefore the positive effects on mental and physical health. The threshold of 300 meters (about a 5-minute walk) is often cited as the maximum distance beyond which people are less inclined to visit a green space regularly, particularly in dense urban areas [
5,
13,
14,
15,
16,
17]. This threshold is also supported by WHO recommendations, which suggest that to promote health, every citizen should have easy access to a green space within a 300-metre radius [
18,
19].
This indicator offers an integrated vision of accessibility to nature, with the potential for practical application to guide urban and land-use planning decisions. As a public health tool, it can be used not only to monitor disparities in access to green spaces, but also to guide interventions aimed at promoting urban environments conducive to a healthy and active lifestyle.
The theoretical foundation of this article is also based on the conceptual framework developed by Chen et al. (2020), which highlights the complex dynamics involved in environmental inequalities, especially in relation to access to green spaces—an essential factor for the well-being of urban dwellers. The theoretical construct is informed by the contributions of Young (1990) regarding social determinants and Rawls (1971) pertaining to distributive justice. It is then applied in a real-world context based on the principles of habitation, accessibility, and the distribution of limited resources. Two major theoretical concepts form the basis for the study of environmental inequality in this sense:
Social determinants: according to Young (1990), social inequalities are produced by structures, cultural beliefs, and institutional contexts. Within such a framework, these are the factors that determine access to environmental resources, such as green spaces. Social beliefs and institutions may further entrench forms of exclusion, leaving some communities more vulnerable to inequalities in access.
Distributive justice: following Rawls (1971), this theory argues that resources, though scarce, must be distributed in a way that there is equal opportunity. From an environmental perspective, it would mean that green spaces, being an important natural resource, should be made accessible to all populations with a view to ensuring social and environmental justice.
The above views lay a basis for scrutinizing how inequities in green space access manifest broader systemic disparities.
From a pragmatic perspective, the model focuses on three interrelated elements: social systems, the distribution of resources, and the availability of green spaces.
Social structures and institutional contexts: social systems and institutions strongly influence the availability of resources. For example, in some urban settings, less privileged populations may have limited access to green spaces because of urban planning policies or economic disparities.
Resource allocation: most of the differences in access to green spaces come from the unequal distribution of this scarce resource in urban settings. This model indicates the importance of proper distribution for environmental justice.
The accessibility of green spaces depends on several down-to-earth factors, which in the model are summed up as the starting point, the distance, and the destination.
The above views lay a basis for scrutinizing how inequities in green space access manifest broader systemic disparities.
Point of origin (Residence/User): The residences of individuals greatly influence their accessibility to green spaces. For example, highly populated urban areas may have a shortage of availability for these green spaces.
Proximity: the physical distance between where one resides and designated green spaces is a critical factor in people's ability to use such resources. A long distance can hinder this access.
Destination place: this refers to the green spaces themselves, which must be sufficiently numerous, accessible and well distributed to enable all urban populations to benefit from them.
In the context of the island of Montreal, the introduction of a 3-30-300 indicator could provide valuable information for assessing and improving access to green spaces in various neighborhoods, taking account of social and environmental inequalities. The aim of this study is therefore to propose the development of a 3-30-300 indicator. We will detail the methodological steps involved in its development, the geospatial data required and the potential challenges in a complex urban context such as that of Montreal. Such an indicator could serve as a benchmark for municipal and community action to improve the well-being and health of Montrealer’s, while contributing to broader efforts towards urban resilience and sustainability. The research questions for this study are: 1. How does the distribution of green spaces vary across different neighborhoods in Montreal, as indicated by the 3-30-300 metric? 2. What are the socio-economic factors influencing the disparities in access to green spaces as measured by the 3-30-300 indicator? 3. How can the 3-30-300 indicator be utilized to identify areas of Montreal with inadequate access to green spaces, particularly in relation to socio-environmental inequalities?
2. Materials and Methods
2.1. Study Area
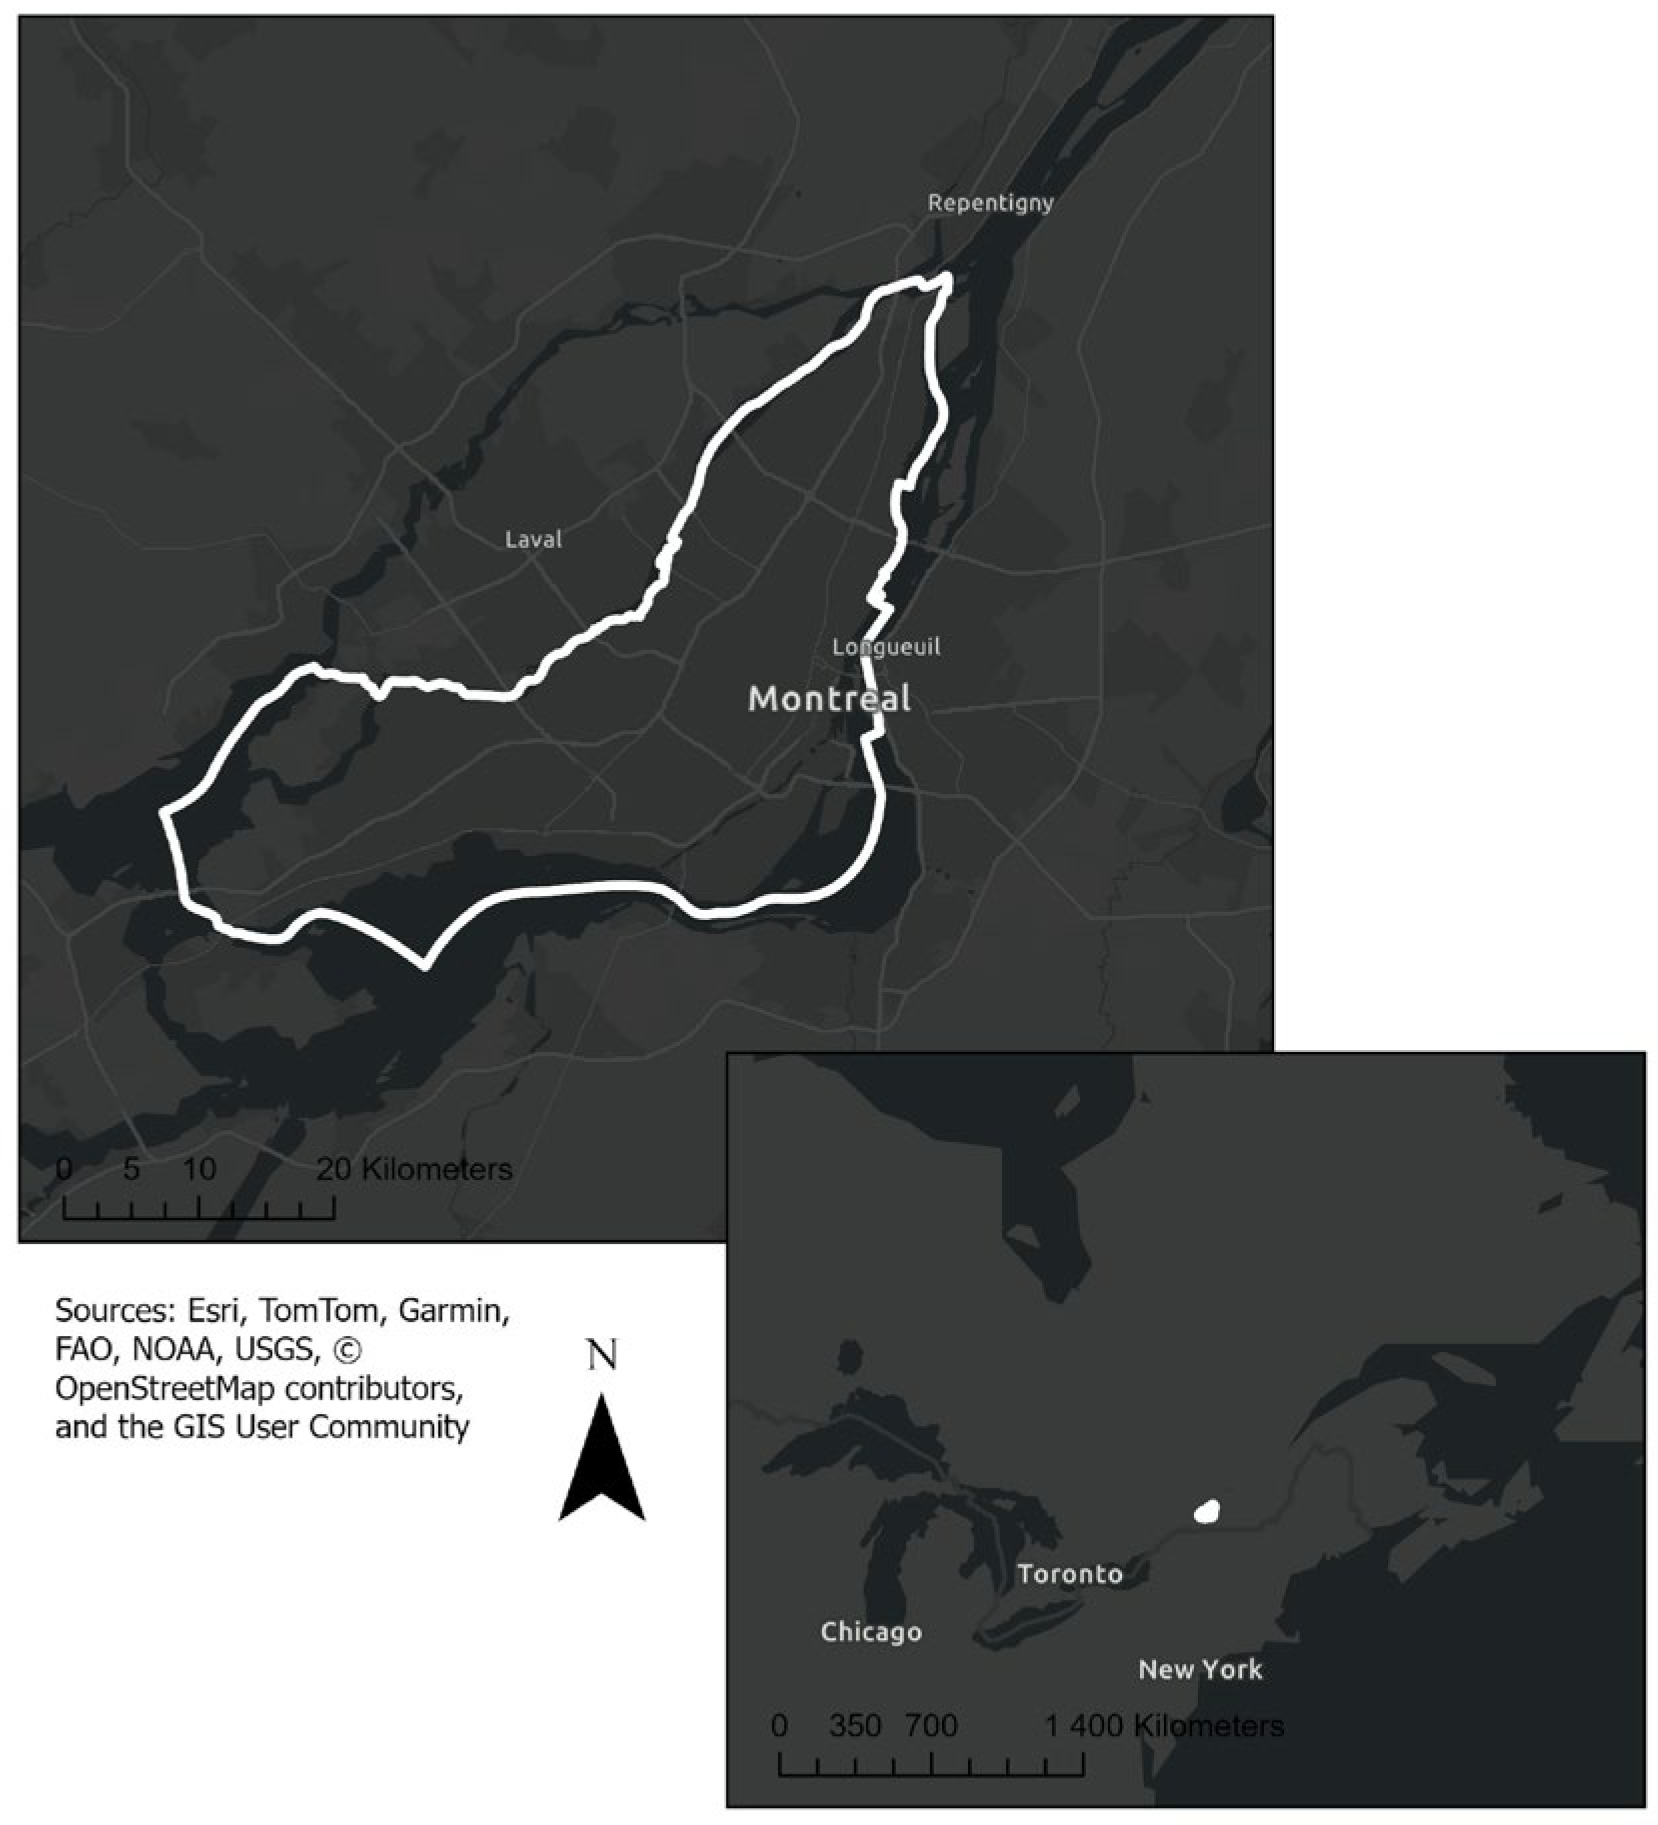
Montreal, Quebec, represents an ideal study area due to its strategic geographic location, significant population, and economic role in the region. With a population of 1,762,949 according to the 2021 census, Montreal is the second largest city in Canada and is home to nearly half of Quebec's population [
23] (
Figure 1). Located in southwestern Quebec, it occupies most of the Island of Montreal, which spans 482.8 km², forming a boomerang-shaped strip 52 km in length and up to 18 km in width. Its 266 km of shoreline run along the St. Lawrence River and the Ottawa River, giving Montreal privileged access to waterways. Mount Royal, a landmark of Montreal’s landscape, dominates the city with its three major peaks, the highest reaching an elevation of 230 meters. These topographic and geographic characteristics make Montreal an ideal study site for analyzing urban dynamics in the context of a North American metropolis with distinct geographical features.
2.2. Data Sources
To answer our research questions, we will use four databases:
Canopy: the canopy is defined as the projection on the ground of the tree crown (including leaves, branches and trunk), which is visible from the sky. All vegetation taller than 2 meters was considered. The canopy was mapped using deep learning methods, based on variables (1 m resolution) calculated from raw airborne LiDAR data from 2010 to 2020 [
24].
Location of buildings, parks and green spaces: centroid and footprint representing the position of a building or a lot. The data is taken from the georeferenced Quebec property 2023 assessment roll [
25] and the Montreal 2024 cadastral data [
26]. Parks and green spaces are divided into categories according to the Land Use Codes of the property assessment units (
Table 1).
- 3.
The Canadian Index of Multiple Deprivation (CMDI) measures inequalities in social well-being, such as health, education and justice. Based on geographical data, it can also be used as a substitute for personal information. The Index assesses disadvantage across four main dimensions: residential instability, economic dependency, situational vulnerability, and ethno-cultural composition. These components use census data to measure socio-economic inequalities and identify vulnerable populations based on their housing, income, access to services and ethno-cultural background.
Table S1 summarizes CMDI dimensions [
27].
- 4.
Dissemination areas (DAs) are the smallest geographic units used by Statistics Canada for census data collection and dissemination. Each dissemination area covers a small region that usually contains between 400 and 700 people, allowing for detailed and localized statistical analysis [
28]. For the 2021 Canadian census, the Island of Montreal has 3,235 dissemination areas.
2.3. Green Space Variables
3 visible trees proxy: to assess the presence of trees around homes on the island of Montreal, we followed a multi-stage methodology. First, we used the property assessment roll file to pinpoint the precise location of residential buildings on the island of Montreal. Next, we created 25-metre buffer zones around each residential building to delimit the study areas [
14,
15,
17].
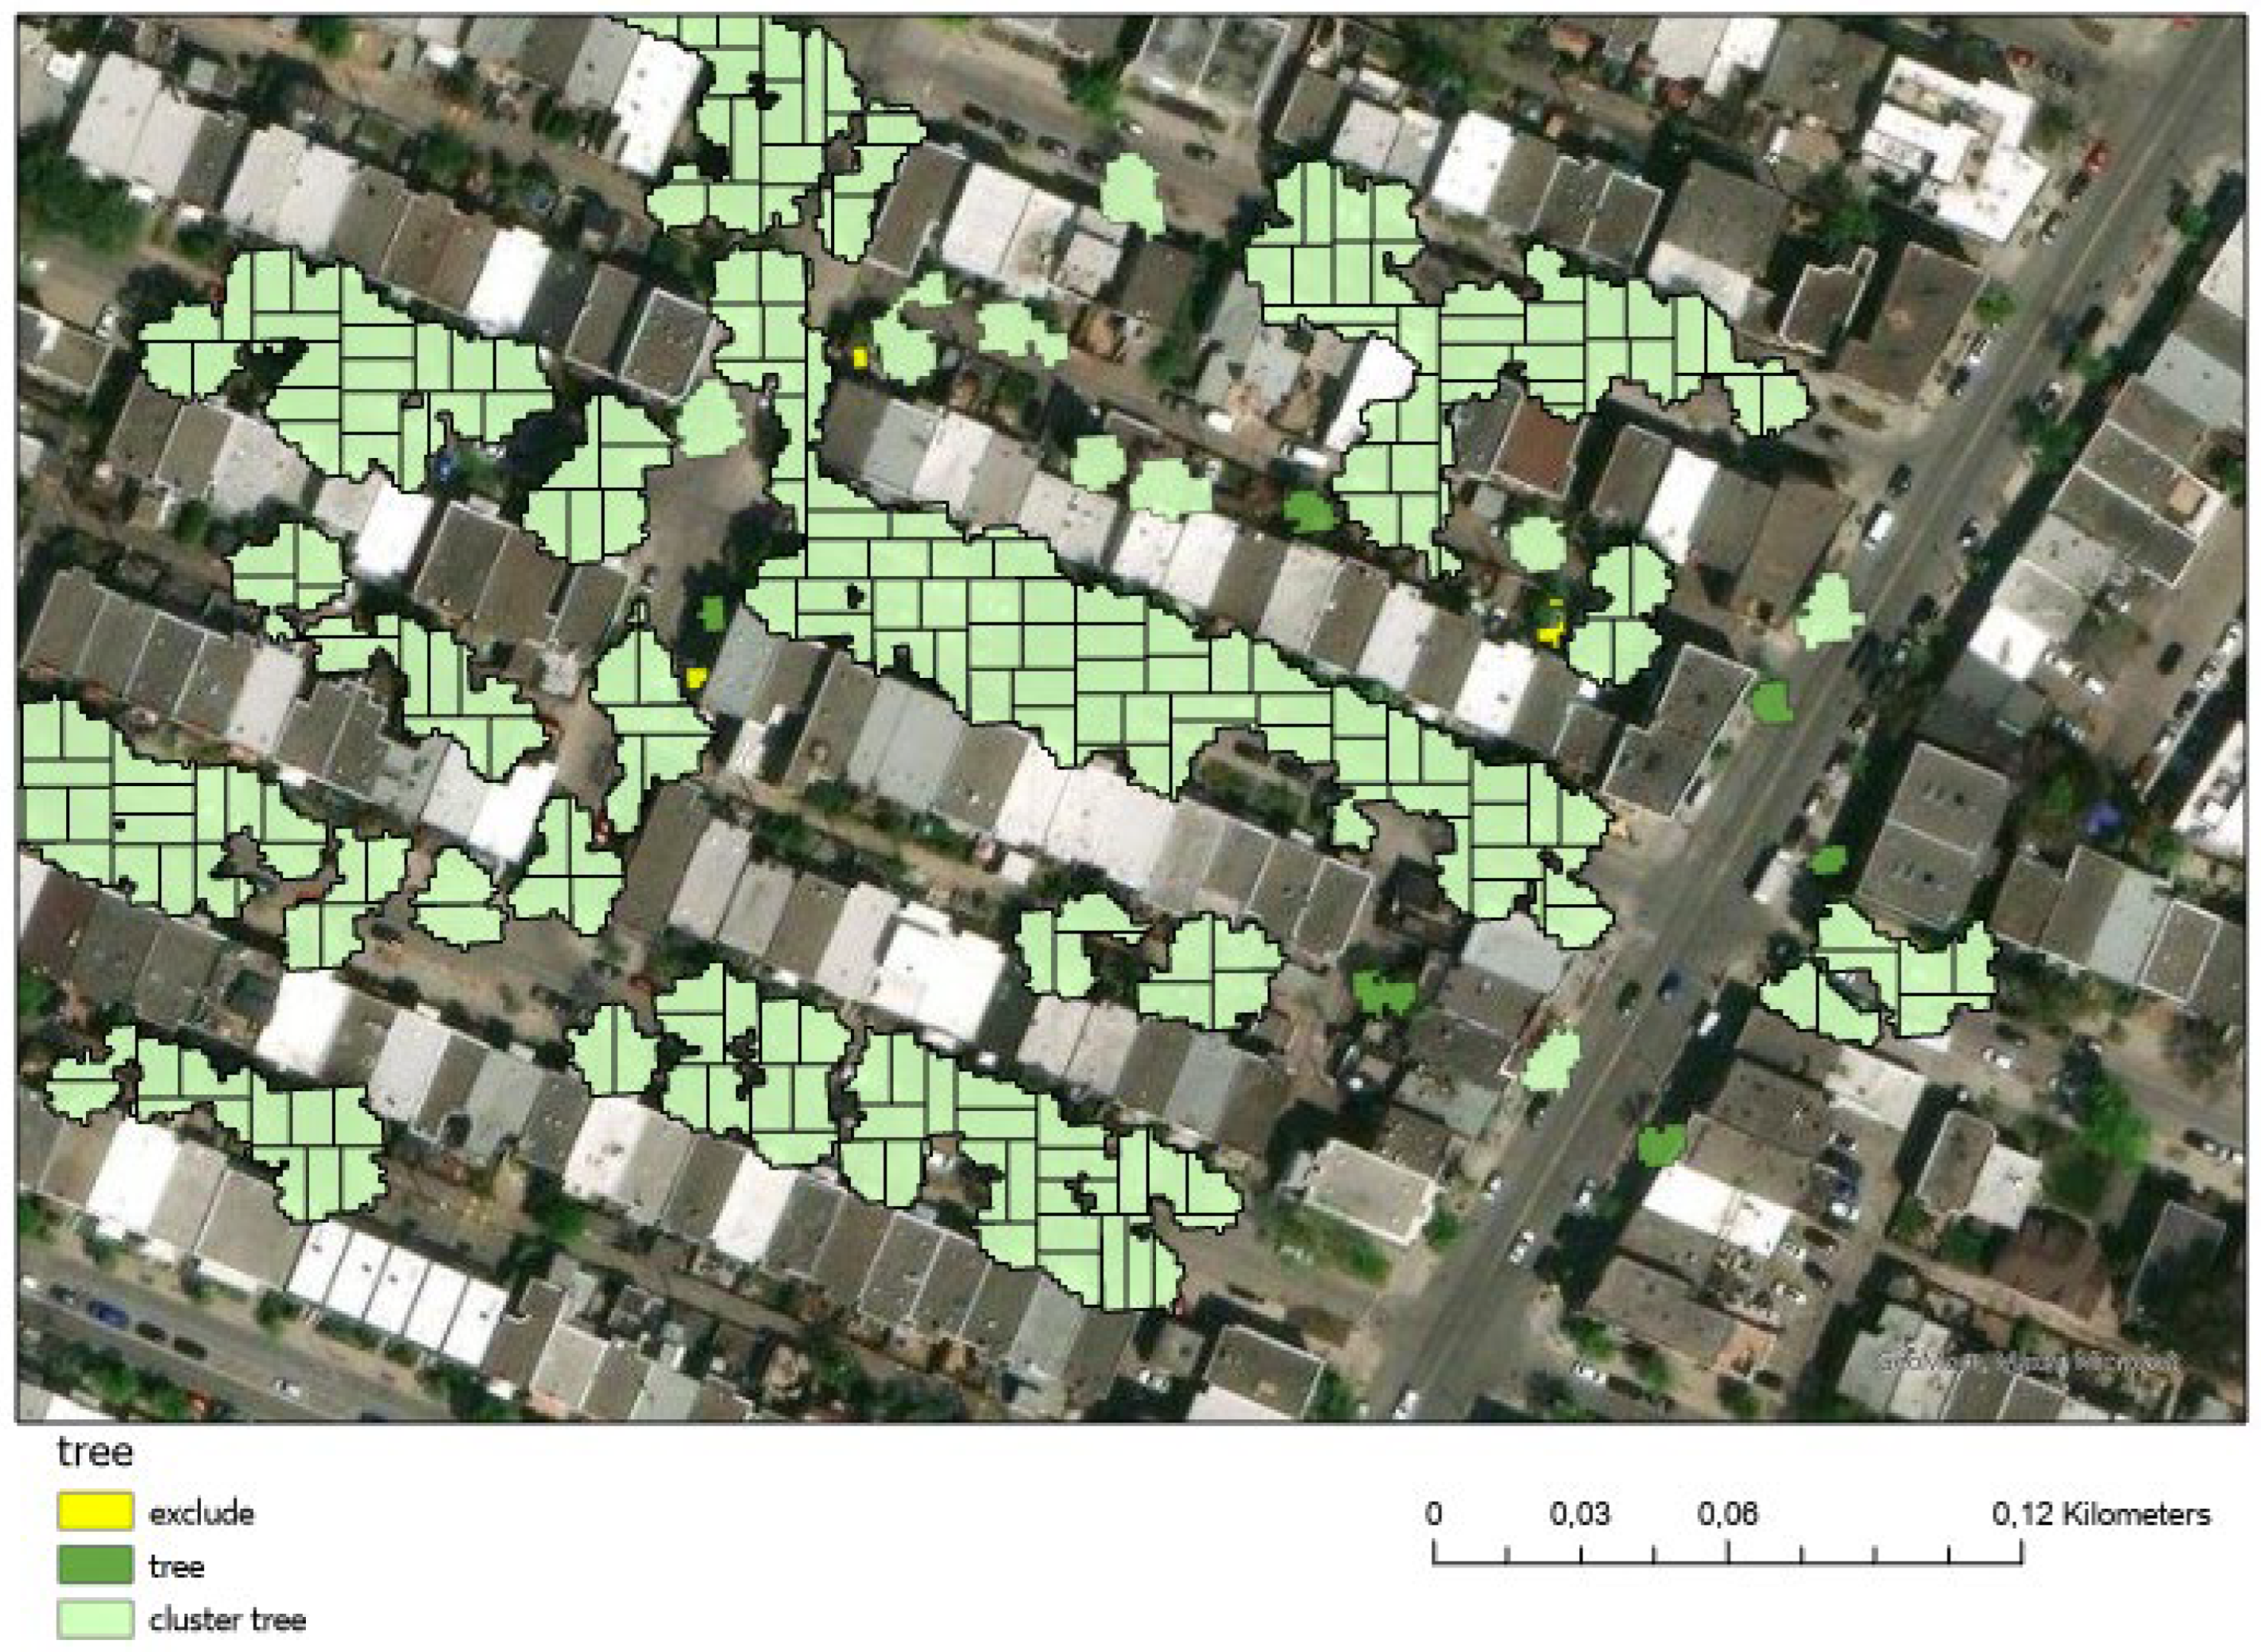
Given the lack of an exhaustive file listing all the trees on the island of Montreal, we adopted an alternative approach in three steps. We used the urban canopy file, which was available and detailed the distribution of trees in the form of polygons. To isolate trees from the dataset and achieve an accurate count, first we selected all polygons with an area between 25 and 100 square meters, corresponding to the typical crown diameter of mature trees in urban environments. This range was chosen based on typical crown sizes of medium to large trees in urban areas, where crown diameters generally range from 5 to 12 meters. The remaining polygons after the initial selection primarily represent clusters of trees located in the same area. To disaggregate these clusters and allow for a more accurate count of individual trees, each polygon was divided into several polygons of uniform size. The size of these new polygons corresponds to the average size of the polygons isolated in the first step, approximately 100 square meters. This dimension helps maintain the precision of the estimate while delineating each canopy area to capture individual trees within clusters (
Figure 2).
For each residential building, we then counted the number of polygons (representing trees) located in the 25-meter buffer zones. This method enabled us to make an effective and detailed assessment of the density of trees surrounding each residence, despite the challenges associated with the availability of specific data on urban vegetation. The approximate mean number of trees around residential buildings was then aggregated at the dissemination area level. We then dichotomized the values to identify dissemination areas with an average of three or more trees around residential locations versus areas with fewer than three trees.
30% tree canopy: the 30% canopy cover was calculated directly at the dissemination area level by dividing the total canopy area within each dissemination area by the total area of the dissemination area. We then dichotomized the values to identify dissemination areas with 30% or more canopy coverage versus areas with less than 30% canopy coverage.
300 meters to a park and a green space: potential spatial access from residential to park and a green space was calculated. Following the method of Apparicio et al. (2017), to estimate geographic accessibility to parks and green spaces, we defined an origin unit—population location, a destination unit—location of parks and green spaces larger than 0.5 hectares, an accessibility measure, and a metric of distance. Origin units are the locations of residential property assessment units, and the destination units are access points along park and green space perimeters. Accessibility is operationalized as a measure of finding the closest park to a given residential location through the road network—that is, streets available for use by people with mobility impairments or by pedestrians and cyclists in right. All distances were calculated in ArcGIS Pro 3.4 using Network Analyst by constructing the Origin–Destination Cost Matrix [
30]. We aggregated the values at the level of dissemination areas, and we then dichotomized the values to identify dissemination areas where residences are more than 300 meters from parks and green spaces versus areas where residences are, on average, within 300 meters.
2.4. Analysis
In alignment with the research questions and objectives, the study was structured around the following methodological framework:
The quantification of the 3-30-300 metric and spatial analyses (General G and Gi*) provide a detailed understanding of the distribution of green spaces, aligning with research question 1.
The use of inequality metrics like spatial correlation techniques like Lee’s L directly investigates the relationship between socio-economic factors and green space disparities, answering research question 2.
The combination of hot spot analysis, correlation analysis, and priority area identification bridges spatial inequalities and socio-economic vulnerabilities, addressing research question 3.
For each dissemination area, we calculated the percentage of the population and area that meet the three criteria of the 3-30-300 standard. Quantification was conducted separately for each criterion (3 trees, 30% canopy, and 300 meters proximity to park or green space). Geospatial data were used to identify areas that meet each criterion and to calculate the proportion of each neighborhood that meets the entire 3-30-300 standard.
We applied spatial analysis techniques specifically Getis-Ord General G for measuring spatial high/low clustering, to identify spatial distribution patterns of green spaces across dissemination areas. Getis-Ord General G is a spatial statistic used to analyze and detect global spatial clustering patterns in geographic data. This index can be used to determine whether high (or low) values of a variable are spatially clustered, or whether they are randomly distributed in space [
31].
The Getis-Ord General G is calculated as follows:
where
is the value of variable x at location
;
is the value of variable
at location
; and
is spatial weight matrix.
A hot spot analysis (Getis-Ord Gi*) was also conducted to pinpoint spatial concentrations of green spaces according to the 3-30-300 criteria. The Getis-Ord Gi* statistic is a local measure of spatial association used to identify specific locations (features) that contribute significantly to spatial clustering of high or low values in a dataset [
32,
33]. Unlike the Getis-Ord General G, which provides a global measure of clustering, the Gi* statistic focuses on identifying localized "hot spots" (high-value clusters) and "cold spots" (low-value clusters) within a study area. This step helped determine whether certain neighborhoods, or clusters of neighborhoods, have a significantly higher or lower concentration of green spaces than others [
14,
34,
35,
36,
37]. The Getis-Ord Gi* statistic for a feature is calculated as:
Where is a spatial weight matrix, with ones for all links defined as within of a given ; all other links are zero, including the link of to itself. The numerator is the sum of all within d of . The value of defines how many and which features will be included in the analysis. The denominator is the sum of all .
Finally, we calculated correlations between four main dimensions of Canadian Index of Multiple Deprivation (median income, education level, unemployment rate, population density) and the 3-30-300 index to identify possible relationships. We used the Bivariate Spatial Association (Lee's L) [
38]. Bivariate Spatial Association (Lee's L) is a spatial statistic used to measure the spatial correlation between two variables in a geographic region. It allows us to examine whether high values of one variable are associated with high (or low) values of another variable in a spatially consistent way, meaning in neighboring areas. This method is particularly useful for studying the co-occurrence of two phenomena in space, considering both the intensity of their association and their spatial arrangement. Correlation analysis allowed us to detect general trends between dissemination areas socio-economic status and green space access, helping determine whether disparities are associated with social factors [
35,
39,
40]. We identified high-priority dissemination areas for improving green space access based on their compounded disadvantage. All analyses were realized in ArcGIS Pro 3.4 [
41].
3. Results
3.1. Descriptive Statistics
The analysis of green infrastructure indicators reveals substantial variation in tree canopy cover, residential tree availability, and proximity to parks or green spaces (
Table 2). Tree canopy cover across the studied area ranges from 0.8% to 84.0%, with an average of 26.1% and a standard deviation of 11.3%. The median canopy coverage is 25.7%, with an interquartile range (IQR) spanning from 18.1% to 33.2%, indicating moderate variability in canopy distribution. Residential tree availability also shows significant disparity, with the number of surrounding trees varying between 0 and 279. The average number of trees is 5.9, though the median is much lower at 4.3, reflecting a skewed distribution. The IQR, ranging from 3.0 to 6.0, further emphasizes this concentration around lower values, with only a few areas exhibiting high tree density. The average distance to the nearest parks and green spaces shows a wide range, from 0 meters to 2,385.2 meters, with a mean distance of 297.1 meters and a standard deviation of 202.0 meters. The median distance is 254.8 meters, and the IQR of 224.3 meters (from 162.0 meters to 386.3 meters) indicates that most residences are within this range of park proximity.
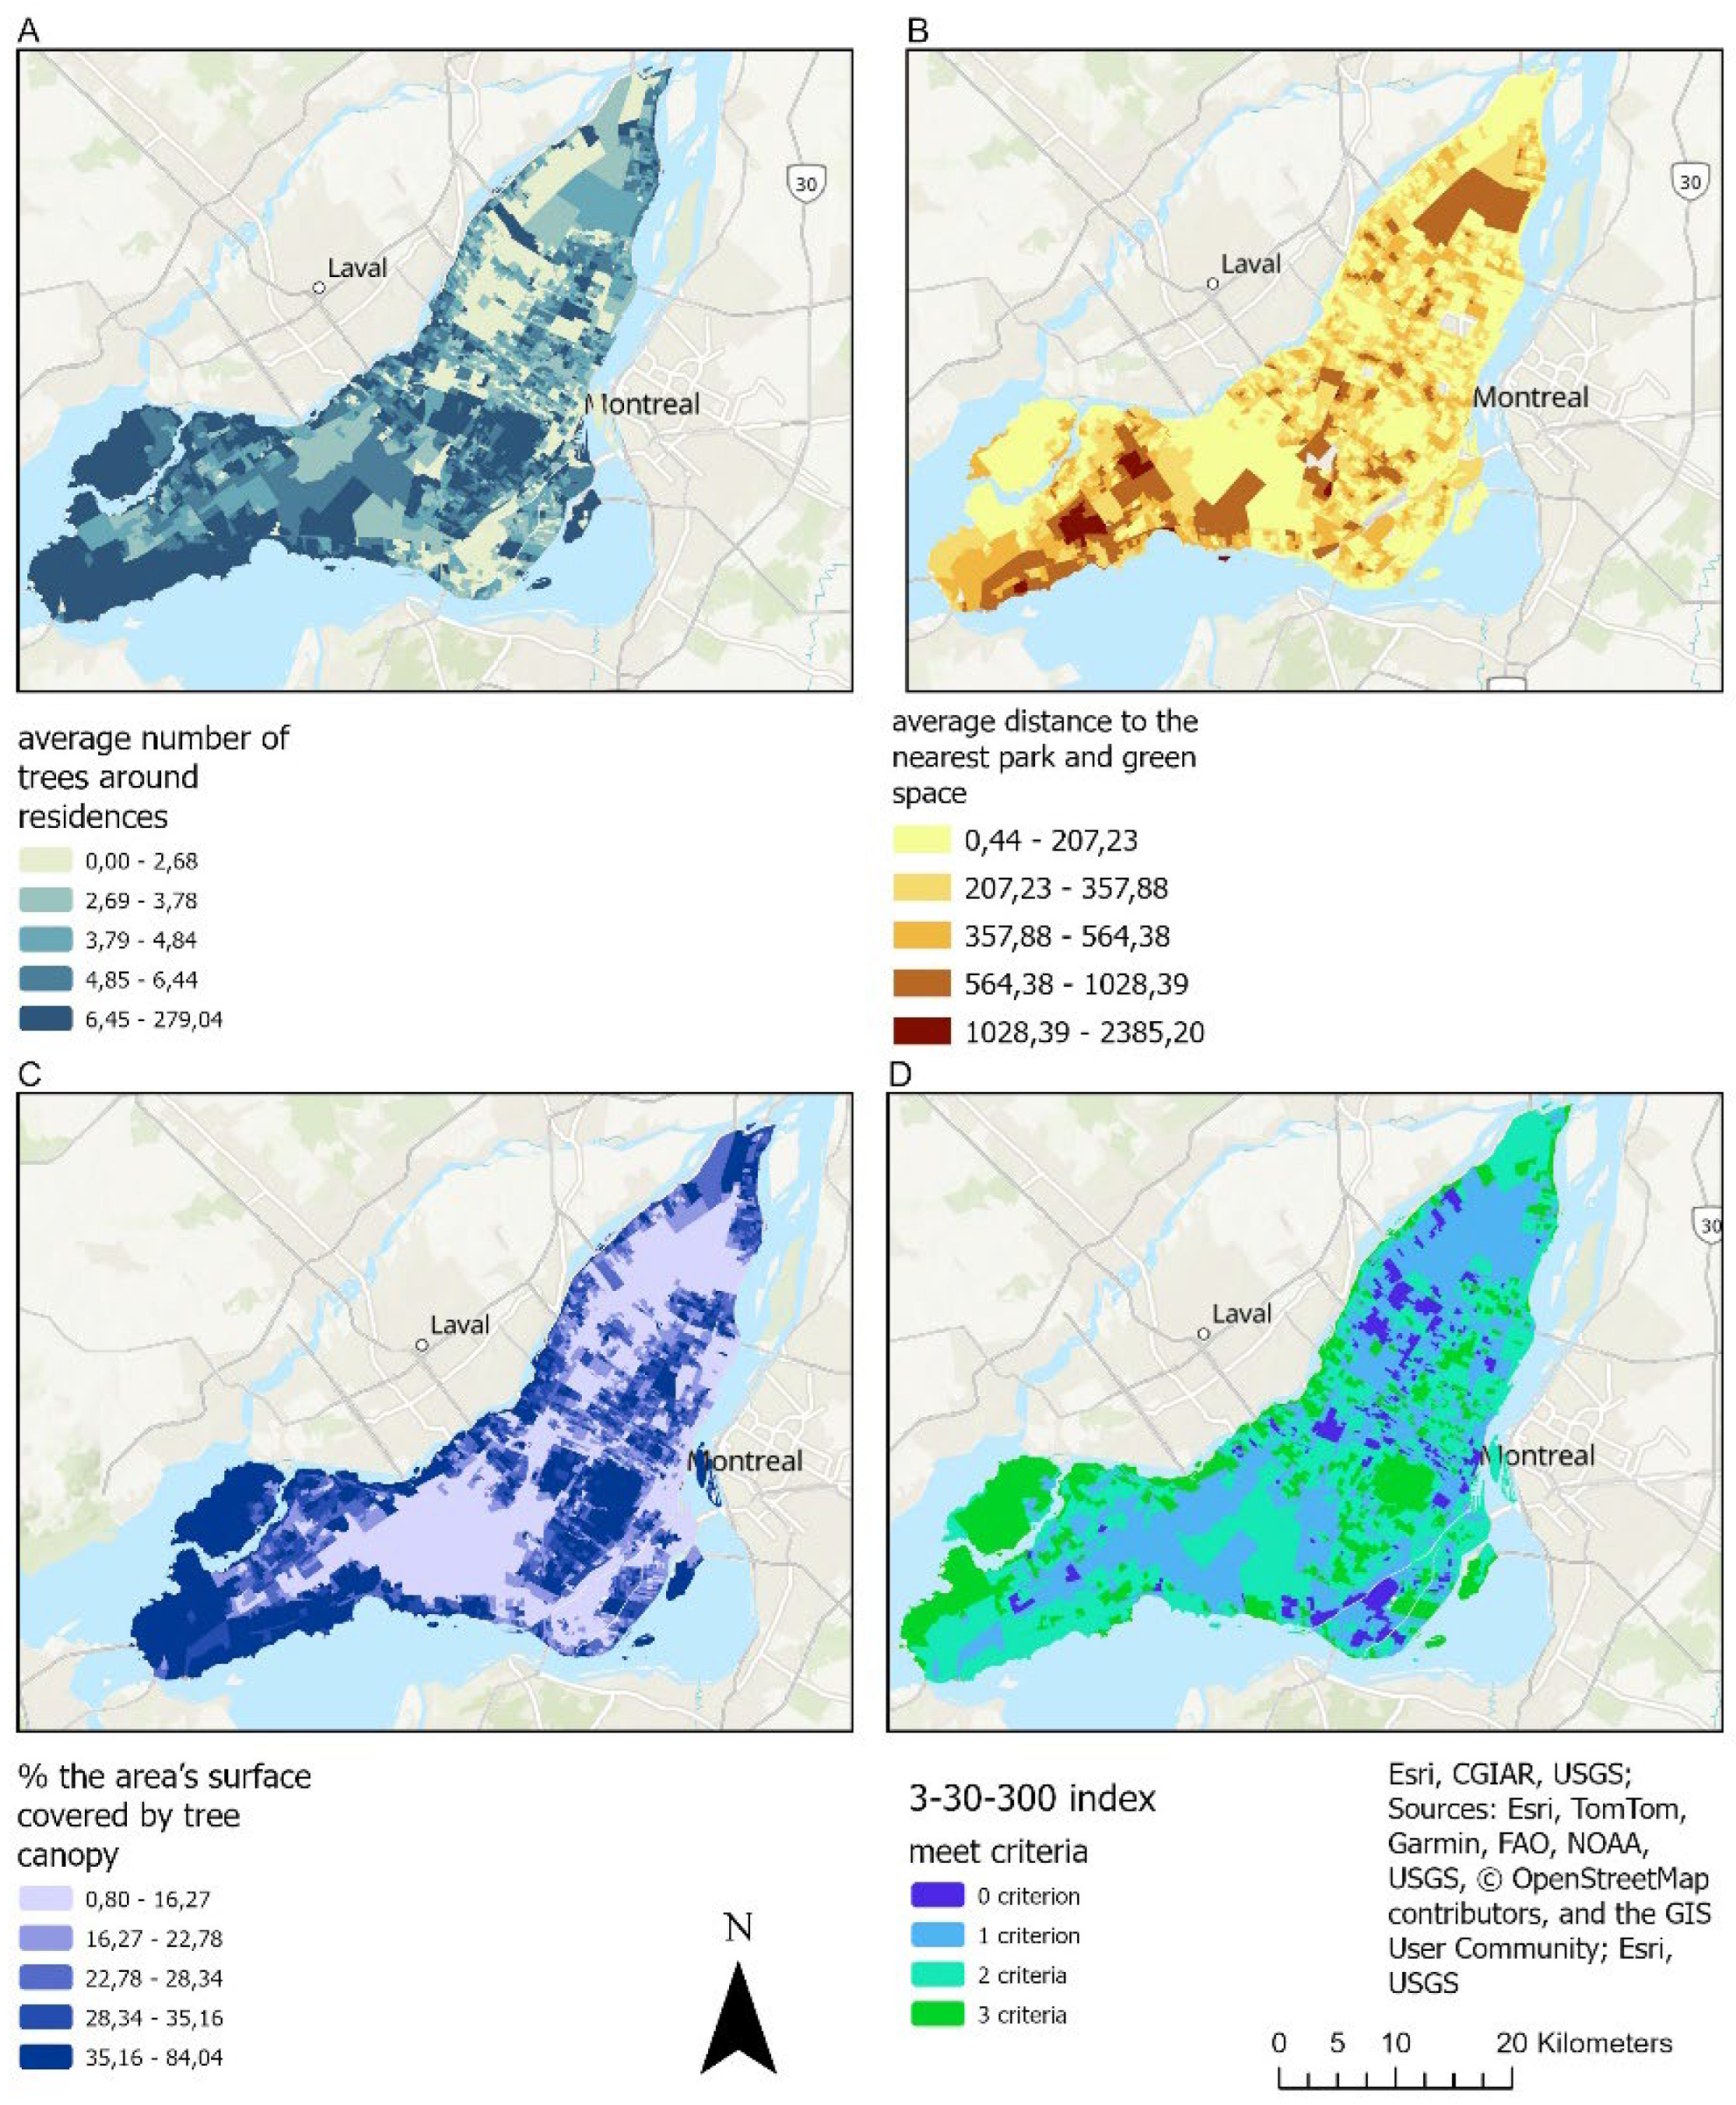
The spatial analysis of green infrastructure in Montreal reveals significant variability across the study area concerning tree density around residences, accessibility to parks and green spaces, and canopy coverage (
Figure 3).
The average number of trees near residences, illustrated in shades of green in Map A, varies greatly across Montreal. Tree density is highest in suburban areas such as the West Island, where the darkest green tones indicate averages exceeding 6.45 trees per residence. In contrast, urbanized neighborhoods, particularly in the eastern boroughs, are represented by lighter green tones, with averages often below 2.69 trees per residence.
Access to parks and green spaces, shown in shades of yellow to dark brown in map B, also highlights stark disparities. Central boroughs such as Plateau-Mont-Royal and downtown Montreal, depicted in pale yellow, enjoy relatively short distances to parks, ranging from 0.44 to 207 meters on average. However, peripheral areas, particularly in the northeast, are shaded in darker tones of brown, indicating distances exceeding 564 meters, with some reaching over 2,385 meters.
Tree canopy coverage, represented in shades of blue in Map C, further illustrates environmental inequities. Suburban neighborhoods, such as those in the West Island and central Laval, appear in the darkest blue shades, with canopy coverage exceeding 35%. Meanwhile, urbanized districts in the east and downtown Montreal are depicted in light blue, with coverage rates below 16.27%.
Map D combines these factors using shades of blue and green to evaluate how well neighborhoods meet the 3-30-300 criteria. Areas in dark green meet all three criteria, indicating robust green infrastructure, while light green and blue areas meet two, one, or no criteria. Suburban neighborhoods, particularly in the West Island, dominate the dark green zones, while central and eastern boroughs are primarily represented in shades of blue, reflecting neighborhoods that fail to meet any of the criteria.
Table 3 presents the population distribution by dissemination areas according to environmental criteria: number of trees within sight of the home, tree canopy cover, proximity to a park or green space, and the complete 3-30-300 index. Of the total population, 74.4% are living in an area with at least three trees in sight of their home, whereas 25.6% are living in an area with less than three trees in sight. In terms of canopy cover, only 31.3% of the population resided in areas with a minimum of 30% in tree canopy cover, and the majority, 68.7%, lived in areas with less than 30% canopy cover. Proximity to parks or green spaces is high, with 60.6% of the population residing within 300 meters of a park or green space, leaving 39.3% farther away from these amenities. However, when evaluating the integrated 3-30-300 index, only 18.9% of the population satisfies all three criteria, while 38.6% meet two criteria and 32.5% meet one. Notably, 10% of the population does not meet any of the 3-30-300 criteria.
3.2. Spatial Distribution Patterns of Park and Green Spaces Across Dissemination Areas
The
Table 4 summarizes the results of the General G statistic for all indices of the 3-30-300 indicator. The observed General G values (I3: 0.000338; I30: 0.000423; I300: 0.000423 and I330300: 0.000326) exceeds the expected General G value of 0.000309, which represents the mean value for a random spatial distribution of events. This discrepancy suggests a higher-than-expected concentration of events in certain areas. The variance is nearly zero, indicating minimal variability around the expected mean and strengthening the reliability of the statistical test. Furthermore, the z-scores are exceptionally high, demonstrating that the observed value significantly deviates from what would be expected in a random distribution. This is reinforced by an extremely low p-values (0.000000), allowing us to reject the null hypothesis and confirming that the observed clustering is statistically significant. Taken together, these results indicate a non-random, structured spatial distribution, with a significant degree of clustering among the green spaces accessibility analyzed.
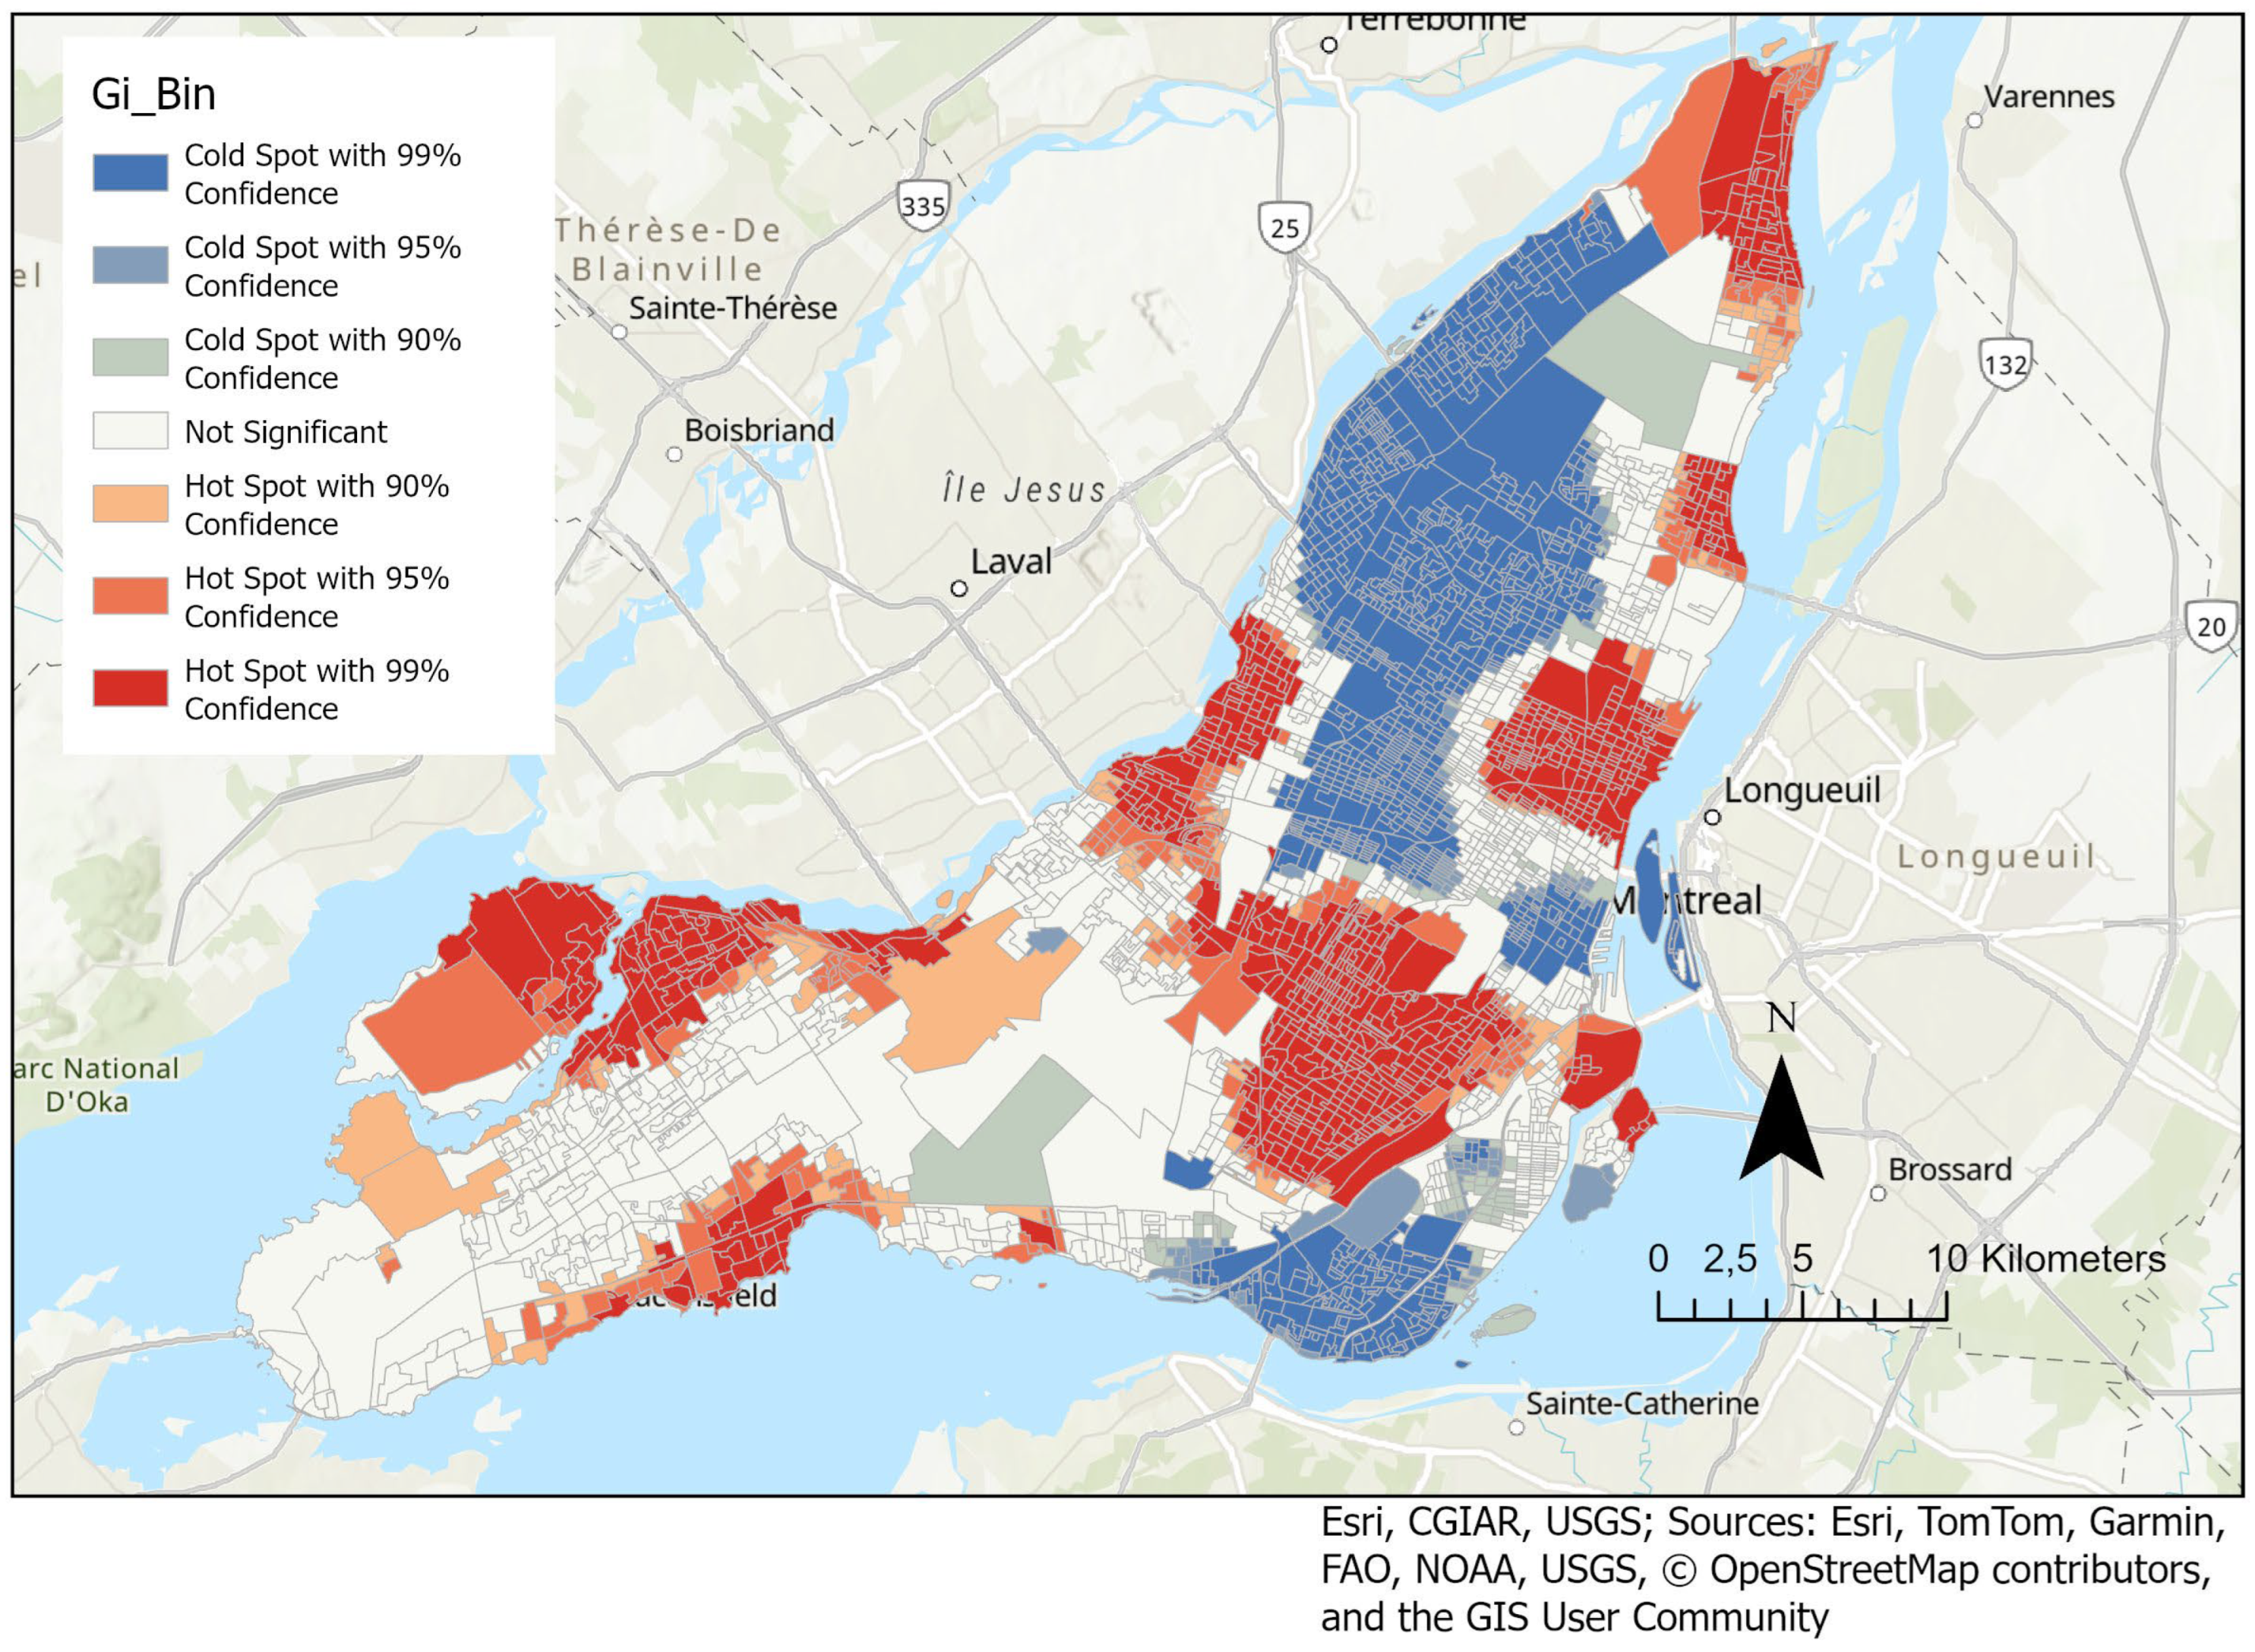
Figure 4 presents a spatial analysis of the 3-30-300 indicator. The red areas, or "hot spots," likely represent dissemination areas where these conditions are more effectively met, with higher tree cover, better visibility of greenery, and closer proximity to green spaces. These hot spots indicate dissemination areas that potentially meet or near meet the 3-30-300 standards. In contrast, the blue areas, or "cold spots," are regions where access to green infrastructure may be limited. These dissemination areas likely have lower tree canopy coverage, less visibility of trees, or less access to park and green spaces within the 300-meter threshold, meaning residents may experience fewer benefits associated with the 3-30-300 indicator. White areas, marked as "Not Significant," show no strong clustering pattern, suggesting intermediate or mixed levels of green space access.
3.4. Correlation Analysis Between Socio-Economic Dimensions and 3-30-300 Index
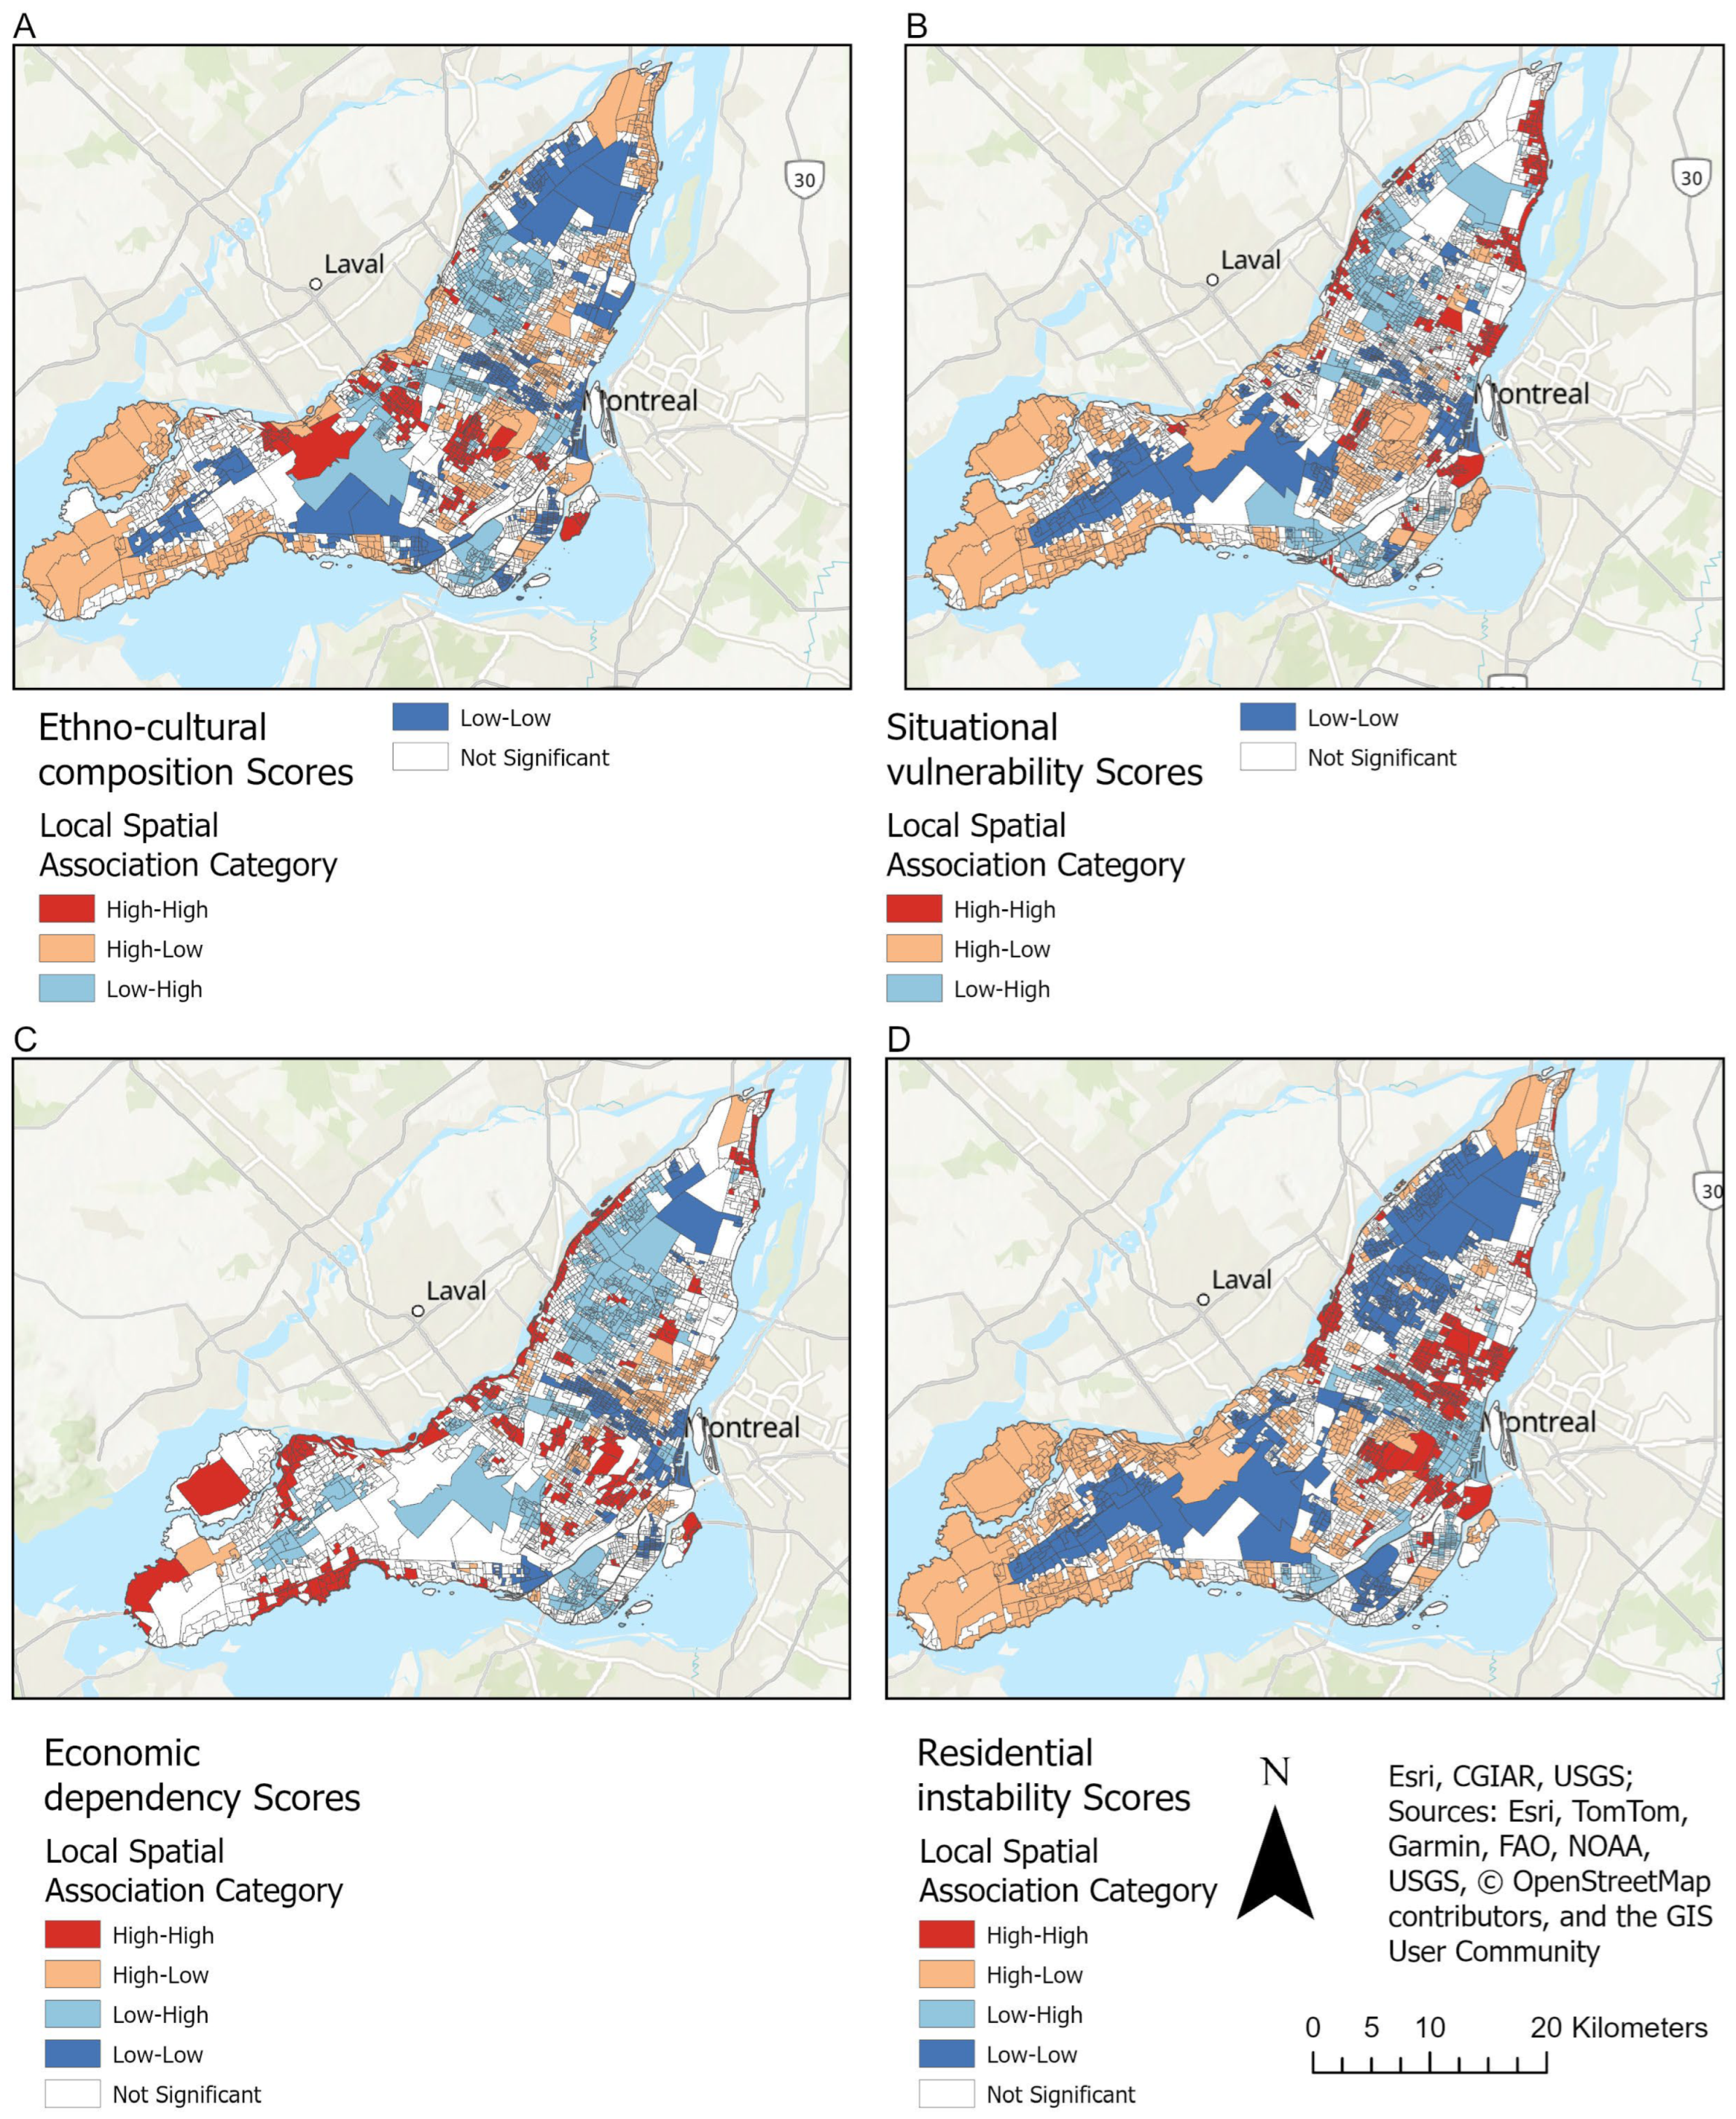
Using the Bivariate spatial association (Lee's L), we analyzed the correlation between socio-economic dimensions (ethno-cultural composition, situational vulnerability, economic dependency, and residential instability) and the 3-30-300 index across dissemination areas in Montreal. The following maps (A-D) (
Figure 5) display significant (p-value > 0.05) spatial clusters and associations, providing insights into how socio-economic factors interact with green infrastructure availability.
The spatial association between ethno-cultural composition scores and the 3-30-300 index reveals distinct spatial clusters (map A): High-High Clusters (red areas): dissemination areas with both high ethno-cultural diversity and high 3-30-300 scores, indicating that some ethnically diverse neighborhoods benefit from green infrastructure that meets or near meets the 3-30-300 criteria. Low-Low Clusters (blue areas): dissemination areas with low ethno-cultural diversity and low greenery scores, suggesting an overlap of low diversity with limited access to green infrastructure. High-Low and Low-High Clusters (orange and light blue areas): These clusters indicate neighborhoods where high ethno-cultural diversity is associated with low greenery scores (Low-High) and vice versa (High-Low).
The spatial association between situational vulnerability and the 3-30-300 index shows the following clusters (map B): High-High Clusters (red areas): High situational vulnerability and high greenery scores, suggesting that some vulnerable dissemination areas have access to green spaces meeting the 3-30-300 criteria. Low-Low Clusters (blue areas): Low vulnerability dissemination areas with low greenery scores, indicating areas that might be less prioritized for green infrastructure. High-Low and Low-High Clusters (orange and light blue areas): These clusters reveal vulnerable areas with limited greenery (Low-High), highlighting dissemination areas that may require targeted greening efforts to improve access for vulnerable populations.
The association between economic dependency and the 3-30-300 index displays important spatial patterns (map C): High-High Clusters (red areas): High economic dependency correlated with high greenery scores, indicating that some economically dependent areas have green infrastructure that meets 3-30-300 standards. Low-Low Clusters (blue areas): Low economic dependency dissemination areas with lower greenery scores, suggesting a possible inverse relationship between economic stability and green infrastructure in some neighborhoods. High-Low and Low-High Clusters (orange and light blue areas): These clusters show economically dependent areas with insufficient greenery (Low-High), suggesting that neighborhoods with high economic needs may lack adequate green spaces, highlighting a need for urban greening initiatives in economically disadvantaged areas.
The spatial association between residential instability and the 3-30-300 index demonstrates the following clustering patterns (map D): High-High Clusters (red areas): dissemination areas with high residential instability and high greenery scores, indicating that some transient neighborhoods benefit from green infrastructure. Low-Low Clusters (blue areas): Low residential instability areas with low greenery scores, suggesting that stable neighborhoods may not necessarily have high access to green spaces. High-Low and Low-High Clusters (orange and light blue areas): These clusters indicate areas with high residential instability and limited greenery (Low-High), suggesting that transient populations may face limitations in accessing green spaces, warranting targeted green infrastructure interventions.
The bivariate spatial association analysis highlights significant correlations between socio-economic dimensions and the 3-30-300 index, revealing clusters where socio-economic vulnerability intersects with green infrastructure availability. High-High clusters identify areas where vulnerable populations have access to green spaces, while Low-Low clusters pinpoint zones with low vulnerability and limited green infrastructure. Low-High clusters reveal disparities, indicating that vulnerable or economically dependent dissemination areas may lack access to adequate greenery, which could exacerbate social inequities.
4. Discussion
How does the distribution of green spaces vary across different neighborhoods in Montreal, as indicated by the 3-30-300 metric?
As depicted, the descriptives statistics quite significant variation in green space distribution across Montreal neighborhoods, as highlighted by the 3-30-300 metric. This implies that the metrics on tree canopy coverage, proximity to parks, and tree density around residences all show significant heterogeneity. Tree canopy cover ranges from 0.8% to 84.0%, with a median of 25.7%, suggesting moderate differences across neighborhoods. Distances to parks also vary greatly, ranging from less than immediately adjacent to more than 2,4 kilometers, indicating considerable variation in access. The number of trees within a resident's immediate surroundings also varies from none to as many as 279, with a very highly skewed distribution in the lower numbers of trees. The heterogeneity of the components in the 3-30-300 metric emphasizes that just a small fraction of neighborhoods will be able to meet these three criteria (18,9 %), Hotspots are primarily concentrated in central neighborhoods and well-established residential areas in western Montreal. On the other hand, peripheral neighborhoods, particularly in the north of Montreal, frequently do not reach any of these standards. This underlines strong spatial inequalities in green infrastructure within the city and points to the availability of green spaces in central Montreal neighborhoods over peripheral ones. These findings are in line with earlier studies that have revealed similar disparities in access to urban green space across cities worldwide [
42,
43]. Many studies have shown that the accessibility of green space varies widely between neighborhoods and that socioeconomic and demographic factors exacerbate these disparities. For example, a spatial prioritization analysis in Helsinki (Finland) indicated that park distribution is uneven, thus creating geographical inequalities in access to them [
44]. In Nanjing (China), the application of the G2SFCA method brought to light clear geographical inequalities in park accessibility, which was unevenly distributed throughout the urban areas [
45]. On the other hand, an evaluation in Iran, through hotspot analysis, found that public parks were spatially clustered in some areas while others lacked them (Rad & Alimohammadi, 2024) [
34]. In Shenzhen (China), transportation mode comparisons showed that green space accessibility varied significantly according to the travel mode, further emphasizing spatial disparities within the city [
46]. In a recent article using the 3-30-300 rule indicator in eight cities worldwide, underlining the important difficulties in achieving this benchmark, to which similar observations have also been made in Montréal. Analysis of the trio components of the 3-30-300 rule shows that there are stark contrasts. When evaluated, "3 trees in sight" was constantly the most easily attained, as a considerable number of properties in the cities studied provides views of at least three trees. But this visibility did not translate strongly to meeting the requirement of "30% neighborhood canopy cover," as trees in sight were often too small or not mature enough to produce substantial canopy. The weakest test across the board was the "30% canopy" test, with fewer than 20% of buildings meeting this threshold in most cities. This is because in dense urban settings, there is limited space availability and often suboptimal planting conditions, which restrict tree growth and limit canopy expansion. Results were patchy and heterogeneous in the "within 300m of a park or green space" test, with some cities doing relatively well and others showing vast areas without access to green spaces [
47].
In general, not many cities have succeeded in meeting all three components of the 3-30-300 rule simultaneously [
47,
48]. Those at the forefront of greening cities—Seattle and Singapore—more than 20 % and 40 % of their buildings, respectively, fall below the set benchmark [
47]. All these demonstrate fundamental failures of green infrastructure availability; something also on the drawing board of Montréal, where gaps in access to green spaces have been discovered. The chief contributors to the inadequacy of infrastructure include the growth and size restrictions on trees. For instance, New York had high intensities of tree planting density; the trees, however, were quite small, and thus the canopy coverages were limited. An additional finding was that trees in view from buildings often had a lack of maturity or were subject to removal or heavy pruning, which precluded them from achieving the required canopy coverage to meet the 30% goal. Similar challenges occur in Montréal, where tree growth conditions, space constraints, and premature removals affect the development of canopy. These findings collectively show the importance of addressing geographical disparities in urban green space distribution through focused policy interventions. A recent report of urban greening efforts has noted the increasing difficulties cities face in meeting ambitious goals like the 3-30-300 rule-of-thumb [
49]. Studies carried out in different urban regions of Sweden, such as Gothenburg and other locations in Southern Sweden, have found significant obstacles to reaching these targets, particularly in densely populated urban and industrial areas. In response to these challenges, an alternative approach called the 2-20-200 rule has been proposed as a more realistic outcome for cities with similar constraints. The 2-20-200 guideline revises the original criteria, lowering the threshold to include two observable trees, 20% coverage of tree canopy, and a maximum proximity of 200 meters to the nearest park or green space. The revision thus reflects pragmatic constraints within urban settings, particularly in metropolitan areas where there is limited opportunity for tree cultivation and intense land competition. For instance, the existing infrastructure makes it very hard to achieve a 30% tree canopy cover in city centers and industrial areas with large-scale tree planting programs.
In Gothenburg, the average tree canopy cover in the inner city is only 16.6%, which makes the original goal of 30% unrealistic without major interventions. In contrast, the canopy cover target of 20% is more in line with Sweden's national goal to reach 25% by the year 2030 and can be used as a base component for future greening initiatives. Correspondingly, the reduced distance of 200 meters to green spaces corresponds with common trends in many cities across Sweden. This would also encourage integration of measures for environmental sustainability within urban planning practices under the 2-20-200 framework. Urban planners and policy makers often must consider constraints of financial resources, spatial limits, and competing priorities. For instance, tree planting and care activities are often perceived as expenses rather than investments, especially in densely populated urban centers where land use is highly competitive. The 2-20-200 rule may overcome these barriers by setting more realistic targets, enabling the widest adoption, and aiding urban centers in making a significant difference in environmental sustainability without an undue strain on their resources.
What are the socio-economic factors influencing the disparities in access to green spaces as measured by the 3-30-300 indicator?
The disparities in access to green spaces, as indicated by the 3-30-300 metric, are influenced by a range of socio-economic factors. Analysis of the correlation using Bivariate Spatial Association-Lee's L-shows strong spatial clustering between socio-economic characteristics and green space access. Ethno-cultural composition, situational vulnerability, economic dependency, and residential instability are all clearly associated with green infrastructure availability. For example, high economic dependency or high residential instability may be related to low availability of green space, which would again point to systemic inequity. These findings agree with other studies that have sought to examine the socio-economic status-greenery availability relationship within urban settings and how this has commonly resulted in a low level of green infrastructure for marginalized communities [
50,
51]. The analysis of recent studies highlights significant disparities in access to parks and green spaces in various urban settings. For example, in Beijing, despite efforts to increase green space coverage, accessibility remains uneven across socio-economic groups, particularly impacting elderly populations and high-density areas [
52]. Similarly, in Porto, the use of the European Deprivation Index (EDI) revealed pronounced inequalities, with less privileged neighborhoods experiencing limited access to green spaces [
53]. On the other hand, highly socioeconomically vulnerable neighborhoods may have adequate green spaces, which would indicate that greening initiatives are indeed effective in certain areas but not implemented equitably. The identified Low-High clusters, where economically dependent neighborhoods show low access to green spaces, signal the need for targeted urban greening interventions to bridge such socioenvironmental gaps.
How can the 3-30-300 indicator be utilized to identify areas of Montreal with inadequate access to green spaces, particularly in relation to socio-environmental inequalities?
The 3-30-300 indicator can be a good tool in showing the green infrastructural gap in Montreal, especially toward socio-environmental inequalities. It will serve to determine which neighborhoods do not meet these key criteria: at least three trees around residence areas, 30% canopy cover, and at least one park within 300 meters from the households. The spatial analysis shows that most of the northern and peripheral neighborhoods are deficient in these aspects, with many areas not meeting any of the 3-30-300 standards. General G statistics also confirm the significant spatial inequality with the concentration of "cold spots," showing the insufficient green coverage in the vulnerable neighborhoods. These findings are in line with previous studies related to urban environmental justice, which pointed out that equal access to green spaces is one of the important social determinants of public health. It finds support in the works of Dai et al. (2011) and Anguelovski et al. (2018). The 3-30-300 metric provides a framework for specific policy interventions aimed at reducing inequity and advancing environmental justice, particularly with socio-economic data. In the context of Montréal, the 3, 30 and 300-meter or the 2-20-200 criteria appear attainable due to urban policies and existing vegetation.
Addressing this challenge requires targeted interventions in underserved areas, such as the development of urban green corridors or the conversion of vacant lots, to ensure equitable access to environmental benefits. Consequently, such targeted urban greening initiatives could focus on neighborhoods detected by Low-High clusters, therefore addressing socioenvironmental inequalities and improving the residents' quality of life.
This paper has given a critical outlook on green space distribution in Montreal and socioeconomic factors influencing inequalities; however, there are a few aspects that call for further attention. The studies might be conducted longitudinally to assess changes in the distribution of green space over time to ascertain whether current greening initiatives are effective in reducing disparities. The findings from such studies can also serve to inform how urban greening policies influence socio-environmental equity over the longer term. Furthermore, knowledge on the health outcomes of variable green space access could offer more substantial support for an equitable green infrastructure. By linking green space access to physical and mental health metrics, future research could provide evidence-based recommendations for urban planning and public health policy. Another interest is to see the place of community involvement in greening processes. Understanding the ways that local communities shape, or influence, or can participate in greening initiatives may lead to important understandings about pathways toward more equitable green space distributions. It will also be beneficial to investigate the functioning of green spaces in enabling neighborhood resilience toward various manifestations of climate change, such as heat islands and flood events. There might be a need to point out how equitable access to green infrastructure contributes to building climate resilience, and vice versa, through both environmental and social policy. Further, comparative research in other cities with similar socioeconomic profiles could provide broader insight into the effectiveness of various greening strategies. Comparing and contrasting would identify best practices that could be applied within each study community to develop targeted interventions focused on access to green space. Finally, research into socio-cultural preferences and perceptions of green spaces can help tailor interventions to diverse community needs. Understanding how various population groups value and use green spaces may lead to more inclusive urban planning practices.
5. Strengths and Weaknesses of the Research
This study has many strengths that contribute to a better understanding of the distribution of green spaces and socio-environmental inequalities in Montreal. A major strength of the study is the application of the 3-30-300 metric, which offers a very holistic and multi-dimensional assessment of access to green spaces by considering measures such as tree density, canopy cover, and proximity to parks [
5,
13,
14,
15,
16,
17]. That way, there is a much broader understanding concerning green infrastructure across different neighborhoods and all aspects of accessibility to green spaces critical to public health outcomes. Additionally, the integration of socio-economic data with spatial analytical methods reveals essential information on inequities affecting communities, therefore showing potential areas of intervention with greater accuracy. Such tools as the General G statistic strengthen the analysis in measuring inequalities and spatial clustering, thereby providing strong evidence to base policy recommendations on.
Limitations do, however, exist in the study. Proxies can be error-prone, as they may not fully capture the true number of trees or account. Those limitations could give rise to potential biases in the assessment of access to green spaces [
56]. Another major limitation is represented by the cross-sectional nature of the analysis—a snapshot of the distribution of green spaces at a single point in time is just temporal. This constraint makes it difficult to assess how access to green spaces may have changed over time or due to the implementation of policy interventions. Such longitudinal data would be needed to properly measure the impact of greening initiatives and track progress towards reducing inequities [
52,
57]. Another concern is that it relies upon spatial indicators, which probably do not represent the full picture in terms of usability or quality of green spaces. While tree density and proximity are good indicators, they do not take into consideration other factors like the amenities in parks, level of upkeep, or perceived safety that influence how residents use and benefit from green spaces. Studies have shown that the perceived quality of green spaces is directly linked to residents' satisfaction with their neighborhoods. For example, Ta et al. (2021) and Zhang et al. (2017) highlight that residents feel more satisfied when green spaces are perceived as being of high quality, regardless of their quantity. Additionally, Richardson & Mitchell (2010) note that the health benefits associated with green spaces may vary by gender, with women being more influenced by subjective indicators of quality and personal safety. These findings also suggest that tree density alone is an insufficient proxy for the usage and benefits of green spaces. The management of parks also needs to take into consideration other factors, such as perceived safety. Evensen et al. (2010) have shown that landscape design interventions, including hedge height, can affect perceptions of safety in green spaces [
61]. Furthermore, research has revealed that park characteristics, including their appeal, size, and proximity, are critical determinants of their use for recreational activities [
62]. Thus, the structural diversity of parks, encompassing both biotic and abiotic elements, plays a significant role in how people use and value these spaces [
63]. Moreover, focusing the study on Montreal might limit the generalizability of the results to other urban contexts, especially those different in their socio-economic and environmental conditions. Comparative studies with other cities would help to validate the findings and put them into a broader perspective of urban green space inequalities. Lastly, while the study indicates the correlations between socioeconomic factors and access to green spaces, it does not explain the causality. Mixed-method approaches, which include qualitative research, could be very beneficial in future studies to understand the underpinning causes of these disparities and to explore issues within the lived experiences of affected communities. Mixed-method research has been acknowledged to have the potential to bring a more nuanced view toward understanding social phenomena, including health disparities related to green space access. For example, incorporating both qualitative and quantitative methods into a study allows the capture of complexities in individual experiences and contextual factors that may influence access to green spaces [
64]. This approach will illustrate how socioeconomic status, cultural background, and issues related to personal mobility interact in affecting access to those essential resources. Some qualitative studies, such as research into the experiences of people with mobility impairments, have noted the barriers that certain groups face in accessing green spaces, and this shows that interventions need to be targeted at such groups [
65].
Supplementary Materials
The following supporting information can be downloaded at: Preprints.org: The four dimensions of multiple deprivation and their corresponding indicators, Québec, 2021
Author Contributions
Conceptualization Eric Robitaille, Cherlie Douyon; methodology, Eric Robitaille, Cherlie Douyon; software, Eric Robitaille; validation, Eric Robitaille, Cherlie Douyon; formal analysis, Eric Robitaille; writing—original draft preparation, Eric Robitaille, Cherlie Douyon; writing—review & editing, Eric Robitaille, Cherlie Douyon; supervision, Eric Robitaille; project administration, Eric Robitaille. All authors have read and agreed to the published version of the manuscript.
Funding
This research received no external funding
Data Availability Statement
The dataset supporting the findings of this study is publicly available on the Open Science Framework (OSF) at the following link:
https://osf.io/zq6c5/?view_only=ee8f50d165a0468caa7f31209dc21782. The data include geospatial indicators related to the 3-30-300 rule calculated at the dissemination area level, along with the shapefile containing the geographic boundaries and corresponding attributes.
Acknowledgments
The authors would like to express their gratitude to Patrick Morency, Public Health Specialist, for his valuable insights and guidance, which greatly contributed to the development and refinement of this study.
Conflicts of Interest
The authors declare no conflicts of interest.
References
- Gascon, M.; Zijlema, W.; Vert, C.; White, M.P.; Nieuwenhuijsen, M.J. Outdoor Blue Spaces, Human Health and Well-Being: A Systematic Review of Quantitative Studies. Int. J. Hyg. Environ. Health 2017, 220, 1207–1221. [Google Scholar] [CrossRef] [PubMed]
- Guinaudeau, B.; Brink, M.; Schäffer, B.; Schlaepfer, M.A. A Methodology for Quantifying the Spatial Distribution and Social Equity of Urban Green and Blue Spaces. Sustainability 2023, 15, 16886. [Google Scholar] [CrossRef]
- Labib, S.M.; Lindley, S.; Huck, J.J. Spatial Dimensions of the Influence of Urban Green-Blue Spaces on Human Health: A Systematic Review. Environ. Res. 2020, 180, 108869. [Google Scholar] [CrossRef] [PubMed]
- Li, L.; Lange, K.W. Assessing the Relationship between Urban Blue-Green Infrastructure and Stress Resilience in Real Settings: A Systematic Review. Sustainability 2023, 15, 9240. [Google Scholar] [CrossRef]
- Browning, M.H.E.M.; Locke, D.H.; Konijnendijk, C.; Labib, S.M.; Rigolon, A.; Yeager, R.; Bardhan, M.; Berland, A.; Dadvand, P.; Helbich, M.; et al. Measuring the 3-30-300 Rule to Help Cities Meet Nature Access Thresholds. Sci. Total Environ. 2024, 907, 167739. [Google Scholar] [CrossRef] [PubMed]
- OMS Physical Activity. Available online:https://www.who.int/news-room/fact-sheets/detail/physical-activity (accessed on 15 October 2024).
- Das, P.; Horton, R. Physical Activity—Time to Take It Seriously and Regularly. The Lancet 2016, 388, 1254–1255. [Google Scholar] [CrossRef]
- Hartig, T.; Mitchell, R.; de Vries, S.; Frumkin, H. Nature and Health. Annu. Rev. Public Health 2014, 35. [Google Scholar] [CrossRef]
- Frumkin, H.; Bratman, G.N.; Breslow, S.J.; Cochran, B.; Kahn Jr, P.H.; Lawler, J.J.; Levin, P.S.; Tandon, P.S.; Varanasi, U.; Wolf, K.L.; et al. Nature Contact and Human Health: A Research Agenda. Environ. Health Perspect. 2017, 125, 075001. [Google Scholar] [CrossRef] [PubMed]
- Shanahan, D.F.; Bush, R.; Gaston, K.J.; Lin, B.B.; Dean, J.; Barber, E.; Fuller, R.A. Health Benefits from Nature Experiences Depend on Dose. Sci. Rep. 2016, 6, 28551. [Google Scholar] [CrossRef] [PubMed]
- Calogiuri, G.; Chroni, S. The Impact of the Natural Environment on the Promotion of Active Living: An Integrative Systematic Review. BMC Public Health 2014, 14, 873. [Google Scholar] [CrossRef]
- Ulrich, R.S. View through a Window May Influence Recovery from Surgery. Science 1984, 224, 420–421. [Google Scholar] [CrossRef] [PubMed]
- Konijnendijk, C.C. Evidence-Based Guidelines for Greener, Healthier, More Resilient Neighbourhoods: Introducing the 3–30–300 Rule. J. For. Res. 2023, 34, 821–830. [Google Scholar] [CrossRef]
- Zheng, Y.; Lin, T.; Hamm, N.A.S.; Liu, J.; Zhou, T.; Geng, H.; Zhang, J.; Ye, H.; Zhang, G.; Wang, X.; et al. Quantitative Evaluation of Urban Green Exposure and Its Impact on Human Health: A Case Study on the 3-30-300 Green Space Rule. Sci. Total Environ. 2024, 924, 171461. [Google Scholar] [CrossRef] [PubMed]
- Nieuwenhuijsen, M.J.; Dadvand, P.; Márquez, S.; Bartoll, X.; Barboza, E.P.; Cirach, M.; Borrell, C.; Zijlema, W.L. The Evaluation of the 3-30-300 Green Space Rule and Mental Health. Environ. Res. 2022, 215, 114387. [Google Scholar] [CrossRef]
- Koeser, A.; Hauer, R.; Andreu, M.; Northrop, R.; Clarke, M.; Diaz, J.; Hilbert, D.; Konijnendijk, C.; Landry, S.; Thompson, G.; et al. Using the 3-30-300 Rule to Assess Urban Forest Access and Preferences in Florida (United States) 2023.
- Daland, S. An Investigation of the 3-30-300 Rule in a Swedish Context. 2023.
- OMS Urban Green Spaces: A Brief for Action; Genève, 2017; p. 22;
- INSPQ Verdissement. Available online: https://www.inspq.qc.ca/changements-climatiques/actions/verdissement#:~:text=L'OMS%20sugg%C3%A8re%20un%20acc%C3%A8s,de%20marche%20de%20son%20domicile (accessed on 13 October 2024).
- Chen, Y.; Yue, W.; La Rosa, D. Which Communities Have Better Accessibility to Green Space? An Investigation into Environmental Inequality Using Big Data. Landsc. Urban Plan. 2020, 204, 103919. [Google Scholar] [CrossRef]
- Young, M. Justice and the Politics of Difference; REV-Revised.; Princeton University Press, 1990; ISBN 978-0-691-15262-2.
- Rawls, J. A Theory of Justice: Original Edition; Harvard University Press, 1971; ISBN 978-0-674-88010-8.
- Gouvernement du Canada Montreal. Available online: https://www.thecanadianencyclopedia.ca/en/article/montreal (accessed on 7 December 2024).
- INSPQ Canopée Des Six RMR Du Québec 2022 2022.
- MINISTÈRE DES AFFAIRES MUNICIPALES ET DE L’HABITATION Rôles d’évaluation Foncière Du Québec 2024.
- VILLE DE MONTRÉAL. Unités d’évaluation Foncière 2024.
- Statistique Canada Canadian Index of Multiple Deprivation: Dataset and User Guide 2023.
- Statistique Canada Dissemination Area 2021.
- Apparicio, P.; Gelb, J.; Dubé, A.-S.; Kingham, S.; Gauvin, L.; Robitaille, É. The Approaches to Measuring the Potential Spatial Access to Urban Health Services Revisited: Distance Types and Aggregation-Error Issues. Int. J. Health Geogr. 2017, 16, 32. [Google Scholar] [CrossRef]
- ESRI Generate Origin Destination Cost Matrix (Ready To Use) Available online: https://pro.arcgis.com/en/pro-app/latest/tool-reference/ready-to-use/itemdesc-generateorigindestinationcostmatrix.htm.
- ESRI Fonctionnement de l’outil High/Low Clustering (Getis-Ord General G). Available online: https://pro.arcgis.com/fr/pro-app/latest/tool-reference/spatial-statistics/h-how-high-low-clustering-getis-ord-general-g-spat.htm (accessed on 7 December 2024).
- Getis, A.; Ord, J.K. The Analysis of Spatial Association by Use of Distance Statistics. Geogr. Anal. 1992, 24, 189–206. [Google Scholar] [CrossRef]
- Ord, J.; Getis, A. Local Spatial Autocorrelation Statistics - Distributional Issues and an Application. Geogr. Anal. 1995, 27, 286–306. [Google Scholar] [CrossRef]
- Rad, T.G.; Alimohammadi, A. A User-Based Approach for Assessing Spatial Equity of Attractiveness and Accessibility to Alternative Urban Parks. Geo-Spat. Inf. Sci. 2024, 27, 487–504. [Google Scholar] [CrossRef]
- Meng, D.; Zhang, J.; Cai, Z.; Xu, S. Evaluating the Accessibility of Seniors to Urban Park Green Spaces. J. Urban Plan. Dev. 2024, 150, 1–11. [Google Scholar] [CrossRef]
- Jin, Y.; He, R.; Hong, J.; Luo, D.; Xiong, G. Assessing the Accessibility and Equity of Urban Green Spaces from Supply and Demand Perspectives: A Case Study of a Mountainous City in China. Land 2023, 12. [Google Scholar] [CrossRef]
- Cao, M.; Yao, H.; Xia, J.; Fu, G.; Chen, Y.; Wang, W.; Li, J.; Zhang, Y. Accessibility-Based Equity Assessment of Urban Parks in Beijing. J. Urban Plan. Dev. 2021, 147, 1–8. [Google Scholar] [CrossRef]
- Lee, S.-I. Developing a Bivariate Spatial Association Measure: An Integration of Pearson’s r and Moran’s I. J. Geogr. Syst. 2001, 3, 369–385. [Google Scholar] [CrossRef]
- Yu, S.; Zhu, X.; He, Q. An Assessment of Urban Park Access Using House-Level Data in Urban China: Through the Lens of Social Equity. Int. J. Environ. Res. Public. Health 2020, 17. [Google Scholar] [CrossRef]
- Zhang, J.; Cheng, Y.; Zhao, B. Assessing the Inequities in Access to Peri-Urban Parks at the Regional Level: A Case Study in China’s Largest Urban Agglomeration. Urban For. Urban Green. 2021, 65. [Google Scholar] [CrossRef]
- ESRI ArcGIS Pro 2024.
- Kabisch, N.; Haase, D. Green Justice or Just Green? Provision of Urban Green Spaces in Berlin, Germany. Landsc. Urban Plan. 2014, 122, 129–139. [Google Scholar] [CrossRef]
- Wolch, J.R.; Byrne, J.; Newell, J.P. Urban Green Space, Public Health, and Environmental Justice: The Challenge of Making Cities ‘Just Green Enough. ’ Landsc. Urban Plan. 2014, 125, 234–244. [Google Scholar] [CrossRef]
- Jalkanen, J.; Fabritius, H.; Vierikko, K.; Moilanen, A.; Toivonen, T. Analyzing Fair Access to Urban Green Areas Using Multimodal Accessibility Measures and Spatial Prioritization. Appl. Geogr. 2020, 124, N.PAG. [Google Scholar] [CrossRef]
- Li, Z.; Fan, Z.; Song, Y.; Chai, Y. Assessing Equity in Park Accessibility Using a Travel Behavior-Based G2SFCA Method in Nanjing, China. J. Transp. Geogr. 2021, 96. [Google Scholar] [CrossRef]
- Zhang, L.; Chen, P.; Hui, F. Refining the Accessibility Evaluation of Urban Green Spaces with Multiple Sources of Mobility Data: A Case Study in Shenzhen, China. Urban For. Urban Green. 2022, 70, N.PAG. [Google Scholar] [CrossRef]
- Croeser, T.; Sharma, R.; Weisser, W.W.; Bekessy, S.A. Acute Canopy Deficits in Global Cities Exposed by the 3-30-300 Benchmark for Urban Nature. Nat. Commun. 2024, 15, 9333. [Google Scholar] [CrossRef] [PubMed]
- Wyrzykowski, B.; Mościcka, A. Implementation of the 3-30-300 Green City Concept: Warsaw Case Study. Appl. Sci. 2024, 14, 10566. [Google Scholar] [CrossRef]
- Daland, S. An Investigation of the 3-30-300 Rule in a Swedish Context. 2023.
- Rigolon, A. A Complex Landscape of Inequity in Access to Urban Parks: A Literature Review. Landsc. Urban Plan. 2016, 153, 160–169. [Google Scholar] [CrossRef]
- Jennings, V.; Larson, L.; Yun, J. Advancing Sustainability through Urban Green Space: Cultural Ecosystem Services, Equity, and Social Determinants of Health. Int. J. Environ. Res. Public. Health 2016, 13, 196. [Google Scholar] [CrossRef]
- Cao, M.; Yao, H.; Xia, J.; Fu, G.; Chen, Y.; Wang, W.; Li, J.; Zhang, Y. Accessibility-Based Equity Assessment of Urban Parks in Beijing. J. Urban Plan. Dev. 2021, 147, 1–8. [Google Scholar] [CrossRef]
- Hoffimann, E.; Barros, H.; Ribeiro, A.I. Socioeconomic Inequalities in Green Space Quality and Accessibility-Evidence from a Southern European City. Int J Env. Res Public Health 2017, 14, 916. [Google Scholar] [CrossRef] [PubMed]
- Dai, D. Racial/Ethnic and Socioeconomic Disparities in Urban Green Space Accessibility: Where to Intervene? Landsc. Urban Plan. 2011, 102, 234–244. [Google Scholar] [CrossRef]
- Anguelovski, I.; Connolly, J.J.T.; Masip, L.; Pearsall, H. Assessing Green Gentrification in Historically Disenfranchised Neighborhoods: A Longitudinal and Spatial Analysis of Barcelona. Urban Geogr. 2018, 39, 458–491. [Google Scholar] [CrossRef]
- Meng, Y.; Shi, J.; Lyu, M.; Sun, D.; Fukuda, H. Research into the Influence Mechanisms of Visual-Comfort and Landscape Indicators of Urban Green Spaces. Land 2024, 13, 1688. [Google Scholar] [CrossRef]
- de Keijzer, C.; Gascon, M.; Nieuwenhuijsen, M.J.; Dadvand, P. Long-Term Green Space Exposure and Cognition Across the Life Course: A Systematic Review. Curr. Environ. Health Rep. 2016, 3, 468–477. [Google Scholar] [CrossRef]
- Ta, N.; Li, H.; Zhu, Q.; Wu, J. Contributions of the Quantity and Quality of Neighborhood Green Space to Residential Satisfaction in Suburban Shanghai. Urban For. Urban Green. 2021, 64, 127293. [Google Scholar] [CrossRef]
- Zhang, Y.; Van den Berg, A.E.; Van Dijk, T.; Weitkamp, G. Quality over Quantity: Contribution of Urban Green Space to Neighborhood Satisfaction. Int. J. Environ. Res. Public. Health 2017, 14, 535. [Google Scholar] [CrossRef] [PubMed]
- Richardson, E.A.; Mitchell, R. Gender Differences in Relationships between Urban Green Space and Health in the United Kingdom. Soc. Sci. Med. 1982 2010, 71, 568–575. [Google Scholar] [CrossRef] [PubMed]
- Evensen, K.H.; Nordh, H.; Hassan, R.; Fyhri, A. Testing the Effect of Hedge Height on Perceived Safety—A Landscape Design Intervention. Sustainability 2021, 13, 5063. [Google Scholar] [CrossRef]
- Sugiyama, T.; Francis, J.; Middleton, N.J.; Owen, N.; Giles-Corti, B. Associations Between Recreational Walking and Attractiveness, Size, and Proximity of Neighborhood Open Spaces. Am. J. Public Health 2010, 100, 1752–1757. [Google Scholar] [CrossRef]
- Voigt, A.; Kabisch, N.; Wurster, D.; Haase, D.; Breuste, J. Structural Diversity: A Multi-Dimensional Approach to Assess Recreational Services in Urban Parks. Ambio 2014, 43, 480–491. [Google Scholar] [CrossRef]
- Molina-Azorin, J.F.; Fetters, M.D. Building a Better World Through Mixed Methods Research. J. Mix. Methods Res. 2019, 13, 275–281. [Google Scholar] [CrossRef]
- Corazon, S.S.; Gramkov, M.C.; Poulsen, D.V.; Lygum, V.L.; Zhang, G.; Stigsdotter, U.K. I Would Really like to Visit the Forest, but It Is Just Too Difficult: A Qualitative Study on Mobility Disability and Green Spaces. Scand. J. Disabil. Res. 2019, 21. [Google Scholar] [CrossRef]
|
Disclaimer/Publisher’s Note: The statements, opinions and data contained in all publications are solely those of the individual author(s) and contributor(s) and not of MDPI and/or the editor(s). MDPI and/or the editor(s) disclaim responsibility for any injury to people or property resulting from any ideas, methods, instructions or products referred to in the content. |
© 2024 by the authors. Licensee MDPI, Basel, Switzerland. This article is an open access article distributed under the terms and conditions of the Creative Commons Attribution (CC BY) license (http://creativecommons.org/licenses/by/4.0/).