
Submitted:
16 December 2024
Posted:
16 December 2024
You are already at the latest version
Abstract
Pork quality is an important trait in pig breeding. Studies have shown that extrachromosomal circular DNA (eccDNAs) play a key role in the musculoskeletal system. However, the characteristics and roles of eccDNAs in pork quality remain unclear. Yunong Black (YN) pigs (n = 3) and Yunong Black × Landrace (YL) hybrid pigs (n = 3) were randomly selected for meat quality determination of the longissimus dorsi (LM) muscle. Multiple types of eccDNA were detected in the muscle tissues of both pig groups using Circle sequencing (Circle-seq). To further explore the mechanism of action, we performed RNA sequencing (RNA-seq) to analyze the differentially expressed genes (eccDEGs) associated with eccDNAs. The results showed that the intramuscular fat content in the YN group was significantly higher than that in the YL group (p < 0.01). In the YN and YL groups, 1,325 and 1,304 differentially expressed eccDNAs were identified, ranging from 0.11 kb to 1 kb and distributed across multiple genomic functional regions. The two sets of differential eccDNAs were annotated to 1,274 and 1,366 protein-coding genes, respectively. Combined analysis of the Circle-seq and RNA-seq results revealed 19 and 27 differentially expressed eccDNAs (eccDEGs) in the YN and YL groups, respectively. Kyoto Encyclopedia of Genes and Genomes (KEGG) and Gene Ontology (GO) analyses of these genes enriched several lipid-related pathways, including chemokine signaling, ADP metabolic process, Apelin signaling, blood lipids and atherosclerosis, and arachidonic acid metabolism. By constructing a regulatory network, several miRNAs, including ssc-miR-10391, ssc-miR-133a-3p, and ssc-miR-1343, were identified as interacting with differential eccDNAs and eccDEGs. Finally, we found that multiple networks, such as ecc_sus_8665/ssc-miR-212/ADMTS16 and ecc_sus_22708/ssc-miR-432-5p/OLFM2 may regulate pork quality. In summary, we elucidated the first eccDNA profile relating to pork quality and identified several potential eccDNAs that may regulate pig muscle. The results of this study not only offer a new perspective for breeding selection of pork texture-related traits, but also provide insights into the role of eccDNA in the LM of pigs.
Keywords:
extrachromosomal circular DNA
; circle-seq
; differentially expressed genes
; meat quality
; pigs
1. Introduction
Pork is a major source of nutritional value for humans and dominates meat production in many countries around the world. Nowadays, pig breeding companies are increasingly focusing on the meat quality of hogs, integrating it as a vital component of their selection and breeding programs. The key indicators for measuring meat quality include intramuscular fat (IMF) content, meat color, protein content, pH, marbling, etc. Pork quality traits are regulated by multiple genes and are quantitative traits, which are studied using molecular genetic methods as an effective strategy to improve them. [1]. In recent years, significant progress has been made in the study of pork texture traits, with different breeds of pigs exhibiting different patterns of muscle and fat deposition. Genome-wide association analysis (GWAS) of IMF in Italian Large White pigs has pinpointed markers within 3 gene-rich regions associated with QTL for fat traits, providing a basis for improving meat quality [2]. In addition, Chinese native pig breeds exhibited higher IMF content compared to Western breeds, with the IMF content of the longest dorsal and loin muscles of Huaihe pigs being significantly higher than that of Duroc pigs [3]. A genome-wide association study of 1028 pigs from 6 different breeds to investigate the correlation between phenotypes and traits found significant correlations between glandular characteristics of breeds and pork quality traits (pH, meat color, fat, and moisture content) [4].
Studies have shown that transcriptomics can reveal the expression patterns of key genes during muscle growth and development, providing insights into the regulatory mechanisms involved [5]. Currently, there are many reports on transcriptome analysis of porcine IMF, such as those using RNA-seq technology combined with lipidomic、genomics and metagenomics approaches on the longissimus dorsi muscle (LM) of Blue Pond and Large White pigs. Which revealed that the expression of the PLA2G12B gene regulates the production and secretion of lipoproteins [6]. Additionally, several experimental-based methods have been developed to study the genetic mechanism of the LM. For example, adipocytes isolated from the LM of the large white pigs were induced to differentiate, and the expression of lncRNA was detected on different days after differentiation, it was found that knockdown of the lnc_000368 gene suppressed the expression of genes related to adipogenesis [7]. Previous studies integrating GWAS with RNA-seq revealed DBI as a good candidate gene for IMF content in Beijing black pigs [8]. Moreover, integrating lipidomic and metagenomics has led to identification of key discriminatory markers for lipid digestion and absorption in two breeds of pigs [6]. Researchers have also utilized transcriptomic-assisted quantitative proteomics analysis to uncover candidate protein molecules influencing IMF deposition in Laiwu pigs [9]. Investigating the specific genes and pathways associated with IMF deposition in pigs would be of great help for breeding selection. However, a comprehensive understanding of the precise genes and regulation mechanism responsible for the enhanced IMF deposition in animals is still poor.
Because pigs share similar physiological, pathological, and genomic characteristics with human. Recent studies have shown that human skeletal muscles of sedentary and exercising individuals have unique eccDNAs [10]. Therefore, pig skeletal muscle may also contain eccDNAs that affect traits. And differences in the abundance of eccDNAs among various pig breeds, with portions or complete genes carried by eccDNAs annotated to pathways related to lipid metabolism, signal transduction, and endocrine regulation [11]. This suggests that eccDNA may play a potential role in modulating lipid metabolism. EccDNA refers to double-stranded circular DNA molecules originating from the genomic DNA, existing outside of chromosomes, mitochondria, and chloroplasts. These molecules are relatively stable and resistant to degradation by nucleases. They exhibit strong heterogeneity in sequence, length, and origin, and are commonly found in cancer cells as well as normal somatic cells. Through continuous exploration and research efforts, information regarding eccDNA has gradually emerged into the public domain. For instance, eccDNA can be classified into various types such as episomes, microDNA, double minutes (DMs), and extrachromosomal DNA (ecDNA), based on their length [12]. Since its initial discovery in wheat embryos in 1965 [13], eccDNA has been detected in a variety of eukaryotic organisms, human tissues, animal blood, and tissues, exhibiting variability in size and function [14,15,16]. It has been found in numerous eukaryotic cell types [17], including skeletal muscle cells from sedentary and regularly exercising individuals, in the blood and pectoral muscles of different species of pigeons, and others [10]. More and more studies have shown that eccDNA plays an important role in living organisms. For example, certain plants utilize eccDNA to amplify resistance genes [18], while eccDNA serves as a gene carrier to enhance the transcription efficiency of specific genes when transferred into particular cells [19]. Acting as mobile elements, eccDNA co-localizes with multiple chromosomal genes within the same chromatin structural domains, thereby regulating their transcription [20]. Moreover, eccDNA can serve as a template for reinsertion into chromosomes of different systems, such as cattle and yeast [21]. The first discovery of eccDNAs in pigs was observed in spermatozoa using electron microscopy [13,22,23,24,25]. Then again it mentioned the prevalence of ecDNAs and eccDNAs detected in Weiss and Large White pigs and its ability to carry one or several partial or complete genes [11]. These findings underscore the significance of studying eccDNA in livestock and poultry.
Although eccDNAs are ubiquitous in a wide range of organisms, their genetic function in pigs has been extremely poorly studied. To gain a more particular understanding of the genetic basis of pork quality traits, we investigated and compared the eccDNA characteristics of the LM of Yunong-black (YN) pigs and YN × Landrace (YL) hybrid pigs by integrating eccDNA sequencing and transcriptome sequencing technologies. Preliminary exploration of the characterization of eccDNAs in pig LM provides a new perspective for pig breeding selection.
2. Materials and Methods
2.1. Samples Description
In this study, 3 YN pigs, and 3 YL pigs, average live weight of 100 kg, were randomly selected from Henan Yifa Animal Husbandry Co., Ltd. YN pig is a new strain bred by crossing the Nanyang Black Pig, Laiwu Black Pig, Erhualian Pig, and Duroc Pig [26,27].
All pigs were raised in identical housing facilities and environmental conditions, and they were subjected to the same feeding standards. Both groups of pigs underwent electrical stunning and slaughter. Fresh muscle samples from the LM at the thoracolumbar junction were collected on-site for meat quality index measurement, while another portion was immediately frozen at low temperature and transported to the laboratory for storage at -4 °C for subsequent assessment of meat quality traits. Additionally, a portion of the samples was preserved at -80 °C for testing.
2.2. Determination of Meat Quality Traits
The pork quality traits were determined according to NY/T 821-2019, GB 50096-85, GB 5009.3-2016, and GB 5009.5-2016 standards. Immediately after slaughter, muscle samples measuring 2-3 cm in thickness were evaluated by the same assessor for color and marbling score on the cross-section. The pH of the muscles at 45 min post-slaughter was measured using a calibrated pH meter (Model: testo 206) inserted into the LM. Each sample was measured three times and the average was taken. The device was calibrated using two buffers: 4.00 and 7.00 [28]. Additionally, the peripheral sarcolemma of some muscles was removed from the meat, and the samples were trimmed into 2 cm ×2 cm ×2 cm samples along the muscle fiber direction of the meat to detect the drip loss [29].
Samples of 2-10 g were placed in a clean aluminum box of constant weight and placed in a drying oven of 101 ℃-105 ℃ for 2-4 h to constant weight. The mass difference before and after measurement was determined and the moisture content was calculated. Then, 1.8 g of the powder sample was placed on a constant weight neutral filter paper, wrapped and placed in an oven at 105 ℃ for 2 h. Then, it was taken out and put into a Soxhlet extractor, adding 60-100 mL anhydrous ether, heated and extracted on a water bath at 60-75 ℃ for 6-8 h, and placed in an oven at 105 ℃ for 1 h to calculate the intramuscular fat content. Another 0.2-0.5 g of the sample was placed into digestion tubes along with 3.2 g of a mixed catalyst (potassium sulfate/sodium sulfate = 1:15) and 10 ml of sulfuric acid. The samples were digested in a muffle furnace (Model: SH220F) at 280 °C for 30 min followed by 420 °C for 2 h. After cooling, the protein content of the muscle was determined using a Kjeldahl nitrogen analyzer (Model: K9860).
The differences in meat quality traits between the YN and YL groups were compared using the independent samples T-test method in SPSS. This involved comparing individual meat color, tenderness, pH, drip loss, moisture content, and IMF content differences between the two groups.
2.3. Circle-seq Data Analysis
The LM of two groups of pigs was sequenced according to the Circle-seq procedure (Jiayin Biotechnology Ltd. (Shanghai, China)). It consists of the following steps: Genomic DNA was extracted using Qiagen kits. EccDNAs were enriched using the Plasmid Mini AX kit. Linear DNA was removed by Plasmid-Safe ATP-dependent DNase (Epicentre) and digested at 37 °C for 6 days. The eccDNAs enriched samples were used as phi29 polymerase reaction template (REPLI-g Midi Kit) to amplify DNA, which was then washed with AMPure XP beads and sonicated by Bioruptor to an average fragment size of 200 to 300 bp. Next-generation sequencing libraries were prepared using the NEBNext Ultra DNA Library Kit for Illumina according to the manufacturer’s protocol (New England Biolabs) and sequenced on an Illumina Novaseq 6000 using a PE150. Trimmomatic was used to filter the sequencing data, and parameters such as Q20 and Q30 were used to represent base quality [30]. BWA was used to compare the obtained data to the reference genome (http://ftp.ensembl.org/pub/release-107/fasta/sus_scrofa/dna/) to check whether the data quality met the standard [31].
Finally, circular DNA identification was performed by matching the sequence to the reference genome through Circle-Map [32].
2.4. EccDNAs Difference Analysis and Gene Annotation
The eccDNAs identified through Circle-Map was processed as follows. The HOMER’s findMotifsGenome.pl tool was used for Motif analysis. Initially, bedtools software was employed to calculate the total sum of soft-clipped read counts for each eccDNA’s start and end positions [33]. Subsequently, DESeq2 was utilized to compute the inter-group differential expression of eccDNAs [34], and differentially expressed eccDNAs were selected based on predefined thresholds. The threshold criteria for this analysis were set as: |log2FC| > 2 and p< 0.05. Functional region coordinates were extracted from the annotation file (gtf), and deep Tools were used to quantify the differential eccDNAs in these regions [35]. The distribution of eccDNAs on chromosomes and Guanine-cytosine (GC) content were analyzed using the RIdeogram R package [36]. Additionally, custom scripts and bedtools were employed for gene annotation of differential eccDNAs [33], retaining only protein-coding genes. Gene annotation analysis of differentially expressed eccDNAs were conducted using bar charts.
2.5. Verification of eccDNAs
To verify the accuracy of the Circle-seq results, three randomly selected ecc DNA sequences were used to design primers and amplify different products of the expected size, which were then verified by Sanger sequencing. Primer information is provided in Table 1. Standard PCR was performed using 5xAmpliMix, with a reaction volume of 50 μL consisting of 35 μL of DNA, 2.5 μL of forward primer, 2.5 μL of reverse primer, and 10 μL of 5xAmpliMix. The cycling conditions were as follows: 72 °C for 3 min, 98 °C for 30 s, 35 cycles (98 °C for 15 s, 60 °C for 10 s, 72 °C for 8 s), 72 °C for 2 min, and storage at 10 °C. PCR products were analyzed by agarose gel electrophoresis and subjected to Sanger sequencing. Circular validation results were generated using SnapGene (https://www.snapgene.com/).
2.6. RNA-seq Data Analysis
Samples stored at -80 °C were retrieved and sent for analysis. RNA integrity was accurately assessed using the Agilent 2100 bioanalyzer. Library construction was performed following the standard NEB protocol [37]. After library construction, initial quantification was carried out using the Qubit 2.0 Fluorometer. Upon meeting the expected concentration, qRT-PCR was performed to accurately quantify the effective concentration of the library (with an effective concentration above 1.5nM) to ensure library quality. Once the library passed quality control, Illumina sequencing was conducted, generating 150 bp paired-end reads.
Data quality control primarily involved removing adapter-containing reads, reads containing N (indicating undetermined base information), and low-quality reads (reads with more than 50% of bases with Qphred <= 5) [38]. HISAT2 software was employed for rapid and accurate alignment of Clean Reads to the reference genome [39]. StringTie software performs prediction and annotation of new transcripts [40], while the featureCounts tool in the subread software was utilized for gene quantification analysis [41]. Gene expression levels were represented using fragments per kilobase of transcript per million fragments mapped (FPKM). Differential expression analysis between the two comparison combinations was performed using DESeq2 [42] software, retaining only protein-coding genes. The criteria for selecting DEGs were: |log2FC| > 1 and p ≤ 0.05. Volcano plots and cluster heatmaps were generated using the NovoMagic cloud platform (https://magic.novogene.com/customer/main#/homeNew).
2.7. Validation of DEGs
To verify the accuracy of transcriptome sequencing results, 6 genes were randomly selected in this study (UBA7, GPCPD1, AKP1C4, FRAS1, GRM4, OLFM2) were verified by qPCR. Primers for the genes were designed on NCBI (Table 2) and synthesized by Shanghai Sangon Biotech Co., Ltd. Tissue RNA from the two groups of individuals was extracted using the TransZol reagent kit (Zhengzhou Far East Biotechnology Co., Ltd.), and RNA was reverse transcribed into cDNA using the Evo M-MLV reverse transcription kit (Hangzhou Aikerui Biotechnology Co., Ltd.). qPCR validation was performed using the SYBR Green I (Hangzhou Aikerui Biotechnology Co., Ltd.) intercalation fluorescence method with GAPDH as an internal reference. The reaction system consisted of 10 μL: 5 μL 2× SYBR, 1 μL cDNA, 0.2 μL each of upstream and downstream primers, and 3.6 μL RNase-free water. The gene expression was calculated by 2-ΔΔCt.
2.8. Enrichment Analysis and Functional Annotation of eccDNAs and eccDEGs
To further uncover the molecular mechanism of eccDNAs and eccDEGs. Protein network interaction and enrichment analysis were performed based on the results of the two-omics combination to determine candidate eccDEGs related to meat quality traits. Specifically, functional enrichment analysis of genes was performed using a free online data analysis platform (https://www.omicshare.com/tools). Gene interaction analysis was conducted on the GeneMANIA website (https://genemania.org/), where species were selected, and gene IDs were inputted into the dialogue box to filter gene information with interacting or regulatory relationships. KEGG and GO pathway enrichment analyses were conducted using gene IDs on the Novogene cloud platform (https://magic.novogene.com/customer/main#/homeNew), and graphical representations were generated through the website (https://www.bioinformatics.com.cn/).
2.9. Prediction of Regulatory Network of eccDNAs-miRNAs-Genes
Porcine miRNA sequences were extracted from the miRBase database (http://www.mirbase.org/), and the 3’UTR sequences of the genes were retrieved from UCSC (https://genome.ucsc.edu/). The miRanda software (https://www.bioinformatics.com.cn/local_miranda_miRNA_target_prediction_120) was used to predict pig miRNAs that might interact with eccDNAs and their target genes. The prediction was performed using the default parameters of the system. Cytoscape (v.3.10.1) [43] was used for visualization.
3. Results
3.1. Comparison of Meat Quality Indicators in YN and YL Groups
The results of LM quality determination for both groups of pigs (Table 3) indicate that several meat quality indicators of YN pigs are significantly higher than those of YL pigs. The meat color score assessed 45 minutes post-slaughter was significantly higher in YN pigs compared to YL pigs (p < 0.05). There was also a significant difference between the two groups in terms of pH (p < 0.05). Specifically, the intramuscular fat content of the longest dorsal muscle in YN pigs was significantly higher than that in YL pigs (p < 0.01). However, there were no significant differences between the two groups in terms of marbling, drip loss, moisture, and protein content.
3.2. Basic Features of eccDNAs in YN and YL Pigs
To characterize eccDNAs in YN and YL pigs, Circle-seq was employed for high-throughput sequencing of eccDNAs (Figure 1A), with the quality results of the sequencing data provided in Supplementary Table S1. A total of 87020 and 78439 eccDNAs with different lengths were detected in YN and YL groups, respectively.
Serving as cellular markers, transcription factors (TFs) directly interpret the genome and interact with transcription co-factors to bind DNA sequences and regulate gene expression [44,45,46]. To ascertain the significance of studying eccDNAs, we conducted motif predictions on it. Partial results from two groups are presented in the manuscript, wherein motifs are predicted to involve multiple adipose-related transcription factors [47].
Further exploration and screening (|log2FC|>2, p < 0.05), as shown in Figure 1B, there were 111 identical eccDNAs in both groups, among which there were 1325 and 1304 different eccDNAs in YN and YL, respectively (Supplementary Tables S2 and S3). Studies have shown that eccDNAs vary greatly in size, ranging from tens of bases to hundreds of thousands of bases, with most eccDNAs being smaller than 1,000 bp [48]. The lengths of differential eccDNAs also differ between the two groups in this study (Figure 1C and 1D). The length of differential eccDNAs in the YN and YL groups was mainly distributed between 0.1-1 kb. However, the length of differential eccDNAs in the YL group was between 1-10 kb more than that in the YN group.
To understand the impact of eccDNA on coding and regulation, the genomic element distribution was analyzed (Figure 2A). EccDNAs from the two groups showed a similar genomic element distribution pattern. The results indicate that differential eccDNAs in both groups are localized to different categories of genomic regions, primarily originating from coding sequence (CDS), coding exons, coding introns, and intergenic regions. In the YL group, differential eccDNAs are distributed in CDS, coding exons, and introns at proportions of 44.40%, 50.84%, and 49.23%, respectively, while in the YN group, these proportions are 42.72%, 47.47%, and 46.42%, respectively. The proportion of differential eccDNAs in genomic functional regions is slightly higher in the YL group compared to the YN group, which may indicate a greater coding capacity. The GC content of differential eccDNA in the YN and YL groups was measured at 47.82% and 49.82%, respectively, both surpassing the GC content detected in the upstream flanking regions (44.88% and 47.47%) or downstream flanking regions (44.88% and 47.53%) of the identified differential eccDNA loci, indicating the possible transcriptional-translational capacity of eccDNAs in the LM (Figure 2B). This suggests that eccDNAs has higher stability.
The differential eccDNAs in both the YN and YL groups were predominantly distributed on chromosomes 1, 6, and 13, but there were differences in the distribution of specific locations on the chromosomes (Figure 2C-E). In particular, on chromosome 13, the YN group exhibits a significantly higher number of differential eccDNAs than the YL group. To further investigate the mechanisms of action of these differential eccDNAs, we annotated genes associated with them and identified protein-coding genes in both groups. There are 1274 and 1366 genes identified in the YN and YL groups, respectively (Figure 2F).
3.3. Validation of eccDNAs
Circular validation of eccDNA was conducted by randomly selecting ecc_sus_13326, ecc_sus_9710, and ecc_sus_22708. Specific primers were designed to amplify sequences containing cleavage sites via PCR, followed by validation of PCR products using Sanger sequencing (Table 1). The results demonstrate that the cleavage sites of these three eccDNAs were successfully amplified, consistent with our Circle-seq sequencing results (Figure 3).
3.4. Identification of DEGs
The relevant results of RNA-seq are as follows: PCA analysis (Figure 4A) demonstrated a clear separation between the YN and YL groups. Following filtration (|log2FC| > 1, p ≤ 0.05), a total of 455 differentially expressed protein-coding genes were identified (Figure 4B, Supplementary Table S4). Clustering analysis based on gene FPKM values revealed blue representing low-expression genes and orange representing high-expression genes. Significant differences in gene expression levels among groups were observed (Figure 4C).
The 6 DEGs were randomly selected from the transcriptome for qPCR validation, with primer information listed in Table 2. The qPCR results (Supplementary Figure B) demonstrate consistent trends in expression levels of up-regulated genes UBA7, GPCPD1, AKP1C4, and down-regulated genes FRAS1, GRM4, PER2 were similar to those of the RNA-seq results (Supplementary Figure A), validating the confidence of the sequencing results, with significant differences observed in expression levels between the two groups.
3.5. Identification and Enrichment Analysis of Differentially Expressed eccDNA-Amplified Encoding Genes
Combined with the transcript expression level of DEGs, the overlapped parts between differential expressed eccDNA genes and DEGs called eccDNA-related DEGs (eccDEGs) were further studied. In all, 19 eccDEGs (Table 5) in the YN group and 23 eccDEGs (Table 6) in the YL group (Figure 5A). Protein interaction prediction among the up-regulated and down-regulated genes within the YN group indicates direct or indirect interactions (Figure 5B), including physical interactions (48.05%), co-expression (38.74%), and shared protein domains (13.15%). In the YL group (Figure 3C), co-expression dominates the inter-gene relationships (97.59%).
The KEGG and GO enrichment analysis results of the two groups of eccDEGs are shown in Figure 5. Pathways enriched in the YN group include viral protein interaction with cytokine and cytokine receptors, chemokine signaling pathway, and lipid and atherosclerosis (Figure 5E). Significantly enriched GO terms in biological processes (BP) include ADP metabolic process, purine nucleoside diphosphate metabolic process, and cytokine-mediated signaling pathway (Figure 5D). Pathways enriched in the YL group include the Apelin signaling pathway, arachidonic acid metabolism, and the FoxO signaling pathway (Figure 5G). Significant GO terms in BP the include vascular process in the circulatory system and regulation of tube diameter (Figure 5F).
3.6. EccDNAs-miRNAs-Genes Regulatory Network
Increasing evidence suggests that eccDNAs may function as molecular sponges, typically playing a regulatory role in various biological processes [49]. Therefore, we hypothesize that the eccDNAs in this study might act as miRNA sponge regulatory genes. The results from miRanda predictions revealed that the differing eccDNAs between the YN and YL groups were associated with multiple miRNAs, including ssc-miR-10391, ssc-miR-133a-3p, and ssc-miR-1343 (Figure 6). Each eccDNA can interact with multiple miRNAs, such as ecc_sus_19445, ecc_sus_35206, and ecc_sus_9710, and each miRNA can also be associated with multiple eccDNAs. Additionally, the miRNAs predicted by the eccDNAs also interact with eccDEGs, such as UBASH3B, ATCAY, and PTGIS, which are involved with multiple miRNAs. Therefore, the eccDNAs in this study may influence traits by regulating the expression of related genes through miRNAs.
3.7. Identification of Candidate eccDNAs and eccDEGs
To identify potentially significant eccDNAs warranting further investigation, we selected eccDEGs associated with meat quality traits and identified their corresponding eccDNAs as the next focus of our study. The results revealed that in the YN group (Figure 7A), the gene CDHR4 is implicated in protein determination; the absence of the gene CISH leads to lipid accumulation [50] and facilitates protein binding [51]; the gene HRH1 potentially influences the size of adipocytes [52]; and ADAMTS16 is linked to the proliferation and differentiation of adipocytes [53]. These eccDEGs are annotated by ecc_sus_13326 and ecc_sus_8665. In the YL group (Figure 7B), eccDEGs such as KLF2, OLFM2, and COMP are associated with white adipocyte differentiation [54], cholesterol and fatty acid synthesis [55,56], and protein determination [57]; PTGIS has been studied in the context of lipid synthesis reactions [58] and serves as a pivotal gene in lipid metabolism [56,59]. EccDEGs KCTD15 and ZFP36 have been shown to affect porcine fat deposition [60] and regulate the early formation of preadipocytes [61]. These eccDEGs were annotated by ecc_sus_24348, ecc_sus_19909, ecc_sus_8330, and ecc_sus_35206. Therefore, these eccDNAs may potentially influence the meat quality traits of YN pigs and YL pigs through eccDEGs regulation.
4. Discussion
In this study, we integrate eccDNA sequencing and transcriptome sequencing data to investigate factors influencing the meat quality traits of the longest dorsal muscle in YN and YL pigs. Finally, 1325 and 1304 differential eccDNAs were respectively detected in the YN and YL groups. To elucidate the mechanism of action of eccDNA, we compared the differential eccDNAs quantities, length distributions, genomic functional region distributions, chromosome distributions, and differences in the functional genes of differential eccDNAs between the two pig groups, aiming to understand the potential role of eccDNA in pig meat quality traits.
Since the discovery of eccDNA, researchers have utilized next-generation sequencing technologies and data analysis methods to reveal its structural features. Firstly, eccDNA exhibits a wide range of sizes, ranging from tens of base pairs to several million base pairs. In here, differential eccDNA sizes identified in YN and YL pigs using Circle-Seq technology ranged from tens of base pairs to tens of kilobases, with the majority of differential eccDNA lengths showing species micro-homogeneity between the two groups. This finding is consistent with numerous previous studies. For instance, researchers detected hundreds of thousands of eccDNAs in breast cancer and normal samples, ranging in size from 33 to 54,229 bp [62]. Besides that, the length of eccDNAs in the two groups of the current research is not restricted to short fragment sequences; there are also extremely rare long eccDNAs with lengths of 39 Mb and 107 Mb. Longer differential eccDNA fragments have the capacity to harbor a greater number of genomic functional segments. Regarding the distribution characteristics of eccDNAs on chromosomes, Sun et al. proved the localization of eccDNAs on 23 pairs of chromosomes in esophageal squamous cell carcinoma [34]. The regions forming eccDNAs are not randomly distributed across chromosomes. The differential eccDNAs in this study are found on all chromosomes, although their density was higher on certain chromosomes, which is consistent with previous studies. Studies have shown that eccDNAs typically originate from untranslated regions and regions with high GC content [63]. The distribution of differential eccDNAs in the YN and YL groups varies slightly across chromosomes. Such as, on chromosome 13, the number of differential eccDNAs in the YN group is significantly higher than in the YL group, indicating variability in eccDNA distribution among individuals. Other studies [64] have identified uneven distributions of eccDNA-associated genes showing differential expression between stroke patients and healthy individuals, with the highest proportions observed on chromosomes 18, 13, and 4. Overall, numerous factors influence the size distribution of eccDNA, varying across different age stages. For example, fetal-derived eccDNAs are shorter than maternal eccDNAs [65], and eccDNA lengths in the blood and skeletal muscles of pigeons of different ages and breeds range from below 100 bp to 48 kb [63]. Therefore, eccDNA length may contribute to phenotypic differences among different breeds.
EccDNA can be classified not only based on size but also according to its genomic origin and genetic content, including full-gene eccDNA, exon eccDNA, intron eccDNA, repeat eccDNA, repeat-intergenic eccDNA, intergenic eccDNA, TE eccDNA, and promoter/enhancer eccDNA [12]. Studies have demonstrated that eccDNA not only functions through genes but also serves as genomic regulatory elements influencing traits. In this study, two groups of differential eccDNAs were localized to distinct genomic regions, primarily originating from coding sequence (CDs) regions and protein-coding exon sequence regions. Notably, eccDNA, as compared to chromosomal DNA, predominantly contains active histone marks, exhibiting a more accessible chromatin landscape [20,66,67]. Compared to the control group, the abundance of eccDNA located in exon regions significantly increased in the diseased group [62], and eccDNA has been shown to be not restricted to specific regions of the genome [63]. Differential eccDNAs in both the YN and YL groups in this study were found more frequently in regions encoding genes, which may contribute to elevated transcription levels, suggesting that eccDNA in specific genomic regions may have potential physiological impacts. Furthermore, the GC content of differential eccDNA was similar between the two groups, consistent with previous findings in plasma [68], femoral head [69], and adipose stem cells [70]. However, their GC content was higher than that of flanker sequences, suggesting that the identified differential eccDNAs may have more stable transcriptional translation capabilities.
In recent years, the biological function of eccDNA has gradually attracted wide attention, especially its important role in diseases such as cancer, genomic instability and drug resistance. By annotating the target genes of eccDNA, we can reveal their underlying functions and mechanisms. For example, the expansion or loss of eccDNAs in yeast can affect the copy number of genes it carries [71,72]. EccDNA carrying the fib-L gene can promote the transcription of fiber-related genes [73]. The decrease of eccDNAs containing MYCN will lead to a decrease in cell activity [74]. Therefore, eccDNAs in this study may also affect pork quality traits through genes. We annotated genes of the differential eccDNAs in the two groups and combined them with the transcriptomes to find the eccDEGs carried by the differential eccDNAs in the YN and YL groups, and carried out protein interaction analysis and enrichment analysis. The results showed that there were direct or indirect interactions among these eccDEGs, including Physical interactions, Co-expression, and Shared protein domains. Through the interaction analysis based on eccDNAs, we are not only able to deeply understand the potential role of eccDNA in pig muscle tissue, but also reveal its relevance in intracellular biological processes and molecular functions. The results of enrichment analysis showed that the KEGG eccDEGs enriched the interaction of the viral protein with cytokines and cytokine receptors, chemokine signaling pathway, lipid, and atherosclerosis pathway. Studies have shown that experimental atherosclerosis in rats is related to lipid metabolism [75]. The significant GO items of BP enrichment include the ADP metabolic process, purine nucleoside diphosphate metabolic process, cytokine-mediated signaling pathway, etc. EccDNA can also perform important biological functions by regulating signaling pathways. Sun [76] et al. found that the stability of DMs in tumor cells is related to the activation of ERK1/2. Inhibition of ERK1/2 activation and constitutive phosphorylation of ERK1/2 significantly reduced the number of DMs in tumor cells and the expression of DMS-carrying genes. KEGG enrichment pathways in the YL group included the Apelin signaling pathway, arachidonic acid metabolism, FoxO signaling pathway, etc. Scholars have identified, based on proteomic and metabolomic analysis, that the arachidonic acid metabolic pathway may be associated with lipid metabolism in male mice [77]. The significant GO items of BP enrichment include vascular processes in the circulatory system, tube diameter regulation, etc. GO entries and KEGG pathways enriched in the two groups were identical, possibly because the experimental animals in both groups were YN pigs. The analysis of GO and KEGG pathways obtained by eccDEGs annotation revealed the cell signaling pathways involved and the underlying biological mechanisms.
However, the regulation of eccDNA traits is a complex process that may involve additional regulatory factors. To further understand how eccDNA regulates genes and influences traits, we performed miRNA interaction network predictions on the final screened eccDNAs and eccDEGs. Several miRNAs with interactions were identified in both groups. Previous studies have confirmed that eccDNA can be associated with bmo-miR-3318 and regulate the expression of its target gene LOC101742450 through miRanda predictions and DNA pull-down experiments [78]. Additionally, research has shown that eccDNA carrying miRNA genes can produce functional miRNA molecules in host cells, promoting cell growth and survival [79]. Based on this, we hypothesize that the differential eccDNAs in this study may also regulate the expression of eccDEGs by interacting with miRNAs, thereby influencing meat quality-related traits.
Previous studies have utilized artificially synthesized eccDNA carrying H3K27ac-modified genomic regions and introduced them into cells to assess the impact on global gene expression, probing whether it affects transcription [20]. In this study, to identify eccDNA worthy of further investigation, eccDEGs related to meat quality traits were selected, and their corresponding eccDNA was identified as the next focal point for research. Results revealed that in the YN group, genes CDHR4, CISH, HRH1, and ADAMTS16 are associated with fat formation and protein measurement [50,51,52,53]. Annotated respectively by ecc_sus_13326 and ecc_sus_8665. In the YL group, genes KLF2, OLFM2, COMP, PTGIS, KCTD15, and ZFP36 were confirmed to be related to adipocyte differentiation and pig fat deposition, serving as pivotal genes in fat metabolism [54,55,56,57,58,59,60,61], annotated respectively by ecc_sus_24348, ecc_sus_19909, ecc_sus_8330, and ecc_sus_35206. Thus, these eccDNA elements may influence the meat quality traits of YN pigs through eccDEGs regulation. The next step involves selecting appropriate eccDNA for experimental validation to further elucidate the mechanisms of eccDNA in YN and YL pigs.
5. Conclusions
Our investigation described the characteristics of eccDNA in YN and YL groups, and identified that CDHR4, CISH, OLFM2, COMP, PTGIS and et al. may play a crucial role in the meat quality traits in pigs with analysis of DEGs and eccDEGs. Several related networks including ecc_sus_8665/ssc_miR_212/ADMTS16 and ecc_sus_22708/ssc-miR-432-5p/OLFM2 that may regulate pork quality were found. The expression levels and correlations of these eccDNAs and genes in YN and YL LM samples showed their potential as joint meat quality traits. The detailed molecular mechanism of eccDNAs in pig merits further exploration.
Supplementary Materials
The following supporting information can be downloaded at the website of this paper posted on Preprints.org.
Author Contributions
X-L L.: Conceptualization, Funding Acquisition and Resources L.B.: Formal Analysis, Visualization, Writing—Original Draft Preparation and Writing—Review & Editing. J.W., Y.Z. and Z.W.: Formal Analysis. Y.Z., S.Y., and S.Z.: Resources and Supervision. X-J.L., X.H., R.Q., K.W. and F.Y.: Software and Investigation. All authors have read and agreed to the published version of the manuscript.
Funding
This study was supported by the National Key Research and Development Program of China (2021YFD1301200), the National Natural Science Foundation of China (31902138), the Joint Research on Improved Agricultural Breeds from Henan Provence (2022020101), and the Key Scientific Research Projects of Colleges and Universities in Henan Province (23A230012).
Data Availability Statement
The data of this study can be obtained with reasonable justification from the corresponding author.
Ethics approval and consent to participate: All animal care and experimental procedures were conducted in accordance with the guidelines established by the Institutional Animal Care and Use Committee (IACUC) of Henan Agricultural University, China (Permit Number: HNND2020030118).
Conflicts of Interest
The authors declare that they have no competing interests.
References
- Zhao, Y.; Chen, S.; Yuan, J.; Shi, Y.; Wang, Y.; Xi, Y.; Qi, X.; Guo, Y.; Sheng, X.; Liu, J., et al. Comprehensive Analysis of the lncRNA-miRNA-mRNA Regulatory Network for Intramuscular Fat in Pigs. Genes (Basel) 2023, 14. [CrossRef]
- Davoli, R.; Luise, D.; Mingazzini, V.; Zambonelli, P.; Braglia, S.; Serra, A.; Russo, V. Genome-wide study on intramuscular fat in Italian Large White pig breed using the PorcineSNP60 BeadChip. J Anim Breed Genet 2016, 133, 277-282. [CrossRef]
- Li, X.; Lu, L.; Tong, X.; Li, R.; Jin, E.; Ren, M.; Gao, Y.; Gu, Y.; Li, S. Transcriptomic Profiling of Meat Quality Traits of Skeletal Muscles of the Chinese Indigenous Huai Pig and Duroc Pig. Genes (Basel) 2023, 14. [CrossRef]
- Cui, D.; Li, L.; Yu, N.; Xiong, S.; Xiao, S.; Zheng, H.; Huang, Z.; Guo, Y.; Huang, L. Phenotypic correlations of carpal gland diverticular number with production traits and its genome-wide association analysis in multiple pig populations. Anim Genet 2024. [CrossRef]
- Liu, J.; Gao, Y.; Zhang, X.; Hao, Z.; Zhang, H.; Gui, R.; Liu, F.; Tong, C.; Wang, X. Transcriptome sequencing analysis of bovine mammary epithelial cells induced by lipopolysaccharide. Anim Biotechnol 2024, 35, 2290527. [CrossRef]
- Sun, J.; Xie, F.; Wang, J.; Luo, J.; Chen, T.; Jiang, Q.; Xi, Q.; Liu, G.E.; Zhang, Y. Integrated meta-omics reveals the regulatory landscape involved in lipid metabolism between pig breeds. Microbiome 2024, 12, 33. [CrossRef]
- Yue, Y.; Ge, Z.; Guo, Z.; Wang, Y.; Yang, G.; Sun, S.; Li, X. Screening of lncRNA profiles during intramuscular adipogenic differentiation in longissimus dorsi and semitendinosus muscles in pigs. Anim Biotechnol 2023, 34, 4616-4626. [CrossRef]
- Yang, M.; Zhang, R.; Liu, X.; Shi, G.; Liu, H.; Wang, L.; Hou, X.; Shi, L.; Wang, L.; Zhang, L. Integrating genome-wide association study with RNA-seq revealed DBI as a good candidate gene for intramuscular fat content in Beijing black pigs. Anim Genet 2023, 54, 24-34. [CrossRef]
- Ma, C.; Wang, W.; Wang, Y.; Sun, Y.; Kang, L.; Zhang, Q.; Jiang, Y. TMT-labeled quantitative proteomic analyses on the longissimus dorsi to identify the proteins underlying intramuscular fat content in pigs. J Proteomics 2020, 213, 103630. [CrossRef]
- Gerovska, D.; Araúzo-Bravo, M.J. Skeletal Muscles of Sedentary and Physically Active Aged People Have Distinctive Genic Extrachromosomal Circular DNA Profiles. Int J Mol Sci 2023, 24. [CrossRef]
- Wen, A.; Zhang, W.; Xu, J.; Wang, K.; Hu, H. Identification and characterization of extrachromosomal circular DNA in Wei and Large White pigs by high-throughput sequencing. Front Vet Sci 2023, 10, 1085474. [CrossRef]
- Yang, L.; Jia, R.; Ge, T.; Ge, S.; Zhuang, A.; Chai, P.; Fan, X. Extrachromosomal circular DNA: biogenesis, structure, functions and diseases. Signal Transduct Target Ther 2022, 7, 342. [CrossRef]
- Hotta, Y.; Bassel, A. MOLECULAR SIZE AND CIRCULARITY OF DNA IN CELLS OF MAMMALS AND HIGHER PLANTS. Proc Natl Acad Sci U S A 1965, 53, 356-362. [CrossRef]
- Liao, Z.; Jiang, W.; Ye, L.; Li, T.; Yu, X.; Liu, L. Classification of extrachromosomal circular DNA with a focus on the role of extrachromosomal DNA (ecDNA) in tumor heterogeneity and progression. Biochim Biophys Acta Rev Cancer 2020, 1874, 188392. [CrossRef]
- Paulsen, T.; Kumar, P.; Koseoglu, M.M.; Dutta, A. Discoveries of Extrachromosomal Circles of DNA in Normal and Tumor Cells. Trends Genet 2018, 34, 270-278. [CrossRef]
- Cohen, S.; Houben, A.; Segal, D. Extrachromosomal circular DNA derived from tandemly repeated genomic sequences in plants. Plant J 2008, 53, 1027-1034. [CrossRef]
- Cohen, S.; Regev, A.; Lavi, S. Small polydispersed circular DNA (spcDNA) in human cells: association with genomic instability. Oncogene 1997, 14, 977-985. [CrossRef]
- Molin, W.T.; Yaguchi, A.; Blenner, M.; Saski, C.A. The EccDNA Replicon: A Heritable, Extranuclear Vehicle That Enables Gene Amplification and Glyphosate Resistance in Amaranthus palmeri. Plant Cell 2020, 32, 2132-2140. [CrossRef]
- Møller, H.D.; Lin, L.; Xiang, X.; Petersen, T.S.; Huang, J.; Yang, L.; Kjeldsen, E.; Jensen, U.B.; Zhang, X.; Liu, X., et al. CRISPR-C: circularization of genes and chromosome by CRISPR in human cells. Nucleic Acids Res 2018, 46, e131. [CrossRef]
- Zhu, Y.; Gujar, A.D.; Wong, C.H.; Tjong, H.; Ngan, C.Y.; Gong, L.; Chen, Y.A.; Kim, H.; Liu, J.; Li, M., et al. Oncogenic extrachromosomal DNA functions as mobile enhancers to globally amplify chromosomal transcription. Cancer Cell 2021, 39, 694-707.e697. [CrossRef]
- Hull, R.M.; King, M.; Pizza, G.; Krueger, F.; Vergara, X.; Houseley, J. Transcription-induced formation of extrachromosomal DNA during yeast ageing. PLoS Biol 2019, 17, e3000471. [CrossRef]
- Møller, H.D.; Parsons, L.; Jørgensen, T.S.; Botstein, D.; Regenberg, B. Extrachromosomal circular DNA is common in yeast. Proc Natl Acad Sci U S A 2015, 112, E3114-3122. [CrossRef]
- Stanfield, S.W.; Lengyel, J.A. Small circular DNA of Drosophila melanogaster: chromosomal homology and kinetic complexity. Proc Natl Acad Sci U S A 1979, 76, 6142-6146. [CrossRef]
- Sunnerhagen, P.; Sjöberg, R.M.; Karlsson, A.L.; Lundh, L.; Bjursell, G. Molecular cloning and characterization of small polydisperse circular DNA from mouse 3T6 cells. Nucleic Acids Res 1986, 14, 7823-7838. [CrossRef]
- Stanfield, S.W.; Helinski, D.R. Cloning and characterization of small circular DNA from Chinese hamster ovary cells. Mol Cell Biol 1984, 4, 173-180. [CrossRef]
- Li, C.; Duan, D.; Xue, Y.; Han, X.; Wang, K.; Qiao, R.; Li, X.L.; Li, X.J. An association study on imputed whole-genome resequencing from high-throughput sequencing data for body traits in crossbred pigs. Anim Genet 2022, 53, 212-219. [CrossRef]
- Xue, Y.; Li, C.; Duan, D.; Wang, M.; Han, X.; Wang, K.; Qiao, R.; Li, X.J.; Li, X.L. Genome-wide association studies for growth-related traits in a crossbreed pig population. Anim Genet 2021, 52, 217-222. [CrossRef]
- Ludwiczak, A.; Składanowska-Baryza, J.; Cieślak, A.; Stanisz, M.; Skrzypczak, E.; Sell-Kubiak, E.; Ślósarz, P.; Racewicz, P. Effect of prudent use of antimicrobials in the early phase of infection in pigs on the performance and meat quality of fattening pigs. Meat Sci 2024, 212, 109471. [CrossRef]
- Wang, W.; Wang, D.; Zhang, X.; Liu, X.; Niu, X.; Li, S.; Huang, S.; Ran, X.; Wang, J. Comparative transcriptome analysis of longissimus dorsi muscle reveal potential genes affecting meat trait in Chinese indigenous Xiang pig. Sci Rep 2024, 14, 8486. [CrossRef]
- Bolger, A.M.; Lohse, M.; Usadel, B. Trimmomatic: a flexible trimmer for Illumina sequence data. Bioinformatics 2014, 30, 2114-2120. [CrossRef]
- Li, H. Aligning sequence reads, clone sequences and assembly contigs with BWA-MEM. arXiv preprint arXiv:13033997 2013.
- Prada-Luengo, I.; Krogh, A.; Maretty, L.; Regenberg, B. Sensitive detection of circular DNAs at single-nucleotide resolution using guided realignment of partially aligned reads. BMC Bioinformatics 2019, 20, 663. [CrossRef]
- Quinlan, A.R.; Hall, I.M. BEDTools: a flexible suite of utilities for comparing genomic features. Bioinformatics 2010, 26, 841-842. [CrossRef]
- Sun, Z.; Ji, N.; Zhao, R.; Liang, J.; Jiang, J.; Tian, H. Extrachromosomal circular DNAs are common and functional in esophageal squamous cell carcinoma. Ann Transl Med 2021, 9, 1464. [CrossRef]
- Ramírez, F.; Ryan, D.P.; Grüning, B.; Bhardwaj, V.; Kilpert, F.; Richter, A.S.; Heyne, S.; Dündar, F.; Manke, T. deepTools2: a next generation web server for deep-sequencing data analysis. Nucleic Acids Res 2016, 44, W160-165. [CrossRef]
- Hao, Z.; Lv, D.; Ge, Y.; Shi, J.; Weijers, D.; Yu, G.; Chen, J. RIdeogram: drawing SVG graphics to visualize and map genome-wide data on the idiograms. PeerJ Comput Sci 2020, 6, e251. [CrossRef]
- Parkhomchuk, D.; Borodina, T.; Amstislavskiy, V.; Banaru, M.; Hallen, L.; Krobitsch, S.; Lehrach, H.; Soldatov, A. Transcriptome analysis by strand-specific sequencing of complementary DNA. Nucleic Acids Res 2009, 37, e123. [CrossRef]
- Yan, L.; Yang, M.; Guo, H.; Yang, L.; Wu, J.; Li, R.; Liu, P.; Lian, Y.; Zheng, X.; Yan, J., et al. Single-cell RNA-Seq profiling of human preimplantation embryos and embryonic stem cells. Nat Struct Mol Biol 2013, 20, 1131-1139. [CrossRef]
- Mortazavi, A.; Williams, B.A.; McCue, K.; Schaeffer, L.; Wold, B. Mapping and quantifying mammalian transcriptomes by RNA-Seq. Nat Methods 2008, 5, 621-628. [CrossRef]
- Pertea, M.; Pertea, G.M.; Antonescu, C.M.; Chang, T.C.; Mendell, J.T.; Salzberg, S.L. StringTie enables improved reconstruction of a transcriptome from RNA-seq reads. Nat Biotechnol 2015, 33, 290-295. [CrossRef]
- Liao, Y.; Smyth, G.K.; Shi, W. featureCounts: an efficient general purpose program for assigning sequence reads to genomic features. Bioinformatics 2014, 30, 923-930. [CrossRef]
- Anders, S.; Huber, W. Differential expression analysis for sequence count data. Genome Biol 2010, 11, R106. [CrossRef]
- Otasek, D.; Morris, J.H.; Bouças, J.; Pico, A.R.; Demchak, B. Cytoscape Automation: empowering workflow-based network analysis. Genome Biol 2019, 20, 185. [CrossRef]
- Soto, L.F.; Li, Z.; Santoso, C.S.; Berenson, A.; Ho, I.; Shen, V.X.; Yuan, S.; Fuxman Bass, J.I. Compendium of human transcription factor effector domains. Mol Cell 2022, 82, 514-526. [CrossRef]
- Schmeier, S.; Alam, T.; Essack, M.; Bajic, V.B. TcoF-DB v2: update of the database of human and mouse transcription co-factors and transcription factor interactions. Nucleic Acids Res 2017, 45, D145-d150. [CrossRef]
- Xu, M.; Bai, X.; Ai, B.; Zhang, G.; Song, C.; Zhao, J.; Wang, Y.; Wei, L.; Qian, F.; Li, Y., et al. TF-Marker: a comprehensive manually curated database for transcription factors and related markers in specific cell and tissue types in human. Nucleic Acids Res 2022, 50, D402-d412. [CrossRef]
- Knezevic, K.; Bee, T.; Wilson, N.K.; Janes, M.E.; Kinston, S.; Polderdijk, S.; Kolb-Kokocinski, A.; Ottersbach, K.; Pencovich, N.; Groner, Y., et al. A Runx1-Smad6 rheostat controls Runx1 activity during embryonic hematopoiesis. Mol Cell Biol 2011, 31, 2817-2826. [CrossRef]
- Møller, H.D.; Mohiyuddin, M.; Prada-Luengo, I.; Sailani, M.R.; Halling, J.F.; Plomgaard, P.; Maretty, L.; Hansen, A.J.; Snyder, M.P.; Pilegaard, H., et al. Circular DNA elements of chromosomal origin are common in healthy human somatic tissue. Nat Commun 2018, 9, 1069. [CrossRef]
- Paulsen, T.; Shibata, Y.; Kumar, P.; Dillon, L.; Dutta, A. Small extrachromosomal circular DNAs, microDNA, produce short regulatory RNAs that suppress gene expression independent of canonical promoters. Nucleic Acids Res 2019, 47, 4586-4596. [CrossRef]
- Shoger, K.E.; Cheemalavagu, N.; Cao, Y.M.; Michalides, B.A.; Chaudhri, V.K.; Cohen, J.A.; Singh, H.; Gottschalk, R.A. CISH attenuates homeostatic cytokine signaling to promote lung-specific macrophage programming and function. Sci Signal 2021, 14, eabe5137. [CrossRef]
- Jones, R.B.; Gordus, A.; Krall, J.A.; MacBeath, G. A quantitative protein interaction network for the ErbB receptors using protein microarrays. Nature 2006, 439, 168-174. [CrossRef]
- Wang, M.; Wei, X.; Shi, L.; Chen, B.; Zhao, G.; Yang, H. Integrative genomic analyses of the histamine H1 receptor and its role in cancer prediction. Int J Mol Med 2014, 33, 1019-1026. [CrossRef]
- Hu, C.; Feng, X.; Ma, Y.; Wei, D.; Zhang, L.; Wang, S.; Ma, Y. CircADAMTS16 Inhibits Differentiation and Promotes Proliferation of Bovine Adipocytes by Targeting miR-10167-3p. Cells 2023, 12. [CrossRef]
- Shen, Y.; Zhou, H.; Jin, W.; Lee, H.J. Acute exercise regulates adipogenic gene expression in white adipose tissue. Biol Sport 2016, 33, 381-391. [CrossRef]
- Barrientos-Riosalido, A.; Bertran, L.; Vilaró-Blay, M.; Aguilar, C.; Martínez, S.; Paris, M.; Sabench, F.; Riesco, D.; Binetti, J.; Castillo, D.D., et al. The Role of Olfactomedin 2 in the Adipose Tissue-Liver Axis and Its Implication in Obesity-Associated Nonalcoholic Fatty Liver Disease. Int J Mol Sci 2023, 24. [CrossRef]
- Wu, X.; Lu, W.; Xu, C.; Jiang, C.; Zhang, W.; Zhang, D.; Cui, S.; Zhuo, Z.; Cui, Y.; Mei, H., et al. PTGIS May Be a Predictive Marker for Ovarian Cancer by Regulating Fatty Acid Metabolism. Comput Math Methods Med 2023, 2023, 2397728. [CrossRef]
- Di Cesare, P.E.; Chen, F.S.; Moergelin, M.; Carlson, C.S.; Leslie, M.P.; Perris, R.; Fang, C. Matrix-matrix interaction of cartilage oligomeric matrix protein and fibronectin. Matrix Biol 2002, 21, 461-470. [CrossRef]
- Wu, H.; Gao, J.; Xie, Z.; Xie, M.; Song, R.; Yuan, X.; Wu, Y.; Ou, D. Effect of chronic deltamethrin exposure on brain transcriptome and metabolome of juvenile crucian carp. Environ Toxicol 2024, 39, 1544-1555. [CrossRef]
- Lei, K.; Liang, R.; Tan, B.; Li, L.; Lyu, Y.; Wang, K.; Wang, W.; Wang, K.; Hu, X.; Wu, D., et al. Effects of Lipid Metabolism-Related Genes PTGIS and HRASLS on Phenotype, Prognosis, and Tumor Immunity in Lung Squamous Cell Carcinoma. Oxid Med Cell Longev 2023, 2023, 6811625. [CrossRef]
- Zhang, P.; Fu, Y.; Zhang, R.; Shang, P.; Zhang, H.; Zhang, B. Association of KCTD15 gene with fat deposition in pigs. J Anim Physiol Anim Nutr (Berl) 2022, 106, 537-544. [CrossRef]
- Brahma, P.K.; Zhang, H.; Murray, B.S.; Shu, F.J.; Sidell, N.; Seli, E.; Kallen, C.B. The mRNA-binding protein Zfp36 is upregulated by β-adrenergic stimulation and represses IL-6 production in 3T3-L1 adipocytes. Obesity (Silver Spring) 2012, 20, 40-47. [CrossRef]
- Ouyang, Y.; Lu, W.; Wang, Y.; Wang, B.; Li, F.; Li, X.; Bai, Y.; Wang, Y. Integrated analysis of mRNA and extrachromosomal circular DNA profiles to identify the potential mRNA biomarkers in breast cancer. Gene 2023, 857, 147174. [CrossRef]
- Møller, H.D.; Ramos-Madrigal, J.; Prada-Luengo, I.; Gilbert, M.T.P.; Regenberg, B. Near-Random Distribution of Chromosome-Derived Circular DNA in the Condensed Genome of Pigeons and the Larger, More Repeat-Rich Human Genome. Genome Biol Evol 2020, 12, 3762-3777. [CrossRef]
- Chen, K.; Chi, Y.; Cheng, H.; Yang, M.; Tan, Q.; Hao, J.; Lin, Y.; Mao, F.; He, S.; Yang, J. Identification and characterization of extrachromosomal circular DNA in large-artery atherosclerotic stroke. J Cell Mol Med 2024, 28, e18210. [CrossRef]
- Sin, S.T.K.; Jiang, P.; Deng, J.; Ji, L.; Cheng, S.H.; Dutta, A.; Leung, T.Y.; Chan, K.C.A.; Chiu, R.W.K.; Lo, Y.M.D. Identification and characterization of extrachromosomal circular DNA in maternal plasma. Proc Natl Acad Sci U S A 2020, 117, 1658-1665. [CrossRef]
- Wu, S.; Turner, K.M.; Nguyen, N.; Raviram, R.; Erb, M.; Santini, J.; Luebeck, J.; Rajkumar, U.; Diao, Y.; Li, B., et al. Circular ecDNA promotes accessible chromatin and high oncogene expression. Nature 2019, 575, 699-703. [CrossRef]
- Verhaak, R.G.W.; Bafna, V.; Mischel, P.S. Extrachromosomal oncogene amplification in tumour pathogenesis and evolution. Nat Rev Cancer 2019, 19, 283-288. [CrossRef]
- Pang, J.; Pan, X.; Lin, L.; Li, L.; Yuan, S.; Han, P.; Ji, X.; Li, H.; Wang, C.; Chu, Z., et al. Characterization of Plasma Extrachromosomal Circular DNA in Gouty Arthritis. Front Genet 2022, 13, 859513. [CrossRef]
- Zhou, T.; Ma, S.; Zhao, Y.; Guo, D.; Wang, H.; Kuang, M.; Li, X. Identification and characterization of extrachromosomal circular DNA in alcohol induced osteonecrosis of femoral head. Front Genet 2022, 13, 918379. [CrossRef]
- Ren, S.; Wu, D.; Shen, X.; Wu, Q.; Li, C.; Xiong, H.; Xiong, Z.; Gong, R.; Liu, Z.; Wang, W., et al. Deciphering the role of extrachromosomal circular DNA in adipose stem cells from old and young donors. Stem Cell Res Ther 2023, 14, 341. [CrossRef]
- Mansisidor, A.; Molinar, T., Jr.; Srivastava, P.; Dartis, D.D.; Pino Delgado, A.; Blitzblau, H.G.; Klein, H.; Hochwagen, A. Genomic Copy-Number Loss Is Rescued by Self-Limiting Production of DNA Circles. Mol Cell 2018, 72, 583-593.e584. [CrossRef]
- Gresham, D.; Usaite, R.; Germann, S.M.; Lisby, M.; Botstein, D.; Regenberg, B. Adaptation to diverse nitrogen-limited environments by deletion or extrachromosomal element formation of the GAP1 locus. Proc Natl Acad Sci U S A 2010, 107, 18551-18556. [CrossRef]
- Zhu, M.; Tong, X.; Qiu, Q.; Pan, J.; Wei, S.; Ding, Y.; Feng, Y.; Hu, X.; Gong, C. Identification and characterization of extrachromosomal circular DNA in the silk gland of Bombyx mori. Insect Sci 2023, 30, 1565-1578. [CrossRef]
- Von Hoff, D.D.; McGill, J.R.; Forseth, B.J.; Davidson, K.K.; Bradley, T.P.; Van Devanter, D.R.; Wahl, G.M. Elimination of extrachromosomally amplified MYC genes from human tumor cells reduces their tumorigenicity. Proc Natl Acad Sci U S A 1992, 89, 8165-8169. [CrossRef]
- Guo, H.; Cui, B.D.; Gong, M.; Li, Q.X.; Zhang, L.X.; Chen, J.L.; Chi, J.; Zhu, L.L.; Xu, E.P.; Wang, Z.M., et al. An ethanolic extract of Arctium lappa L. leaves ameliorates experimental atherosclerosis by modulating lipid metabolism and inflammatory responses through PI3K/Akt and NF-κB singnaling pathways. J Ethnopharmacol 2024, 325, 117768. [CrossRef]
- Sun, W.; Quan, C.; Huang, Y.; Ji, W.; Yu, L.; Li, X.; Zhang, Y.; Zheng, Z.; Zou, H.; Li, Q., et al. Constitutive ERK1/2 activation contributes to production of double minute chromosomes in tumour cells. J Pathol 2015, 235, 14-24. [CrossRef]
- Dang, L.; Dong, Y.; Zhang, C.; Su, B.; Ning, N.; Zhou, S.; Zhang, M.; Huang, Q.; Li, Y.; Wang, S. Zishen Yutai pills restore fertility in premature ovarian failure through regulating arachidonic acid metabolism and the ATK pathway. J Ethnopharmacol 2024, 324, 117782. [CrossRef]
- 童新宇. 家蚕丝腺eccDNAs的特征及eccDNA~(fib-L)的功能研究 [D], 2022.
- Jiang, X.; Pan, X.; Li, W.; Han, P.; Yu, J.; Li, J.; Zhang, H.; Lv, W.; Zhang, Y.; He, Y., et al. Genome-wide characterization of extrachromosomal circular DNA in gastric cancer and its potential role in carcinogenesis and cancer progression. Cell Mol Life Sci 2023, 80, 191. [CrossRef]
Figure 1.
eccDNA Sequencing Results. (A) Schematic representation of the Circle-Seq method for whole-genome analysis of eccDNA. (B) Venn diagram illustrating differential eccDNAs. (C and D) Distribution of differential eccDNAs lengths.
Figure 1.
eccDNA Sequencing Results. (A) Schematic representation of the Circle-Seq method for whole-genome analysis of eccDNA. (B) Venn diagram illustrating differential eccDNAs. (C and D) Distribution of differential eccDNAs lengths.
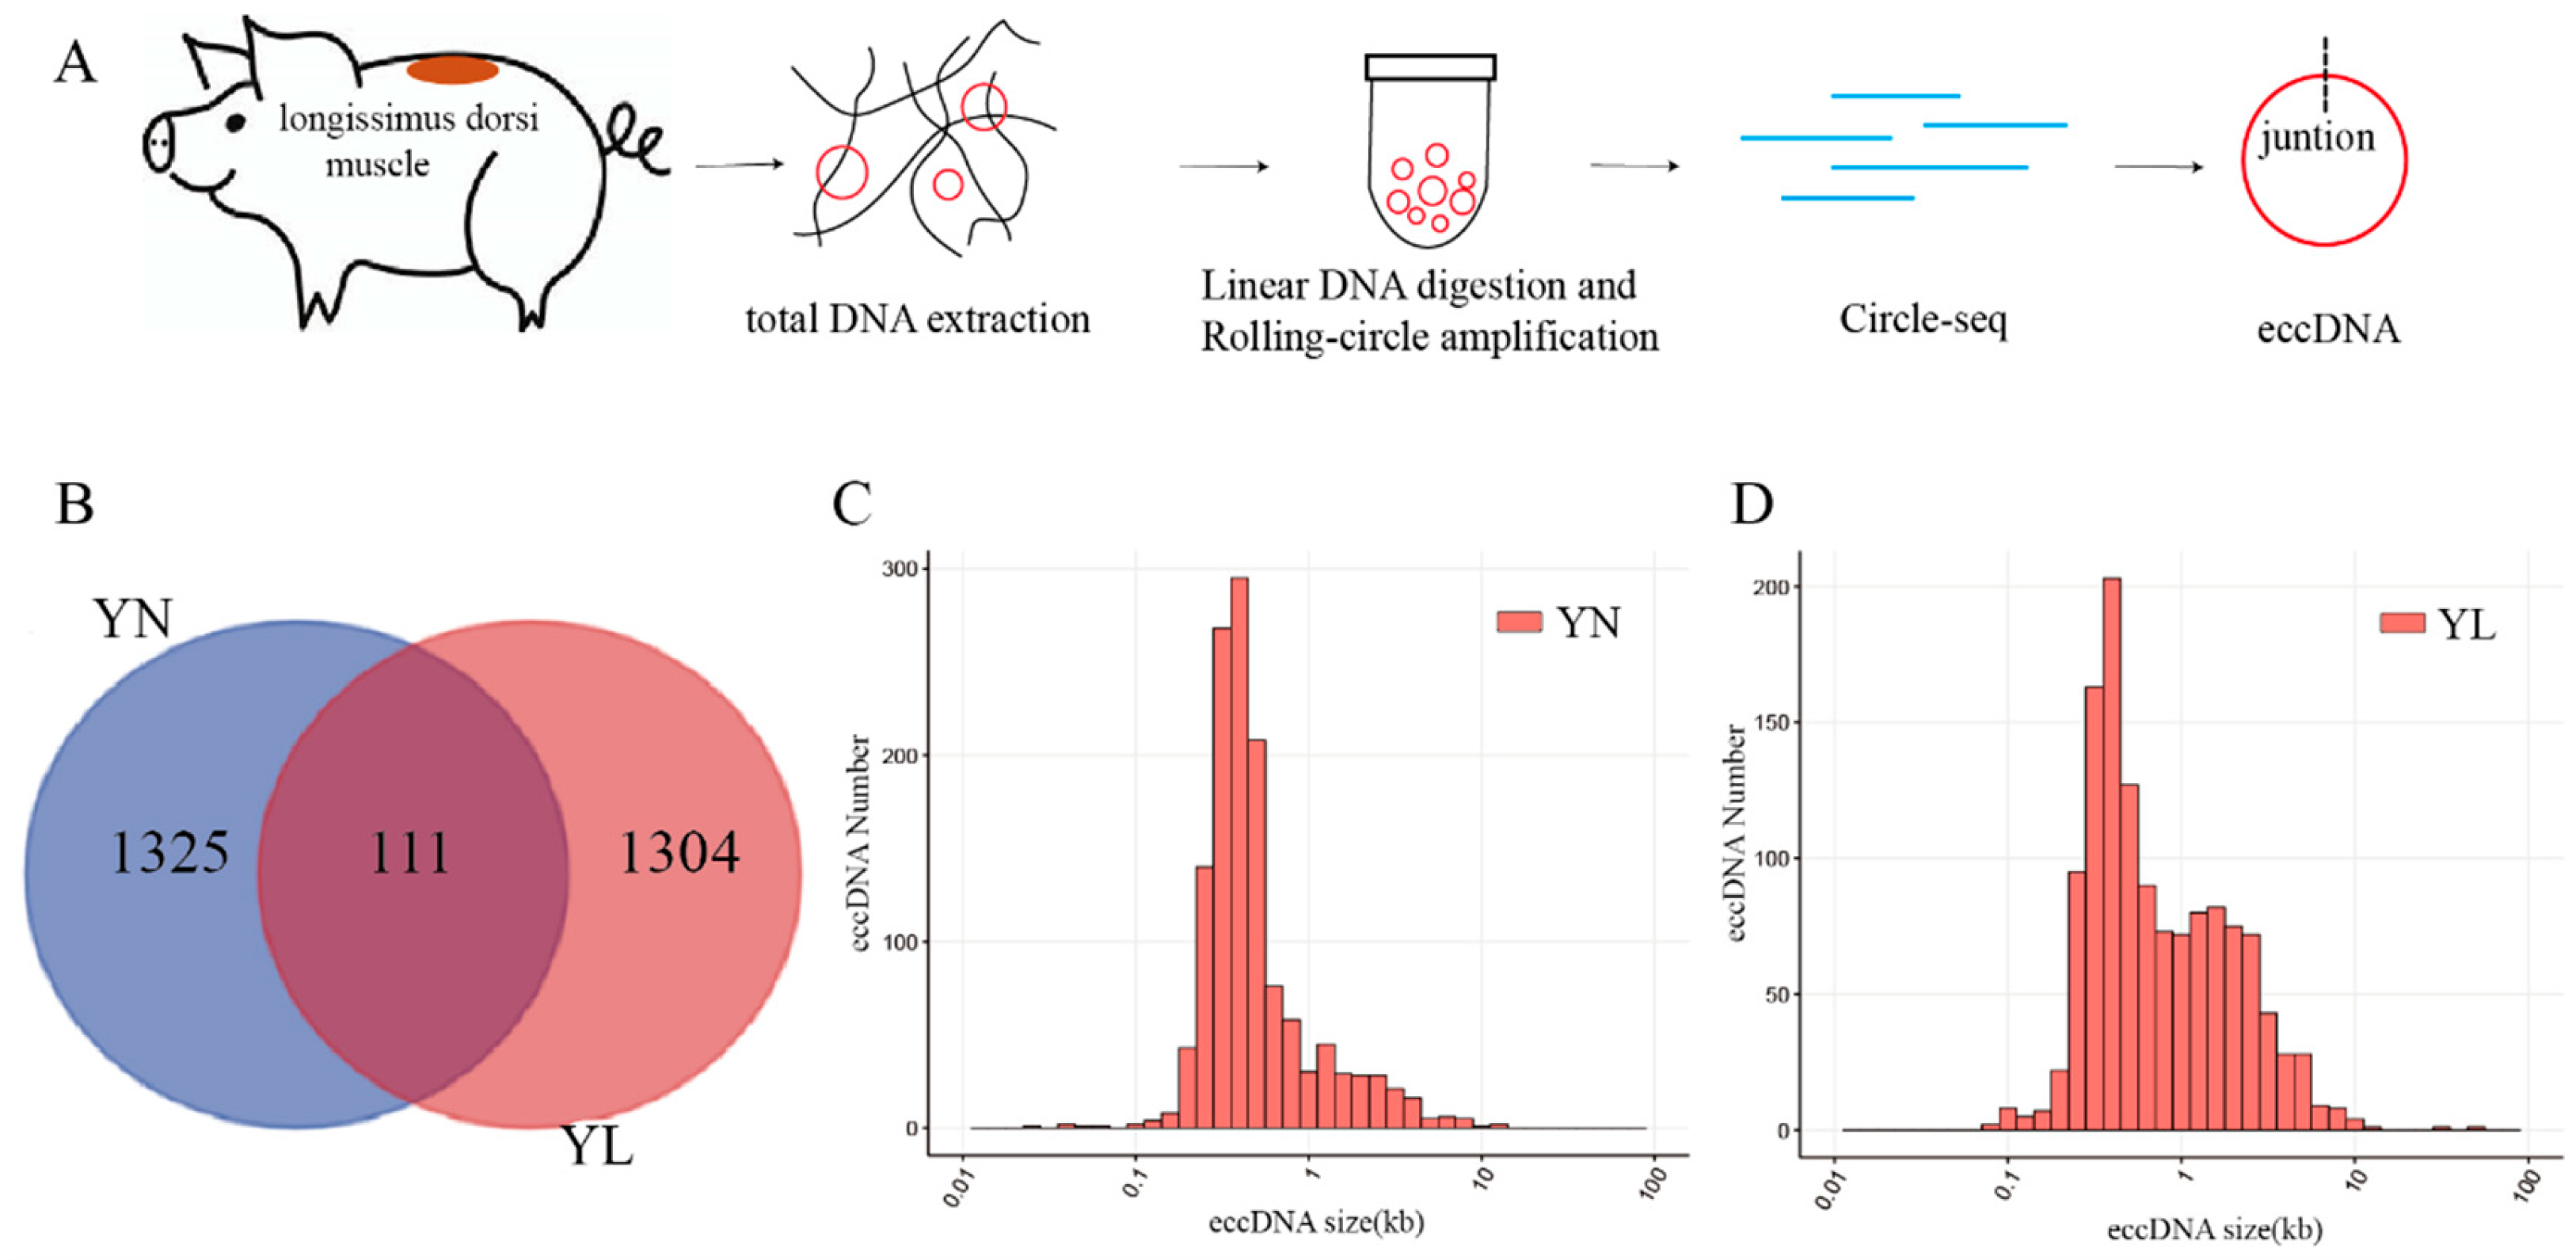
Figure 2.
Chromosomal distribution of eccDNAs and expressed. (A) Proportional representation of differential eccDNAs across genomic functional regions. (B) The analysis of the GC content of differential eccDNAs and their upStream and downStream regions with equivalent lengths (1000 bp) from the YN and YL groups. DownStream: represents the downStream region of eccDNA; eccDNA: represents the entire coordinate interval of eccDNA; upStream: represents the upStream region of eccDNA. (C) Differences between the YN and YL groups eccDNAs distribution number on chromosomes. (D) The chromosomal distribution of differential eccDNAs in YN group. (E) The chromosomal distribution of differential eccDNAs in YL group. The depth of chromosome color represents gene density, while varying shades of orange indicate the number of differential eccDNAs on the chromosome, with higher shades indicating a greater abundance of differential eccDNAs. (F) The number of annotated genes associated with differential eccDNAs.
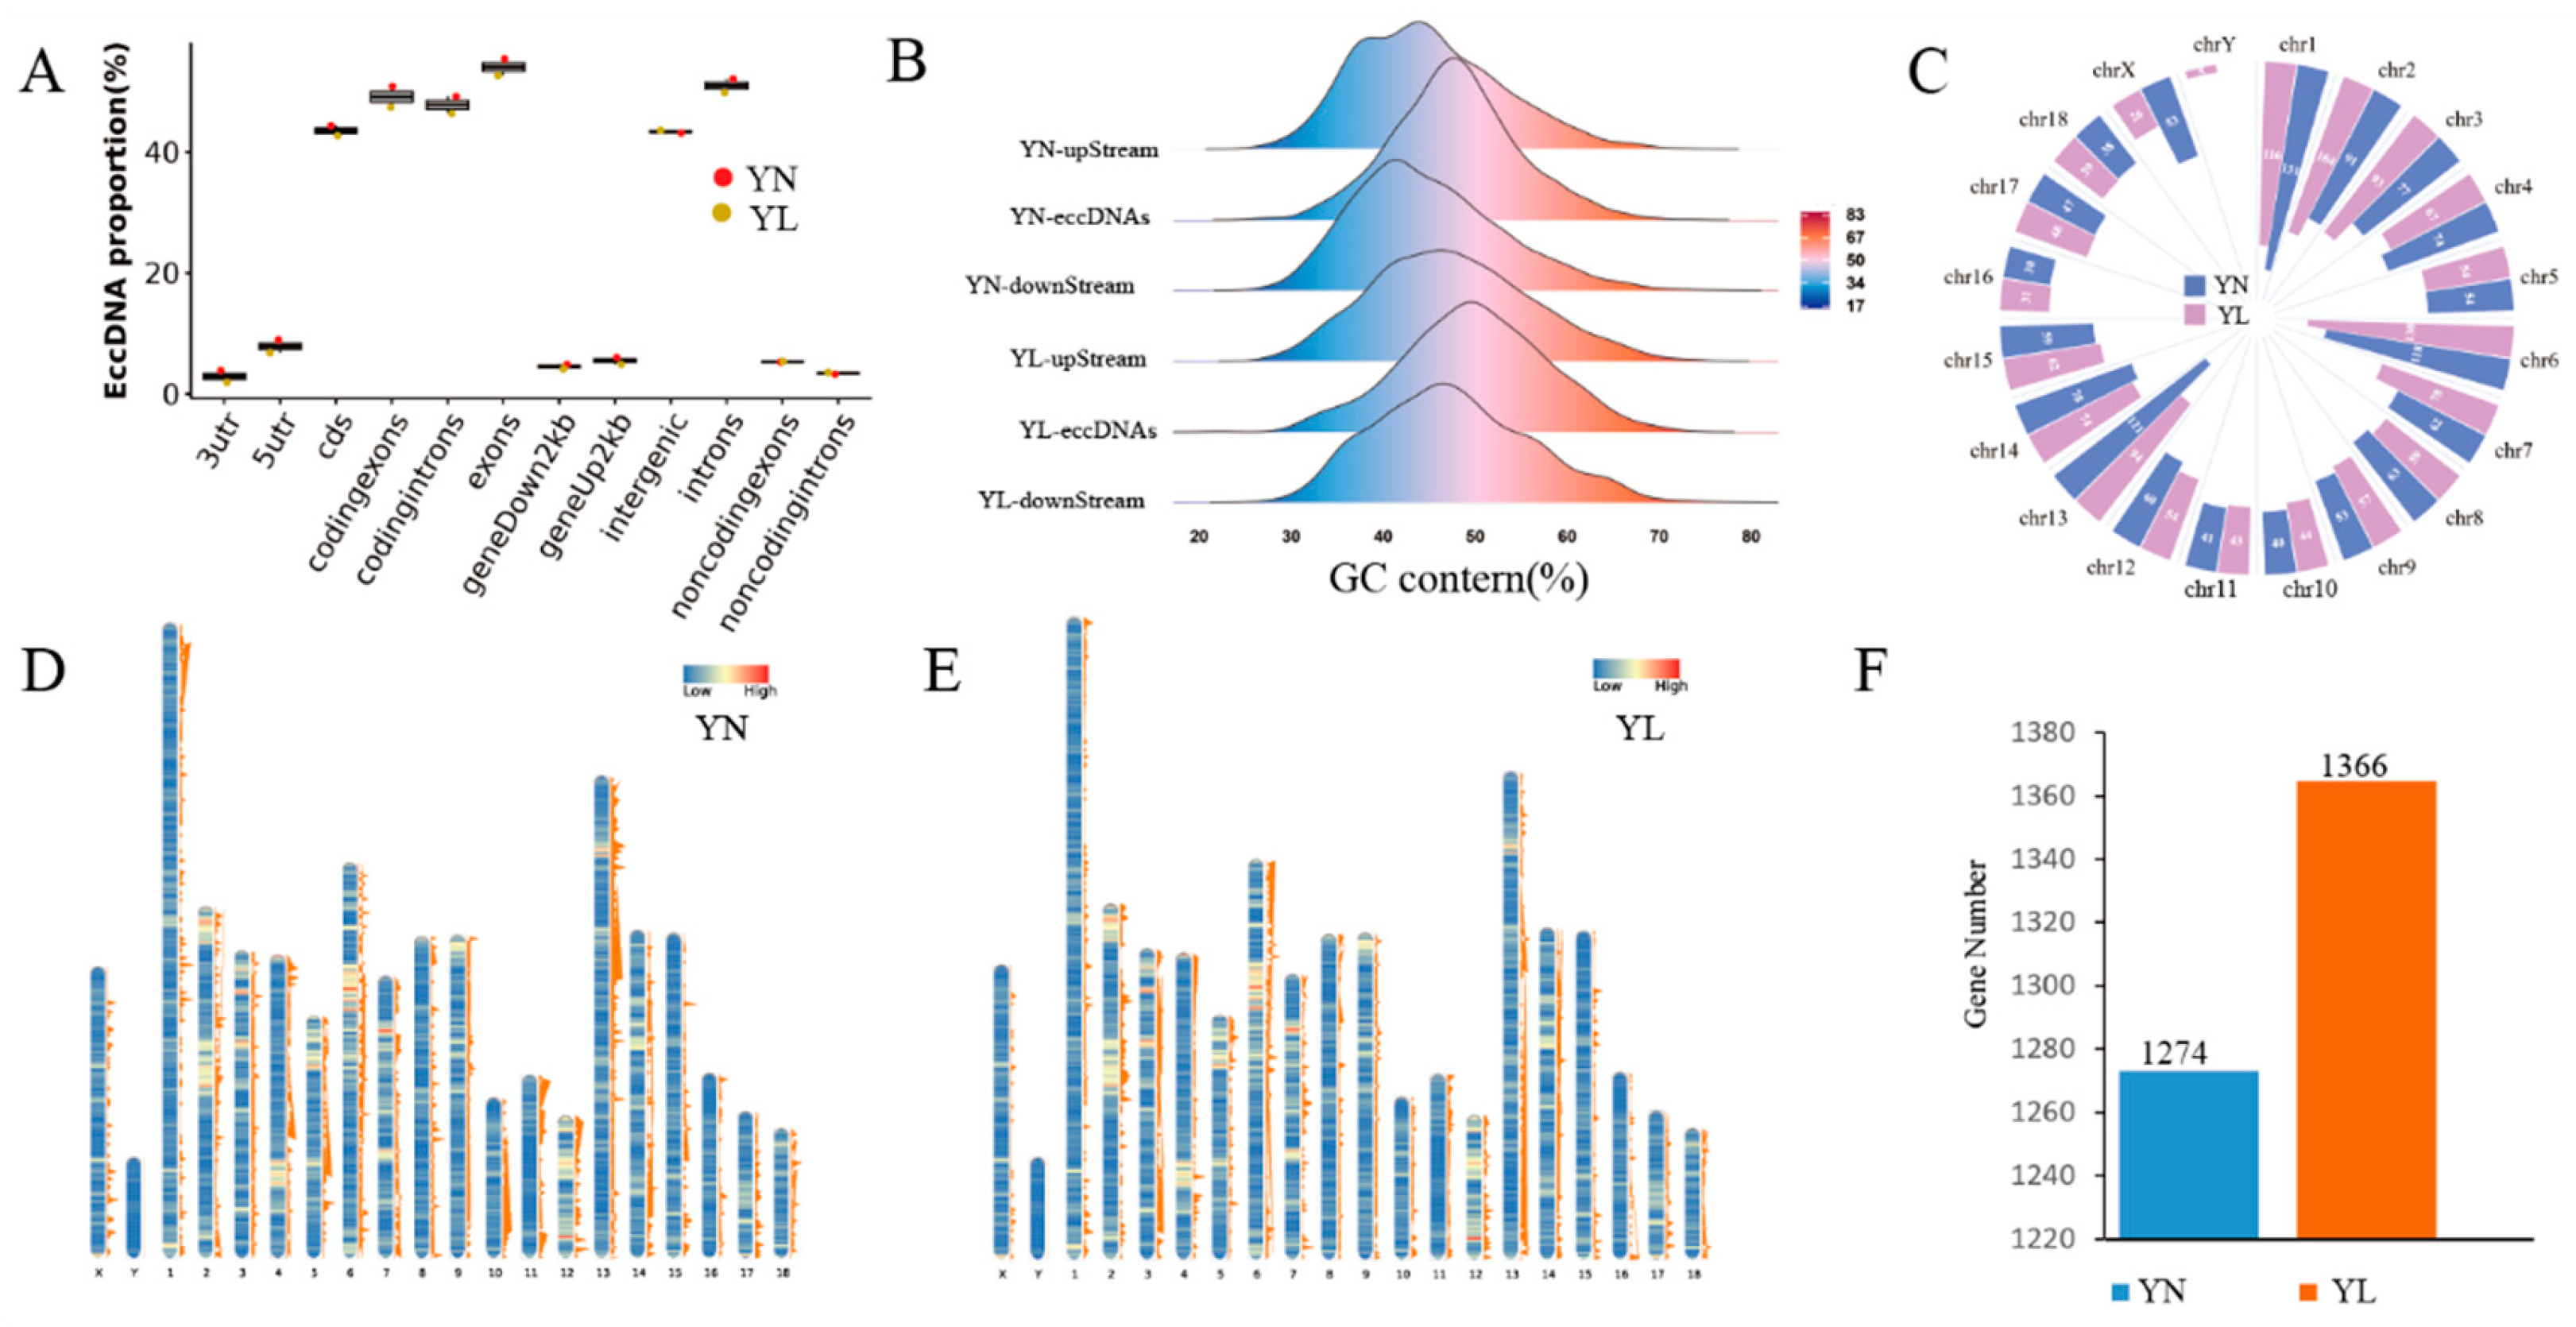
Figure 3.
Circular validation of eccDNAs.
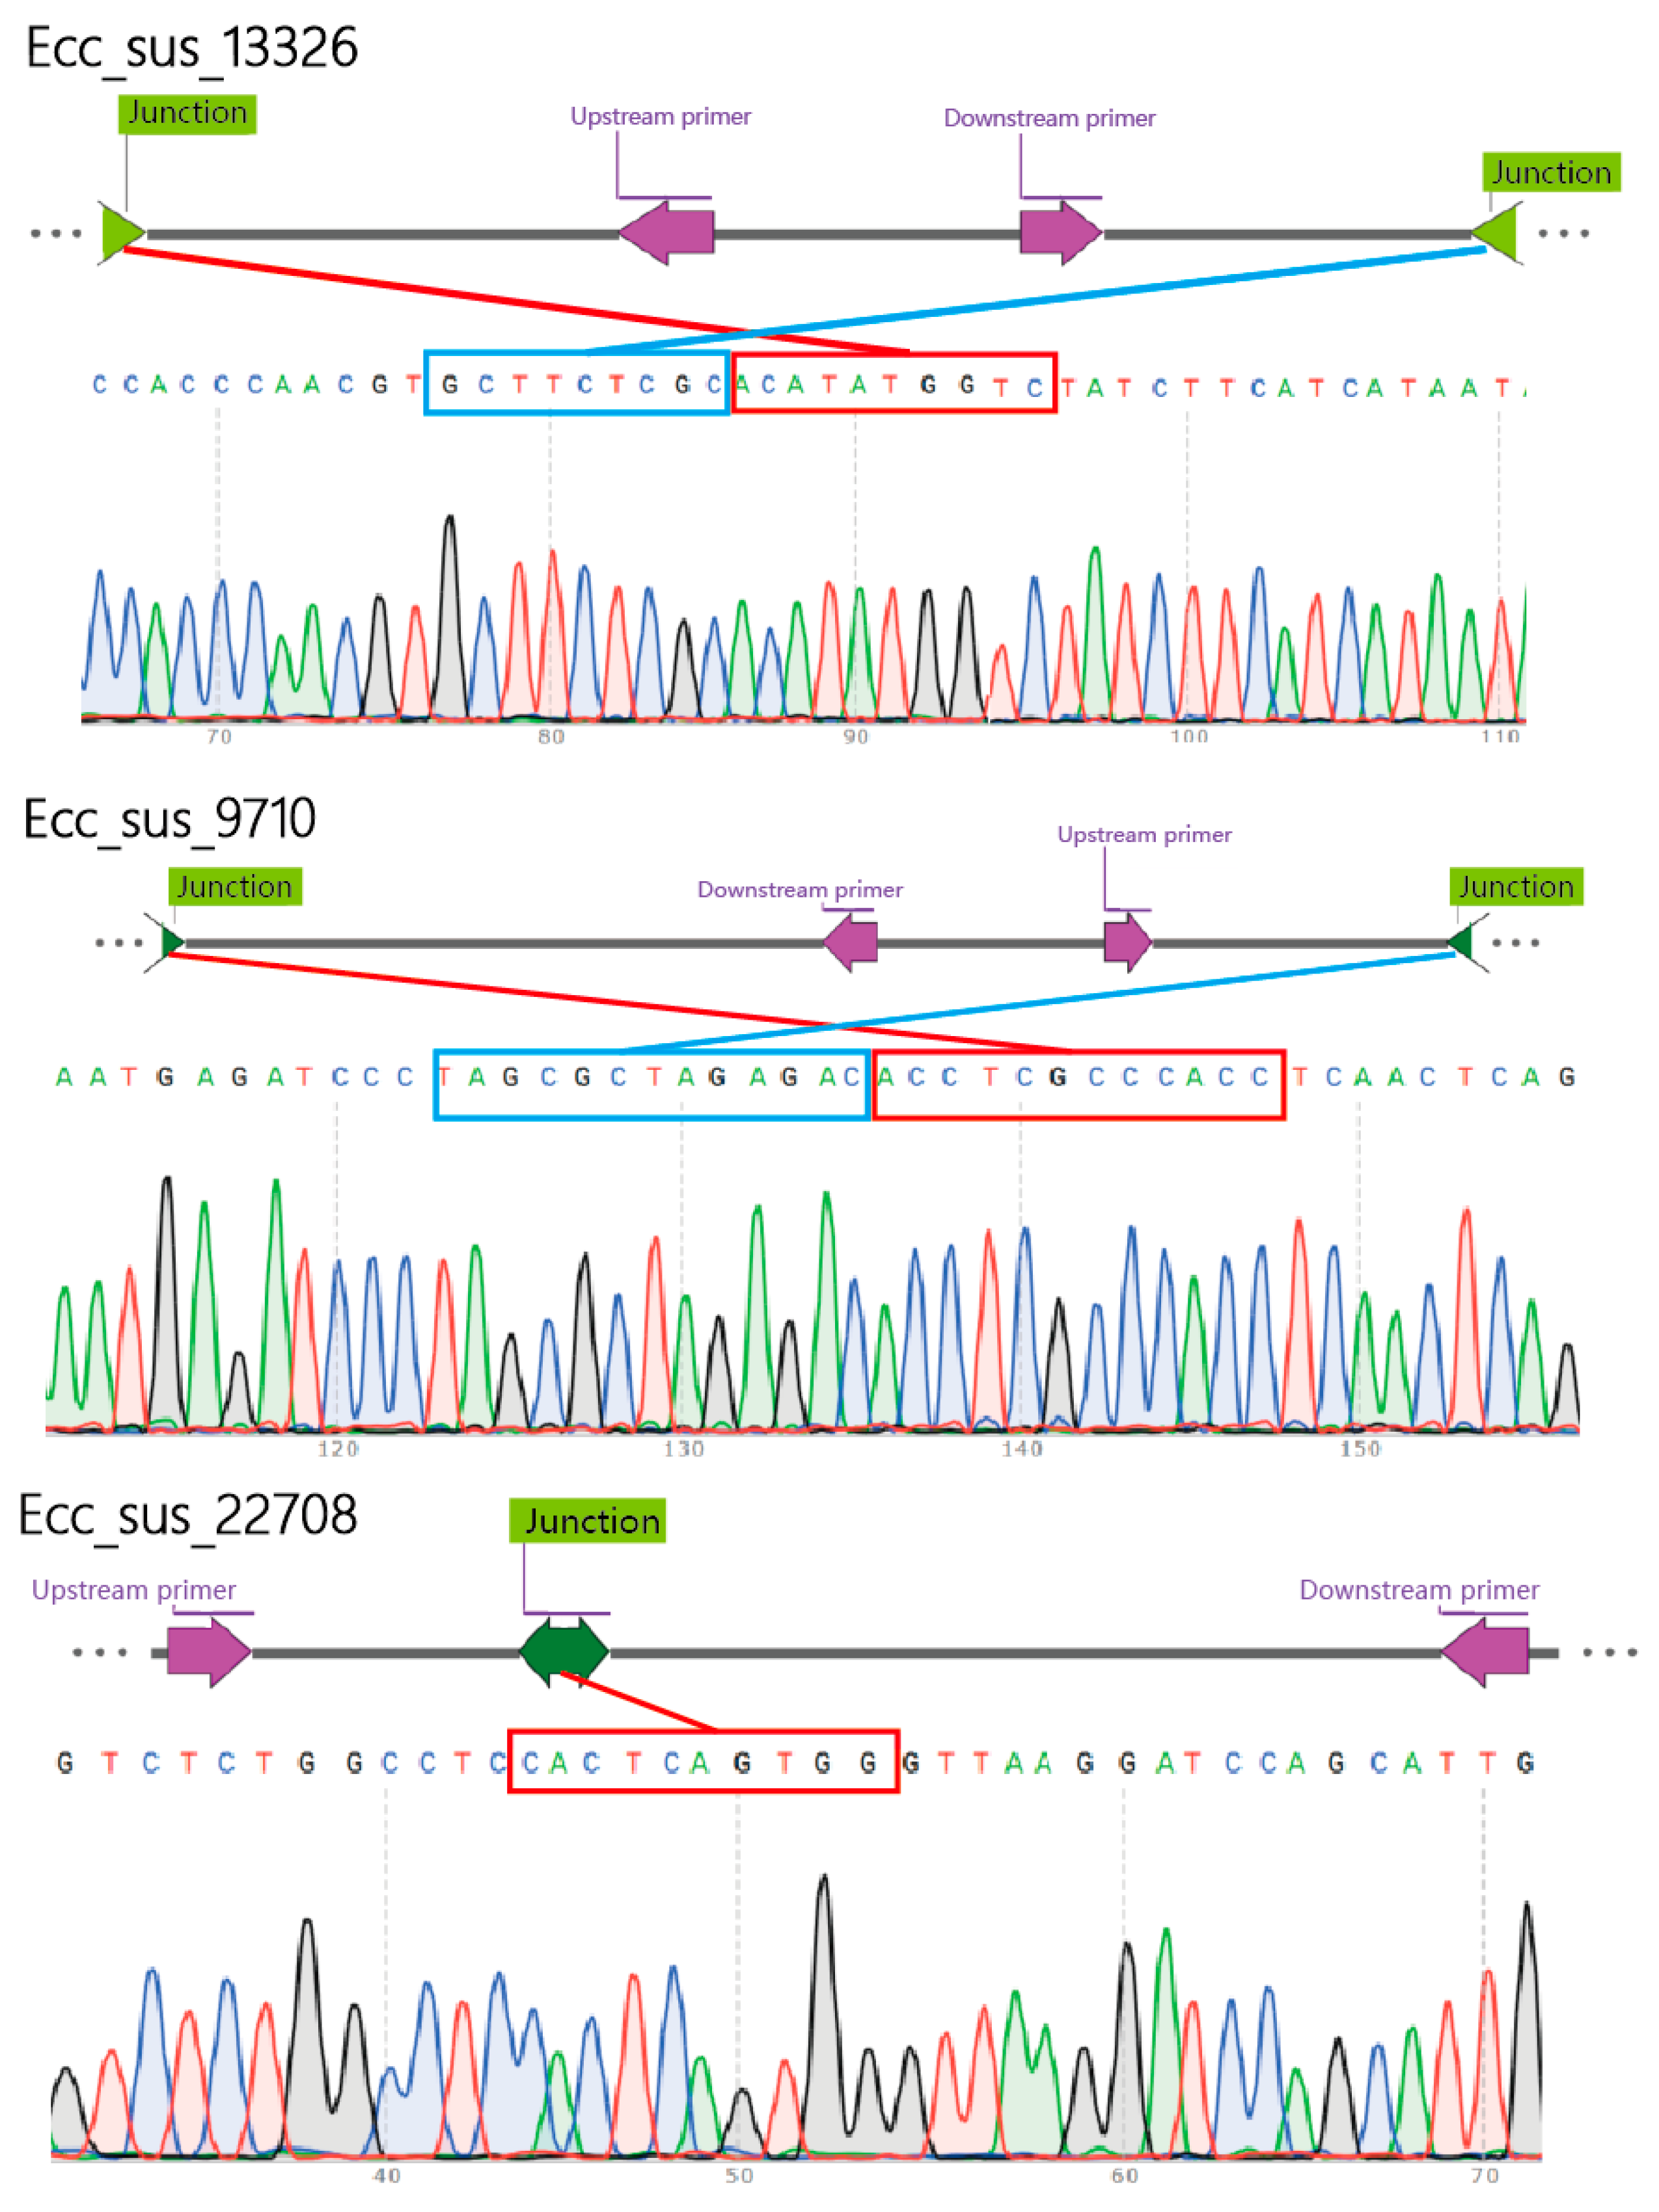
Figure 4.
Transcriptome sequencing results. (A) Principal component analysis between individuals in the two groups. (B) Volcano plot of DEGs (up: genes expression was higher in the YN group than in the YL group, down: genes expression was lower in the YN group than in the YL group). (C) Heatmap of clustered DEGs. .
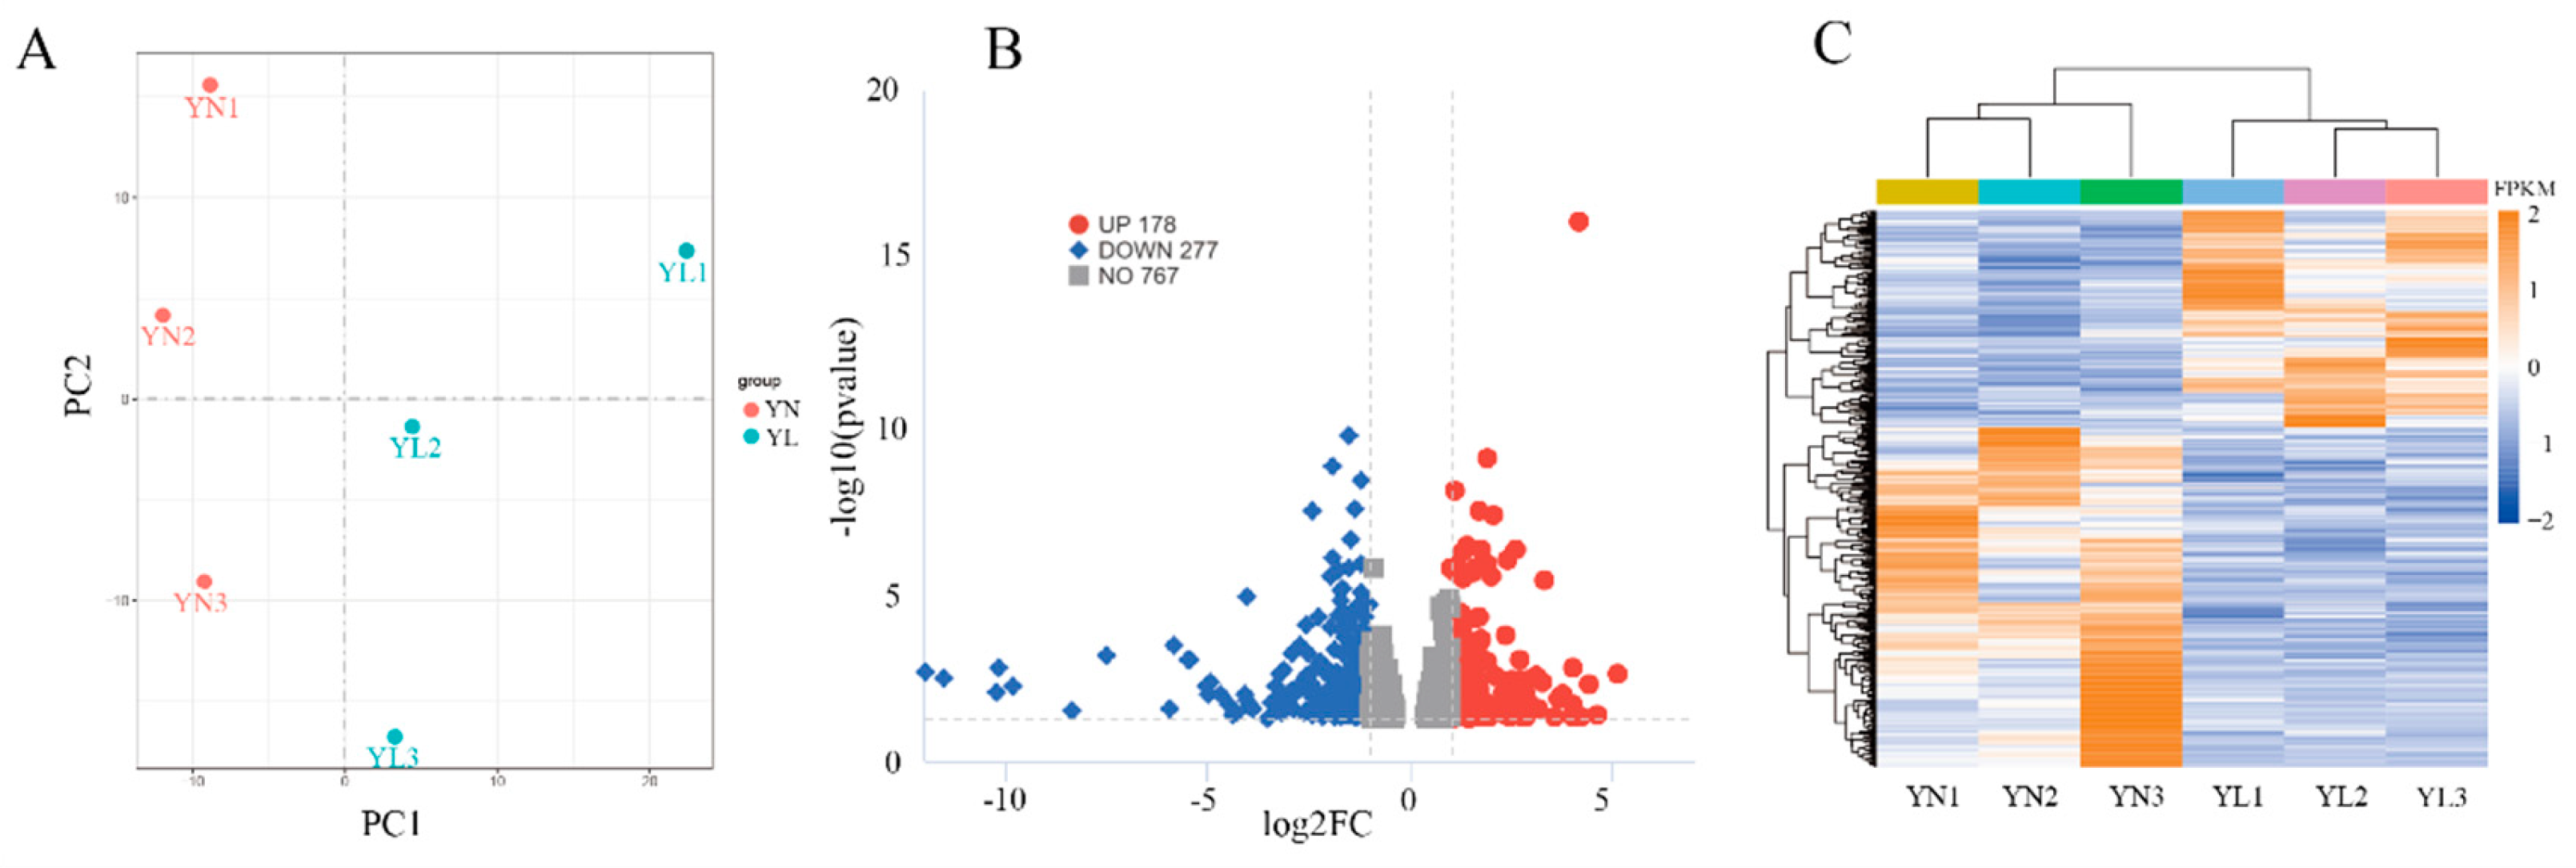
Figure 5.
Analysis of Genes Derived from the Integration of eccDNAs and Transcriptome. (A) Intersection of two omics genes. (B, C) Analysis of binding gene interaction between YN and YL group. The inner circle represents eccDEGs and the outer circle represents genes that interact with eccDEGs. (D, F) KEGG analysis of binding eccDEGs in YN and YL group. (E, G) GO analysis of two omics binding eccDEGs.
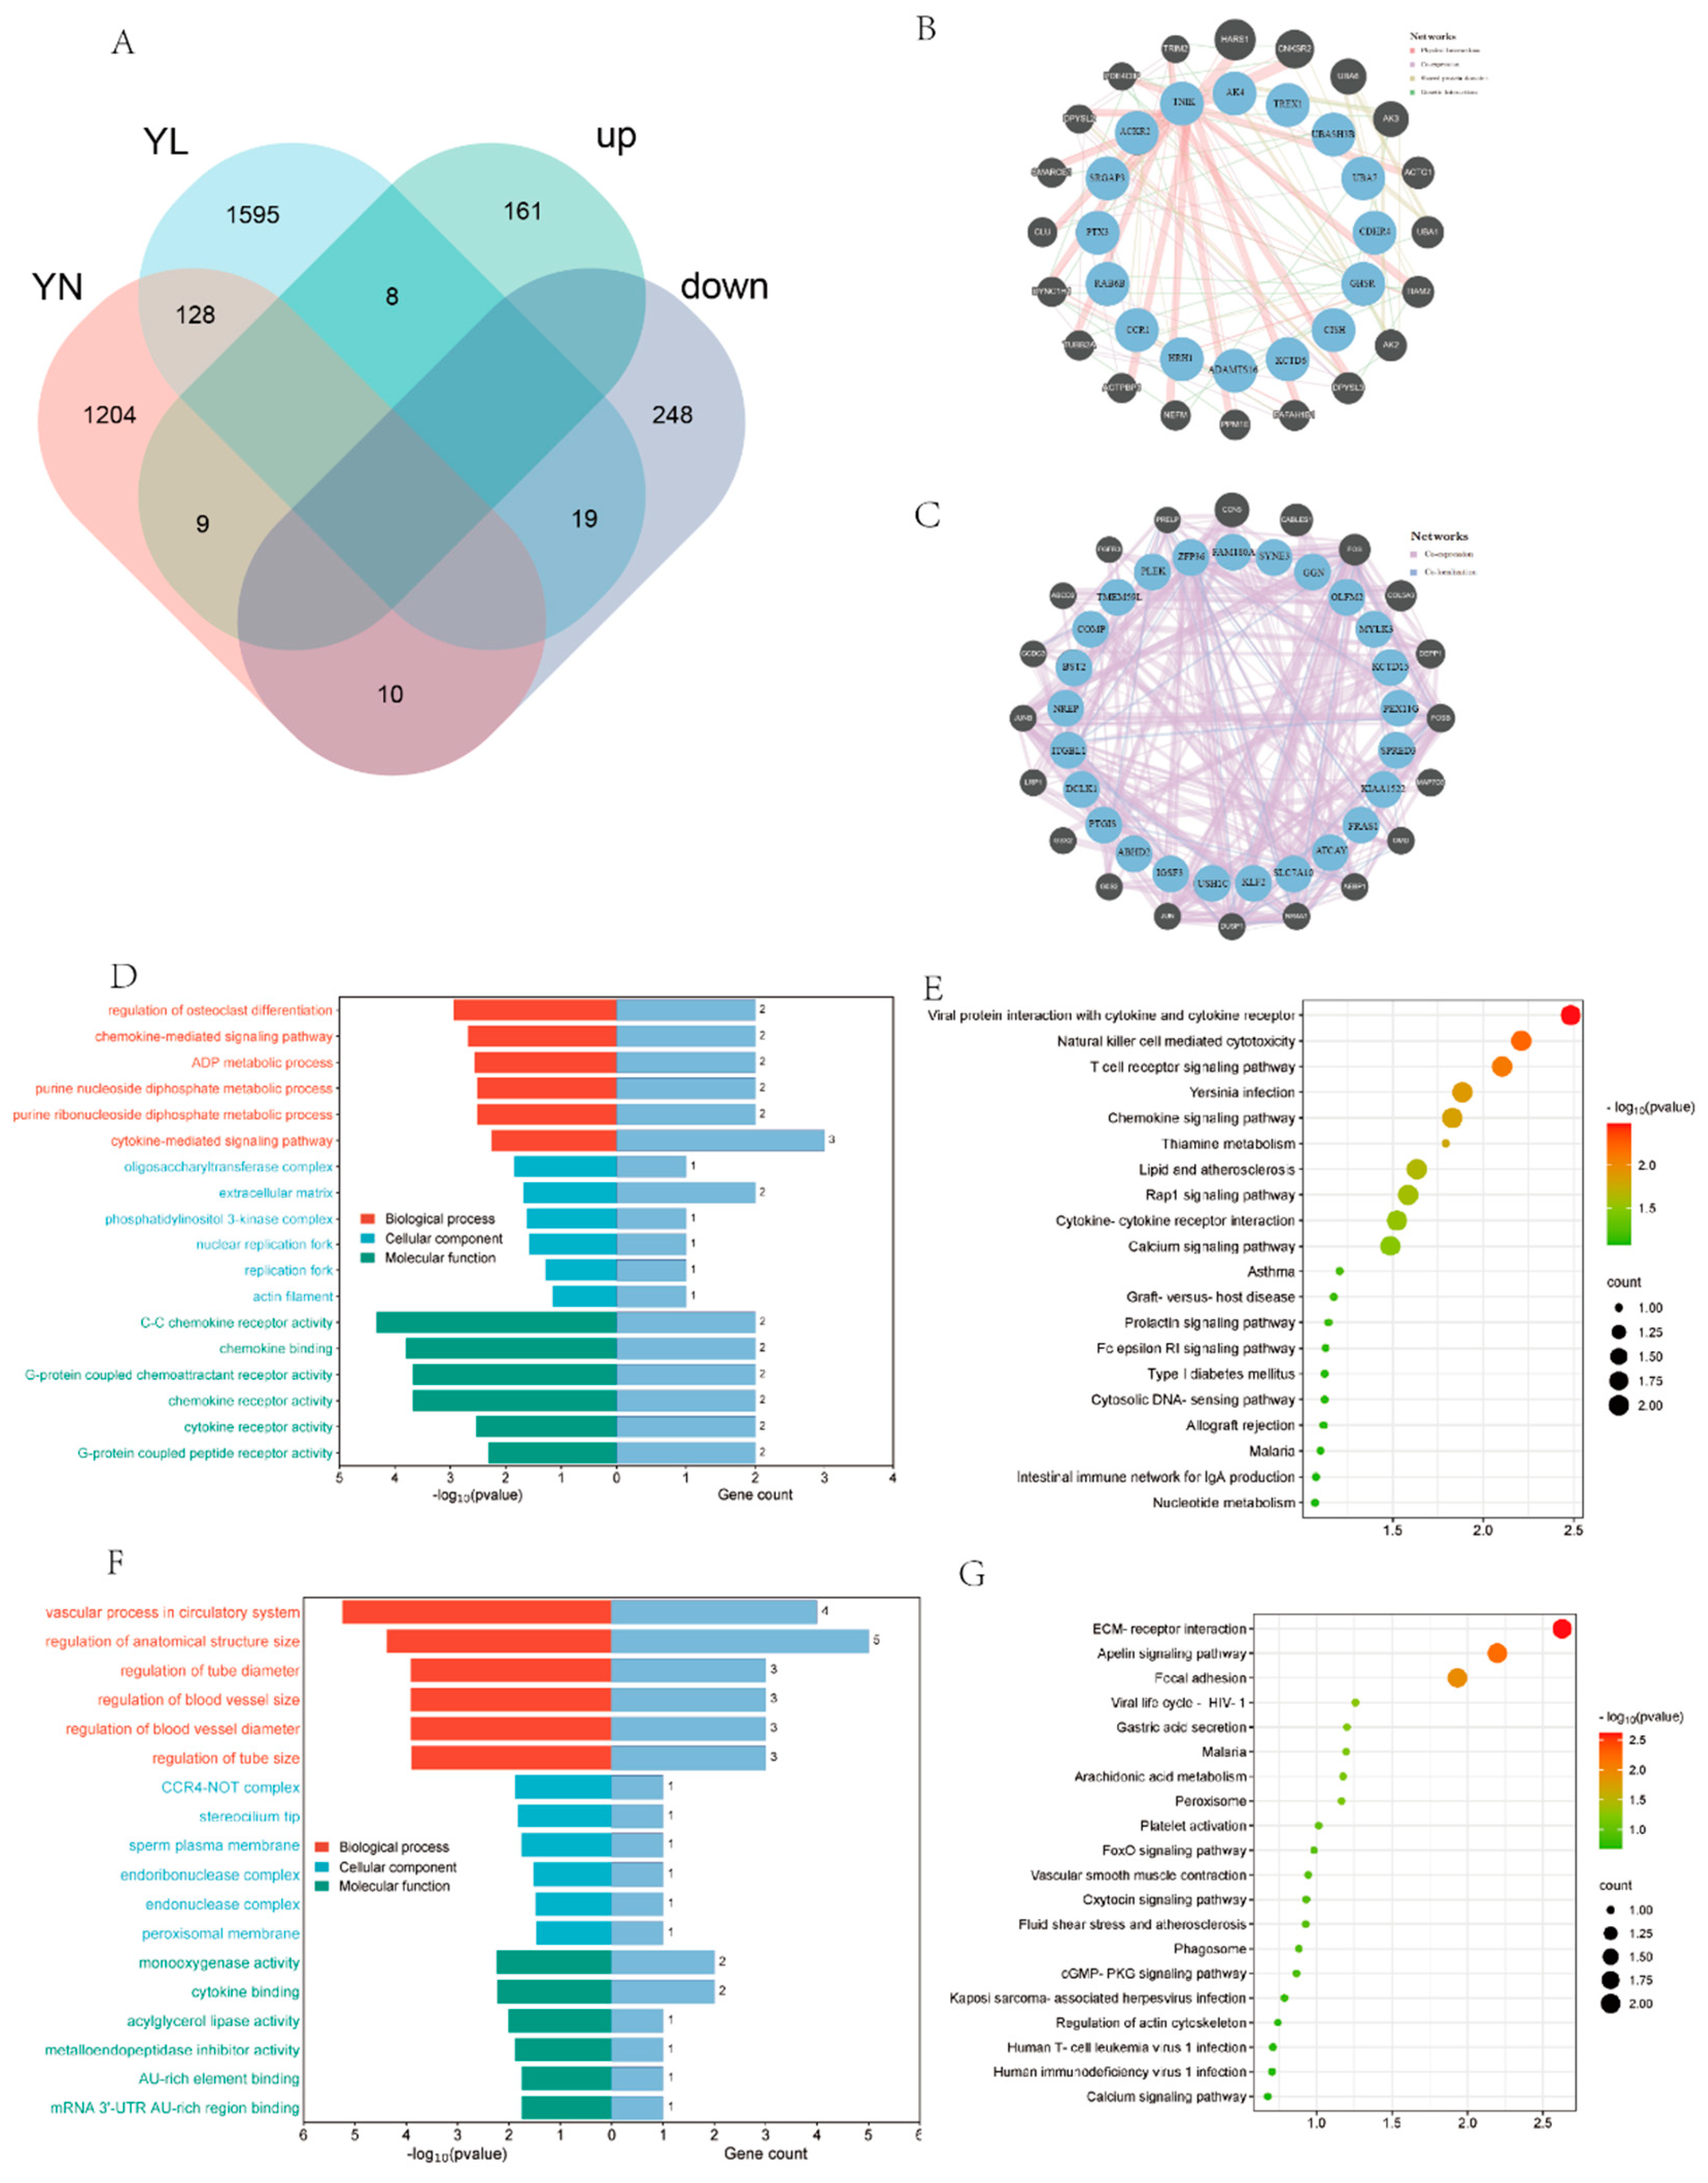
Figure 6.
Construction of the eccDNAs-miRNAs-genes regulatory network. (A) Analysis of the eccDNAs-miRNAs-genes network in the YL group; (B) Analysis of the eccDNAs-miRNAs-genes network in the YN group. Diamond nodes indicate eccDNAs, circular nodes indicate genes, square nodes indicate mRNAs.
Figure 6.
Construction of the eccDNAs-miRNAs-genes regulatory network. (A) Analysis of the eccDNAs-miRNAs-genes network in the YL group; (B) Analysis of the eccDNAs-miRNAs-genes network in the YN group. Diamond nodes indicate eccDNAs, circular nodes indicate genes, square nodes indicate mRNAs.
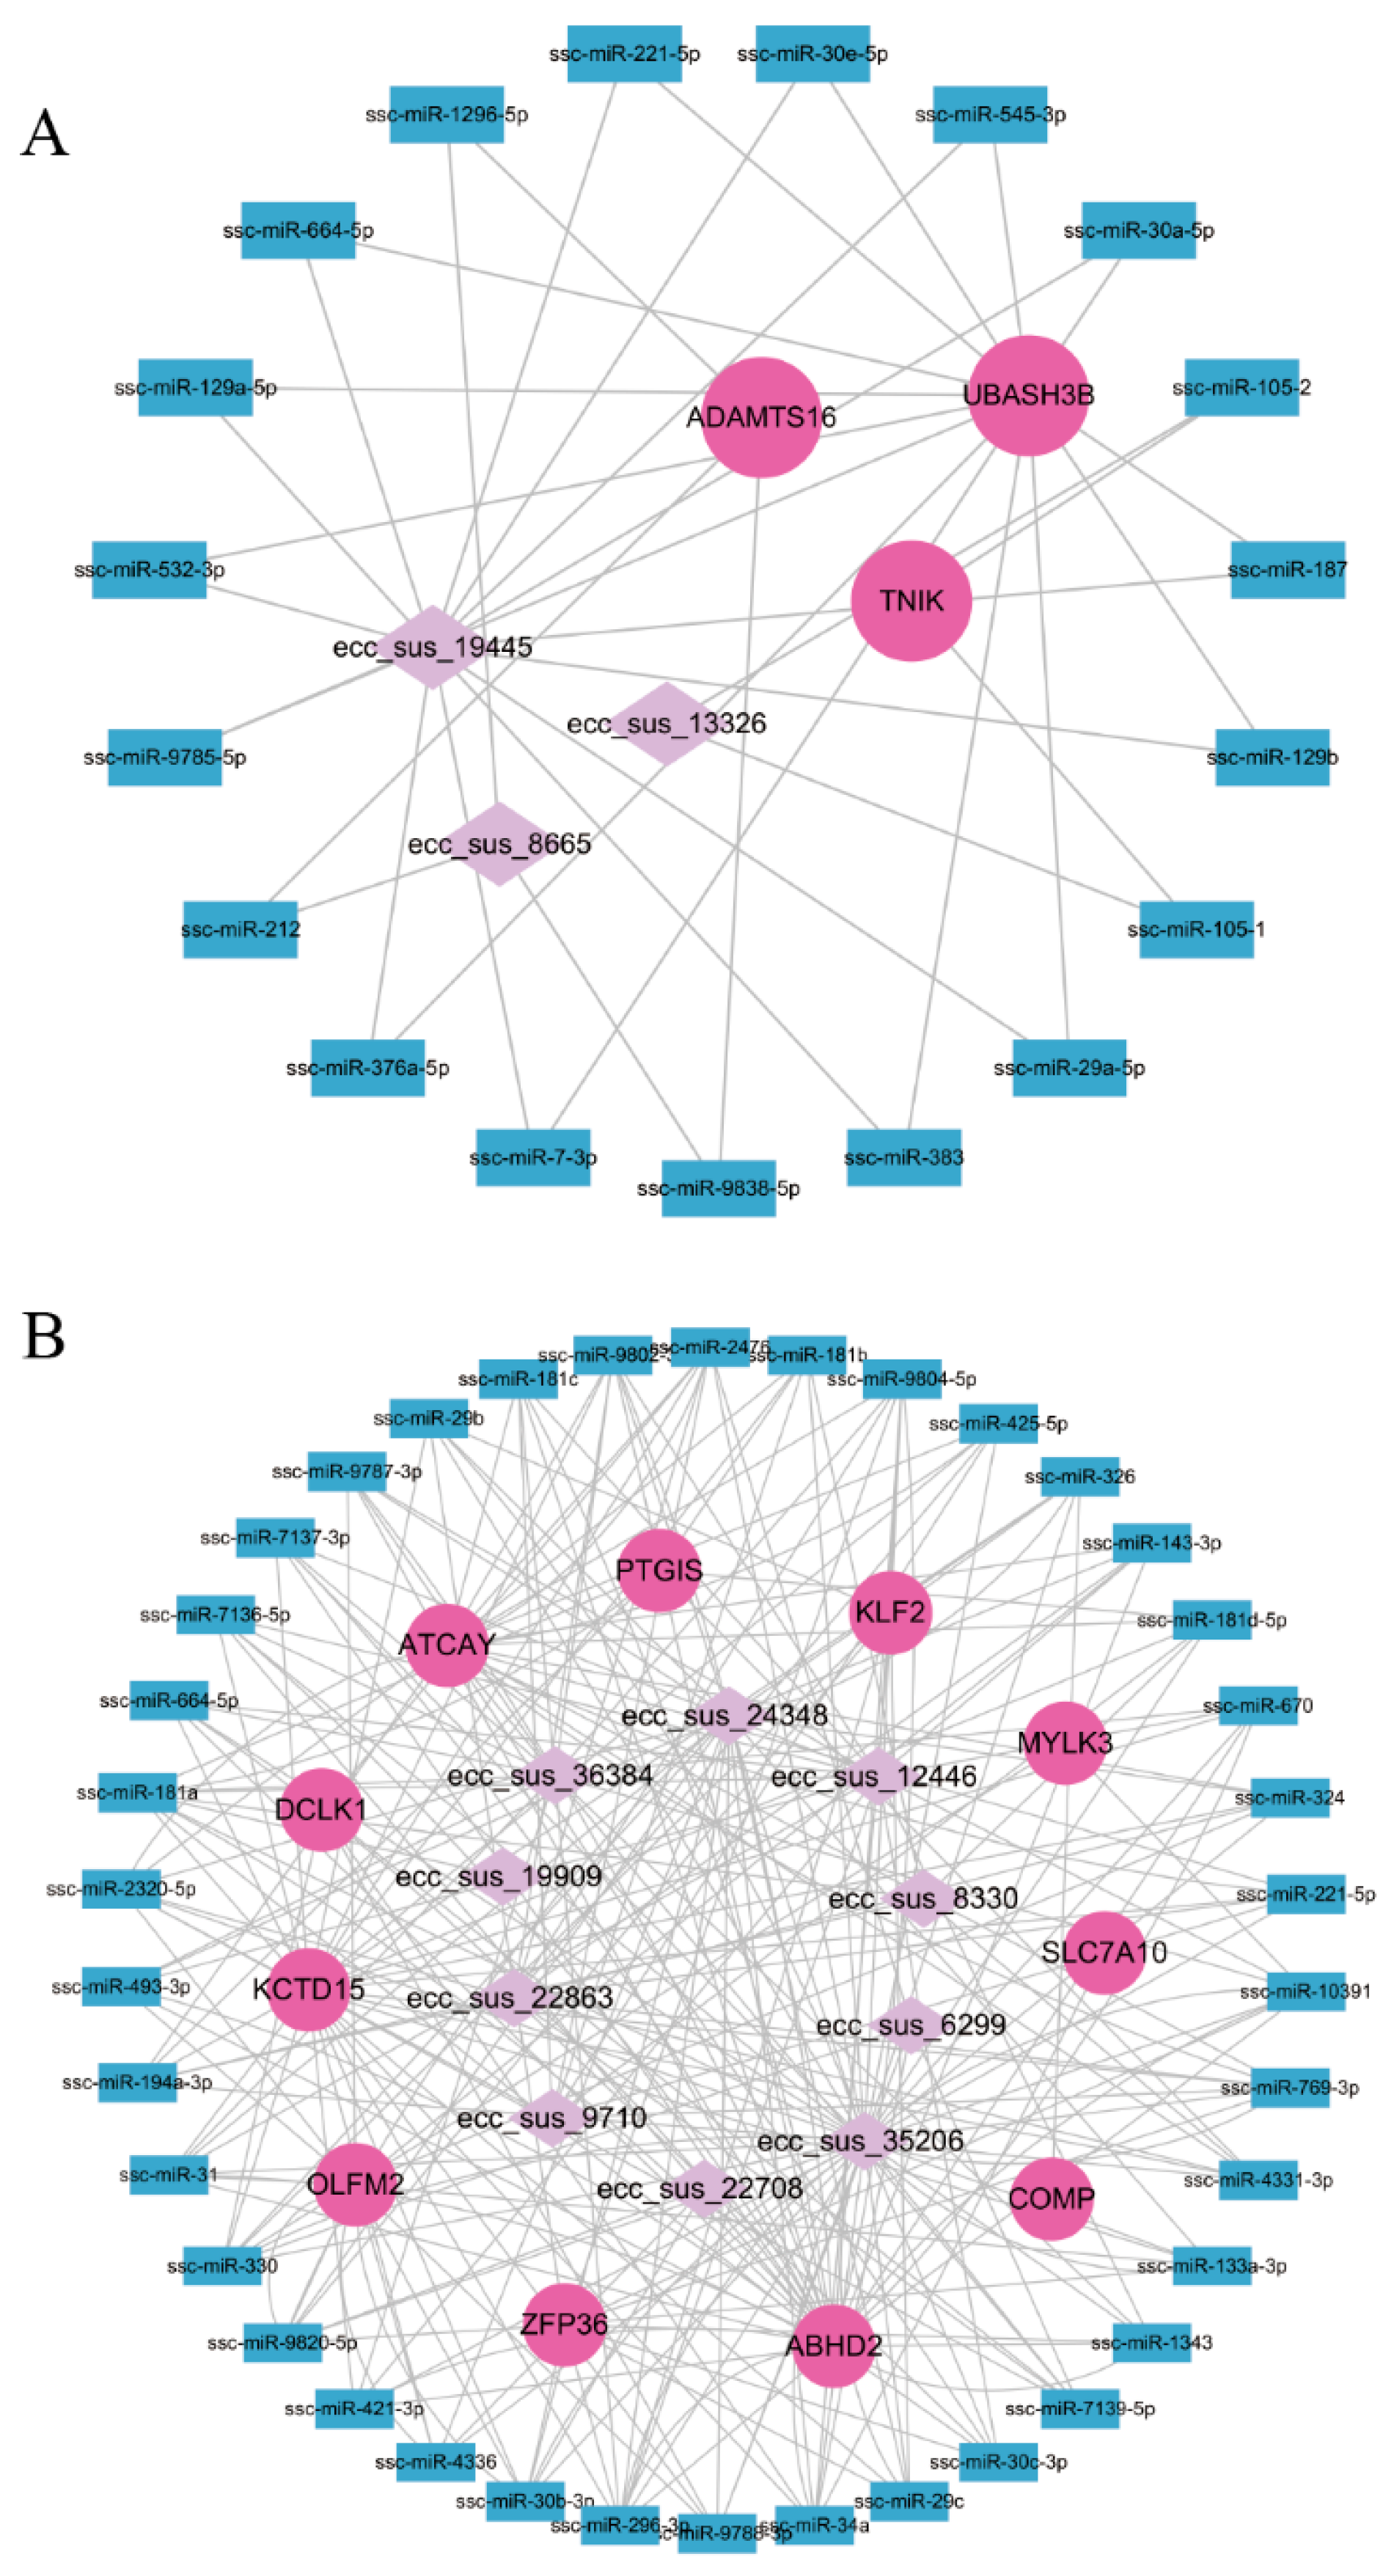
Figure 7.
Differential eccDNA-Gene Relationship Diagram. (A) Relationship between differential eccDNAs and genes in the YN group. (B) Relationship between differential eccDNAs and genes in the YL group. Pink represents eccDNAs, blue represents genes annotated to this eccDNAs, and light-colored lines between genes indicate their interaction.
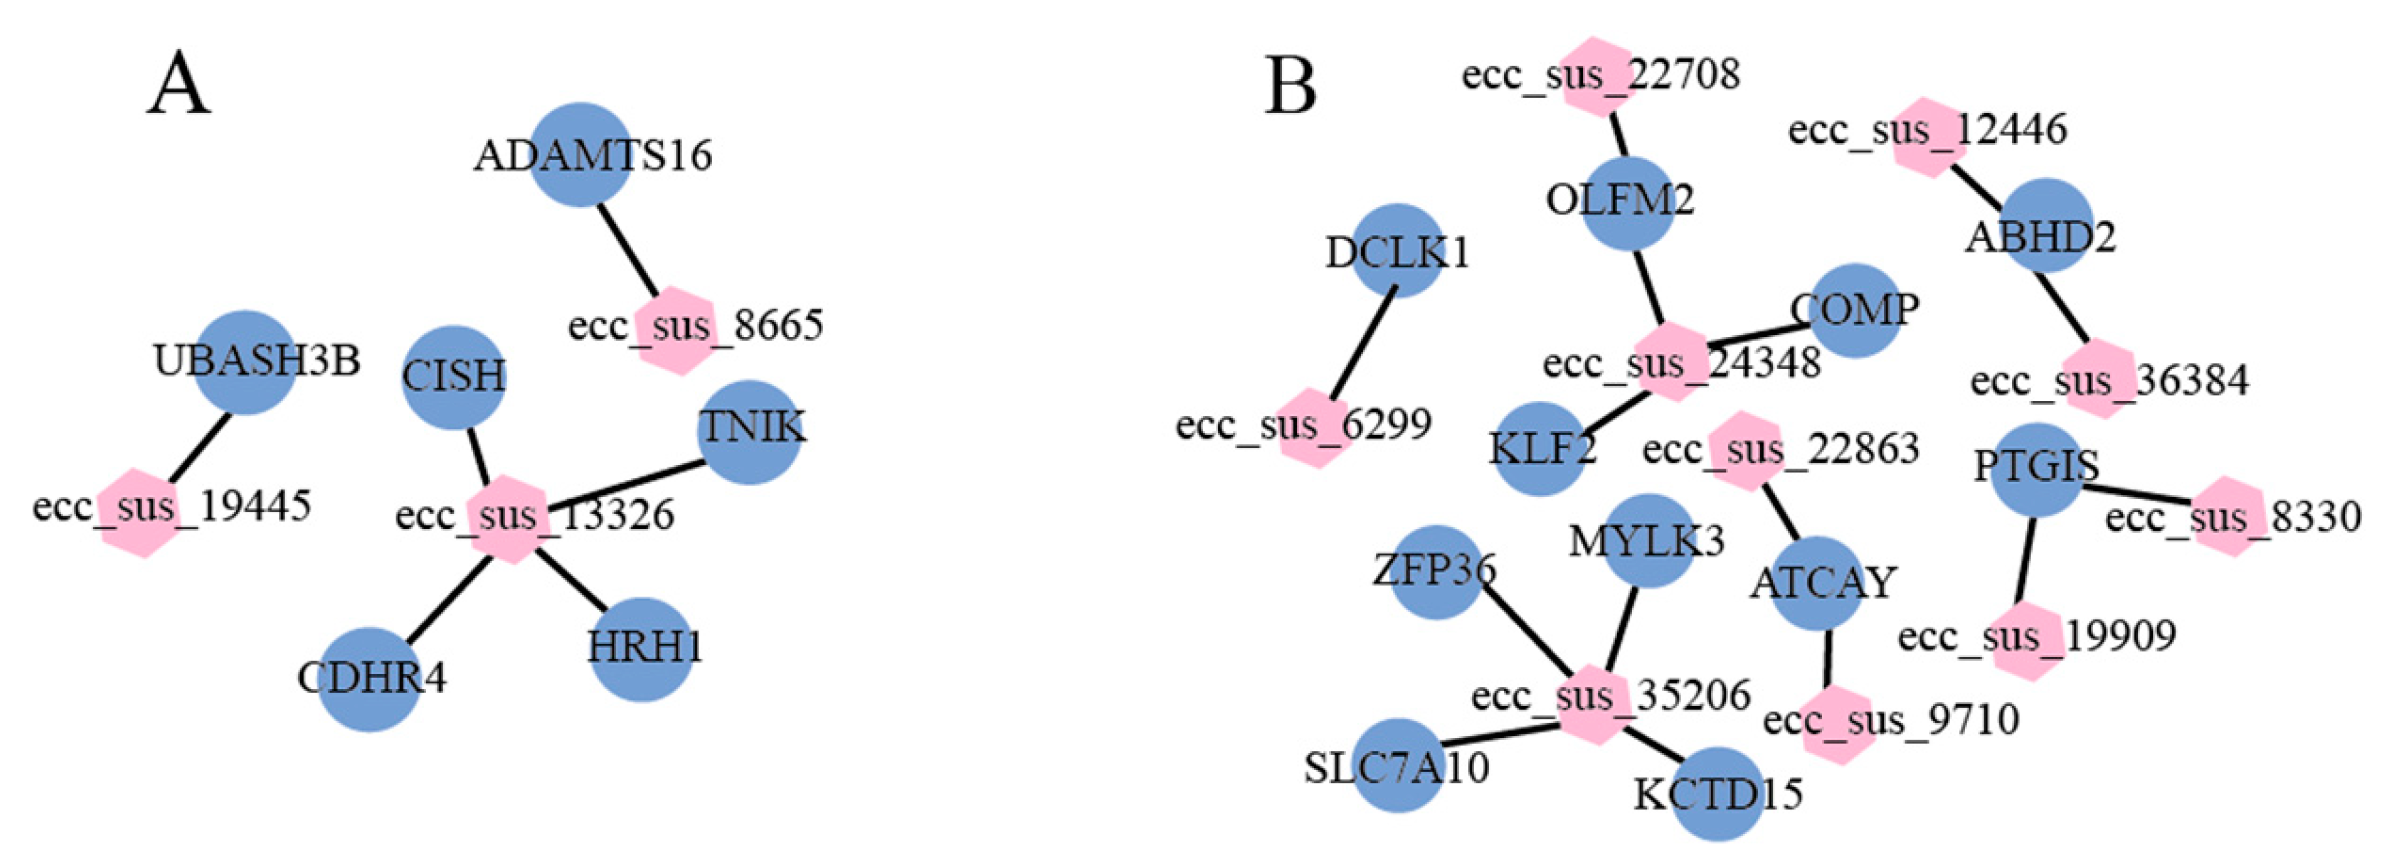

Table 1.
The primers used in eccDNAs verification.
| eccDNAs | Forward Primers | Reverse Primers |
|---|---|---|
| Ecc_sus_13326 | CAATCGCACCAGTGAGGCC | GGTGGTGTTGAGGATGAATGTG |
| Ecc_sus_9710 | ATTCCCATTGTGGCTCTTG | CACAAATCCAAAGGGAACAA |
| Ecc_sus_22708 | GAGATGTGCCAGGTGGACTGT | GTAATCAACCCTGACCATCTCCT |
Table 2.
The primers used in gene expression.
| Gene Name | Forward Primers | Reverse Primers | |
|---|---|---|---|
| UBA7 | CTTCTGCTGAGTTTGGCCCT | ATAGTTCTGAGCTCGCAGGC | |
| GPCPD1 | TCTGGTGGGAGCTTTGCTTT | TGGTGGGGATTTGTCTTCCAA | |
| AKR1C4 | GACATCGAGGTGCAGGGAAT | CAAAGGCTGCACCGTGACTA | |
| GRM4 | GTCGGCAGACAGATGGTCTT | TGCTCTTAGGGACCAAATCCC | |
| FRAS1 | GTCAAGAAGTGCACCAACCG | CGGCATCGATCACAAACTGC | |
| PER2 | ACTTCGTCTTCCTGTCCAGATG | CTTTCAGCTCCCTCAGCGTT | |
Table 3.
Characteristics of back length muscle mass of YN and YL.
| Item | YN | YL |
|---|---|---|
| Meat color 45min | 4.00±0.00a | 2.40±0.17b |
| Ph 45min | 5.45±0.12b | 6.17±0.15c |
| Marble grain 45min | 3.50±0.50 | 2.50±0.50 |
| Drip loss % | 1.04±0.12 | 1.10±0.27 |
| Moisture % | 73.66±1.66 | 75.14±0.66 |
| Intramuscular fat content (dry sample) % | 13.80±0.63a | 9.39±0.44c |
| Protein content (dry sample) % | 77.90±0.87 | 81.57±2.77 |
Note: The superscript letters on the data shoulder indicate significant differences (P < 0.05), with alternating letters indicating highly significant differences (P < 0.01). Rows lacking letters or having identical letters indicate non-significant differences (P > 0.05).
Table 4.
Partial motifs surrounding the eccDNAs from the YN and YL groups.
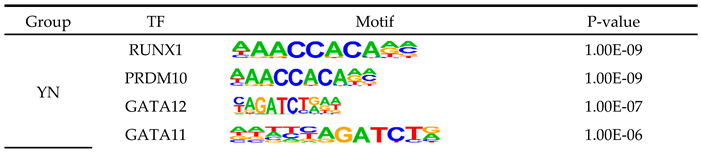
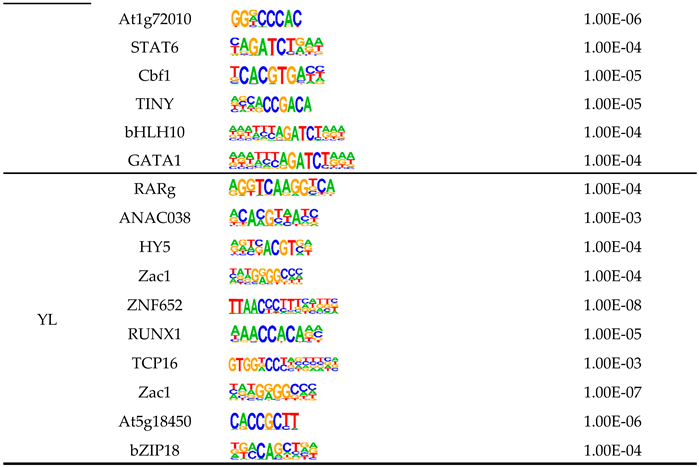
Note: TF-transcription factor. Motif: the sequence of the Motif. P-value: the P-value value of the Motif, the smaller the P-value, the higher the credibility of the predicted transcription factors.
Table 5.
eccDEGs in YN.
| eccDNAs ID | eccDNAs Segment | Gene | FPKM | Gene Locus | Overlap Size |
|---|---|---|---|---|---|
| ecc_sus_13326 | ssc13:6028213-113199299 | TREX1 | up-regulated | ssc13:31179291-31180747 | 1211 |
| ecc_sus_13326 | ssc13:6028213-113199299 | CDHR4 | ssc13:32322034-32329337 | 2646 | |
| ecc_sus_13326 | ssc13:6028213-113199299 | UBA7 | ssc13:32332367-32341217 | 3162 | |
| ecc_sus_9559 | ssc18:7500811-7501075 | ENSSSCG00000016475 | ssc18:7421004-7580571 | 264 | |
| ecc_sus_13326 | ssc13:6028213-113199299 | GHSR | ssc13:110983298-111038324 | 7847 | |
| ecc_sus_13326 | ssc13:6028213-113199299 | KCTD6 | ssc13:40167717-40219838 | 2259 | |
| ecc_sus_13326 | ssc13:6028213-113199299 | ENSSSCG00000034614 | ssc13:35207145-35257795 | 5308 | |
| ecc_sus_13326 | ssc13:6028213-113199299 | CISH | ssc13:33085286-33090858 | 2077 | |
| ecc_sus_31597 | ssc4:112113803-112114225 | ENSSSCG00000062186 | ssc4:112075073-112201596 | 422 | |
| ecc_sus_13326 | ssc13:6028213-113199299 | CCR1 | down-regulated | ssc13:29227222-29233960 | 3021 |
| ecc_sus_13326 | ssc13:6028213-113199299 | HRH1 | ssc13:67209127-67411170 | 4052 | |
| ecc_sus_13326 | ssc13:6028213-113199299 | PTX3 | ssc13:97273594-97279569 | 1887 | |
| ecc_sus_19445 | ssc9:49740087-49740527 | UBASH3B | ssc9:49630793-49770897 | 440 | |
| ecc_sus_8665 | ssc16:76445891-76446106 | ADAMTS16 | ssc16:76326721-76491003 | 215 | |
| ecc_sus_13326 | ssc13:6028213-113199299 | TNIK | ssc13:109643895-110052236 | 8855 | |
| ecc_sus_13326 | ssc13:6028213-113199299 | ACKR2 | ssc13:26288584-26329581 | 7187 | |
| ecc_sus_13326 | ssc13:6028213-113199299 | SRGAP3 | ssc13:65367608-65721405 | 8787 | |
| ecc_sus_13326 | ssc13:6028213-113199299 | RAB6B | ssc13:75012268-75075239 | 5528 | |
| ecc_sus_38422 | ssc6:140981157-151173884 | AK4 | ssc6:147177031-147257814 | 6813 |
Table 6.
eccDEGs in YL.
| eccDNAs ID | eccDNAs Segment | Gene | FPKM | Gene Locus | Overlap Size |
|---|---|---|---|---|---|
| ecc_sus_24348 | ssc2:34161240-73232708 | USH1C | up-regulated | ssc2:41593802-41647247 | 3579 |
| ecc_sus_24348 | ssc2:34161240-73232708 | PEX11G | ssc2:71639301-71652903 | 4441 | |
| ecc_sus_35206 | ssc6:10037381-48166072 | ZFP36 | ssc6:48063677-48066250 | 1761 | |
| ecc_sus_24348 | ssc2:34161240-73232708 | ENSSSCG00000031706 | ssc2:47042505-47240103 | 9894 | |
| ecc_sus_24348 | ssc2:34161240-73232708 | BST2 | ssc2:60305283-60309697 | 1458 | |
| ecc_sus_35206 | ssc6:10037381-48166072 | MYLK3 | ssc6:37850754-37920754 | 4932 | |
| ecc_sus_24348 | ssc2:34161240-73232708 | KLF2 | ssc2:61270199-61273138 | 2256 | |
| ecc_sus_35206 | ssc6:10037381-48166072 | ENSSSCG00000047099 | ssc6:12221270-12223375 | 2106 | |
| ecc_sus_12446/ ecc_sus_36384 | ssc7:54689073-54689459/ ssc7:54689071-54689419 | ABHD2 | down-regulated | ssc7:54655804-54770131 | 386/348 |
| ecc_sus_35206 | ssc6:10037381-48166072 | SLC7A10 | ssc6:43002431-43017554 | 1869 | |
| ecc_sus_35206 | ssc6:10037381-48166072 | GGN | ssc6:47297575-47301553 | 3216 | |
| ecc_sus_19909/ ecc_sus_8330 | ssc17:51172371-51172836/ ssc17:51172368-51172836 | PTGIS | ssc17:51153154-51200300 | 465/468 | |
| ecc_sus_25923 | ssc3:73896006-73896978 | PLEK | ssc3:73877743-73906667 | 972 | |
| ecc_sus_38878 | ssc8:73887871-73889045 | FRAS1 | ssc8:73502717-73957375 | 1174 | |
| ecc_sus_24348 | ssc2:34161240-73232708 | TMEM59L | ssc2:59210792-59223202 | 2484 | |
| ecc_sus_24348 | ssc2:34161240-73232708 | COMP | ssc2:59061426-59069564 | 3022 | |
| ecc_sus_22863/ ecc_sus_9710 | ssc2:74816329-74817223/ ssc2:74816071-74816394 | ATCAY | ssc2:74800048-74838671 | 894/323 | |
| ecc_sus_24348/ ecc_sus_22708 | ssc2:34161240-73232708/ ssc2:68745326-68746000 | OLFM2 | ssc2:68734081-68807191 | 2297/674 | |
| ecc_sus_35206 | ssc6:10037381-48166072 | KCTD15 | ssc6:43529806-43544186 | 2878 | |
| ecc_sus_6299 | ssc11:12110009-12110582 | DCLK1 | ssc11:11815357-12158826 | 573 | |
| ecc_sus_35206 | ssc6:10037381-48166072 | SPRED3 | ssc6:47298634-47310181 | 2736 | |
| ecc_sus_20701 | ssc18:13583492-13583857 | FAM180A | ssc18:13575527-13592344 | 365 | |
| ecc_sus_23489 | ssc2:117841533-117843133 | NREP | ssc2:117838660-117867801 | 1600 | |
| ecc_sus_9862 | ssc4:104147899-104150211 | IGSF3 | ssc4:103994390-104166988 | 2312 | |
| ecc_sus_12823 | ssc7:116708508-116708756 | SYNE3 | ssc7:116665435-116770302 | 248 | |
| ecc_sus_11533 | ssc6:89086144-89086537 | KIAA1522 | ssc6:89058808-89087839 | 393 | |
| ecc_sus_2392 | ssc11:70217219-70217727 | ITGBL1 | ssc11:70042232-70246968 | 508 |
Note: up-regulated means that the expression level of this gene in the YN group is higher than that in the YL group, and down-regulated means that the expression level of this gene in the YL group is higher than that in the YN group.
Disclaimer/Publisher’s Note: The statements, opinions and data contained in all publications are solely those of the individual author(s) and contributor(s) and not of MDPI and/or the editor(s). MDPI and/or the editor(s) disclaim responsibility for any injury to people or property resulting from any ideas, methods, instructions or products referred to in the content. |
© 2024 by the authors. Licensee MDPI, Basel, Switzerland. This article is an open access article distributed under the terms and conditions of the Creative Commons Attribution (CC BY) license (http://creativecommons.org/licenses/by/4.0/).
Copyright: This open access article is published under a Creative Commons CC BY 4.0 license, which permit the free download, distribution, and reuse, provided that the author and preprint are cited in any reuse.


