
Submitted:
13 May 2023
Posted:
15 May 2023
You are already at the latest version
Abstract
Ningxiang pig is renowned breed for its exceptional meat quality, but it possesses suboptimal carcass traits. To elucidate the genetic architecture of meat quality and carcass traits in Ningxiang pigs, we assessed heritability and executed a genome-wide association study (GWAS) concerning carcass length, backfat thickness, meat color parameters (L.LD, a.LD, b.LD), and pH at two postmortem intervals (45 minutes and 24 hours) within a Ningxiang pig population. Heritability estimates ranged from moderate to high (0.30 ~ 0.80) for carcass traits and from low to high (0.11 ~ 0.48) for meat quality traits. We identified 21 significant SNPs, the majority of which were situated within previously documented QTL regions. Furthermore, the HMGA1 gene emerged as a pleiotropic gene correlated with carcass length and backfat thickness. The ADGRF1, FKBP5, and PRIM2 genes were associated with carcass length, while the NIPBL gene was linked to backfat thickness. These genes hold potential for use in selective breeding programs targeting carcass traits in Ningxiang pigs.
Keywords:
genome-wide association study
; carcass length
; meat color
; genetic parameter
1. Introduction
In the livestock industry, carcass and meat quality traits are highly significant economic traits. Carcass traits encompass backfat thickness (BFT), carcass length (CL), and other traits. Generally, larger and taller body size correlate with increased meat production. In comparison to imported commercial breeds, most Chinese indigenous breeds exhibit smaller body sizes and lower meat production [1]. However, Chinese indigenous pig breeds possess superior meat quality, outperforming the imported or crossbred [2]. Particularly, meat color and intramuscular fat deposition, which directly influence consumer perception, both exhibit moderate to high heritability [3,4]. Studies have reported that “acid meat”, PSE (pale, soft, and exudative), and DFD (dark, firm, and dry) meat are seldom observed in indigenous pigs [5,6,7]. Meat color, tenderness, and water loss rate undergo the most significant changes, with breed and pre- and post-slaughter management being the primary factors contributing to PSE and DFD in pork [8]. Research indicates that pH, drip loss, and meat color of indigenous pigs surpass those of commercial pigs. Genetically, a few major genes have been identified as being associated with inferior meat quality, such as the HALn gene (Halothane, or RYRI gene) and the RN (Renderment napole) gene, which profoundly impact on PSE meat and acid meat [9,10].
The genetic architecture characterizes the phenotype alterations resulting from genetic variation, with specific research areas encompassing the number of variations impacting traits, population occurrence frequency, genetic effect’s scope, and relationships with other genes (additive and interactive effects) or environments [11,12]. Investigating the genetic architecture of complex quantitative traits aids in the identification of novel single nucleotide polymorphisms (SNPs) or genes associated with these traits. Genome-wide association study serve as a prevalent method for understanding the genetic architecture of quantitative traits and discovering new genes. Prior research has uncovered numerous candidate genes for economic traits, including carcass traits [13,14], meat quality traits [4,15], and reproduction traits [16,17]. While Ningxiang pig is the renowned for its meat quality and disease resistance, it exhibits a low growth rate and lean meat percentage. Deciphering the genetic architecture of these economic traits could facilitate the genetic enhancement of Ningxiang pigs' shortcomings while preserving their advantages through marker-assisted selection, ultimately benefiting the Ningxiang pig industry. In this study, we performed a GWAS on carcass and meat quality traits within a Ningxiang pig population, identifying several candidate genes related to these traits, which hold potential for implementation in Ningxiang pig breeding programs.
2. Materials and Methods
2.1. Phenotypes and Genotyping
Phenotypic data were collected for Ningxiang pigs (n = 508) that were slaughtered at a predetermined age from the Ningxiang Chu Weixiang Slaughterhouse and Meat Processing, LLC (Hunan Province, China). Carcass traits included left half carcass weight (LW), carcass oblique length (COL), carcass length (CL), and backfat thickness (BFT), were measured in accordance with the national technical regulation for testing of carcass traits in lean-type pig (NY/T 825-2004). Meat quality traits, such as longissimus dorsi meat color (L.LD, a.LD, b.LD) after slaughtering 45 minutes and pH of longissimus dorsi at two postmortem time points (45 minutes and 24 hours), were assessed following the national technical regulation for determination of pork quality (NY/T 821-2019). (Detailed measurement methods for carcass and meat quality traits are presented in Table S1). In summary, we obtained data on CL, COL, meat color (L.LD, a.LD, b.LD) and pH (45min and 24h) for 508 pigs (21 females and 487 males), and BFT data for 485 pigs (Table 1). DNA was extracted from muscle tissue of all pigs. These samples were genotyped using the GeneSeek Genomic Profiling (GGP) version 2 Porcine 50K SNP chip, which comprises 50,697 SNP loci.
2.2. Genotype Imputation and Quality Control
To reduce the missing genotype rate, we employed Beagle5.4 software [18] to impute the missing genotypes. Subsequently, quality control was conducted using PLINK v1.9 [19] with the following criterion: (1) SNP call rate ≥ 90%; (2) minor allele frequency (MAF) ≥ 1%; (3) Hardy-Weinberg Equilibrium (HWE) testing P-value ≤ 10-6; (4) on autosomes with known positions. After quality control, 537 and 14,812 SNPs were removed due to HWE and MAF thresholds, respectively. Additionally, 4,197 SNPs located on the sex chromosome or with unknown chromosome positions were excluded. Ultimately, 31,106 SNPs distributed across 18 autosomes remained for association analysis (Figure S1). More details about the SNP distribution are presented in Table S2.
2.3. Statistical Method
2.3.1. Estimation of Genetic Parameters
The heritabilities and genetic correlations for the studied traits was estimated using the multiple traits model of the HIBLUP software [20]. The model follows [20]:
where y is the vector of phenotypic data, X and R are the design matrix for fixed effects (including covariates) and environmental random effects, respectively; b and r are the vector of corresponding and estimated effects. Zi is the design matrix for the i-th genetic random effect and ui is the vector of its responding genetic effects. Ki is the additive genetic relationship matrix, I is an identity matrix, and e is the vector of residulas errors. The heritability (h2), genetic correlation (rA), and phenotypic correlation (rP) are calculated by , , and . Where and are the additive genetic variance and residual variance, respectively. Cov(a1, a2) is the additive effect covariance between a1 and a2 traits, and Cov(p1, p2) is the phenotypic covariance between p1 and p2 traits.
2.3.2. Principal Component Analysis
To avoid hidden population stratification causing false-positive in GWAS, we used imputed genotypes to perform principal component analysis (PCA) with PLINK v1.9 (command: --pca). The results depicted in Figure S2 suggest that this population may have population stratification, and PCs need to be added for correction.
2.3.3. Genome-Wide Association Study
GWAS was conducted using the rMVP package [21]. Sex was treated as fixed effects, and CW and five PCs were treated as covariates. We assessed the association between phenotypes and each SNP across the genome under the following linear mixed model (MLM) [22,23]:
where y is a vector of phenotypic observations, b is a vector of fixed effects (included sex, CW, and 5 PCs), a is a vector of SNP effects; u is a verctor of random polygenic effects with a covariance structure; e is a vector of residual errors. X, Z are the design matrix of fixed and SNP effects, respectively. and are additive genetic and residual variances, respectively. I is an identity matrix, and G is the genomic relationship matrix calculated by following [24]:
where Zis the matrix related to genotypes of each SNP (encoded 0, 1, 2 for AA, AB, and BB, respectively); D is a diagonal matrix of weights for SNP variance; k is the number of SNPs; pj is the minor allele frequency at j-th loci. The genome-wide and suggestive significant thresholds were 0.05/NSNP and 1/NSNP, respectively. The proportion of variance explained (PVE) by a SNP was defined as follows [25]:
where is the effect size for SNP marker, MAF is the minor allele frequency for SNP marker, is standard error of effect size for SNP marker, and N is the sample size.
2.4. Linkage Disequilibrium Analysis
To detect the linkage disequilibrium (LD) between significant SNPs, SNPs centering on each significant SNP was utilized to conduct LD analysis using the LDblockShow software [26].
2.5. Candidate Genes Related to Significant SNPs
To identify candidate genes near the significant SNPs, we examined the annotated genes within a 1Mb radius round each SNP in the Sus scrofa 11.1 genome, using the biomaRt package (https://bioconductor.org/packages/3.15/bioc/html/biomaRt.html). To annotate significant SNP located in previously mapped QTLs in pigs, all QTL data in pigs were downloaded from the animal QTLdatabase. (https://www.animalgenome.org/cgi-bin/QTLdb/SS/download?file=gbpSS_11.1). Kyoto Encyclopedia of Genes and Genomes (KEGG) and Gene Ontology (GO) analyses were employed to identify related pathways. KEGG and GO analyses were performed using KOBAS [27] and AmiGO2 (http://amigo.geneontology.org/amigo/). To obtain more comprehensive gene enrichment results, we used the Homo Sapenis database for GO and KEGG Pathway enrichment. Fisher's exact test was used to assess the significance of the enriched terms, with P-adj < 0.05 as the significant threshold.
3. Results
3.1. Descriptive Statistics of Phenotypes
Descriptive statistics of carcass and meat quality traits of Ningxiang pigs are presented in Table 1. All phenotypic data conformed to the Gaussian distribution before GWAS (Figure S3). Substantial phenotypic variations were observed, with the coefficient of variation (CV) ranging from 4.74% to 41.75% for the eight traits.
3.2. Estimates of Genetic Parameters
The estimates of heritabilities of these traits, and phenotypic and genetic correlations between them were shown in Table 2. In phenotype correlations, CL and COL were significantly negatively correlated with BFT (r = -0.12, P < -0.001; r = -0.16, P < -0.001). Expect for L.LD, carcass traits and meat color traits exhibited an extremely significant negative or positive correlation. L.LD only demonstrated a significant negative correlation with two pH traits and positive correlations with the a.LD and b.LD. In genetic correlations, BFT also exhibited a negative correlation with CL and COL. CL showed negative correlation with pH traits and positive correlation with L.LD. In this study, heritabilities (± SE) of carcass traits were moderate to high and ranged from 0.47 (± 0.07) to 0.80 (± 0.07), and meat quality traits indicated low to high heritability ranged from 0.11 (± 0.07) to 0.44 (± 0.08).
3.3. GWAS Results and Gene Annotation
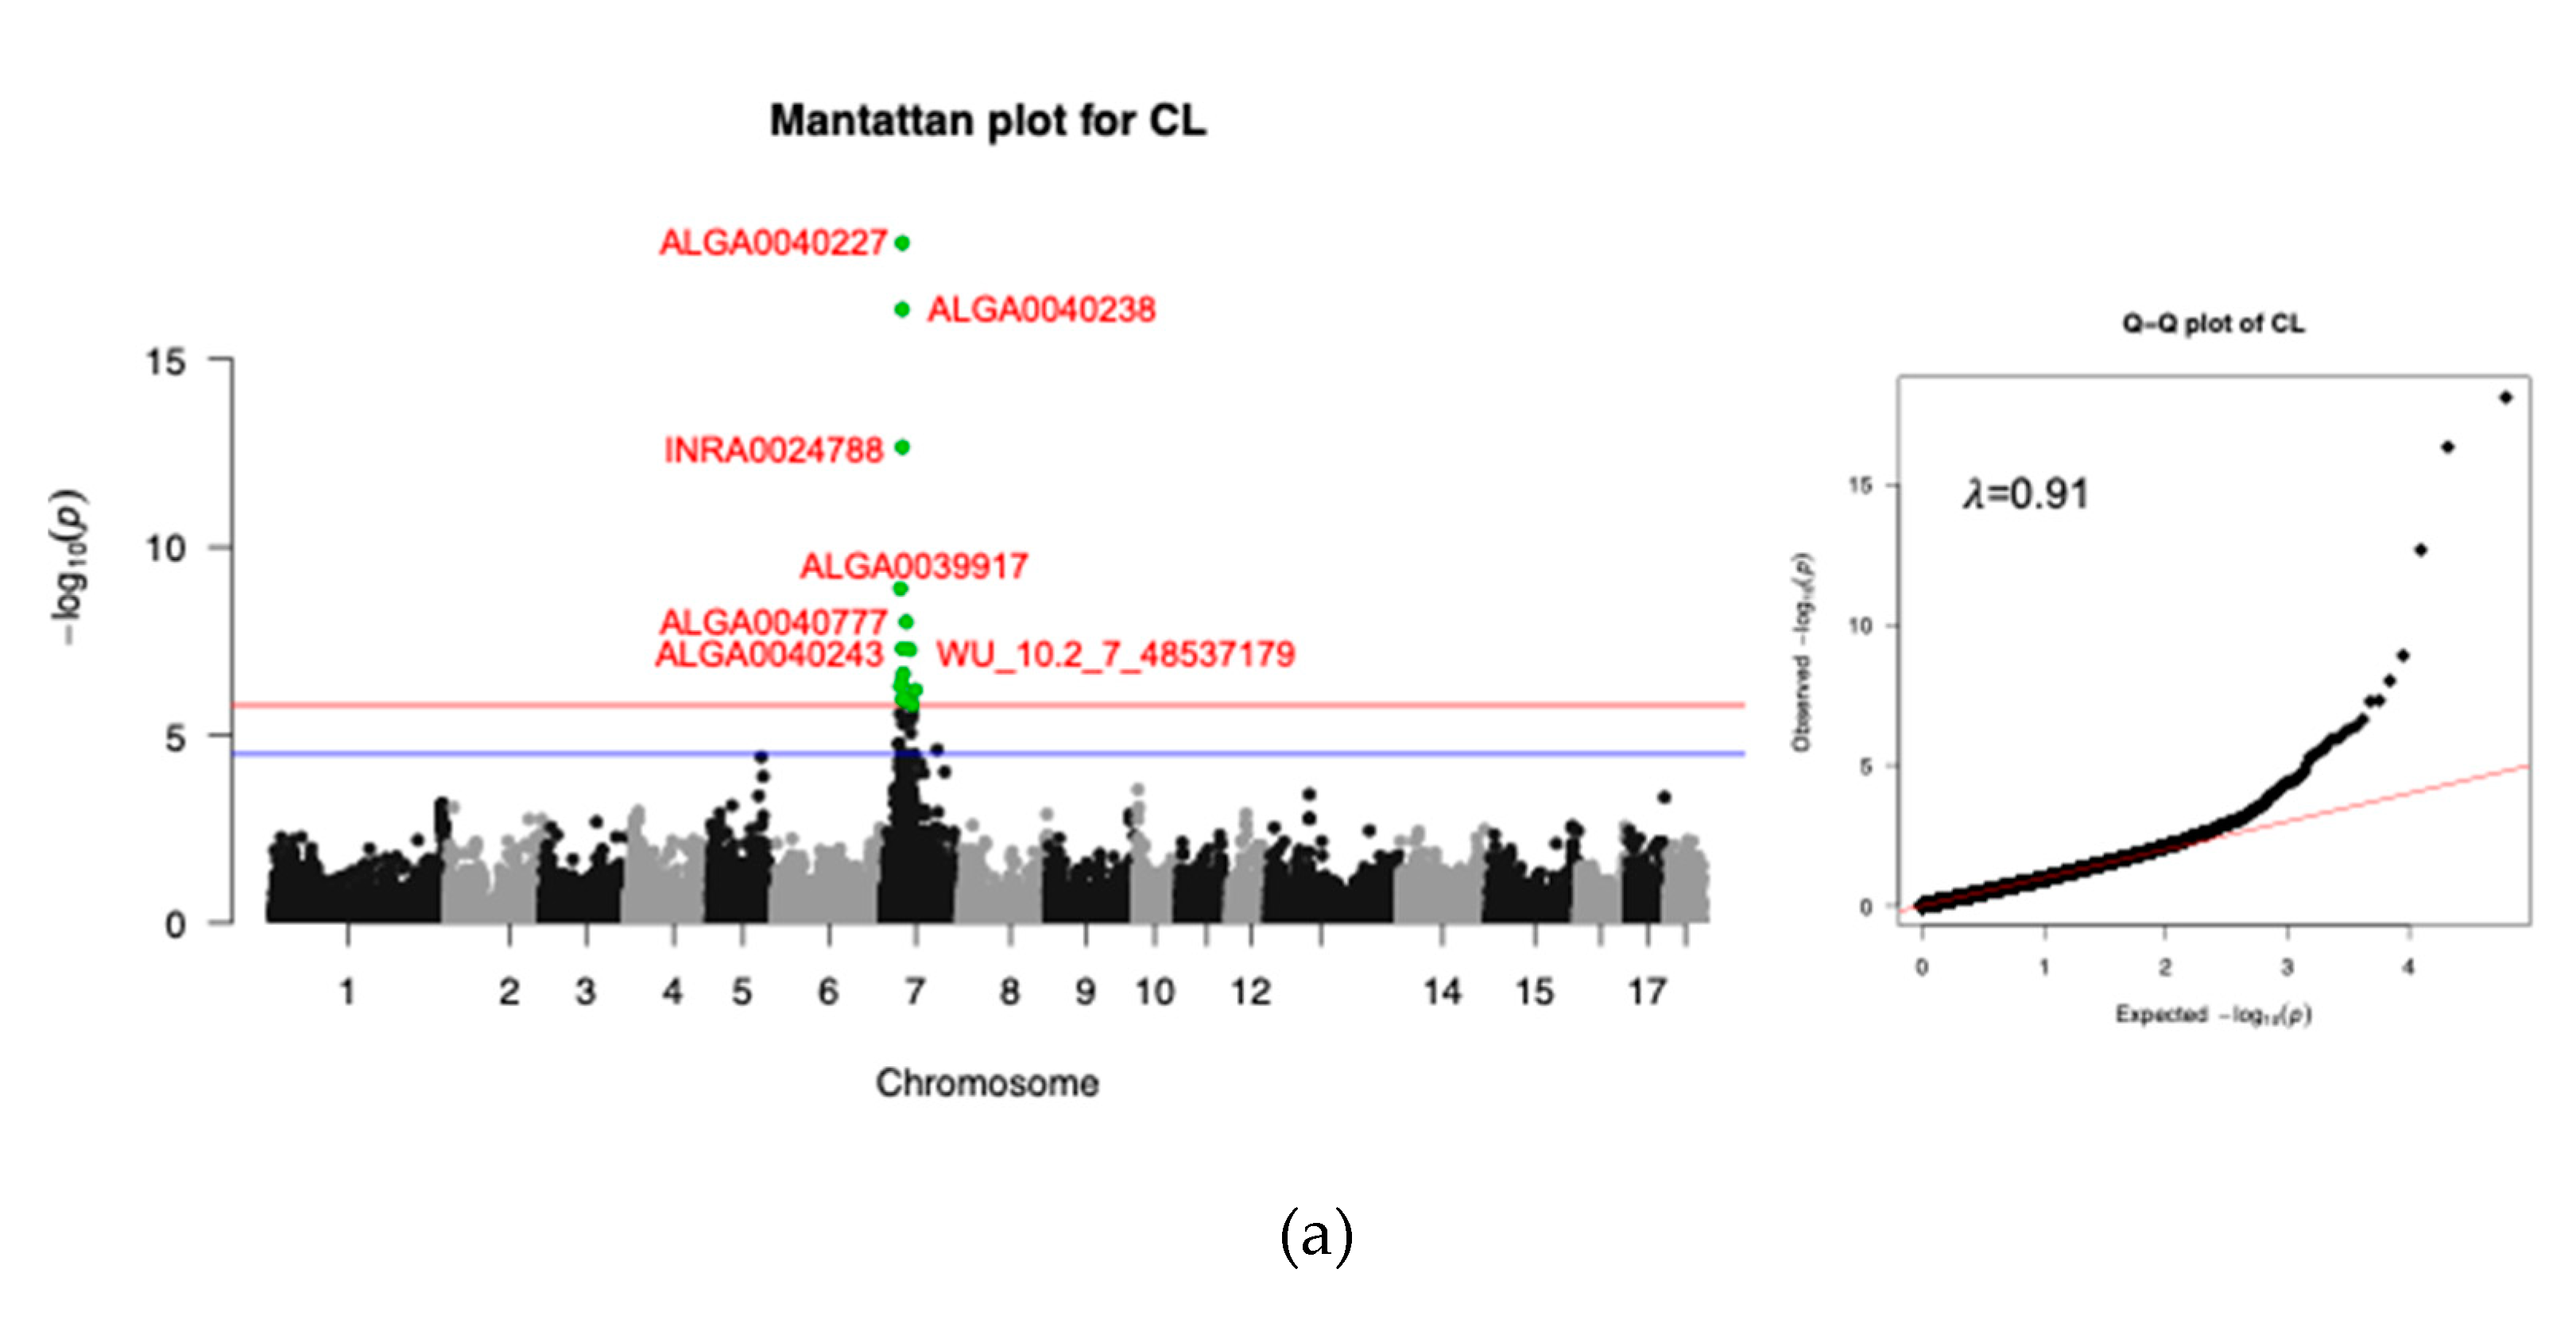
We performed GWAS for each trait to understand the genetic architecture of the carcass and meat quality traits. After quality control, 31,106 SNPs were available for subsequent GWAS. The average physical distance between two neighboring SNPs was approximately 71 kb and ranged from 55 kb (SSC7) to 82 kb (SSC1) (Table S2). Single marker tests using MLM were performed to identify genetic markers associated with these traits at the genome-wide significant level (threshold = 0.05/31,106). The GWAS results were presented in Figure 1, Figure 2, Figure S4, and Table 3-1 and 3-2. By adding five PCs as covariates, the Q-Q plots of P-values and the computed genomic inflation factors (λ) indicated no evidence of population stratification.

Table 3-1.
The genome-level significant SNPs and possible candidate genes for carcass traits.
| Trait | SNP | CHR | POS (bp) | MAF | PVE (%) | P-adj1 | Gene | DIS (bp) |
|---|---|---|---|---|---|---|---|---|
| CL | ALGA0040227 | 7 | 30176520 | 0.39 | 14.35 | 8.05E-19 | HMGA1 | 143890 |
| ALGA0040238 | 7 | 30197014 | 0.36 | 12.98 | 4.72E-11 | HMGA1 | 123396 | |
| INRA0024788 | 7 | 30317219 | 0.36 | 10.08 | 2.16E-13 | HMGA1 | 3191 | |
| ALGA0039917 | 7 | 26737102 | 0.19 | 7.02 | 1.25E-9 | MLIP | Within | |
| ALGA0040777 | 7 | 36323988 | 0.44 | 6.28 | 9.85E-9 | UNC5CL | 8213 | |
| ALGA0040243 | 7 | 30213771 | 0.25 | 5.69 | 4.97E-8 | HMGA1 | 106639 | |
| WU_10.2_7_48537179 | 7 | 41877149 | 0.42 | 5.66 | 5.39E-8 | ADGRF1 | 23492 | |
| ASGA0032589 | 7 | 31450019 | 0.32 | 5.13 | 2.36E-7 | FKBP5 | Within | |
| H3GA0020641 | 7 | 28521421 | 0.11 | 4.92 | 4.17E-7 | PRIM2 | Within | |
| ALGA0039880 | 7 | 26501975 | 0.11 | 4.86 | 5.04E-7 | TINAG | Within | |
| ALGA0041948 | 7 | 50283279 | 0.47 | 4.77 | 6.30E-7 | STARD5 | 164650 | |
| ALGA0040370 | 7 | 32328188 | 0.48 | 4.60 | 1.02E-6 | SRSF3 | 29608 | |
| M1GA0010006 | 7 | 31161760 | 0.31 | 4.55 | 1.16E-6 | ZNF76 | Within | |
| WU_10.2_7_36255497 | 7 | 31181718 | 0.31 | 4.55 | 1.16E-7 | ZNF76 | Within | |
| MARC0060950 | 7 | 46569153 | 0.16 | 4.44 | 1.58E-6 | LOC100526118 | 1797 | |
| COL | ALGA0040227 | 7 | 30176520 | 0.39 | 8.38 | 2.67E-25 | HMGA1 | 143890 |
| ALGA0040238 | 7 | 30197014 | 0.36 | 7.51 | 3.17E-10 | HMGA1 | 123396 | |
| ALGA0039880 | 7 | 26501975 | 0.11 | 5.75 | 4.19E-7 | TINAG | Within | |
| H3GA0020641 | 7 | 28521421 | 0.11 | 5.14 | 2.30E-7 | PRIM2 | Within | |
| ALGA0039917 | 7 | 26737102 | 0.19 | 4.88 | 4.74E-7 | MLIP | Within | |
| INRA0024788 | 7 | 30317219 | 0.36 | 4.63 | 9.33E-7 | HMGA1 | 3191 | |
| BFT | WU_10.2_18_56654365 | 18 | 51759775 | 0.12 | 12.66 | 5.80E-16 | HECW1 | Within |
| WU_10.2_16_23509998 | 16 | 22361911 | 0.12 | 12.38 | 1.27E-15 | NIPBL | Within | |
| WU_10.2_8_138925750 | 8 | 129537879 | 0.12 | 11.94 | 4.37E-15 | MMRN1 | 364487 | |
| ALGA0014052 | 2 | 82412427 | 0.14 | 7.72 | 4.52E-10 | TMEM174 | 75272 | |
| ALGA0040227 | 7 | 30176520 | 0.39 | 5.01 | 6.14E-7 | HMGA1 | 143890 |
Table 3-2.
The genome-level significant SNPs and possible candidate genes for meat quality traits.
| Trait | SNP | CHR | POS (bp) | MAF | PVE (%) | P-adj1 | Gene | DIS (bp) |
|---|---|---|---|---|---|---|---|---|
| a.LD | WU_10.2_16_23509998 | 16 | 22361911 | 0.12 | 7.94 | 2.34E-10 | NIPBL | Within |
| WU_10.2_8_138925750 | 8 | 129537879 | 0.12 | 7.44 | 8.95E-10 | MMRN1 | 364487 | |
| WU_10.2_18_56654365 | 18 | 51759775 | 0.12 | 7.36 | 1.14E-9 | HECW1 | Within | |
| ALGA0014052 | 2 | 82412427 | 0.14 | 6.95 | 3.38E-9 | TMEM174 | 75272 | |
| H3GA0000048 | 1 | 493510 | 0.01 | 4.75 | 1.19E-6 | PSMB1 | 19168 |
3.3.1. Carcass Trait
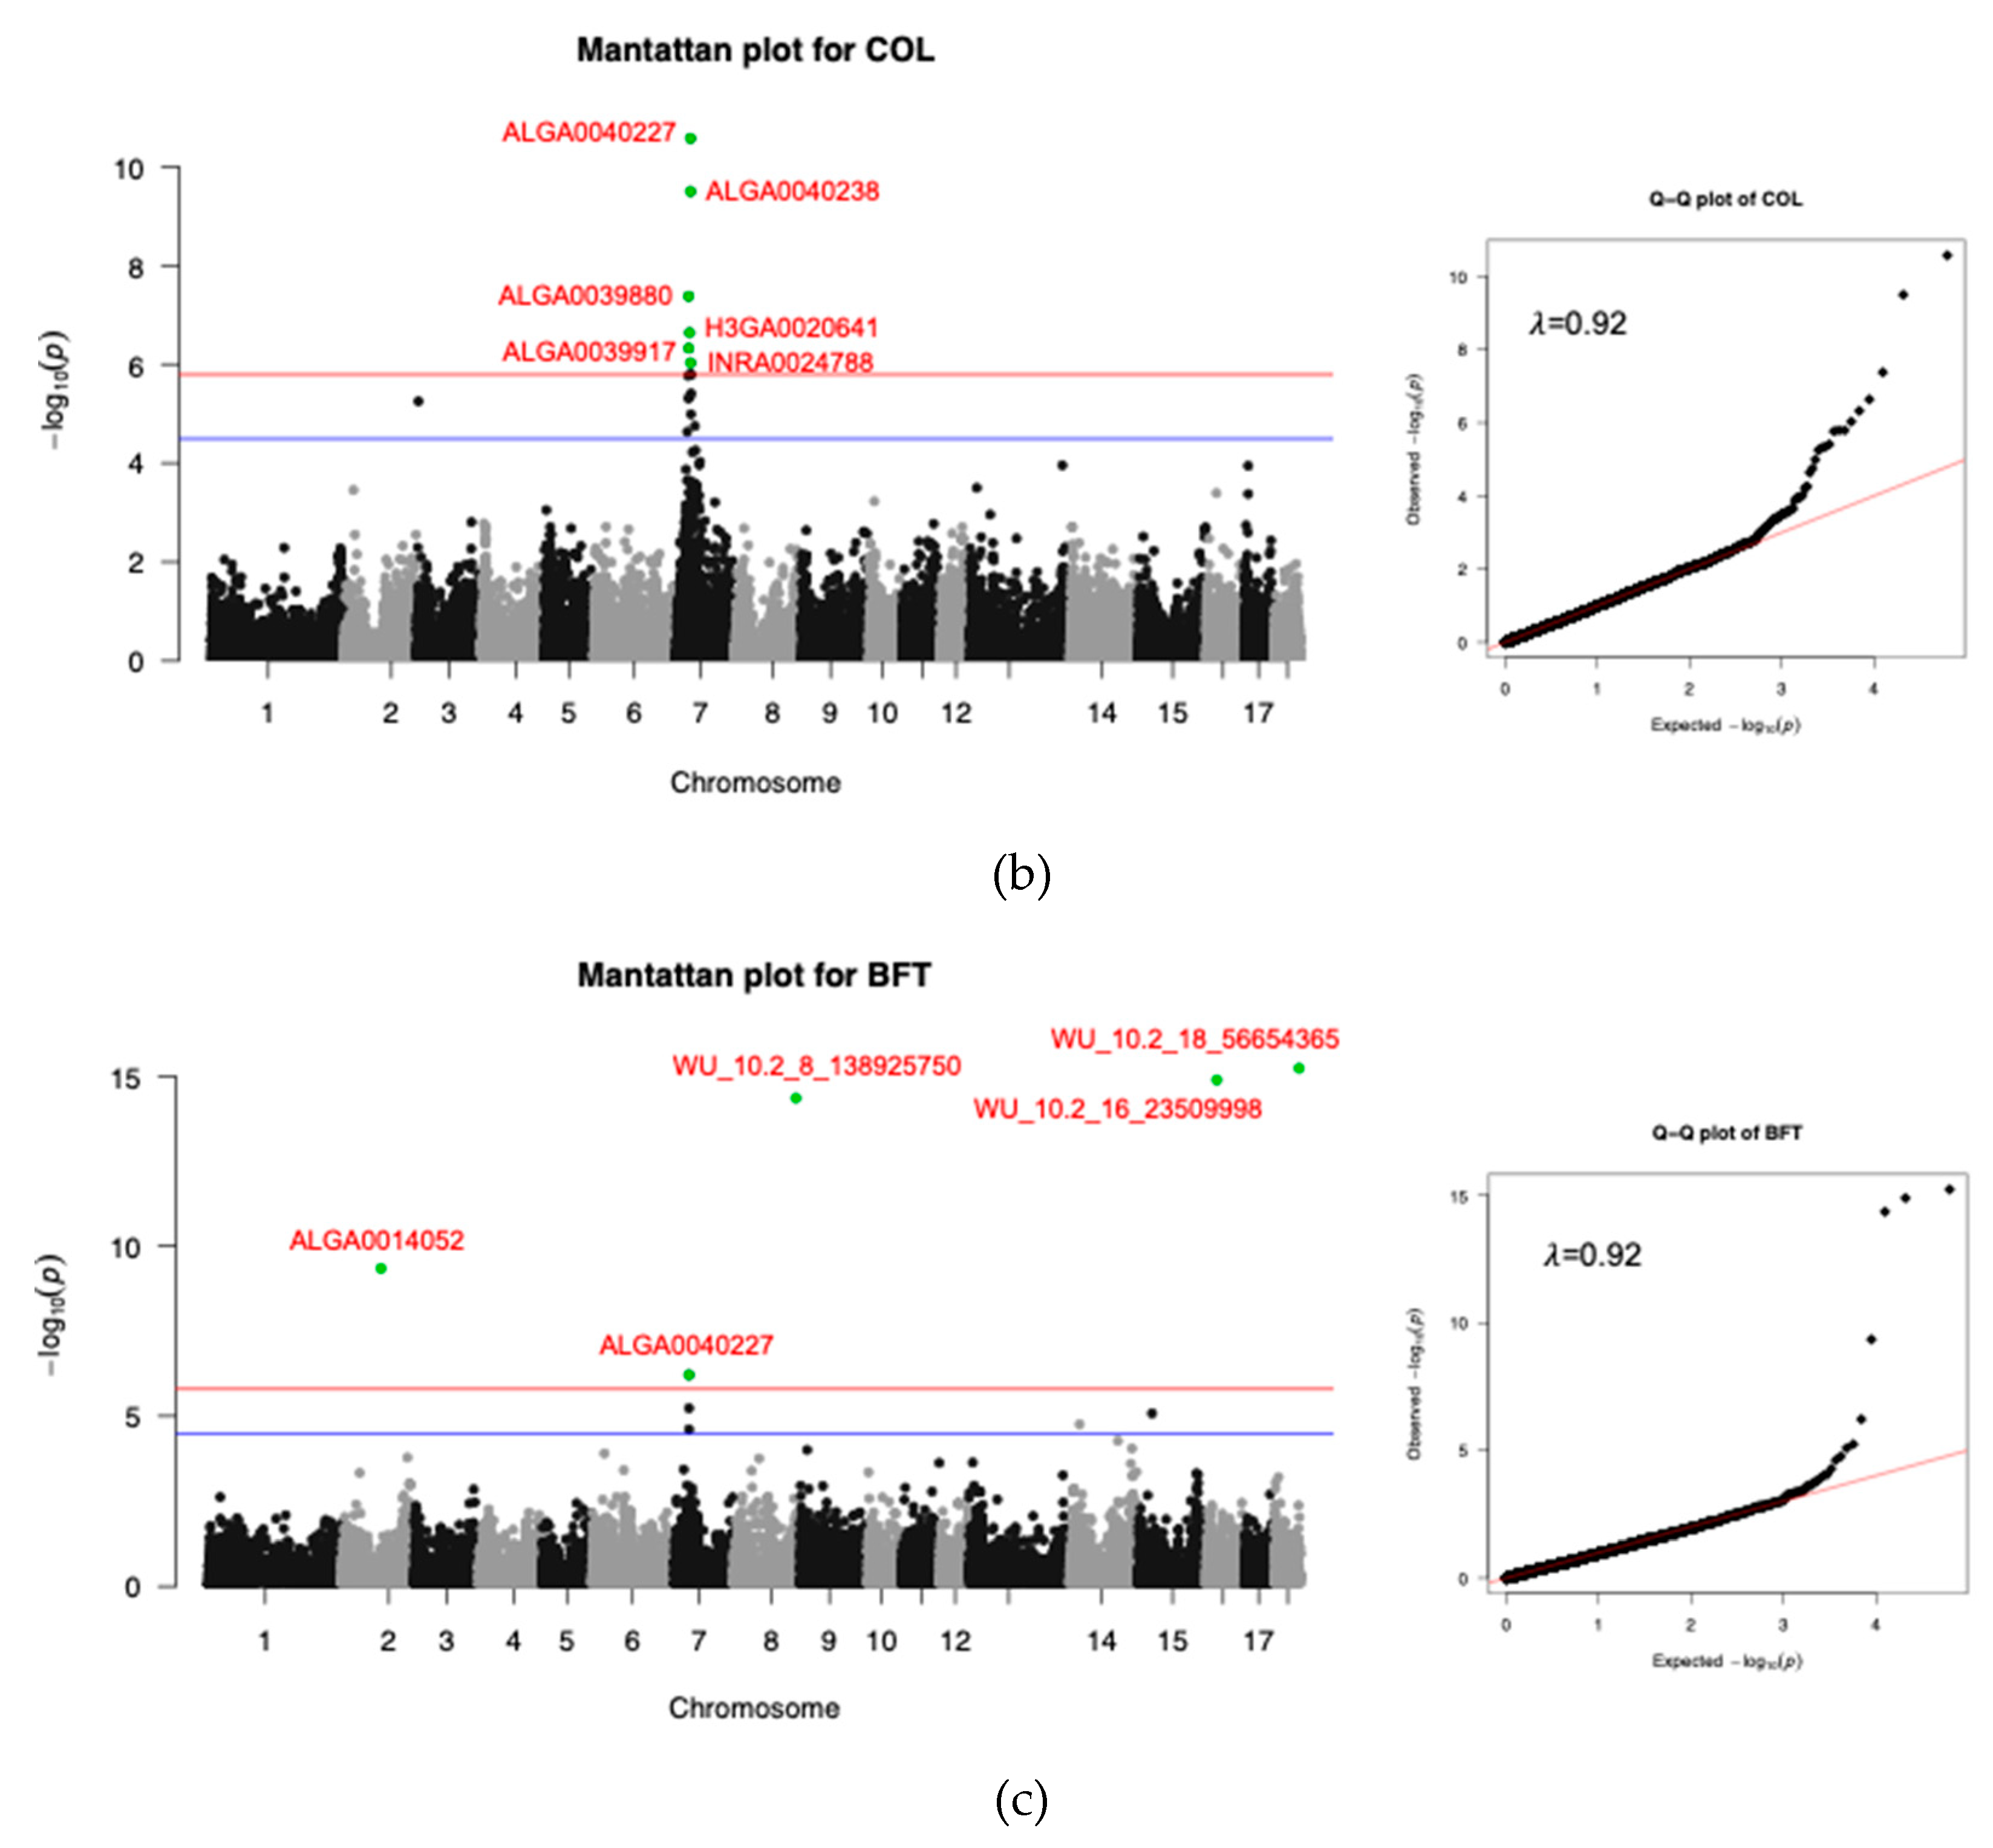
For CL and COL, 15 and 6 genome-wide significant SNPs were identified on SSC7, respectively (Table 3-1). ALGA0040227 was the most significant SNP for both traits, contributing 14.35% and 8.38% to the phenotypic variance, respectively. Among all the significant SNPs, 6 were intergenic (located within MLIP, FKBP5, PRIM2, TINAG, and ZNF76, respectively). For BFT, there were 5 genome-wide significant SNPs identified and distributed on SSC2, SSC7, SSC8, SSC16, and SSC18, respectively (Figure 1c), WU_10.2_18_56654365 was the most significant SNP, contributing 12.66% to the phenotypic variance. Two SNPs (WU_10.2_18_56654365, WU_10.2_16_23509998) were located within HECW1 and NIPBL genes, respectively.
Figure 1.
Manhattan and Q-Q plots for three carcass traits. (a) to (c) are CL, COL, and BFT traits, respectively. The red line is the genome-wide threshold -log10(0.05/31,106) and the blue line -log10(1/31,106) is the suggestive threshold. The green dots represent genome-wide significant SNPs. Because of the overlap of SNPs, some SNPs are not marked. The λ represents genomic inflation factors.
3.3.2. Meat Quality Trait
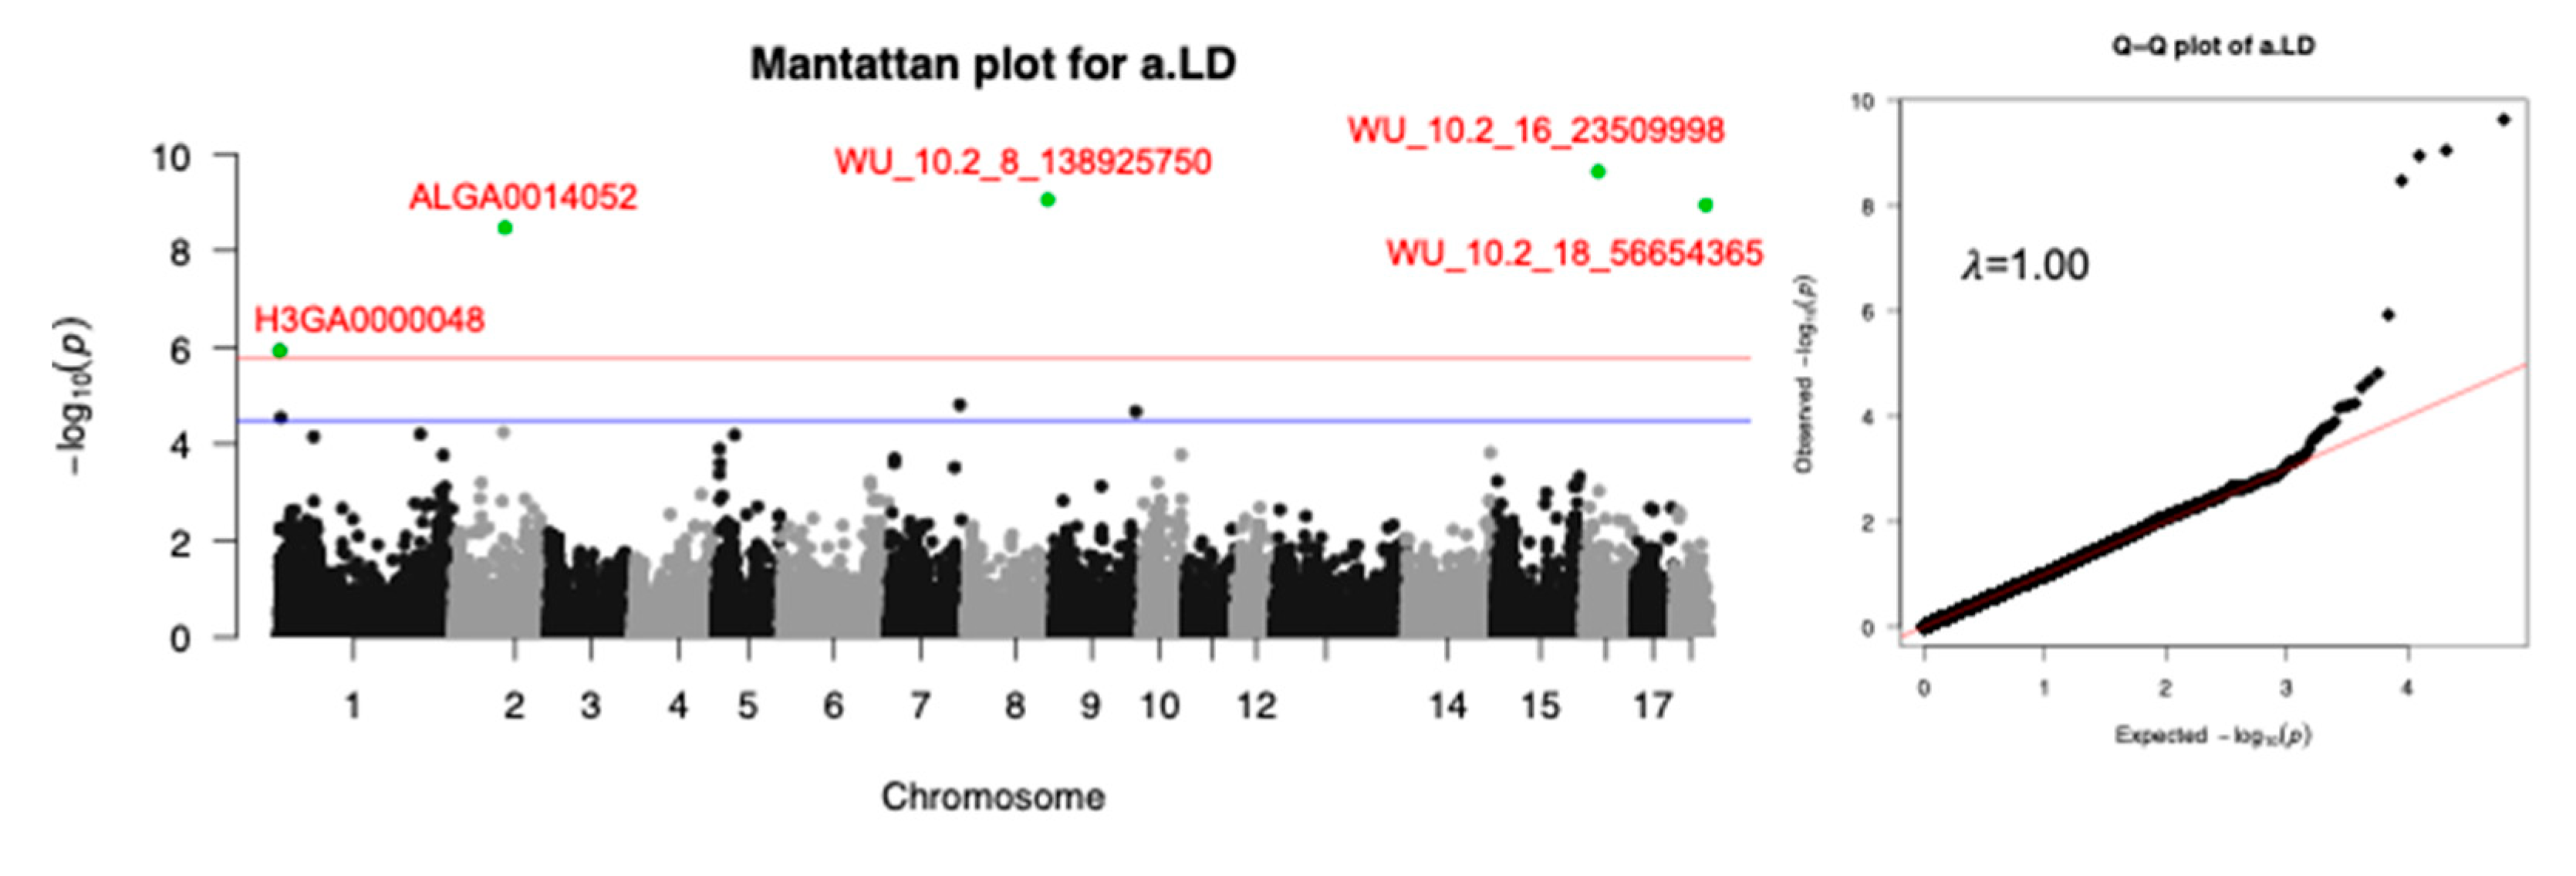
Among the meat quality traits, only for a.LD we 5 significant SNPs identified, distributed across 5 separate chromosomes. The most significant SNP was WU_10.2_16_23509998 located on SSC16 (Figure 2 and Table 3-2) and contributing 7.95% to the phenotypic variance. Except for H3GA0000048 SNP, which was a rare variant (MAF = 0.01), the other 4 were also identified for BFT trait. No significant SNPs were found for the other traits in this study (Figure S4).
Figure 2.
Manhattan and Q-Q plots s for meat trait (a.LD). The red line is the genome-wide threshold -log10(0.05/31,106) and the blue line -log10(1/31,106) is the suggestive threshold. The green dots represent genome-wide significant SNPs. The λ represents genomic inflation factors.
Figure 2.
Manhattan and Q-Q plots s for meat trait (a.LD). The red line is the genome-wide threshold -log10(0.05/31,106) and the blue line -log10(1/31,106) is the suggestive threshold. The green dots represent genome-wide significant SNPs. The λ represents genomic inflation factors.
3.4. LD Block Analysis
Twelve LD blocks were identified in regions 26.50 - 50.28 Mb on SSC7, but only one block included two genome-wide significant SNPs and indicated strong LD (r2 = 1). In fact, LD block analysis revealed that the multiple significant SNPs on SSC7 associated with CL spanned 146.72 kb (r2 =0.3) (Figure 3).
3.5. Functional Enrichment Results
To annotate the potential SNPs, candidate genes overlapping with the extended genomic regions were selected for GO term enrichment analysis. A total of 103 and 27 genes were identified for carcass traits (CL, COL, and BFT) and meat color a.LD, respectively. However, only 8 SNPs were located within 7 genes. (Top 10 GO terms shown in Figure 4, KEGG pathway shown in Table S3).
3.5.1. Carcass Trait
There were 83 genes that overlapped with or closed to the significant SNPs for the CL trait. Most of these genes were enriched in GO terms of cellular component (CC), and two genes (MAPK14, TREM2) were significantly enriched in osteoclast differentiation (GO:0030316). Osteoclast differentiation (hsa04380) was also a significant KEGG pathway for this trait. For COL, there were 28 potential genes within these genomic regions, these genes were mostly enriched in protein binding (GO:0005515). There were 153 GO terms found, and 4 of them were related to calcium regulation and transportation (calcium-release channel activity, phosphatidylinositol metabolic process, positive regulation of calcium ion transport into cytosol, calcium ion transport into cytosol). Seven GO terms were related to phosphate metabolism or enzyme activity (e.g., inositol phosphate metabolic process, inositol phosphate biosynthetic process, inositol phosphate-mediated signaling). Most of the enriched KEGG pathways were primarily related to disease and immunity, such as Kaposi sarcoma-associated herpesvirus infection (hsa05167) and Human cytomegalovirus infection (hsa05163). The other pathways were Apoptosis (hsa04210), Phosphatidylinositol signaling system (hsa04070), and Protein processing in endoplasmic reticulum (hsa04141). For BFT, nucleus (GO: 0006998) was the most enriched GO term, and inositol phosphate metabolic process (GO:0043647) was also found.
3.5.2. Meat Quality Trait
In total, 27 genes were used for enrichment analysis for a.LD, and biological process (BP) was the most enriched category in top 10 GO terms. Proteasome was the only significant KEGG pathway.
4. Discussion
In this study, the heritability of carcass traits ranged from 0.47 to 0.80, while the heritability of meat quality traits ranged from 0.11 to 0.44. In phenotypic and genetic correlation, BFT and body length traits exhibited a significant negative correlation. Most Chinese indigenous pig breeds were shorter than the imported breeds, but had thicker BFT [28]. Ningxiang pig, a famous obese pig breed, had a BFT (41.61 mm) thicker than commercial breeds [14,29] and comparable to Chinese indigenous obese breeds [30]. In this study, the average carcass length (81.35 cm) was shorter and BFT (41.61 mm) was higher than commercial breeds [31]. Regarding meat quality traits, meat color mainly included three parameters (i.e., L, a, b) indicating lightness, redness, and lightness of pork. Redness was associated with myoglobin content, with higher myoglobin presenting increased redness [32]. The meat color of Ningxiang pigs was similar to Chinese Sutai pigs [33]. Compared with Duroc pigs, Ningxiang pigs had higher redness, lower yellowness, and lower lightness [29]. In phenotypic correlation, most carcass traits and pH traits showed a significant negative correlation with meat color traits, while genetic correlation differed. The pH45min and pH24h were negatively genetically correlated with redness, and yellowness, respectively. The study indicated that low acidity could affect meat color, structure, and tenderness [34], which was also consistent with our team's previous report [35]. Additionally, there was a negative correlation between lightness and BFT. Yuan et al. reported polymorphism of DGAT1 gene affected meat color, which was a known gene for fat deposition [36].
In this study, we performed a GWAS in a Ningxiang population to explore the genetic architecture of carcass and meat quality traits. A total of 21 genome-wide significant SNPs and several candidate genes were identified for carcass traits (CL, COL, BFT) and one meat quality trait (a.LD). We identified some novel SNPs and genes potentially associated with these traits, which had not been reported previously. Therefore, it is essential to conduct GWAS in different pig breeds to identify more genes underlying the complex traits, which would be beneficial for Ningxiang pig breeding programs. Previous studies concluded that some SNP-containing annotated genes were highly associated with carcass and meat quality traits. Notably, we found some SNPs exhibited pleiotropy in multiple traits. Watanabe et al. [37] indicated that numerous pleiotropy loci, SNPs, or genes existed between traits with strong correlations, especially within the same domain. For example, CL and COL were highly correlated in phenotype and genetics, a total of 6 SNPs were identified for two traits, and ALGA0040227 was also the most significant site for BFT. This SNP was located within 113 reported QTLs, with 3 of them associated with carcass length [38,39], 16 QTLs related to backfat thickness [40,41], 3 QTLs associated with meat color [15,42]. ALGA0040227 was closest to the HMGA1 (high mobility group AT-hook 1) gene. The HMGA1 is a nonhistone chromatin structural protein characterized by the absence of transcriptional activity and belongs to the high mobility family A, which comprises three members: HMGA1, HMGA2 and HMGA3. This gene plays a vital role in osteoblast commitment and mediates the function of NFIX by transcriptionally activating canonical Wnt signaling [43]. Moreover, the HMGA1 gene is a key regulator of the insulin receptor (INSR) gene [44]. This gene has been reported to be related to many traits. For example, Ding et al. [14], Wang et al. [13], and Kim et al. [45] reported that HMGA1 was associated with fat deposition traits in pigs. Additionally, this gene has been reported to be associated with obesity [46], diabetes [47] and metabolic syndrome [44] in humans. Gong et al. [48] and Liu et al. [49] reported that this gene was associated with growth traits (e.g., cannon circumference and body length) and body size in pigs. Otto et al. [50] identified that the HMGA1 gene affected the measurement of meat color. In this study, BFT and carcass length traits also exhibited strong phenotypic and genetic correlations.
Through GO and KEGG enrichment analysis, we identified several candidate genes associated with carcass length that are involved in skeletal development process, including calcium ion transportation, phosphatidylinositol metabolism and synthesis, and osteoclast differentiation. The majority of calcium ions in animals are primarily located in bones and teeth, and skeletal development is intimately linked to carcass length. Osteoclasts are a specialized cell type involved in the development of bone and cartilage [51,52,53].
In this study, all significant SNPs were located within or close proximity to several genes (HMGA1, MLIP, UNC5CL, ADGRF1, FKBP5, PRIM2, TINAG, STARD5, SRSF3, ZNF76, and LOC100526118). Some of these genes have been reported to be associated with interesting phenotypes. For example, the ADGRF1 gene, also known as the GPR110 gene, is a member of the adhesion GPCR family and functions as a receptor of N-docosahexaenoyl ethanolamine [54]. Hidaka et al. [55] suggested that synaptamide/GPR110 signaling negatively regulates osteoclastogenesis. This gene has also been reported to be associated with carcass length in pigs [56]. PRIM2 (DNA primase subunit 2, also named PRIM2A) encodes 58 kDa protein containing a 4Fe-4S cofactor that forms a heterodimeric DNA primase with PRIM1, a small subunit of DNA primase [57]. Wang et al. [58] identified the PRIM2 gene as being associated with body length. The FKBP5 gene (FKBP prolyl isomerase 5, all named AIG61, FKBP54.) encodes the FKBP5 protein, an immunoaffinity protein with multiple biological functions. Lu et al. [59] found that the FKBP5 gene is involved in NF-kB and Akt signaling pathways, both of which regulate and control osteoclasts differentiation and development. They also pointed out the FKBP5V55L mutation is related to osteoclastogenesis and function, which affects the development of Paget's disease. This gene is a potential candidate for skeletal muscle development. The MLIP (Muscular A-type Lamin interacting protein, also called MMCKR or CIP) gene encodes alternatively spliced variants (23–57 kDa) with several novel structural motifs not found in other proteins and is highly expressed in heart, skeletal, and smooth muscle [60]. Huang et al. [61] identified it as a candidate gene for the formation of exterior traits (facial wrinkles) in Chinese Erhualian pigs.
Furthermore, few studies have investigated these genes in livestock or their association with interesting phenotypes, such as TINAG (Tubulointerstitial nephritis antigen, also named TIN-AG) and ZNF76 (Zinc finger protein 76). The TINag gene encodes an extracellular matrix protein, TINag, which is expressed in tubular basement membranes [62]. Most studies on this gene have focused on disease. For instance, Tong et al. [62] identified a mutation in TINAG as a prognostic biology marker for pectus excavatum (PE). Jakowlev et al. [1] suggested that TINAG might be a potential susceptibility gene for hand osteoarthritis. The UNC5CL gene (all called MUXA, ZUD) is a member of the UNC5 family and has a unique death and ZU5 domain in its molecular structure. It is also involved in immunity and inflammation [63]. This gene has been extensively implicated in mucosal diseases [64,65].
For the BFT trait, we identified four candidate genes, which were also found in a.LD, including HECW1, NIPBL, MMRN1, TMEM174. Additionally, two significant SNPs were located within NIPBL (nipped-B-like protein cohesin loading factor) and HECW1 (HECT, C2 and WW domain-containing E3 ubiquitin protein ligase 1, also called NEDL1), respectively. The NIPBL encodes the homolog of Nipped-B like protein and colon tumor susceptibility 2-type sister chromatid cohesion proteins, facilitating enhancer-promoter interaction of remote enhancers. It is highly expressed in lung, spleen, and subcutaneous adipose tissue. In this study, we discovered that the NIPBL gene was enriched in embryo development, such as embryonic viscerocranium morphogenesis (GO:0048703) and embryonic digestive tract morphogenesis (GO:0048557). Kawauchi et al. [66] indicated that heterozygous mutations of NIPBL led to multiple organ defects and transcriptional disorders in mice. In farm animals, the gene has been reported to be associated with limb development in Qinchuan cattle [1], milk traits in Chinese dairy cattle [68], and adipogenesis in Duroc pigs [69]. HECW1 was highly expressed in kidney and ovary, is one of nine members of the HECT ubiquitin-like ligase NEDD4 family. No studies have shown that this gene is related to traits of interest. The other two genes, MMRN1 gene (Multimerin 1, also known as ECM, EMILIN4) and TMEM174 gene (Transmembrane protein 174), are also unrelated to fat deposition or meat color formation.
Meat color is a major factor affecting consumer preferences. Redness, yellowness, and lightness serve as primary indicators of meat color. Factors influencing meat color are not limited to pigment sources such as myoglobin, hemoglobin and cytochrome C, but also include muscle structure [70]. In this study, we identified significant loci for only one meat color trait (a.LD), with candidate genes associated with iron ion transport, mitochondrial cytochrome c oxidase assembly, and negative regulation of myoblast differentiation. However, none of the obtained genes have been previously studied in relation to meta color.
To assess whether SNPs associated with carcass and meat quality trait in this study replicated any previously known QTLs, we searched the pig QTL database based on SNP and QTL locations. We identified a total of 21 SNPs associated with carcass and/or meat quality traits within genomic regions. The top 10 traits with the highest enrichment are shown in Table S4, with average daily gain exhibiting the highest enrichment among all traits. Reported QTLs associated with carcass traits were found in genomic regions for CL and COL. Average backfat thickness, fat-cuts percentage, and intramuscular fat content were related to fatness and meat quality for BFT. Some QTLs for meat color traits (L, a, and b) were also identified in the a.LD genomic region.
5. Conclusions
Through a genome-wide association study on carcass and meat quality traits in a Ningxiang pig population, we detected 21 SNPs associated with the traits of interest, and identified several candidate genes related to these SNPs. HMGA1 emerged as a potential pleiotropic gene associated with carcass length and BFT. ADGRF1, FKBP5, and PRIM2 genes were identified in relation to carcass length, while NIPBL gene was associated with BFT. These findings contribute to a better understanding of the genetic architecture of carcass and meat quality traits in Ningxiang pigs and hold potential for application in inbreeding programs.
Supplementary Materials
The following supporting information can be downloaded at the website of this paper posted on Preprints.org. Figure S1: SNP density after quality control; Figure S2: Principal component analysis of 508 animals; Figure S3: Phenotypic distribution of eight traits, Sd represents standard deviation; Figure S4: Manhattan and Q-Q plots for 4 traits (b.LD, L.LD, pH45min,pH24h). The red line is the genome-wide threshold (0.05/31,106) and the blue line (1/31,106) is the suggestive threshold. The -log10(P-value) of each SNP (y-axis) across the chromosomes (x-axis), along with the corresponding Q-Q plots. The λ represents genomic inflation factors. Table S1: Abbreviation and measurement method description in this study; Table S2: Distribution of SNPs before, and after quality control and the average distance between adjacent SNPs on each chromosome; Table S3: Enrichment of KEGG pathway in Homo Sapiens dataset; Table S4: Top 10 traits with the highest enrichment QTLs number.
Author Contributions
Writing original draft and data analysis, Shishu Yin; data curation, Gang Song; review and editing, Ning Gao; resources, Qinghua Zeng; investigation, Peng Lu; supervision and editing, Qin Zhang; supervision, Kang Xu; project administration, Jun He; All authors have read and agreed to the published version of the manuscript.
Funding
This research was funded by the Strategic Priority Research Program of the Chinese Academy of Sciences (Precision Seed Design and Breeding, XDA24030204), the Special Fund for the Construction of Innovative Provinces in Hunan (Grant number 2021NK1009), Hunan Provincial Natural Science Foundations of China (Grant numbers 2022JJ30286, 2021JJ40254).
Institutional Review Board Statement
The animal study protocol was approved by the Ethics Association of Hunan Agricultural University (approval number 2020047).
Data Availability Statement
The data presented in this study are available on request from the corresponding author.
Acknowledgments
We are grateful to the Ningxiang Chu Weixiang Slaughterhouse and Meat Processing, LLC (Hunan Province, China) for providing samples and helping to collect samples and phenotypic data.
Conflicts of Interest
The authors declare no conflict of interest.
References
- Yang, J.; Huang, L.; Yang, M.; Fan, Y.; Li, L.; Fang, S.; Deng, W.; Cui, L.; Zhang, Z.; Ai, H.; et al. Possible Introgression of the VRTN Mutation Increasing Vertebral Number, Carcass Length and Teat Number from Chinese Pigs into European Pigs. Sci Rep 2016, 6, 19240. [Google Scholar] [CrossRef] [PubMed]
- Lu, P.; Li, D.; Yin, J.; Zhang, L.; Wang, Z. Flavour Differences of Cooked Longissimus Muscle from Chinese Indigenous Pig Breeds and Hybrid Pig Breed (Duroc×Landrace×Large White). Food Chemistry 2008, 107, 1529–1537. [Google Scholar] [CrossRef]
- Gjerlaug-Enger, E.; Aass, L.; Ødegård, J.; Vangen, O. Genetic Parameters of Meat Quality Traits in Two Pig Breeds Measured by Rapid Methods. Animal 2010, 4, 1832–1843. [Google Scholar] [CrossRef] [PubMed]
- Fernández-Barroso, M.Á.; Silió, L.; Rodríguez, C.; Palma-Granados, P.; López, A.; Caraballo, C.; Sánchez-Esquiliche, F.; Gómez-Carballar, F.; García-Casco, J.M.; Muñoz, M. Genetic Parameter Estimation and Gene Association Analyses for Meat Quality Traits in Open-air Free-range Iberian Pigs. J Anim Breed Genet 2020, 137, 581–598. [Google Scholar] [CrossRef] [PubMed]
- Huang, Y.; Zhou, L.; Zhang, J.; Liu, X.; Zhang, Y.; Cai, L.; Zhang, W.; Cui, L.; Yang, J.; Ji, J.; et al. A Large-Scale Comparison of Meat Quality and Intramuscular Fatty Acid Composition among Three Chinese Indigenous Pig Breeds. Meat Science 2020, 168, 108182. [Google Scholar] [CrossRef]
- Jiang, Y.Z.; Zhu, L.; Tang, G.Q.; Li, M.Z.; Jiang, A.A.; Cen, W.M.; Xing, S.H.; Chen, J.N.; Wen, A.X.; He, T.; et al. Carcass and Meat Quality Traits of Four Commercial Pig Crossbreeds in China. Genet. Mol. Res. 2012, 11, 4447–4455. [Google Scholar] [CrossRef]
- Jiang, Y.-Z.; Zhu, L.; Li, F.-Q.; Li, X.-W. Carcass Composition and Meat Quality of Indigenous Yanan Pigs of China. Genet. Mol. Res. 2012, 11, 166–173. [Google Scholar] [CrossRef]
- Adzitey, F.; Nurul, H. Pale Soft Exudative (PSE) and Dark Firm Dry (DFD) Meats: Causes and Measures to Reduce These Incidences: A Mini Review. International Food Research Journal 2011, 18, 11–20. [Google Scholar]
- Hamilton, D.N.; Ellis, M.; Miller, K.D.; McKeith, F.K.; Parrett, D.F. The Effect of the Halothane and Rendement Napole Genes on Carcass and Meat Quality Characteristics of Pigs. Journal of Animal Science 2000, 78, 2862. [Google Scholar] [CrossRef]
- Scheffler, T.L.; Gerrard, D.E. Mechanisms Controlling Pork Quality Development: The Biochemistry Controlling Postmortem Energy Metabolism. Meat Science 2007, 77, 7–16. [Google Scholar] [CrossRef]
- Timpson, N.J.; Greenwood, C.M.T.; Soranzo, N.; Lawson, D.J.; Richards, J.B. Genetic Architecture: The Shape of the Genetic Contribution to Human Traits and Disease. Nat Rev Genet 2018, 19, 110–124. [Google Scholar] [CrossRef] [PubMed]
- Mackay, T.F.C. The Genetic Architecture of Quantitative Traits. 2001, 37.
- Wang, H.; Wang, X.; Yan, D.; Sun, H.; Chen, Q.; Li, M.; Dong, X.; Pan, Y.; Lu, S. Genome-Wide Association Study Identifying Genetic Variants Associated with Carcass Backfat Thickness, Lean Percentage and Fat Percentage in a Four-Way Crossbred Pig Population Using SLAF-Seq Technology. BMC Genomics 2022, 23, 594. [Google Scholar] [CrossRef] [PubMed]
- Ding, R.; Zhuang, Z.; Qiu, Y.; Ruan, D.; Wu, J.; Ye, J.; Cao, L.; Zhou, S.; Zheng, E.; Huang, W.; et al. Identify Known and Novel Candidate Genes Associated with Backfat Thickness in Duroc Pigs by Large-Scale Genome-Wide Association Analysis. Journal of Animal Science 2022, 100, skac012. [Google Scholar] [CrossRef] [PubMed]
- Cho, I.-C.; Yoo, C.-K.; Lee, J.-B.; Jung, E.-J.; Han, S.-H.; Lee, S.-S.; Ko, M.-S.; Lim, H.-T.; Park, H.-B. Genome-Wide QTL Analysis of Meat Quality-Related Traits in a Large F2 Intercross between Landrace and Korean Native Pigs. Genet Sel Evol 2015, 47, 7. [Google Scholar] [CrossRef] [PubMed]
- Suwannasing, R.; Duangjinda, M.; Boonkum, W.; Taharnklaew, R.; Tuangsithtanon, K. The Identification of Novel Regions for Reproduction Trait in Landrace and Large White Pigs Using a Single Step Genome-Wide Association Study. Asian-Australas J Anim Sci 2018, 31, 1852–1862. [Google Scholar] [CrossRef]
- Wang, Y.; Ding, X.; Tan, Z.; Xing, K.; Yang, T.; Pan, Y.; Wang, Y.; Mi, S.; Sun, D.; Wang, C. Genome-Wide Association Study for Reproductive Traits in a Large White Pig Population. Anim Genet 2018, 49, 127–131. [Google Scholar] [CrossRef]
- Browning, B.L.; Zhou, Y.; Browning, S.R. A One-Penny Imputed Genome from Next-Generation Reference Panels. The American Journal of Human Genetics 2018, 103, 338–348. [Google Scholar] [CrossRef]
- Purcell, S.; Neale, B.; Todd-Brown, K.; Thomas, L.; Ferreira, M.A.R.; Bender, D.; Maller, J.; Sklar, P.; de Bakker, P.I.W.; Daly, M.J.; et al. PLINK: A Tool Set for Whole-Genome Association and Population-Based Linkage Analyses. The American Journal of Human Genetics 2007, 81, 559–575. [Google Scholar] [CrossRef]
- Yin, L.; Zhang, H.; Tang, Z.; Yin, D.; Fu, Y.; Yuan, X.; Li, X.; Liu, X.; Zhao, S. HIBLUP: An Integration of Statistical Models on the BLUP Framework for Efficient Genetic Evaluation Using Big Genomic Data. Nucleic Acids Research 2023, gkad074. [Google Scholar] [CrossRef]
- Yin, L.; Zhang, H.; Tang, Z.; Xu, J.; Yin, D.; Zhang, Z.; Yuan, X.; Zhu, M.; Zhao, S.; Li, X.; et al. rMVP: A Memory-Efficient, Visualization-Enhanced, and Parallel-Accelerated Tool for Genome-Wide Association Study. Genomics, Proteomics & Bioinformatics 2021, 19, 619–628. [Google Scholar] [CrossRef]
- Yu, J.; Pressoir, G.; Briggs, W.H.; Vroh Bi, I.; Yamasaki, M.; Doebley, J.F.; McMullen, M.D.; Gaut, B.S.; Nielsen, D.M.; Holland, J.B.; et al. A Unified Mixed-Model Method for Association Mapping That Accounts for Multiple Levels of Relatedness. Nat Genet 2006, 38, 203–208. [Google Scholar] [CrossRef] [PubMed]
- Price, A.L.; Patterson, N.J.; Plenge, R.M.; Weinblatt, M.E.; Shadick, N.A.; Reich, D. Principal Components Analysis Corrects for Stratification in Genome-Wide Association Studies. Nat Genet 2006, 38, 904–909. [Google Scholar] [CrossRef] [PubMed]
- VanRaden, P.M. Efficient Methods to Compute Genomic Predictions. Journal of Dairy Science 2008, 91, 4414–4423. [Google Scholar] [CrossRef] [PubMed]
- Teslovich, T.M.; Musunuru, K.; Smith, A.V.; Edmondson, A.C.; Stylianou, I.M.; Koseki, M.; Pirruccello, J.P.; Ripatti, S.; Chasman, D.I.; Willer, C.J.; et al. Biological, Clinical and Population Relevance of 95 Loci for Blood Lipids. Nature 2010, 466, 707–713. [Google Scholar] [CrossRef] [PubMed]
- Dong, S.-S.; He, W.-M.; Ji, J.-J.; Zhang, C.; Guo, Y.; Yang, T.-L. LDBlockShow: A Fast and Convenient Tool for Visualizing Linkage Disequilibrium and Haplotype Blocks Based on Variant Call Format Files. Briefings in Bioinformatics 2021, 22, bbaa227. [Google Scholar] [CrossRef] [PubMed]
- Bu, D.; Luo, H.; Huo, P.; Wang, Z.; Zhang, S.; He, Z.; Wu, Y.; Zhao, L.; Liu, J.; Guo, J.; et al. KOBAS-i: Intelligent Prioritization and Exploratory Visualization of Biological Functions for Gene Enrichment Analysis. Nucleic Acids Research 2021, 49, W317–W325. [Google Scholar] [CrossRef] [PubMed]
- Song, B.; Zheng, C.; Zheng, J.; Zhang, S.; Zhong, Y.; Guo, Q.; Li, F.; Long, C.; Xu, K.; Duan, Y.; et al. Comparisons of Carcass Traits, Meat Quality, and Serum Metabolome between Shaziling and Yorkshire Pigs. Animal Nutrition 2022, 8, 125–134. [Google Scholar] [CrossRef]
- Suzuki, K.; Irie, M.; Kadowaki, H.; Shibata, T.; Kumagai, M.; Nishida, A. Genetic Parameter Estimates of Meat Quality Traits in Duroc Pigs Selected for Average Daily Gain, Longissimus Muscle Area, Backfat Thickness, and Intramuscular Fat Content. Journal of Animal Science 2005, 83, 2058–2065. [Google Scholar] [CrossRef]
- Tian, W.; Lan, G.; Zhang, L.; Wang, L.; Liang, J.; Liu, X. Detection of DKK3 and CCR1 Genes Polymorphisms and Their Association with Backfat Thickness in Being Black Pigs. Acta Veterinaria et Zootechnica Sinica 2022, 53, 2083–2093. [Google Scholar]
- Khanal, P.; Maltecca, C.; Schwab, C.; Gray, K.; Tiezzi, F. Genetic Parameters of Meat Quality, Carcass Composition, and Growth Traits in Commercial Swine. Journal of Animal Science 2019, 97, 3669–3683. [Google Scholar] [CrossRef]
- Kim, G.-D.; Jeong, J.-Y.; Hur, S.-J.; Yang, H.-S.; Jeon, J.-T.; Joo, S.-T. The Relationship between Meat Color (CIE L* and A*), Myoglobin Content, and Their Influence on Muscle Fiber Characteristics and Pork Quality. Korean Journal for Food Science of Animal Resources 2010, 30, 626–633. [Google Scholar] [CrossRef]
- Liu, H.; Hou, L.; Zhou, W.; Wang, B.; Han, P.; Gao, C.; Niu, P.; Zhang, Z.; Li, Q.; Huang, R.; et al. Genome-Wide Association Study and FST Analysis Reveal Four Quantitative Trait Loci and Six Candidate Genes for Meat Color in Pigs. Front. Genet. 2022, 13, 768710. [Google Scholar] [CrossRef]
- Tomasevic, I.; Djekic, I.; Font-i-Furnols, M.; Terjung, N.; Lorenzo, J.M. Recent Advances in Meat Color Research. Current Opinion in Food Science 2021, 41, 81–87. [Google Scholar] [CrossRef]
- Liao, Y.; Gao, H.; Zhang, Y.; Yin, S.; Xu, K.; He, J. Genome-Wide Association Analysis of Post-Mortem pH and Meat Color Traits in Ningxiang Pigs. Chinese Journal of Animal Science 2021, 57, 174–181. [Google Scholar]
- Yuan, Z.; Li, J.; Li, J.; Gao, X.; Gao, H.; Xu, S. Effects of DGAT1 Gene on Meat and Carcass Fatness Quality in Chinese Commercial Cattle. Mol Biol Rep 2013, 40, 1947–1954. [Google Scholar] [CrossRef] [PubMed]
- Watanabe, K.; Stringer, S.; Frei, O.; Umićević Mirkov, M.; de Leeuw, C.; Polderman, T.J.C.; van der Sluis, S.; Andreassen, O.A.; Neale, B.M.; Posthuma, D. A Global Overview of Pleiotropy and Genetic Architecture in Complex Traits. Nat Genet 2019, 51, 1339–1348. [Google Scholar] [CrossRef] [PubMed]
- Rohrer, G.A.; Keele, J.W. Identification of Quantitative Trait Loci Affecting Carcass Composition in Swine: II. Muscling and Wholesale Product Yield Traits. J Anim Sci 1998, 76, 2255–2262. [Google Scholar] [CrossRef] [PubMed]
- Liu, G.; Jennen, D.G.J.; Tholen, E.; Juengst, H.; Kleinwächter, T.; Hölker, M.; Tesfaye, D.; Un, G.; Schreinemachers, H.-J.; Murani, E.; et al. A Genome Scan Reveals QTL for Growth, Fatness, Leanness and Meat Quality in a Duroc-Pietrain Resource Population. Anim Genet 2007, 38, 241–252. [Google Scholar] [CrossRef]
- Nagamine, Y.; Visscher, P.M.; Haley, C.S. QTL Detection and Allelic Effects for Growth and Fat Traits in Outbred Pig Populations. Genet Sel Evol 2004, 36, 83–96. [Google Scholar] [CrossRef]
- Demeure, O.; Sanchez, M.P.; Riquet, J.; Iannuccelli, N.; Demars, J.; Fève, K.; Kernaleguen, L.; Gogué, J.; Billon, Y.; Caritez, J.C.; et al. Exclusion of the Swine Leukocyte Antigens as Candidate Region and Reduction of the Position Interval for the Sus Scrofa Chromosome 7 QTL Affecting Growth and Fatness. J Anim Sci 2005, 83, 1979–1987. [Google Scholar] [CrossRef]
- Stratz, P.; Baes, C.; Rückert, C.; Preuss, S.; Bennewitz, J. A Two-Step Approach to Map Quantitative Trait Loci for Meat Quality in Connected Porcine F(2) Crosses Considering Main and Epistatic Effects. Anim Genet 2013, 44, 14–23. [Google Scholar] [CrossRef] [PubMed]
- Wu, X.; Wang, X.; Shan, L.; Zhou, J.; Zhang, X.; Zhu, E.; Yuan, H.; Wang, B. High-Mobility Group At-Hook 1 Mediates the Role of Nuclear Factor I/X in Osteogenic Differentiation Through Activating Canonical Wnt Signaling. Stem Cells 2021, 39, 1349–1361. [Google Scholar] [CrossRef] [PubMed]
- Chiefari, E.; Tanyolaç, S.; Iiritano, S.; Sciacqua, A.; Capula, C.; Arcidiacono, B.; Nocera, A.; Possidente, K.; Baudi, F.; Ventura, V.; et al. A Polymorphism of HMGA1 Is Associated with Increased Risk of Metabolic Syndrome and Related Components. Sci Rep 2013, 3, 1491. [Google Scholar] [CrossRef]
- Kim, K.S.; Lee, J.J.; Shin, H.Y.; Choi, B.H.; Lee, C.K.; Kim, J.J.; Cho, B.W.; Kim, T.-H. Association of Melanocortin 4 Receptor (MC4R) and High Mobility Group AT-Hook 1 (HMGA1) Polymorphisms with Pig Growth and Fat Deposition Traits. Animal Genetics 2006, 37, 419–421. [Google Scholar] [CrossRef] [PubMed]
- Arce-Cerezo, A.; García, M.; Rodríguez-Nuevo, A.; Crosa-Bonell, M.; Enguix, N.; Peró, A.; Muñoz, S.; Roca, C.; Ramos, D.; Franckhauser, S.; et al. HMGA1 Overexpression in Adipose Tissue Impairs Adipogenesis and Prevents Diet-Induced Obesity and Insulin Resistance. Sci Rep 2015, 5, 14487. [Google Scholar] [CrossRef]
- Foti, D.; Chiefari, E.; Fedele, M.; Iuliano, R.; Brunetti, L.; Paonessa, F.; Manfioletti, G.; Barbetti, F.; Brunetti, A.; Croce, C.M.; et al. Lack of the Architectural Factor HMGA1 Causes Insulin Resistance and Diabetes in Humans and Mice. Nat Med 2005, 11, 765–773. [Google Scholar] [CrossRef]
- Gong, H.; Xiao, S.; Li, W.; Huang, T.; Huang, X.; Yan, G.; Huang, Y.; Qiu, H.; Jiang, K.; Wang, X.; et al. Unravelling the Genetic Loci for Growth and Carcass Traits in Chinese Bamaxiang Pigs Based on a 1.4 Million SNP Array. J Anim Breed Genet 2019, 136, 3–14. [Google Scholar] [CrossRef] [PubMed]
- Liu, H.; Song, H.; Jiang, Y.; Jiang, Y.; Zhang, F.; Liu, Y.; Shi, Y.; Ding, X.; Wang, C. A Single-Step Genome Wide Association Study on Body Size Traits Using Imputation-Based Whole-Genome Sequence Data in Yorkshire Pigs. Front Genet 2021, 12, 629049. [Google Scholar] [CrossRef]
- Otto, G.; Roehe, R.; Looft, H.; Thoelking, L.; Knap, P.W.; Rothschild, M.F.; Plastow, G.S.; Kalm, E. Associations of DNA Markers with Meat Quality Traits in Pigs with Emphasis on Drip Loss. Meat Sci 2007, 75, 185–195. [Google Scholar] [CrossRef]
- William, J.B.; W. , S.S.; David L., L. Osteoclast Differentiation and Activation. Nature 2003, 423, 337–342. [Google Scholar]
- Datta, H.K.; Ng, W.F.; Walker, J.A.; Tuck, S.P.; Varanasi, S.S. The Cell Biology of Bone Metabolism. Journal of Clinical Pathology 2008, 61, 577–587. [Google Scholar] [CrossRef] [PubMed]
- Kim, J.-M.; Lin, C.; Stavre, Z.; Greenblatt, M.B.; Shim, J.-H. Osteoblast-Osteoclast Communication and Bone Homeostasis. Cells 2020, 9, 2073. [Google Scholar] [CrossRef] [PubMed]
- Zhu, X.; Qian, Y.; Li, X.; Xu, Z.; Xia, R.; Wang, N.; Liang, J.; Yin, H.; Zhang, A.; Guo, C.; et al. Structural Basis of Adhesion GPCR GPR110 Activation by Stalk Peptide and G-Proteins Coupling. Nat Commun 2022, 13, 5513. [Google Scholar] [CrossRef] [PubMed]
- Hidaka, S.; Mouri, Y.; Akiyama, M.; Miyasaka, N.; Nakahama, K. GPR110, a Receptor for Synaptamide, Expressed in Osteoclasts Negatively Regulates Osteoclastogenesis. Prostaglandins, Leukotrienes and Essential Fatty Acids 2022, 182, 102457. [Google Scholar] [CrossRef] [PubMed]
- Falker-Gieske, C.; Blaj, I.; Preuß, S.; Bennewitz, J.; Thaller, G.; Tetens, J. GWAS for Meat and Carcass Traits Using Imputed Sequence Level Genotypes in Pooled F2-Designs in Pigs. G3 Genes|Genomes|Genetics 2019, 9, 2823–2834. [Google Scholar] [CrossRef] [PubMed]
- Yuan, B.; Liao, F.; Shi, Z.-Z.; Ren, Y.; Deng, X.-L.; Yang, T.-T.; Li, D.-Y.; Li, R.-F.; Pu, D.-D.; Wang, Y.-J.; et al. Dihydroartemisinin Inhibits the Proliferation, Colony Formation and Induces Ferroptosis of Lung Cancer Cells by Inhibiting PRIM2/SLC7A11 Axis. OTT 2020, Volume 13, 10829–10840. [Google Scholar] [CrossRef]
- Wang, L.; Zhang, L.; Yan, H.; Liu, X.; Li, N.; Liang, J.; Pu, L.; Zhang, Y.; Shi, H.; Zhao, K.; et al. Genome-Wide Association Studies Identify the Loci for 5 Exterior Traits in a Large White × Minzhu Pig Population. PLoS ONE 2014, 9, e103766. [Google Scholar] [CrossRef]
- Lu, B.; Jiao, Y.; Wang, Y.; Dong, J.; Wei, M.; Cui, B.; Sun, Y.; Wang, L.; Zhang, B.; Chen, Z.; et al. A FKBP5 Mutation Is Associated with Paget’s Disease of Bone and Enhances Osteoclastogenesis. Exp Mol Med 2017, 49, e336–e336. [Google Scholar] [CrossRef]
- Ahmady, E.; Deeke, S.A.; Rabaa, S.; Kouri, L.; Kenney, L.; Stewart, A.F.R.; Burgon, P.G. Identification of a Novel Muscle A-Type Lamin-Interacting Protein (MLIP). Journal of Biological Chemistry 2011, 286, 19702–19713. [Google Scholar] [CrossRef]
- Huang, T.; Zhang, M.; Yan, G.; Huang, X.; Chen, H.; Zhou, L.; Deng, W.; Zhang, Z.; Qiu, H.; Ai, H.; et al. Genome-Wide Association and Evolutionary Analyses Reveal the Formation of Swine Facial Wrinkles in Chinese Erhualian Pigs. Aging 2019, 11, 4672–4687. [Google Scholar] [CrossRef]
- Tong, X.; Li, G.; Feng, Y. TINAG Mutation as a Genetic Cause of Pectus Excavatum. Medical Hypotheses 2020, 137, 109557. [Google Scholar] [CrossRef] [PubMed]
- Heinz, L.X.; Rebsamen, M.; Rossi, D.C.; Staehli, F.; Schroder, K.; Quadroni, M.; Gross, O.; Schneider, P.; Tschopp, J. The Death Domain-Containing Protein Unc5CL Is a Novel MyD88-Independent Activator of the pro-Inflammatory IRAK Signaling Cascade. Cell Death Differ 2012, 19, 722–731. [Google Scholar] [CrossRef]
- Wu, C.; Hu, Z.; He, Z.; Jia, W.; Wang, F.; Zhou, Y.; Liu, Z.; Zhan, Q.; Liu, Y.; Yu, D.; et al. Genome-Wide Association Study Identifies Three New Susceptibility Loci for Esophageal Squamous-Cell Carcinoma in Chinese Populations. Nat Genet 2011, 43, 679–684. [Google Scholar] [CrossRef] [PubMed]
- Shah, R.; Verma, S.; Bhat, A.; Rasool Bhat, G.; Sharma, V.; Sharma, I.; Singh, H.; Kaul, S.; Rai, E.; Sharma, S. Newly Identified Genetic Variant Rs2294693 in UNC5CL Gene Is Associated with Decreased Risk of Esophageal Carcinoma in the J&K Population–India. BIOCELL 2021, 45, 665–670. [Google Scholar] [CrossRef]
- Kawauchi, S.; Calof, A.L.; Santos, R.; Lopez-Burks, M.E.; Young, C.M.; Hoang, M.P.; Chua, A.; Lao, T.; Lechner, M.S.; Daniel, J.A.; et al. Multiple Organ System Defects and Transcriptional Dysregulation in the Nipbl+/− Mouse, a Model of Cornelia de Lange Syndrome. PLoS Genet 2009, 5, e1000650. [Google Scholar] [CrossRef] [PubMed]
- Wang, S.; Raza, S.H.A.; Zhang, K.; Mei, C.; Alamoudi, M.O.; Aloufi, B.H.; Alshammari, A.M.; Zan, L. Selection Signatures of Qinchuan Cattle Based on Whole-Genome Sequences. Animal Biotechnology 2022, 1–9. [Google Scholar] [CrossRef]
- Jiang, L.; Liu, X.; Yang, J.; Wang, H.; Jiang, J.; Liu, L.; He, S.; Ding, X.; Liu, J.; Zhang, Q. Targeted Resequencing of GWAS Loci Reveals Novel Genetic Variants for Milk Production Traits. BMC Genomics 2014, 15, 1105. [Google Scholar] [CrossRef]
- Kim, E.-S.; Ros-Freixedes, R.; Pena, R.N.; Baas, T.J.; Estany, J.; Rothschild, M.F. Identification of Signatures of Selection for Intramuscular Fat and Backfat Thickness in Two Duroc Populations1. Journal of Animal Science 2015, 93, 3292–3302. [Google Scholar] [CrossRef]
- Hughes, J.M.; Clarke, F.M.; Purslow, P.P.; Warner, R.D. Meat Color Is Determined Not Only by Chromatic Heme Pigments but Also by the Physical Structure and Achromatic Light Scattering Properties of the Muscle. Compr Reviews in Food Science and Food Safety 2020, 19, 44–63. [Google Scholar] [CrossRef]
Figure 3.
The LD block in the significantly associated region on SSC7. LD blocks are marked with triangles. Values in boxes are LD (r2) between SNP pairs. From 31161760 to 32150539, only two significant SNPs are M1Ga0010006 and WU_10.2_7_36255497 are within the LD block and their LD value is 1.
Figure 3.
The LD block in the significantly associated region on SSC7. LD blocks are marked with triangles. Values in boxes are LD (r2) between SNP pairs. From 31161760 to 32150539, only two significant SNPs are M1Ga0010006 and WU_10.2_7_36255497 are within the LD block and their LD value is 1.
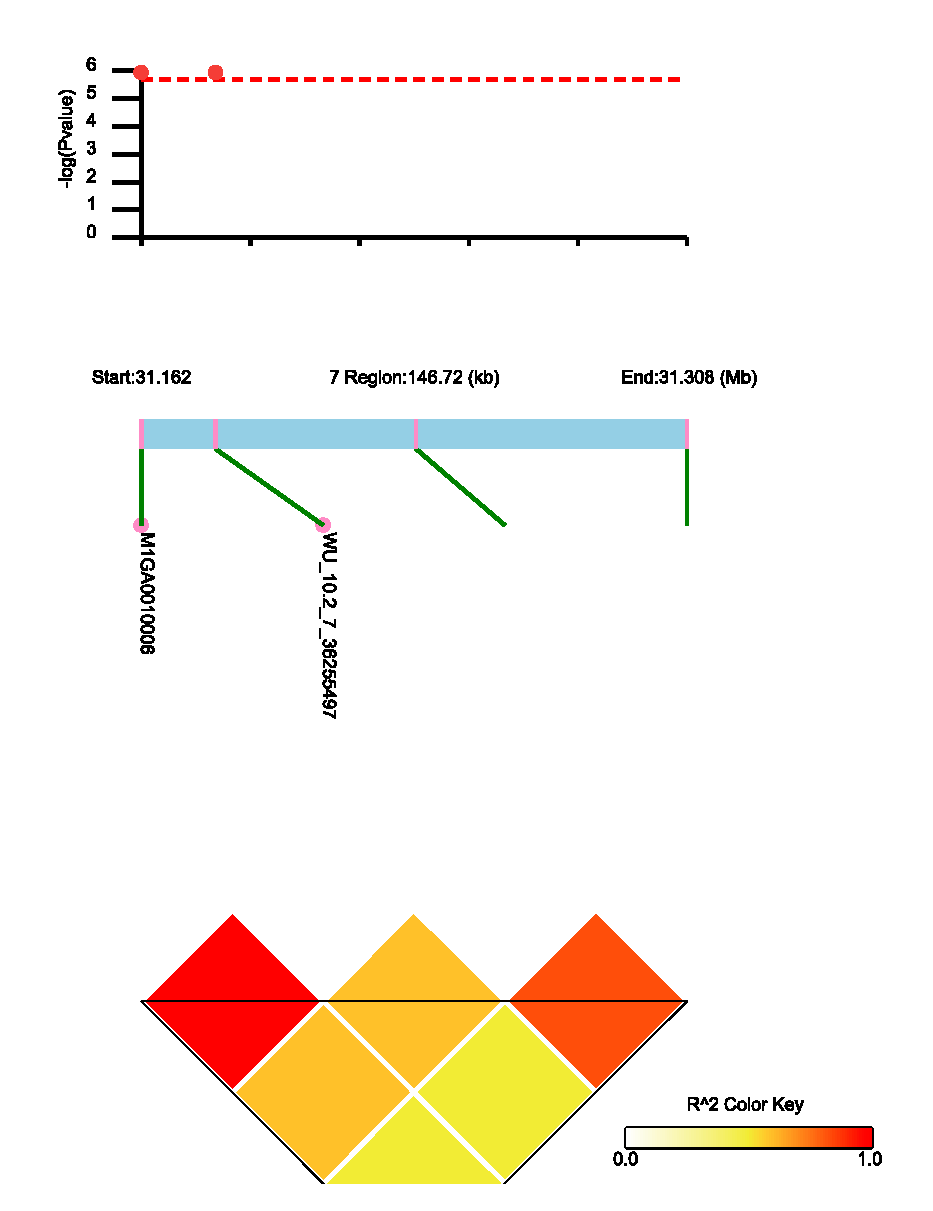
Figure 4.
The GO enrichment of CL, COL, a.LD and BFT traits. Different shapes present different categories, circle presents biological process (BP), triangle present cellular component (CC), and square presents molecular function (MF). Except for BFT, the other figure shows the GO terms in the top 10.
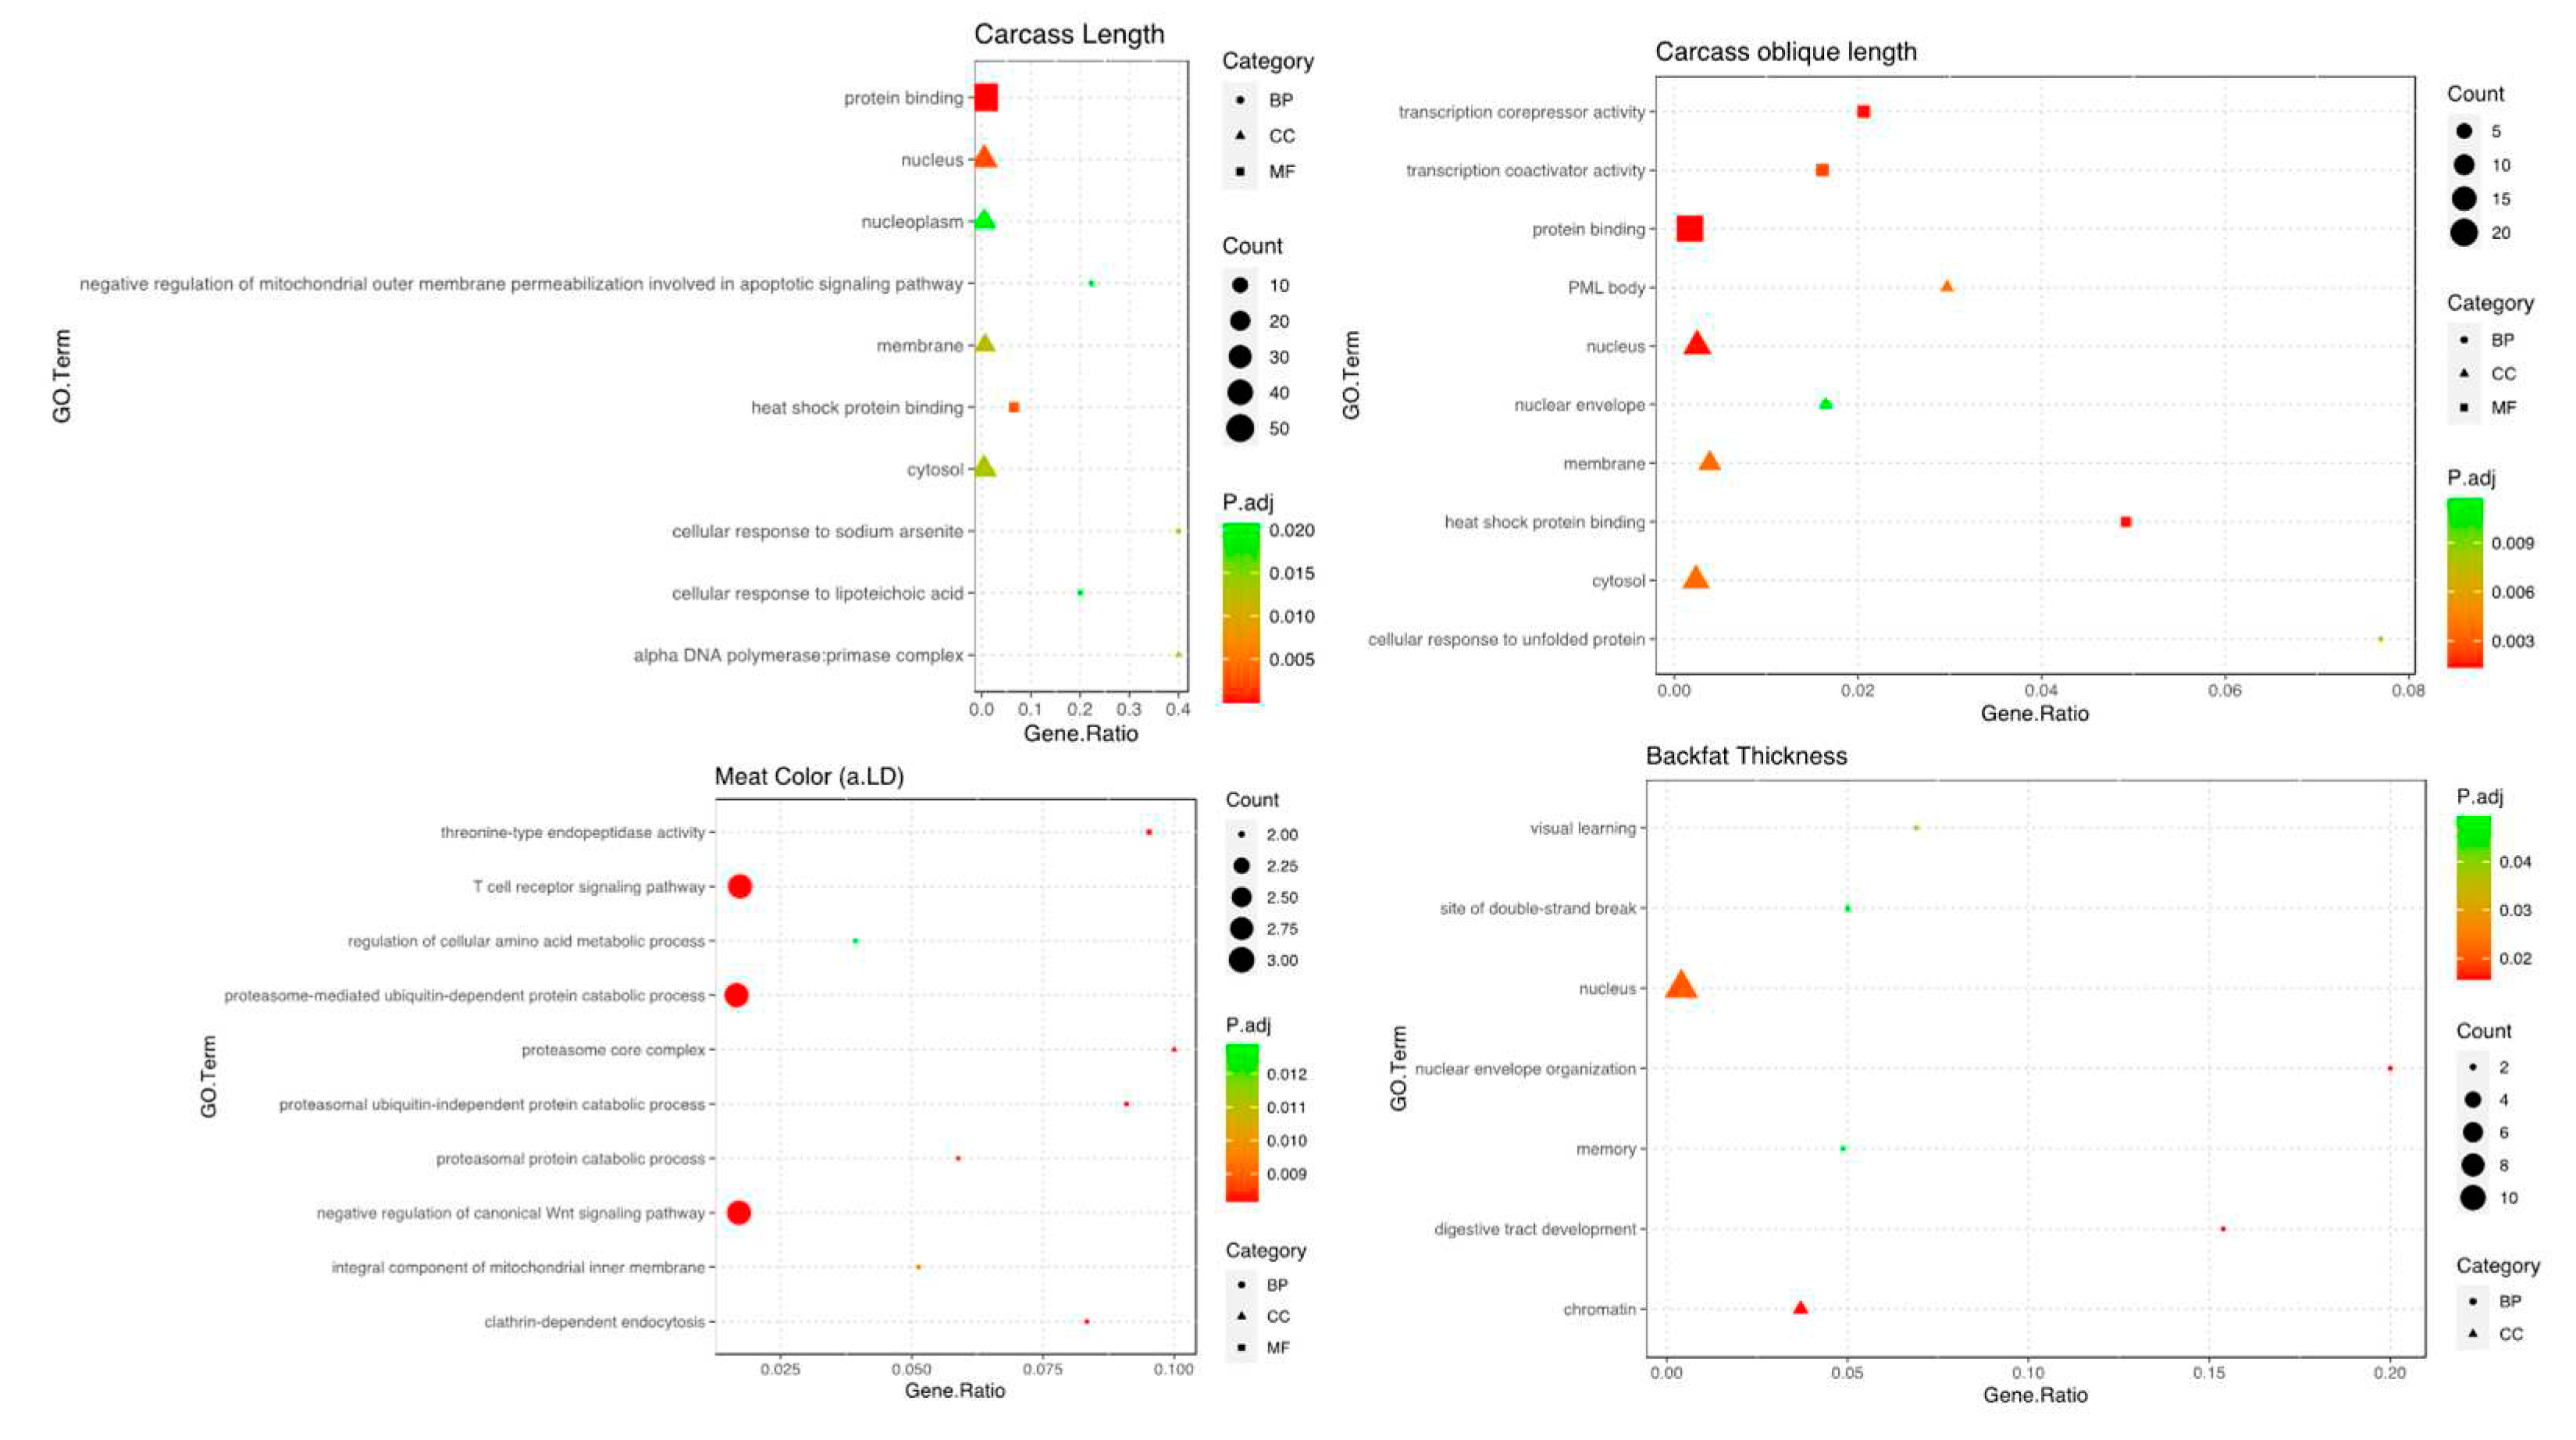
Table 1.
Summary statistics for carcass and meat quality traits in Ningxiang pigs.
| Trait | N | Max. | Min. | Mean ± SD | C.V. |
|---|---|---|---|---|---|
| CL (cm) | 508 | 96.40 | 68.50 | 81.35 ± 4.69 | 5.77 |
| COL (cm) | 508 | 86.50 | 34.10 | 66.11 ± 6.16 | 9.32 |
| BFT (mm) | 485 | 71.06 | 16.17 | 41.61 ± 8.28 | 19.90 |
| L.LD | 508 | 58.73 | 34.80 | 44.73 ± 3.84 | 8.58 |
| a.LD | 508 | 16.17 | 1.34 | 6.53 ± 2.61 | 39.97 |
| b.LD | 508 | 10.53 | 0.14 | 4.00 ± 1.67 | 41.75 |
| pH45min | 508 | 6.96 | 5.46 | 6.28 ± 0.31 | 4.94 |
| pH24h | 508 | 6.87 | 5.46 | 5.91 ± 0.28 | 4.74 |
Table 2.
Estimates of heritabilities and genetic and phenotypic correlations.
| Trait | CL | COL | BFT | pH45min | pH24h | L.LD | a.LD | b.LD |
|---|---|---|---|---|---|---|---|---|
| CL | 0.80(0.06) | 0.87 | -0.53 | -0.22 | -0.27 | 0.25 | -0.05 | 0.14 |
| COL | 0.82*** | 0.47(0.07) | -0.53 | 0.08 | -0.47 | 0.07 | -0.41 | 0.50 |
| BFT | -0.12** | -0.16*** | 0.48(0.08) | 0.07 | -0.08 | -0.32 | 0.07 | -0.32 |
| pH45min | 0.01 | 0.02 | -0.04 | 0.14(0.11) | 0.10 | 0.27 | -0.39 | 0.41 |
| pH24h | -0.05 | -0.09 | 0.12 | 0.37*** | 0.30(0.09) | 0.45 | 0.42 | -0.37 |
| L.LD | 0.06 | -0.03 | -0.07 | -0.24*** | -0.2*** | 0.11(0.07) | 0.38 | -0.08 |
| a.LD | -0.11* | -0.28*** | 0.18*** | -0.07 | -0.04 | 0.31*** | 0.44(0.08) | -0.23 |
| b.LD | 0.27*** | 0.32*** | -0.18*** | 0.09 | -0.24*** | 0.24*** | 0.03 | 0.19(0.09) |
1 Lower triangle numbers are phenotypic correlation, upper are genetic correlation, and the diagonal line represents heritability (± SE) of each trait. 2 “***”, "**", and "*" indicated P < 0.001, P < 0.01, and P < 0.05, respectively.
Disclaimer/Publisher’s Note: The statements, opinions and data contained in all publications are solely those of the individual author(s) and contributor(s) and not of MDPI and/or the editor(s). MDPI and/or the editor(s) disclaim responsibility for any injury to people or property resulting from any ideas, methods, instructions or products referred to in the content. |
© 2023 by the authors. Licensee MDPI, Basel, Switzerland. This article is an open access article distributed under the terms and conditions of the Creative Commons Attribution (CC BY) license (http://creativecommons.org/licenses/by/4.0/).
Copyright: This open access article is published under a Creative Commons CC BY 4.0 license, which permit the free download, distribution, and reuse, provided that the author and preprint are cited in any reuse.


