
Submitted:
15 December 2024
Posted:
16 December 2024
You are already at the latest version
Abstract
Germinal center (GC) reaction is crucial for the generation of high-affinity antibodies against any infection. To address the role of specific gene in GC, knock out mouse models are generally used. However, since GC is multicellular event, complete knock out models cannot pin point the cell intrinsic effect of certain genes in GC reaction. Here, we describe a detail protocol for the analysis of GC in competitive bone marrow chimeric mice generated by transplanting 1:1 mixture of CD45.1 and CD45.2 positive donor bone marrow (BM) cells in immunodeficient Rag2-/-gc-/- mice as recipient host. We describe the method of immunization using sheep red blood cells (SRBC), detection of successful immunization by the antigen specific antibody titer in the serum of the immunized mice and finally assessing the GC reaction in the spleen of the immunized mice by flow cytometry 10 days post-immunization. When the competitive chimera is made with wild type (WT) and a knock out (KO) donor BM, this method is suitable to address the cell type specific (for. e.g. B cell specific) role of the KO gene in GC.
Keywords:
GC reaction
; immune response
; bone marrow chimera
; Rag2-/-gc-/- mice
; B cell
; flow cytometry
; SRBC
1. Introduction
B lymphocytes have the unique capacity to produce highly specific antibodies against any invading pathogens or foreign particles. Upon encountering a cognate antigen, activated B cells interact with helper T cells and seed GC in the secondary lymphoid organs (SLO). GCs are specialized microstructures where B cells undergo proliferation, class switching, somatic hypermutation (SHM) and antibody affinity maturation to produce long lived antibody secreting plasma cells and memory B cells that provide protection against reinfection [1,2]. GC is a highly regulated process and several proteins play essential role in the intricate steps of GC. In general, study of GC reaction involves immunization of mice with a T-cell dependent (TD) antigen followed by subsequent analysis of the development of antigen specific antibody in the serum. In addition, formation of GC in the SLO of immunized mice can be assessed by specific activation markers on B cells using flow cytometry and/or microscopy [3]. Like all major fields of biology, addressing the role of a specific gene in GC relies on KO mouse models. Since GC involves the interplay of different immune cell types such as B cells, T cells and follicular dendritic cells (FDC), complete KO models cannot unambiguously identify the cell type specific function of the gene of interest. Therefore, cell type specific deletion models using Cre-loxP system is believed to be the gold standard for this sort of analysis. However, there are few limiting factors for this approach- first, not all deletion models are available in the Cre-loxP system and generating such models are time and cost demanding. Second, the leakiness of certain Cre-deleter lines, specially the inducible ones and non-specific expression of the Cre in other tissues leads to non-specific deletion of the gene in non-target cell types and finally, the inefficient deletion caused by certain Cre-deleter lines leads to residual gene expression making it difficult to assess the actual contribution of the gene [4].
To circumvent these issues, we took the help of bone marrow chimeric (BMC) mouse models [5]. Competitive BMC, also known as mixed BMC is generated by transplanting 1:1 mixture of BM cells or purified hematopoietic stem cells (HSC) from two different donor strains into one immunodeficient recipient strain (such as Rag2-/-γc-/- mice). The recipient strain is myeloablated either by whole body irradiation [6] or chemotherapy [7,8] or by antibody based removal of host HSCs [9] to make room for the donor cells. The donor strains usually express distinguishable congenic markers such as CD45.1 and CD45.2 which could be reliably and conveniently detected by flow cytometry or imaging. Typically, one donor strain is taken as WT while the other is genetically modified. For instance, if the modified strain is a gene specific KO, the competitive BMC could be a very handy tool to investigate the effect of the KO gene in different processes such as hematopoiesis, immune response etc. directly in comparison with the WT growing in the same microenvironment within the same host. The donor derived HSCs engraft the BM niches of the recipient mice, proliferate, differentiate and repopulate the immune system within a certain period of time [5]. Once engrafted, the competitive chimeric mice can now be challenged with TD immunogen to test the ability of the donor derived cells to respond to the immunization. A comparison of the relative frequency of CD45.1+ and CD45.2+ B cells in the blood and spleen of the chimeric mice with that in GC gives a clear identification of any B cell intrinsic effect of the gene of interest in GC reaction [10].
In the current protocol, a step by step description is given for the immunization of competitive chimeric Rag2-/-γc-/- mice, detection of antigen specific antibody titer in the serum of the immunized mice to assess successful immunization and finally the analysis of GC in the spleen of the successfully immunized chimeric mice. The timeline of the whole experiment is schematically shown in Figure 1.
2. Materials
- Competitive bone marrow chimeric Rag2-/-γc-/- mice generated by transplanting 1:1 mixture of total BM cells from CD45.1+ and CD45.2+ donor mice. Time after transplantation- 6-8 weeks [5].
- General animal injection materials: 1ml disposable syringe and 27G disposable needle.
- Blood collection tube (Z-gel for serum preparation)
- General animal surgical instruments- scissors and forceps.
- General lab wares: 96-well V-bottom plate, 50ml Falcon tubes, 15ml Falcon tubes, 40μm cell strainer, 2ml disposable syringe (piston), 5ml round bottom FACS tubes with cell strainer caps, 5ml round bottom FACS tubes and cell counting chambers.
- SRBC: 10% packed volume, unfixed (see Note 1).
- 1X sterile Phosphate Buffer Saline (PBS): 137mM NaCl, 2.7mM KCl, 10mM Na2HPO4, and 1.8mM KH2PO4.
- 1X Red Blood Cell (RBC) lysis buffer: 150mM NH4Cl, 10mM KHCO3, 0.1mM EDTA.
- FACS buffer: 1X PBS containing 3% fetal bovine serum, optional- 0.05% NaN3.
- Trypan blue solution.
- Mouse Fc blocking reagent.
- Fluorescence conjugated anti-mouse antibodies (see Table 1 and 2).
- Flow cytometer and corresponding acquisition software (such as BD LSRFortessa™ and FACS Diva software, BD Bioscience).
- Flow cytometric data analyzer (such as FlowJo, BD Bioscience).
3. Methods
3.1. Collection of Pre-Immunization Serum from the BM Chimeric Rag2-/-γc-/- Mice
All animal works should be performed in accordance with the guidelines set up by the responsible animal authority. The method presented here comply with the appropriate ethical permission (TVA 1435).
- Collect required number of BM chimeric Rag2-/-γc-/- mice (6-8 weeks post BM transplantation, see Note 2) and house them in individually ventilated cages (IVC) with food and water ab libitum and 12h day-night cycle (see Note 3).
- One day before immunization (day -1, Figure 1), collect ~100-200μl of blood from each chimeric mouse by puncturing the lateral tail vein with a 27G needle (see Note 4). Collect the blood in Microvette Z-gel tubes for preparation of serum (see Note 5).
- After blood collection, allow the tube to stand upright for 30min at room temperature.
- Centrifuge at 10,000g for 1.5min at room temperature.
- Collect the serum from the top in a fresh 1.5ml Eppendorf tube. Store the serum at -20oC for later analysis.
3.2. Immunization of BM Chimeric Rag2-/-γc-/- Mice
Perform the steps under aseptic condition. All solution should be sterile (autoclaved/sterile filtered)
- On the day of immunization (day 0, Figure 1), aseptically aliquot sufficient amount of 10% SRBC in a 15ml falcon tube (see Note 6).
- Add 4-5ml of ice cold 1X PBS, gently mix by inverting the tube and centrifuge at 300-400g for 5 min at 4oC. Carefully aspirate the supernatant to remove the raptured and haemolysed RBCs. The supernatant will be red.
- Repeat the wash for another two times until the supernatant is colorless (see Note 7).
- Resuspend with sterile 1X PBS to the initial volume to keep the original packed volume of 10%. Allow to equilibrate at room temperature before injection (see Note 8).
- Inject 150μl of 10% SRBC to each BM chimeric Rag2-/-γc-/- mouse by intraperitoneal (i.p.) injection (see Note 9).
- Return the mouse to its home cage. Observe daily for any adverse effects.
3.3. Detection of Anti-SRBC Antibody in the Serum of the Chimeric Mice After Immunization
- 1.
- One week after immunization (day 7, Figure 1), collect ~200μl blood from each immunized mouse in Microvette Z-gel tubes for preparation of serum as described in section 3.1.
- 2.
- Thaw the pre-immunization sera collected on day -1 on ice.
- 3.
- Place a 96 well V-bottom plate on ice. Serially dilute each serum (both pre-and post-immunization sera) with 1X PBS at 1:10, 1:20 and 1:40 dilutions. Final volume in each well should be 40μl.
- 4.
- Aliquot sufficient amount of 10% SRBC in a 1.5ml Eppendorf tube. Wash three times with 1X PBS as described in section 3.2 (see Note 7).
- 5.
- Add 10μl of 10% SRBC to each well of the 96 well plate containing different dilutions of the serum. Mix well and incubate on ice for 15 min.
- 8.
- Add 150μl of 1X PBS to each well and centrifuge at 300-400g for 5 min at 4oC. Discard the supernatant either by aspiration or forcefully throwing and soaking the excess liquid on the paper towels.
- 9.
- Prepare sufficient amount of the antibody master mix as shown in Table 1 in PBS (see Note 10).
- 10.
- Add 50μl of the antibody master mix to each well (see Note 11). Mix and incubate on ice for 15 min.
- 11.
- Add 150μl of 1X PBS to each well and centrifuge at 300-400g for 5 min at 4oC. Discard the supernatant.
- 12.
- Add 150μl of ice cold PBS to each well. Measure in flow cytometry. The gating strategy is shown in Figure 2A–C. Representative results of the detection of anti-SRBC IgG2b and anti-SRBC IgG1 antibodies in the different serum dilution in comparison to pre-immune serum are shown in Figure 2D and E respectively.
3.4. Analysis of the Immune Response in the BM Chimeric Rag2-/-γc-/- Mice
- Ten days after immunization (day 10, Figure 1), sacrifice the chimeric mice by an approved method of euthanasia. Collect the spleen in ice cold 1X PBS.
- Prepare single cell suspension from spleen (see Note 12). Place the spleen on a 40μm cell strainer on top of a 50ml Falcon tube. Smash the tissue using the piston of a 2ml syringe and collect the tissue homogenate with 5ml ice cold PBS.
- Centrifuge at 300-400g for 5 min at 4oC. Remove the supernatant by decanting.
- Add 2ml/spleen 1X RBC lysis solution and resuspend completely. Keep at room temperature for 5 min (see Note 13).
- Add 2ml of ice cold FACS buffer (see Note 14). Centrifuge at 300-400g for 5 min at 4oC. Remove the supernatant. Repeat RBC lysis step if the tissue still appears reddish.
- Resuspend the tissue in 3ml ice cold FACS buffer. Pipette slowly to avoid clump formation.
- Filter the suspension using 5ml round bottom FACS tubes containing cell strainer cap.
- Count the cells using cell counting chambers. Use Trypan blue to exclude the dead cells.
- Aliquot ~ 5x10⁶ cells/staining in FACS tubes.
- Dilute sufficient mouse Fc block at 1:100 in FACS buffer. Add 50μl/tube and incubate for 10-15 min at 4oC. Wash with 1ml ice cold FACS buffer.
- Prepare sufficient amount of the antibody master mixes as shown in Table 2 in FACS buffer (see Note 10).
- Add 50μl/tube the antibody master mixes and incubate for 10-15 min at 4oC. Wash with 1ml ice cold FACS buffer.
- Add 200μl of ice cold FACS buffer to each tube. Measure them in flow cytometry. Keep the tubes always placed on ice until measurement. The gating strategy and a representative result is shown in Figure 3A–H. The ratio of CD45.1+ and CD45.2+ B cells in the total spleen (Figure 3E) and those participating in the GC (Figure 3H) can be compared to identify any GC related effect of the genetically modified donor in B cells (see Note 15).
4. Notes
- Always use unfixed SRBC for immunization purpose. Fixed (such as glutaraldehyde fixed) SRBC has higher stability but does not elicit effective immune response.
- Before proceeding to immunization experiment, stable engraftment of donor cells should be analyzed in the BM transplanted Rag2-/-γc-/- mice. Typically, it takes 8 weeks after transplantation [5]. The presence of CD45.1+ and CD45.2+ immune cells (B, T, myeloid, NK-cells) should be detected in the blood of the successfully transplanted mice. If the relative percentage of CD45.1+ and CD45.2+ engrafted cells in different compartments remain similar over weeks (e.g. 6 and 8 weeks after transplantation), a stable transplantation is achieved.
- If the animal breeding and maintenance facility is different from the animal house where the experiment will be carried out, bring the animals to the experimental facility at least 7 days prior to the start of the experiment. This helps the mice to acclimatize to the new environment and reduces variability within and between experiments.
- Before blood collection, place the mouse under a heat lamp to warm it up. This promotes peripheral vasodilation and allows better identification of the blood vessel. Securely restrain the mouse in the injection chamber and dip the tail in warm water (but not hot water) for 1-2 min. The lateral veins should be clearly visible.
- After blood collection, immediately compress the vein with a paper towel until bleeding is stopped. Never put an already bled mouse under the heating lamp or in warm water as this might cause further bleeding from the punctured vein.
- The SRBC should always be aliquoted in excess amount to allow room for losses while transferring to injection syringe. Always count two mice extra when calculating the total amount of SRBC required.
- SRBC has lower shelf life (around 1 month from the date of production). However, it can still be successfully used afterwards provided the initial starting material is increased by ~20% every week after the date of expiration. Initial washes with PBS will produce red supernatant due to hemolysed RBCs. But after 2-3 washes, the supernatant should turn colorless. If this is not the case after 3-4 washes, do not use the old SRBC as the percentage of intact RBC would be too less and immunization may be unsuccessful.
- Do not inject cold solutions to the animals as this might cause sudden decrease in body temperature and may lead to death. First aliquot reagent/injectable into required quantity and allow sufficient time to reach to room temperature before applying to mice.
- Antibodies with different fluorochrome conjugations other than those mentioned in the tables can also be used. The users can make their own panel of colors.
- The antibody master mixture should always be prepared in excess amount to allow room for losses due to pipetting.
- If intended, half of the spleen tissue can be fixed in 4% paraformaldehyde for microscopic analysis of GC reaction. Rest half of the spleen will be enough for flow cytometric analysis of GC.
- Complete erythrocyte lysis is essential for the analysis. Incomplete lysis will result in excessive cell count due to RBCs and underrepresent the white blood cells (WBC) during flow cytometry. Resuspend the tissue very well in RBC lysis buffer without any visible clumps and allow the cells to sit at room temperature. Repeat the step if necessary or increase the volume of lysis buffer used. However, do not allow the lysis to progress for >10min as this may negatively affect the viability of the other cells.
- Using buffers containing some amount of protein improves cell viability. It is, therefore, recommended to use FACS buffer over PBS during the cell isolation procedure.
- In addition to the markers listed in Table 2, inclusion of two more markers namely, CXCR4 and CD86 can distinguish the dark zone (DZ, CXCRhi CD86lo) and the light zone (LZ, CXCR4lo CD86hi) of GC thereby making it possible to compare the relative percentages of CD45.1 and CD45.2 positive cells in these two compartments.
- The percentage of reconstitution achieved by CD45.1 and CD45.2 positive cells may vary depending on many factors. Even when a 1:1 mixture of CD45.1+ WT and CD45.2+ WT cells are injected, the final reconstitution percentage may not be 50:50. There could be several reasons- for e.g. one genotype of cell is better tolerated than the other. Therefore, for such experiments, ~10-20% variation can be expected (55:45 to 60:40). In case, one particular genotype consistently shows reduced reconstitution, it is indicative of some intrinsic problem of that particular strain in one or many stages/processes of hematopoiesis.
- When the ratio of CD45.1+ and CD45.2+ cells in GC vary considerably from that in total spleen, a GC specific defect is intriguing (either hyper-activated or hypo-activated in participating in GC).
Acknowledgement
The author acknowledges Ms. Gabriela Allies for the technical help and CRC 1279 for funding the author’s position.
References
- Shlomchik MJ, Luo W and Weisel F (2019) Linking signaling and selection in the germinal center. Immunol Rev 288(1):49-63. [CrossRef]
- Victora GD and Nussenzweig MC (2012) Germinal centers. Annu Rev Immunol 30:429-457. [CrossRef]
- Setz CS et al. (2019) Pten controls B-cell responsiveness and germinal center reaction by regulating the expression of IgD BCR. EMBO J 38(11). [CrossRef]
- Schmidt-Supprian M and Rajewsky K (2007) Vagaries of conditional gene targeting. Nat Immunol 8(7):665-668. [CrossRef]
- Ferreira FM et al. (2019) Bone marrow chimeras-a vital tool in basic and translational research. J Mol Med (Berl) 97(7):889-896. [CrossRef]
- Down JD, Tarbell NJ, Thames HD and Mauch PM (1991) Syngeneic and allogeneic bone marrow engraftment after total body irradiation: dependence on dose, dose rate, and fractionation. Blood 77(3):661-669.
- Peake K et al. (2015) Busulfan as a myelosuppressive agent for generating stable high-level bone marrow chimerism in mice. J Vis Exp (98):e52553. [CrossRef]
- Floersheim GL and Elson LA (1961) [Restoration of hematopoiesis following a lethal dose of dimethyl myleran by isologic bone marrow transplantation in mice. Experiments on modification of intolerance to homologous bone marrow by 6-mercaptopurine, aminochlorambucil and cortisone]. Acta Haematol 26:233-245. [CrossRef]
- Czechowicz A, Kraft D, Weissman IL and Bhattacharya D (2007) Efficient transplantation via antibody-based clearance of hematopoietic stem cell niches. Science 318(5854):1296-1299. [CrossRef]
- Rauschmeier R et al. (2022) Bhlhe40 function in activated B and TFH cells restrains the GC reaction and prevents lymphomagenesis. J Exp Med 219(2). [CrossRef]
- Okimura T and Nigo Y (1986) Stress and immune responses. I. Suppression of T cell function in restraint-stressed mice. Jpn J Pharmacol 40(4):505-511. [CrossRef]
- Reiche EM, Nunes SO and Morimoto HK (2004) Stress, depression, the immune system, and cancer. Lancet Oncol 5(10):617-625. [CrossRef]
Figure 1.
Scheme showing the experimental time line for immunization and analysis of GC in the competitive BM chimera.
Figure 1.
Scheme showing the experimental time line for immunization and analysis of GC in the competitive BM chimera.
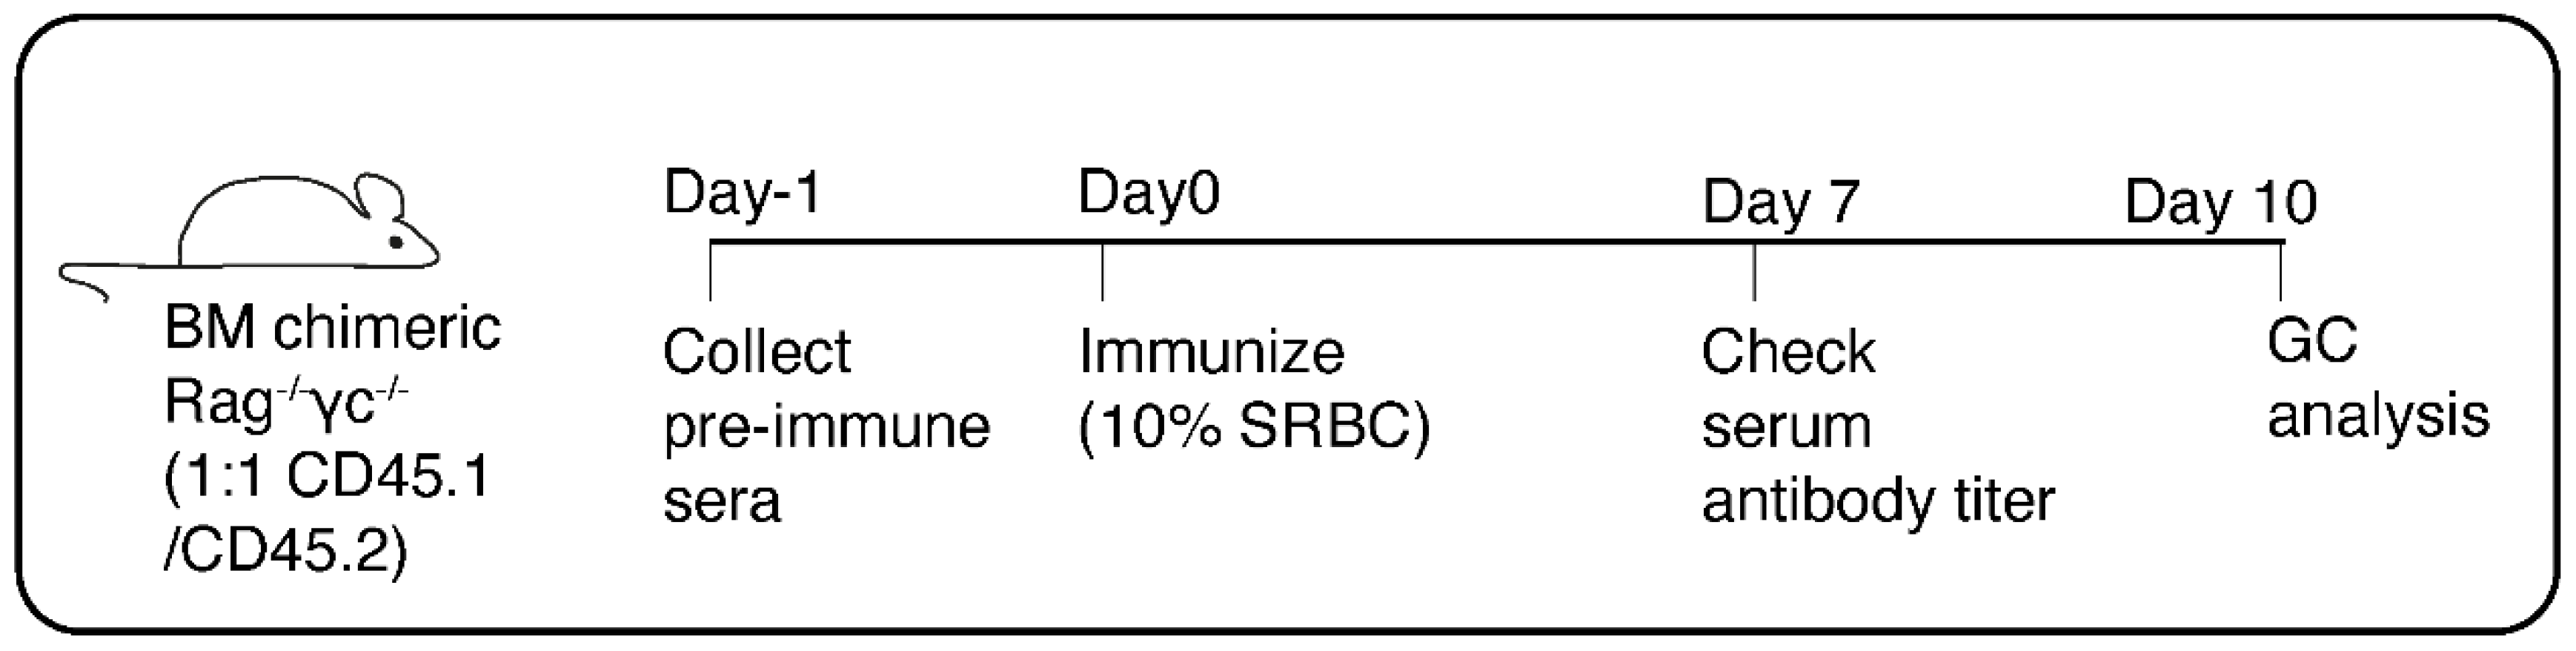
Figure 2.
Gating strategy for the analysis of anti-SRBC antibody titer in the sera of the immunized chimeric mice. A. The total population is plotted as side scatter area (SSC-A) vs. forward scatter area (FSC-A). Intact SRBCs are gated (‘SRBC’) as shown. B. Singlets (FSC) are gated from the parental gate ‘SRBC’ by plotting the forward scatter height (FSC-H) vs. forward scatter width (FCS-W). C. Singlets (SSC) are gated from the parental gate ‘Singlets (FSC)’ by plotting the side scatter height (SSC-H) vs. side scatter width (SSC-W). D. Singlets (SSC) are plotted as histogram for IgG2b expression and overlaid with different serum dilutions and pre-immune serum. This allows the comparison of relative level of anti-SRBC IgG2b antibody in the serum before and after immunization. E. Singlets (SSC) are plotted as histogram for IgG1 expression and overlaid with different serum dilutions and pre-immune serum. This allows the comparison of relative level of anti-SRBC IgG1 antibody in the serum before and after immunization.
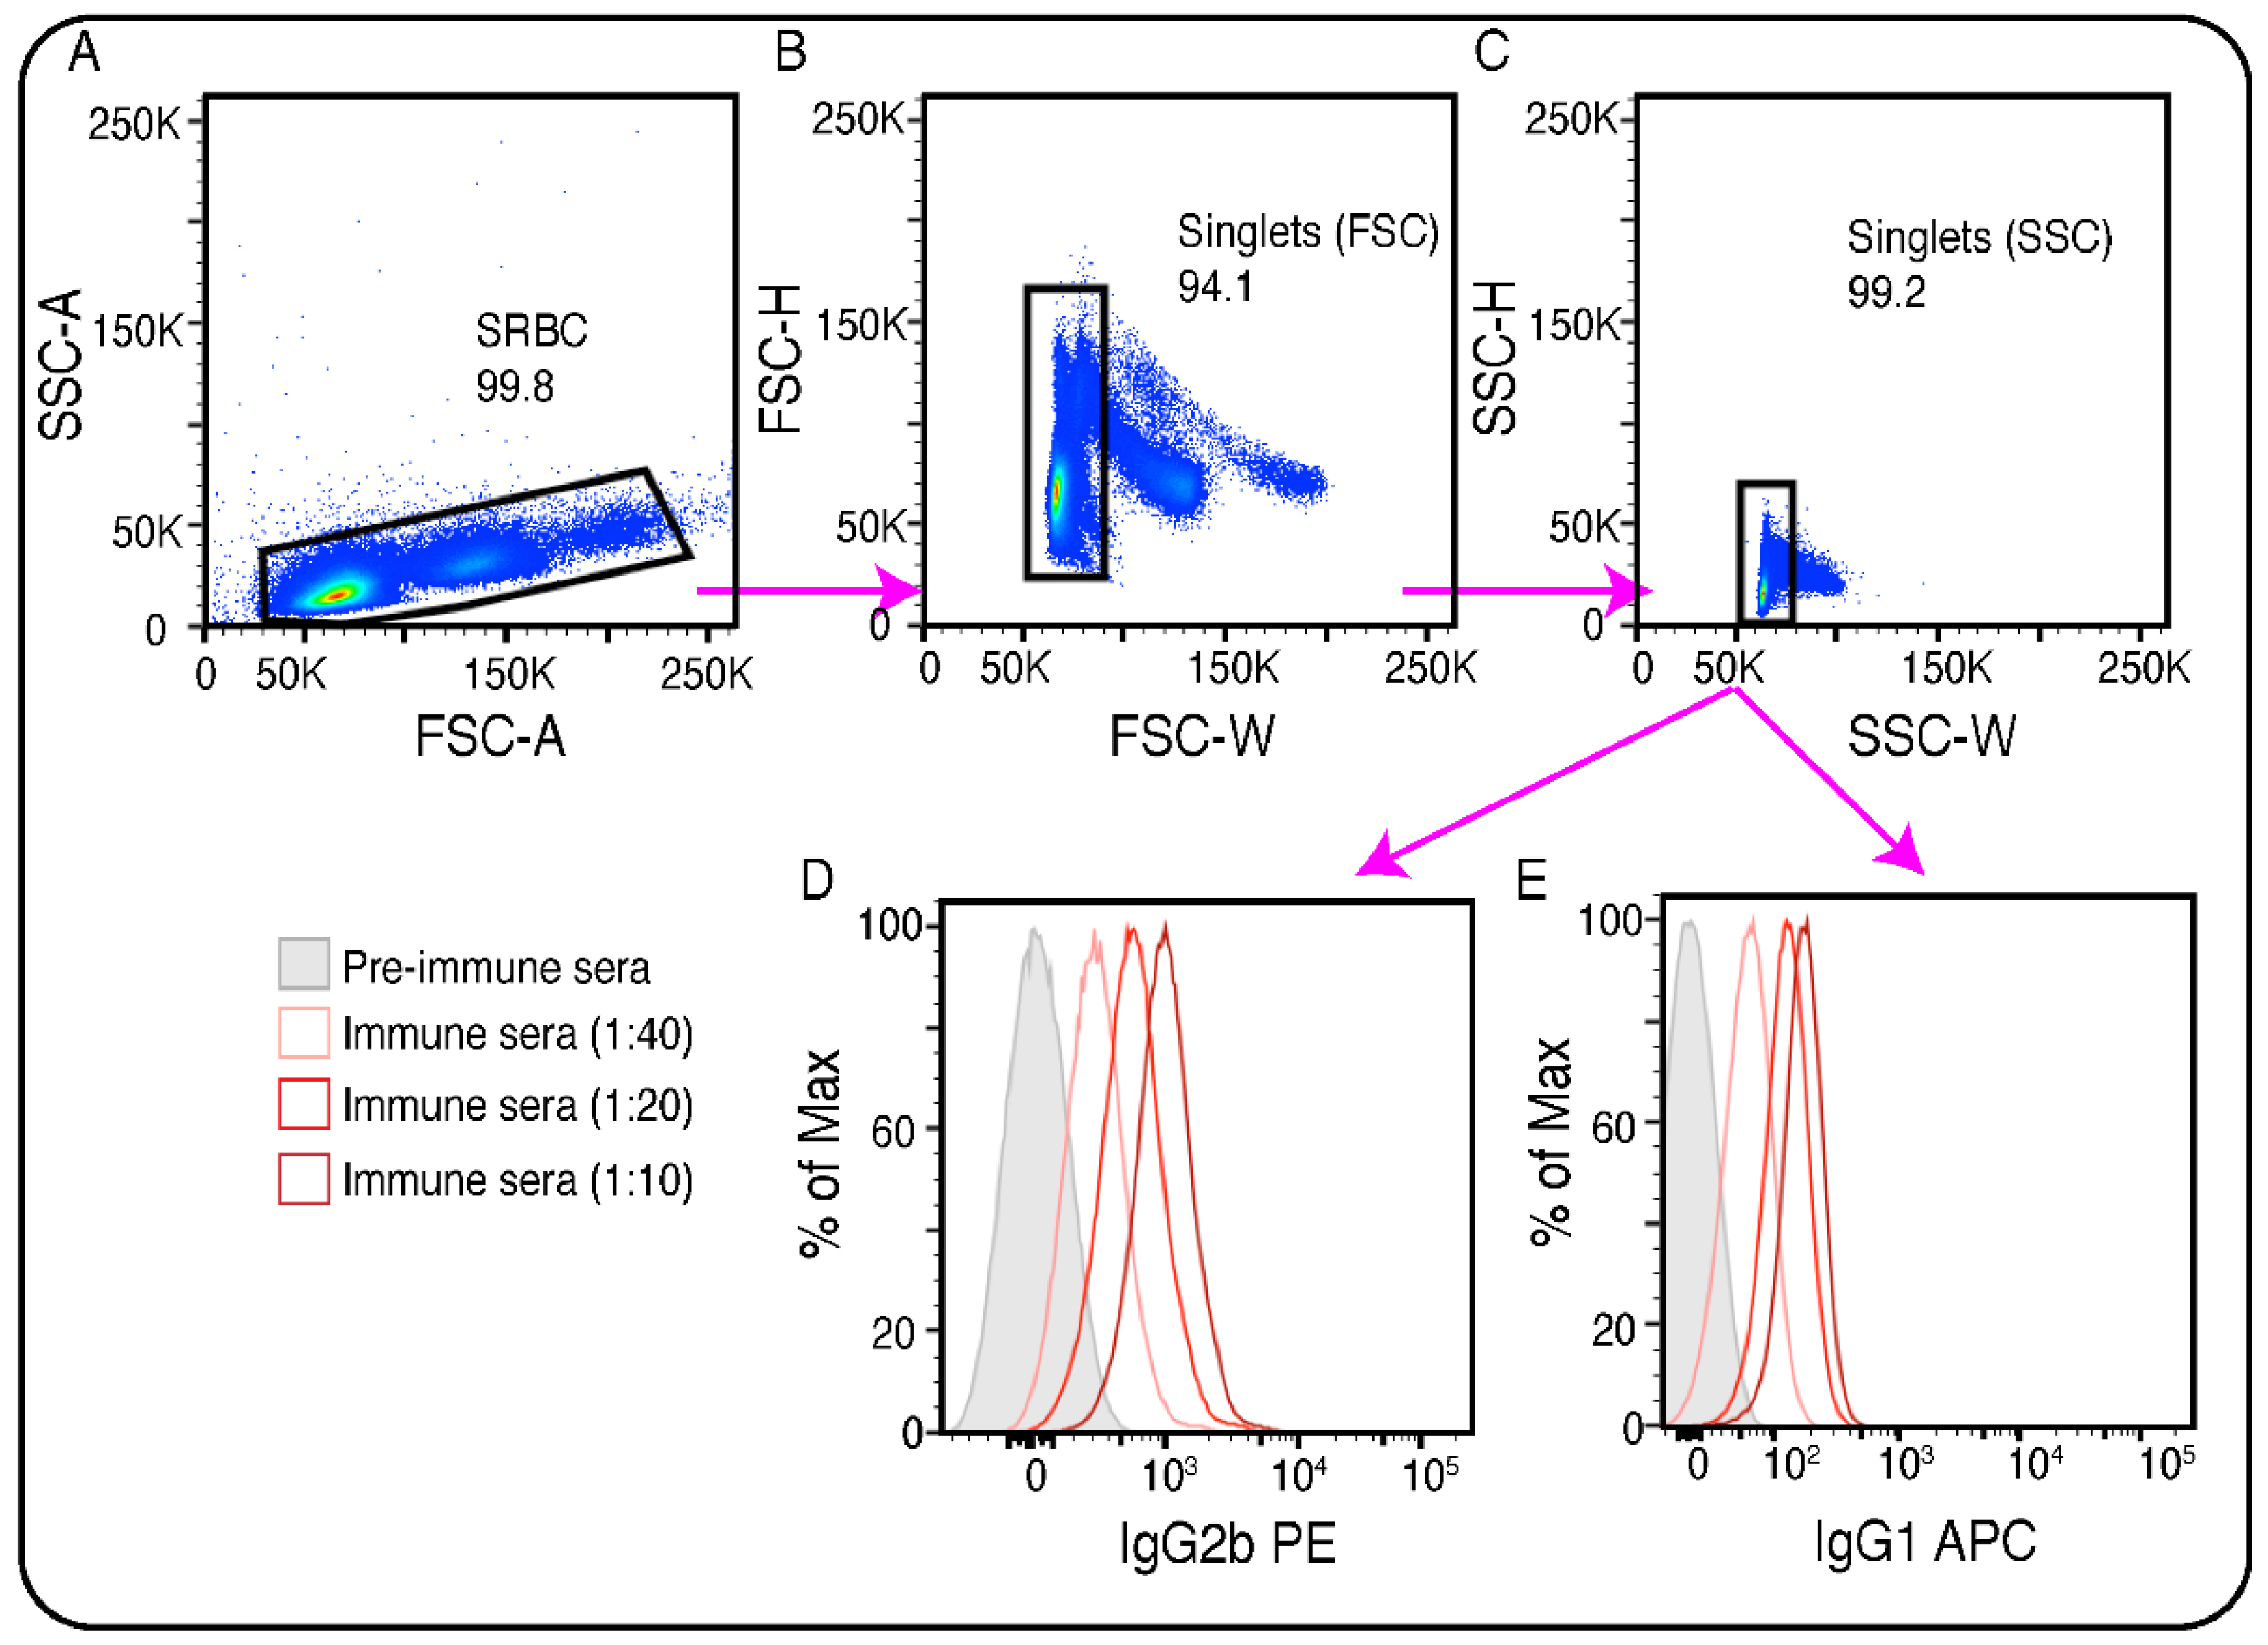
Figure 3.
Gating strategy for the analysis of GC reaction in BM chimeric Rag2-/-γc-/- mice 10 days after immunization. A. The total cell population is plotted as SSC-A vs. FSC-A. Lymphocytes are gated as shown. B. Single cells (FSC) are gated from the parental gate ‘Lymphocytes’ by plotting the FSC-H vs. FCS-W. C. Single cells (SSC) are gated from the parental gate ‘Single cells (FSC)’ by plotting the SSC-H vs. SCS-W. D. Single cells (SSC) are plotted as SSC-H vs. CD19. CD19+ cells are gated as B cells. E. B-Cells are plotted as CD45.2 vs. CD45.1 expression. This plot shows the efficiency of the CD45.1 and CD45.2 expressing BM HSCs to reconstitute the B cell compartment in the spleen of the recipient Rag2-/-γc-/- mice (see Note 16). F. B-Cells are further plotted as CD38 vs. CD95 expression. Activated B cells are gated as CD38- CD95+ cells. G. Activated B cells are plotted as histogram for GL7 expression (a marker of GC). Cells having expression level >103 are gated as GL7+. H. GL7+ cells (those eventually participating in GC) are plotted as CD45.2 vs. CD45.1 expression. This plot shows the efficiency of the CD45.1 and CD45.2 derived B cells to participate in GC reaction (see Note 17).
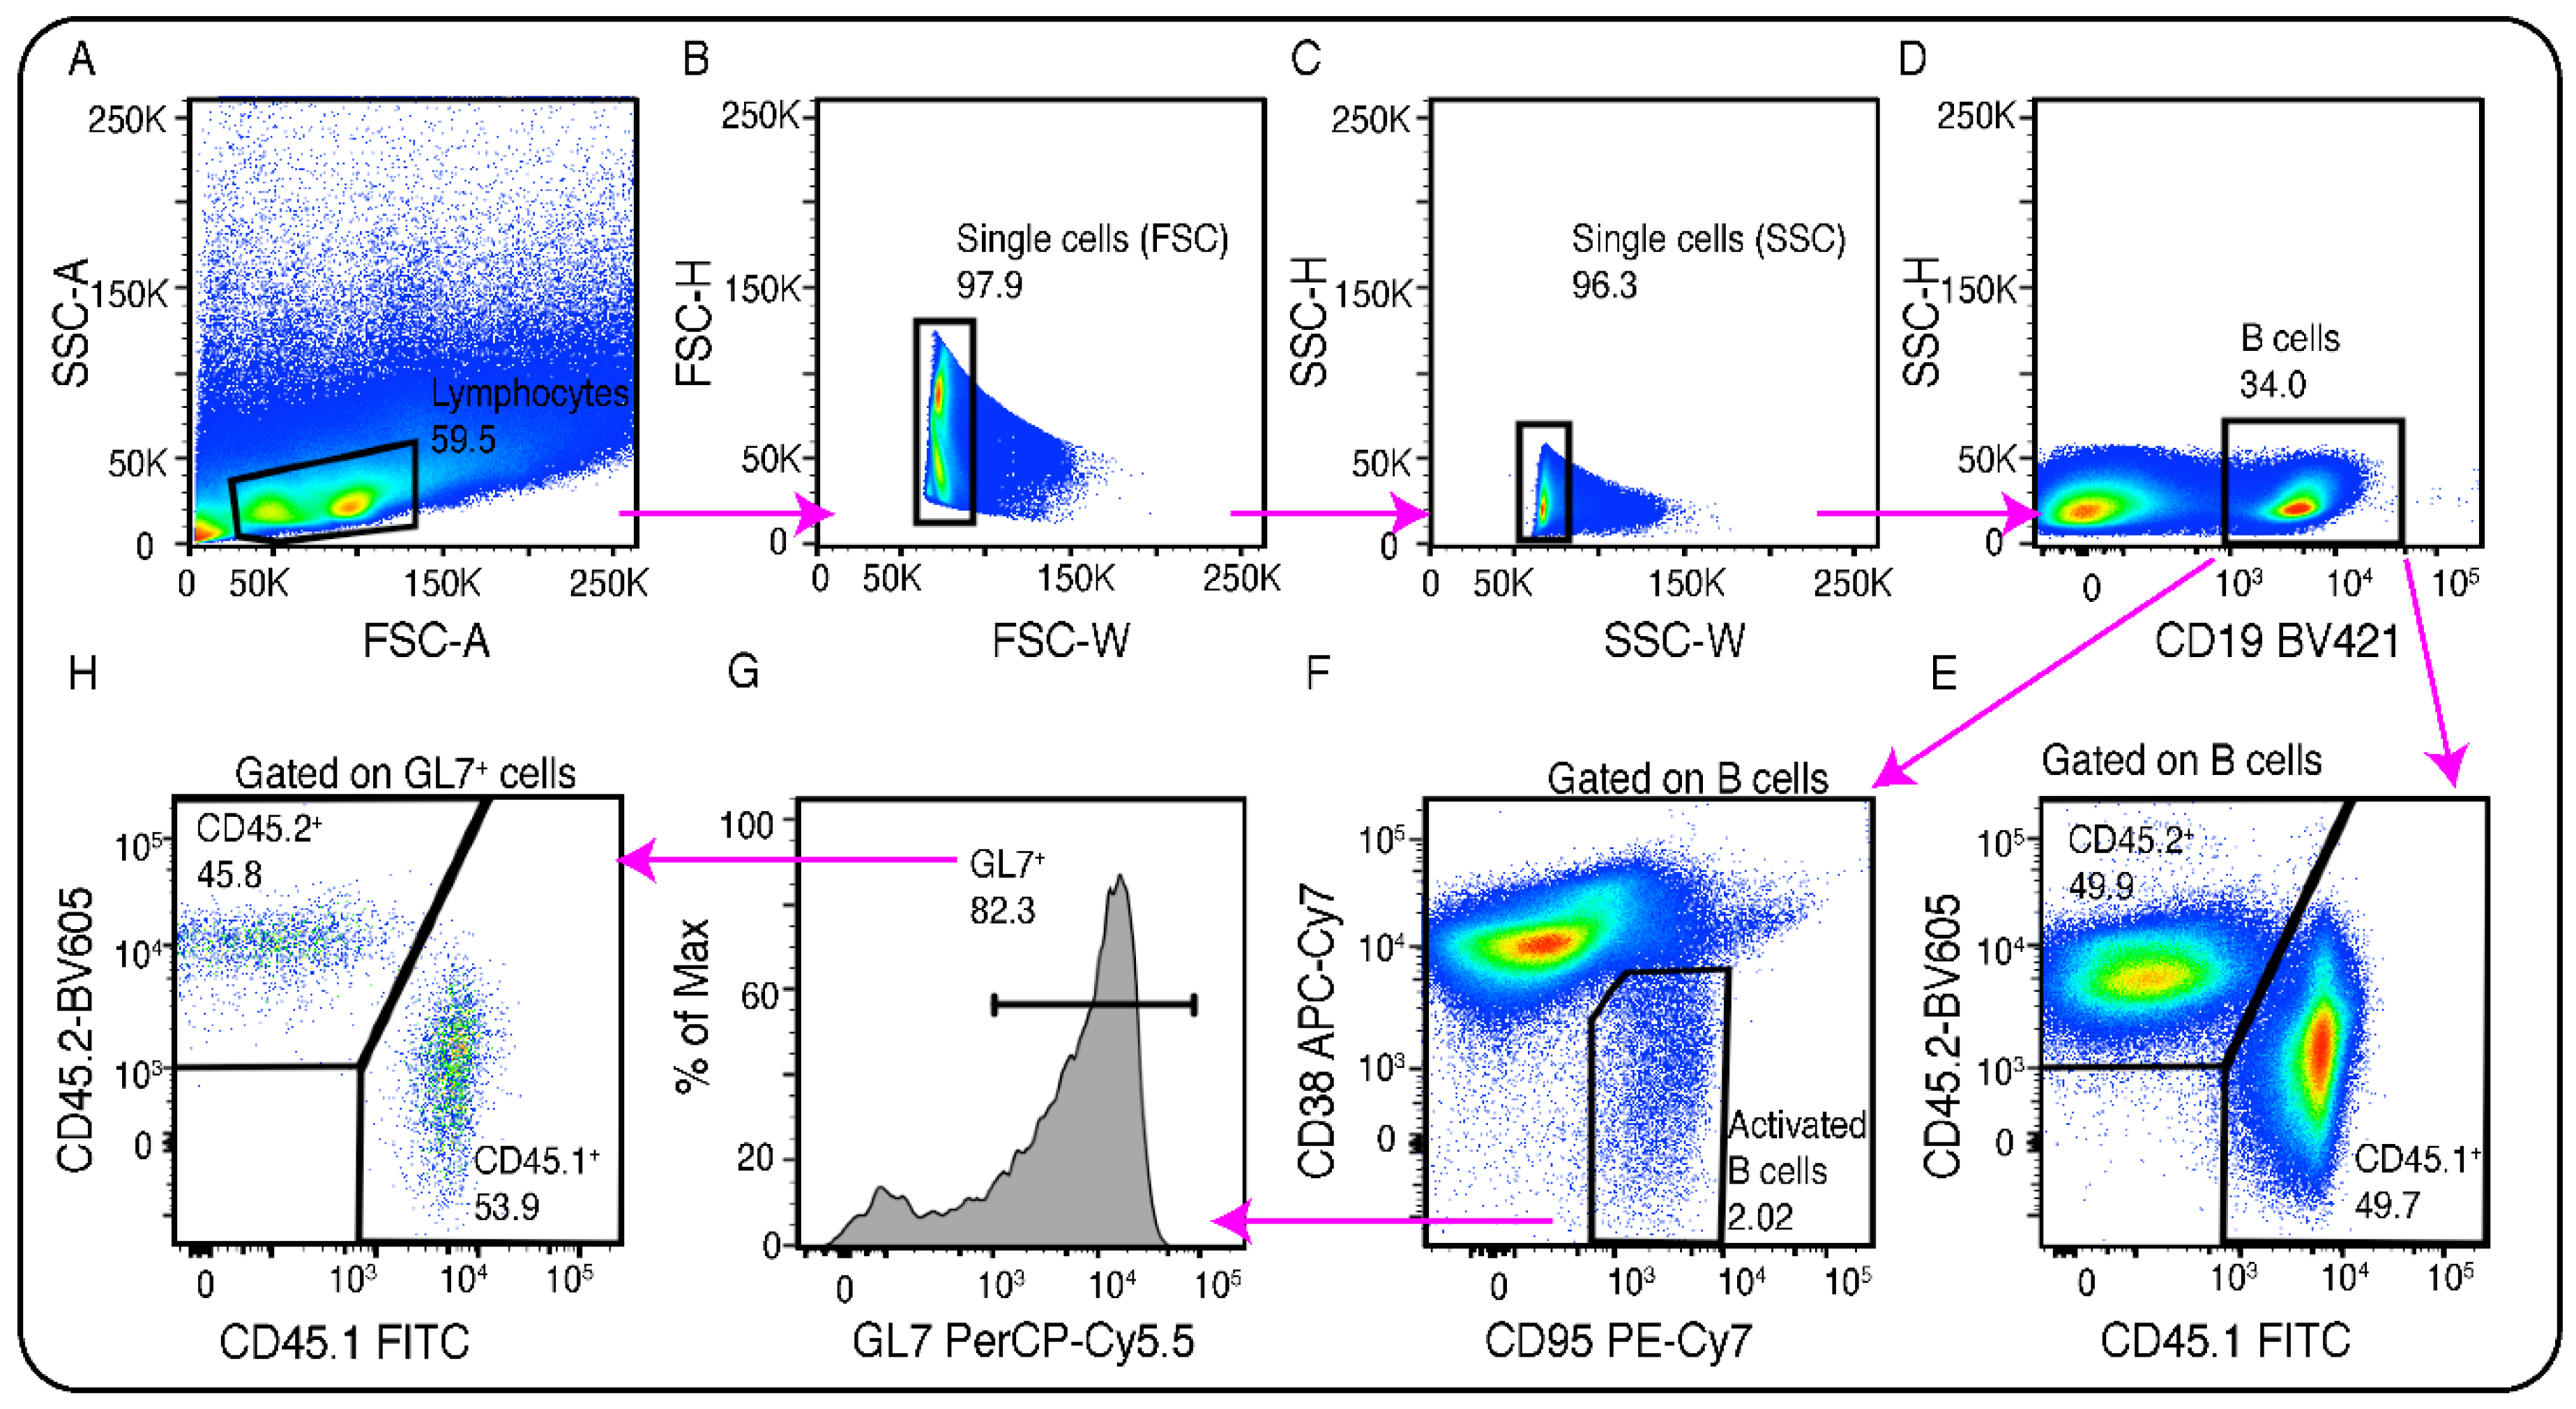

Table 1.
Antibody panel for the analysis of anti-SRBC antibody in serum by flow-cytometry.
| Serum Panel 1 | Clone No. | Stock concentration | Final concentration |
|---|---|---|---|
| IgM efluor 450 | eB121-15F9 | 0.2mg/ml | 0.002mg/ml |
| IgG1 FITC | RMG1-1 | 0.5mg/ml | 0.005mg/ml |
| IgG2b PE | Polyclonal | 0.5mg/ml | 0.0025mg/ml |
| IgG2a APC | Polyclonal | 0.5mg/ml | 0.0025mg/ml |
Table 2.
Antibody panel for the analysis of GC by flow-cytometry.
| GC Panel 1 | Clone No. | Stock concentration | Final concentration |
|---|---|---|---|
| CD19 BV421 | 6D5 | 0.2mg/ml | 0.001mg/ml |
| CD38 APC-Cy7 | 90 | 0.2mg/ml | 0.002mg/ml |
| CD95 PE-Cy7 | Jo2 | 0.2mg/ml | 0.002mg/ml |
| GL7 PerCP-Cy5.5 | GL7 | 0.2mg/ml | 0.002mg/ml |
| CD45.2 BV605 | 104 | 0.2mg/ml | 0.002mg/ml |
| CD45.1 FITC | A20 | 0.5mg/ml | 0.0025mg/ml |
Disclaimer/Publisher’s Note: The statements, opinions and data contained in all publications are solely those of the individual author(s) and contributor(s) and not of MDPI and/or the editor(s). MDPI and/or the editor(s) disclaim responsibility for any injury to people or property resulting from any ideas, methods, instructions or products referred to in the content. |
© 2024 by the author. Licensee MDPI, Basel, Switzerland. This article is an open access article distributed under the terms and conditions of the Creative Commons Attribution (CC BY) license (https://creativecommons.org/licenses/by/4.0/).
Copyright: This open access article is published under a Creative Commons CC BY 4.0 license, which permit the free download, distribution, and reuse, provided that the author and preprint are cited in any reuse.


