
Submitted:
12 December 2024
Posted:
14 December 2024
You are already at the latest version
Abstract
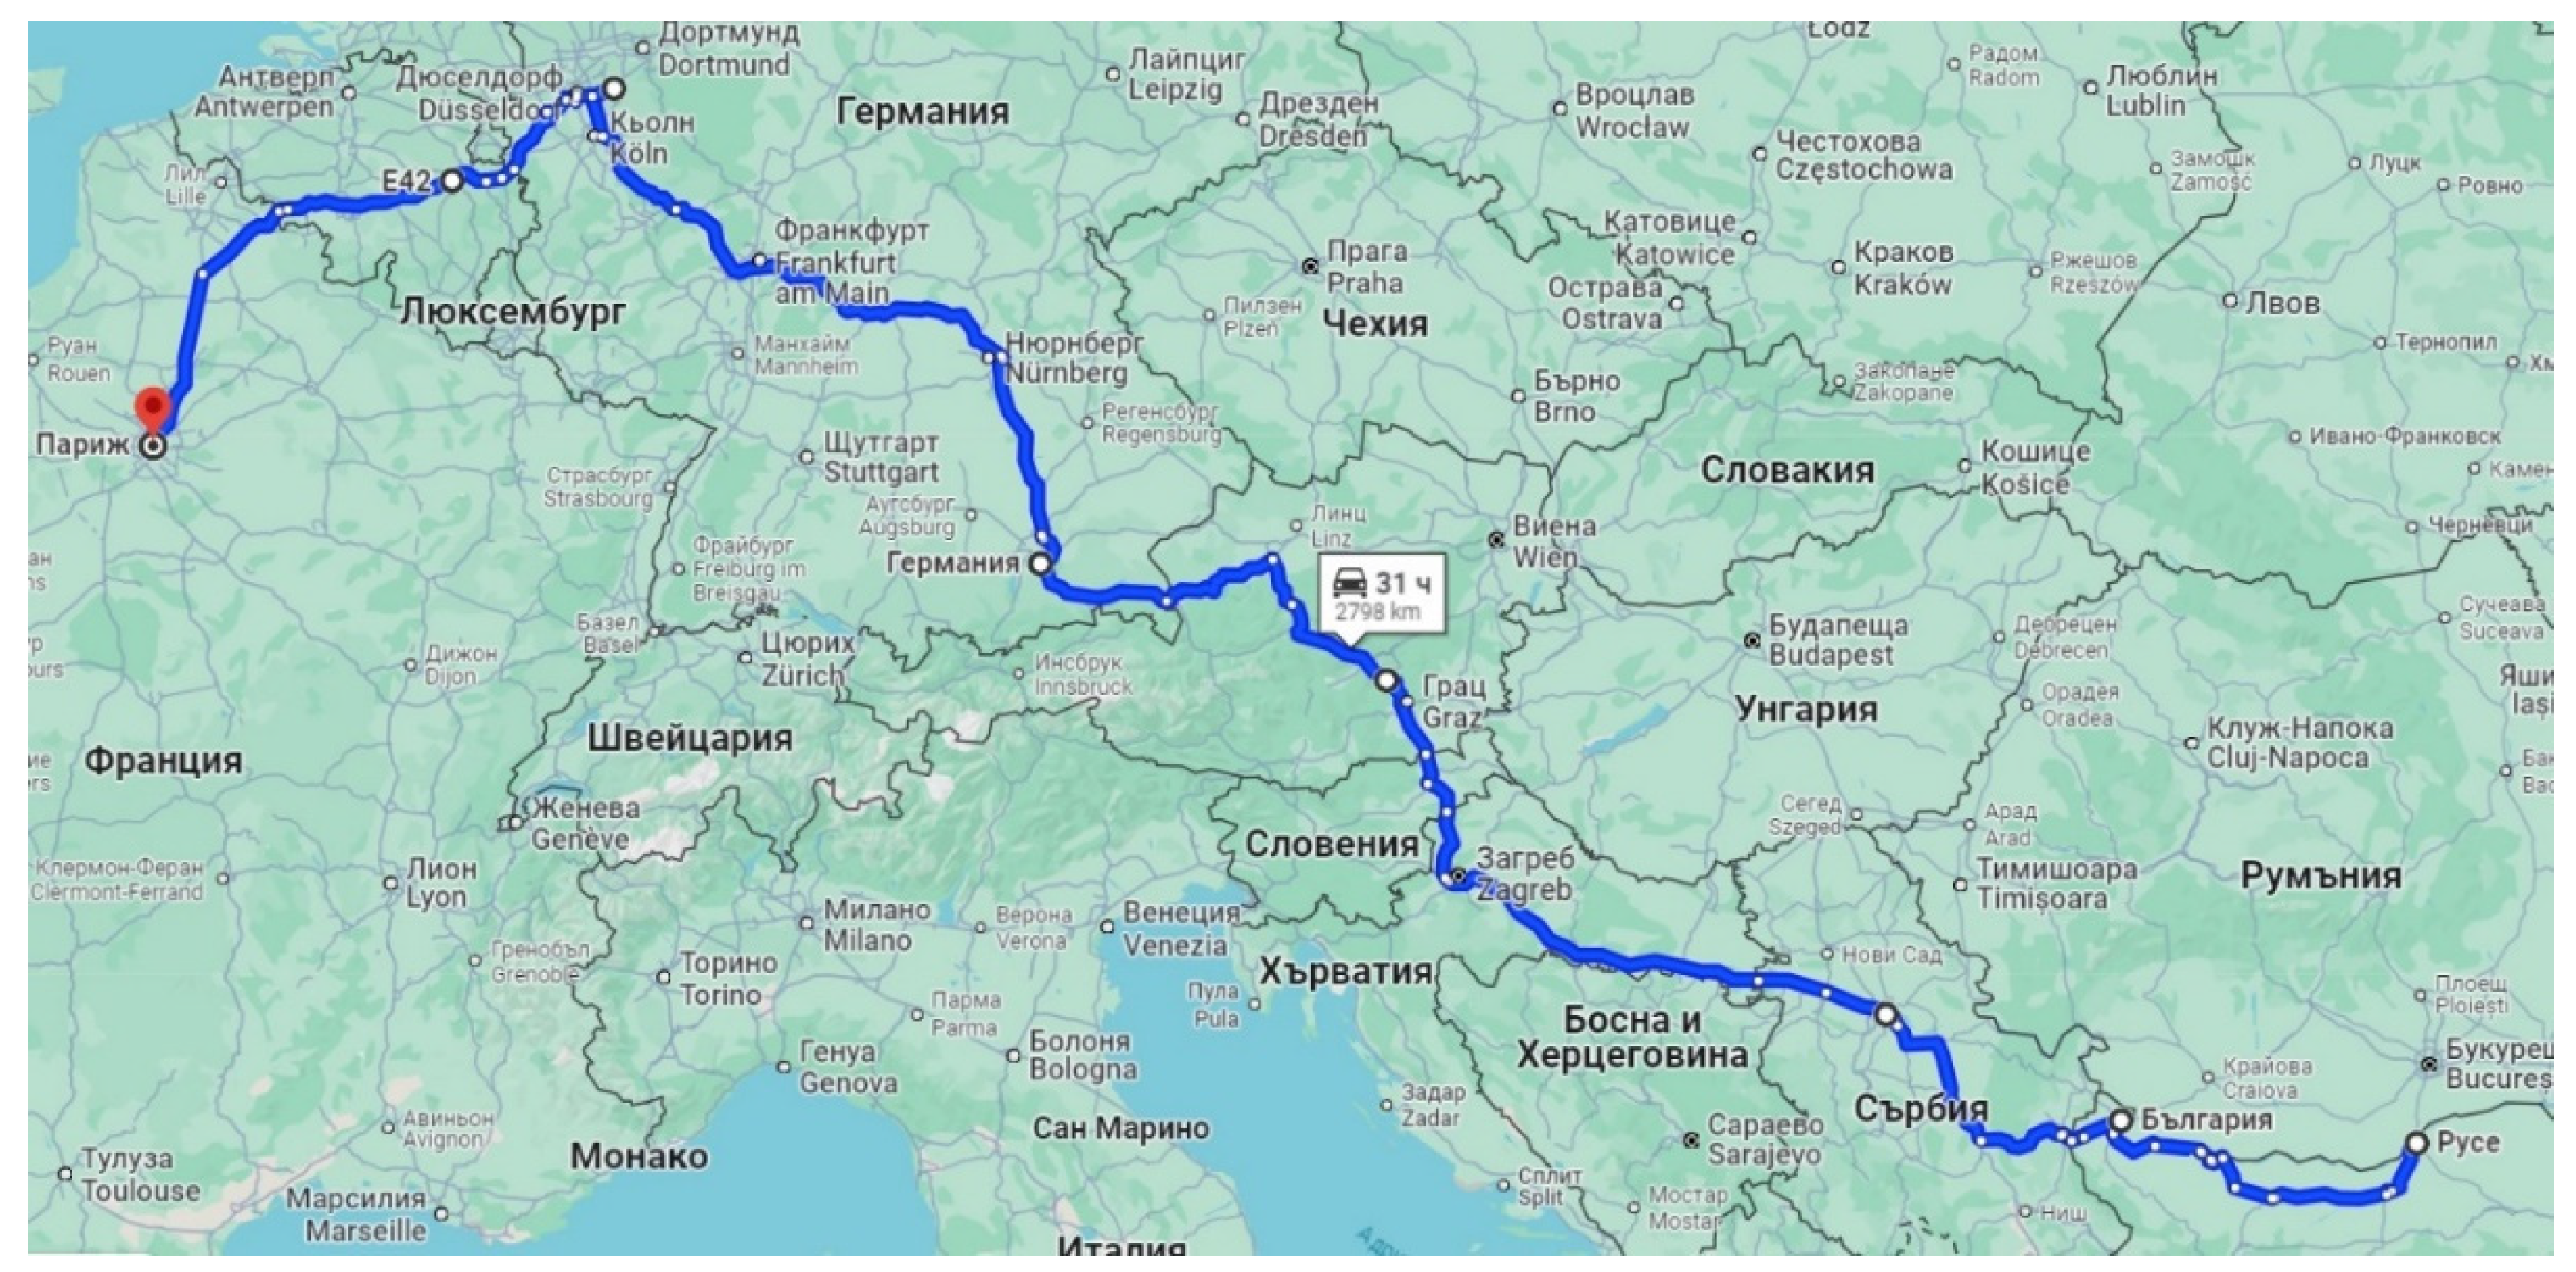
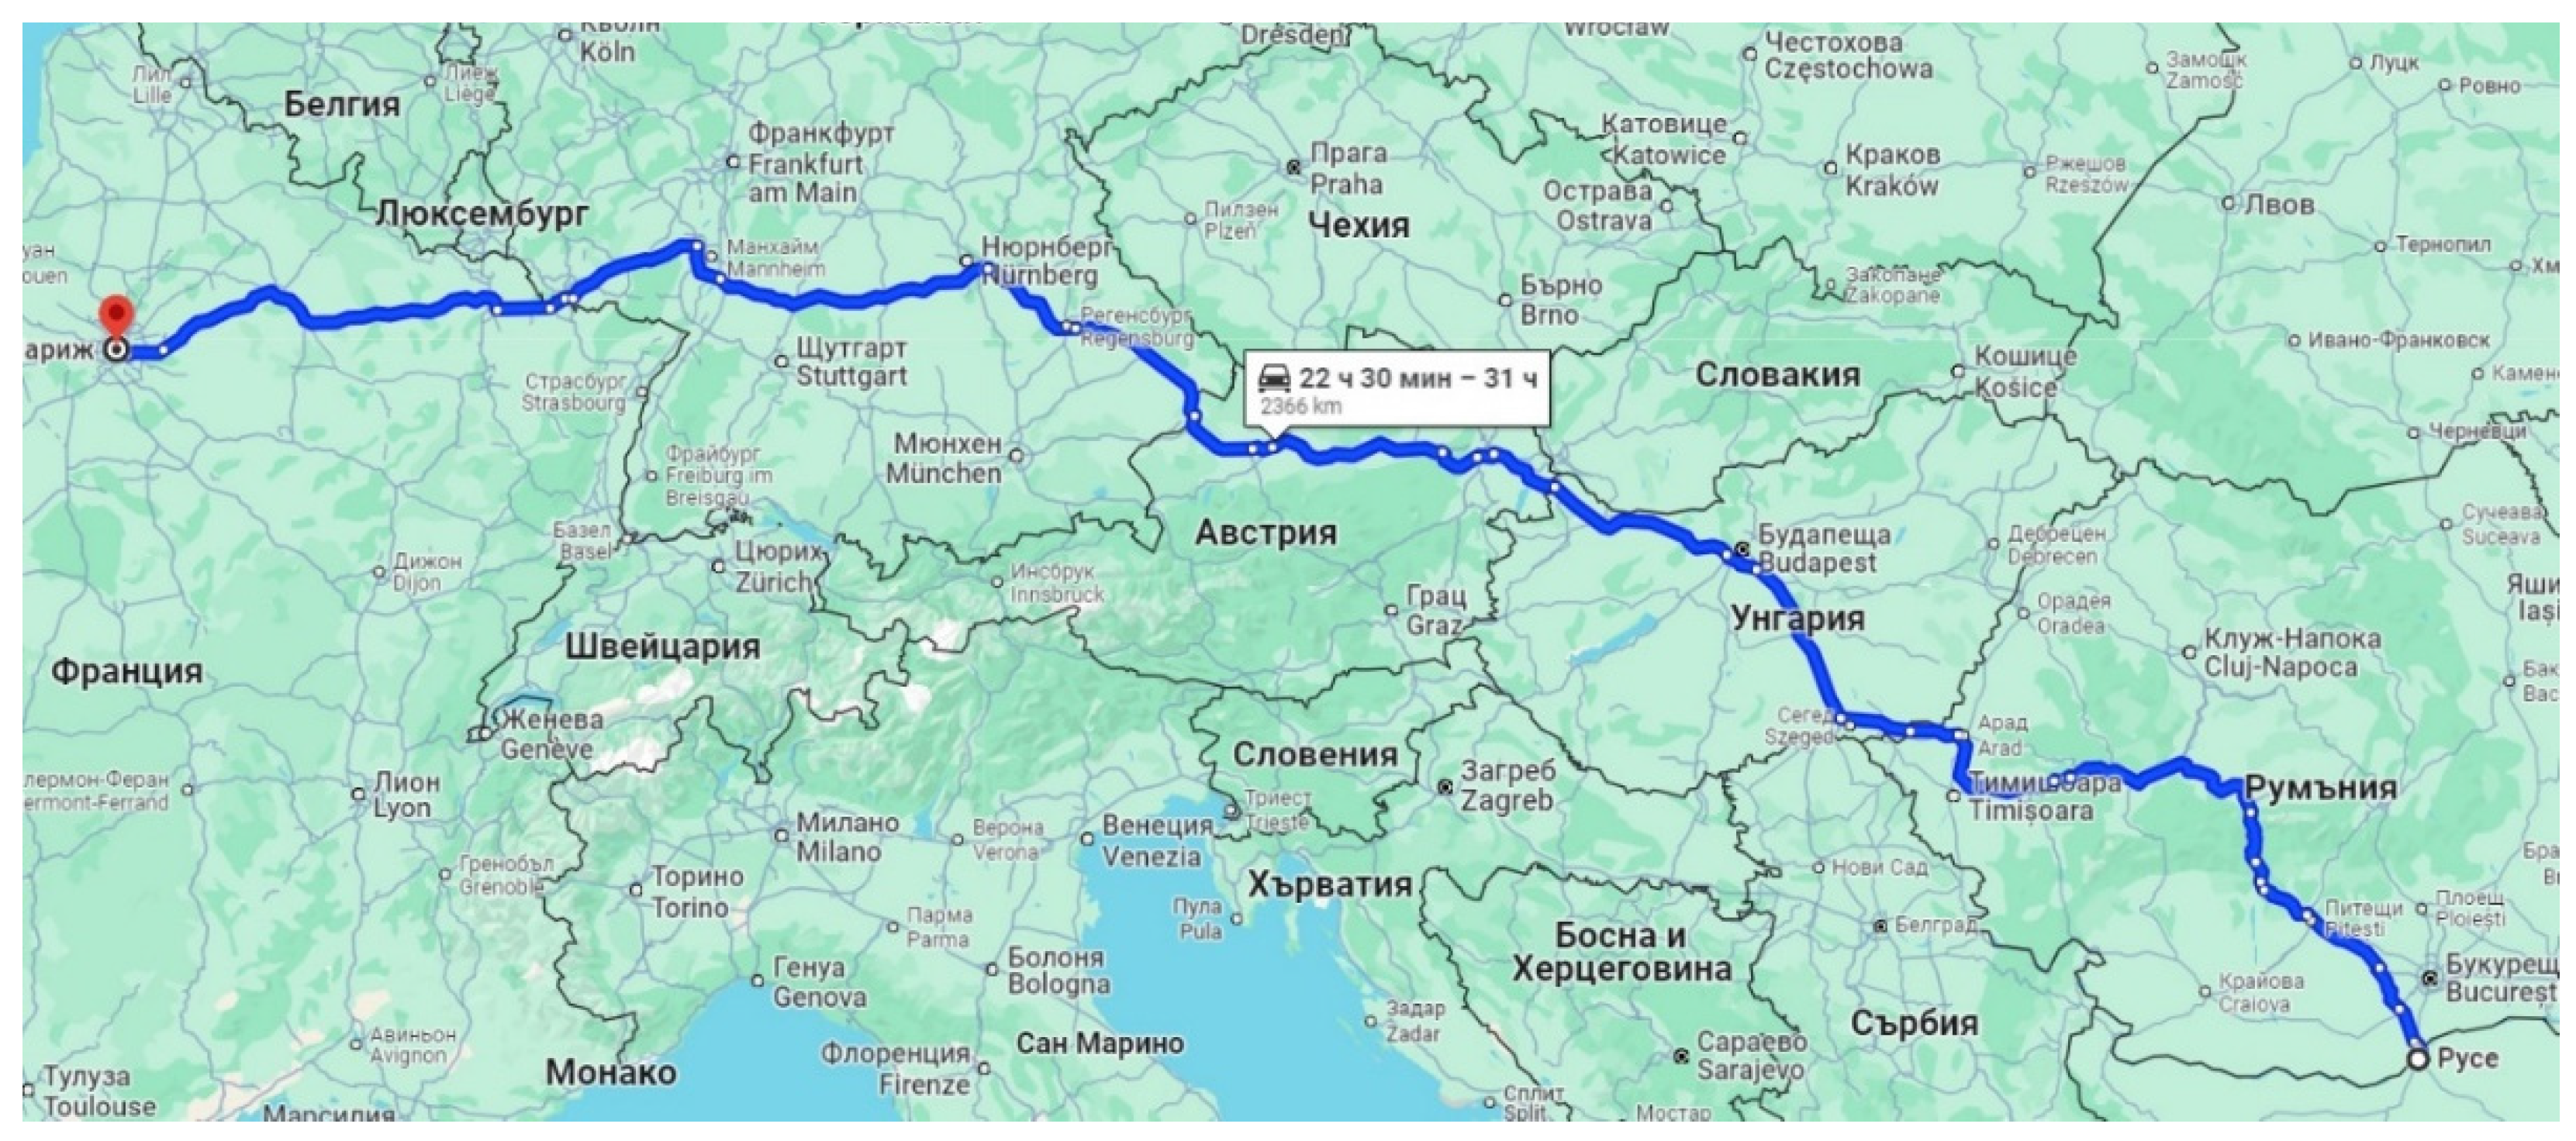
This study examines the challenges of traveling with an electric vehicle (EV) over a distance exceeding 2,000 km from Bulgaria to France. A specific methodology was developed for the study, through which a route and an EV were selected. The findings indicate an average energy consumption of approximately 0.18 kWh/km when carrying a load of about 240 kg. The research highlighted various challenges faced by electric vehicle drivers, such as identifying charging infrastructure and managing charging processes. As a result of the research, solutions aimed at enhancing the charging conditions for electric vehicles and mitigating driver uncertainty are proposed.
Keywords:
1. Introduction
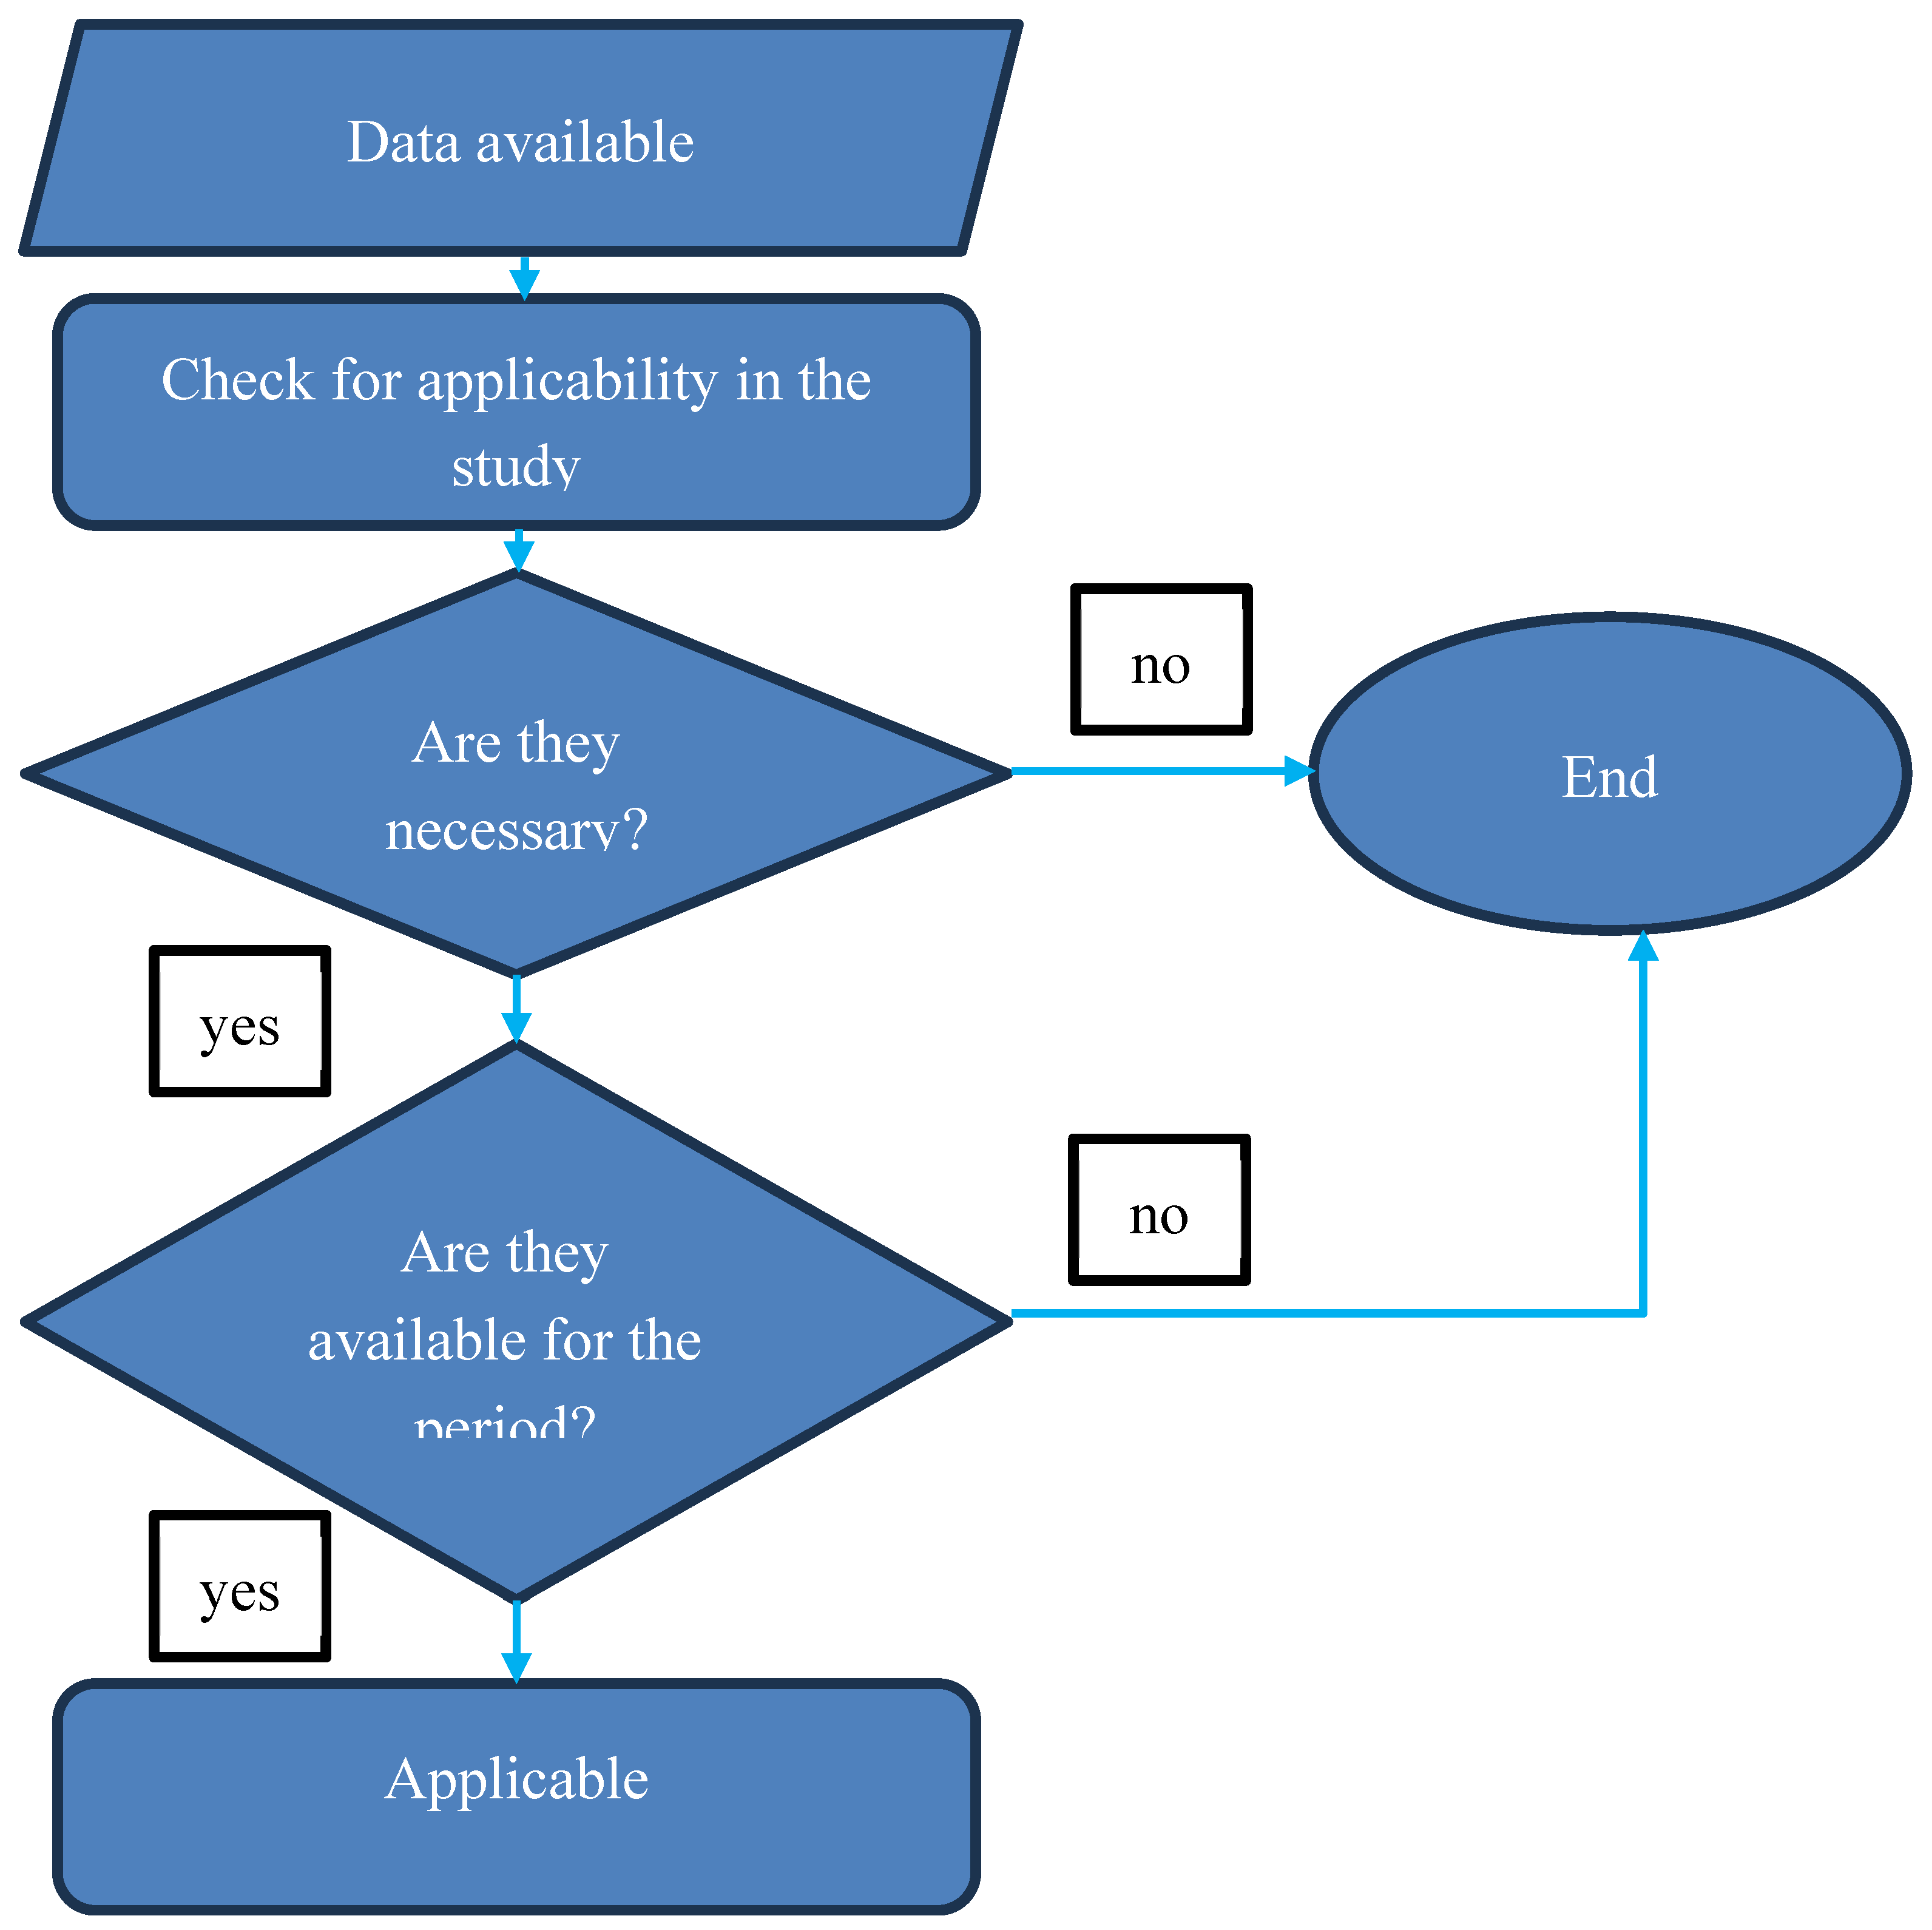
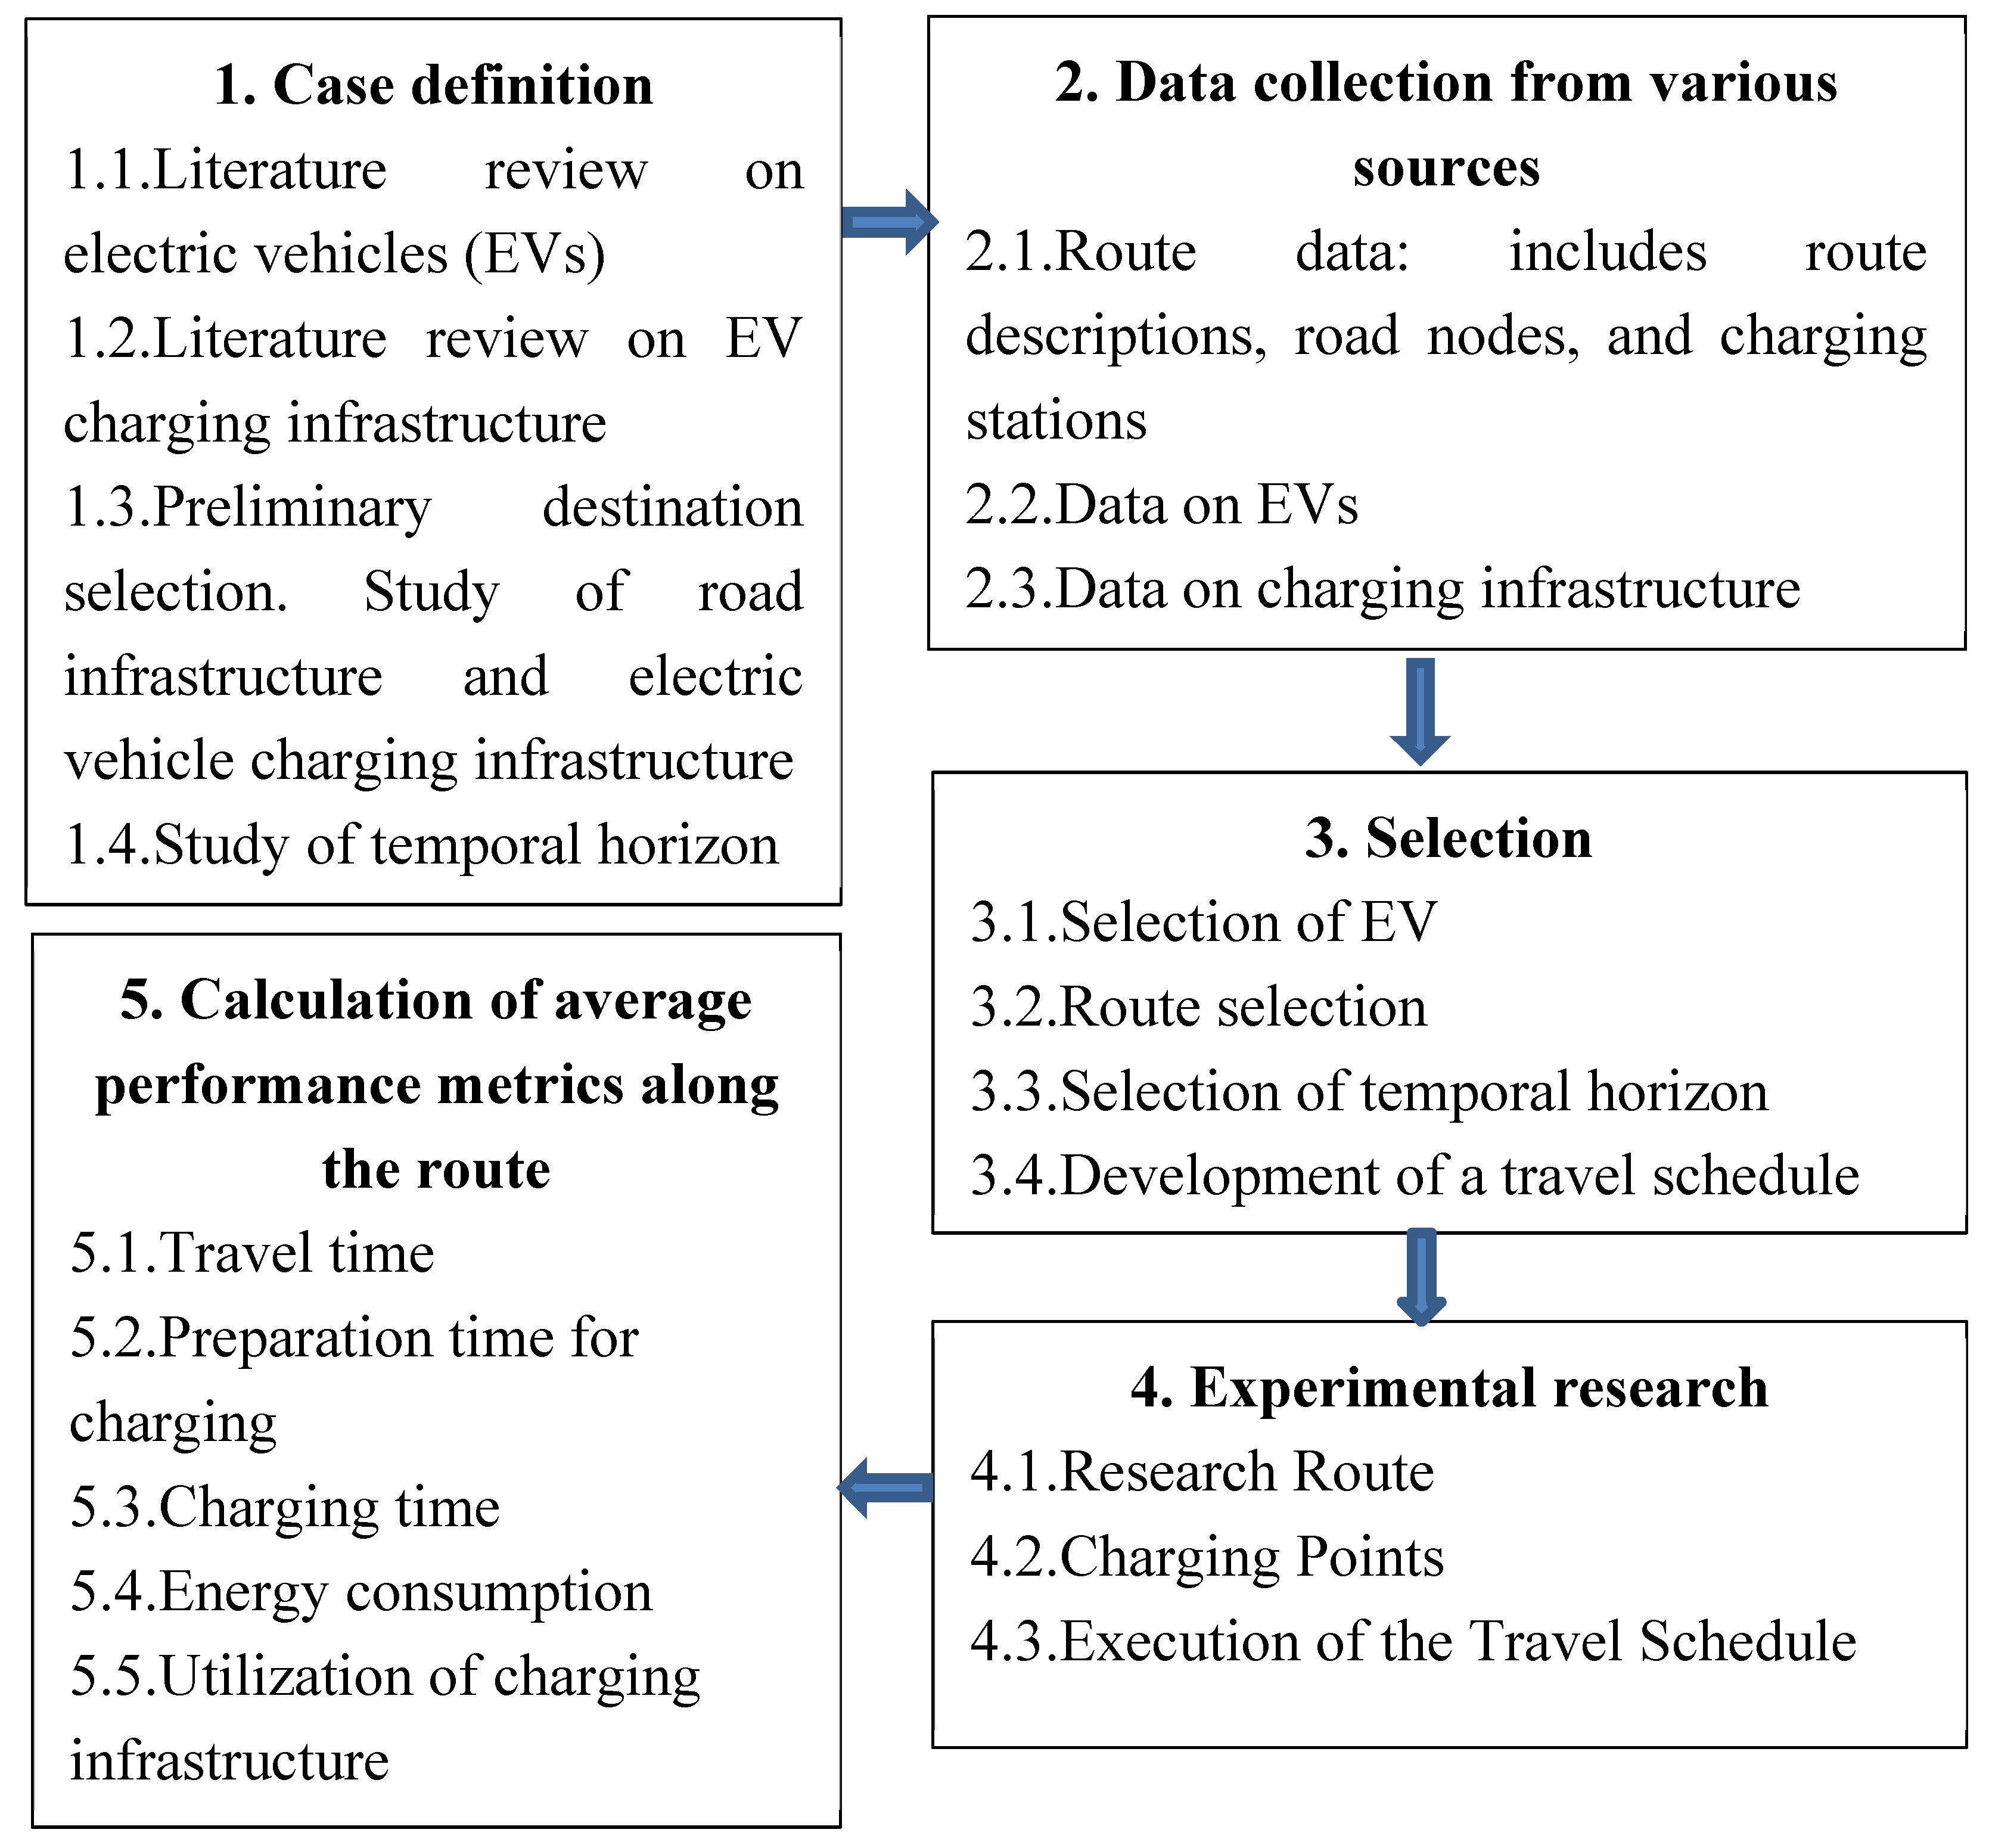
2. Materials and Methods
3. Results

| Range (km) | 0,4-0,85 | 1-1,6 | 2,3-4 | 4,1-10 | > 10 |
|---|---|---|---|---|---|
| Number of charging stations | 5 | 4 | 6 | 3 | 2 |
4. Main Problems and Recommendations for Future Work
- Limited availability of charging stations.
- Need for reliable public information regarding the location of rapid charging infrastructure for EVs, respective charging power, and pricing.
- The necessity of pre-route research for selected destinations.
- Extended travel duration due to additional charging time.
- Compatibility of charging points, variations in payment methods across different countries, including those offered by various providers (the need for installing and using different applications instead of the option to directly use debit and credit cards, difficulties with payment processing, such as incompatible payment methods or complex payment procedures).
- Lack of protective structures at some charging points, which complicates reading information during sunny weather and does not protect users from adverse weather conditions (rain, snow, etc.).
- Mandatory rest areas adjacent to charging stations.
- Issues with cellular and network connectivity, as unreliable internet connectivity can disrupt communication between EVs and charging infrastructure, leading to unsuccessful charging or delays.
- Absence of Wi-Fi at charging stations which necessitates the use of data while roaming.
- Limited driving range and inadequate charging infrastructure.
- Management of charging cables, as issues with tangled cables, insufficient cable length, and difficulties handling heavy cables.
- Reliability problems with charging infrastructure, such as malfunctioning equipment or inconsistent charging performance.
- Charging EVs after reaching 80% battery capacity takes a considerable amount of time.
- Recommendations:
- Establishment of a unified information platform that should provide information on the location of rapid charging infrastructure for EVs, charging power, pricing, and other relevant data (e.g. rest area conditions during charging).
- Introduction of a unified standard for payment - a standardized payment method for the charged amount of energy using credit and debit cards, streamline payment processes, offer multiple payment options, and ensure secure and reliable transaction processing.
- Mandatory implementation of protective structures at charging stations, which should adhere to a unified standard.
- Designated rest areas adjacent to charging infrastructure to ensure that users have appropriate facilities for relaxation while charging.
- Availability of Wi-Fi at charging points to enhance user experience.
- Utilization of standard charging protocols and increased operational compatibility between charging infrastructure and EVs.
- Regular maintenance and updates of quality assurance measures with implemented real-time monitoring of charging points to maintain service quality.
- Improvement of network infrastructure by deploying backup solutions, such as offline charging authentication methods, to address connectivity issues.
5. Conclusions
Acknowledgments
Conflicts of Interest
References
- Baltazara, J.; Valleta, F.; Garcia J. A model for long-distance mobility with battery electric vehicles: a multiperspective analysis. Procedia CIRP. 2022, 109, 334–339. [CrossRef]
- Turienzo; J.; Cabanelas, P.; Lampón, J.; Parkhurst, G. The transformation of mobility in Europe: Technological change and social conditionings. Travel Behaviour and Society. 2025, 38, 100907. [CrossRef]
- Nanaki, E. Electric vehicles. Electric Vehicles for Smart Cities. Trends, Challenges, and Opportunities. 2021, 13-49.
- Haghani, M.; Sprei, F.; Kazemzadeh, K.; Shahhoseini, Z. Trends in electric vehicles research. Transportation Research Part D: Transport and Environment. 2023, 123, 103881. [CrossRef]
- Debnath, R.; Bardhan, R.; Reiner, D. M.; Miller, J. R. Political, economic, social, technological, legal and environmental dimensions of electric vehicle adoption in the United States: A social-media interaction analysis Renew. Sustain. Energy Rev. 2021, 152, 111707. [CrossRef]
- Coffman, M.; Bernstein, P.; Wee, S. Electric vehicles revisited: a review of factors that affect adoption. Transport Reviews. 2016, 37, 1, 79-93 . [CrossRef]
- Liao, F.; Molin, E.; Wee, B. Consumer preferences for electric vehicles: a literature review. Transport Reviews. 2017, 37, 3, 252-275. [CrossRef]
- Recharge EU: How many charge points will Europe and its Member states need in the 2020s. Brussels, 2020, 68, https://www.transportenvironment.org/uploads/files/0120202020Draft20TE20Infrastructure20Report20Final.pdf.
- Alternative Fuels Infrastructure Directive 2014/94 (AFID). 2020, https://europe.influencemap.org/policy/EU-Alternative-Fuels-Infrastructure-431 (Accessed on 20.07.2024).
- Rogers, L.; Zoepf, S.; Prenninger, J. Analysing the Energy Consumption of the BMW ActiveE Field Trial Vehicles with Application to Distance to Empty Algorithms. Transportation Research. 2014, 4, 42-54. [CrossRef]
- Wang, H.; Zhao, D.; Cai, Y.; Meng, Q.; Ong, G. P. A trajectory-based energy consumption estimation method considering battery degradation for an urban electric vehicle network. Transportation Research Part D: Transport and Environment. 2019, 74, 142-153. [CrossRef]
- Al-Wreikat, Y.; Serrano, C.; Ricardo Sodre, J. Effects of ambient temperature and trip characteristics on the energy consumption of an electric vehicle. Energy, Part C, 2022, 238, 122028. [CrossRef]
- Zhang, R.; Yao, E. Electric vehicles’ energy consumption estimation with real driving condition data. Transportation Research Part D: Transport and Environment. 2015, 41, 177-187. [CrossRef]
- Lee, G.; Song, J.; Lim, Y.; Park, S. Energy consumption evaluation of passenger electric vehicle based on ambient temperature under Real-World driving conditions. Energy Conversion and Management. 2024, 306, 118289. [CrossRef]
- Modi, S.; Bhattacharya, J.; Basak, P. Estimation of energy consumption of electric vehicles using Deep Convolutional Neural Network to reduce driver’s range anxiety. ISA Transactions. 2020, 98, 454-470. [CrossRef]
- Kambly, К.; Bradley, T. Geographical and temporal differences in electric vehicle range due to cabin conditioning energy consumption. Journal of Power Sources. 2015, 275, 468-475. [CrossRef]
- Fetene, G. M.; Kaplan, S.; Mabit, S.; Jensen, A.; Prato, C. Harnessing big data for estimating the energy consumption and driving range of electric vehicles. Transportation Research Part D: Transport and Environment. 2017, 54, 1-11. [CrossRef]
- Liu, К.; Yamamoto, T.; Morikawa, T. Impact of road gradient on energy consumption of electric vehicles. Transportation Research Part D: Transport and Environment. 2017, 54, 74-81. [CrossRef]
- Alves, J.; Baptista, P.; Gonçalves, G. A.; Duarte, G. O. Indirect methodologies to estimate energy use in vehicles: Application to battery electric vehicles. Energy Conversion and Management. 2016, 124, 116-129. [CrossRef]
- Luin, B.; Petelin, S.; Al-Mansour, F. Microsimulation of electric vehicle energy consumption. Energy. 2019, 174, 24-32. [CrossRef]
- Garberson, A.; Hough, B. Study: Summer & Hot Weather on Electric Car Range. 2024, Recurrent Motors, Inhttps://www.recurrentauto.com/research/what-a-c-does-to-your-range (Accessed on 20.07.2024).
- Garberson, A.; Hough, B. Study: Winter & Cold Weather EV Range 10,000+ Cars. 2024, Recurrent Motors, Inc. https://www.recurrentauto.com/research/winter-ev-range-loss (Accessed on 20.07.2024).
| Charger speed and type | Rated Power (kW) | Approximate charging time* |
|---|---|---|
| Slow (AC) | 3-7 | 7-16 h |
| Normal (AC) | 11-22 | 2-4 h |
| Rapid (DC) | 50-100 | 30-40 min. |
| Ultra-fast (DC) | >100 | <20 min. |
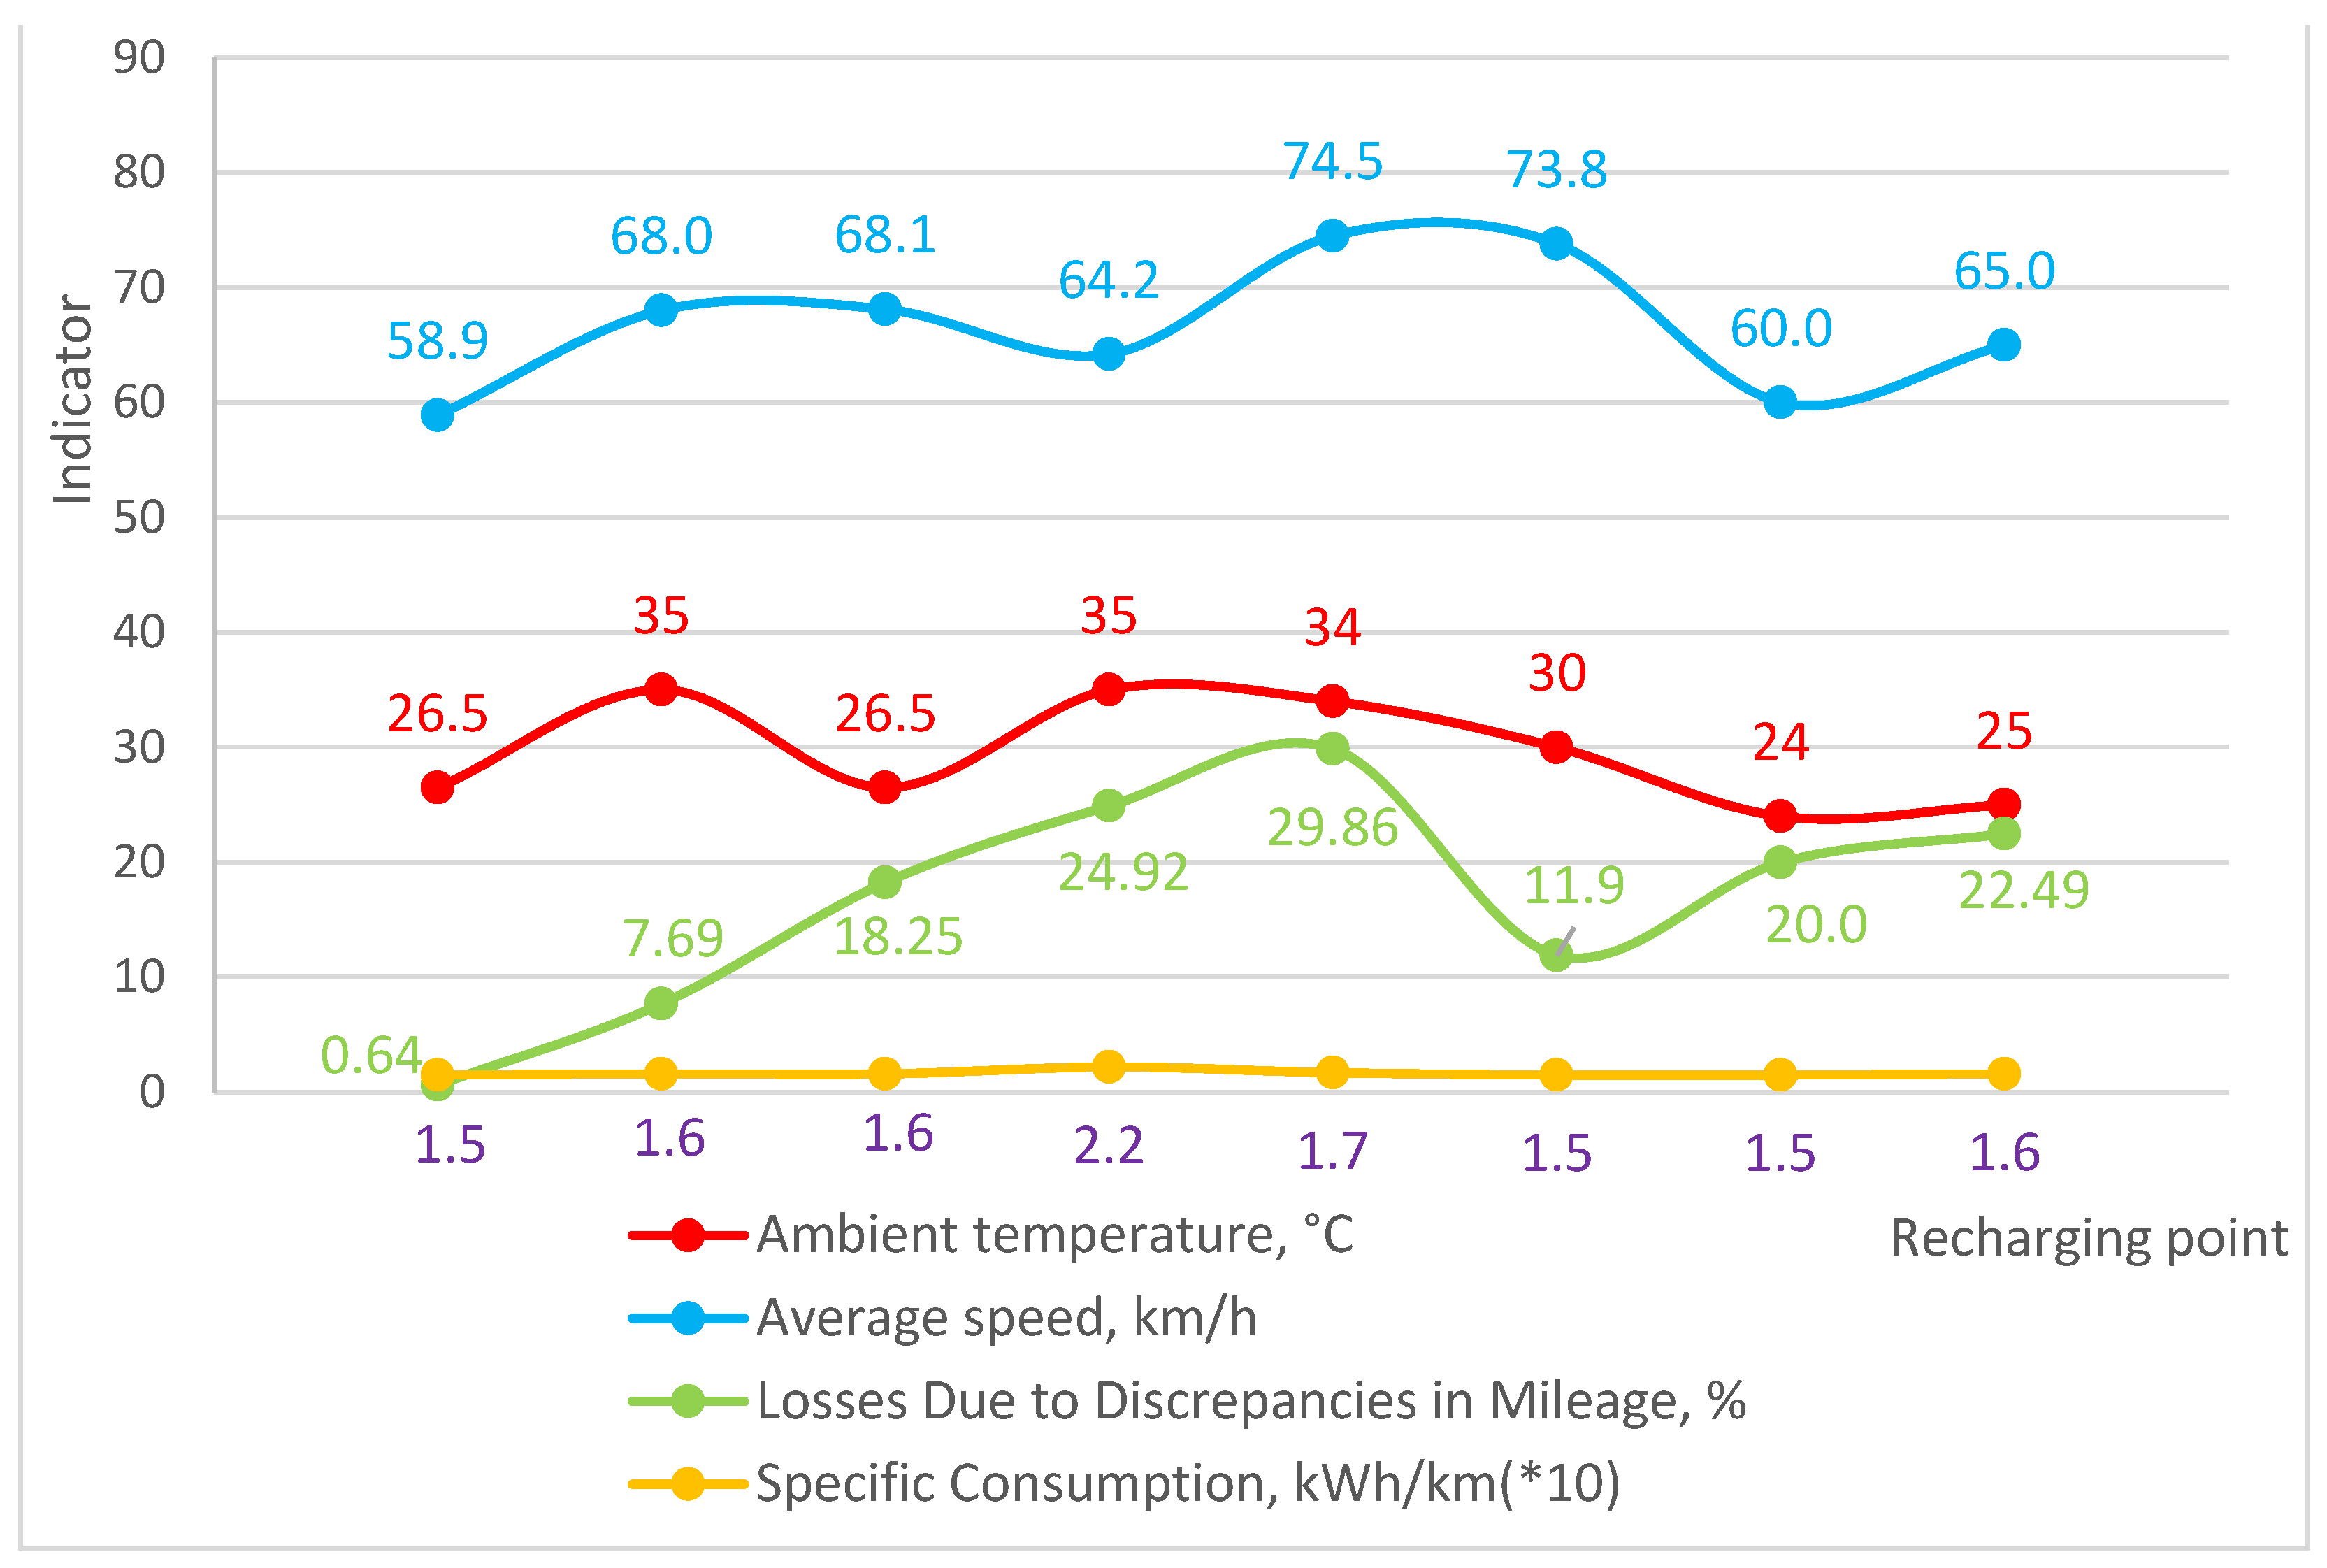
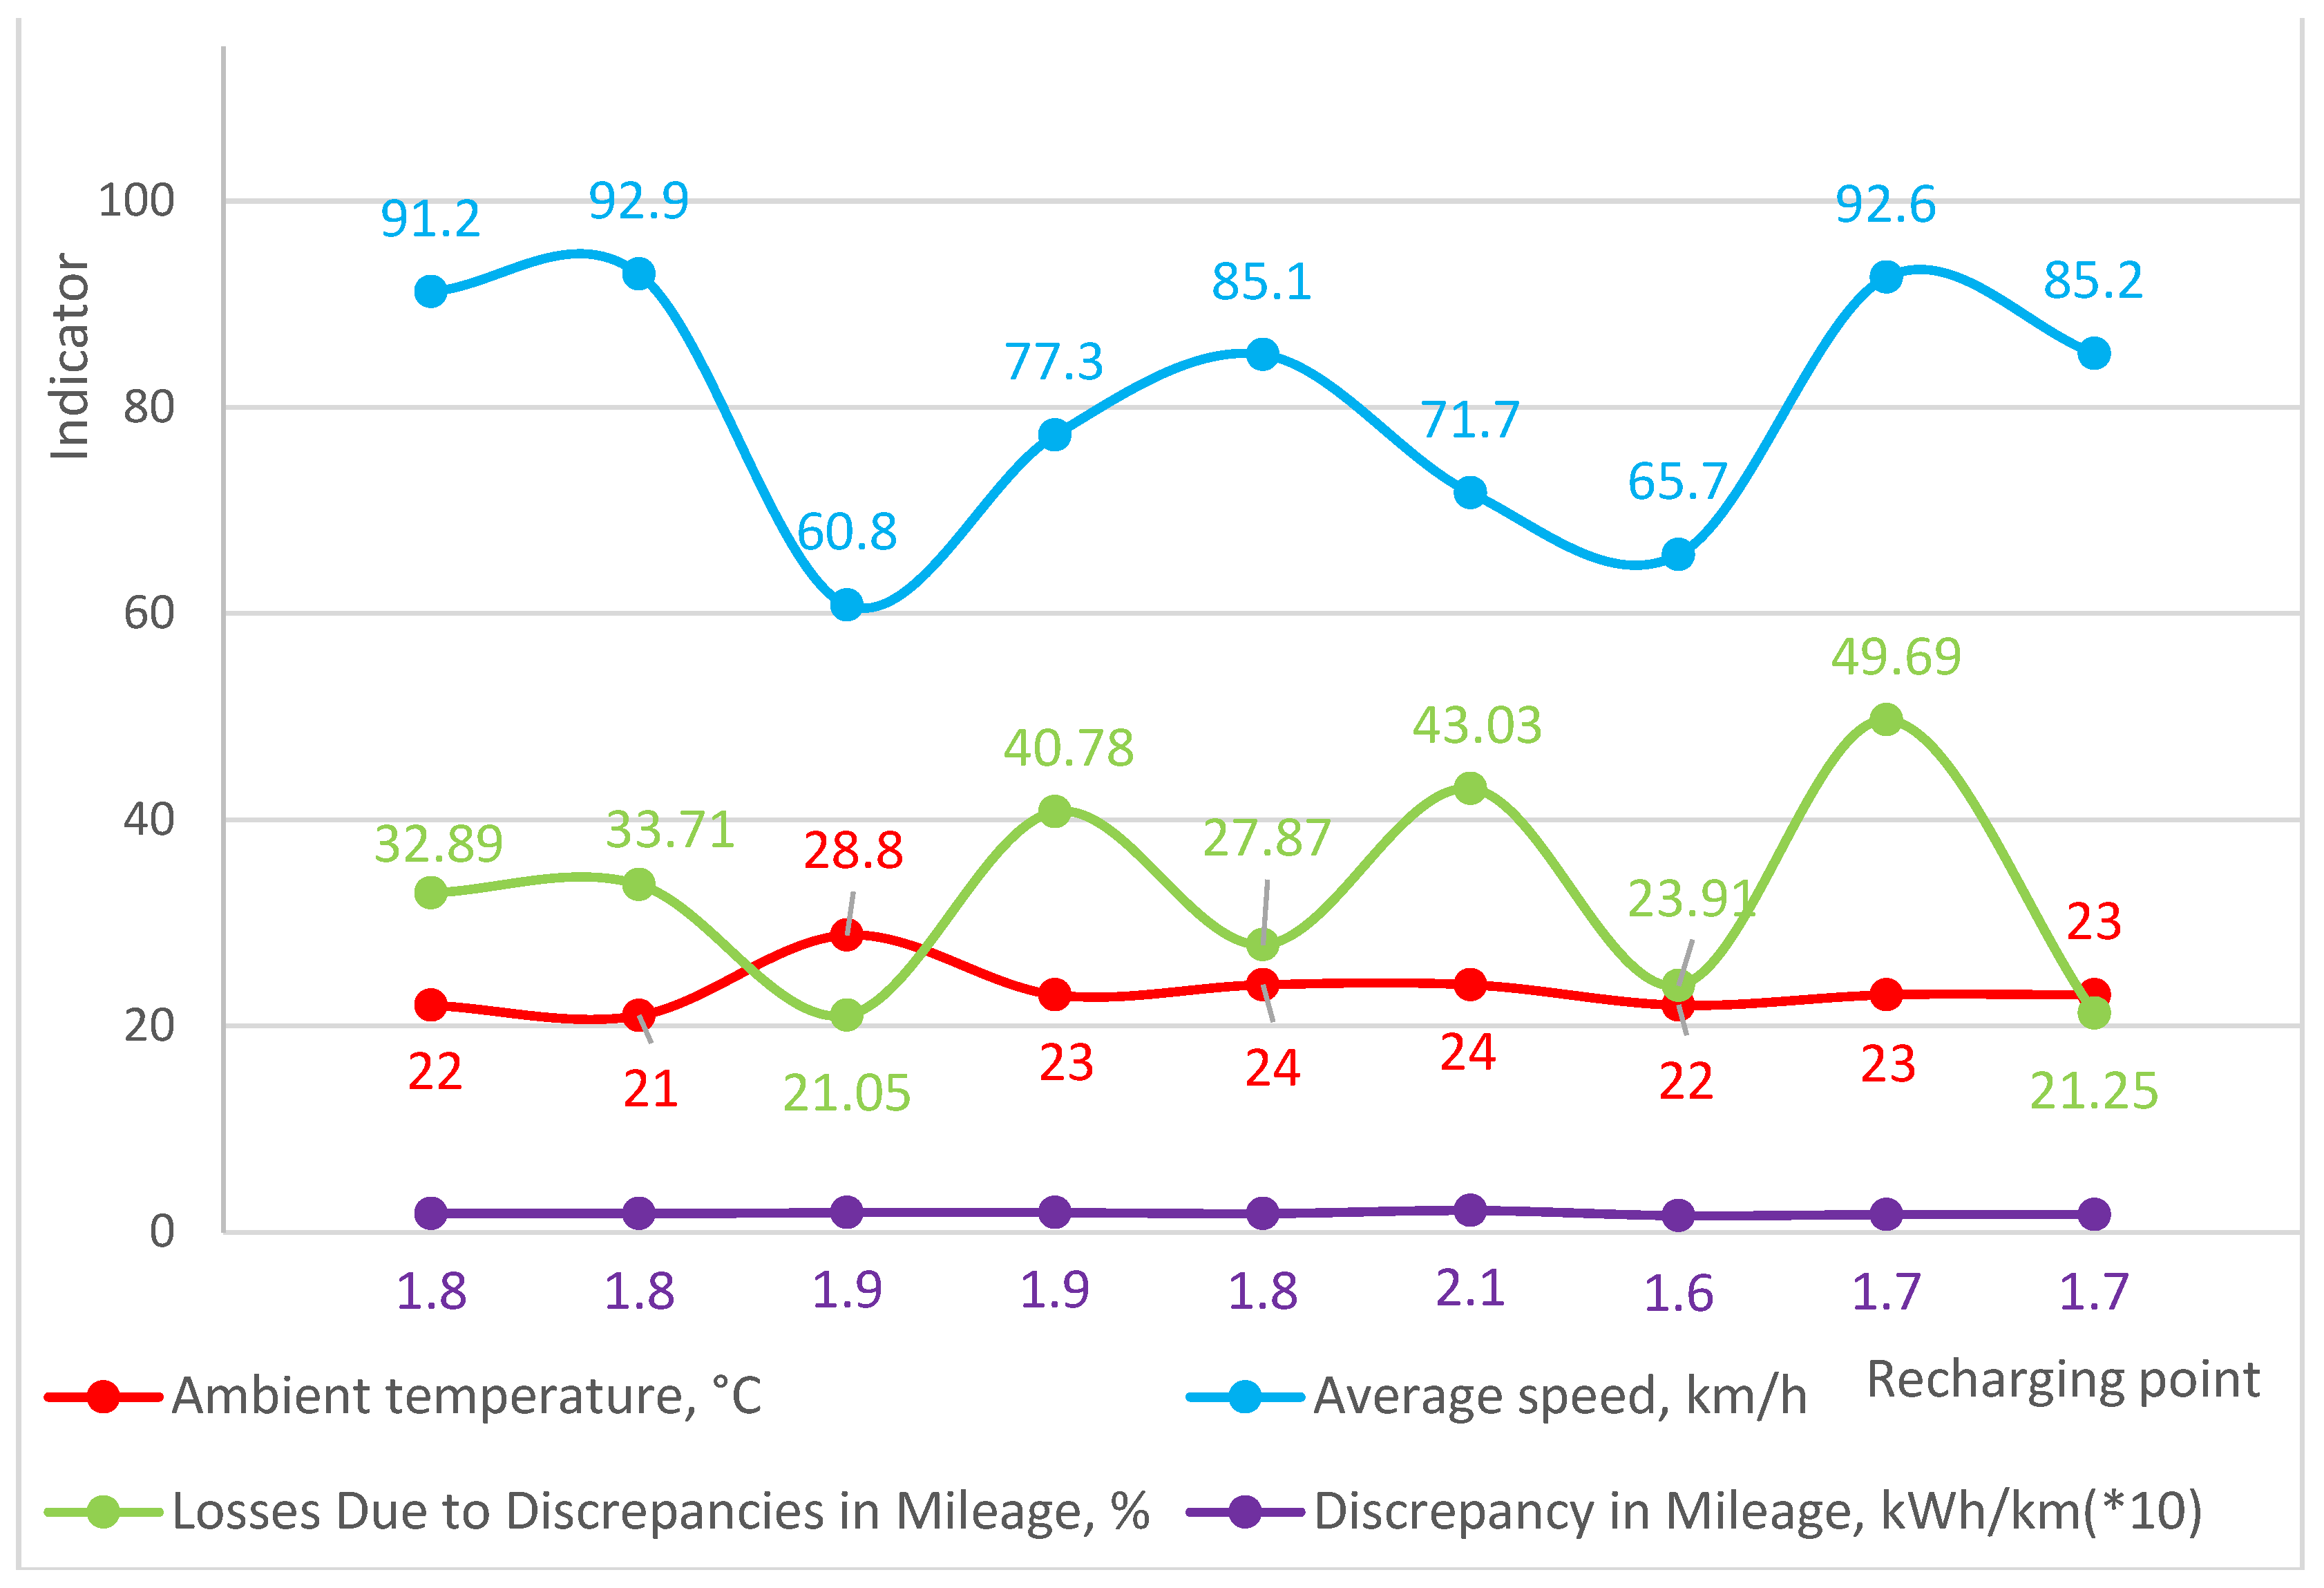
| Ambient tempera-ture, °C | Speed mode, km/h | Utilization of Auxiliary Loads (AC, radio, etc.) | Actual Distance Traveled, km | Discre-pancy in Mileage, km | Losses Due to Discre-pancies in Mileage, % | Specific Consump-tion ESEC kWh/km |
|---|---|---|---|---|---|---|
| 23-30 | 58.9 | No | 157 | 1 | 0.64 | 0.15 |
| 35 | 68.0 | No | 273 | 21 | 7.69 | 0.16 |
| 23-30 | 68.1 | No | 193 | 35 | 18.25 | 0.16 |
| 35 | 64.2 | No | 154 | 38 | 24.92 | 0.22 |
| 34 | 74.5 | No | 211 | 63 | 29.86 | 0.17 |
| 33-27 | 73.8 | No | 252 | 30 | 11.9 | 0.15 |
| 24 | 60.0 | No | 15 | 3 | 20 | 0.15 |
| 25 | 65.0 | No | 209 | 47 | 22.49 | 0.16 |
| 21-23 | 91.2 | Yes | 149 | 49 | 32.89 | 0.18 |
| 21 | 92.9 | Yes | 178 | 60 | 33.71 | 0.18 |
| 27-30 | 60.8 | Yes | 152 | 32 | 21.05 | 0.19 |
| 23 | 77.3 | Yes | 179 | 73 | 40.78 | 0.19 |
| 24 | 85.1 | Yes | 183 | 51 | 27.87 | 0.18 |
| 24 | 71.7 | Yes | 165 | 71 | 43.03 | 0.21 |
| 22 | 65.7 | Yes | 184 | 44 | 23.91 | 0.16 |
| 23 | 92.6 | Yes | 159 | 79 | 49.69 | 0.17 |
| 23 | 85.2 | Yes | 160 | 34 | 21.25 | 0.17 |
| Criteria | Available in number of stations | Missing in number of stations | ||
| Geographical location | EU | non-EU | EU | non-EU |
| Roof over the charging area | 3 | 0 | 14 | 3 |
| Resting area (benches) | 2 | 0 | 15 | 3 |
| Availability of free Wi-Fi | 0 | 0 | 17 | 3 |
| Option for cash payments | 1 | 0 | 16 | 3 |
| Online information regarding the station’s functionality | 14 | 1 | 3 | 2 |
| Station status online | 11 | 1 | 6 | 2 |
| Online information on station occupancy | 10 | 0 | 7 | 3 |
Disclaimer/Publisher’s Note: The statements, opinions and data contained in all publications are solely those of the individual author(s) and contributor(s) and not of MDPI and/or the editor(s). MDPI and/or the editor(s) disclaim responsibility for any injury to people or property resulting from any ideas, methods, instructions or products referred to in the content. |
© 2024 by the authors. Licensee MDPI, Basel, Switzerland. This article is an open access article distributed under the terms and conditions of the Creative Commons Attribution (CC BY) license (http://creativecommons.org/licenses/by/4.0/).


