1. Introduction
Neopentyl glycol (NPG) has a wide range of applications, from the textiles, plastics, and coatings industries to pharmaceuticals and foods processing [
1,
2]. It is also important for cognitive fundamentals. Namely, it can exist in orientationally disordered crystal (ODIC) mesophase between liquid and solid crystal, matched with a discontinuous transition. ODIC-forming materials are in the plastic crystals family, with free orientational or rotational motions of molecules translationally ‘trapped’ in the crystalline network [
3,
4,
5,
6,
7]. Two decades ago, the concept of the barocaloric effect, related to ‘exploration’ of the discontinuous phase transition latent heat on compressing and decompressing, was introduced [
8]. However, only in 2019 the colossal barocaloric effect (CBE) in NPG, yielding hopes for groundbreaking applications, was found [
9,
10]. As the phenomenon metric the entropy change at the transition is used. For NPG the colossal value
was obtained when compressing up to
[
9].
Since then, NPG is considered the reference basis for new generations of thermal energy storage facilities, refrigerators, chillers, air-conditioners, and related technological solutions [
11,
12,
13,
14,
15,
16,
17,
18,
19,
20,
21,
22,
23,
24,
25,
26,
27]. CBE-based devices can be wholly environment-friendly and more energy efficient than the omnipresent devices based on the circulation of special fluids and their almost continuous adiabatic decompression.
BCE is related to hidden heat (
) coupled to the discontinuous phase transition, explored during compressing and decompressing. Clapeyron-Clausius (C-C) relation [
27], constitutes the essential interpretative tool [
9,
14,
15,
16,
19,
22,
23,
24,
25,
28]:
where
denotes the melting temperature under given pressure
;
,
are for the volume and entropy changes at the discontinuous transition.
Fundamental BCE research, yielding essential support for applications and new materials searching, follows the path set in discontinuous phase transition related studies, particularly melting/freezing between liquid and solid crystal states [
28,
29,
30,
31,
32,
33]. The phenomenon is intensively studied since the 19th century [
33], but it remains a challenge. The cognitve situation is in contrast to the continuous, critical phase transitions, with the grand universalistic success of
Critical Phenomena Physics [
34,
35,
36,
37].
To a large extent, cognitive problem in ultimate explanation of dicontinuous phase transitions can be related to the apparent absence of long-range pretransitional effects [
28,
29,
30,
31,
32,
33]. Generally, fundamental studies on melting/freezing transitiona BCE phenomenon are focused on magnitudes in C-C Eq. (1) and comparison of structural and spectroscopic properties in adjacent phases [
9,
10,
11,
12,
13,
14,
15,
16,
17,
18,
19,
20,
21,
22,
23,
24,
25,
26,
27,
28,
29,
30,
31,
32,
33]. A hope for a cognitive breakthrough can suggest recent findings of critical-like premelting effects appearing when using dielectric methods [
38,
39,
40,
41]. The second cognitive problem, is the still limited evidence for high pressure studies [
28,
29,
30,
31,
32,
33]. Notable, that the high temperature ODIC phase can be considered a specific model liquid, where the ‘freedom’ is related solely to orientations. Hence, the broadband dielectric spectroscopy (BDS) [
42], inherently coupled to the electric field action, is the primary primary method for testing the ODIC mesophase [
3,
4,
5,
6,
43].
When commenting on the importance of high pressure and dielectric studies for NPG worth noting is the recent model analyses of entropy changes
for discontinuous phase transitions.leading to the following output relation [
44]:
where
is the heat capacity related to constant pressure and/or electric field,
is the specific volume per unit mass, and α is the isobaric thermal expansion concerning subsequent pressures.
The first term , can be related to the general internal energy change. The second term can be retrieved as follows at the transition: indicates the significance of compressibility change at the ΔχT discontinuous transition and the pressure dependence of the phase transition, namely: ⇒. It explicitly shows the importance of the compressibilities difference for adjacent phases. It is particularly impressive impressive fo NPG, due to the ductility of the high-temperature plastic crystal ODIC mesophase and the ‘hardness’ of the solid state crystal. Notable is also the significance of the discontinuous phase transition patten. The last term in Eq. (2), , directly recalls the significance of dielectric constant change when passing the transition.
This report shows the first multi-aspect broadband dielectric spectroscopy insight for neopentyl glycol (NPG) on compressing, in the broad surrounding of the discontinuous phase transition between the ‘soft’ ODIC’ phase and the ‘hard’ crystal phase. The report introduce new evidences regarding properties of the ODIC mesophase, the ODIC- crystal or even melting/freezing discontinuous phase transition, and the colossal barocaloric effect in NPG and related materials [
45,
46].
2. Temperature-Related BDS Studies Under Atmospheric Pressure in Neopentyl Glycol
There is a large experimental evidence regarding broadband dielectric spectroscopy in ODIC-forming materials. It focuses on the complex, previtreous dynamics since such material often can be supercooled down to the amorphous glass state [42,43 and refs. therein]. They are motivated by the glass transition grand challenge, considered essential problems for the 21
st-century physics and material engineering [
47,
48,
49,
50,
51]. Glass transition studies are essentially focused on the previtreous domain and the evolution of the primary relaxation time and, eventually, its distribution, i.e., properties associated with the primary loss curve in the imaginary part of dielectric permittivity
detected in BDS experiments. Notable is the the cognitive differences between temperature and pressure studies. The first one is related to activation energy changes, whereas compressing shift the activation volume. For ODIC-forming material such pressure studies are still very limited, and the first results were reported only 2 decades ago [
52,
53].
As for NPG, Tamarit et al. [
54] presented changes in the primary relaxation time in ODIC phase of NPG for temperatures from
to
, i.e., covering ca. 50% of the ODIC phase range in this material. Although the functional parameterization is not discussed, the presented slightly nonlinear pattern in the Arrhenius scale plot
vs.
indicates the possible super-Arrhenius (SA) dynamics, which are considered the universalistic feature for previtreous dynamics. In subsequent reports, for similar ODIC-forming materials, the parameterization via the Vogel-Fulcher-Tamman (VFT) equation, i.e., the replacement equation for the general SA relation, was shown [
55,
56]:
where the left part is for the general SA equation, with the apparent (temperature-dependent) activation energy
It reduces to the basic Arrhenius pattern for
. The right part is for the VFT replacement equation. Eq.(1) is for the supercooled liquid-like temperature domain
;
is the extrapolated VFT singular temperature and
is the glass temperature which can be estimated via the empirical condition
.
is the fragility strength parameter;
[
42,
50].
The VFT equation is the commonly used dependence for describing the previtreous dynamics, including the vitrifying ODIC phase. Notwithstanding, since 2006, the prevalence of the critical-like parameterization in the ODIC phase was presented [
50,
57]:
where
is the extrapolated singular temperature, and the exponent
for different ODIC-forming materials.
The primary relaxation time-focused BDS studies in NPG constitute a particular experimental challenge since they require multi-GHz range measurements in a relatively volatile and sensitive material contaminated by contamination. The subsequent report for for NPG appeared in 2021 [
58]. They were related to frequencies
, and covered liquid, ODIC, and Crystal phases in the temperature range from 416 K to 293 K. It focused on the evolution of DC electric conductivity for which the VFT-type portrayal (Eq. (1)) was suggested [
58]:
where
, and
is the extrapolated singular temperature.
The description via the above relation was evidenced in the liquid phase, for the range covering
and in the ODIC phase (denoted as
) in the domain covering
, namely starting
below the melting temperature and terminating
before the transition to the solid crystal phase. For the latter, the basic Arrhenius dynamics (
) is reported. In ref. [
56], also, spectra of imaginary parts of dielectric modulus
and electric impedance
for four temperatures were superposed and preliminary discussed. The authors of ref. [
58] heuristically suggested the importance of the proton hoping mechanism, which is influenced by the rotational freedom of molecules and intrinsic defects, for translational processes
Very recently, BDS studies extending from the low-frequency and mid-frequency domain to high-frequency, explicitly orientation processes focused region [
43]. As for applications recalled in the section above, new findings related to constant dielectric changes are particularly noteworthy. First, the unique pattern for dielectric constant, or more precisely dielectric permittivity
has been shown [
43]:
where
is the singular, ‘critical’, temperature related to
, the amplitude
, and then
.
Such a pattern was noted earlier for the liquid and ODIC phases of cyclooctanol, which can suggest its universality [
43]. The model explanation of such behavior was proposed. It suggested obeying the Clausius-Mossotti local field, directly leading to the Mossotti Catastrophe type behavior [
58,
59,
60,
61,
62,
63], correlated with Eq. (6). Such behavior is formally forbidden for dielectric materials, except the paraelectric phase of ferroelectric materials. Nevertheless, the translational confinement of molecules in crystal lattices and the orientational freedom of the permanent dipole moments conjugated to them lead to the formal fulfillment of the essential condition for the Clausius-Mossotti model of the local field in dielectric materials, namely the presence of non-interacting or very weakly interacting permanent dipole moments [
43,
59,
60,
61,
62,
63,
64].
For dynamics, tested via the evolution of DC electric conductivity, the explicit prevalence of the ‘activated&critical’ model relation, introduced by Drozd-Rzoska [
65], was shown [
43]:
where
,
is the extrapolated singular temperature, the prefactor
and the exponent
.
The values of the exponents are in the range
and for its smaller values, the ‘critical-like’ term dominates, leading to the approximation by Eq. 4) [
65].
The distortions-sensitive validation of the above relation is the simple, quasi-critical pattern for apparent activation enthalpy
changes [
43,
65]:
where
and
is the extrapolated singular temperature related to
,
condition.
can also be considered the steepness index for the Arrhenius scale presentation metric; it is also directly related to so-called apparent fragility, the normalized metric of non-Arrhenius behavior introduced for the ‘glassy’ dynamics.
Notably, that slightly earlier patterns related to Eqs. (6), (7) (8) and (8)) were reported in the ODIC phase of cyclooctanol [
66], which leads to the question of their universality.
3. Materials and Methods
Neopentyl glycol, with the highest available purity, was purchased from Sigma-Aldrich NPG Glycol (CAS 126-30-7). It shows the following phase sequence under atmospheric pressure:
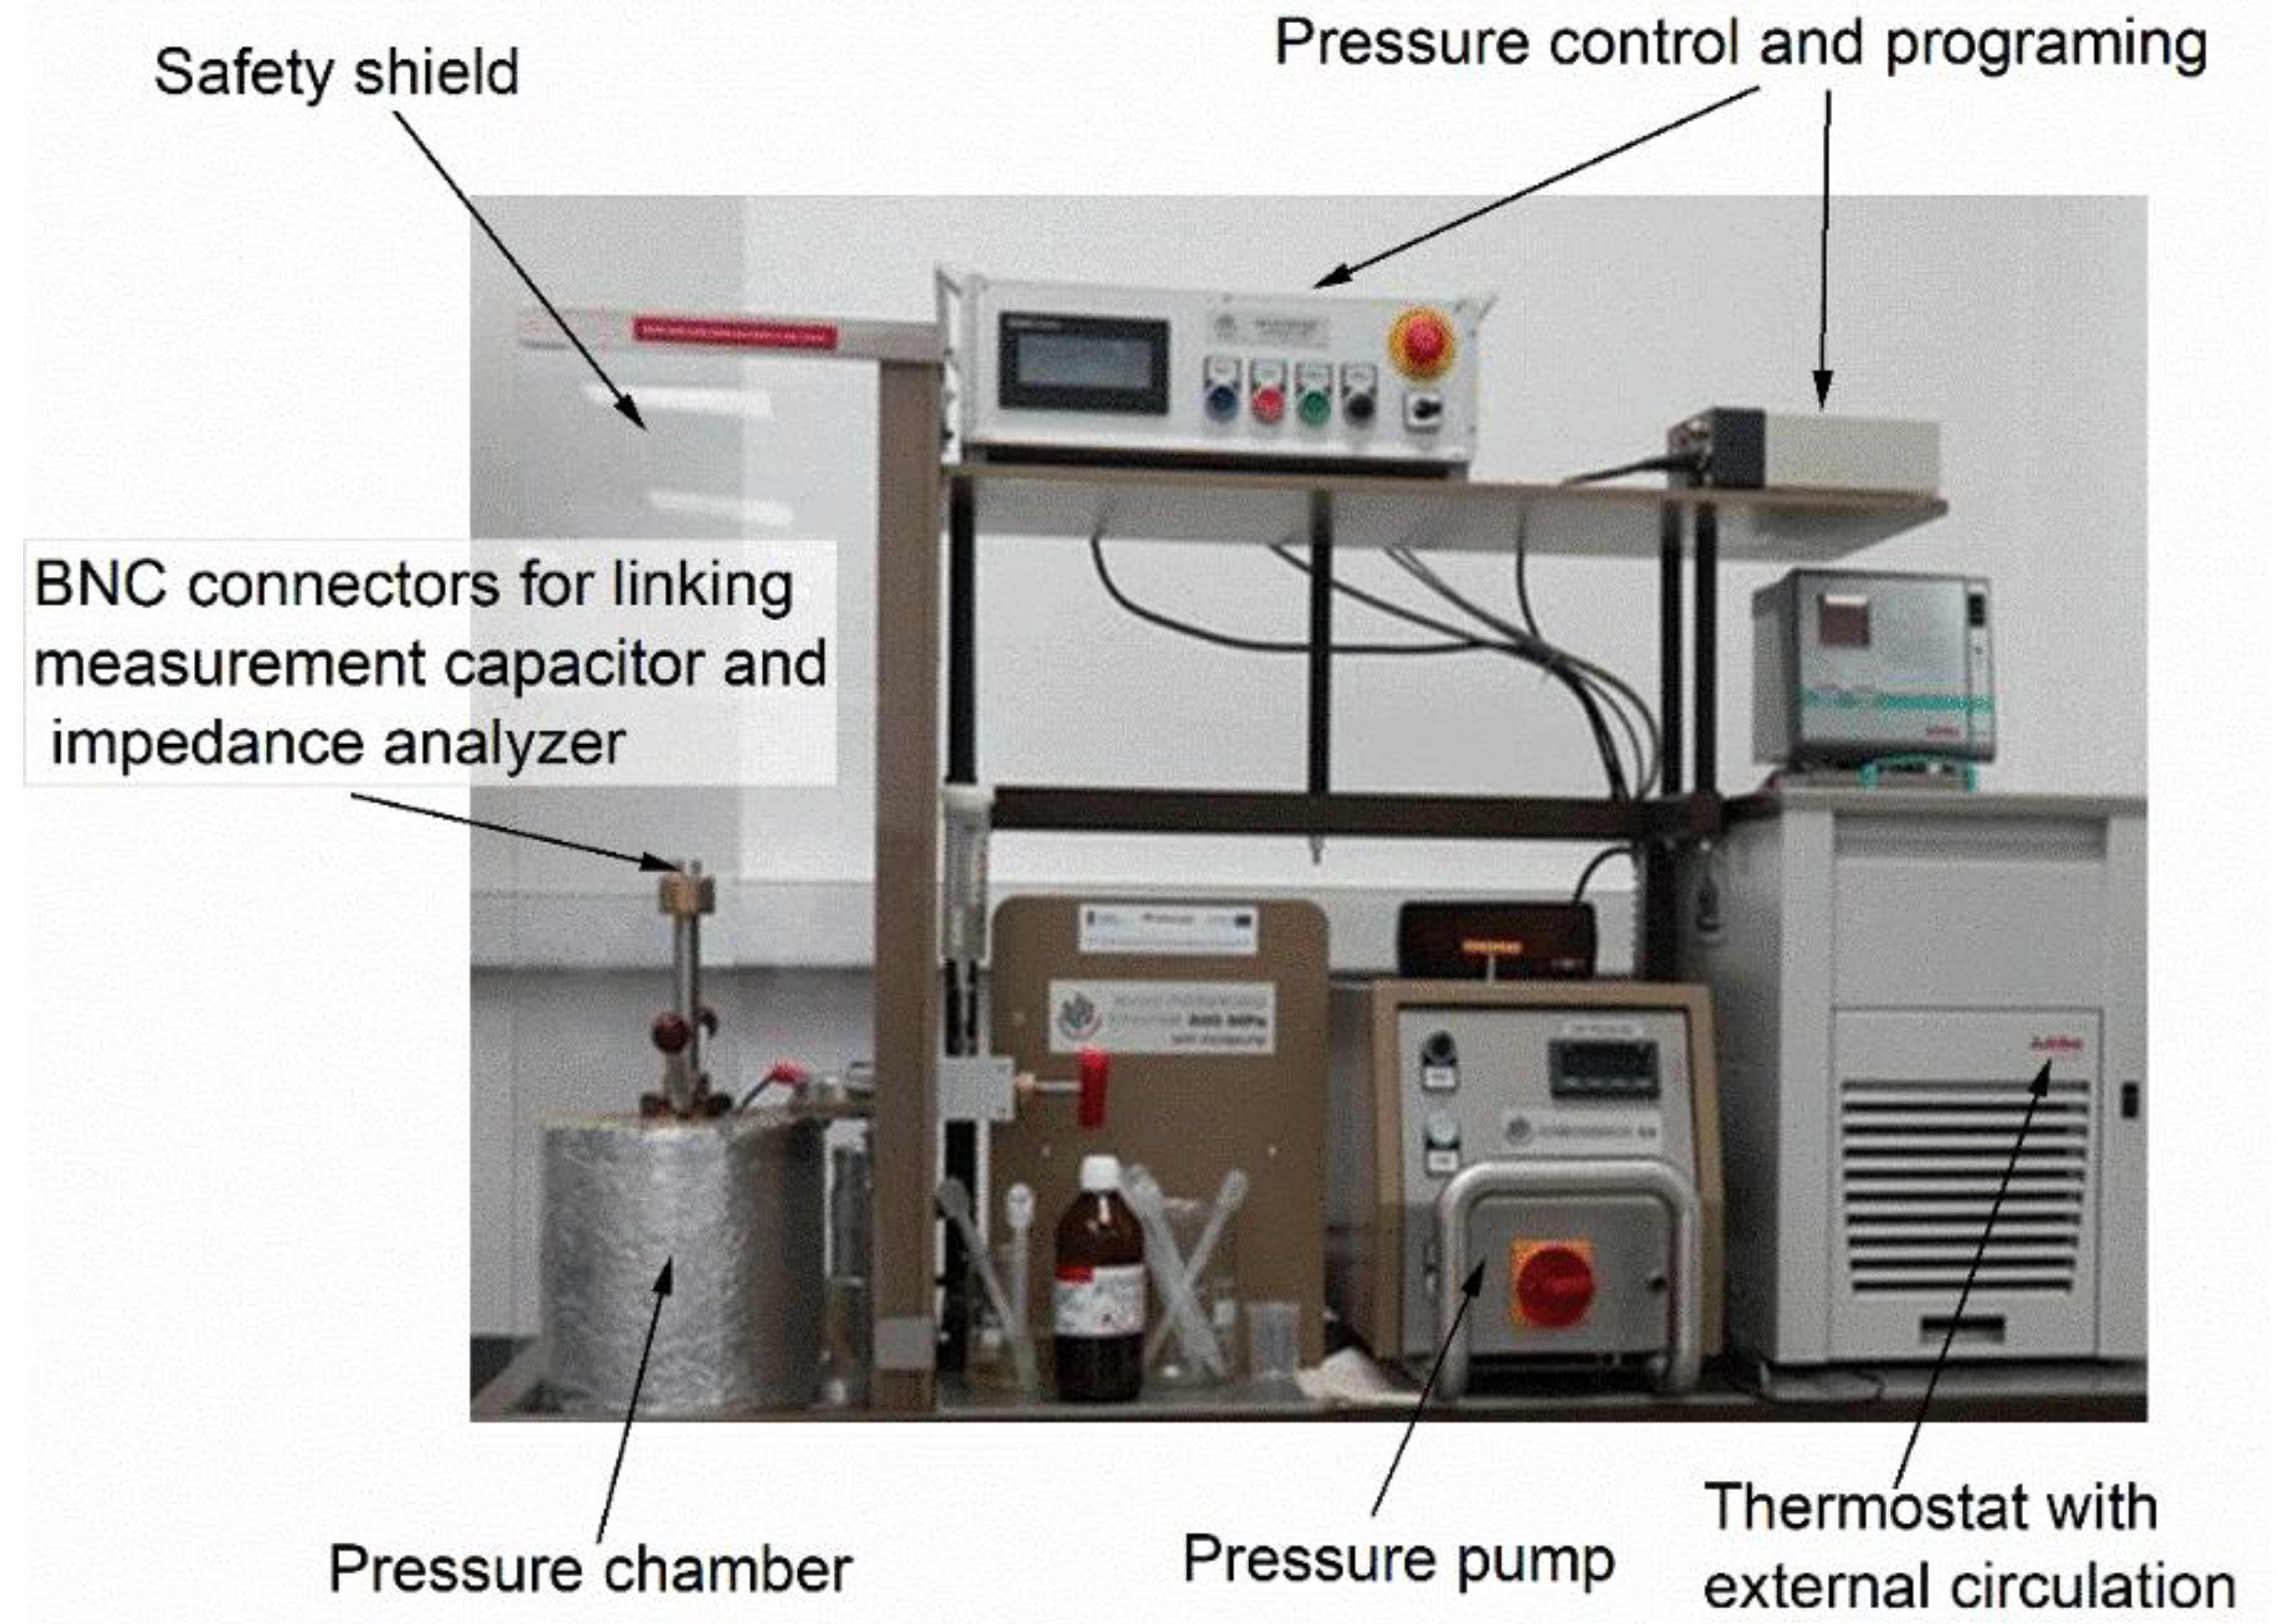
High-pressure measurements were carried out using two setups. The first one was used to study up to 700 MPa. It is shown in
Figure 1. For this facility, the pressure pump supports the pressure chamber, where Plexol is used to transmit the pressure. It consists of a pressure chamber linked to the pressure pump. The chamber was surrounded by a jacket, linked to the large volume (
) thermostat with external circulation. Both temperature and pressure were computer-controlled. Temperature was measured by the copper-constant thermocouple placed in the pressure chamber and two Pt100 resistors along the chamber to monitor a possible temperature gradient. The pressure was monitored by a tensometric meter, with
precision. Tested samples were placed in the measurement flat-parallel capacitor in the pressure chamber. The pressure was transmitted to the sample inside the capacitor via the deformation of an elastic element. Its design is shown in ref. [
50]. The measurement capacitor was made from Invar, with the
gap between capacitor plates.
The second setup focused on extending pressure up to challenging 2 GPa. It consists of a pressure chamber with an internal diameter 12 mm. The capacitor with the tested sample was placed in the Teflon tube with an external diameter only slightly lower than the diameter of the chamber. Inside the Teflon tube, a flat-parallel measuring capacitor was created on the basis of an Invar cylinder cut along the long axis. The distance between the plates was 0.3 mm.
High and very high pressures acting on the tested sample were created by the piston being pressed into the pressure chamber, causing the Teflon tube plastic (reversible) deformation. The pressure chamber was also surrounded by a jacket, allowing the circulation of liquid from a large-volume thermostat with external circulation. The temperature was measured using a thermocouple inside the chamber. Changing the experimental pressure technique from method 1 to method 2 allows us to avoid problems with a strong increase in the viscosity of the medium (liquid) transmitting the pressure in method 1.
Method 2 is associated with limitations in high-pressure values estimations to at least . It can be calculated from the force acting on the piston, creating pressure by high-pressure press. It has to be calibrated by testing pressure induced using the manganin coil electric resistance placed in the chamber. Consequently, applying the second method for pressures above a few hundred MPa can be advised.
The pressure was transmitted to the sample inside the capacitor via the deformation of an elastic element. Its design is shown in ref. [
50]. The measurement capacitor was made from Invar, with the
gap between plates of the capacitor.
BDS measurements were carried out using the Alpha Novocontrol BDS spectrometer, supported by Novocontrol system software, allowing the avoidance of parasitic capacitances and yielding directly the real and imaginary parts of dielectric permittivity or electric conductivity as the output of measurements. The analyzer enables 5 or 6 digits resolution scans. Tests were carried out for measurement voltage, which guaranteed the optimal measurement resolution. BDS studies under pressure are still limited to a few MHz in frequency because of unsolved technical challenges. NPG was purchased from Aldrich company and placed in the measurement capacitor after heating up to the liquid phase.
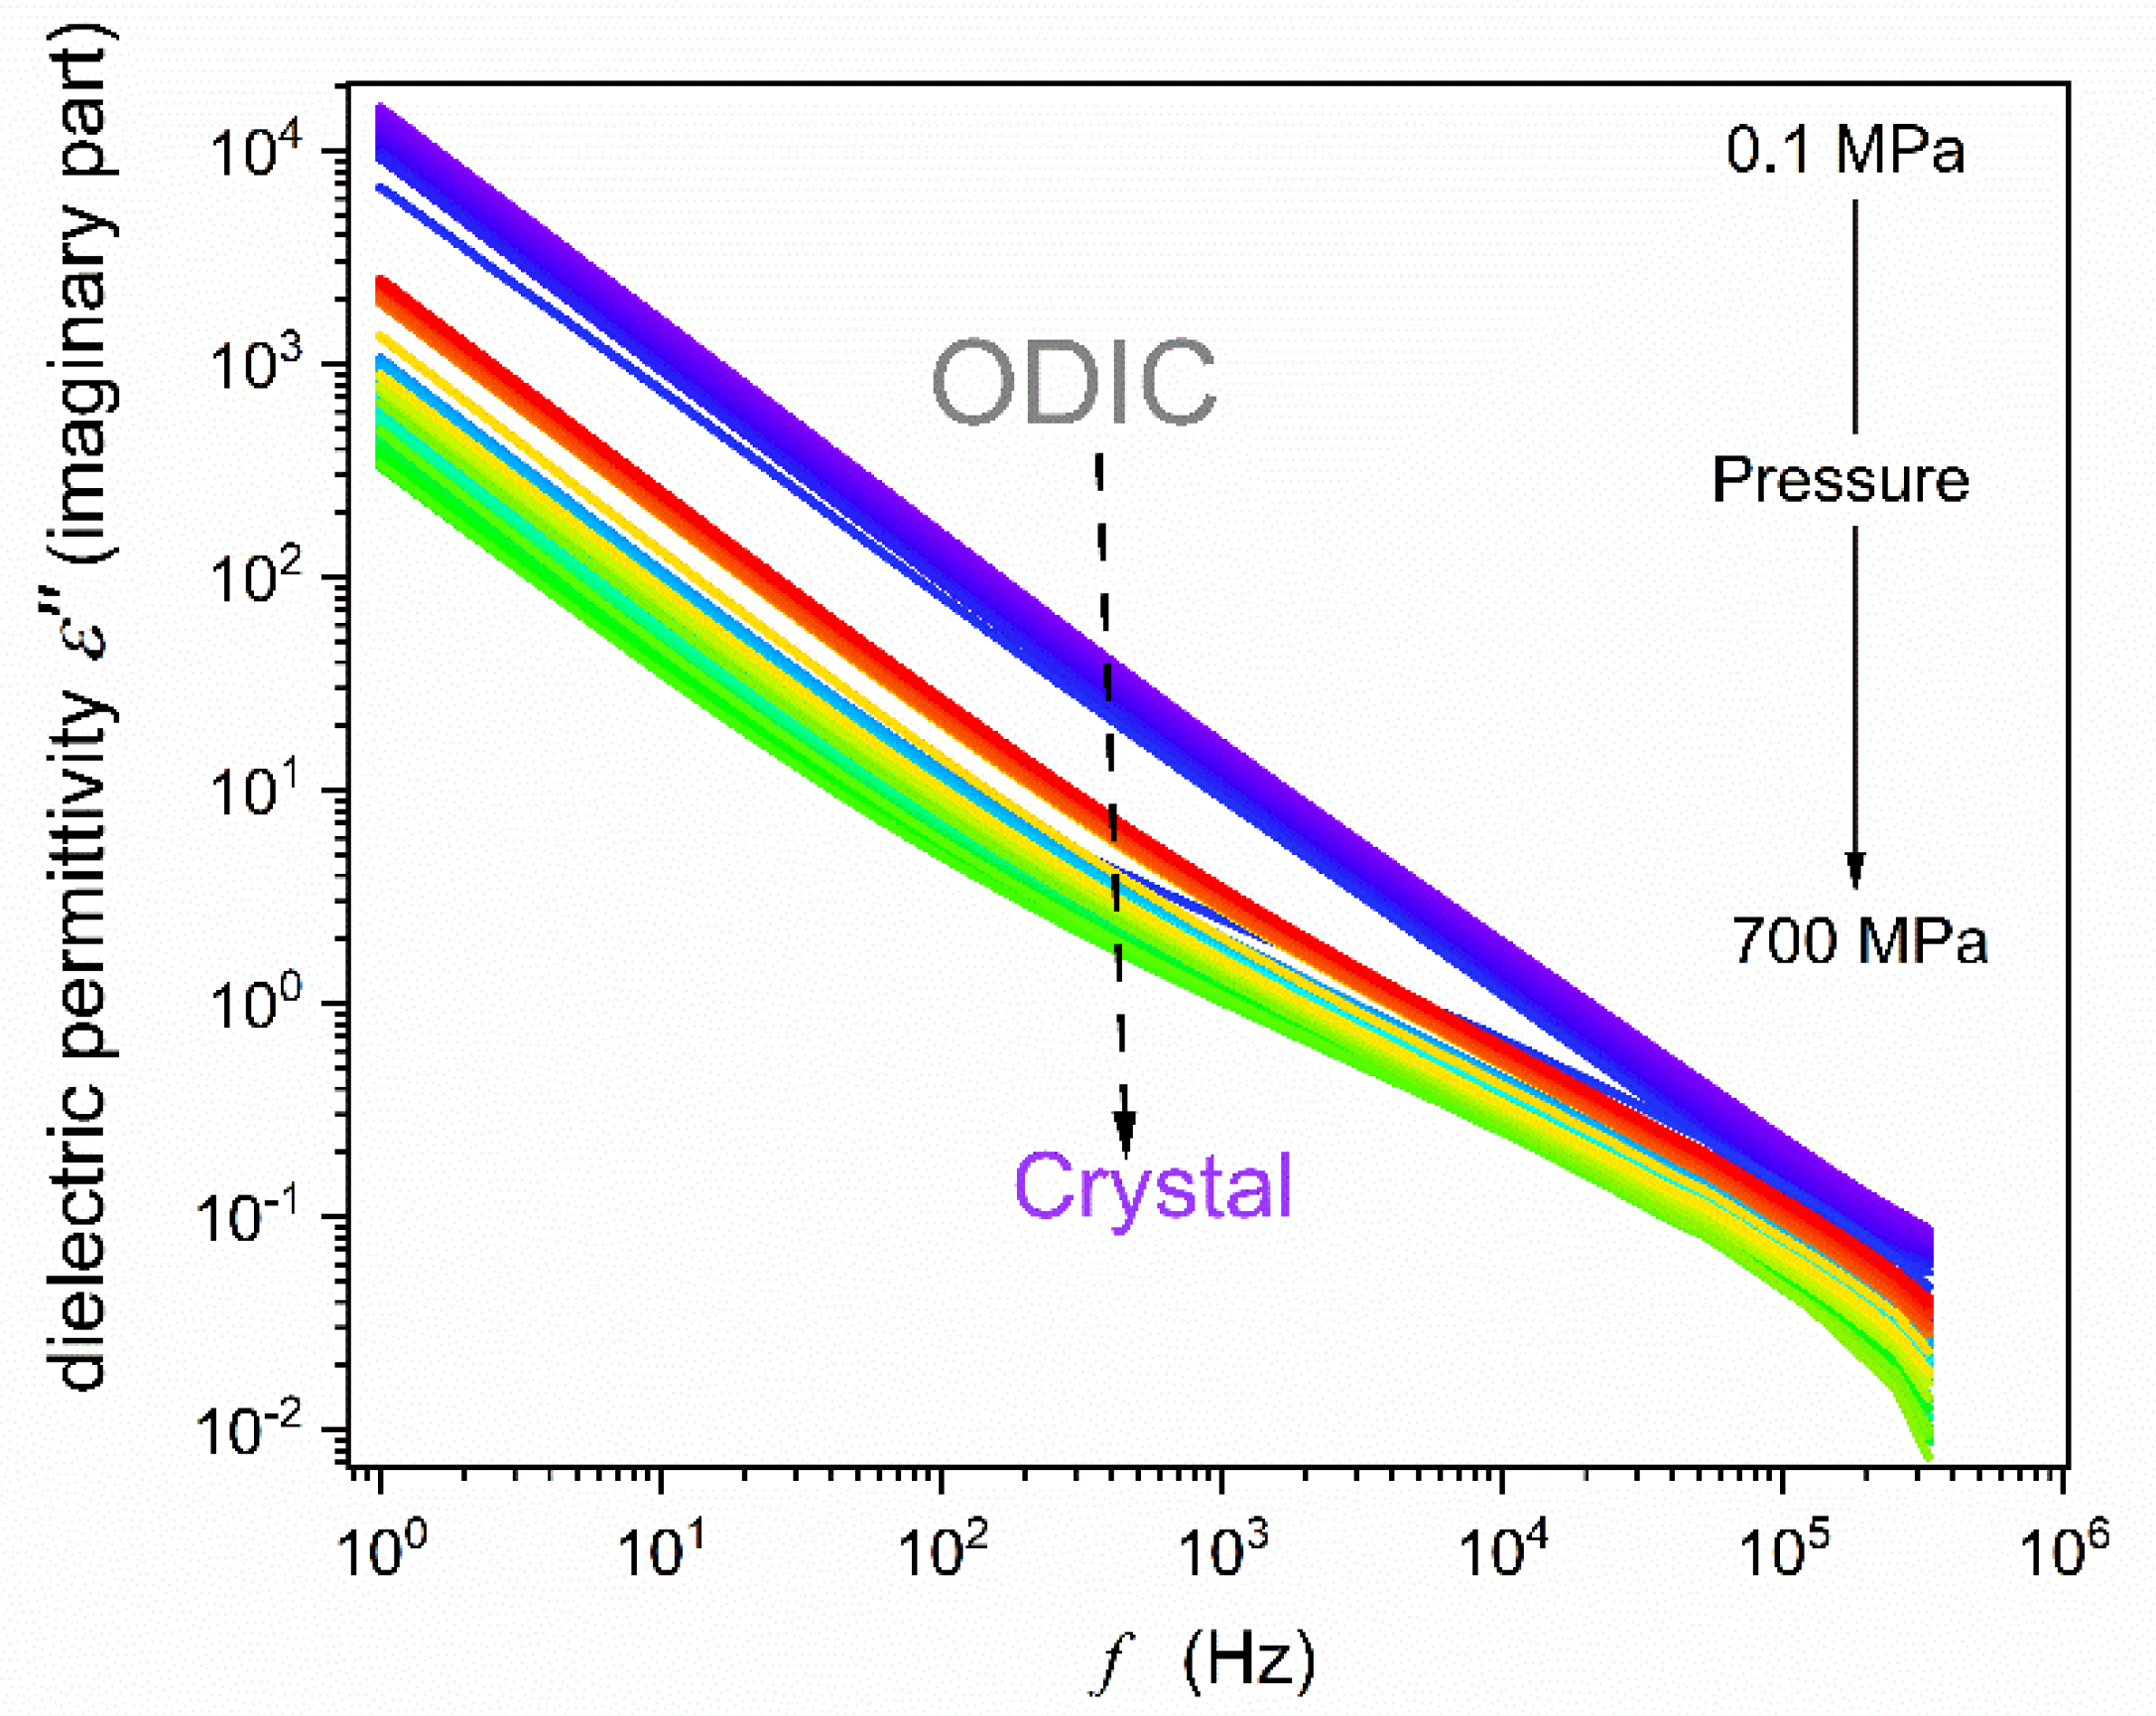
The example of experimental spectra detected in BDS-based scans is presented in
Figure 2 and
Figure 3 for the real imaginary parts of dielectric permittivity:
, where
and
;
and
are detected electric capacitances for the capacitor with the sample and ‘empty’,
is the resistivity,
[
42] They were the base for deriving properties discussed in the subsequent section. In
Figure 2 important frequency domains are indicated.
4. Results and Discussion
4.1. Real Part of Dielectric Permittivity, Moderate Pressures
Dielectric constant is the first, and still essential, characterization of dielectric materials, introduced yet by Michel Faraday [
67]. It is related to the horizontal ‘static’ domain of the real part of dielectric permittivity
. For NPG the static domain appears explicitly only in the ODIC phase, for
, as shown in
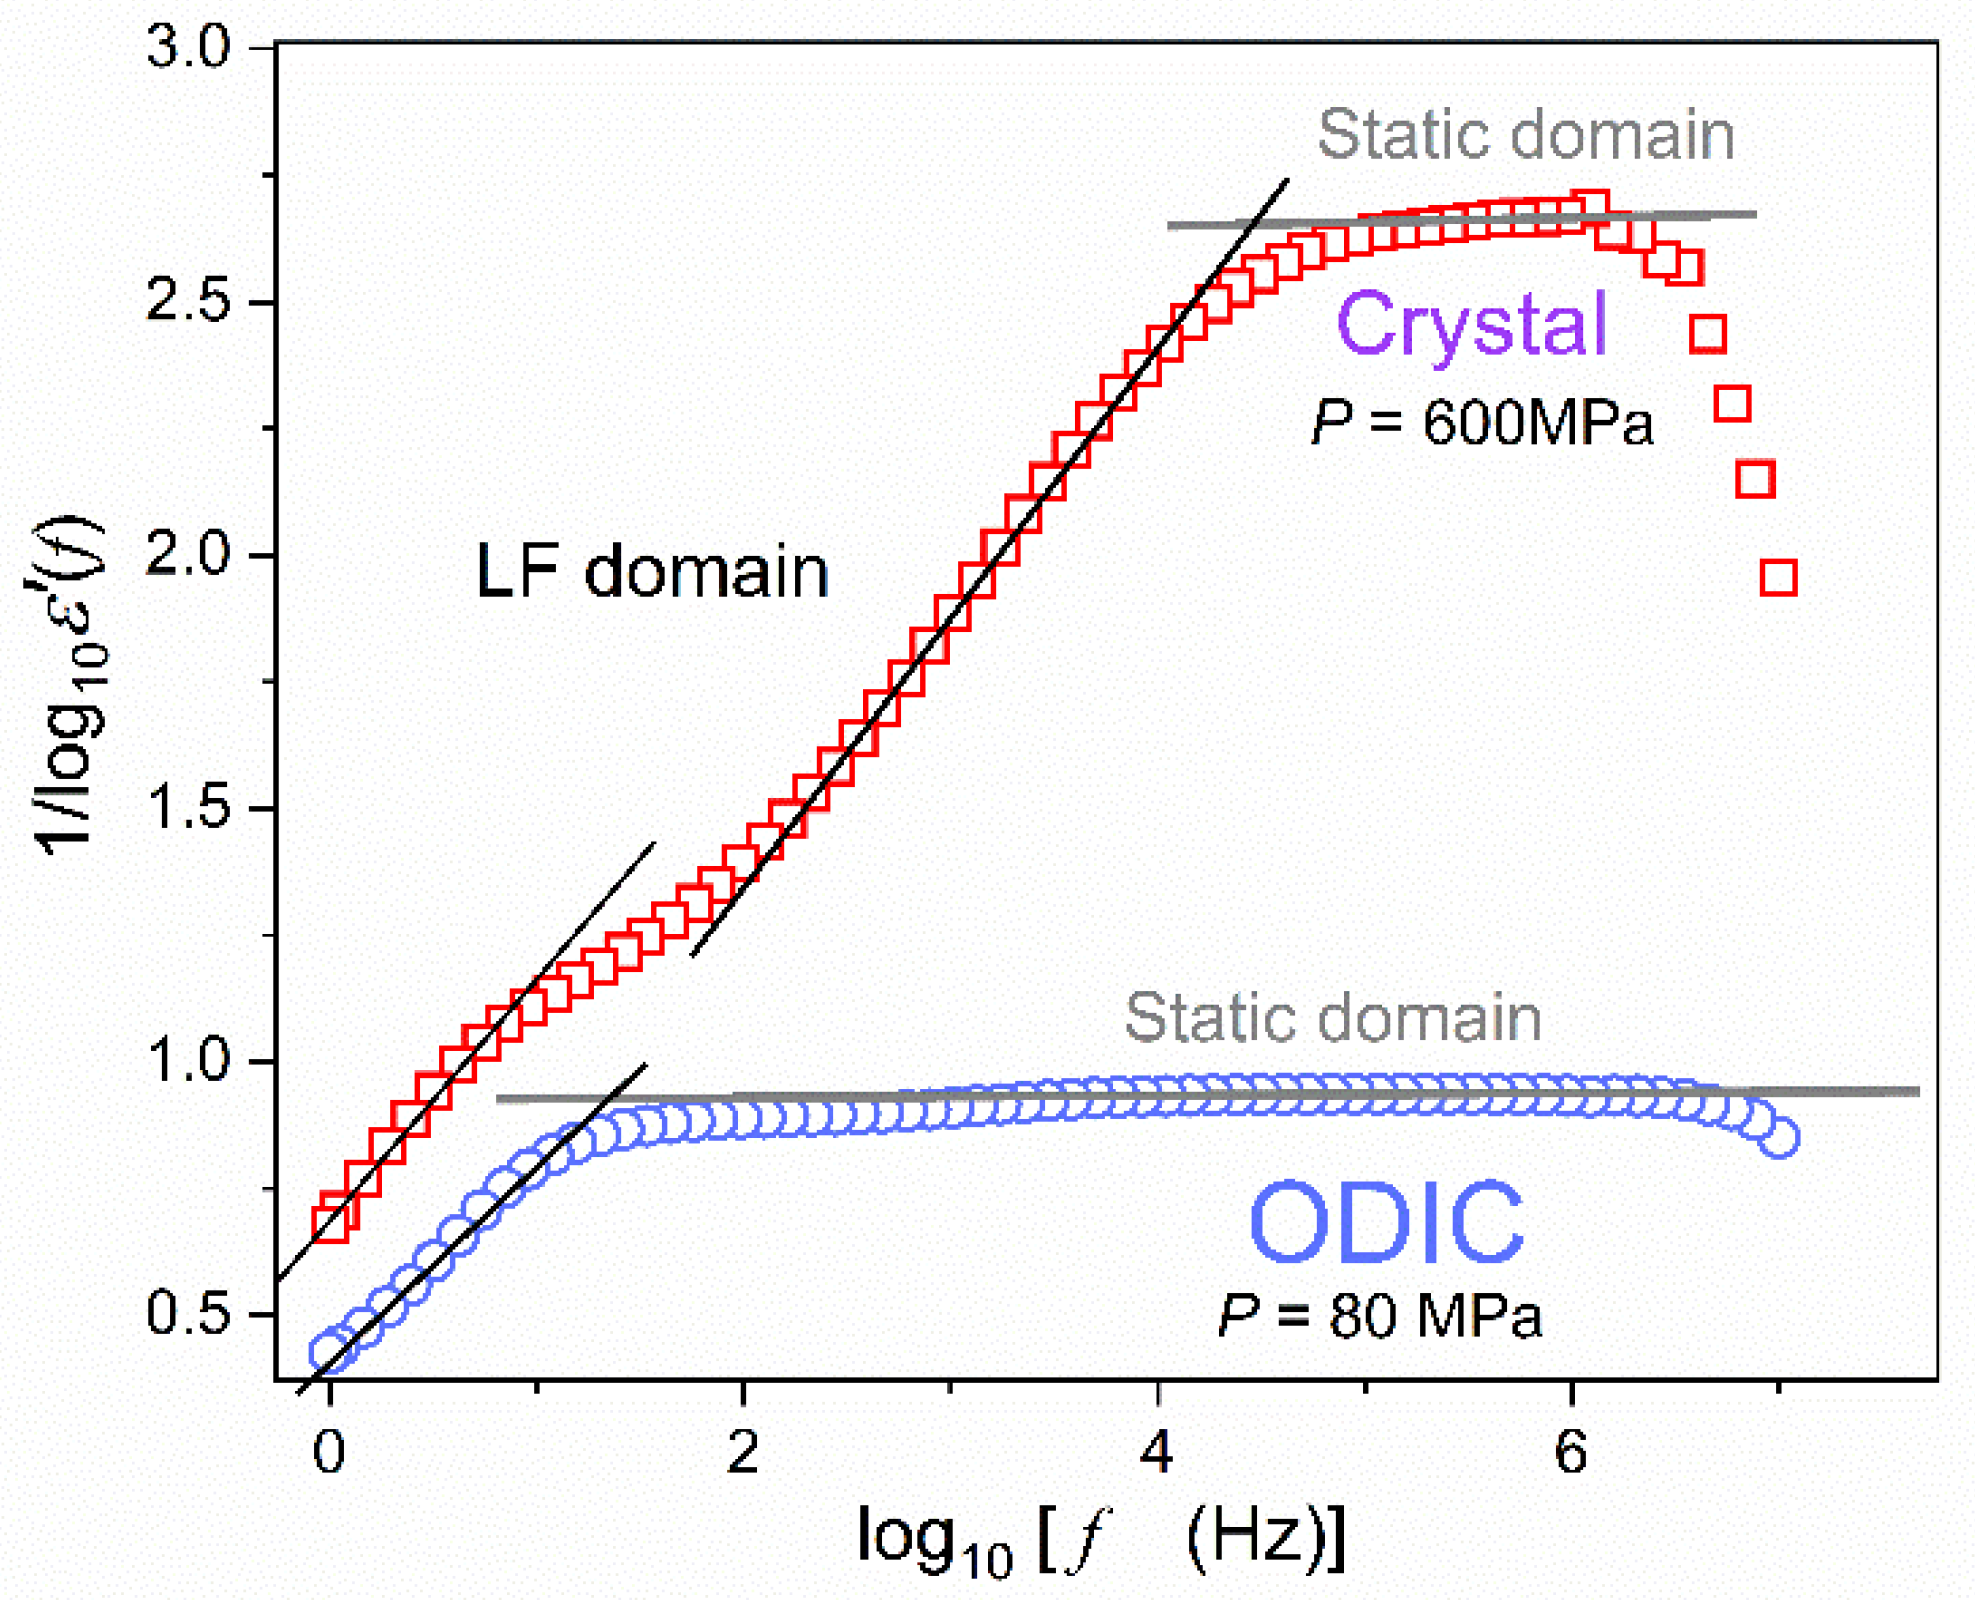
Figure 2 by the horizontal line in grey. For the solid crystal phase, the extent of the static domain is qualitatively lesser. For frequencies above the static domain, the relaxation domain with the primary loss curve addresses the reorientations of permanent dipole moments directly. It was not possible to access it in the given experiment because of the frequency range technical limitations in high-pressure studies.
Below the static domain, the boost in
and
values are linked to the low frequency (LF) domain. Generally, it is related to ionic species in dielectric material, which can contribute to dielectric materials for low enough frequencies.
The strong rise of dielectric permittivity is essentially linked to ‘generally recalled ‘ionic species’ or ‘contaminations [
68,
69,
70,
71,
72,
73,
74,
75]. Neverteless, they can also explaine by translational shift, in respect to the average position, for basic molecules of a givan system/material [
50].
Worth recalling, is the still existing challenge for dielectric permimittivity parameterization in the LF domain, particularly for
[
66,
67,
68,
69,
70,
71,
72,
73].
Figure 4 shows an empirical attempt to overcome this problem. It presents the changes of the real part of dielectric permittivity reciprocal, revealing features not explicitly visible in
Figure 2. Horizontal lines in grey indicate the static domain, where frequency shifts do not yield changes in
values. For LF domain, i.e., frequencies below the static domain. also a simple linear pattern emerges. It leads to the following set of equations:
where
are empirical constants.
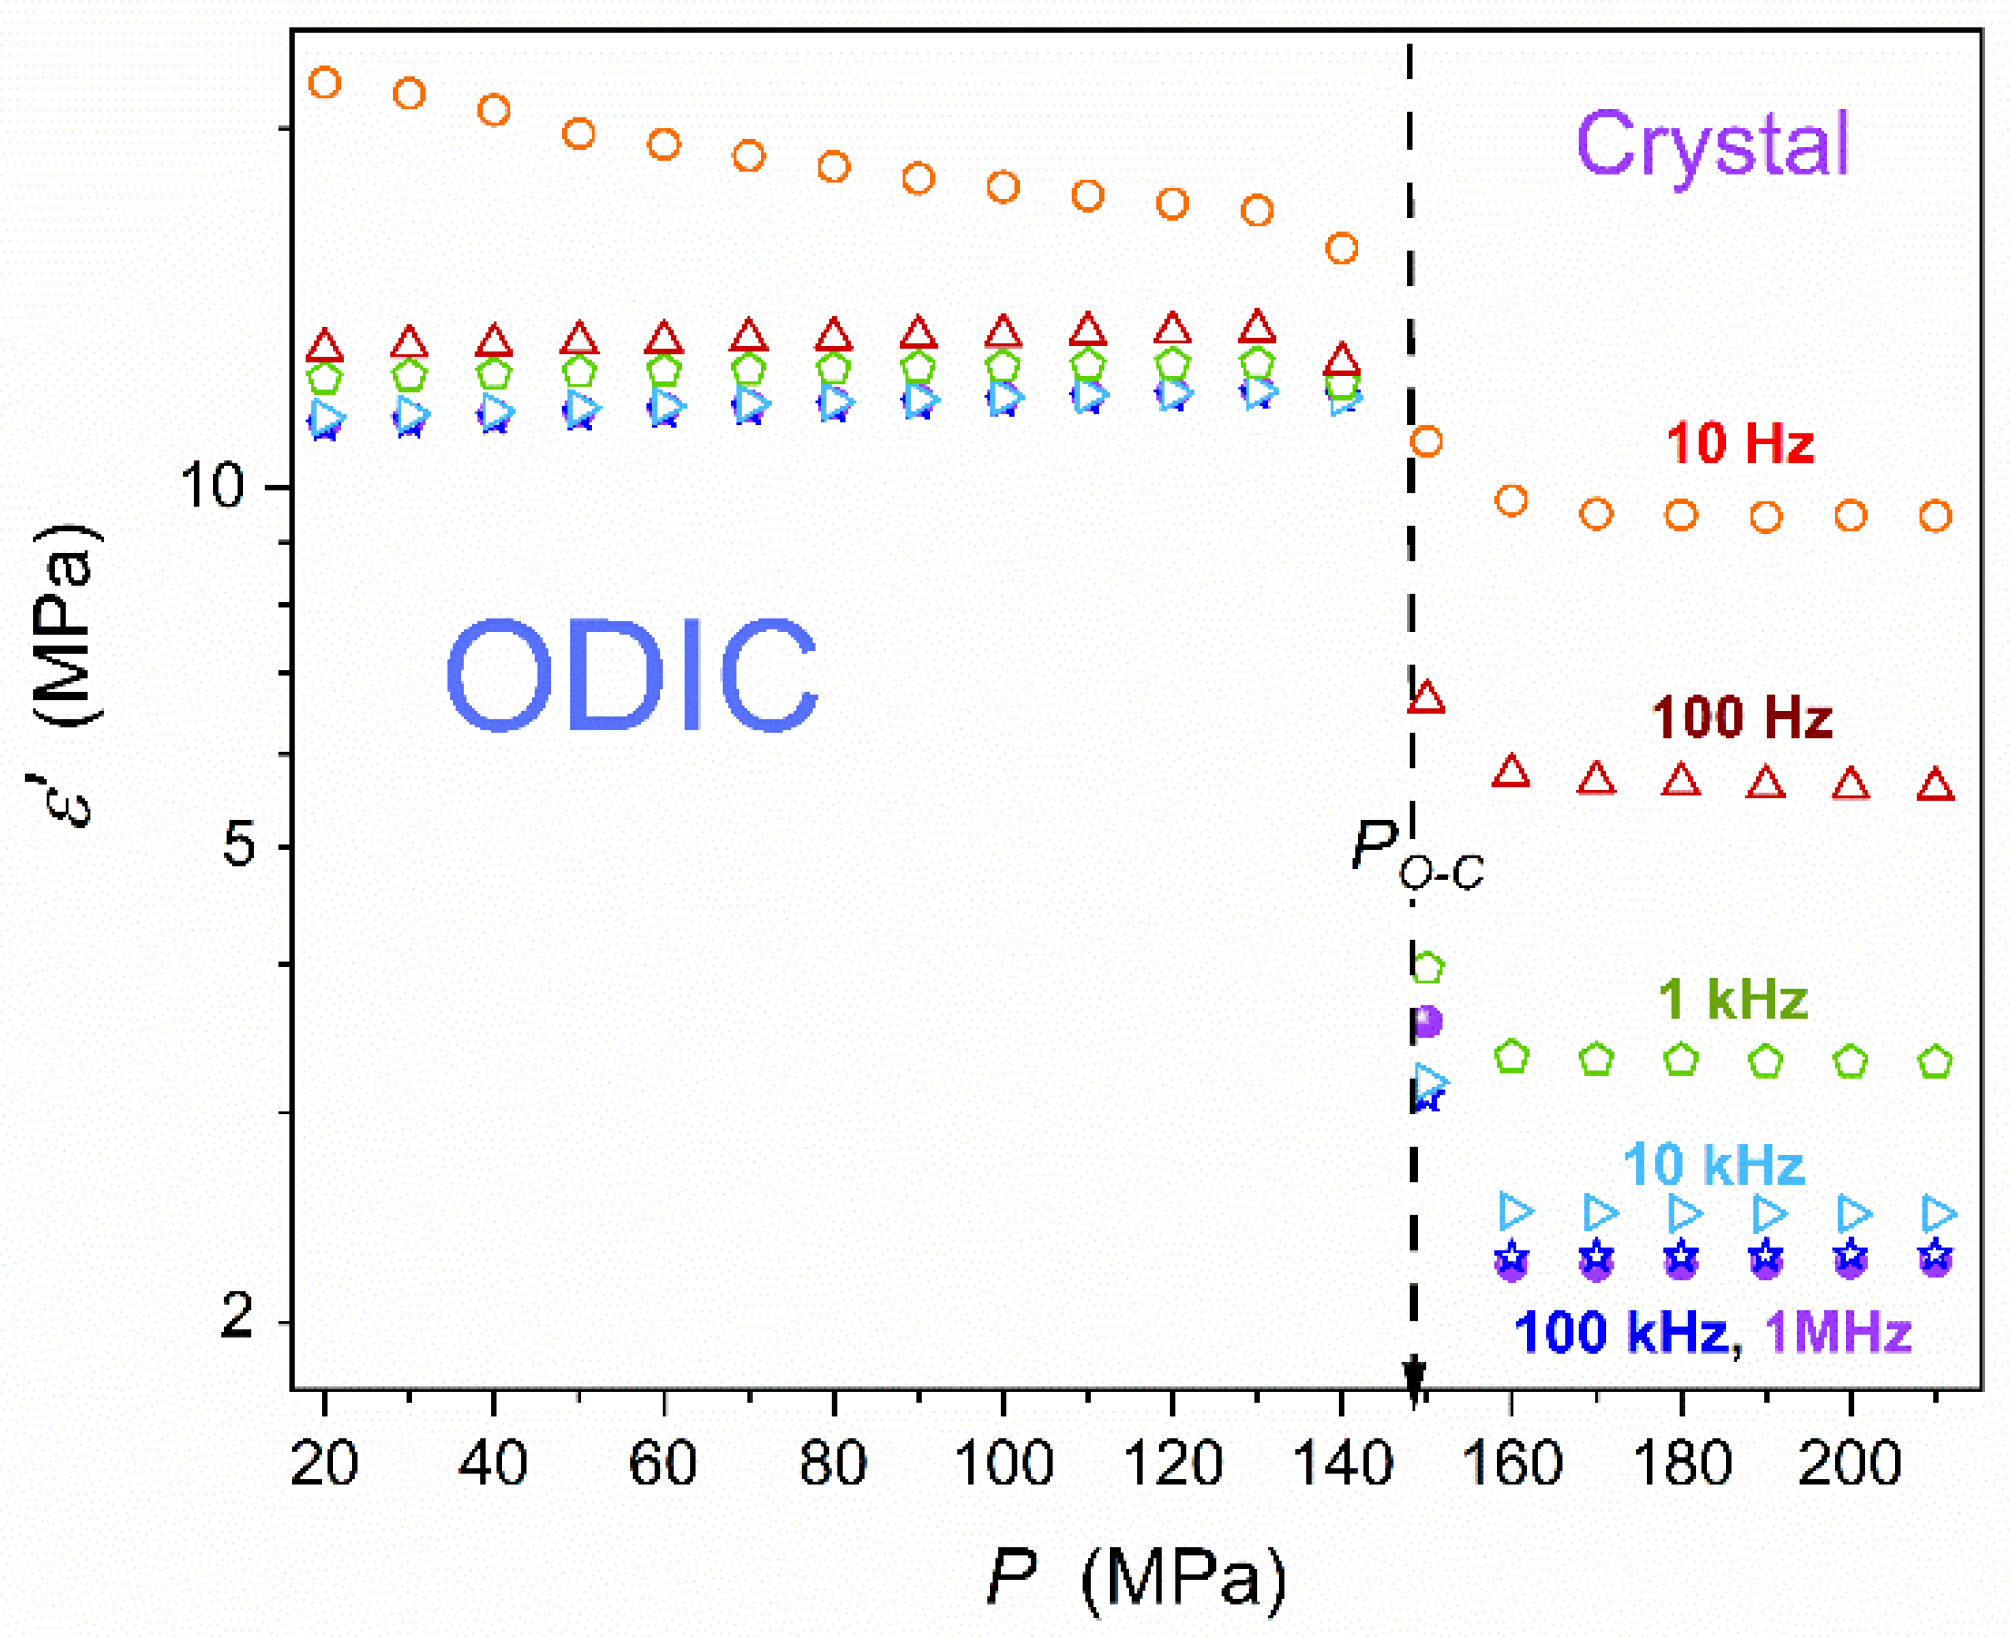
Figure 5 presents isothermal pressure changes of dielectric constant in the surroundings of the discontinuous phase transition. The plot is in the semi-log scale to support the insights both in the ODIC and Crystal phase, despite strong different values. In both phases, the impact of frequency shift to the LF domain is visible. For the static domain, in the frequency range ~100 kHz, changes of
seems to be nearly linear. Visible is a weak pretransitional rise in the solid phase for pressures just above the phase transition.
Studies of temperature changes of dielectric constant in dipolar liquid dielectrics showed that the general tendency in
evolution can indicate the dominant way of permanent dipole arrangements. Namely, for
the preference for their antiparallel arrangement can be expected, and for
the parallel one [
61]. A similar ‘rule’ should be expected in the ODIC phase, with a large range of permanent dipole moments orientational freedom. Implementing this reasoning to isothermal changes on compressing, one should expect
as the indicator of the preferable antiparallel arrangement and
for the parallel one.
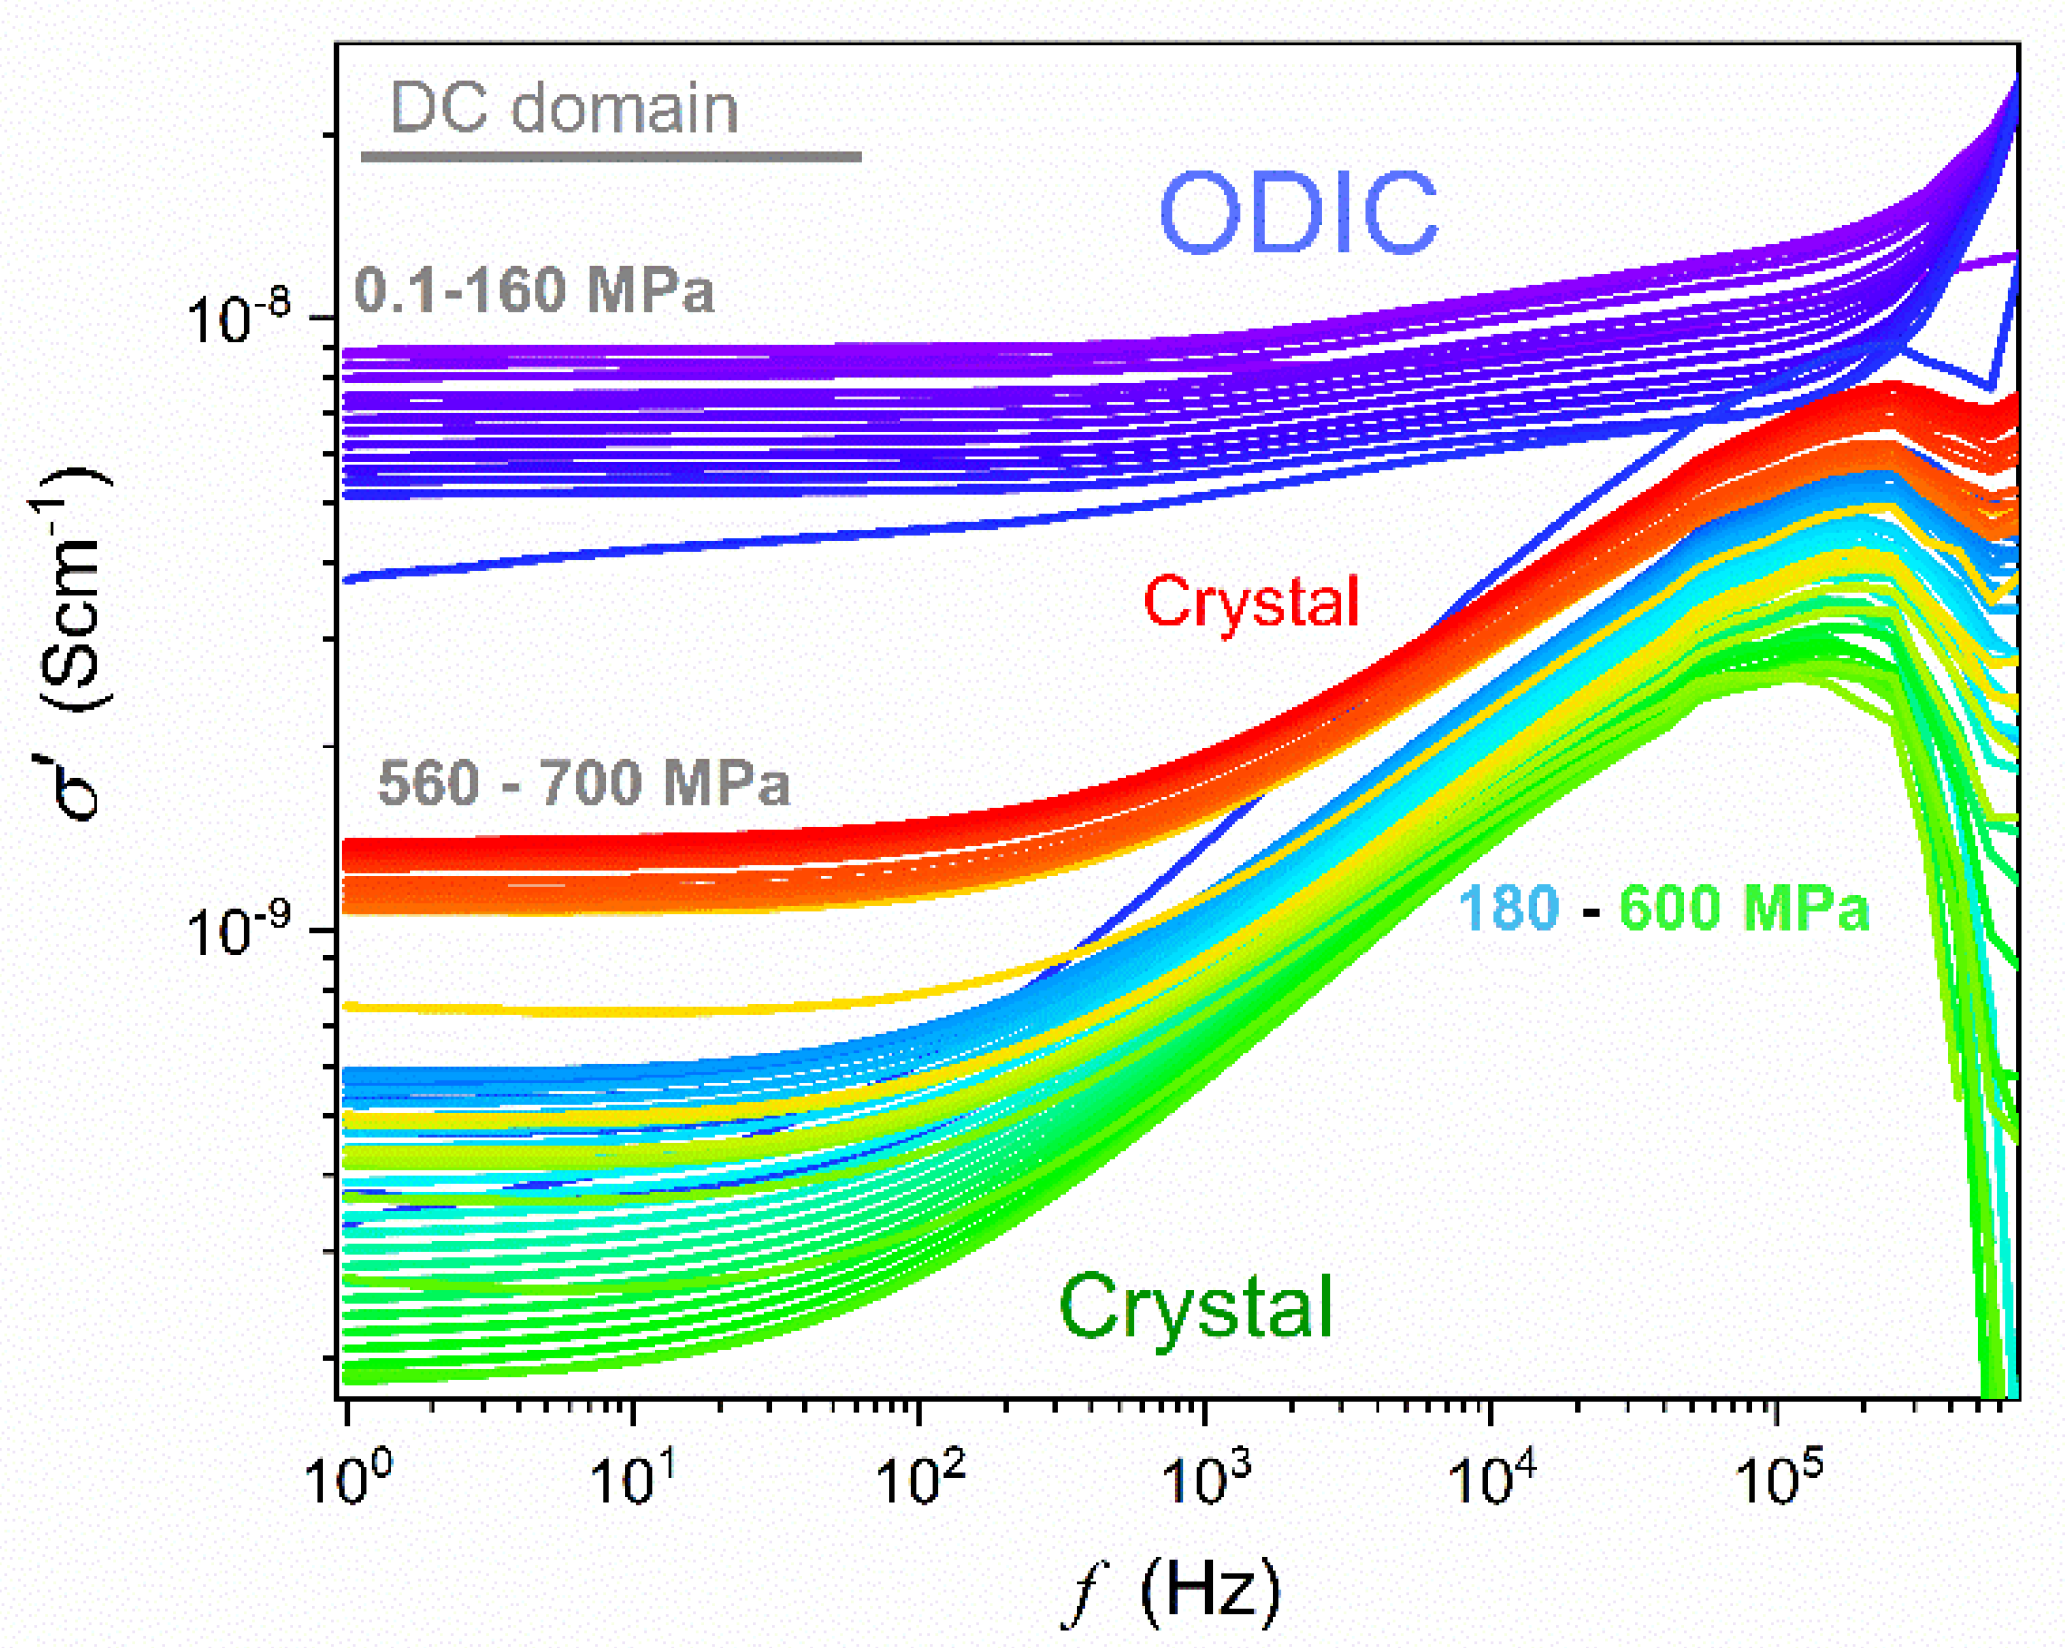
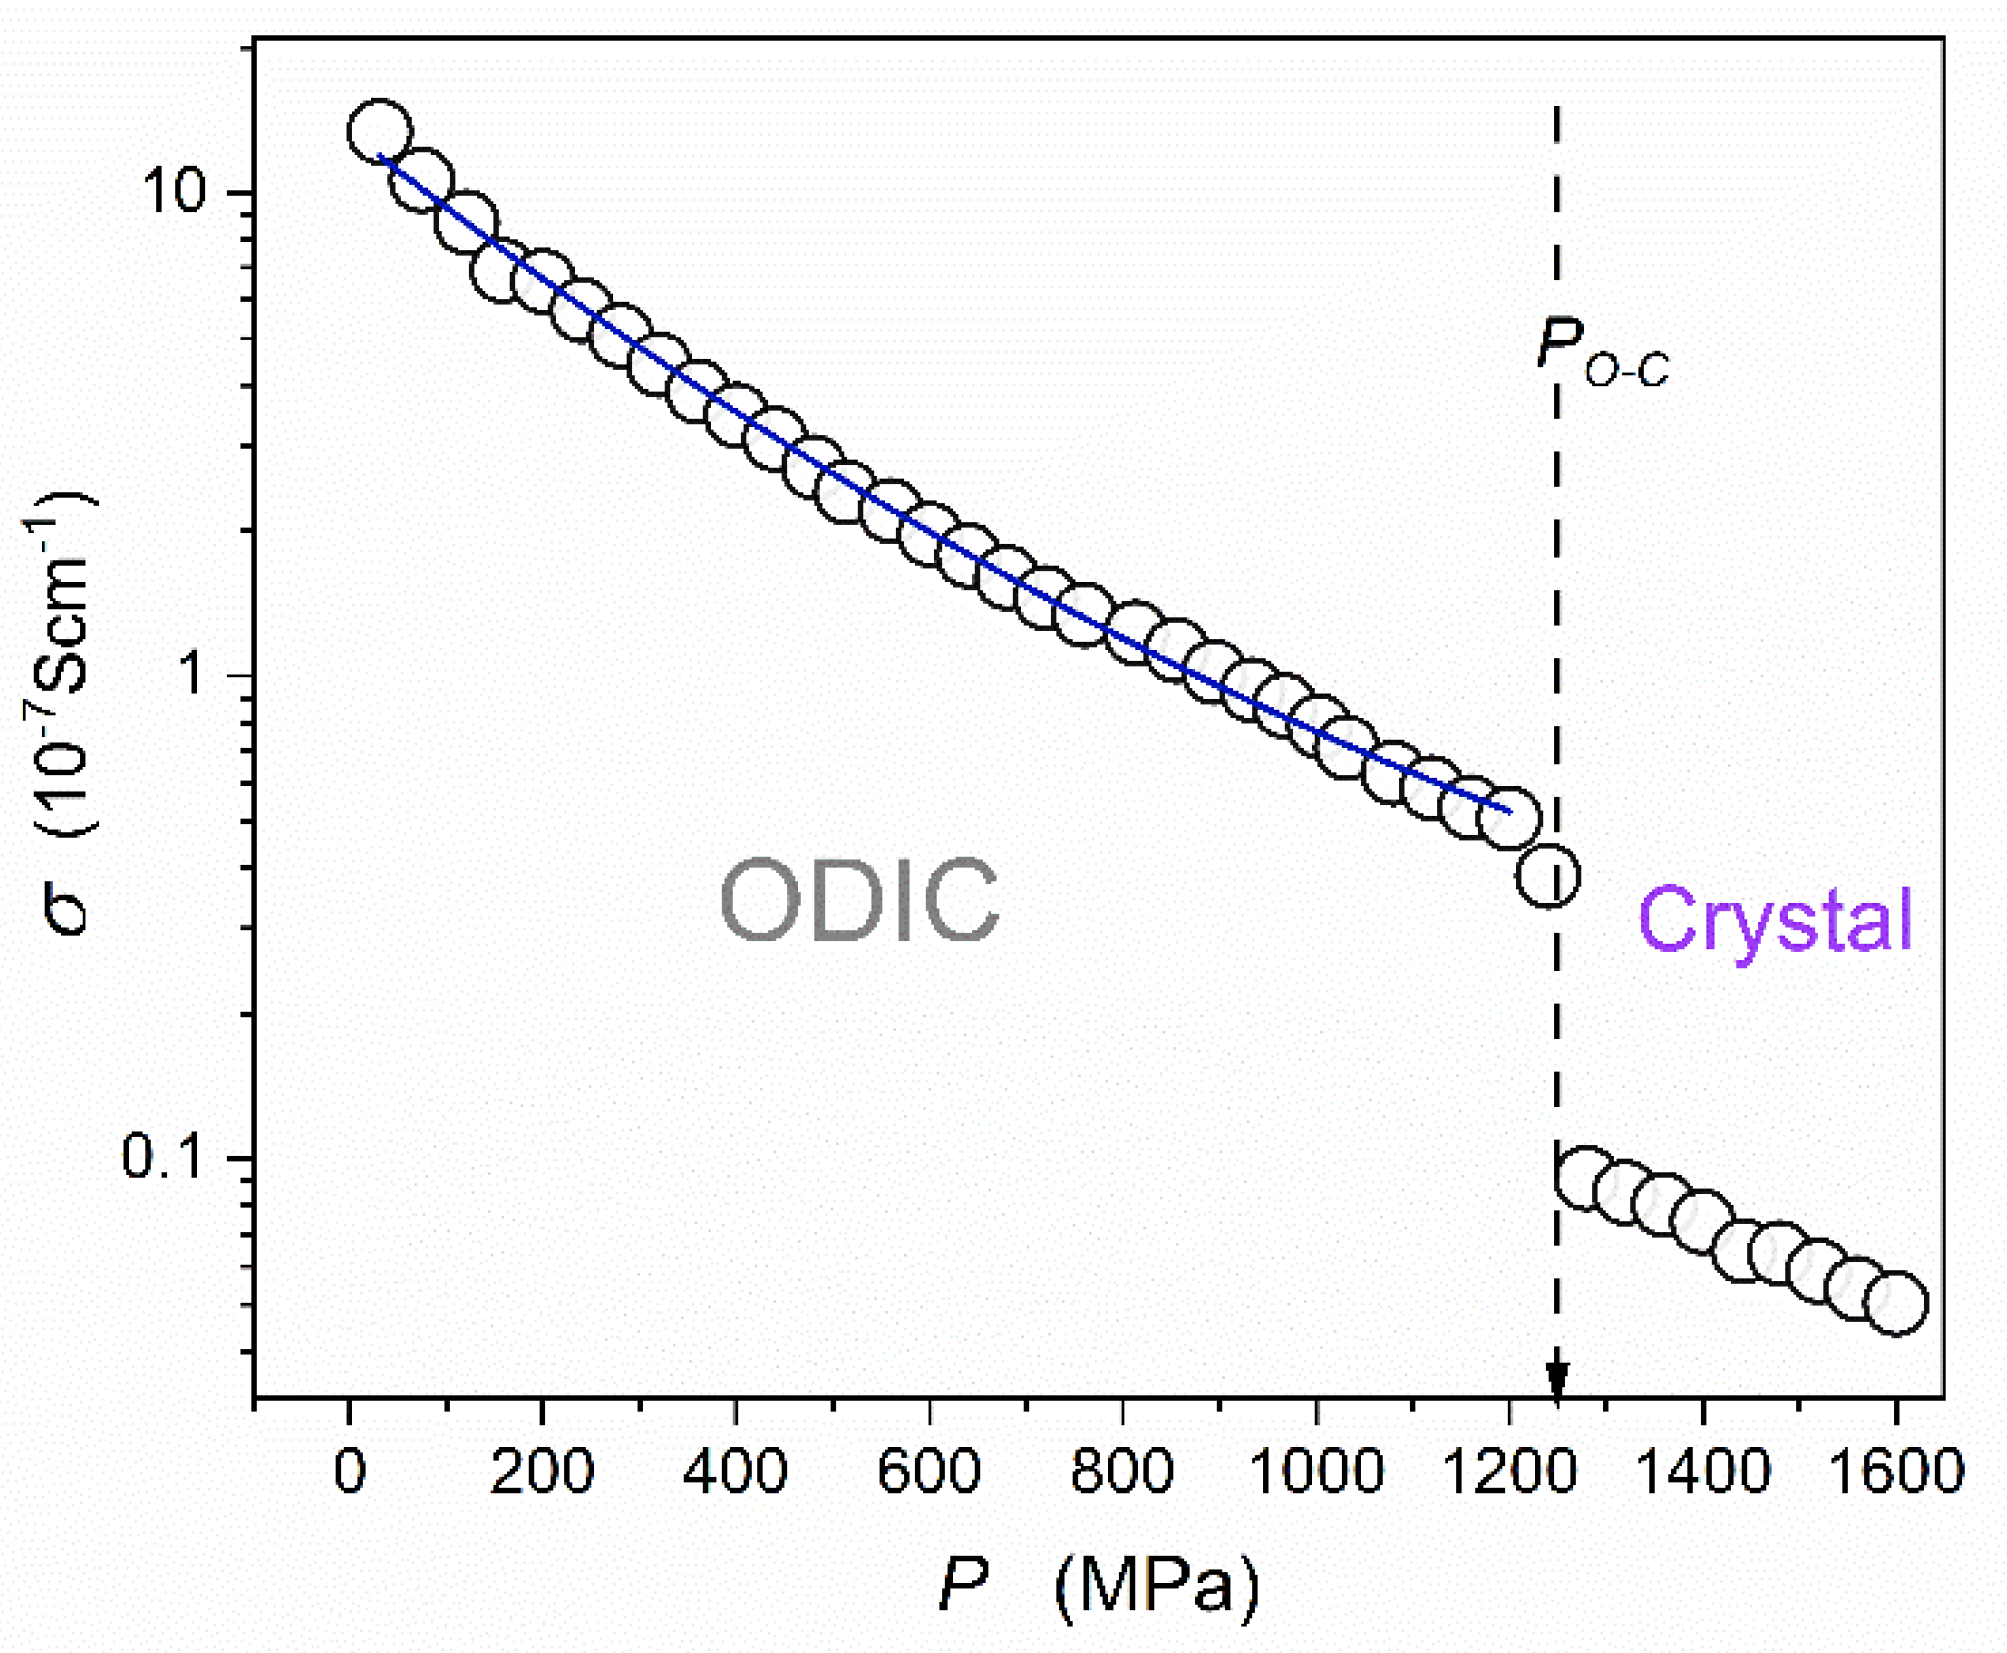
4.2. Electric Conductivity, Moderate Pressures
Figure 6 displays the results of the transformation of experimental data given in
Figure 3 to the electric conductivity representation:
,
[
61], to enable the insight into dynamic properties overcoming the mentioned frequency range limitations in high-pressure studies . The DC electric conductivity domain, which can be considered as the ‘static domain’ parallel for dynamic properties, is indicated by the gray horizontal line. For this domain, the frequency shift does not change the electric conductivity value:
. In the ODIC phase, the DC domain covers 3 decades in frequency:
In the solid crystal phase, such behavior emerges only for
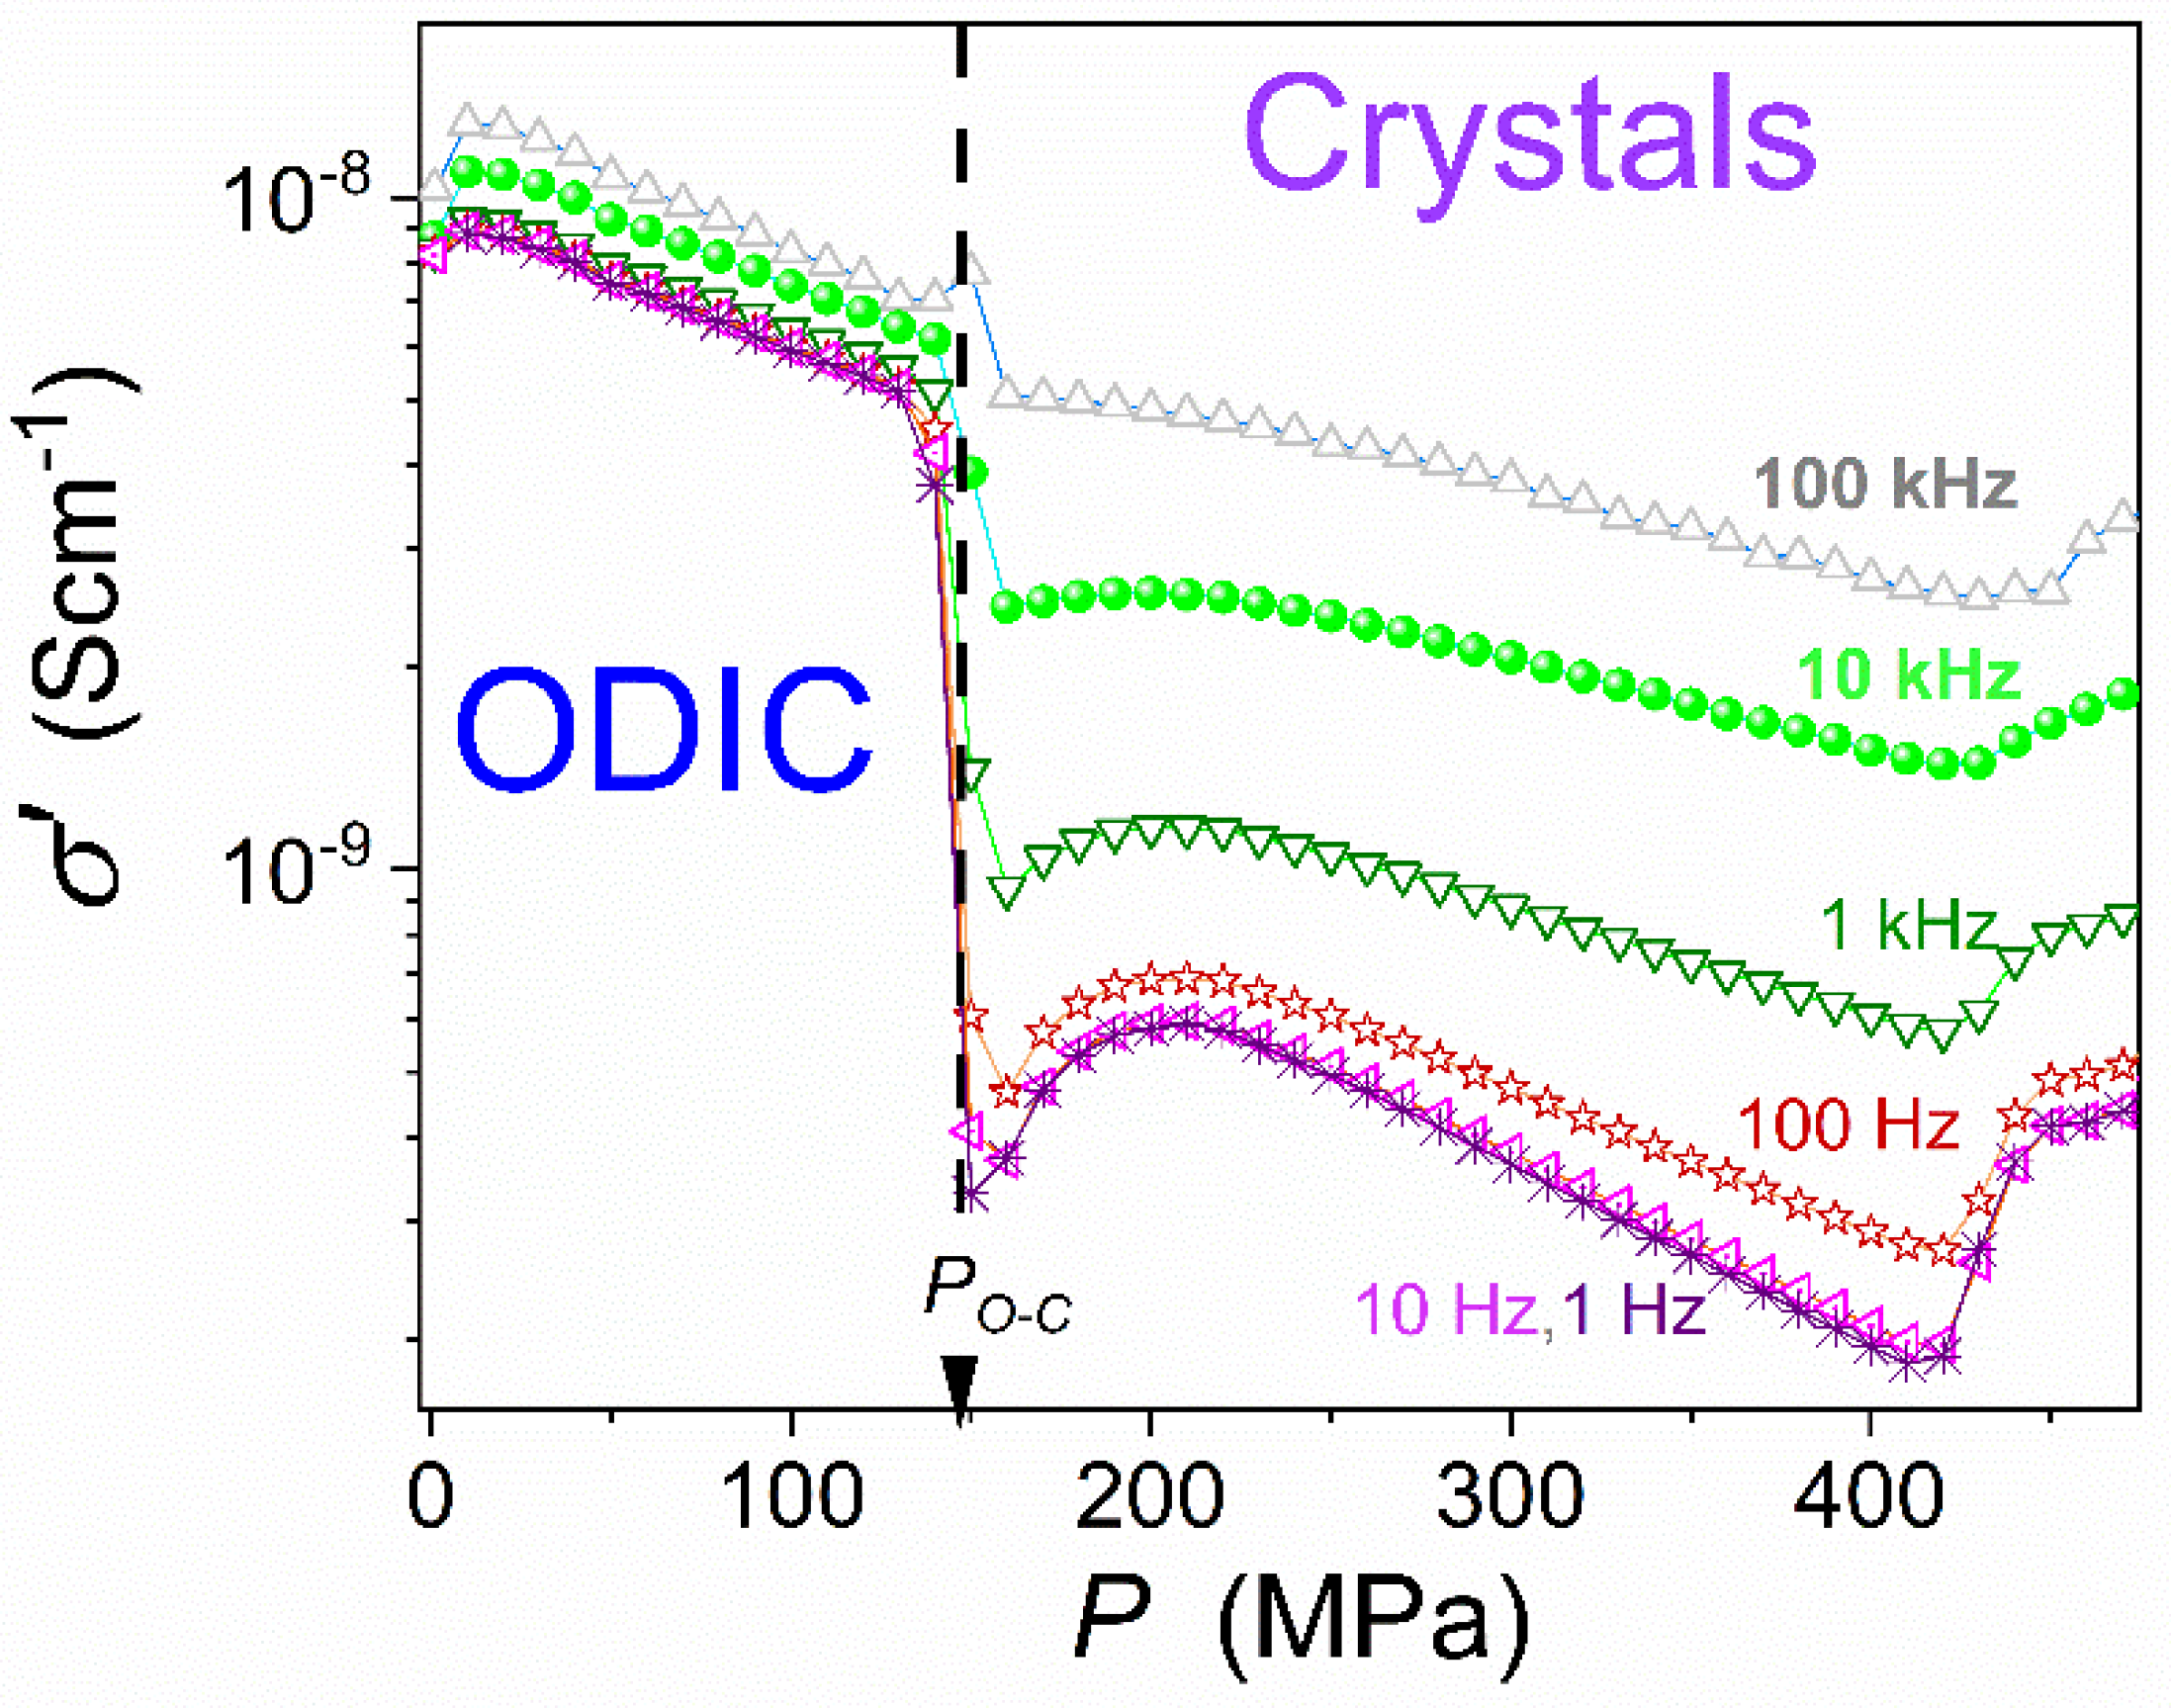
. Pressure changes of electric conductivity, including the DC domain, are presented in
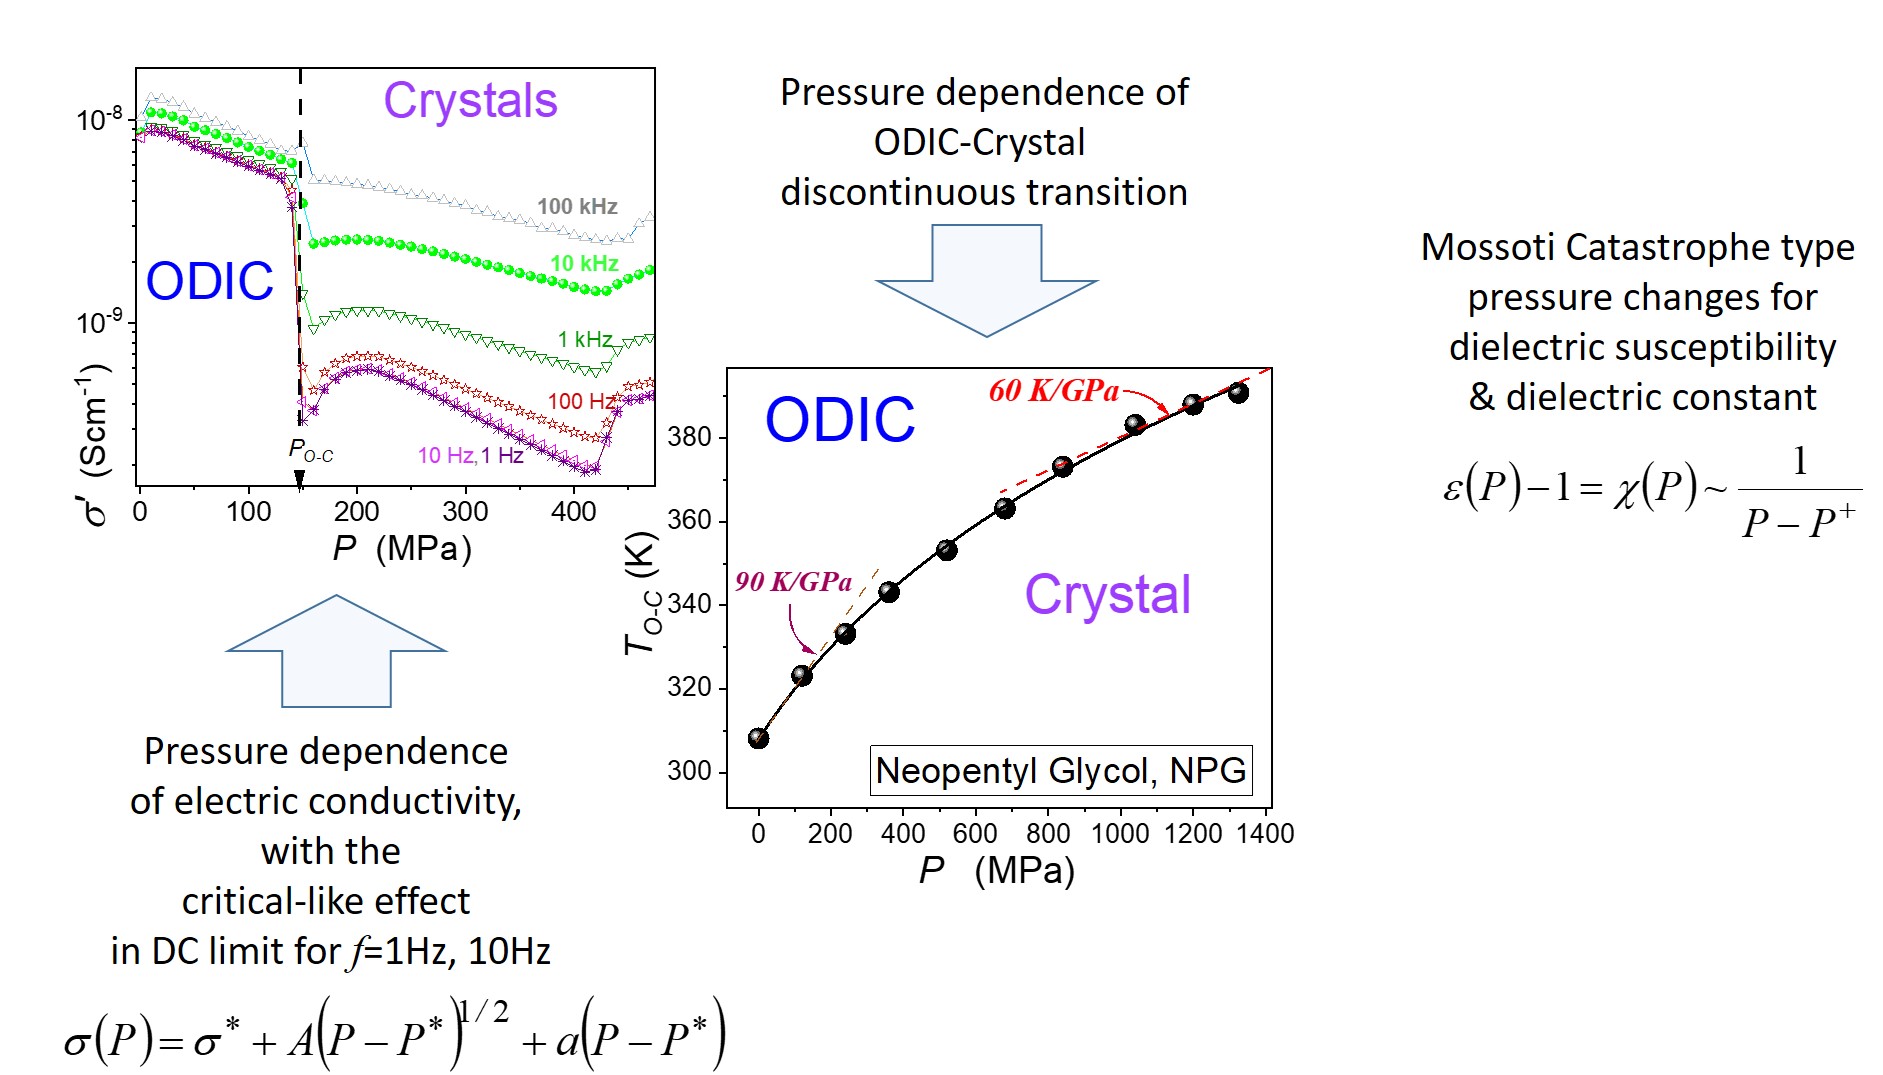
Figure 7. Notable is the complex pattern in the Solid Crystal phase.
Vertical continuous arrows indicate possible phase transitions or transformations in this domain. The first one is for
. The second one is more complex since its hallmarks are frequency–dependent:
.
The ODIC – Crystal discontinuous transition is explicitly visible at
, as shown by the ;thick’, dashed arrow. The striking feature is the pretransitional behavior in the Solid Crystal phase and extends up to
. At least for the first 150 MPa from the transition, it can be approximated by the critical-like relation:
where
are constant parameters, the exponent
, and the singular pressure
, note - it is close to the discontinuous transition
.
The above result is for the DC limited, i.e.,
. The pretransitional effect diminishes when rising the frequency, i.e., shifting away from the DC domain limit.
The results in
Figure 6 are presented in the ‘Barus scale’ i.e.,
vs.
, which can be considered as the pressure counterpart of the Arrhenius scale
vs.
[
42] used in temperature studies under atmospheric pressure. For the ‘Barus scale’ the linear dependence validates the simple behavior with the constant activation volume
in the given pressure range, namely:
where the left side is for the original Barus report [
76] and the right side, with the activation volume
; in the given case
and the empirical Barus parameter
;
means the gas constant.
Notable that the authors of the given report in refs. [
50,
65] introduced the name Barus scale. to honor the author of refs. [
76] who introduced the pressure portrayal via the left side of Eq. (11). It also included names Super-Barus behavior and Super-Barus (SB) equation with the pressure-dependent apparent activation volume
[
50,
65,
77].
4.3.
Dielectric Loss Factor Changes
The dissipation factor
addresses both dynamics and energy-related issues in dielectric materials. It is defined as follows [
61,
64,
78,
79,
80]:
It is the crucial parameter in the evaluation of materials used for isolations in electric equipment, from solid covers of cables, capacitors, and some machines to transformers’ oil. Its measurement can indicate the presence of moisture, aging, or other degradation factors. Such tests are essential to predict dielectric materials' life expectancy and maintenance in tested elements [
78,
79,
80]. Surprisingly, this magnitude, commonly used in material engineering, is hardly discussed in fundamental studies of dielectric properties in solids and liquids [
42,
60,
61,
62,
63,
64].
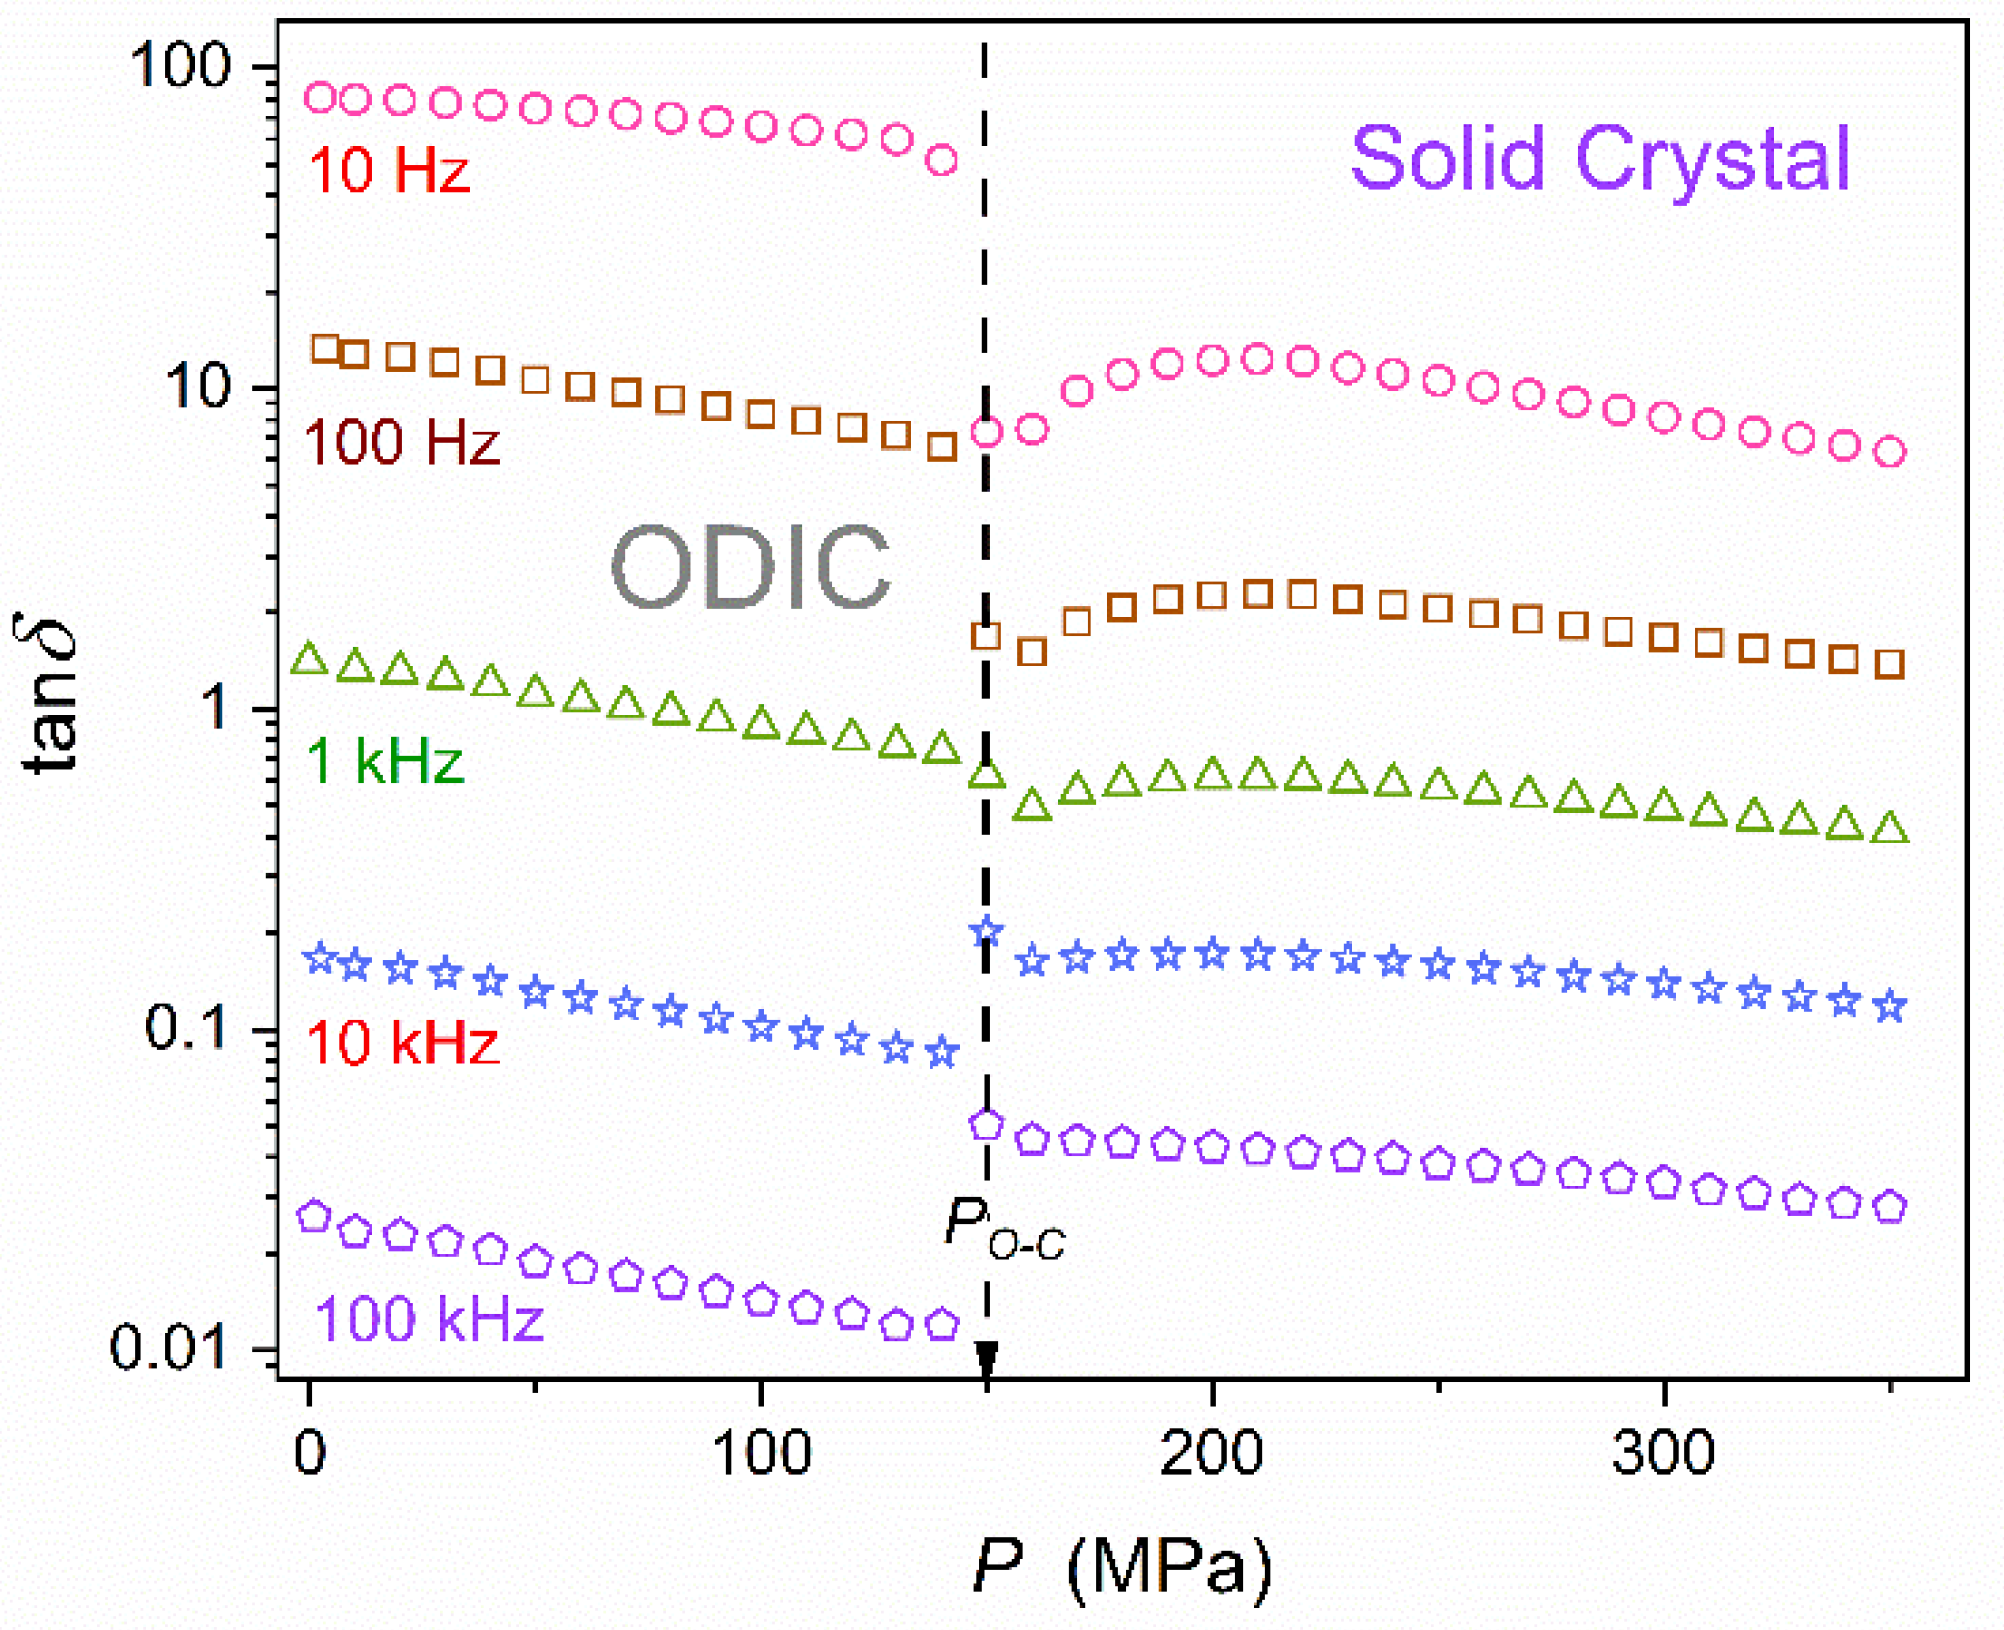
Figure 8 shows pressure changes of the dissipation factor in neopentyl glycol (NPG), derived from experimental data shown in
Figure 2 and
Figure 3. The linear behavior in the semi-log scale plot 8 suggests the evolution following the parallel of the Barus relation, namely:
,
. Nevertheless, pretransitional effects are visible in the solid phase , particularly for the lowest presented frequency. Notable is the significant change in values from
for
, which in applications would be classified as an excellent isolator (no energy loss) for
for
, i.e., the value linked to extremely poor isolator and substantial energy losses that can be converted to heat.
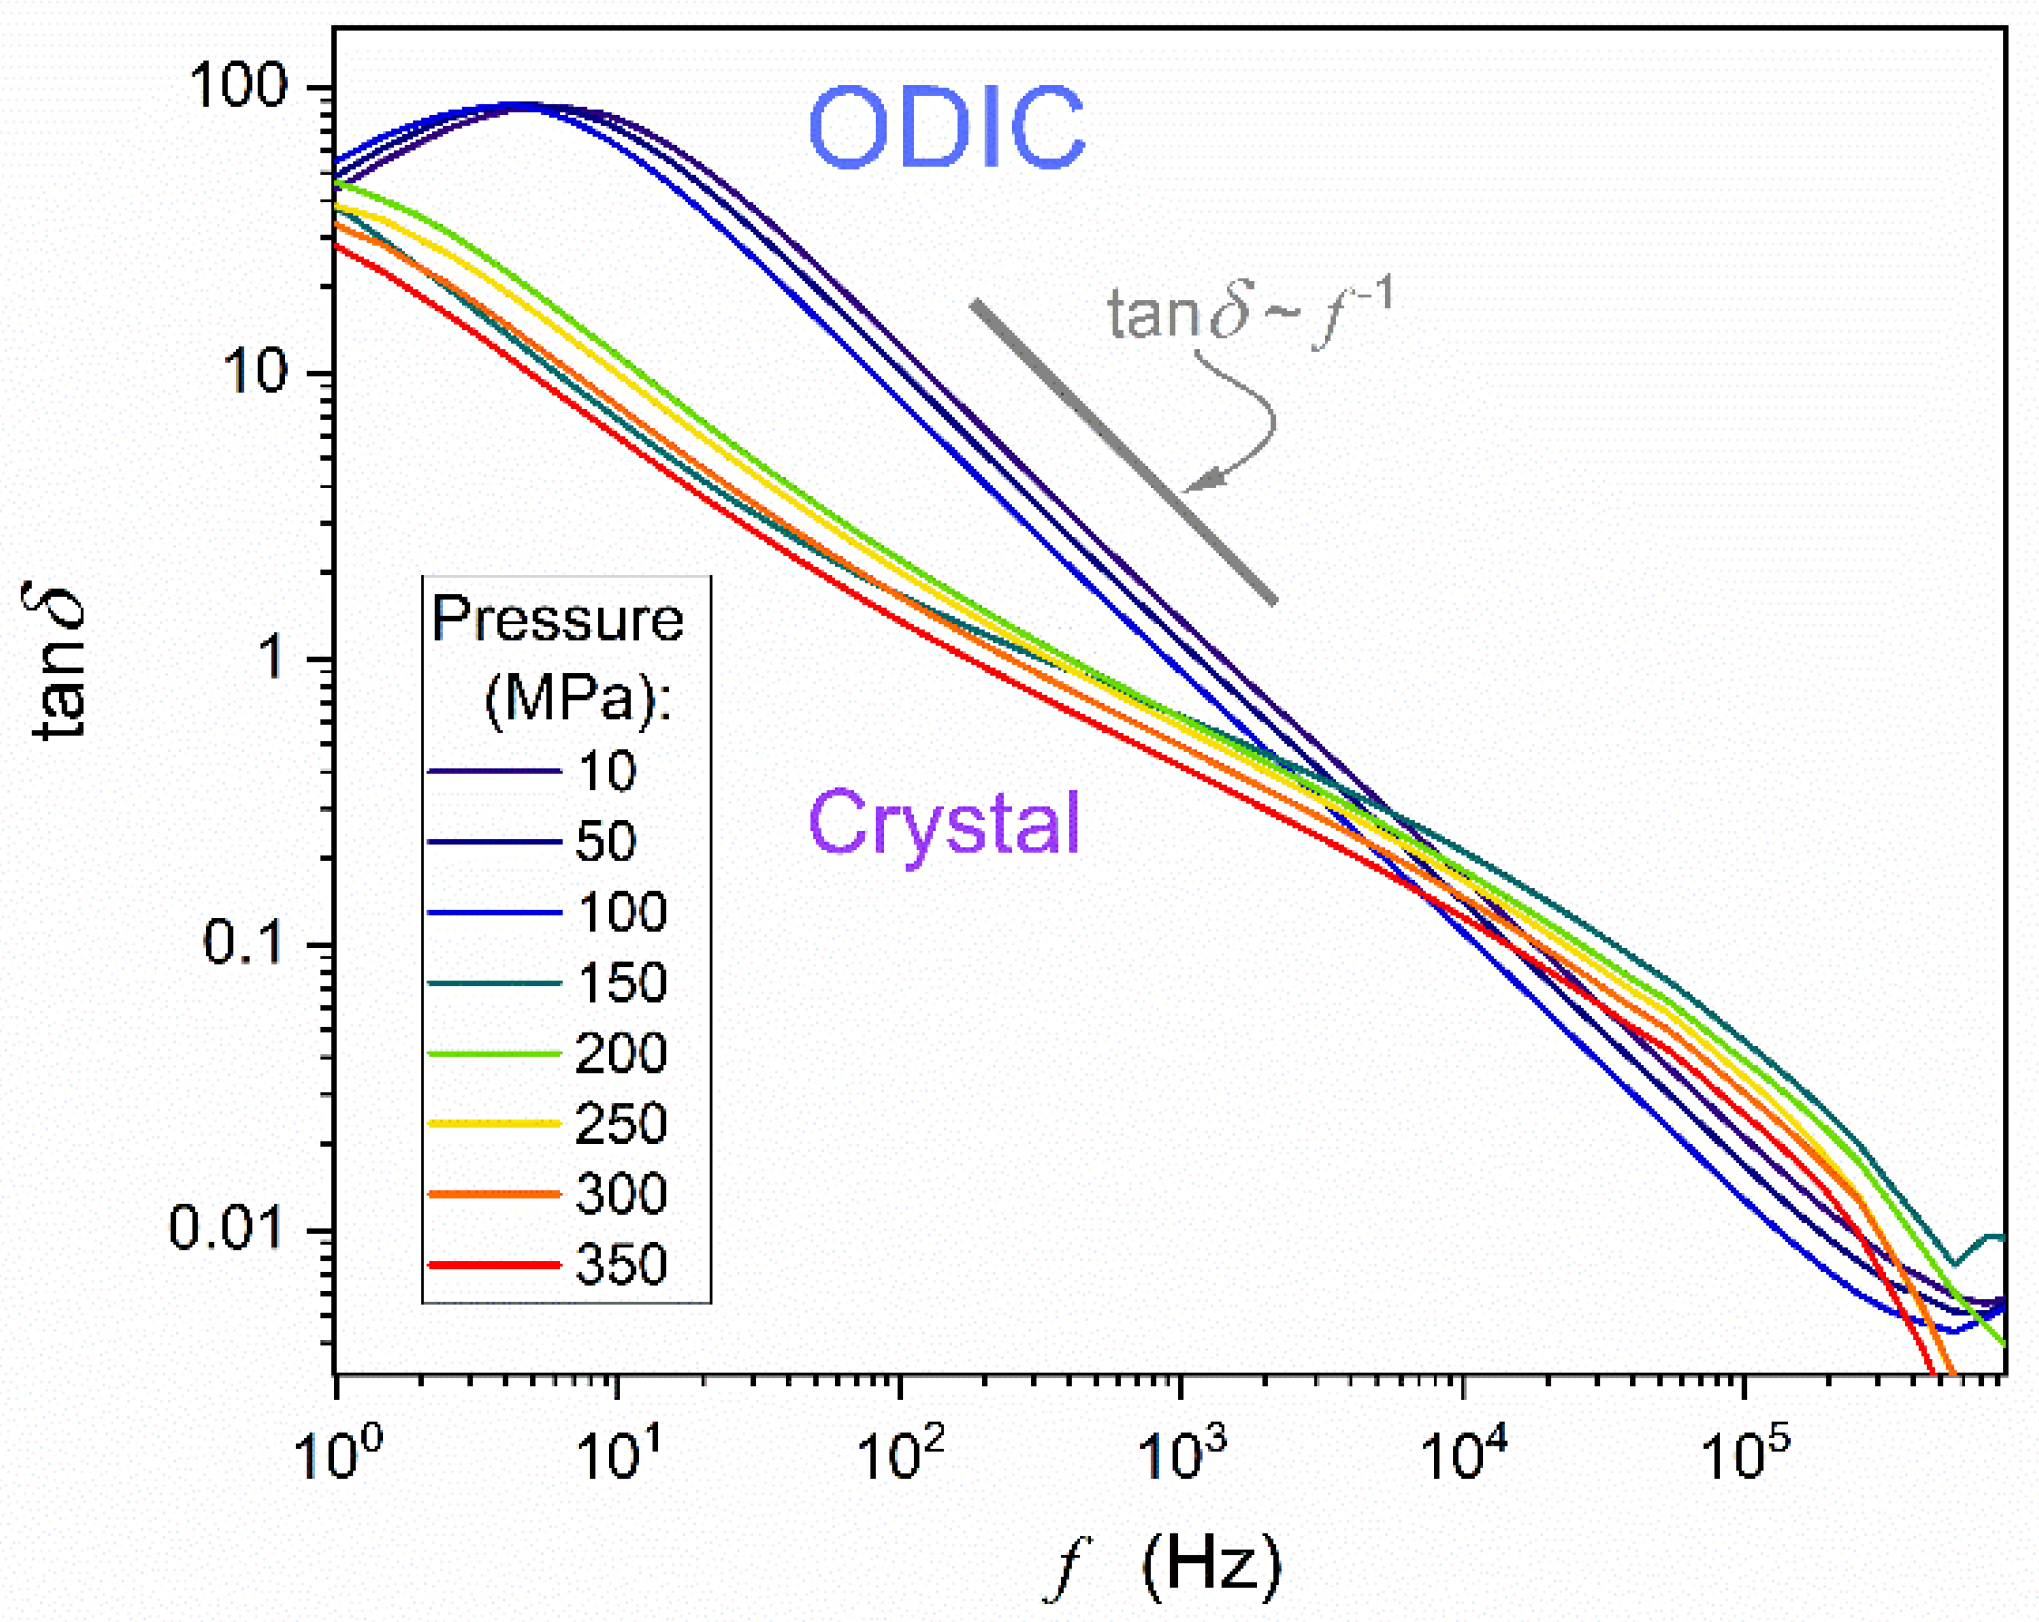
Figure 9 supplements the above discussion by showing
frequency-related spectrum. In the ODIC phase, the plot suggests the evolution
for
. Such behavior is considered as a pattern for a non-ideal capacitor in an AC circuit when the ratio of resistive power loss to reactive power loss is considered [
78,
79,
80]. When commenting such behavior for NPG, one can recall
Figure 3, where ion the ODIC phase
in the static domain, and
. The latter is related to DC electric conductivity domain in
Figure 6. Although the ‘canonic’ static domain terminates at
, it remains only slightly distorted down to
in the ODIC phase. It is notable that usually, in molecular liquid dielectrics,
is the definitive onset of the LF domain boost of dielectric permittivity. These feature of spectra presented in
Figure 2,
Figure 3 and
Figure 6 , confronted with the definition of the disipation factore (Eq. 12) one obtaines
, even down to ~100Hz. In same domain the DC electric conductivity ‘horizontal evolution is equivalent to
. Hence, for the ODIC phase in NPG the appearing model-relation
can be linked to the dominance of translational processes.
The crossover
for low frequencies is associated with the definitive leave by
near static domain domain and LF domain strong boost in values.
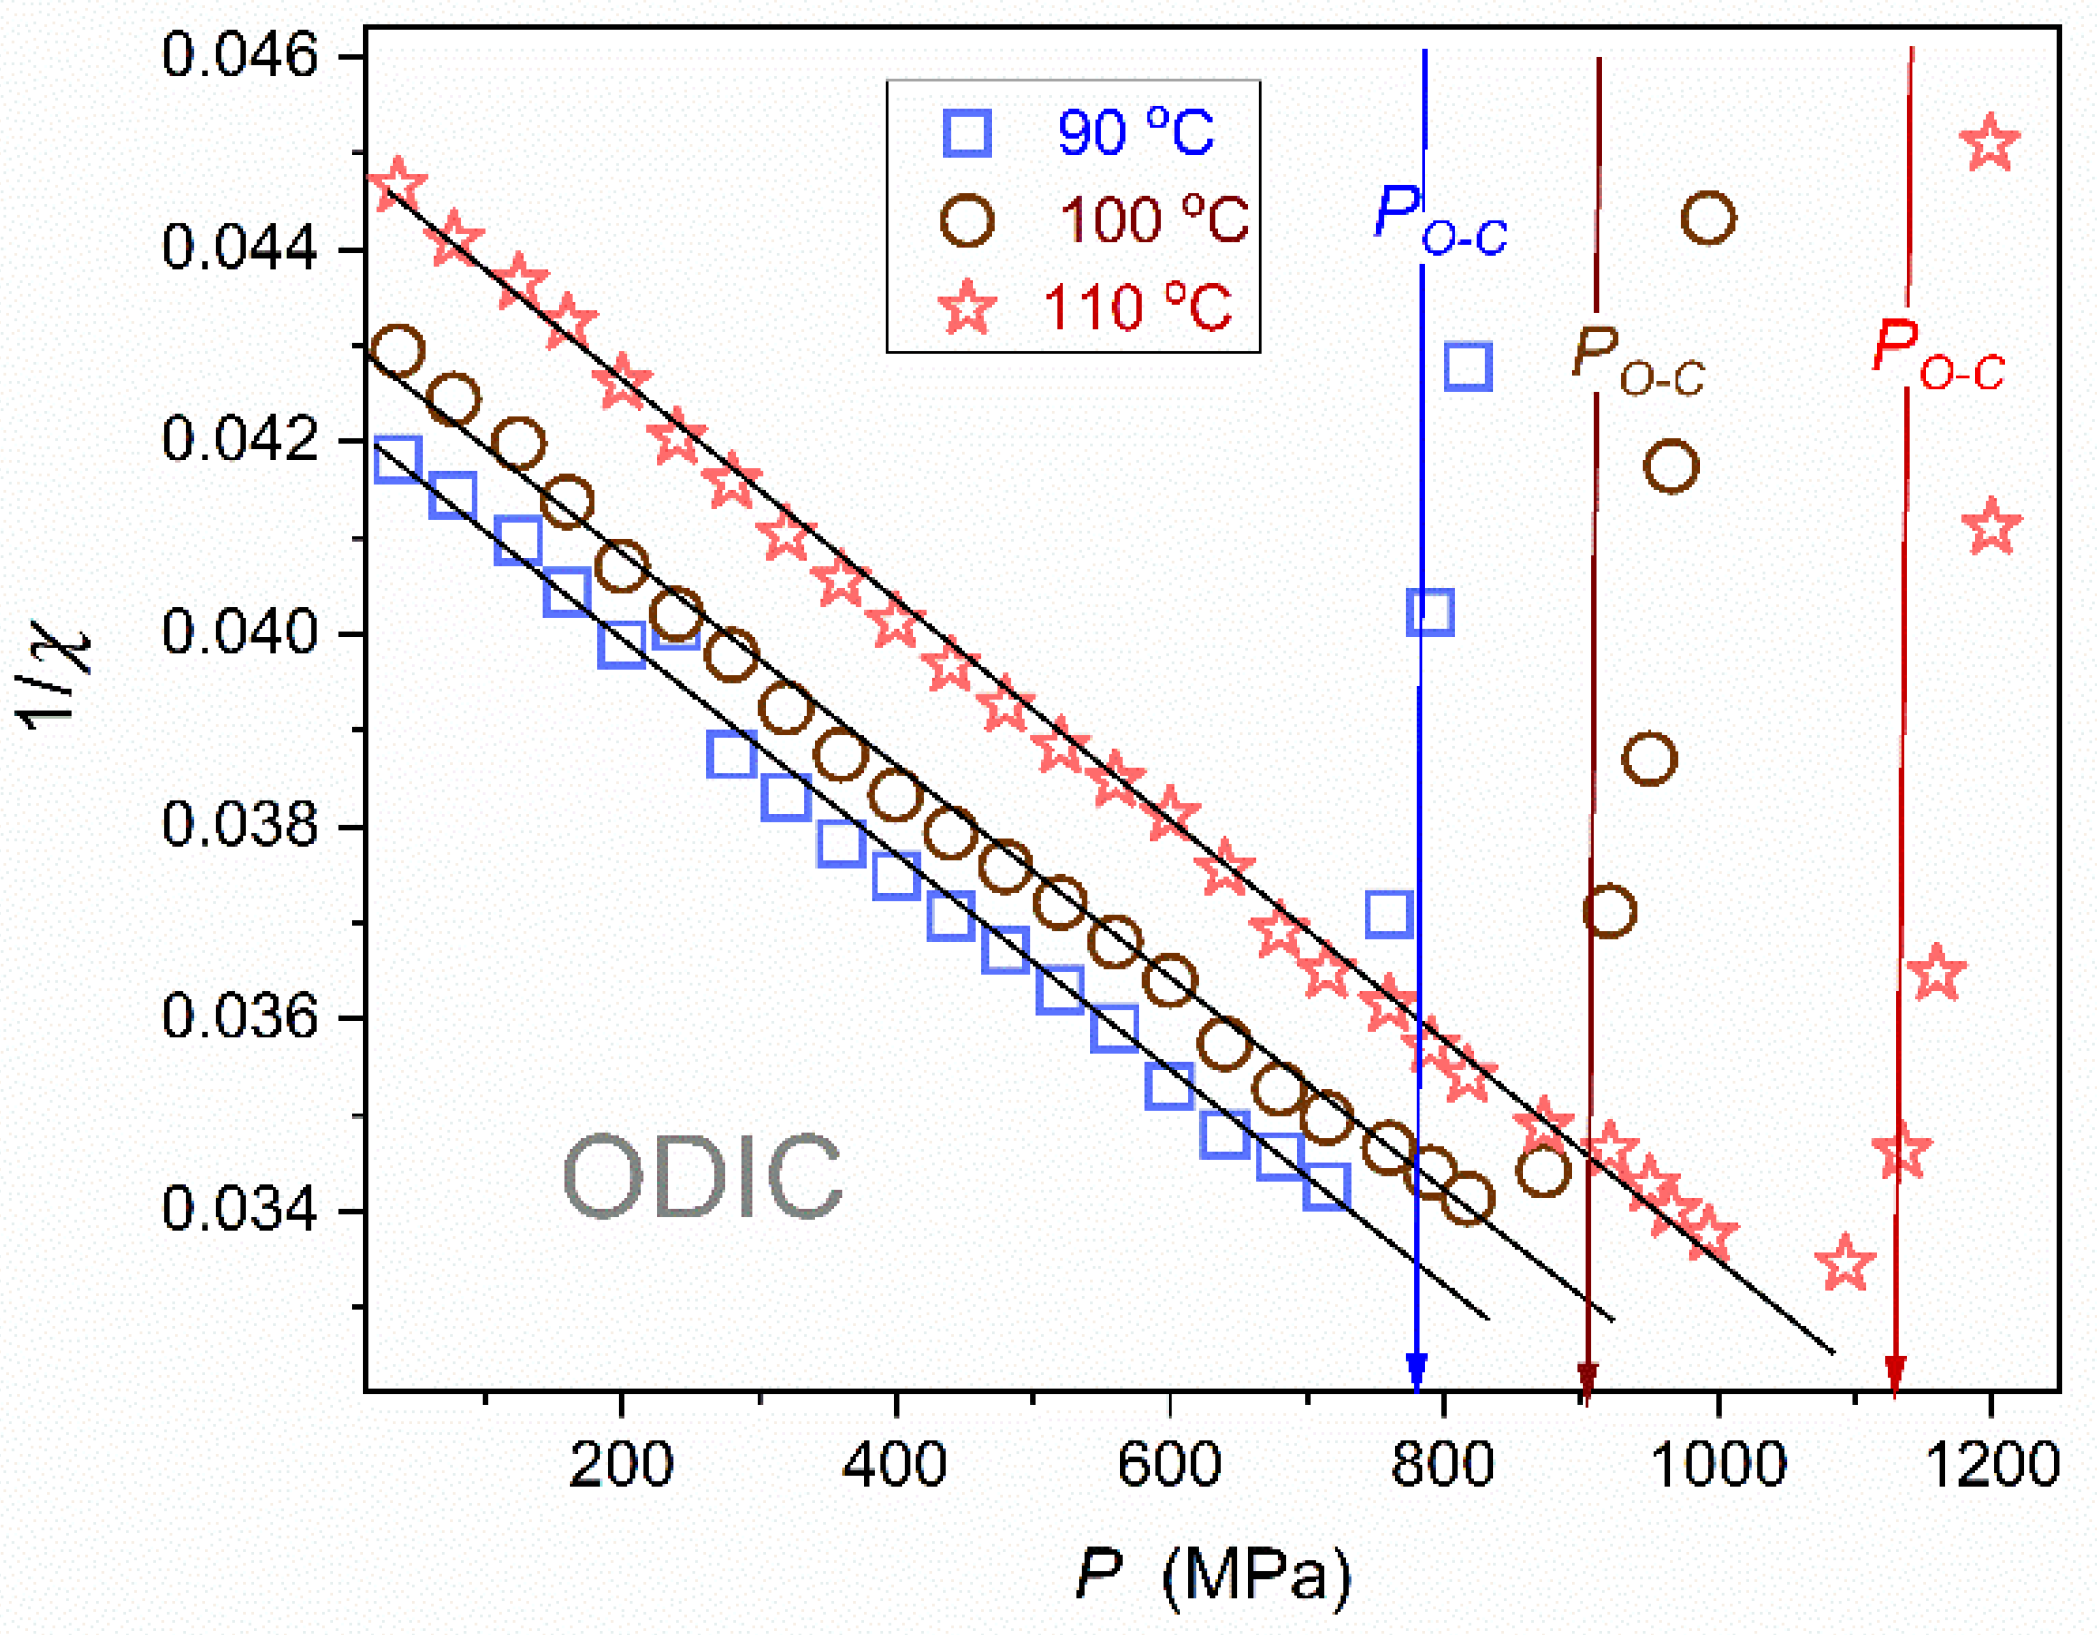
4.4. Dielectric Constant: Extreme Pressures Tests
The above evidence suggests linear changes of dielectric constant and simple Barus-type evolution for electric conductivity. However, it can also be linked to the relatively small pressure range:
. To test this hypothesis, challenging studies for isotherms reaching T = 110 °C, where the ODIC phase extends up to
.were carried out.
The mentioned extreme pressure tests reveal slight distortion from the linear behavior in
changes.
Figure 10 presents the results of these data via the analysis of the dielectric susceptibility
reciprocal. The explicit linear behavior suggests the following scaling pattern:
where
and
is the extrapolated singular pressure;
and
.
Notable is the similarity of the pressure related Eq. (13) and temperature related Eq. (6) The latter has been just repported in ODIC phase of NPG [
43] and earlier in cyclooctanol [
66]. In those reports, it was explained via precursors of the Mossotti – Catastrophe behavior and the validation of the Clausius-Mossotti simple local field modeling. The similarity of Eq. (6) for temperature and Eq. (13) for pressure changes in the ODIC phase also recalls the Isomorphism Postulate within the
Critical Phenomena Physics [
35]
, suggesting the same critical scaling pattern when a given physical property is tested along two different field variable related paths of approaching continuous phase transition. It is particularly related to values of universal critical exponents for pressure and temperature paths of approaching the critical. For the ODIC phase of NPG, Eq. (13) for
and Eq. (6)
aloso resemble the Curie-Weiss type behavior pattern in the paraelectric phase of ferroelectric materials, coupled to the susceptibility (compressibility) exponent (
).
2.5. DC Electric Conductivity: Extreme Pressures Test
Figure 11 presents the evolution of DC electric conductivity in the ODIC phase extended up to
‘extreme’ pressure. It reveals a slight distortion from the apparent Barus pattern visible in
Figure 7, where the ODIC phase covers only
. The nonlinear, non-Barus, behavior in
Figure 11 is visible but it is too weak for a reliable and decisive fitting by a model equation.
To overcome this problem, the analysis recalling the super-Barus equation, i.e., the extension of Eq. (11) with the pressure-dependent apparent activation energy
can be considered. Generally, such super-Barus equation cannot be used for fitting electric conductivity
, primary relaxation time
or viscosity
data because of the unknown general pattern of
changes. Nevertheless, it is commonly used for estimating the apparent activation via the following relation Eq. (11) [
81,
82,
83,
84,
85,
86,
87,
88,
89,
90]:
In the analysis using the above equation it is assumed that the right part of the above relation estimates the apparent activation volume estimation, i.e.,
. Unfortunately, this assumption is essentially wrong, i.e.,
and
determine the steepness index for the non-Barus type experimental data presented in the Barus scale plot [
50,
77]. Namely, the right part of Eq. (14) can be obtained only by assuming
. The proper analysis of the super-Barus relation, gives [
50,
77]:
The term
only for the basic Barus equation with
.
A protocol overcoming this problem and allowing the determination of the real apparent activation volumes for subsequent pressures was proposed by Drozd-Rzoska [
77], where the prevalence of the following extension of the SB relation was also indicated:
where
;
is the absolute stability (spinodal) limit for the tested isotherm
.
Originally in refs. [
50,
77], the discussion was carried out in frames of the primary relaxation time. Eq.(16) take into account that for real liquids and solids, the pressure
does not constitute any specific reference. Such value can be passed without any hallmark into the negative pressures domain, where isotropic stretching until reaching
value is possible.
is the terminal point only for gases [
50,
77].
Figure 12 presents pressure changes of the apparent activation volume, related to Eq. (16) and recalling the analysis presented in ref. [
77]. Notable that for the basic Barus relation, i.e., Eq. (11) with
, the horizontal line related to
should appear.
The linear parameterization appearing in
Figure 12 can be substituted to Eq. (16), yielding the following dependence portraying experimental data in the ODIC phase of NPG:
where
, and values of
,
are given in the caption of
Figure 12.
The result of such decription is shown by the red curve portraying experimental data in
Figure 12: Notably, that the described routine avoids a nonlinear fitting.
4.6.
Pressure Dependence of the ODIC-Crystal Discontinuous Phase Transition Temperature
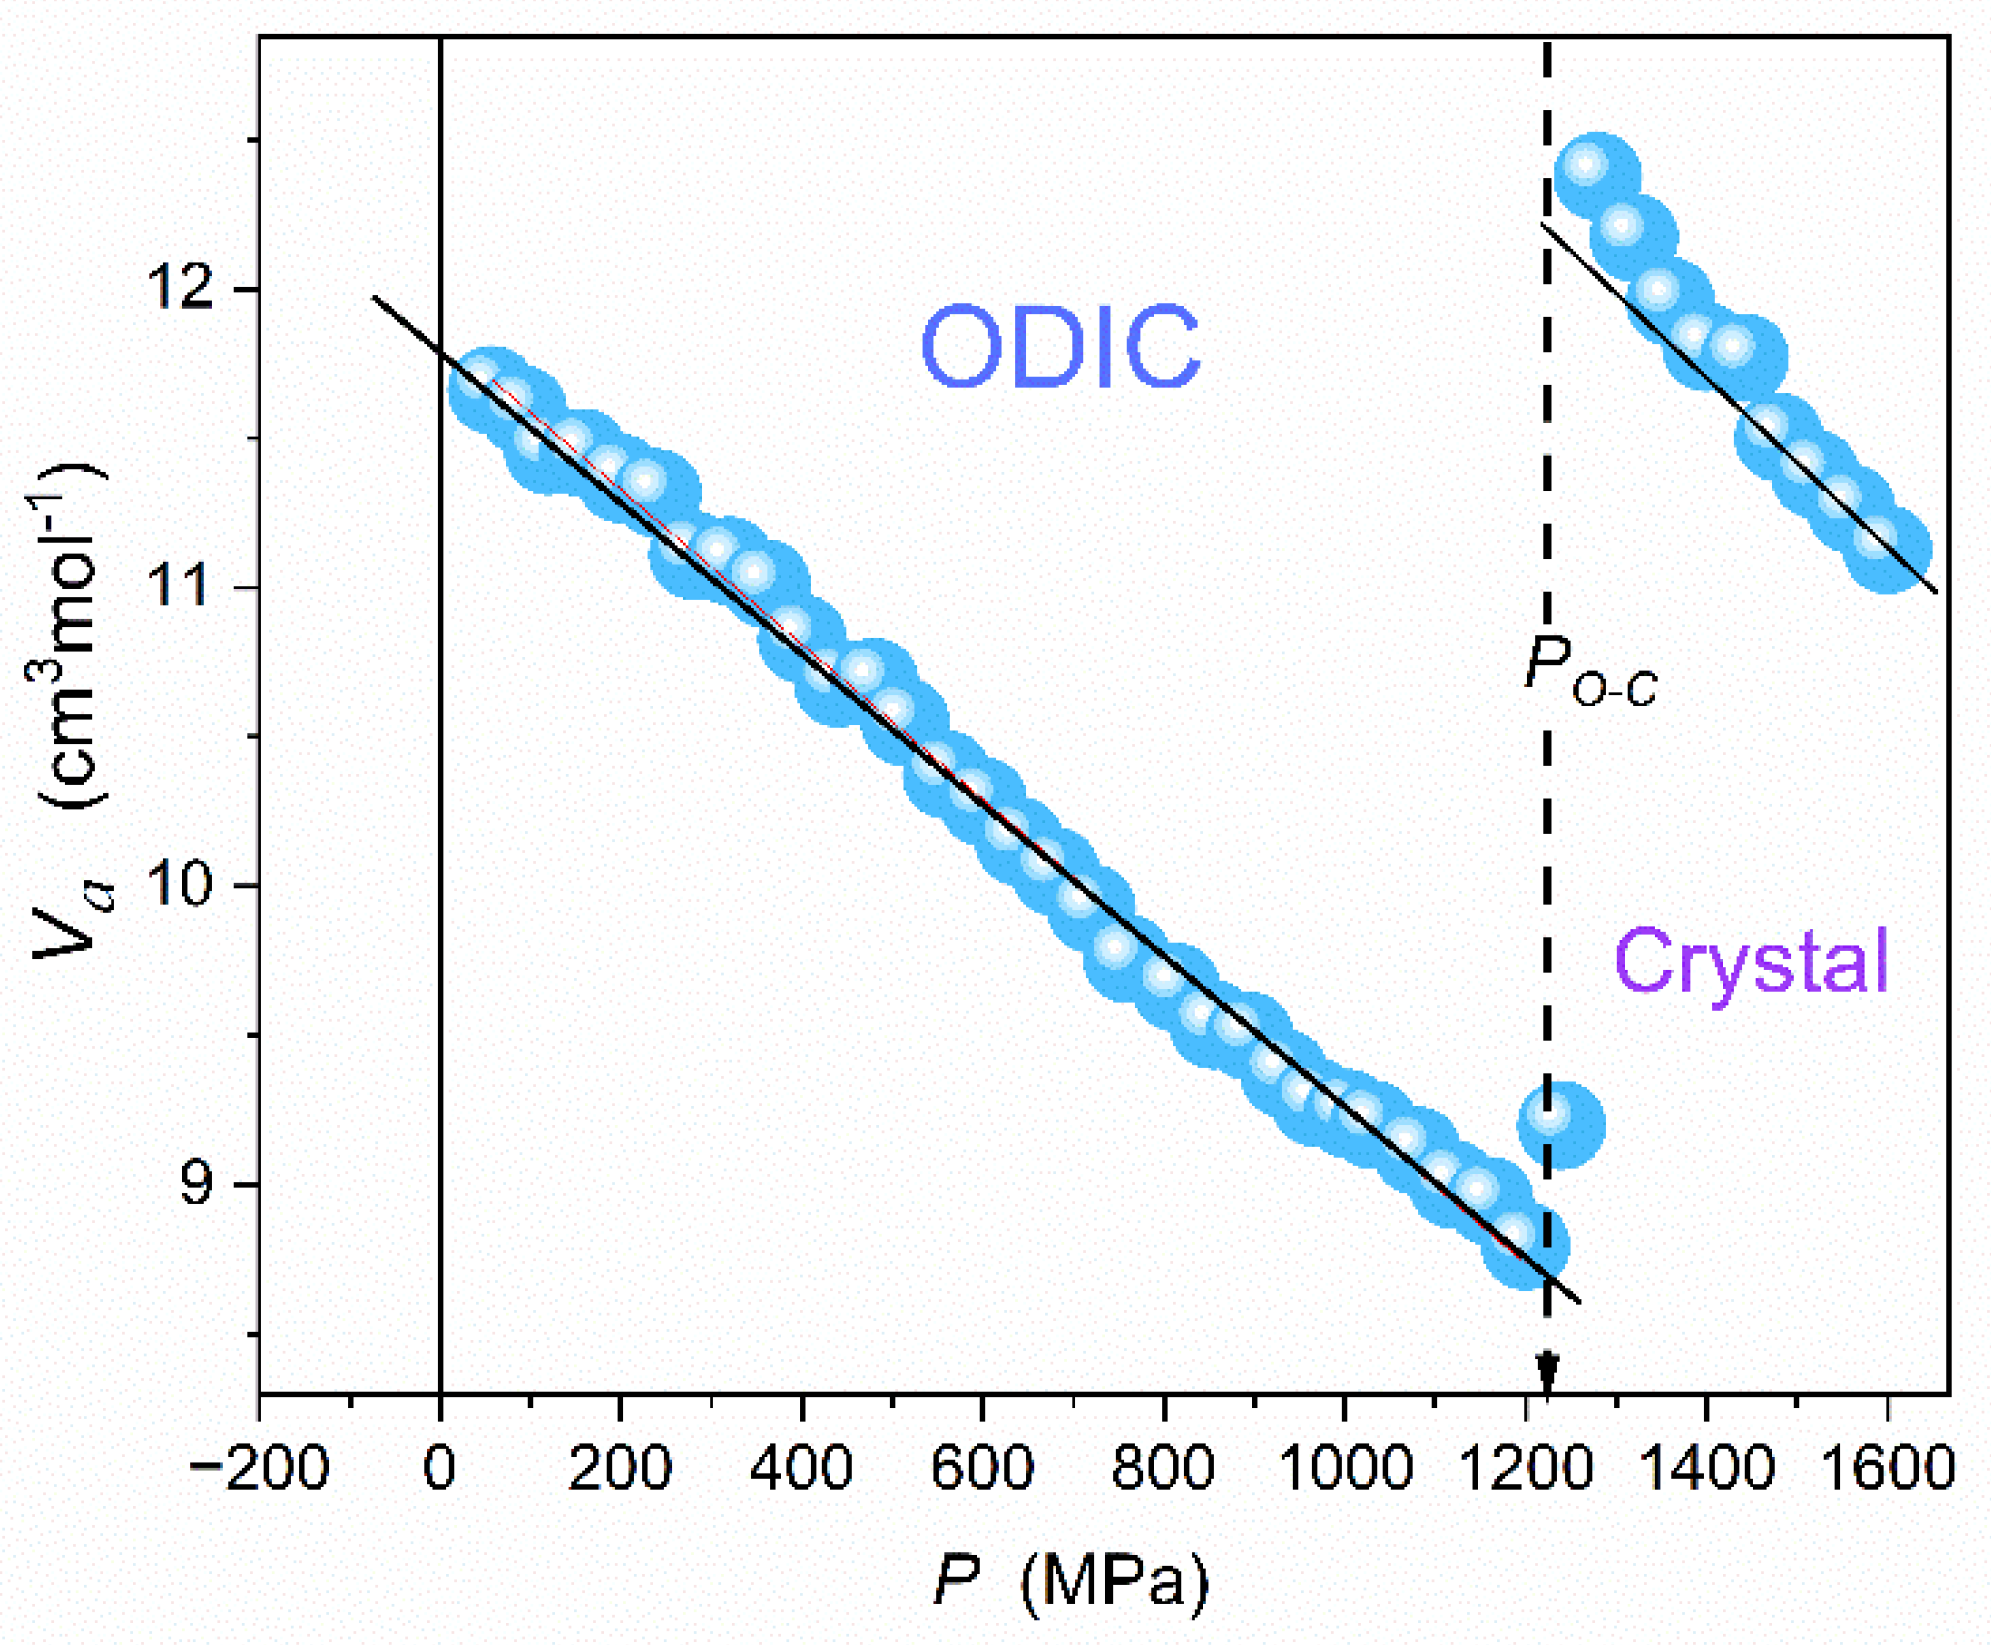
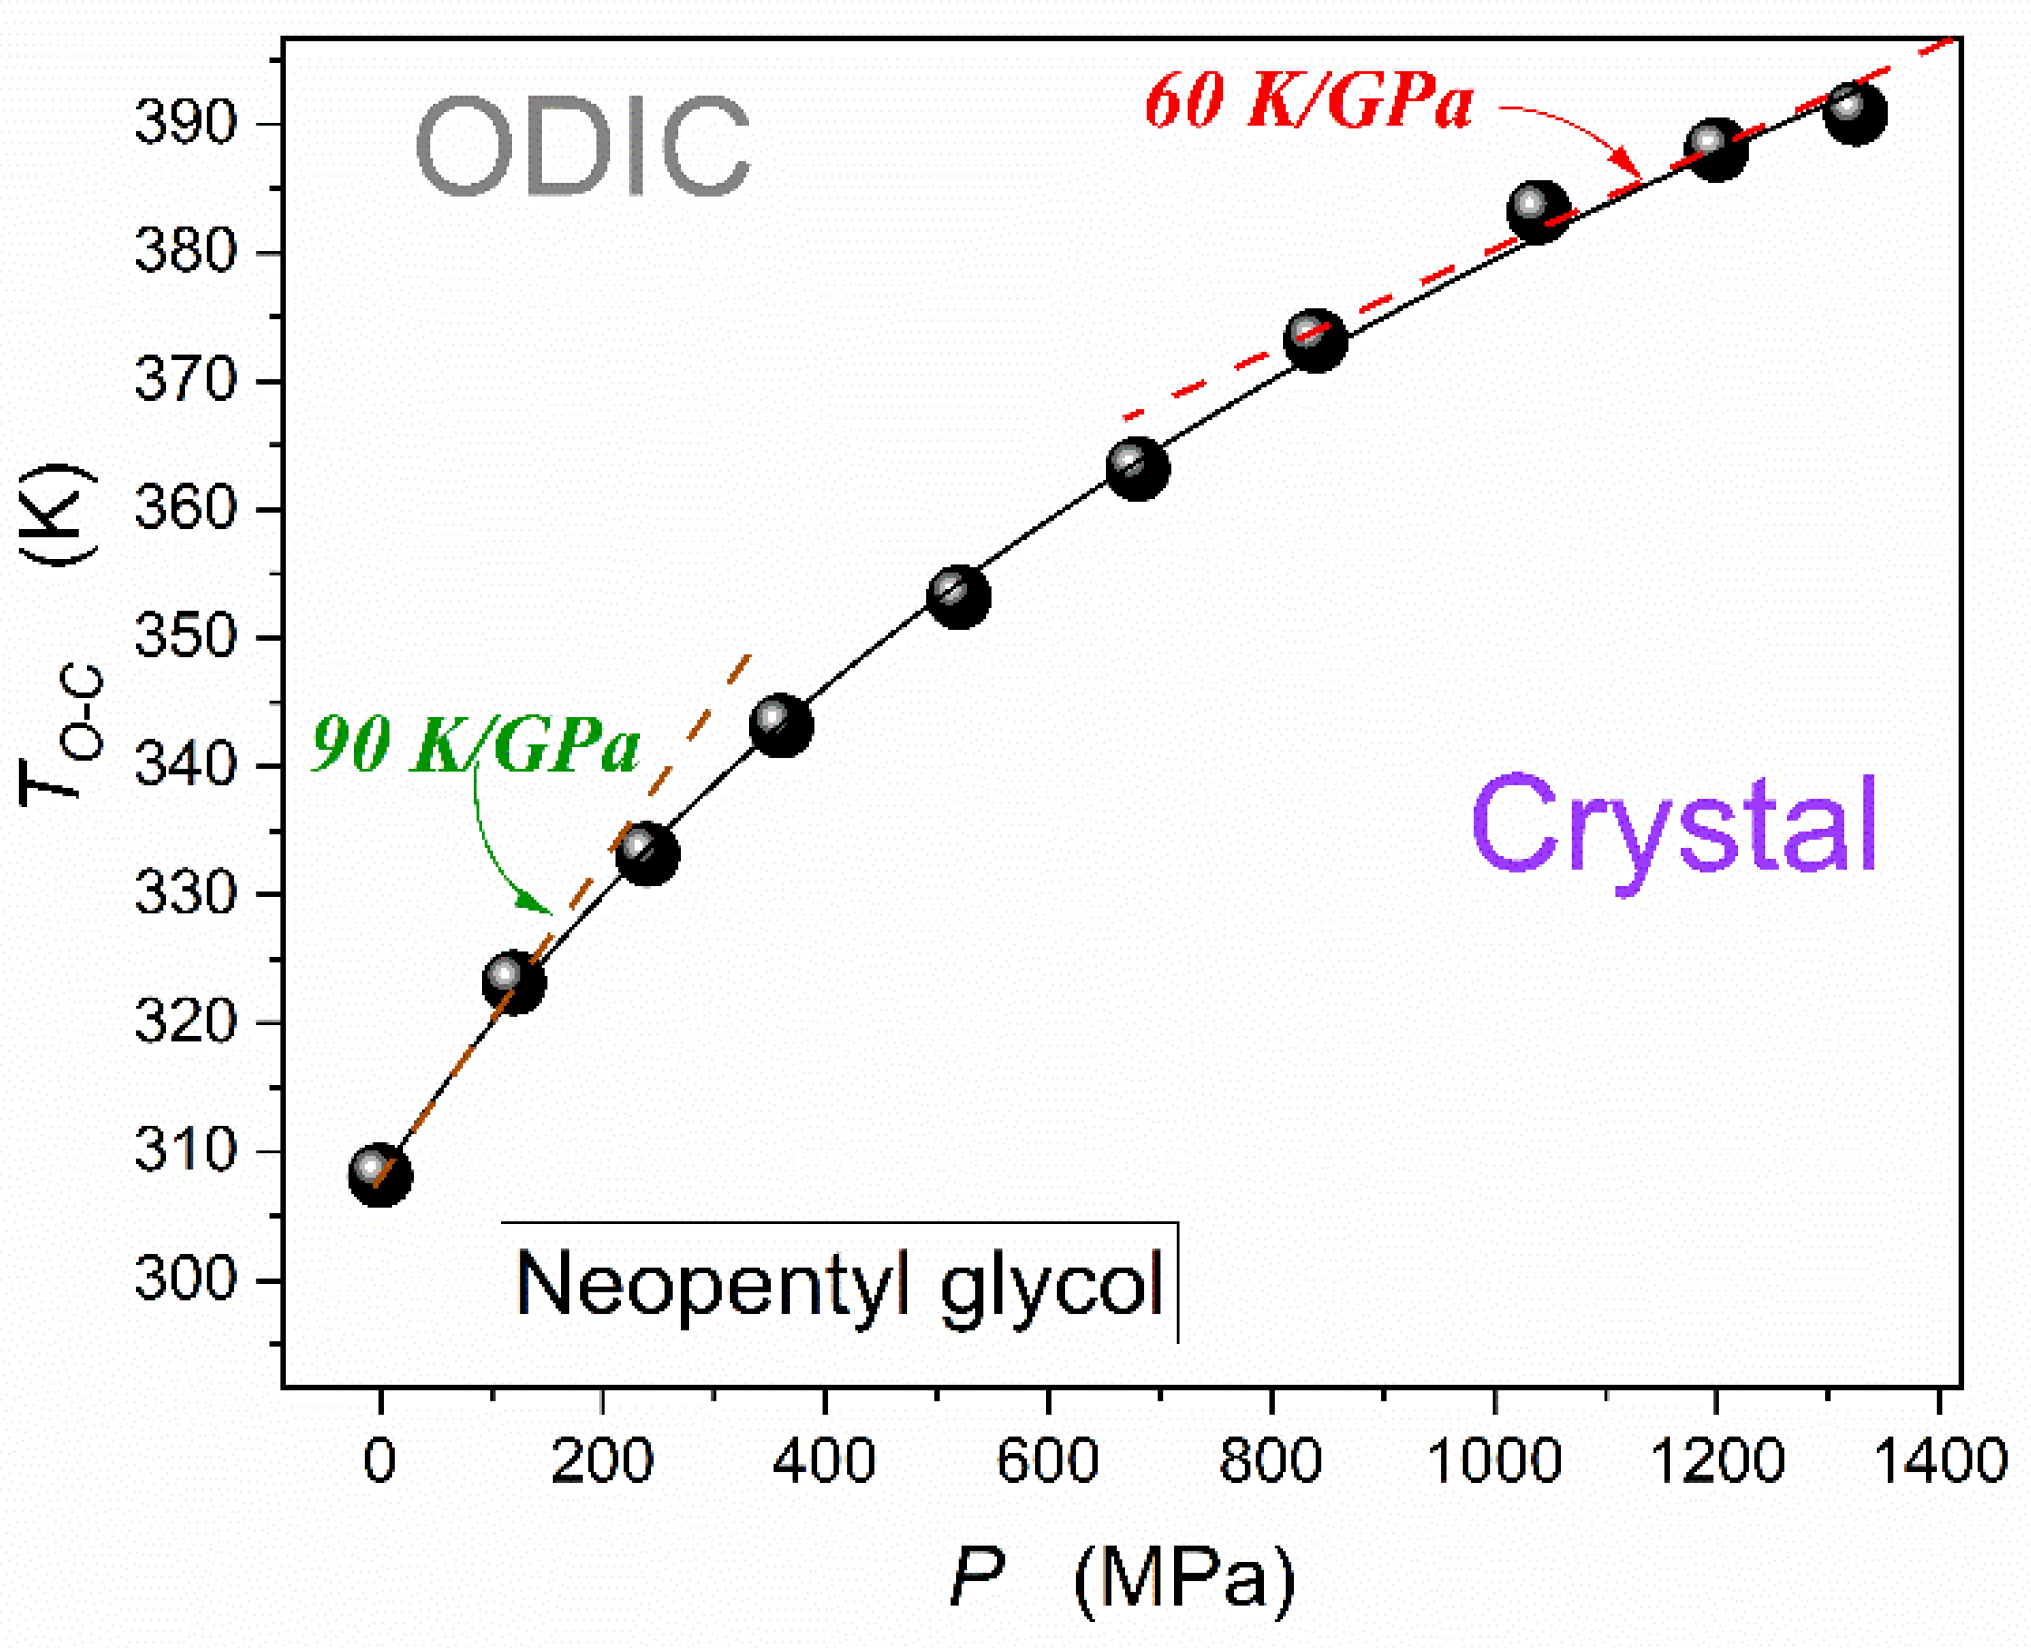
Figure 13
concludes the discussion of NPG pressure-related features presented in the given report by showing the pressure dependence of the discontinuous ODIC – Crystal phase transition. Data were determined by detecting dielectric constant step changes when passing the transition.
Results presented in
Figure 13 can be parameterized by the |Simon-Glatzel equation [
50,
90], as shown by shown by the solid curve in the plot:
where
is related to the melting temperature under atmospheric pressure,
and
are empirical constants when recalling the original reference of this model relation.
When considering the barocaloric ‘experiment’, related to subsequent isothermal path of approaching
curve notable is the rise of
which has to lead to a similar change in the related contrinution to entropy
in Eq. (2).
4. Conclusions
This report presents the first results on broadband dielectric spectroscopy insight into ODIC-forming neopentyl glycol (NPG) under compression, up to GPa domain. Particular attention was paid to the strongly discontinuous phase transition ODIC – Solid Crystal.. The insight covers both static, dynamic, and energy-related properties, namely evolutions of dielectric constant, DC electric conductivity, and the dissipation factor. Worth stressing are unique findings related to the pressure-related Mossotti-Catastrophe type behavior of dielectric constant, the novel approach to non-Barus dynamics, and the discussion on fundamentals of dissipation factor changes in NPG. The report significantly addresses the low-frequency domain in BDS-related spectra problems.
A complex phase sequence of compression has been evidenced in the solid crystal phase. Also, a notable pretransitional effect, with critical-like characterization, was found for the solid phase near the discontinuous transition ODIC-Crystal. This allows us to ask whether a parallel grain model, initially developed for the premelting effect near the liquid-solid crystal discontinuous transition, is possible for a given phase transition. This model assumes the appearance of solid-state crystalline grains surrounded by quasi-liquid nanolayers. Recently, it has been shown, based on BDS studies, that the critical characteristics of temperature and pressure changes of the latter are as follows: For the system studied in this work, the parallel system (crystalline grains + liquid nano-layers) could be a pre-transition system composed of crystalline grains surrounded by ODIC nano-layers, with orientational freedom of molecules and moments coupled with it dipoles. The enormous and frequency-dependent difference between the conductivities and dissipation factor in the crystalline and ODIC phases shown in this work may indicate the importance of the mentioned orientational freedom for the translational motions of, for example, percolating ions. It is worth noting here the proximity of the quasi-critical singular pressure in the solid state and the pressure of the discontinuous phase transition, which is also characteristic of the ‘critical nano-layers grain model’ discussed in refs. [
31,
32,
38,
40,
41]. Finally, summarizing the results of this work, the authors point out the complementarity with the unavailable research results discussing temperature changes under atmospheric pressure. The results presented in this work and ref. [
43] also introduces qualitatively new experimental evidence concerning the properties of the ODIC mesophase and the related discontinuous phase transition to the solid crystalline phase. This work also supplements the missing evidence relevant to the potentially exceptional colossal barocaloric effect applications of NPG.
Author Contributions
A.D.-R. is responsible for the methodology/analysis, validation, conceptualization, paper writing and finalizing; S.J.R. is responsible for conceptualization, resources, supervision, paper writing and figures; J.K. is responsible for measurements, part of analysis, and figures preparation. All authors have read and agreed to the published version of the manuscript.
Funding
Studies were supported by the National Science Center (NCN, Poland), OPUS grant, ref. 2022/45/B/ST5/04005, headed by S.J. Rzoska.
Institutional Review Board Statement
Not applicable.
Informed Consent Statement
Not applicable.
Data Availability Statement
Experimental data are available from the authors at reasonable request.
Acknowledgments
The authors are grateful to National Science Center (NCN, Poland), for the support via the OPUS grant, ref. 2022/45/B/ST5/04005.
Conflicts of Interest
The authors declare no conflict of interest.
References
- Samanta, C. NeoPentyl Glycol – a unique multi-purpose chemical. In Petroleum Federation of India: Technology, Bharat, India; 2016; pp. 23–28. [Google Scholar]
- Vest, K. Neopentyl Glycol (NPG) Market Analysis: Size, Share, Current Trends, Growth Factors, and Future Outlook 2024-2030. 2024. Available online: https://www.zionmarketresearch.com/sample/neopentyl-glycol-npg-market (accessed on 11 May 2024).
- Timmermans, J. Plastic crystals: a historical review. J. Phys. Chem. Solids 1961, 18, 1–8. [Google Scholar] [CrossRef]
- Tong, H. , Tan, P. & Xu, N. From crystals to disordered crystals: a hidden order-disorder transition. Sci. Rep. 2015, 5, 15378. [Google Scholar]
- Das, S.; Mondal, A.; Reddy, C.M. Harnessing molecular rotations in plastic crystals: a holistic view for crystal engineering of adaptive soft materials. Chem. Soc. Rev. 2020, 49, 8878–8896. [Google Scholar] [CrossRef] [PubMed]
- Simonov, A.; Goodwin, A.L. Designing disorder into crystalline materials. Nat. Rev. Chem. 2020, 4, 657–673. [Google Scholar] [CrossRef] [PubMed]
- Takamizawa, S. , M.. Elastic and plastic soft crystals with superelasticity, ferroelasticity, and superplasticity. In Kato, M., Ishii, K. (eds) Soft Crystals; The Materials Research Society Serie;s: Springer, Singapore, 2023. [Google Scholar]
- Strässle, Th.; Furrer, A.; Müller, K.A. Cooling by adiabatic application of pressure—The barocaloric effect. Physica B Cond. Matt. 2000, 276–278, 944–945. [Google Scholar] [CrossRef]
- Lloveras, P. , Aznar A., Barrio M., et al. Colossal barocaloric effects near room temperature in plastic crystals of neopentylglycol. Nat. Commun. 2019, 10, 1803. [Google Scholar] [CrossRef]
- Li, B. , Kawakita, Y., Ohira-Kawamura, S. et al. Colossal barocaloric effects in plastic crystals. Nature 2019, 567, 506–510. [Google Scholar] [CrossRef]
- Li, F.B. , Li, M., Xum X., et al. Understanding colossal barocaloric effects in plastic crystals. Nat Commun. 2020, 11, 4190. [Google Scholar] [CrossRef] [PubMed]
- Li, F.; Li, M.; Niu, C.; Wang, H. Atomic-scale insights into the colossal barocaloric effects of neopentyl glycol plastic crystals. Appl. Phys. Lett. 2022, 120, 073902. [Google Scholar] [CrossRef]
- Zhang, Z.; Chen, Y.-N.; Qi, J.; Zhang, Z.; Ohara, K.; Sakata, O.; Zhang, Z.-D.; Li, B. High-energy x-ray diffraction study on phase transition asymmetry of plastic crystal neopentylglycol. Chinese Phys. B 2022, 31, 036802. [Google Scholar] [CrossRef]
- Dai, Z. , She, X. , Wang, C. et al. Thermodynamic analysis on the performance of barocaloric refrigeration systems using neopentyl glycol as the refrigerant. J. Therm. Sci. 2023, 32, 1063–1073. [Google Scholar]
- Solid-solid phase transitions between crystalline polymorphs of organic materials, Rietveld, I. B. Current Pharm. Design 2023, 29, 445–461. [CrossRef]
- de Oliveira, N.A. Barocaloric effect in neopentylglycol plastic crystal: A theoretical study. Acta Materialia 2023, 246, 118657. [Google Scholar] [CrossRef]
- Moya, X. , Mathur, N.D. A hot future for cool materials. Front. Energy 2023, 17, 447–449. [Google Scholar] [CrossRef]
- Cirillo, L.; Greco, A.; Masselli, C. The Application of barocaloric solid-state cooling in the cold food chain for carbon footprint reduction. Energies 2023, 16, 6436. [Google Scholar] [CrossRef]
- Rendell-Bhatti, F.; Boldrin, D.; Dilshad, M.; Moya, X.; MacLaren, D.A. Understanding variations of thermal hysteresis in barocaloric plastic crystal neopentyl glycol using correlative microscopy and calorimetry. J. Phys. Energy 2024, 6, 025020. [Google Scholar] [CrossRef]
- Dai, Z.; X., She; Wang, C.; Ding, Y.; Li, Y.; Zhang, X.; Zhao, D. Dynamic simulation and performance analysis of a solid-state barocaloric refrigeration system. Energy 2024, 294, 130800. [Google Scholar] [CrossRef]
- Qian, K.; Lin, S.; Zhang, Z.; Li, B.; Peng, Y.; Li, Y.; Zhao, C. Highly efficient mechanocaloric cooling using colossal barocaloric plastic crystals. Cell Rep. Phys. Sci. 2024, 5, 101981. [Google Scholar] [CrossRef]
- Marin-Delado, R; Moya, X. ; Guzman-Verri, G.G. Landau theory of barocaloric plastic crystals. J. Phys. Energy 2024, 6, 035003. [Google Scholar] [CrossRef]
- .Ahčin, Ž.; Kitanovski, A.; ∙Tušek, J. Latent thermal energy storage using solid-state phase transformation in caloric materials. Cell Rep. Phys. Sci. 2024, 9, 102175. [Google Scholar] [CrossRef]
- Somodi, C.B.; McCormick, K.; Tabor, D.P.; Pentzer, E.; Shamberger, P.J. phase-change materials and their applications. J. Appl. Phys. 2024, 135, 145101. [Google Scholar] [CrossRef]
- Xu, X.; Xie, W.; Li, F.; Niu, C.; Li., M.; Wang, H. General approach for efficient prediction of refrigeration performance in caloric materials. Phys. Rev. Appl. 2024, 22, 014036. [Google Scholar] [CrossRef]
- Qian, S.; Takeuchi, I. Sizing up caloric devices. Science 2024, 385, 6708. [Google Scholar] [CrossRef]
- Zhang, K.; Wang, X.; Li, H.; Zhao, X.; Zhang, G.; Tan, C.; Wang, Y.; Li, B. Large thermal hysteresis enabled caloric batteries. Applied Energy 2025, 377A, 124408. [Google Scholar] [CrossRef]
- Skripov, V.P.; Faizulin, M.Z. Crystal-Liquid-Gas Phase Transitions and Thermodynamic Similarity; Wiley-VCH: Berlin, Germany, 2006. [Google Scholar]
- Riegler, H.; Köhler, R. How pre-melting on surrounding interfaces broadens solid–liquid phase transitions. Nat. Phys. 2007, 3, 890–894. [Google Scholar] [CrossRef]
- Lawson, A.C. Physics of the Lindemann rule. Phil. Mag. 2009, 89, 1757–1770. [Google Scholar] [CrossRef]
- Mei, Q.S.; Lu, K. Melting and superheating of crystalline solids: From bulk to nanocrystals. Prog. Mater. Sci. 2007, 5, 1175–1262. [Google Scholar] [CrossRef]
- Samanta, A.H.; Tuckerman, M.E.; Yu, T.-Q.; Ee, W. Microscopic mechanisms of equilibrium melting of a solid. Science 2014, 345, 729–732. [Google Scholar] [CrossRef]
- de With, G. Melting is well-known, but is it also well-understood? Chem. Rev. 2023, 123, 13713–13795. [Google Scholar] [CrossRef] [PubMed]
- Wilson, K.G.; The Renormalization Group and Critical Phenomena. Nobel Prize Lecture. Available online: https://www.nobelprize.org/prizes/physics/1982/wilson/lecture/ (accessed on 4 June 2024).
- Anisimov, M.A. Critical Phenomena in Liquid and Liquid Crystals; Gordon and Breach Science Publishers: Philadelphia, PA, USA, 1991. [Google Scholar]
- Stanley, H.E. Introduction to Phase Transitions and Critical Phenomena; Oxford University Press: New York, NY, USA, 1992. [Google Scholar]
- Honig, J.; Spalek, J. A Primer to the Theory of Critical Phenomena; Elsevier: Amsterdam, The Netherlands, 2018. [Google Scholar]
- Kalabiński, J.; Drozd-Rzoska, A.; Rzoska, S.J. Giant premelting effects for solid-liquid discontinuous transition in nitrobenzene under compression. Crystals 2023, 13, 247. [Google Scholar] [CrossRef]
- Łoś, J.; Drozd-Rzoska, A.; Rzoska, S.J.; Starzonek, S.; Czupryński, K.; Mukherjee, P. Mukherjee, Near-continuous isotropic – nematic transition in compressed rod-like liquid crystal based nanocolloid. J. Mol Liq. 2023, 382, 121884. [Google Scholar] [CrossRef]
- Drozd-Rzoska, A.; Rzoska, S.J.; Łoś, J. Supercriticality, glassy dynamics, and the new insight into melting/freezing discontinuous transition in linseed oil. Biophysica 2024, 4, 34–57. [Google Scholar] [CrossRef]
- Kalabiński, J.; Drozd-Rzoska, A.; Starzonek, S.; Rzoska, S.J. Precritical and giant post-freezing and premelting effects for dielectric properties in binary mixture of limited miscibility. Crystals 2024, 14, 612. [Google Scholar] [CrossRef]
- Kremer, F.; Schoenhals, A. Broadband Dielectric Spectroscopy; Springer: Berlin/Heidelberg, Germany, 2002. [Google Scholar]
- Drozd-Rzoska, A.; Kalabiński, J.; Rzoska, S.J. Critical model-insight into broadband dielectric properties of neopentyl glycol (NPG). Materials 2024, 17, 4144. [Google Scholar] [CrossRef] [PubMed]
- Burns, J. Linear dielectric thermodynamics: A new universal law for optical, dielectric constants. J. Am. Ceram Soc. 2021, 104, 2087–2101. [Google Scholar] [CrossRef]
- Kawakita, Y. , Ohira-Kawamura S., et al. Colossal barocaloric effects in plastic crystals. Nature 2019, 567, 506–510. [Google Scholar]
- Boldrin, D. Fantastic barocalorics and where to find them. Appl. Phys. Lett. 2021, 118, 170502. [Google Scholar] [CrossRef]
- Kennedy, D.; Norman, C. What don't we know. Science's 125 Open Questions. In 125th anniversary Science 1st July special issue; 2005. [Google Scholar]
- Berthier, L. , Ediger, M. Facets of the glass transition. Physics Today 2016, 69, 40–44. [Google Scholar] [CrossRef]
- Berthier, L. , Reichman, D.R. Modern computational studies of the glass transition. Nat. Rev. Phys. 2023, 5, 102–116. [Google Scholar] [CrossRef]
- Drozd-Rzoska, A.; Rzoska, S.J.; Starzonek, S. New scaling paradigm for dynamics in glass-forming systems. Prog. Mater. Sci. 2023, 134, 101074. [Google Scholar] [CrossRef]
- Gavazzoni, C.; Brito, C.; Wyart, M. Testing theories of the glass transition with the same liquid but many kinetic rules. Phys. Rev. Lett. 2024, 132, 248201. [Google Scholar] [CrossRef]
- Drozd-Rzoska, A.; Rzoska, S.J.; Pawlus, S.; Tamarit, J.Ll. Dynamic crossover and the dynamic scaling description in vitrifying of orientationally disordered crystal. Phys. Rev. B 2006, 73, 224205. [Google Scholar] [CrossRef]
- Drozd-Rzoska, A.; Rzoska, S.J.; Pawlus, S.; Tamarit, J.Ll. Dielectric relaxation in compressed glassy and orientationally disordered mixed crystal. Phys. Rev. B 2006, 74, 064201. [Google Scholar] [CrossRef]
- Tamarit, J.Ll.; Perez-Jubindoz, M.A.; de la Fuentez, M.R. Dielectric studies on orientationally disordered phases of neopentylglycol ((CH3/2C(CH2OH)2) and tris(hydroxymethyl aminomethane) ((NH2)C(CH2OH)3). J. Phys.: Condens. Matter 1997, 9, 5469–5478. [Google Scholar]
- Tamarit, J.Ll.; Lopez, D.O.; de la Fuente, M.R.; Perez-Jubindo, M.A.; Salud, J.; Barrio, M. Relaxation dynamics in orientationally disordered molecular mixed crystal [(CH3)3CCH2OH]0. 7[(CH3)2C(CH2OH)2]0.3. J. Phys.: Condens. Matter 2000, 12, 8209–8220. [Google Scholar]
- Romanini, M. Relaxation Dynamics in Disordered Systems; PhD thesis: Universat Polytecnica de Catalunya, Barcelona, 2015. [Google Scholar]
- Drozd-Rzoska, A.; Rzoska, S. J. ’ Pawlus, S.;. Martinez-Garcia, J. C.; Tamarit J.-L., Evidence for critical-like behavior in ultraslowing glass-forming systems. Phys. Rev. E 2010, 82, 031501. [Google Scholar] [CrossRef]
- Pan, H.; Luo, J.; Li, B.; Wübbenhorst, M. Phase-dependent dielectric properties and proton conduction of neopentyl glycol. RSC Adv. 2021, 11, 23228. [Google Scholar] [CrossRef]
- von Hippel, A. Dielectrics and Waves; Artech House: New York, NY, USA, 1954. [Google Scholar]
- Böttcher, C.J.F. Theory of Electric Polarization; Elsevier: Amsterdam, The Netherlands, 1973. [Google Scholar]
- Chełkowski, A. Dielectric Physics; PWN-Elsevier: Warsaw, Poland, 1990. [Google Scholar]
- Kornyushin, Y. The Clausius–Mossotti approximation in the theory of polar materials. Ceram. Intern. 2003, 29, 333–345. [Google Scholar] [CrossRef]
- Sagadevan, S.; Sundaram, A.S. A brief review of the relevant dielectric theories of solids. Lat. Am. J. Phys. Educ. 2014, 8, 397–406. [Google Scholar]
- Raju, G.G. Dielectric in Electric Field; CRC Press: Boca Raton, FL, USA, 2018. [Google Scholar]
- Drozd-Rzoska, A. Universal behavior of the apparent fragility in ultraslow glass forming systems. Sci. Rep. 2019, 9, 6816. [Google Scholar] [CrossRef] [PubMed]
- Drozd-Rzoska, A.; Rzoska, S.J.; Szpakiewicz-Szatan, A.; Starzonek, S.; Łoś, J.; Orzechowski, K. Supercritical anomalies in liquid ODIC-forming cyclooctanol under the strong electric field. J. Mol. Liq. 2022, 345, 1178491. [Google Scholar] [CrossRef]
- Hirshfeld, A.W. The Electric Life of Michel Faraday; Raincoast Books: Vancouver, BC, Canada, 2006. [Google Scholar]
- Bauer, Th.; Köhler, M.; Lunkenheimer, P.; Loidl, A.; Angell, C. A. Relaxation dynamics and ionic conductivity in a fragile plastic crystal. J. Chem. Phys. 2010, 133, 144509. [Google Scholar] [CrossRef] [PubMed]
- Tomylko, S.; Yaroshchuk, O.; Kovalchuk, O.; Maschke, U.; Yamaguchi, R. Dielectric properties of nematic liquid crystal modified dielectric properties of nematic liquid crystal modified with diamond. Ukr. J. Phys. 2012, 57, 239–243. [Google Scholar] [CrossRef]
- Hwang, D. , Kim, D, Jo, S. et al. Highly efficient plastic crystal ionic conductors for solid-state dye-sensitized solar cells. Sci. Rep. 2013, 3, 3520. [Google Scholar] [CrossRef] [PubMed]
- Ayeb, H.; Missaoui, T.; Mouhli, A.; Jomni, F.; Soltani, T. Dielectric spectroscopy study on the impact of magnetic and nonmagnetic nanoparticles dispersion on ionicbehavior in nematic liquid crystal. Phase Transit. 2021, 94, 37–46. [Google Scholar] [CrossRef]
- Kumar, A.; Varshney, D.; Prakash, J. Role of ionic contribution in dielectric behaviour of a nematic liquid crystal with variable cell thickness. J. Mol. Liq. 2020, 303, 112520. [Google Scholar] [CrossRef]
- Lin, F.C.; Po-Chang, W.; Jian, B.R.; Lee, W. Dopant effect and cell-configuration-dependent dielectric properties of nematic liquid crystals. Adv. Condens. Matter Phys. 2013, 1, 5. [Google Scholar] [CrossRef]
- Garbovskiy, Y. Conventional and unconventional ionic phenomena in tunable soft materials made of liquid crystals and nanoparticles. Nano Express 2021, 2, 012004. [Google Scholar]
- Yoshizawa-Fujita, M.; Nakazawa, M.; Takeoka, Y.; Rikukawa, M. Phase transitions and ionic conductivity of ionic plastic crystals based on pyrrolidinium cations and dihydrogen phosphate anion. J. Non-Cryst. Solids: X 2022, 13, 100078. [Google Scholar] [CrossRef]
- Barus, C. Isothermals, isopiestic and isometrics relative to viscosity. Am. J. Sci. 1893, 45, 87–96. [Google Scholar] [CrossRef]
- Drozd-Rzoska, A. Activation volume in superpressed glass-formers. Sci. Rep. 2019, 9, 13787. [Google Scholar] [CrossRef]
- Hill, R. Characterisation of dielectric loss in solids and liquids. Nature 1978, 275, 96–99. [Google Scholar] [CrossRef]
- Kim, T.; Yong, H.; Kim, B.; Kim, D.; Choi, D.; Park, Y.T.; Lee, S. Energy-loss return gate via liquid dielectric polarization. Nat. Commun. 2018, 9, 1437. [Google Scholar] [CrossRef] [PubMed]
- Morsalin, S.; Phung, T.B.; Danikas, M.; Mawad, D. Diagnostic challenges in dielectric loss assessment and interpretation: A review. IET Sci. Meas. Technol. 2019, 13, 767–782. [Google Scholar] [CrossRef]
- Paluch, M. , Casalini, R., Best, A.; Patkowski, A. Volume effects on the molecular mobility close to glass transition in supercooled phenylphthalein-dimethylether. J. Chem. Phys. B 2002, 117, 7624–7630. [Google Scholar] [CrossRef]
- Pawlus, S.; et al. Temperature and volume effects on the change of dynamics in propylene carbonate. Phys. Rev. E 2004, 70, 061501. [Google Scholar] [CrossRef] [PubMed]
- Kriegs, H.; et al. Pressure effects on the alpha and alpha’ relaxations in polymethylphenylsiloxane. J. Chem. Phys. 2006, 124, 104901. [Google Scholar] [CrossRef] [PubMed]
- Pawlus, S. , Mierzwa, M., Paluch, M., Rzoska, S.J.; Roland, C.M. Dielectric and mechanical relaxation in isooctylcyanobiphenyl (8*OCB). J. Phys.: Condens. Matt. 2010, 22, 235101. [Google Scholar]
- Grzybowski, A. , Koperwas, K., Swiety-Pospiech, A., Grzybowska, K.; Paluch, M. Activation volume in the density scaling regime:equation of state and its test by using experimental and simulation data. Phys. Rev. B 2013, 87, 054105. [Google Scholar] [CrossRef]
- Paluch, M.; et al. General rules prospected for the liquid fragility in various material groups and different thermodynamic conditions. J. Chem. Phys. 2014, 141, 13450. [Google Scholar] [CrossRef]
- Panagos, P.; Floudas, G. Dynamics of poly(propyl methacrylate) as a function of temperature and pressure. J. Non-Cryst. Solids 2015, 407, 184–189. [Google Scholar] [CrossRef]
- Grzybowski, A. S. , Urban, S., Mróz, S.; Paluch, M. Activation volume of selected liquid crystals in the density scaling regime. Sci. Rep. 2017, 7, 42174. [Google Scholar] [CrossRef]
- .Santamaría, A. , Boix, M., Conde, J.I.; Pascual, B. PVC/PBA random copolymers obtained by SET–DTLRP: Pressure effect on glass transition, rheology, and processing. J. Vinyl. Add. Technol. 2018, 25, 78–84. [Google Scholar]
- Jesionek, P.; Włodarczyk, P.; Heczko, M.; Kamiński, K.; Kamińśka, E. Variation of activation volume as an indicator of the difference in clusterization phenomenon induced by H-bonding and F−Π stacking interactions in enantiomers and a racemate of flurbiprofen. J. Phys. Chem. B 2024, 128, 4021–4032. [Google Scholar] [CrossRef]
- Simon, F.E.; Glatzel, G. Bemerkungen zur Schmelzdruck kurve. Zeitschrift fuer Anorganische und Allgemeine Chemie 1929, 178, 309. [Google Scholar] [CrossRef]
Figure 1.
The photo of the pressure setup used for reported experimental studies.
Figure 1.
The photo of the pressure setup used for reported experimental studies.
Figure 2.
Example of the real part of dielectric permittivity spectrum obtained in high-pressure studies in NPG, for T = 50 °C.
Figure 2.
Example of the real part of dielectric permittivity spectrum obtained in high-pressure studies in NPG, for T = 50 °C.
Figure 3.
Example of the imaginary part of dielectric permittivity spectrum obtained in high-pressure studies in NPG, for T = 50 °C.
Figure 3.
Example of the imaginary part of dielectric permittivity spectrum obtained in high-pressure studies in NPG, for T = 50 °C.
Figure 4.
Frequency changes of the real part of dielectric permittivity reciprocal for the selected pressures in the ODIC and Crystal phases, based on results shown in
Figure 2. Lines in black are plotted to indicate the dominant pattern of frequency changes.
Figure 4.
Frequency changes of the real part of dielectric permittivity reciprocal for the selected pressures in the ODIC and Crystal phases, based on results shown in
Figure 2. Lines in black are plotted to indicate the dominant pattern of frequency changes.
Figure 5.
Isothermal (T = 50 °C) pressure dependence of dielectric constant in NPG, for the surrounding of ODIC – Solid Crystal transition.
Figure 5.
Isothermal (T = 50 °C) pressure dependence of dielectric constant in NPG, for the surrounding of ODIC – Solid Crystal transition.
Figure 6.
The real part of the electric conductivity spectrum. The DC electric conductivity is related to the horizontal behavior, explicitly appearing in the ODIC phase for f < 100 Hz and in the solid crystal phase, it can be approximated for f = 1 Hz. Note: the DC electric conductivity appears as the horizontal domain in such plot.
Figure 7.
Pressure changes of electric conductivity in ODIC and Solid Crystal phases of NPG, for a set of frequencies. The dashed arrow indicates the discontinuous phase transition ODIC – Crystal. The solid curve portraying data for DC conductivity limit is related to Eq. (10).
Figure 7.
Pressure changes of electric conductivity in ODIC and Solid Crystal phases of NPG, for a set of frequencies. The dashed arrow indicates the discontinuous phase transition ODIC – Crystal. The solid curve portraying data for DC conductivity limit is related to Eq. (10).
Figure 8.
The pressure evolution of the dissipation fact (Eq. (12), based on data presented in
Figure 2 and
Figure 3, for a set of frequencies given in the plot. The semi-log scale enables insight that is non-biased by decadal changes in values.
Figure 8.
The pressure evolution of the dissipation fact (Eq. (12), based on data presented in
Figure 2 and
Figure 3, for a set of frequencies given in the plot. The semi-log scale enables insight that is non-biased by decadal changes in values.
Figure 9.
Frequency changes of the dissipation factor
in neopentyl glycol (NPG), for selected pressures.
Figure 9.
Frequency changes of the dissipation factor
in neopentyl glycol (NPG), for selected pressures.
Figure 10.
Pressure related evolution of the reciprocal of dielectric susceptibility
., for the isotherm
T = 110 °C, where the ODIC phase is extended up to
; the line following data supports parameterization via the Mossotti – Catastrophe Eq. (13). The plot also contains the distortions-sensitive derivative analysis, in which the emergence of the horizontal line validates the mentioned behavior (Eq. ( )).
Figure 11.
Pressure evolution of the DC electric conductivity for the isotherm T = 110 °C, where the ODIC phase is extended up to .
Figure 11.
Pressure evolution of the DC electric conductivity for the isotherm T = 110 °C, where the ODIC phase is extended up to .
Figure 12.
Apparent activation volume pressure changes for the isotherm T = 110 °C. The solid line in the ODIC phase is portrayed as , for .
Figure 12.
Apparent activation volume pressure changes for the isotherm T = 110 °C. The solid line in the ODIC phase is portrayed as , for .
Figure 13.
The ODIC - Crystal discontinuous phase transition pressure dependence up to GPa domain. The parameterization is related to the Simon-Glatzel Eq. (18).
Figure 13.
The ODIC - Crystal discontinuous phase transition pressure dependence up to GPa domain. The parameterization is related to the Simon-Glatzel Eq. (18).
|
Disclaimer/Publisher’s Note: The statements, opinions and data contained in all publications are solely those of the individual author(s) and contributor(s) and not of MDPI and/or the editor(s). MDPI and/or the editor(s) disclaim responsibility for any injury to people or property resulting from any ideas, methods, instructions or products referred to in the content. |
© 2024 by the authors. Licensee MDPI, Basel, Switzerland. This article is an open access article distributed under the terms and conditions of the Creative Commons Attribution (CC BY) license (http://creativecommons.org/licenses/by/4.0/).