
Submitted:
12 December 2024
Posted:
12 December 2024
You are already at the latest version
Abstract
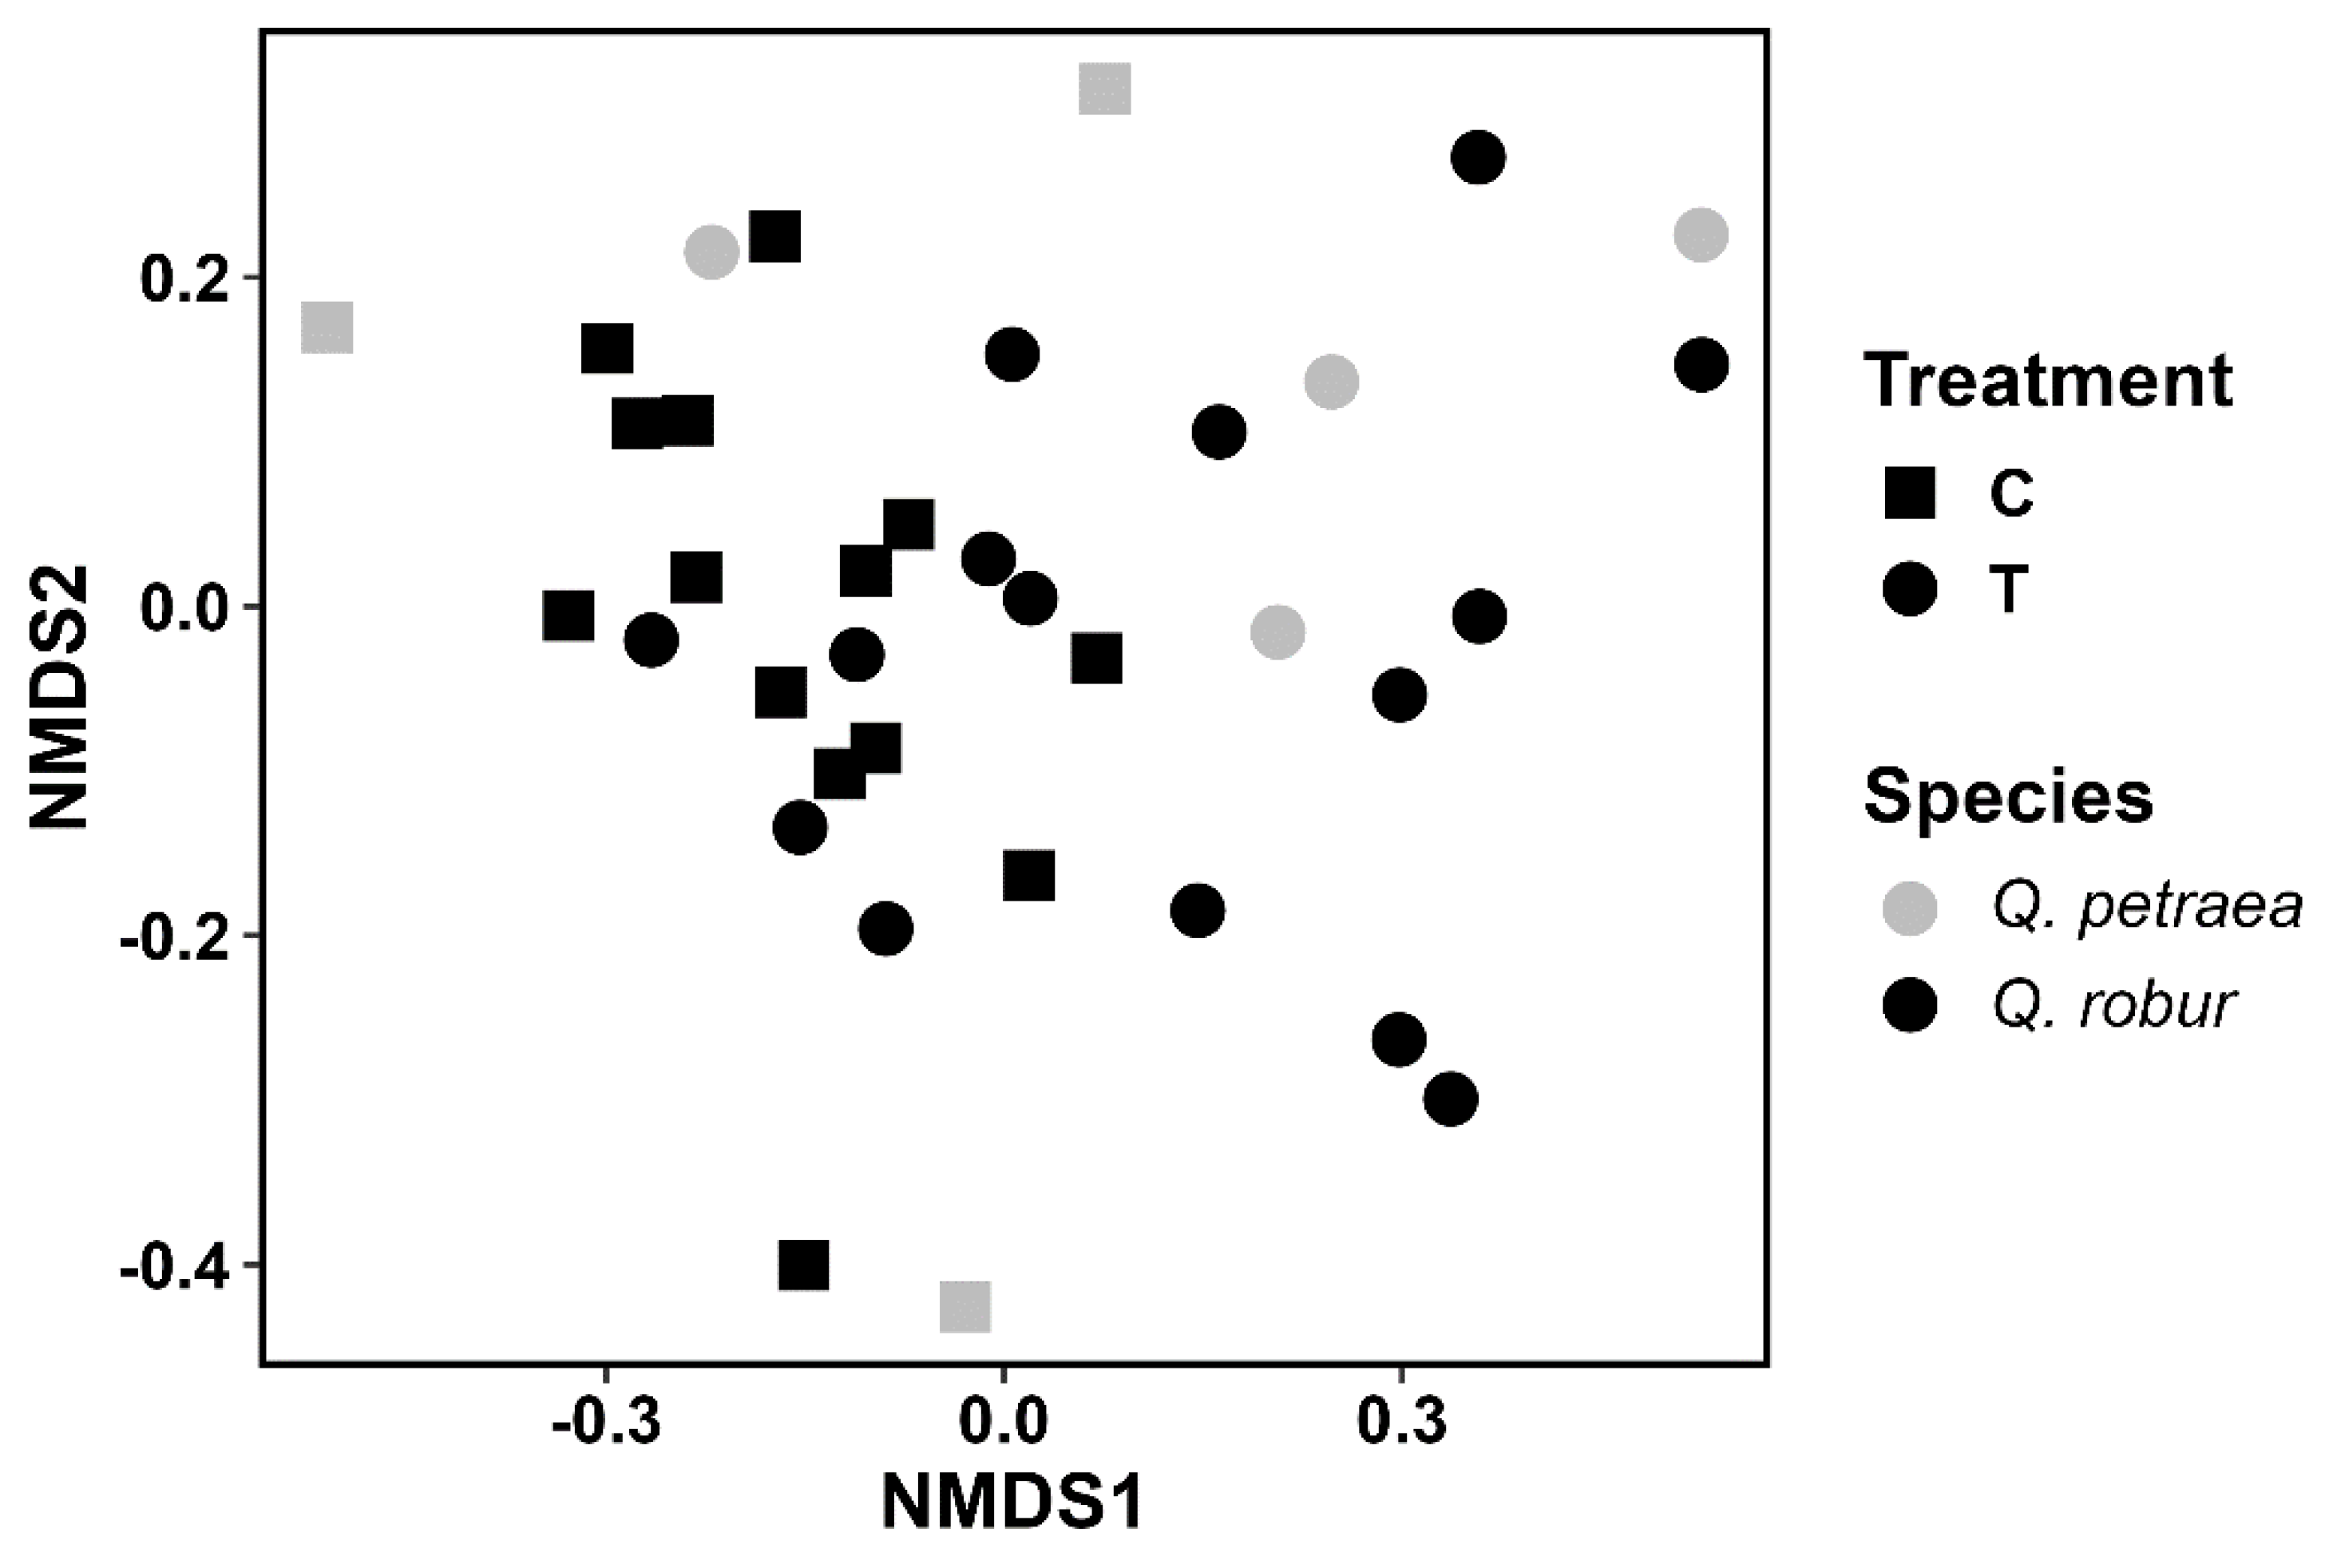
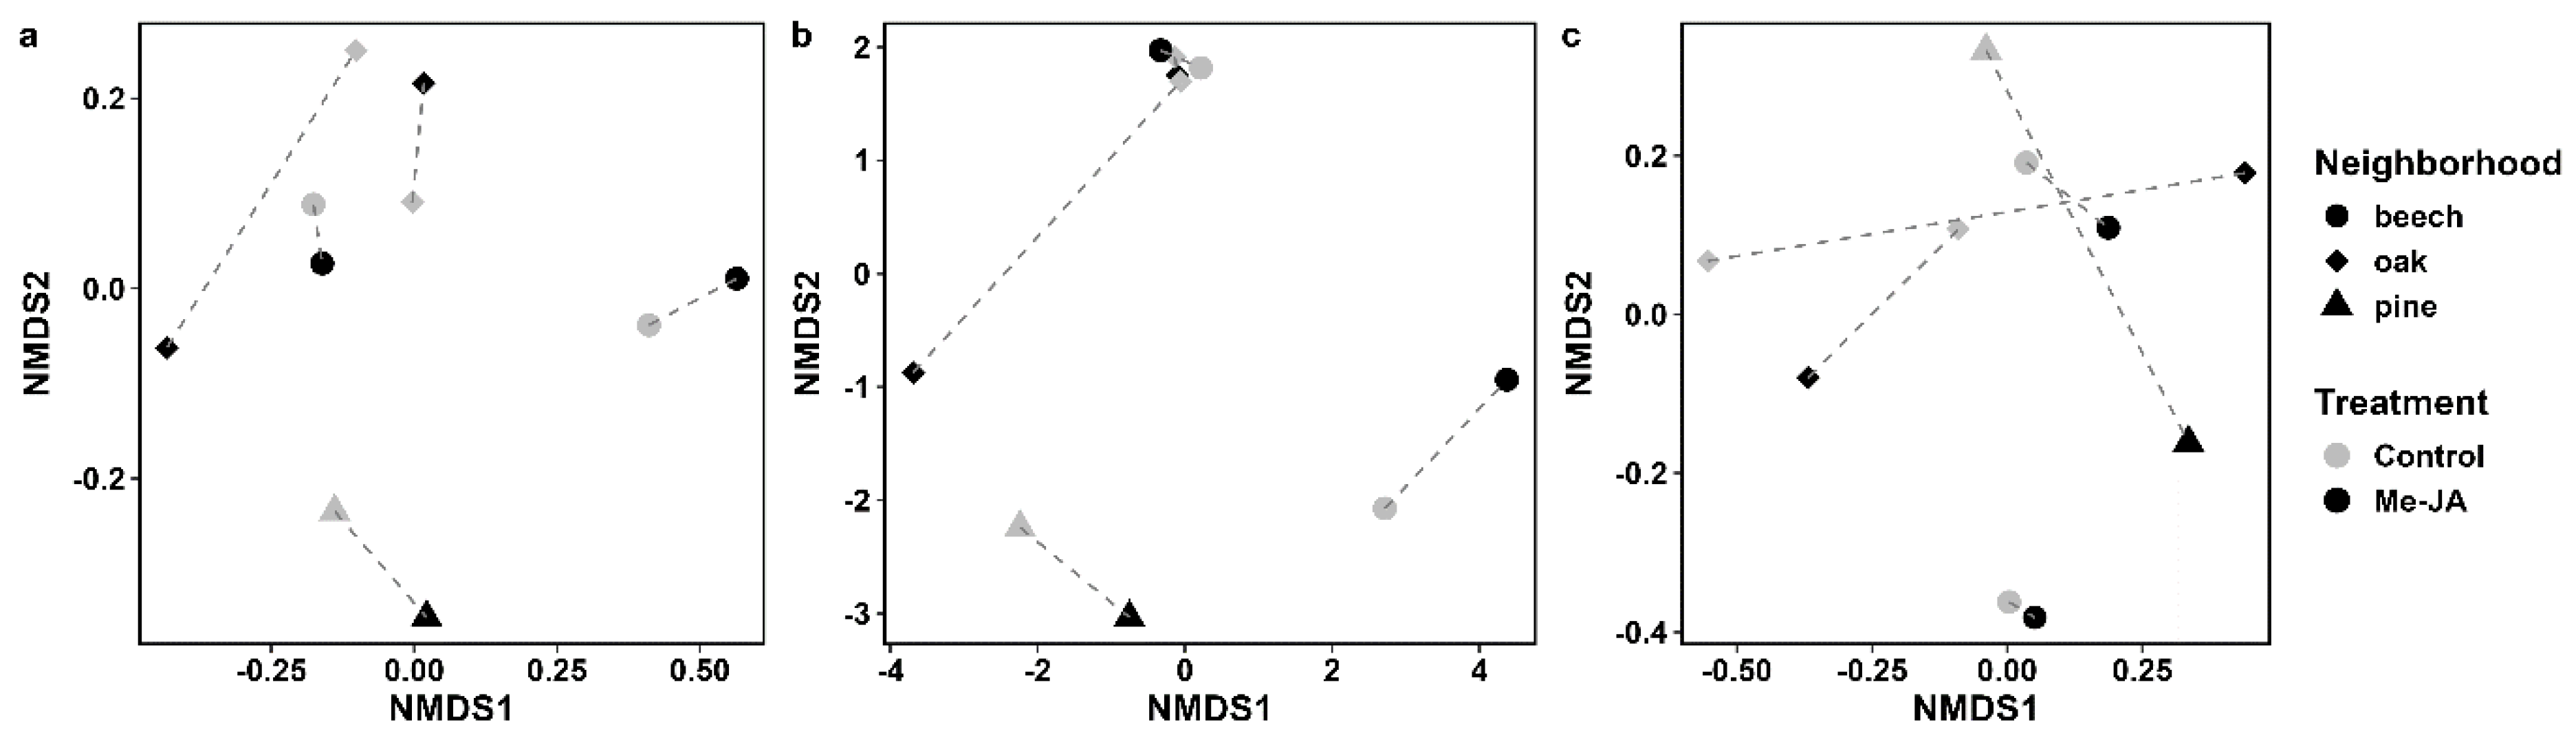
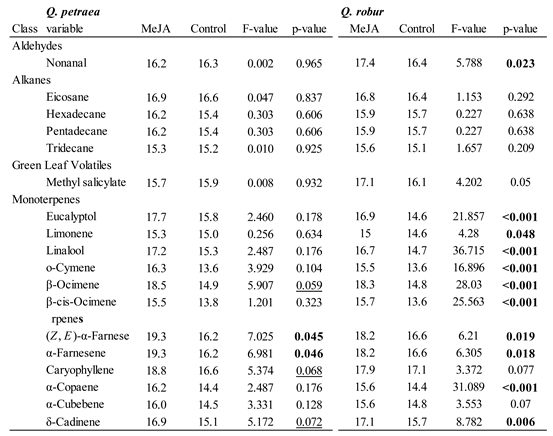
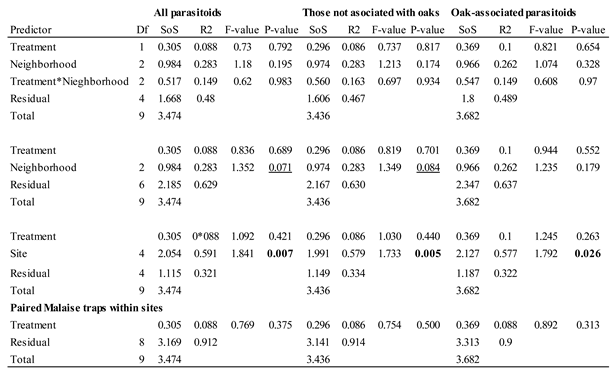
We know little about how parasitoids of herbivorous insects use herbivore-induced volatile organic compounds (VOCs) to locate potential hosts on saplings in forests and how this depends on tree composition. Therefore, we performed an experiment in a forest in Poland where we placed pairs of oak saplings (Quercus robur or Q. petraea) in neighborhoods dominated by oak, beech, or pine trees. We treated one sapling in each pair with the phytohormone methyl jasmonate that triggers induced responses in plants. We measured the VOC emissions of thirty-six saplings and placed Malaise traps with five of the pairs. We counted the parasitoids in the ten Malaise samples and identified them using DNA metabarcoding. The two species of oak differed in both the proportions of VOCs and the specific VOCs that were elevated following the application of methyl jasmonate. We did not detect any overall effects of treatment on parasitoid abundance or community composition. However, some parasitoid species appeared to be attracted to elevated emissions of specific induced VOCs. Parasitoid communities differed significantly between sites and showed marginally significant differences between neighborhoods. Overall, our results suggest that parasitoids in the understory are affected by tree composition of the canopy, but the effects of VOC emissions were limited.
Keywords:
1. Introduction
2. Materials and Methods
Study Site
Experimental Methods
Analyses of VOC Samples
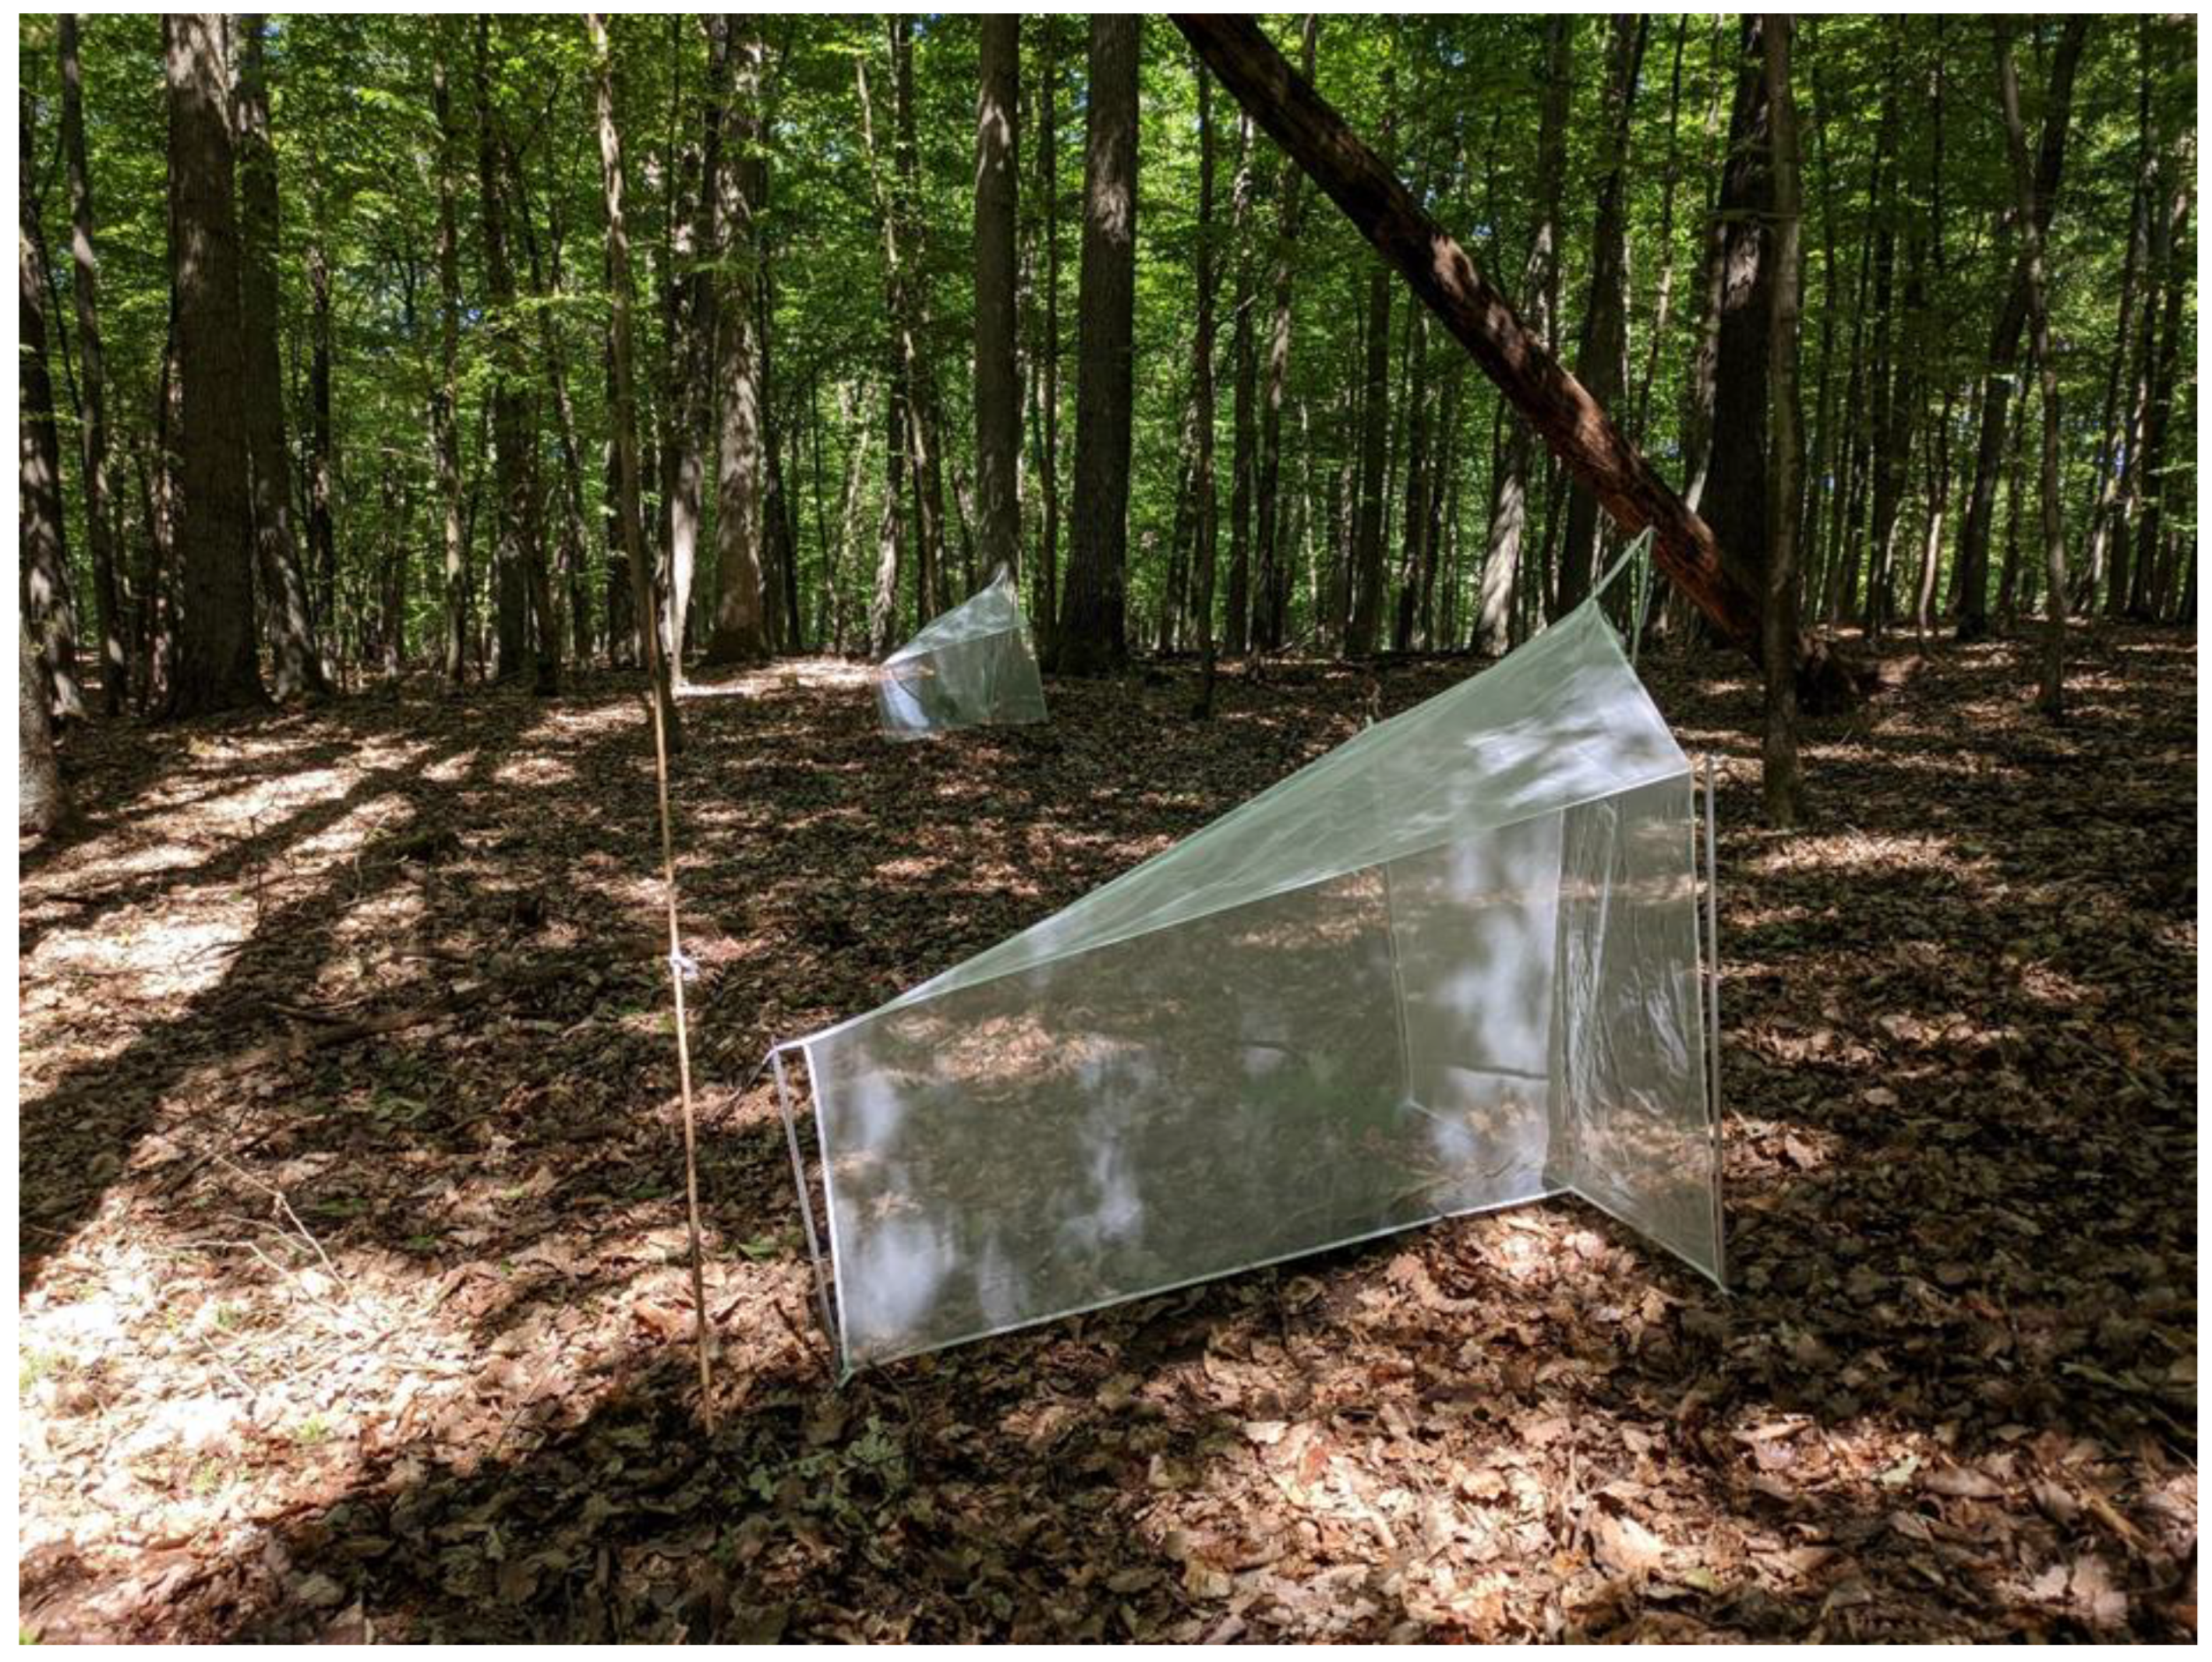
Sampling of Parasitoids
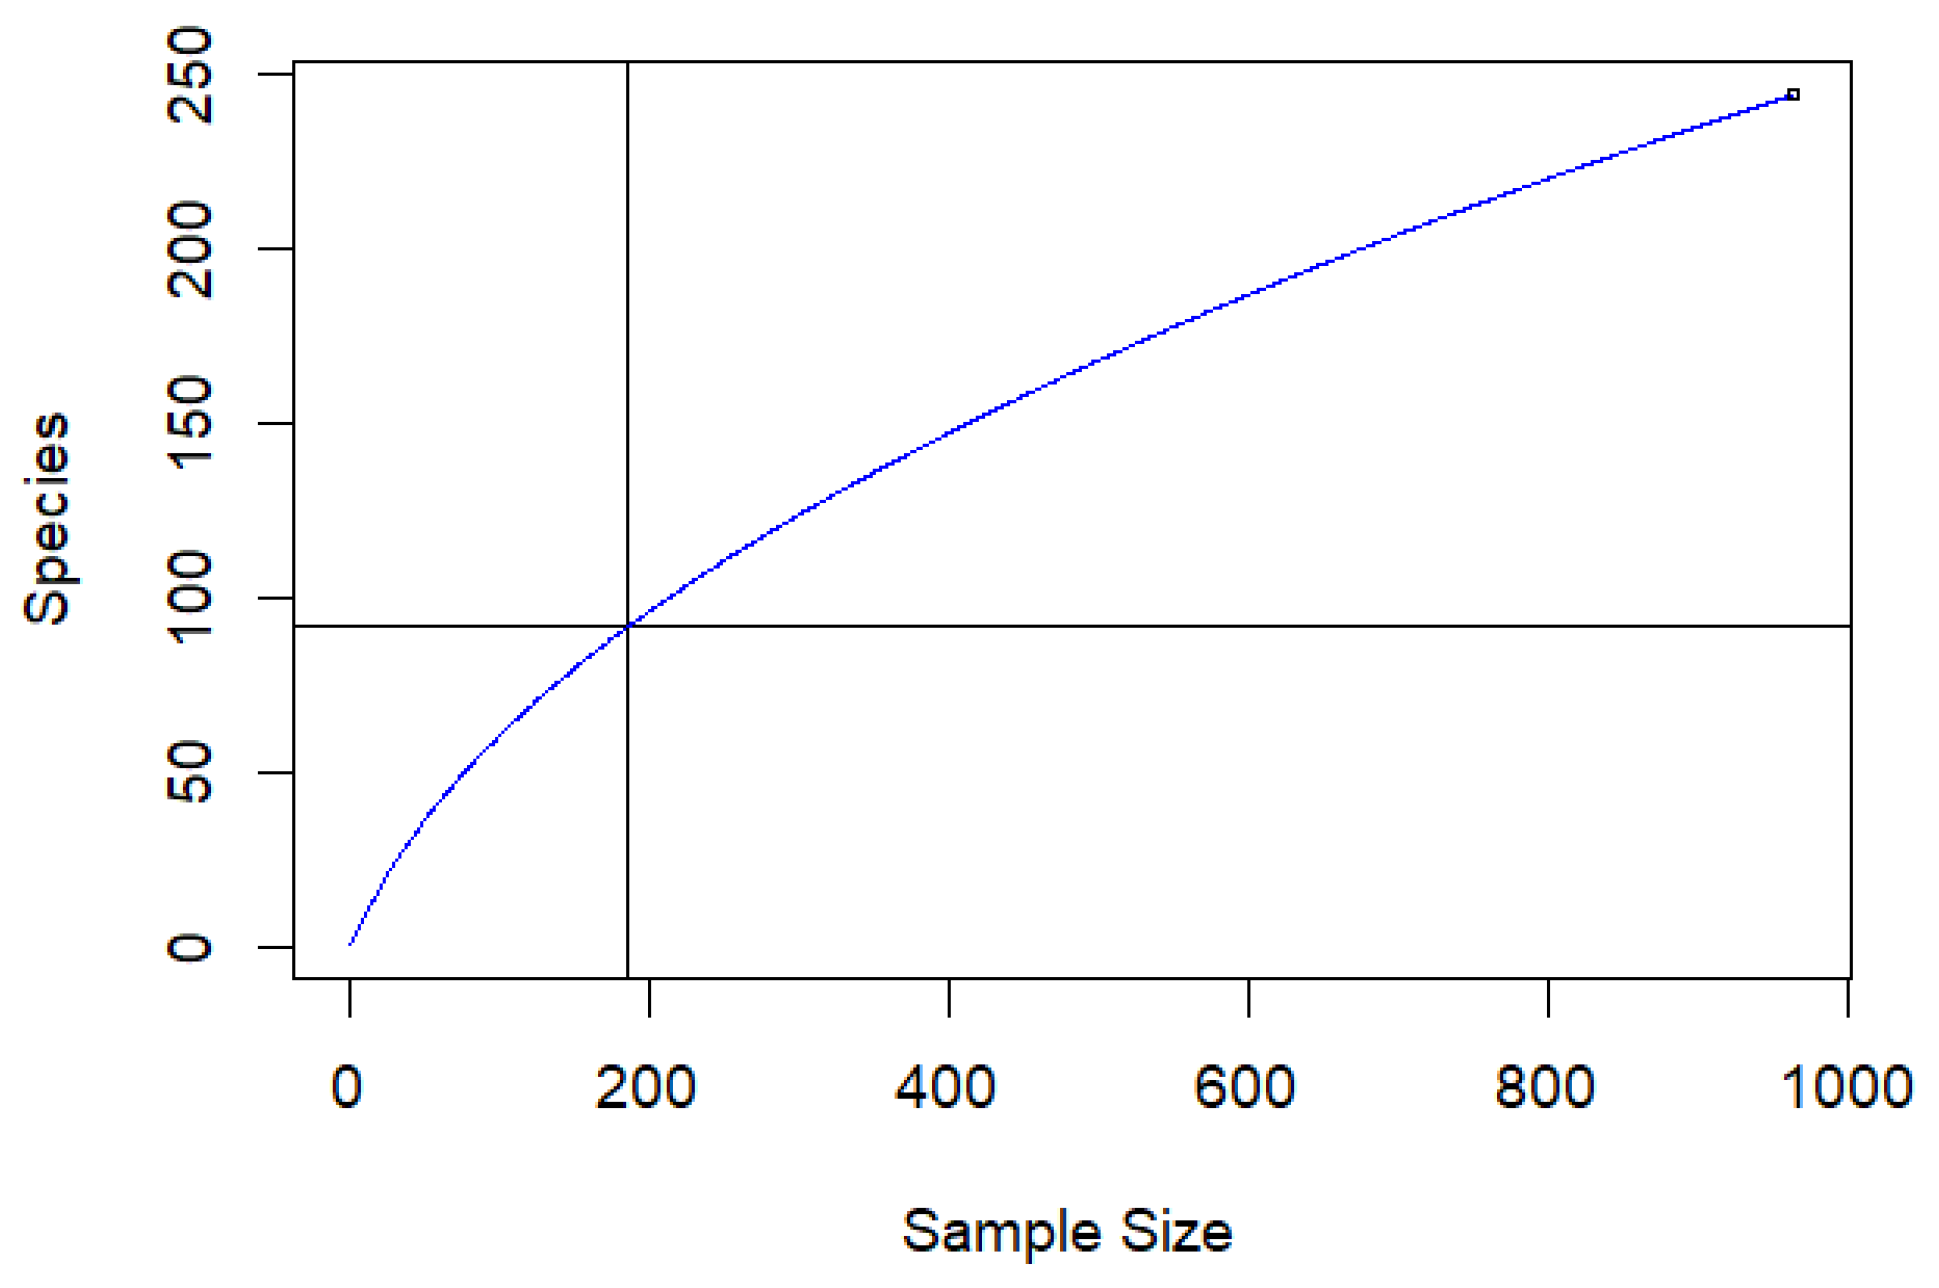
Estimating Parasitoid Community Composition
Data Analysis
3. Results
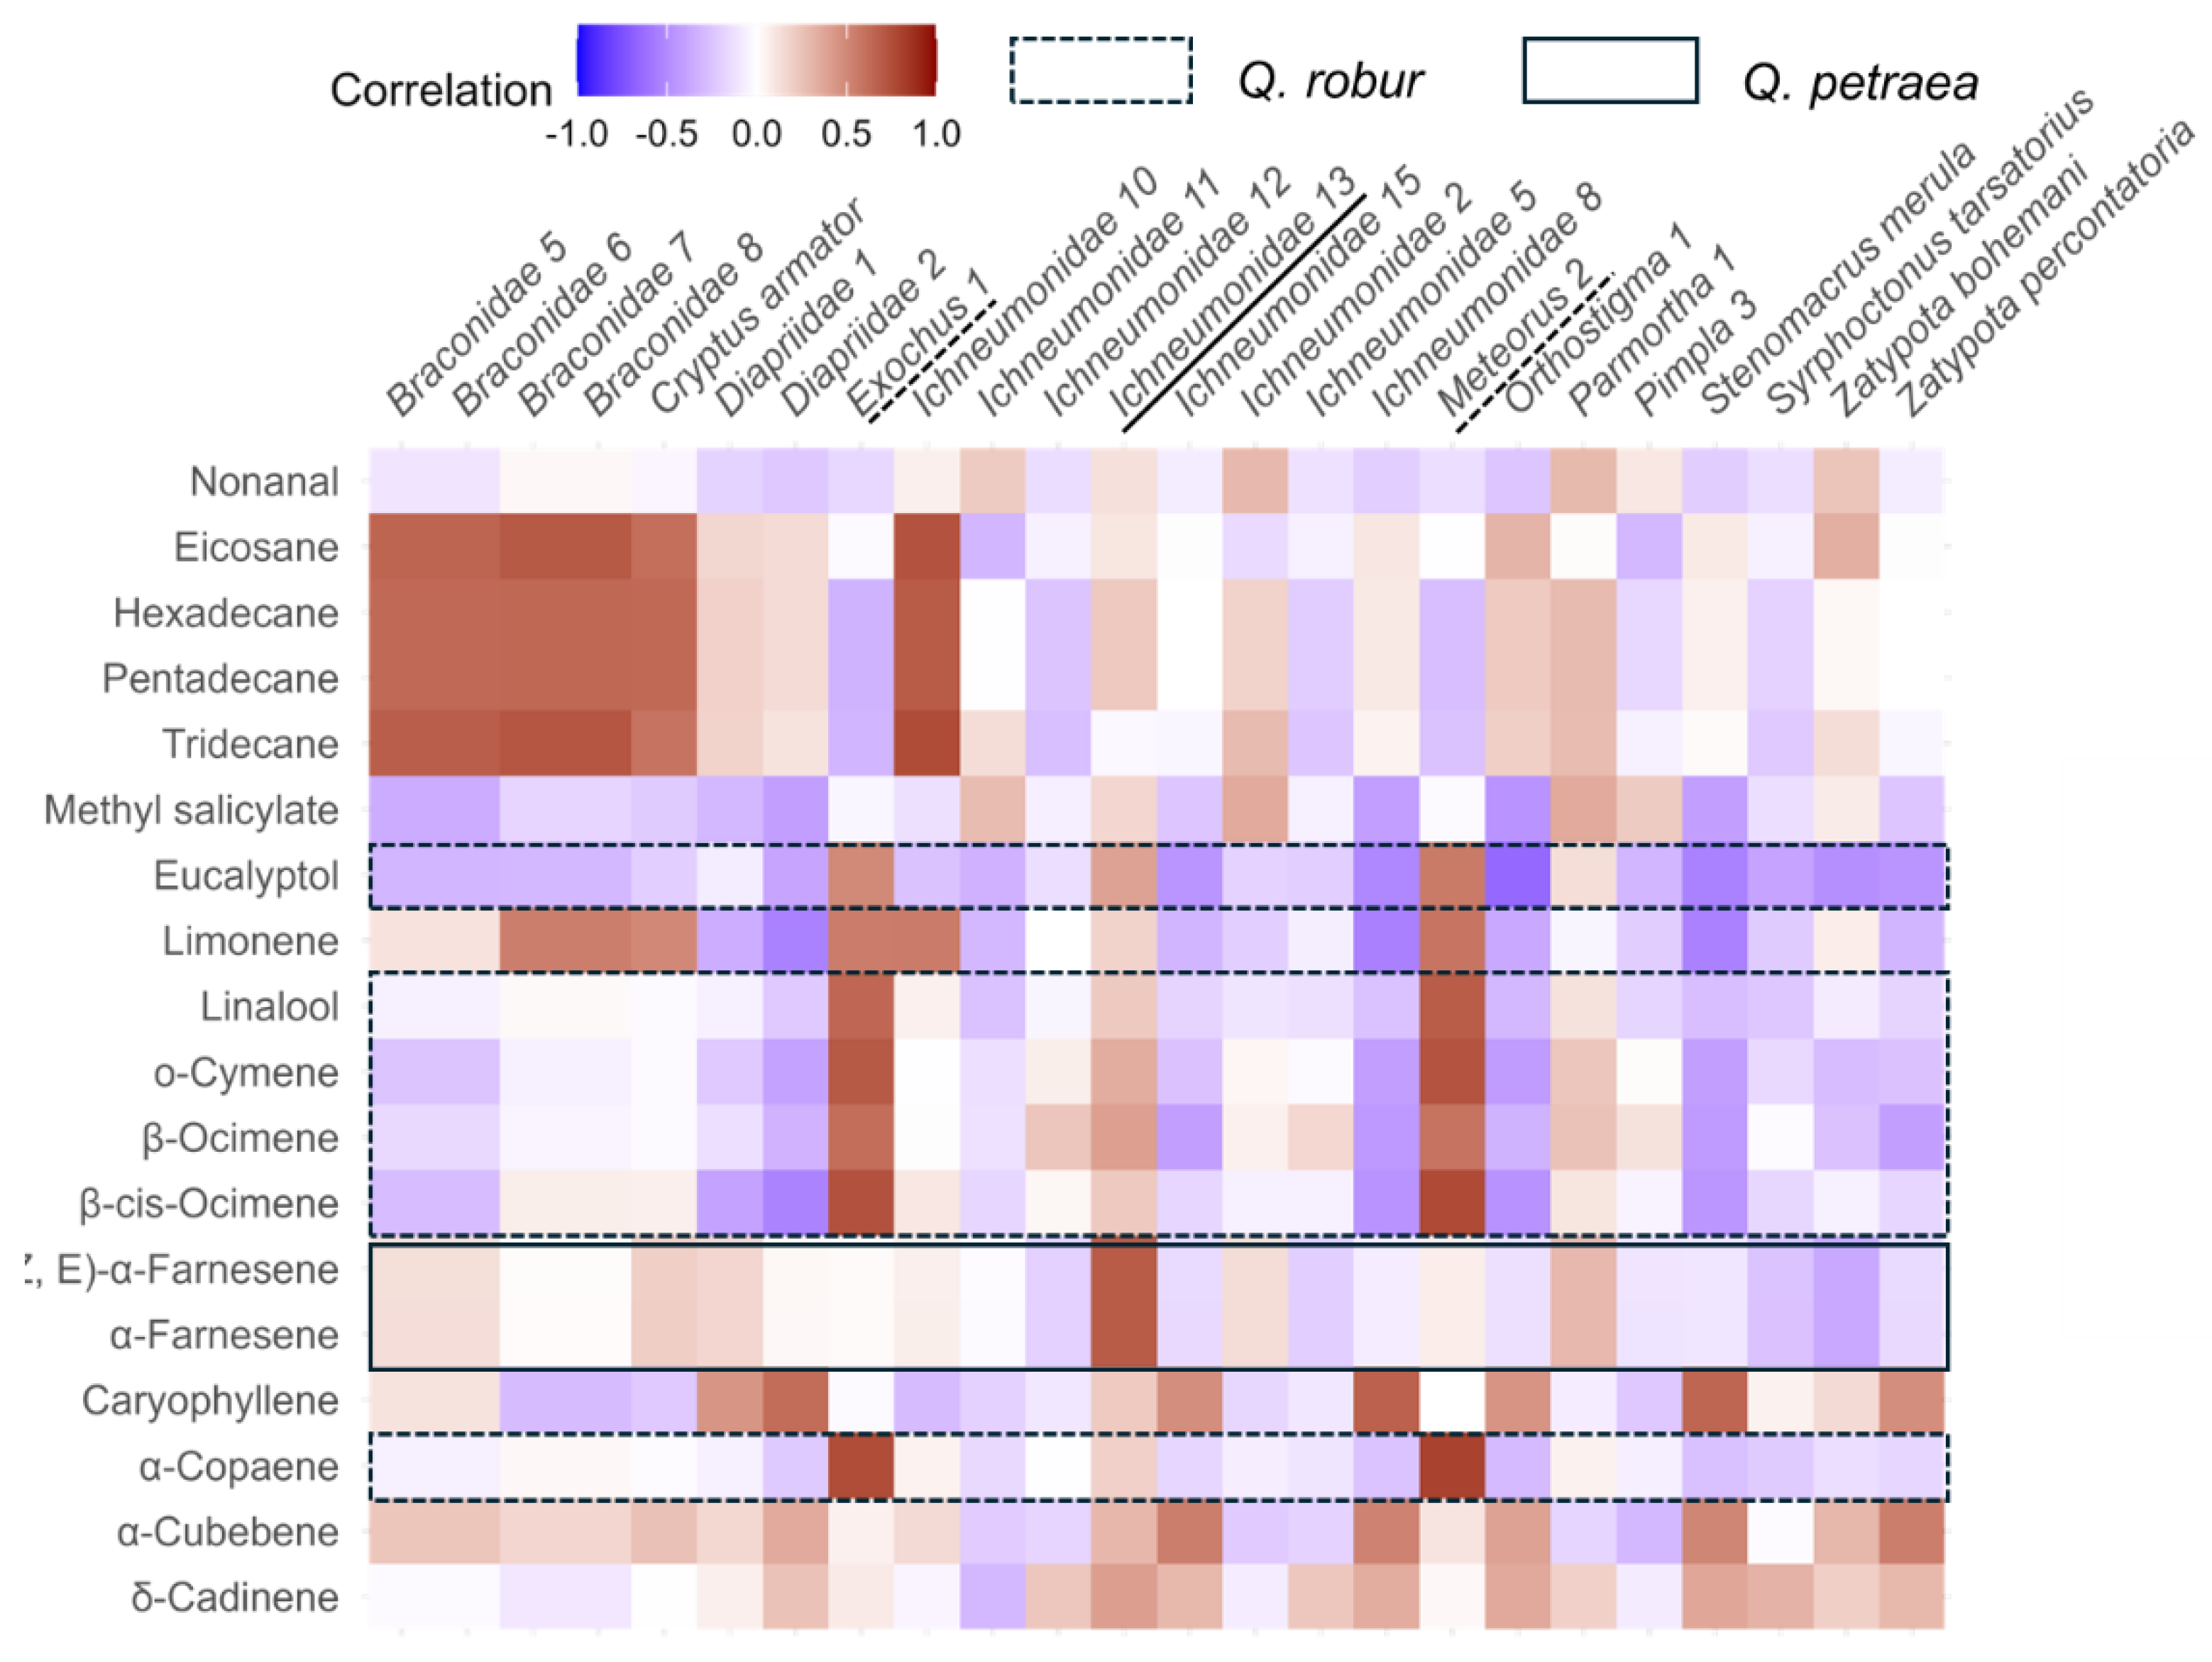
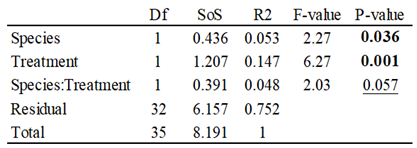
VOC Emissions
Parasitoids
4. Discussion
5. Conclusions
Supplementary Materials
Author Contributions
Funding
Institutional Review Board Statement
Data Availability Statement
Acknowledgments
Conflicts of Interest
Appendix A. Metabarcoding Data
References
- Stireman, J.O.; Shaw, S.R. Natural History and Ecology of Caterpillar Parasitoids. In Caterpillars in the Middle: Tritrophic Interactions in a Changing World, Marquis, R.J., Koptur, S., Eds.; Springer International Publishing: Cham, 2022; pp. 225–272. [Google Scholar]
- Alleyne, M.; Beckage, N.E. Parasitism-induced effects on host growth and metabolic efficiency in tobacco hornworm larvae parasitized by Cotesia congregata. Journal of Insect Physiology 1997, 43, 407–424. [Google Scholar] [CrossRef] [PubMed]
- Moore, M.E.; Kester, K.M.; Kingsolver, J.G. Rearing temperature and parasitoid load determine host and parasitoid performance in Manduca sexta and Cotesia congregata. Ecological Entomology 2020, 45, 79–89. [Google Scholar] [CrossRef]
- Cuny, M.A.; Poelman, E.H. Evolution of koinobiont parasitoid host regulation and consequences for indirect plant defence. Evolutionary Ecology 2022, 36, 299–319. [Google Scholar] [CrossRef] [PubMed]
- Sobhy, I.; Tamiru, A.; Chiriboga Morales, X.; Nyagol, D.; Cheruiyot, D.; Chidawanyika, F.; Subramanian, S.; Midega, C.; Bruce, T.; Khan, Z. Bioactive volatiles from push-pull companion crops repel fall armyworm and attract its parasitoids. Frontiers in Ecology and Evolution 2022, 10, 883020. [Google Scholar] [CrossRef]
- Janssen, A.; Sabelis, M.W.; Bruin, J. Evolution of herbivore-induced plant volatiles. Oikos 2002, 97, 134–138. [Google Scholar] [CrossRef]
- Dicke, M.; Lucas-Barbosa, D. Herbivore-induced plant volatiles as a source of information in plant–insect networks. In Biology of plant volatiles; CRC Press, 2020; pp. 327–346. [Google Scholar]
- Lortzing, T.; Steppuhn, A. Jasmonate signalling in plants shapes plant–insect interaction ecology. Current Opinion in Insect Science 2016, 14, 32–39. [Google Scholar] [CrossRef] [PubMed]
- Fatouros, N.E.; van Loon, J.J.A.; Hordijk, K.A.; Smid, H.M.; Dicke, M. Herbivore-induced plant volatiles mediate in-flight host discrimination by parasitoids. Journal of Chemical Ecology 2005, 31, 2033–2047. [Google Scholar] [CrossRef] [PubMed]
- Girling, R.D.; Stewart-Jones, A.; Dherbecourt, J.; Staley, J.T.; Wright, D.J.; Poppy, G.M. Parasitoids select plants more heavily infested with their caterpillar hosts: a new approach to aid interpretation of plant headspace volatiles. Proceedings of the Royal Society B: Biological Sciences 2011, 278, 2646–2653. [Google Scholar] [CrossRef] [PubMed]
- Gish, M.; De Moraes, C.M.; Mescher, M.C. Herbivore-induced plant volatiles in natural and agricultural ecosystems: open questions and future prospects. Current Opinion in Insect Science 2015, 9, 1–6. [Google Scholar] [CrossRef] [PubMed]
- Fernandez-Conradi, P.; Castagneyrol, B.; Jactel, H.; Rasmann, S. Combining phytochemicals and multitrophic interactions to control forest insect pests. Current Opinion in Insect Science 2021, 44, 101–106. [Google Scholar] [CrossRef]
- Aartsma, Y.; Bianchi, F.; van der Werf, W.; Poelman, E.H.; Dicke, M. Herbivore-induced plant volatiles and tritrophic interactions across spatial scales. New Phytol 2017, 216, 1054–1063. [Google Scholar] [CrossRef] [PubMed]
- Douma, J.C.; Ganzeveld, L.N.; Unsicker, S.B.; Boeckler, G.A.; Dicke, M. What makes a volatile organic compound a reliable indicator of insect herbivory? Plant, Cell & Environment 2019, 42, 3308–3325. [Google Scholar]
- Gossner, M.M.; Weisser, W.W.; Gershenzon, J.; Unsicker, S.B. Insect attraction to herbivore-induced beech volatiles under different forest management regimes. Oecologia 2014, 176, 569–580. [Google Scholar] [CrossRef]
- Godfray, H.C.J. Parasitoids: behavioral and evolutionary ecology; Princeton University Press, 1994; Volume 12. [Google Scholar]
- van Oudenhove, L.; Mailleret, L.; Fauvergue, X. Infochemical use and dietary specialization in parasitoids: a meta-analysis. Ecology and Evolution 2017, 7, 4804–4811. [Google Scholar] [CrossRef] [PubMed]
- Šigut, M.; Šigutová, H.; Šipoš, J.; Pyszko, P.; Kotásková, N.; Drozd, P. Vertical canopy gradient shaping the stratification of leaf-chewer–parasitoid interactions in a temperate forest. Ecology and Evolution 2018, 8, 7297–7311. [Google Scholar] [CrossRef] [PubMed]
- Hrcek, J.; Miller, S.E.; Whitfield, J.B.; Shima, H.; Novotny, V. Parasitism rate, parasitoid community composition and host specificity on exposed and semi-concealed caterpillars from a tropical rainforest. Oecologia 2013, 173, 521–532. [Google Scholar] [CrossRef] [PubMed]
- Smith, M.A.; Rodriguez, J.J.; Whitfield, J.B.; Deans, A.R.; Janzen, D.H.; Hallwachs, W.; Hebert, P.D.N. Extreme diversity of tropical parasitoid wasps exposed by iterative integration of natural history, DNA barcoding, morphology, and collections. Proc Natl Acad Sci U S A 2008, 105, 12359–12364. [Google Scholar] [CrossRef]
- Fraser, S.E.; Dytham, C.; Mayhew, P.J. Determinants of parasitoid abundance and diversity in woodland habitats. Journal of applied ecology 2007, 44, 352–361. [Google Scholar] [CrossRef]
- Rodriguez, A.; Pohjoismäki, J.L.; Kouki, J. Diversity of forest management promotes parasitoid functional diversity in boreal forests. Biological conservation 2019, 238, 108205. [Google Scholar] [CrossRef]
- Peralta, G.; Frost, C.M.; Didham, R.K. Plant, herbivore and parasitoid community composition in native Nothofagaceae forests vs. exotic pine plantations. Journal of applied ecology 2018, 55, 1265–1275. [Google Scholar] [CrossRef]
- Jactel, H.; Birgersson, G.; Andersson, S.; Schlyter, F. Non-host volatiles mediate associational resistance to the pine processionary moth. Oecologia 2011, 166, 703–711. [Google Scholar] [CrossRef] [PubMed]
- Staab, M.; Bruelheide, H.; Durka, W.; Michalski, S.; Purschke, O.; Zhu, C.-D.; Klein, A.-M. Tree phylogenetic diversity promotes host–parasitoid interactions. Proceedings of the Royal Society B: Biological Sciences 2016, 283, 20160275. [Google Scholar] [CrossRef] [PubMed]
- Guo, P.-F.; Wang, M.-Q.; Orr, M.; Li, Y.; Chen, J.-T.; Zhou, Q.-S.; Staab, M.; Fornoff, F.; Chen, G.-H.; Zhang, N.-L. Tree diversity promotes predatory wasps and parasitoids but not pollinator bees in a subtropical experimental forest. Basic and Applied Ecology 2021, 53, 134–142. [Google Scholar] [CrossRef]
- Haddad, N.M.; Crutsinger, G.M.; Gross, K.; Haarstad, J.; Knops, J.M.; Tilman, D. Plant species loss decreases arthropod diversity and shifts trophic structure. Ecology letters 2009, 12, 1029–1039. [Google Scholar] [CrossRef] [PubMed]
- Moreira, X.; Abdala-Roberts, L.; Rasmann, S.; Castagneyrol, B.; Mooney, K.A. Plant diversity effects on insect herbivores and their natural enemies: current thinking, recent findings, and future directions. Current Opinion in Insect Science 2016, 14, 1–7. [Google Scholar] [CrossRef] [PubMed]
- Yguel, B.; Bailey, R.I.; Villemant, C.; Brault, A.; Jactel, H.; Prinzing, A. Insect herbivores should follow plants escaping their relatives. Oecologia 2014, 176, 521–532. [Google Scholar] [CrossRef]
- Mallick, S.; Molleman, F.; Yguel, B.; Bailey, R.; Müller, J.; Jean, F.; Prinzing, A. Ectophagous folivores do not profit from rich resources on phylogenetically isolated trees. Oecologia 2022, 1–18. [Google Scholar] [CrossRef] [PubMed]
- Hidasi-Neto, J.; Bailey, R.I.; Vasseur, C.; Woas, S.; Ulrich, W.; Jambon, O.; Santos, A.M.C.; Cianciaruso, M.V.; Prinzing, A. A forest canopy as a living archipelago: Why phylogenetic isolation may increase and age decrease diversity. Journal of Biogeography 2019, 46, 158–169. [Google Scholar] [CrossRef]
- Jactel, H.; Moreira, X.; Castagneyrol, B. Tree diversity and forest resistance to insect pests: patterns, mechanisms, and prospects. Annual Review of Entomology 2021, 66, 277–296. [Google Scholar] [CrossRef]
- Setiawan, N.N.; Vanhellemont, M.; Baeten, L.; Gobin, R.; De Smedt, P.; Proesmans, W.; Ampoorter, E.; Verheyen, K. Does neighbourhood tree diversity affect the crown arthropod community in saplings? Biodiversity and conservation 2016, 25, 169–185. [Google Scholar] [CrossRef]
- Crawley, M.J. Insect herbivores and plant population dynamics. Annual review of entomology 1989, 34, 531–562. [Google Scholar] [CrossRef]
- Zvereva, E.L.; Paolucci, L.N.; Kozlov, M.V. Top-down factors contribute to differences in insect herbivory between saplings and mature trees in boreal and tropical forests. Oecologia 2020, 193, 167–176. [Google Scholar] [CrossRef]
- Barton, K.E.; Koricheva, J. The ontogeny of plant defense and herbivory: characterizing general patterns using meta-analysis. The American Naturalist 2010, 175, 481–493. [Google Scholar] [CrossRef]
- Molleman, F.; Mandal, M.; Sokół-Łętowska, A.; Walczak, U.; Volf, M.; Mallick, S.; Moos, M.; Vodrážka, P.; Prinzing, A.; Mezzomo, P. Simulated herbivory affects the volatile emissions of oak saplings, while neighbourhood affects flavan-3-ols content of their leaves. Journal of Chemical Ecology 2024, 1–12. [Google Scholar] [CrossRef] [PubMed]
- Ghirardo, A.; Heller, W.; Fladung, M.; Schnitzler, J.P.; Schroeder, H. Function of defensive volatiles in pedunculate oak (Quercus robur) is tricked by the moth Tortrix viridana. Plant, cell & environment 2012, 35, 2192–2207. [Google Scholar]
- Pearse, I.S.; Gee, W.S.; Beck, J.J. Headspace volatiles from 52 oak species advertise induction, species Identity, and evolution, but not defense. Journal of Chemical Ecology 2013, 39, 90–100. [Google Scholar] [CrossRef] [PubMed]
- Jiang, Y.; Veromann-Jürgenson, L.L.; Ye, J.; Niinemets, Ü. Oak gall wasp infections of Quercus robur leaves lead to profound modifications in foliage photosynthetic and volatile emission characteristics. Plant, cell & environment 2018, 41, 160–175. [Google Scholar]
- Klimm, F.S.; Weinhold, A.; Volf, M. Volatile production differs between oak leaves infested by leaf-miner Phyllonorycter harrisella (Lepidoptera: Gracillariidae) and galler Neuroterus quercusbaccarum (Hymenoptera: Cynipidae). European Journal of Entomology 2020, 117. [Google Scholar] [CrossRef]
- Copolovici, L.; Pag, A.; Kännaste, A.; Bodescu, A.; Tomescu, D.; Copolovici, D.; Soran, M.-L.; Niinemets, Ü. Disproportionate photosynthetic decline and inverse relationship between constitutive and induced volatile emissions upon feeding of Quercus robur leaves by large larvae of gypsy moth (Lymantria dispar). Environmental and Experimental Botany 2017, 138, 184–192. [Google Scholar] [CrossRef] [PubMed]
- Reinhardt, A.; Kreuzwieser, J.; Thies, C.; Arnold, A. Variation of VOC emissions of oak trees infested by oak processionary moth. Annals of Forest Research 2023, 66, 4044–4056. [Google Scholar]
- Volf, M.; Weinhold, A.; Seifert, C.L.; Holicová, T.; Uthe, H.; Alander, E.; Richter, R.; Salminen, J.-P.; Wirth, C.; van Dam, N.M. Branch-localized induction promotes efficacy of volatile defences and herbivore predation in trees. Journal of Chemical Ecology 2021, 47, 99–111. [Google Scholar] [CrossRef]
- Mrazova, A.; Houska Tahadlová, M.; Řehová, V.; Sam, K. The specificity of induced chemical defence of two oak species affects differently arthropod herbivores and arthropod and bird predation. Arthropod-Plant Interactions 2023, 17, 141–155. [Google Scholar] [CrossRef]
- Jurkšienė, G.; Baranov, O.Y.; Kagan, D.I.; Kovalevič-Razumova, O.A.; Baliuckas, V. Genetic diversity and differentiation of pedunculate (Quercus robur) and sessile (Q. petraea) oaks. Journal of Forestry Research 2020, 31, 2445–2452. [Google Scholar] [CrossRef]
- Gossner, M.M.; Brandle, M.; Brandl, R.; Bail, J.; Muller, J.; Opgenoorth, L. Where is the extended phenotype in the wild? The community composition of arthropods on mature oak trees does not depend on the oak genotype. PLoS ONE 2015, 10, e0115733. [Google Scholar] [CrossRef] [PubMed]
- Forest_Data_Bank. Forests on maps. Available online: https://www.bdl.lasy.gov.pl/portal/mapy-en (accessed on 1 October 2018).
- Kallenbach, M.; Oh, Y.; Eilers, E.J.; Veit, D.; Baldwin, I.T.; Schuman, M.C. A robust, simple, high-throughput technique for time-resolved plant volatile analysis in field experiments. Plant J. 2014, 78, 1060–1072. [Google Scholar] [CrossRef] [PubMed]
- Volf, M.; Volfová, T.; Seifert, C.L.; Ludwig, A.; Engelmann, R.A.; Jorge, L.R.; Richter, R.; Schedl, A.; Weinhold, A.; Wirth, C. A mosaic of induced and non-induced branches promotes variation in leaf traits, predation and insect herbivore assemblages in canopy trees. Ecology Letters 2022. [CrossRef]
- Southwood, R.T.E.; Wint, G.R.; Kennedy, C.E.J.; Greenwood, S.R. The composition of the arthropod fauna of the canopies of some species of oak (Quercus). European Journal of Entomology 2005, 102, 65–72. [Google Scholar] [CrossRef]
- Molleman, F.; Walczak, U.; Melosik, I.; Baraniak, E.; Piosik, Ł.; Prinzing, A. What drives caterpillar guilds on a tree: enemy pressure, leaf or tree growth, genetic traits, or phylogenetic neighbourhood? Insects 2022, 13, 367. [Google Scholar] [CrossRef]
- Elbrecht, V.; Peinert, B.; Leese, F. Sorting things out: Assessing effects of unequal specimen biomass on DNA metabarcoding. Ecology and Evolution 2017, 7, 6918–6926. [Google Scholar] [CrossRef]
- Molleman, F.; Walczak, U. Winter moth populations are isolated on co-occurring tree species with contrasting budburst-phenology. Ecological Entomology 2024. [CrossRef]
- Uhler, J.; Redlich, S.; Zhang, J.; Hothorn, T.; Tobisch, C.; Ewald, J.; Thorn, S.; Seibold, S.; Mitesser, O.; Morinière, J. Relationship of insect biomass and richness with land use along a climate gradient. Nature Communications 2021, 12, 5946. [Google Scholar] [CrossRef] [PubMed]
- Leray, M.; Yang, J.Y.; Meyer, C.P.; Mills, S.C.; Agudelo, N.; Ranwez, V.; Boehm, J.T.; Machida, R.J. A new versatile primer set targeting a short fragment of the mitochondrial COI region for metabarcoding metazoan diversity: application for characterizing coral reef fish gut contents. Frontiers in Zoology 2013, 10, 34. [Google Scholar] [CrossRef] [PubMed]
- Ratnasingham, S.; Hebert, P.D. BOLD: The Barcode of Life Data System (http://www. barcodinglife. org). Molecular ecology notes 2007, 7, 355–364. [Google Scholar] [CrossRef] [PubMed]
- Wickham, H. ggplot2: Elegant Graphics for Data Analysis; Springer-Verlag: New York, 2016. [Google Scholar]
- Oksanen, J.; Kindt, R.; Legendre, P.; O’Hara, B.; Stevens, M.H.H.; Oksanen, M.J.; Suggests, M. The vegan package. Community ecology package 2007, 10, 719. [Google Scholar]
- R_Core_Team R: A language and environment for statistical computing; R Foundation for Statistical Computing: Vienna, Austria, 2024.
- Lämke, J.S.; Unsicker, S.B. Phytochemical variation in treetops: causes and consequences for tree-insect herbivore interactions. Oecologia 2018, 187, 377–388. [Google Scholar] [CrossRef] [PubMed]
- Bertić, M.; Schroeder, H.; Kersten, B.; Fladung, M.; Orgel, F.; Buegger, F.; Schnitzler, J.-P.; Ghirardo, A. European oak chemical diversity – from ecotypes to herbivore resistance. New Phytologist 2021, 232, 818–834. [Google Scholar] [CrossRef]
- Pihain, M.; Gerhold, P.; Ducousso, A.; Prinzing, A. Evolutionary response to coexistence with close relatives: increased resistance against specialist herbivores without cost for climatic-stress resistance. Ecology letters 2019, 22, 1285–1296. [Google Scholar] [CrossRef] [PubMed]
- Loreto, F.; Schnitzler, J.-P. Abiotic stresses and induced BVOCs. Trends in plant science 2010, 15, 154–166. [Google Scholar] [CrossRef] [PubMed]
- McCormick, A.C. Can plant–natural enemy communication withstand disruption by biotic and abiotic factors? Ecology and Evolution 2016, 6, 8569–8582. [Google Scholar] [CrossRef]
- Becker, C.; Desneux, N.; Monticelli, L.; Fernandez, X.; Michel, T.; Lavoir, A.-V. Effects of abiotic factors on HIPV-mediated interactions between plants and parasitoids. BioMed research international 2015, 2015, 342982. [Google Scholar] [CrossRef]
- Turlings, T.C.; Erb, M. Tritrophic interactions mediated by herbivore-induced plant volatiles: mechanisms, ecological relevance, and application potential. Annual review of entomology 2018, 63, 433–452. [Google Scholar] [CrossRef]
- Lill, J.; Marquis, R.; Ricklefs, R. Host plants influence parasitism of forest caterpillars. Nature 2002, 417, 170–173. [Google Scholar] [CrossRef] [PubMed]
- Wist, T.J.; Greis, R.; Evenden, M.L. Differential parasitism by a generalist parasitoid is mediated by volatile organic chemicals of the herbivore’s host. Arthropod-plant interactions 2015, 9, 515–527. [Google Scholar] [CrossRef]
- Danner, H.; Desurmont, G.A.; Cristescu, S.M.; van Dam, N.M. Herbivore-induced plant volatiles accurately predict history of coexistence, diet breadth, and feeding mode of herbivores. New Phytologist 2018, 220, 726–738. [Google Scholar] [CrossRef]
- Mezzomo, P.; Weinhold, A.; Aurová, K.; Jorge, L.R.; Kozel, P.; Michálek, J.; Nováková, N.; Seifert, C.L.; Volfová, T.; Engström, M. Leaf volatile and nonvolatile metabolites show different levels of specificity in response to herbivory. Ecology and Evolution 2023, 13, e10123. [Google Scholar] [CrossRef] [PubMed]
- De Moraes, C.M.; Lewis, W.; Pare, P.; Alborn, H.; Tumlinson, J. Herbivore-infested plants selectively attract parasitoids. Nature 1998, 393, 570–573. [Google Scholar] [CrossRef]
- McCormick, A.C.; Boeckler, G.A.; Köllner, T.G.; Gershenzon, J.; Unsicker, S.B. The timing of herbivore-induced volatile emission in black poplar (Populus nigra) and the influence of herbivore age and identity affect the value of individual volatiles as cues for herbivore enemies. BMC plant biology 2014, 14, 1–14. [Google Scholar]
- Bruinsma, M.; Posthumus, M.A.; Mumm, R.; Mueller, M.J.; van Loon, J.J.; Dicke, M. Jasmonic acid-induced volatiles of Brassica oleracea attract parasitoids: effects of time and dose, and comparison with induction by herbivores. Journal of experimental botany 2009, 60, 2575–2587. [Google Scholar] [CrossRef]
- Couchoux, C.; Seppä, P.; Van Nouhuys, S. Strong dispersal in a parasitoid wasp overwhelms habitat fragmentation and host population dynamics. Molecular ecology 2016, 25, 3344–3355. [Google Scholar] [CrossRef]
- Hughes, J.S.; Cobbold, C.A.; Haynes, K.; Dwyer, G. Effects of forest spatial structure on insect outbreaks: insights from a host-parasitoid model. The American Naturalist 2015, 185, E130–E152. [Google Scholar] [CrossRef]
- Fraser, S.E.; Dytham, C.; Mayhew, P.J.; Mouillot, D.; Anderson, B.J. Community structure in ichneumonid parasitoids at different spatial scales. Oecologia 2008, 157, 521–530. [Google Scholar] [CrossRef] [PubMed]
- Fraser, S.E.M.; Dytham, C.; Mayhew, P.J. The effectiveness and optimal use of Malaise traps for monitoring parasitoid wasps. Insect Conservation and Diversity 2008, 1, 22–31. [Google Scholar] [CrossRef]

 |
 |
 |
Disclaimer/Publisher’s Note: The statements, opinions and data contained in all publications are solely those of the individual author(s) and contributor(s) and not of MDPI and/or the editor(s). MDPI and/or the editor(s) disclaim responsibility for any injury to people or property resulting from any ideas, methods, instructions or products referred to in the content. |
© 2024 by the authors. Licensee MDPI, Basel, Switzerland. This article is an open access article distributed under the terms and conditions of the Creative Commons Attribution (CC BY) license (http://creativecommons.org/licenses/by/4.0/).


