Submitted:
10 December 2024
Posted:
11 December 2024
You are already at the latest version
Abstract
Stress and strain analysis in lifted segments has been a prominent subject, especially with the increasing use of thin plates and higher pre-outfitting rates, which has brought to light the previously overlooked issue of torsional deformation. This research focused on investigating the mechanics of torsional deformation in thin-plate open-section segments with nonuniform weight distributions during lifting. By simulating the effect of the pre-outfitting weight using offset weights, establishing reasonable lifting point constraints, and creating a typical segment lifting analysis model, the results obtained through nonlinear and linear finite element analyses were compared. Extensive data was employed to establish the relationship between the torsional deformation and offset weights, using the principle of energy and the linear regression method. This analysis uncovered substantial disparities between the linear and nonlinear methods, with the linear approach failing to provide accurate stress and strain for torsion. Furthermore, the stress distribution obtained from nonlinear finite element analysis adhered to contemporary torsional theory. This paper underscores the nonlinear nature of torsional deformation, elucidates the influence of the weight distribution, and establishes a functional relation between the torsional deformation and offset weights, offering a robust tool for optimizing outfitting design and construction schemes.
Keywords:
torsional deformation mitigation
; thin-walled structure
; lifting operation
; parametric modelling
1. Introduction
Segment lifting is a costly operation during the shipbuilding process [1,2]. It occupies space and time on the shipyard, which is critical in the docking stage [3]. The use of docks and gantry cranes is very important, as it controls productivity and drives cost. In particular, modern cruise ships are becoming taller and the superstructures may have multiple layers of decks, as shown in Figure 1. In order to reduce the weight and to lower the center of gravity, 4–8 mm thin plates are widely used. As thinner plates are used and more outfittings are pre-installed [4,5,6], as shown in Figure 2, it results in lower torsional strengths and uneven weight distributions. When the thin plate structures are lifted and installed, the problems related to torsional deformation increase in the segment lifting operations. Characterized by open sections lacking the enclosed geometry of a box, these structures exhibit inherent vulnerability to torsional deformation. Therefore, the stress and strain induced by the torsion from an uneven weight distribution is significant, and it should not be ignored. Furthermore, torsional deformation will make the edges of segments unable to match each other, which influences the feasibility, safety, and cost-effectiveness of ship construction.
Segment lifting plays a pivotal role in shipbuilding, significantly influencing both efficiency and safety. Extensive research has been conducted in the realm of lifting analysis, with a focus on various types of lifting equipment, such as multi-crane combined operations [7,8], floating cranes [9,10], and mobile cranes [11]. These studies established the foundation for the loads and constraints in stress and deformation analysis.
Research on the deformation and stress analysis of lifted structures has primarily utilized finite element analysis [12,13]. The majority of these studies employed linear finite element methods [14,15,16], of which the emphasis was only on the bending strength or local strength. Prior research in this field often employed simplified lifting point constraints, neglecting the influence of the torsional displacement induced by mechanisms such as equalizers and pulleys. This simplification can lead to an overestimation of the system’s rigidity and potentially contribute to issues arising from excessive constraints. For instance, in the analysis of the lifting stress and strain of a double-layer bottom structure, [17] (2018) constrained the displacements of four lifting points. [18] set lifting point constraints with four and six points to optimize the lifting scheme with the overall strain energy as the optimization objective. Both studies examined thick-walled, closed-box segments, which provided inherent torsional rigidity, minimizing the influence of excessive constraints. [15] adopted a similar constraint setting with four lifting points. Based on the lifting method, two of the lifting points were connected to a fixed pulley. The method of directly constraining the displacements of the lifting points limited the possible free torsional deformation of the segments. [1] also constrained the displacements of four lifting points, resulting in a lack of torsional deformation in the results. Since the subjects of the above two studies were open-type segments, the influence of their torsional deformation should not be ignored. Therefore, the influence of the stress and strain caused by torsional deformation was missing in their research results. The impact of torsional deformation on segments under lifting operations needs further investigation.
This study addressed the characteristics of thin-plate open-section segments and aimed to investigate the behaviors and patterns of torsional deformation during lifting operations. This investigation delved into the underlying causes of torsional deformation and the establishment of appropriate constraints. By comparing the differences between linear and nonlinear finite element simulation results, the objective was to obtain a more precise understanding of the deformation and stress during segmented lifting. Additionally, statistical analysis of a substantial finite element method dataset was conducted to establish a functional relation between segment torsional deformation and the applied torque during lifting operations.
2. Problem Description and Methodology
2.1. Problem Description
The superstructure of a cruise ship consists of multiple decks carefully designed to optimize stability by lowering the center of gravity. This entails strict weight control. Consequently, these decks are constructed using thin plate structures based on the specific needs of the cruise ship. These structures are typically of the open-section type. It is worth noting that this type of structure is relatively weak in terms of torsional resistance, yet there is limited research on the impact of torsional deformation in strength analysis when lifting such segments. Torsional deformations during lifting operations have frequently been disregarded in general analyses due to excessive constraints. The primary source of excessive constraints stems from the imprudent simplification of equalizers. The equalizer is responsible for balancing forces in sub-cables by hinges and pulleys, as shown in Figure 3. Based on its mechanism, the equalizer does not restrict rotation. This is traditionally ignored, because it does not significantly impact the overall structural bending behavior. However, this approach can introduce errors in the local stress and torsion analysis. In particular, this simplification results in inaccuracies in the torsional stress and deformation when the lifting processes of thin-plate structures with nonuniform weight distributions.
The torsional deformation during segment lifting can be attributed to the nonuniform weight distribution. A structure with pre-installed pipes and fittings, as depicted in Figure 2, causes weight concentration and a non-uniform distribution. This nonuniform distribution results in torsional deformation during the lifting process. In Figure 4, the center of gravity of a segment is point G, and the X-axis divides the segment into parts A and B, which are further divided into N pieces from left to right, denoted as and . The definition of the center of gravity indicates that part A and B respectively satisfy the following force and moment equilibrium conditions:
where w and r are the weight and the position vector of the pieces, respectively, , .
However, these conditions do not hold for individual and , which means and are not necessary equal to each other. As , a torque arises in the X-axis direction, which equals
2.2. Methodology
In this study, both linear and nonlinear finite element methods were used to compare the differences in the computational results, as discussed in Section 4. Subsequently, the Abaqus Python module was utilized, and a programming approach was adopted to perform nonlinear finite element analysis to examine the torsional deformation of lifted segments under various weight distribution scenarios, as discussed in Section 5. The deformation magnitude and strain energy were extracted, and through the application of the least squares method to analyze the computed results, a functional relationship between the torsional deformation magnitude and the strain energy was established. Finally, in Section 5.1, by leveraging the law of conservation of energy, a derivation is presented linking the work done by offset weights to the strain energy. By connecting strain energy from the finite element method with the torsional deformation, a functional relationship between the offset weight and the torsional deformation is derived.
2.2.1. Geometric Nonlinear Finite Element Analysis
Geometric nonlinear finite element analysis is a numerical method utilized for studying structural behaviors under significant deformations, like torsion, flexure, and bending. Unlike linear finite element analysis, it takes into account the effects of geometric nonlinearity, considering factors like large displacements, substantial strains, and structural nonlinearity. This approach is crucial in engineering to obtain more accurate predictions of how complex structures will perform under actual operational loads.
2.2.2. Principle of Energy Conservation
The principle of energy conservation is a fundamental physical concept that describes the conservation and transfer of energy within physical systems. In structural engineering, it finds application in the analysis and design of structures. One common use is in employing the conservation of elastic potential energy and strain energy to determine how structures will respond and deform. This principle provides an intuitive and effective means of understanding how structures react to external loads and calculating internal stress and strain distributions. In Section 5, it is used to determine the basic relation between the torsional deformation and the offset weight.
2.2.3. Least Squares Method (Linear Regression)
The least squares method is a mathematical and statistical tool used to fit models or data to observed data points. In linear regression, this method is applied to find the best-fitting line that describes the relationship between two variables. It aims to minimize the sum of squared differences between the observed data points and the fitted line. The least squares method is widely utilized in various fields, such as statistics, engineering, science, and economics, for tasks like data analysis, model development, and trend prediction.
3. Segment Lifting Model Construction
3.1. Thin-Plate Segment Model and Coordinates
The superstructure of a cruise liner is constructed using a multi-decked, thin-plate structure, which involves a significant number of lifting operations for thin-plate segments during the construction phase. Consequently, this study focused on a representative thin-plate segment as the subject of investigation, with specific emphasis on the characteristics of torsional deformation. This typical segment comprised a main deck, along with 45 longitudinal stringers and five transverse beams, as depicted in Figure 5.
The model’s coordinate origin was situated precisely at the center of the main deck, precisely aligned with the structural center of gravity, as shown in Figure 6. The deck structure was characterized by its inherent axisymmetric properties, having symmetric attributes along both the x- and y-axes. The deck had a length of 41.4 m and a width of 27 m, complete with longitudinal stringers, designated as L-22 through L22, and transverse beams, numbered Fr1 through Fr5. The torque and angle of twist followed the left-hand rule, with the clockwise direction defined as the positive direction.
The segment model was constructed utilizing the S4R shell elements in the Abaqus standard element library. S4R5, S8R, and S4RSW were compared. Because the results were identical, S4R was used for a higher efficiency. The mesh size of the elements was set to 300 mm, and the element type was a quadrilateral mesh. The solver was set with Nlgeom on and off, and other parameters were set at the default values. Detailed information regarding the material properties, elements, and dimensional parameters of the structure can be found in Table 1.
3.2. Simplified Set of Lifting Constraints
Gantry cranes are commonly used in the construction of modern large ships as the main lifting equipment. The 800-ton gantry crane has three main hooks, each with an equalizer to balance the forces of the slings, as shown in Figure 7. To avoid over-constraint issues that impede the analysis of torsional deformation in finite element calculations, a simplified set of hooks was employed to constrain the segment displacement. To avoid the pulley-related complexities and the additional nonlinearity, the positions of the three primary hooks were employed as segment lifting points. These hook positions are represented by labels , , and on the main deck, as depicted in Figure 8.
The constraints of the lifting equipment dictated the locations and constraints of the three lifting points, which were kept constant in this work, as shown in Table 2 and Table 3. The constraint setting was based on the most realistic lifting point constraints, avoiding excessive constraints and having no impact on the free torsional deformation of the segments.
3.3. Configuration of Offset Weights and Torques
The impact of the weight distribution on the lifting scheme is a critical aspect of lifting analysis, which directly influences the stability, safety, and efficiency of the lifting process. While the position and height of the weight center have been extensively studied for safety and stability in lifting operations, the specific influence of the local weight distribution on the torsional deformation of the structure remains an unexplored area.
Lifting schemes typically use the center of gravity as a reference point. To prevent weight distribution changes from affecting the structural center of gravity, we propose a solution involving a pair of offset weights. These weights address the weight distribution imbalance between the two parts divided by X-axis. The offset weights are symmetric with respect to the center of gravity, as shown in Figure 9. Meanwhile, the weights are set as and the positions are set as , so that and . By introducing a pair of opposing forces at positions symmetric about the x-axis, each with a magnitude of , the two offset weights can be transformed into four forces symmetric with respect to the X-axis and two torques at the locations 1 and 2. The torques are defined as follows:
3.4. Parametric Modeling and Analysis Scenarios
The continual enhancement of computer capabilities has significantly boosted the efficiency of finite element computational analysis. This advancement forms the basis for statistical analysis methods, relying on a vast number of results from finite element computations. In this paper, a parametric model of the lifting analysis was created using the Abaqus Python module. Extensive computations allowed for statistical analysis of the torsional deformation mechanism of lifted segments. This approach elevated the structural analysis capabilities, circumvented the high costs and experimental errors linked to experimental methods, and was an efficient analytical approach for understanding the mechanical responses of structures under specific conditions.
In Section 4.1 and Section 4.2, the characteristics of stress and strain during torsional deformation under segment lifting conditions are investigated. A comparative analysis of the linear and nonlinear results was performed for cases 1 and 2, as detailed in Table 4.
4. Linear and Nonlinear Results
4.1. Torsional Deformation in Segment Lifting
4.1.1. Torsional Deformation
When comparing the linear and nonlinear computational results, the trends in the torsional deformation were anticipated to be consistent and in accordance with the general principles of torsion theory. However, there was a significant disparity in the magnitudes of the deformation. Under the same conditions, the deformations obtained from the linear calculations were much greater than those from the nonlinear calculations.
Figure 10 shows the magnitude of U3, which represents the deformation in the Z-axis direction. The maximum values in the linear calculations were 8958 and mm, while the nonlinear calculations yielded values of and mm, respectively, for case 1. The results of the linear calculations were unrealistic, as such significant torsional deformations would have inevitably led to structural damage. The reason is revealed in Section 4.2.
However, the results both provided confirmation that the torsional deformation centerline aligned with the suspension point constraints, of which the displacements were zero, as depicted in Figure 11. The centerline was positioned along the X-axis, and the angle of twist was zero, corresponding precisely to the locations of suspension points 1# and 2#, as shown in Figure 12.
4.1.2. Angle of Twist Variations
Based on the finite element method data, it was observed that displacements at different points exhibited the following trends: U1 (in the X-direction) and U2 (in the Y-direction) tended to zero, and they were significantly smaller in magnitude than U3 (in the Z-direction). Consequently, it is justifiable to approximate the torsional deformation by using the U3 displacement. The displacement of the upper edge of the deck is denoted as , and the bottom edge as . i varied from to 22, corresponding to the positions of the longitudinal stringers from L-22 to L22. By extracting the U3 displacement data from the finite element method results, it was possible to calculate the angles of twist at these positions, as follows:
where is the torsion angle at position i, and is the distance between and .
We quantified the variations of the torsional angles also based on and , which provides a more intuitive representation of the deformation. These are defined as follows:
Figure 12 shows the distribution of the torsional deformations and in the X-direction. increased linearly in the X-direction, and thus, the growth rate of also followed a nearly horizontal line. Data analysis revealed consistent torsional deformation patterns from both the linear and nonlinear calculations for the different scenarios. However, the linear calculations yielded significantly larger results than the nonlinear ones. Specifically, for case 1 and case 2, the deformations were 40 and 159 times greater, respectively. The results in Table 6 show that the standard deviation of was very small in relation to the mean, suggesting close proximity of all data points to the average value. Through the analysis of , we determined the pattern of variation in and arrived at a crucial conclusion:
4.1.3. Key Findings
- The trends of the torsional deformation from the linear and nonlinear calculations were consistent. This suggested that under various configurations of the offset weights, torsional deformation occurred uniformly on a global scale. The change in the angle of twist was constant along the X-axis.
- The linear calculations yielded significantly larger values than the nonlinear calculations. This difference in magnitude is evident from the comparison of the linear and nonlinear deformation values in Figure 10. The linear calculations showed unrealistic deformation levels that would lead to structural damage, whereas the nonlinear results provided more accurate estimations.
- The center of torsional deformation coincided with the X-axis, and the point where the angle of twist was zero corresponded precisely to the locations of the suspension points. This alignment reinforced the importance of considering the constraints at the suspension points when analyzing the torsional deformation.
- The significance of using nonlinear calculations for assessing torsional deformation is notable. Linear calculations, as observed, may introduce inaccuracies and should be replaced with more precise nonlinear methods. This is crucial for ensuring the safe lifting of segments without risking structural damage or misinterpretation of the deformation patterns.
4.2. Stress Distribution in Segment Lifting
In the analysis of thin-plate segment lifting, torsional deformation occurs due to the application of torque, resulting in shear strains within the structure’s cross section. This gives rise to geometric nonlinearity, a factor not typically considered in linear theory. However, in torsional scenarios, these strains become significant, necessitating the use of nonlinear elastic theory. Below, we will illustrate these differences by presenting the stress distribution results for case 1 (case 2 is identical except the numbers).
4.2.1. Stress Analysis in Main Deck
Figure 13 depicts the stress distribution resulting from segmented torsional deformation in case 1. In the linear analysis, the maximum von Mises stress was 25.06 MPa, whereas the nonlinear analysis yielded a significantly lower value of 3.658 MPa, nearly 7 times less. The linear calculation yielded a uniformly distributed stress pattern on the deck surface, with stress variations primarily occurring in the underlying framework structure. Conversely, the nonlinear results exhibited a distinctive distribution pattern, highlighting the maximum stress on the deck structure.
Subsequently, we extracted the distributions of S11 (X-direction stress), S22 (Y-direction stress), and S12 (X-Y shear stress), as shown in Figure 14. While the linear results, which were identical to the results in Figure 13(a), remained relatively consistent, the stress distributions for the nonlinear analysis were very different. The stress distribution on the deck surface adhered to bi-moment theory, commonly used for analyzing stresses in thin-walled structures during torsional deformation. In this scenario, the deck experienced the action of two symmetric moments about the X-axis in the X-Y plane, resulting in tensile stresses on the outer regions and compressing stresses in the central region.
4.2.2. Stress Analysis in Structural Frames
This section delves into the stress distributions within the longitudinal stringers and transverse beams, as shown in Figure 15 and Figure 16. In the linear analysis, Figure 17 reveals that the maximum stress was concentrated within the longitudinal stringers. However, in the nonlinear analysis, the deck experienced the highest stress. Notably, the linear calculations neglected the deck’s contribution to the torsional deformation, leading to stress primarily arising from deformation in the stringers. Conversely, the nonlinear analysis accounted for the deck’s torsional stiffness, significantly influencing the stress distribution. Consequently, both the torsional deformation stress and strain were notably higher in the linear calculations than the in nonlinear approach.
Figure 17 and Figure 18 display stress contour plots of the longitudinal stringer L5. In the linear calculations, the stress on the transverse beams closely mirrored that on the deck surface, being uniformly distributed without any torsional shear stress. However, the results from the nonlinear analysis offer a more realistic depiction of the stress distribution, emphasizing the involvement of both the transverse beams and the deck in the torsional deformation.
4.2.3. Key Findings
These key findings underscore the importance of considering torsional deformation through nonlinear analysis when evaluating stress distributions in thin-plate segment lifting scenarios.
- In the linear analysis, the stress distribution primarily occurred in the longitudinal stringers, neglecting the deck’s contribution to torsional deformation. In contrast, nonlinear analysis considered the deck’s torsional stiffness, leading to a more realistic stress distribution. This result emphasized that nonlinear analysis provides a more realistic representation of the stress distribution, taking into account the torsional stiffness of both the deck and the structural frames. This realistic approach helps in better understanding the true stress patterns and strain distribution in the structure during segment lifting.
- The nonlinear results showed that the stress distribution on the deck surface adhered to bi-moment theory, which is commonly used to analyze stresses in thin-walled structures during torsional deformation. The stresses were tensile stresses on the outer regions and compressing stresses in the central region due to the action of two symmetric moments about the X-axis in the X-Y plane.
5. Formulation of Torsional Deformation and Offset Weights
Establishing the relation between the torsional deformation and the offset weight enables a quick and concise analysis of the torsional deformation of lifted segments. Understanding the relationship between the torsional deformation and the offset weight provides crucial information for segment design, aiding in the optimization of the lifting schemes and enhancing the reliability and efficiency of design and construction.
During the design phase, considering factors such as the pre-outfitting weight distribution avoids torsional deformation by strategically arranging weights or, during lifting scheme design, incorporating additional offset weights to counteract the inherent torsional deformation.
By meticulously analyzing a significant volume of the finite element analysis results and leveraging numerical statistical techniques, we have successfully established a functional relation between the torsional deformation and the offset weights within the context of segment lifting. This can provide a tool for the design and construction of segments in shipyards.
5.1. Fundamental Assumptions and Principles
This study was confined to the analysis of deformations during the lifting of a thin-plate segment with an open-section structure. Torsional effects played a paramount role due to the specific structural attributes. The segments experienced constraints from three lifting points and were subjected to torsional moments resulting from offset weights. The constraints of the lifting equipment dictated the locations and constraints of the three lifting points, which were consistent in this study, as shown in Table 2 and Table 3. The parameters , which characterize the offset weights, were defined as independent variables for formulating an equation relating the strain energy to the torsional deformation and the offset weights. In the coordinate system, these parameters are defined as
The torsional moments caused by the offset weights are then expressed as
Through in-depth analysis of the stress and strain during segment lifting, we have put forward the following assumptions to establish a functional relation between the torsional deformation and offset weights.
- Regardless of the point of torque application, torsional deformation exhibited a globally uniform characteristic. Additionally, under the defined conditions, the incremental torsional angles at various positions remain constant, i.e.,where is a constant for the specific working conditions. For simplification, the generalized torsional deformation is defined as Then, Eq 13 can be approximated as,where L is the distance between L22 and L-22.
- The gravitational potential energy changes due to torsional deformation are disregarded. The work done by the torque (off-center weight) is entirely converted into strain energy.
- There is a one-to-one mapping between the torsional deformation and the strain energy and the condition. Thus, is a function of :and is a function of three independent variables: x, y, and w:where represents the strain energy, and and are functions.
5.2. Torsional Deformation and Strain Energy
Considering the nature of the research subject and the underlying principles of torsional deformation, we propose that the connection between the generalized torsional deformation and strain energy should exhibit symmetry and can be represented in the form of raised to the power of :
By employing a linear regression technique based on the least squares method, we modeled the strain energy as a function of raised to the 2nd, 4th, and 6th powers, i.e., , , and , yielding three respective coefficients The fitted coefficients for these power-law functions were , , and , respectively. The corresponding coefficients for the linear results were , , and , respectively.
As shown in Figure 19, when considering geometric nonlinearity, the best fit was achieved with . Conversely, when excluding geometric nonlinearity, which aligned with the results of linear beam theory. However, as previously determined, linear calculations were inappropriate. Hence, we proceeded to derive the relation between the generalized torsional deformation and the offset weight distribution using the function obtained from the nonlinear results:
where is the coefficient that relates the strain energy to the generalized torsional deformation.
5.3. Torsional Deformation and Offset Weights
Abaqus approaches the solution by incremental loading and iterative calculations. The computation process divides the time interval from 0 to 1 into numerous time steps. It gradually increases the load size to enhance the accuracy, iteratively computes the results at each time step, and progressively deduces the full loading state.
Meanwhile, the energy conservation is maintained throughout the calculation process. In this study, the strain energy is equal to the work done by the two torques at every time step. Accordingly, and , and the following equation can be obtained:
For each case from time 0 to 1, the relation between the generalized torsional deformation and the strain energy should also satisfy Eq 18. That was confirmed by the finite element analysis data extracted from Abaqus. Then, the following equation can be obtained:
For the step approach of Abaqus, it is defined that and . So the functional relation between the generalized torsional deformation and the three independent variables related to the offset weights can be rewritten as:
5.4. Discussion
Based on the relationship obtained through the least squares method between the torsional deformation and the strain energy, and by linking the torsional deformation and the work done by the offset weight based on the law of conservation of energy, a functional relationship between the torsional deformation and offset weight was derived. Comparing the function values with the results of finite element calculations demonstrated that the function accurately described the relationship between the torsional deformation and the offset weight (x, y, w), as shown in Figure 20. It can be observed that the parameters , x, and y were equally influential from Eq 23. To ensure that the weight and position parameters were of the same order of magnitude, let , which denote forces, have units of N, and let x and y have units of mm. Their relationship with the generalized torsional deformation was cubic.
In Figure 21, with the product of any two of the three parameters constant, four curves are plotted for product values of , , , and . Meanwhile, the results of the finite element analysis, where any two parameters were multiplied to yield the corresponding numerical values, are also plotted. The results closely aligned with the curves, demonstrating that for any one of the three parameters, their effects were equal and consistent with Eq 23.
Several conclusions can be drawn from Eq 23: 1) When one of the three parameters is zero, torsional deformation is zero, corresponding to no offset weight (). The offset weights are symmetric about the X- or Y-axis, aligning with real-world scenarios. 2) The cubic root relationship between the torsional deformation and the offset weight parameters indicates that as the offset weight parameters increase, the impact increases rapidly initially. 3) The influence of the offset weights is based on the product of the three parameters, suggesting that if the position parameter were large, a smaller weight could still cause significant deformation. 4) and L correspond to the parameters of the segment. L corresponds to the length of the segment in the X-direction, and corresponds to the torsional strength of the structure. With the offset weights unchanged, when is larger, torsional deformation is smaller. Building on this, the study further investigated this type of segmented lifting, confirming that is positively correlated with the structural strength. When the plate thickness or the longitudinal rib height increases, increases, and the torsional deformation decreases.
Based on this equation, a method for controlling the torsional deformation by arranging the offset weight was proposed. First, the torsional deformation caused by the weight distribution of the segment itself is calculated without the offset weight. Then, through two different offset weight arrangement schemes, the coefficient is calculated. Finally, the equation is used to calculate the appropriate offset weight parameters to eliminate torsional deformation, and the results are validated through finite element calculations.
6. Conclusions
This paper presents an analysis of the torsional deformation in the lifting of thin-plate open-section segments, obtained through geometric nonlinear finite element analysis. First, the relationship between the torsional deformation and weight distribution as well as the constraint conditions in segmented lifting are investigated. A model for the offset weights and reasonable lifting point constraints is established. Subsequently, the results obtained from linear and nonlinear finite element analyses are discussed, focusing on the stress and strain during torsional deformation. In the analysis of the strain, it was observed that torsional deformation exhibited global and uniform characteristics. The distribution characteristics of the torsional angles in the X-direction were identified, laying the foundation for establishing a functional relation between the torsional angle and weight distribution. Moreover, the substantial differences in the strain magnitudes between the linear and nonlinear analyses were determined in the stress analysis. It was concluded that nonlinear analysis techniques should be employed when torsional deformation has a significant impact, since their results are more accurate and reliable. Finally, utilizing the principles of energy and the linear regression method based on the least squares technique, an extensive analysis of the finite element data was conducted. This led to the establishment of a functional relation between the torsional deformation and offset weight distribution.
The main contributions of this paper lie in the in-depth exploration of the mechanics of torsional deformation in segment lifting. This analysis unveiled the nonlinear characteristics of the torsional deformation and emphasized the importance of considering these nonlinearity effects. The specific relationship between the weight distribution and torsional deformation was established, providing a reliable tool for the design and construction of segments in shipyards.
In the future, we intend to conduct more extensive research to delve deeper into the phenomena uncovered in this study and to further explore the functional relations established. This exploration will be approached from two complementary perspectives: torsional deformation theory and experimental analysis.
Funding
This research received no external funding
Author Contributions: Bowen Jin
Conceptualization, methodology, software, formal analysis, writing—original draft preparation. Ji Zeng: methodology,validation, supervision. Pan Gao: software,validation. All authors have read and agreed to the published version of the manuscript.
Data Availability Statement
The data and scripts can be found at https://github.com/B1Kim/Python-code-for-the-torsional-research.git.
Conflicts of Interest
The authors declare no conflicts of interest.
References
- Ge, H.; Yang, S. Finite Element Analysis of Surface Ship Hull Thin Section Lifting Scheme, 2022. [CrossRef]
- Dragatogiannis, D.A.; Zaverdinos, G.; Galanis, A. Structural Analysis of Deck Reinforcement on Composite Yacht for Crane Installation. Journal of Marine Science and Engineering 2024, 12. [Google Scholar] [CrossRef]
- Mokhtar, A.A.A.; Zarim, M.A.U.A.A.; Bersara, K.H.b.A.A.T.; Mokhtar, A.H.A. A Review of Modular Construction Shipbuilding in Malaysian Shipyard. 2017.
- Wang, J.; Ren, H.; Chu, N. An MBD based systematic approach of accommodation module building with integrity. Discover Applied Sciences 2024, 6. [Google Scholar] [CrossRef]
- Pfeifer, S.; Seidenberg, T.; Jürgenhake, C.; Anacker, H.; Dumitrescu, R. Towards a modular product architecture for electric ferries using Model-Based Systems Engineering. Procedia Manufacturing 2020, 52, 228–233. [Google Scholar] [CrossRef]
- Rajasekaran, S.; Annet, D.; Choo, Y.S. Optimal locations for heavy lifts for offshore platforms. Asian Journal of Civil Engineering 2008, 9, 605–627. [Google Scholar]
- Choi, K. Lifting analysis for heavy ship-hull blocks using 4 cranes. International Journal of Offshore and Polar Engineering 2005, 15, 62–64. [Google Scholar]
- Ku, N.; Ha, S. Dynamic response analysis of heavy load lifting operation in shipyard using multi-cranes. Ocean Engineering 2014, 83, 63–75. [Google Scholar] [CrossRef]
- Ham, S.H.; Roh, M.I.; Lee, H.; Ha, S. Multibody dynamic analysis of a heavy load suspended by a floating crane with constraint-based wire rope. Ocean Engineering 2015, 109, 145–160. [Google Scholar] [CrossRef]
- Lee, K.Y.; Cha, J.H.; Park, K.P. Dynamic Response of a Floating Crane in Waves by Considering the Nonlinear Effect of Hydrostatic Force. Ship Technology Research 2015, 57, 64–73. [Google Scholar] [CrossRef]
- Qian, S.; Zi, B.; Ding, H. Dynamics and trajectory tracking control of cooperative multiple mobile cranes. Nonlinear Dynamics 2015, 83, 89–108. [Google Scholar] [CrossRef]
- Zhou, H.; Wang, J.; Zhang, H.; Liu, J.; Mo, Z. Prediction and mitigation of out-of-plane welding distortion of a typical block in fabrication of a semi-submersible lifting and disassembly platform. Marine Structures 2021, 77. [Google Scholar] [CrossRef]
- Lee, D.H.; Paik, J.K. Ultimate strength characteristics of as-built ultra-large containership hull structures under combined vertical bending and torsion. Ships and Offshore Structures 2021, 15, S143–S160. [Google Scholar] [CrossRef]
- Gaykar, V.M.; Solanki, J. Stress Analysis of Precast Prestressed Concrete Beams during Lifting 2014.
- Galatanu, L.; Darie, A.G.; Gavan, E.; Mocanu, C.I. Stress and strain analysis that occurs in the structure of a section and in its lifting installation, during the lifting and turning maneuvers. Annals of” Dunarea de Jos” University of Galati. Fascicle XI Shipbuilding 2020, 43, 53–60. [Google Scholar] [CrossRef]
- Su, W.; Qiu, Q. Finite Element Analysis of The Hoisting Process of A Lifting Device Based on ANSYS. IOP Conference Series: Earth and Environmental Science 2019, 242. [Google Scholar] [CrossRef]
- Misbah, M.N.; Sujiatanti, S.H.; Setyawan, D.; Ariesta, R.C.; Rahmadianto, S. Structural analysis on the block lifting in shipbuilding construction process. MATEC Web of Conferences. EDP Sciences, 2018, Vol. 177, p. 01027.
- Fan, Z.; Rui, L.; Yujun, L.; Ruixue, S.; Zhengrun, L. Fast finite element analysis technique for hull section lifting based on parametric method. Journal of Dalian University of Technology 2020, 060, 22–29. [Google Scholar]
Figure 1.
Cruise superstructure and segment lifting in a shipyard.
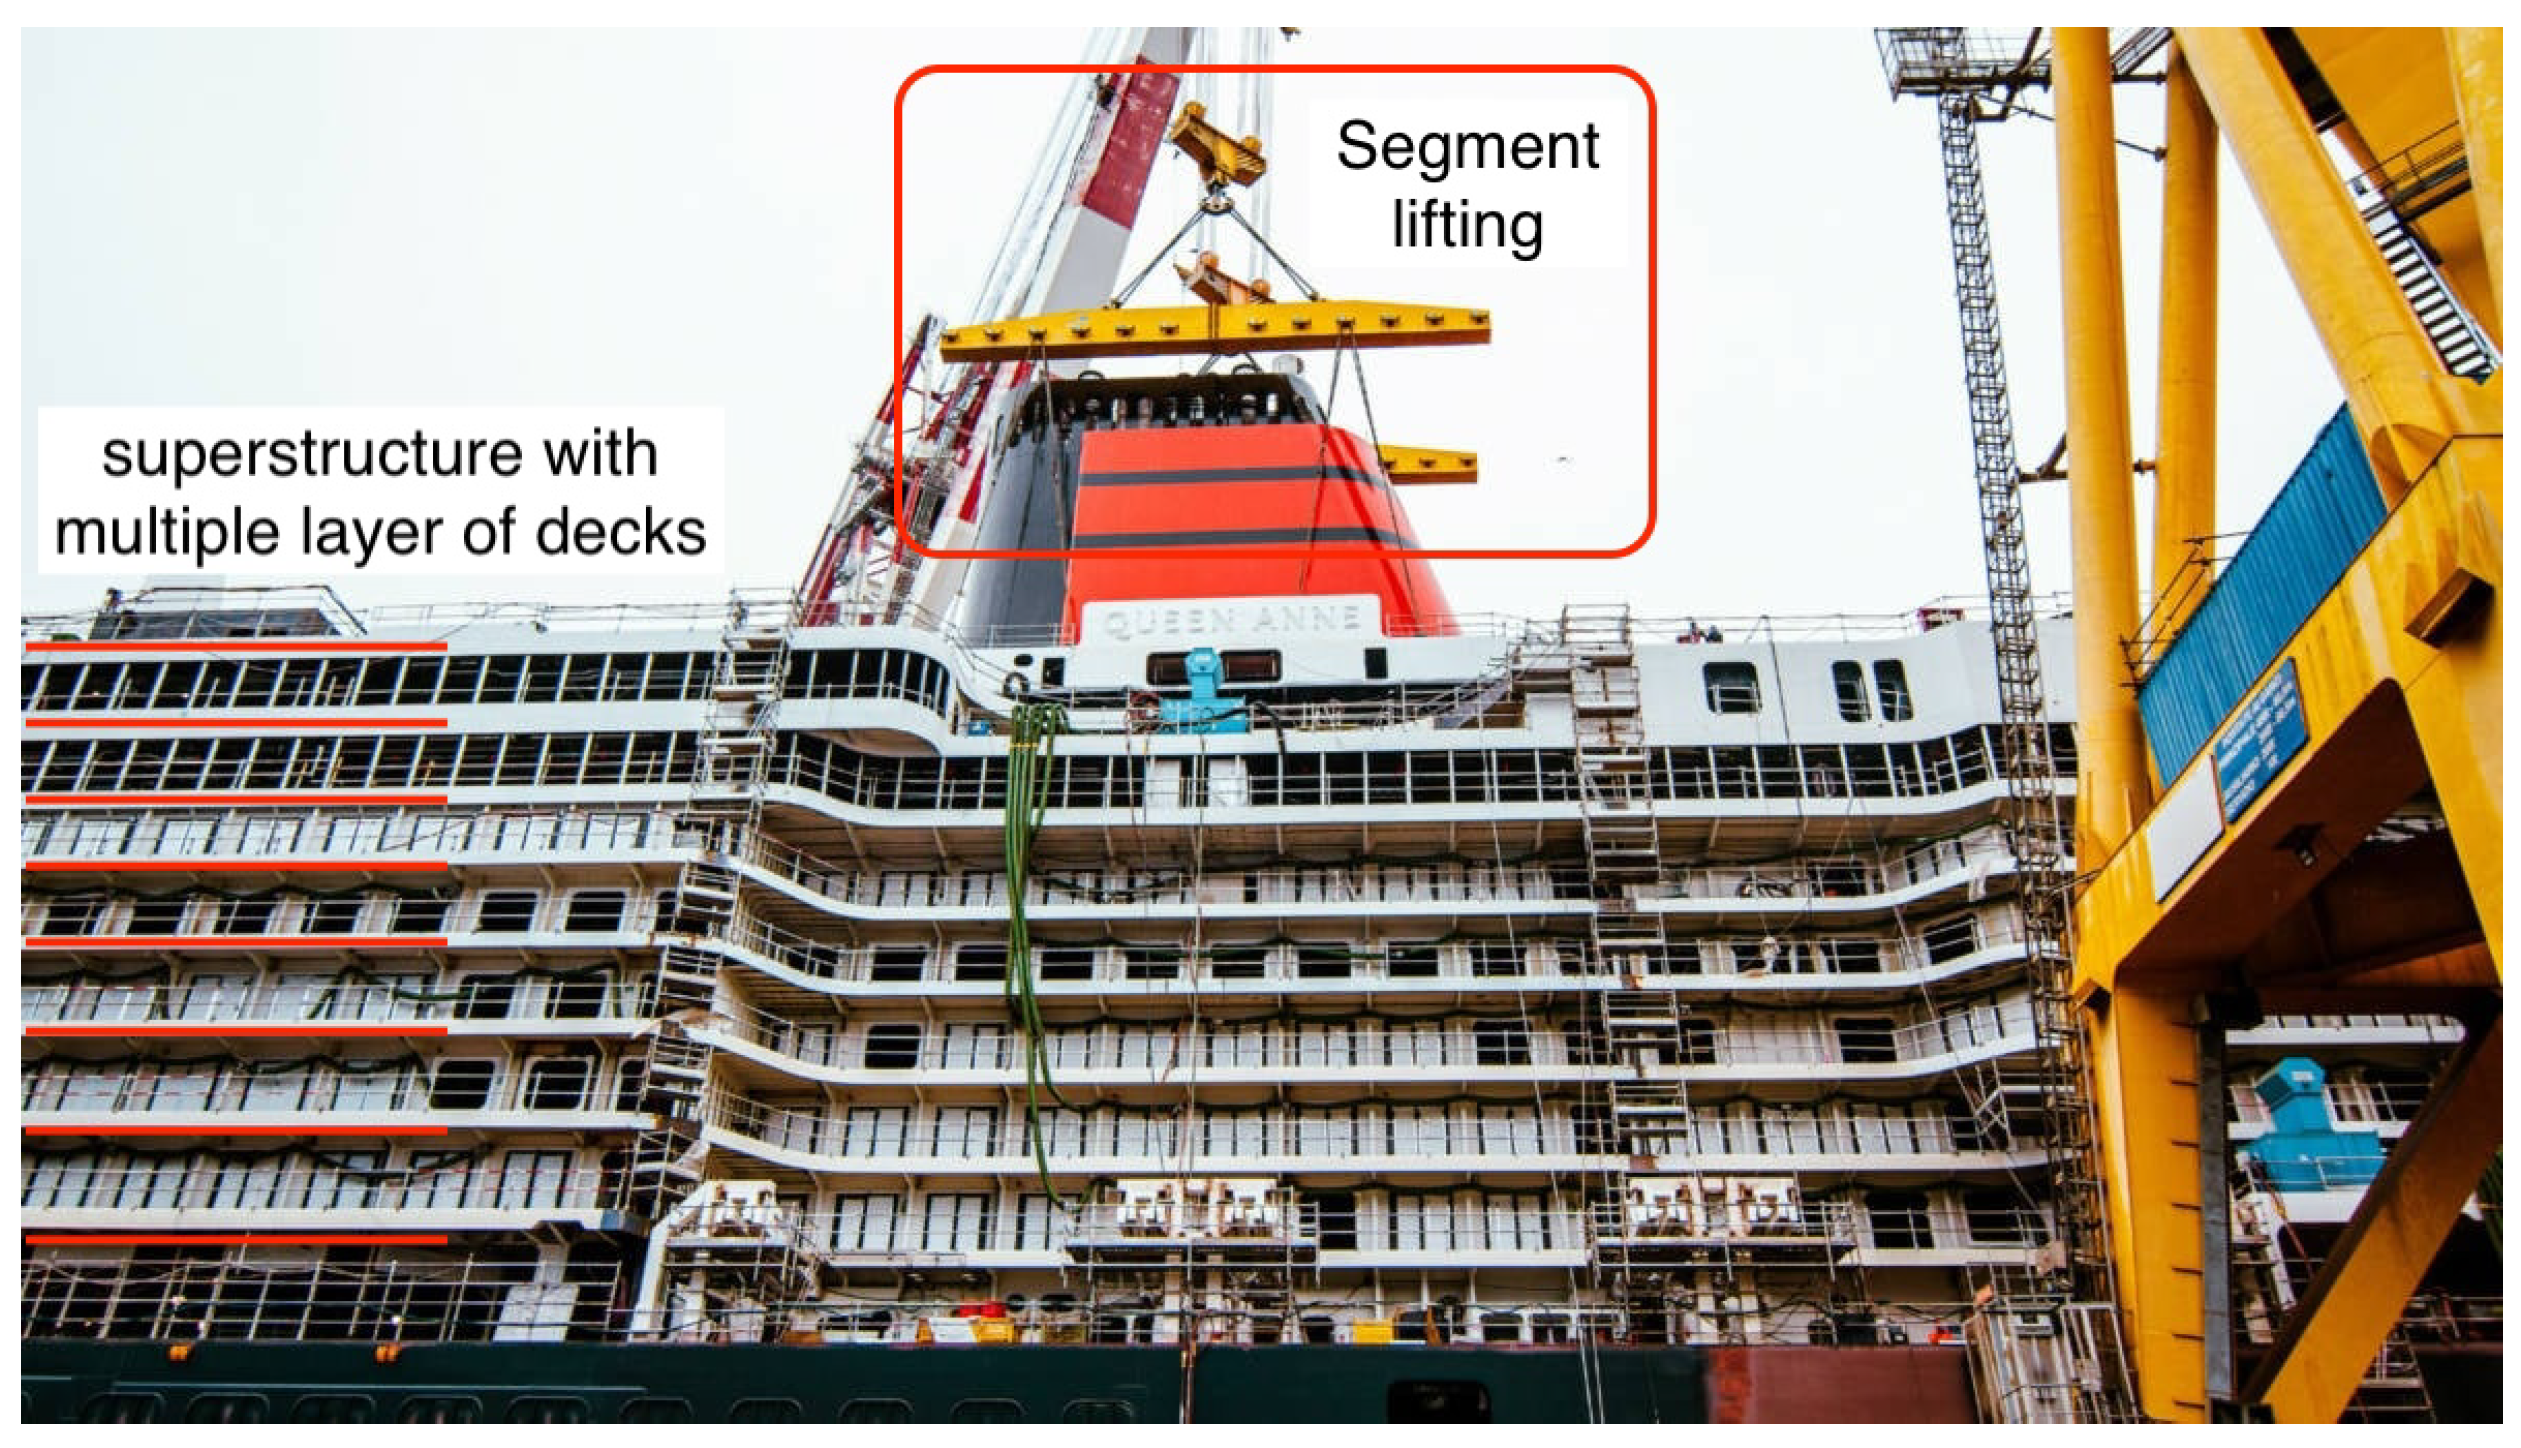
Figure 2.
Segment with many pre-installed outfittings.

Figure 3.
Diagram of an equalizer.
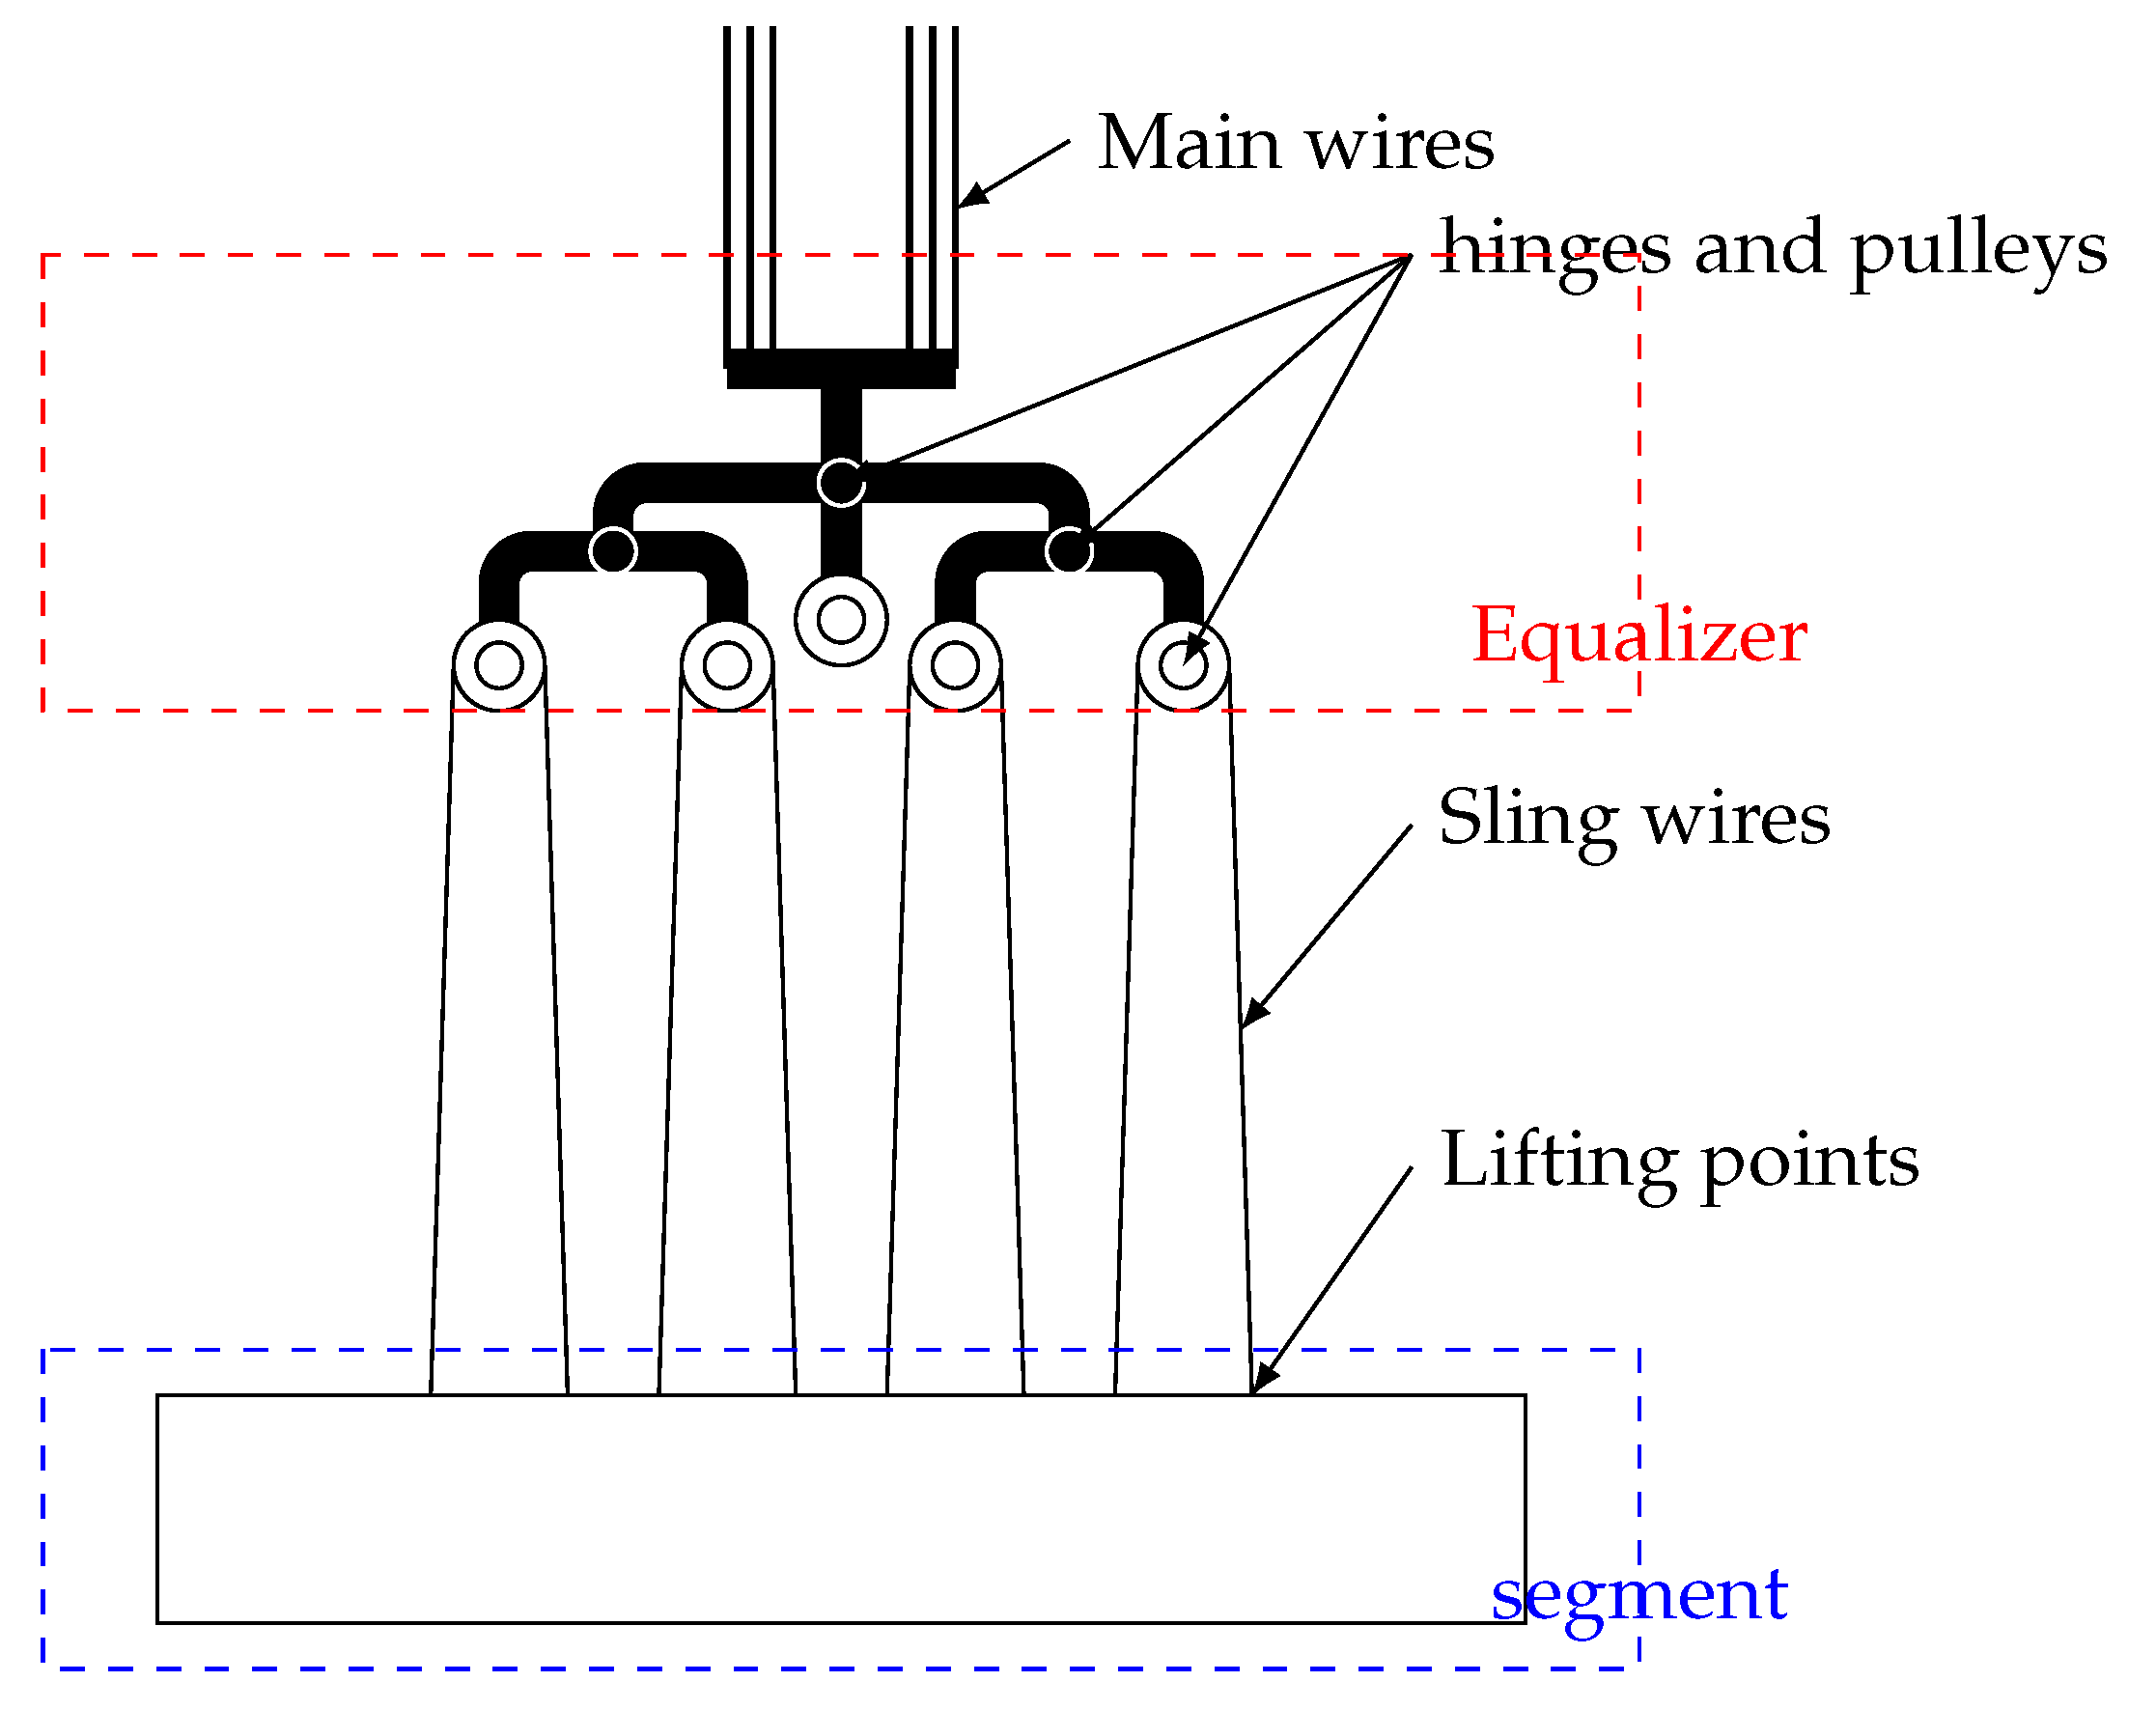
Figure 4.
Illustration of nonuniform weight distribution.
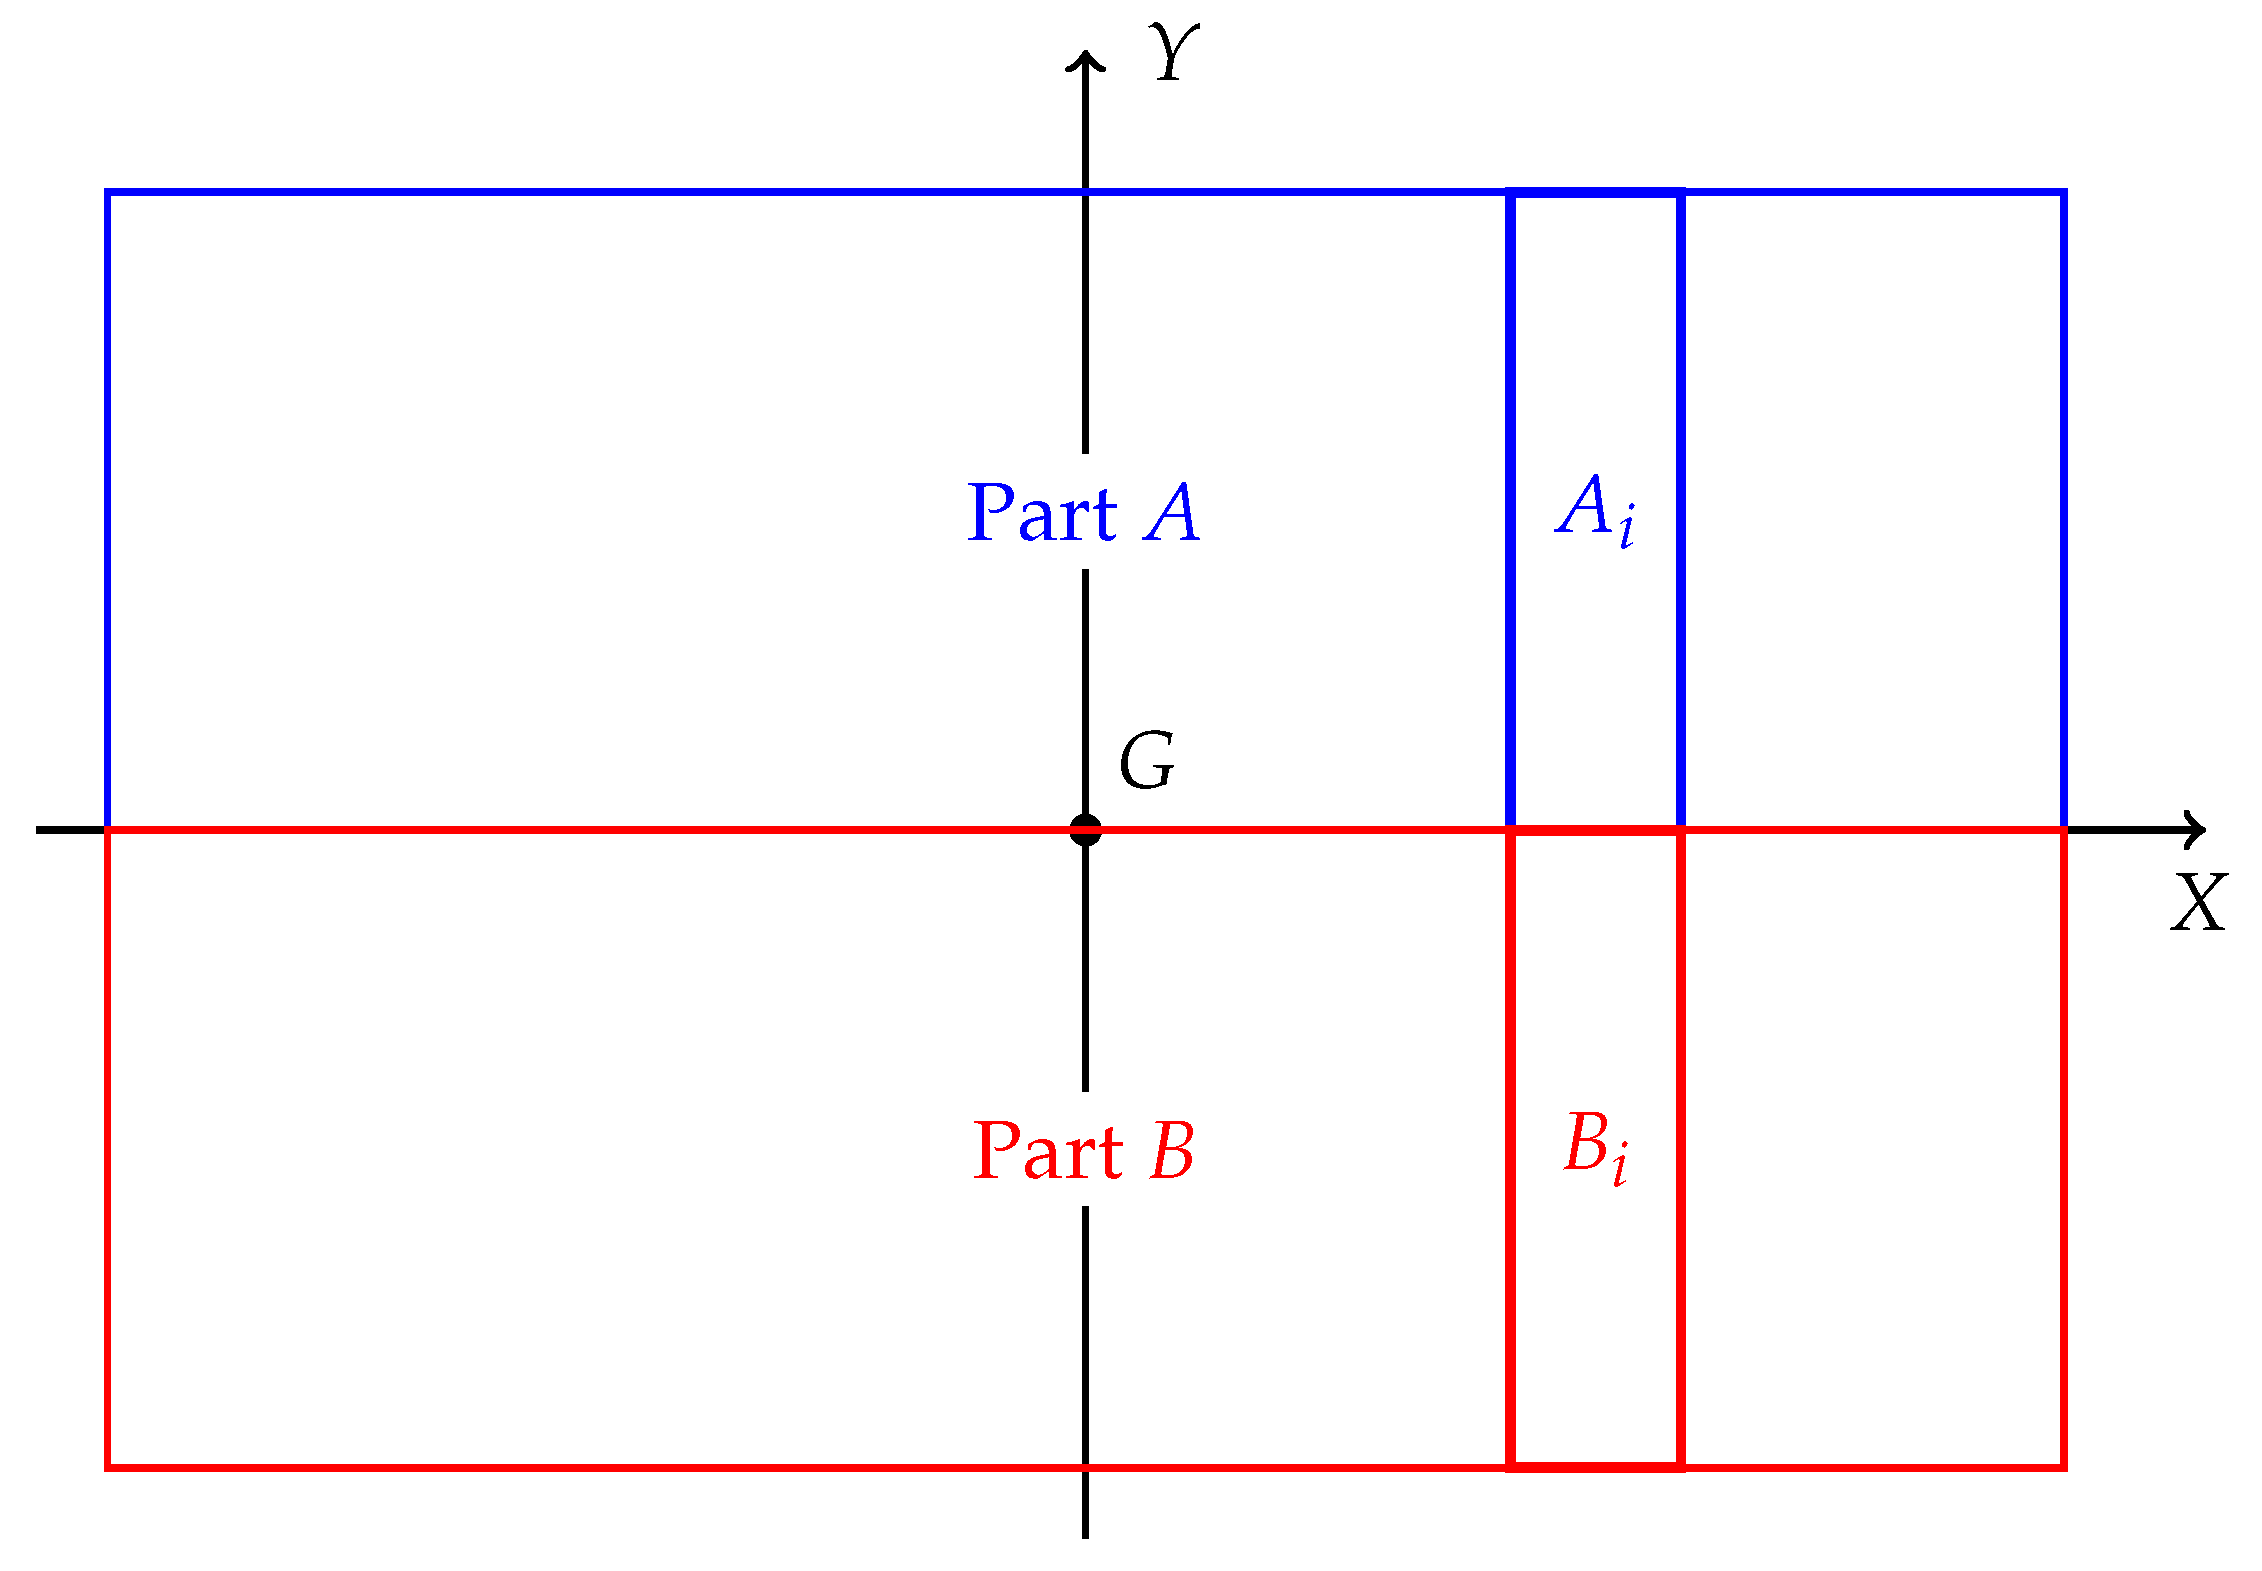
Figure 5.
Illustration of the representative segment model.
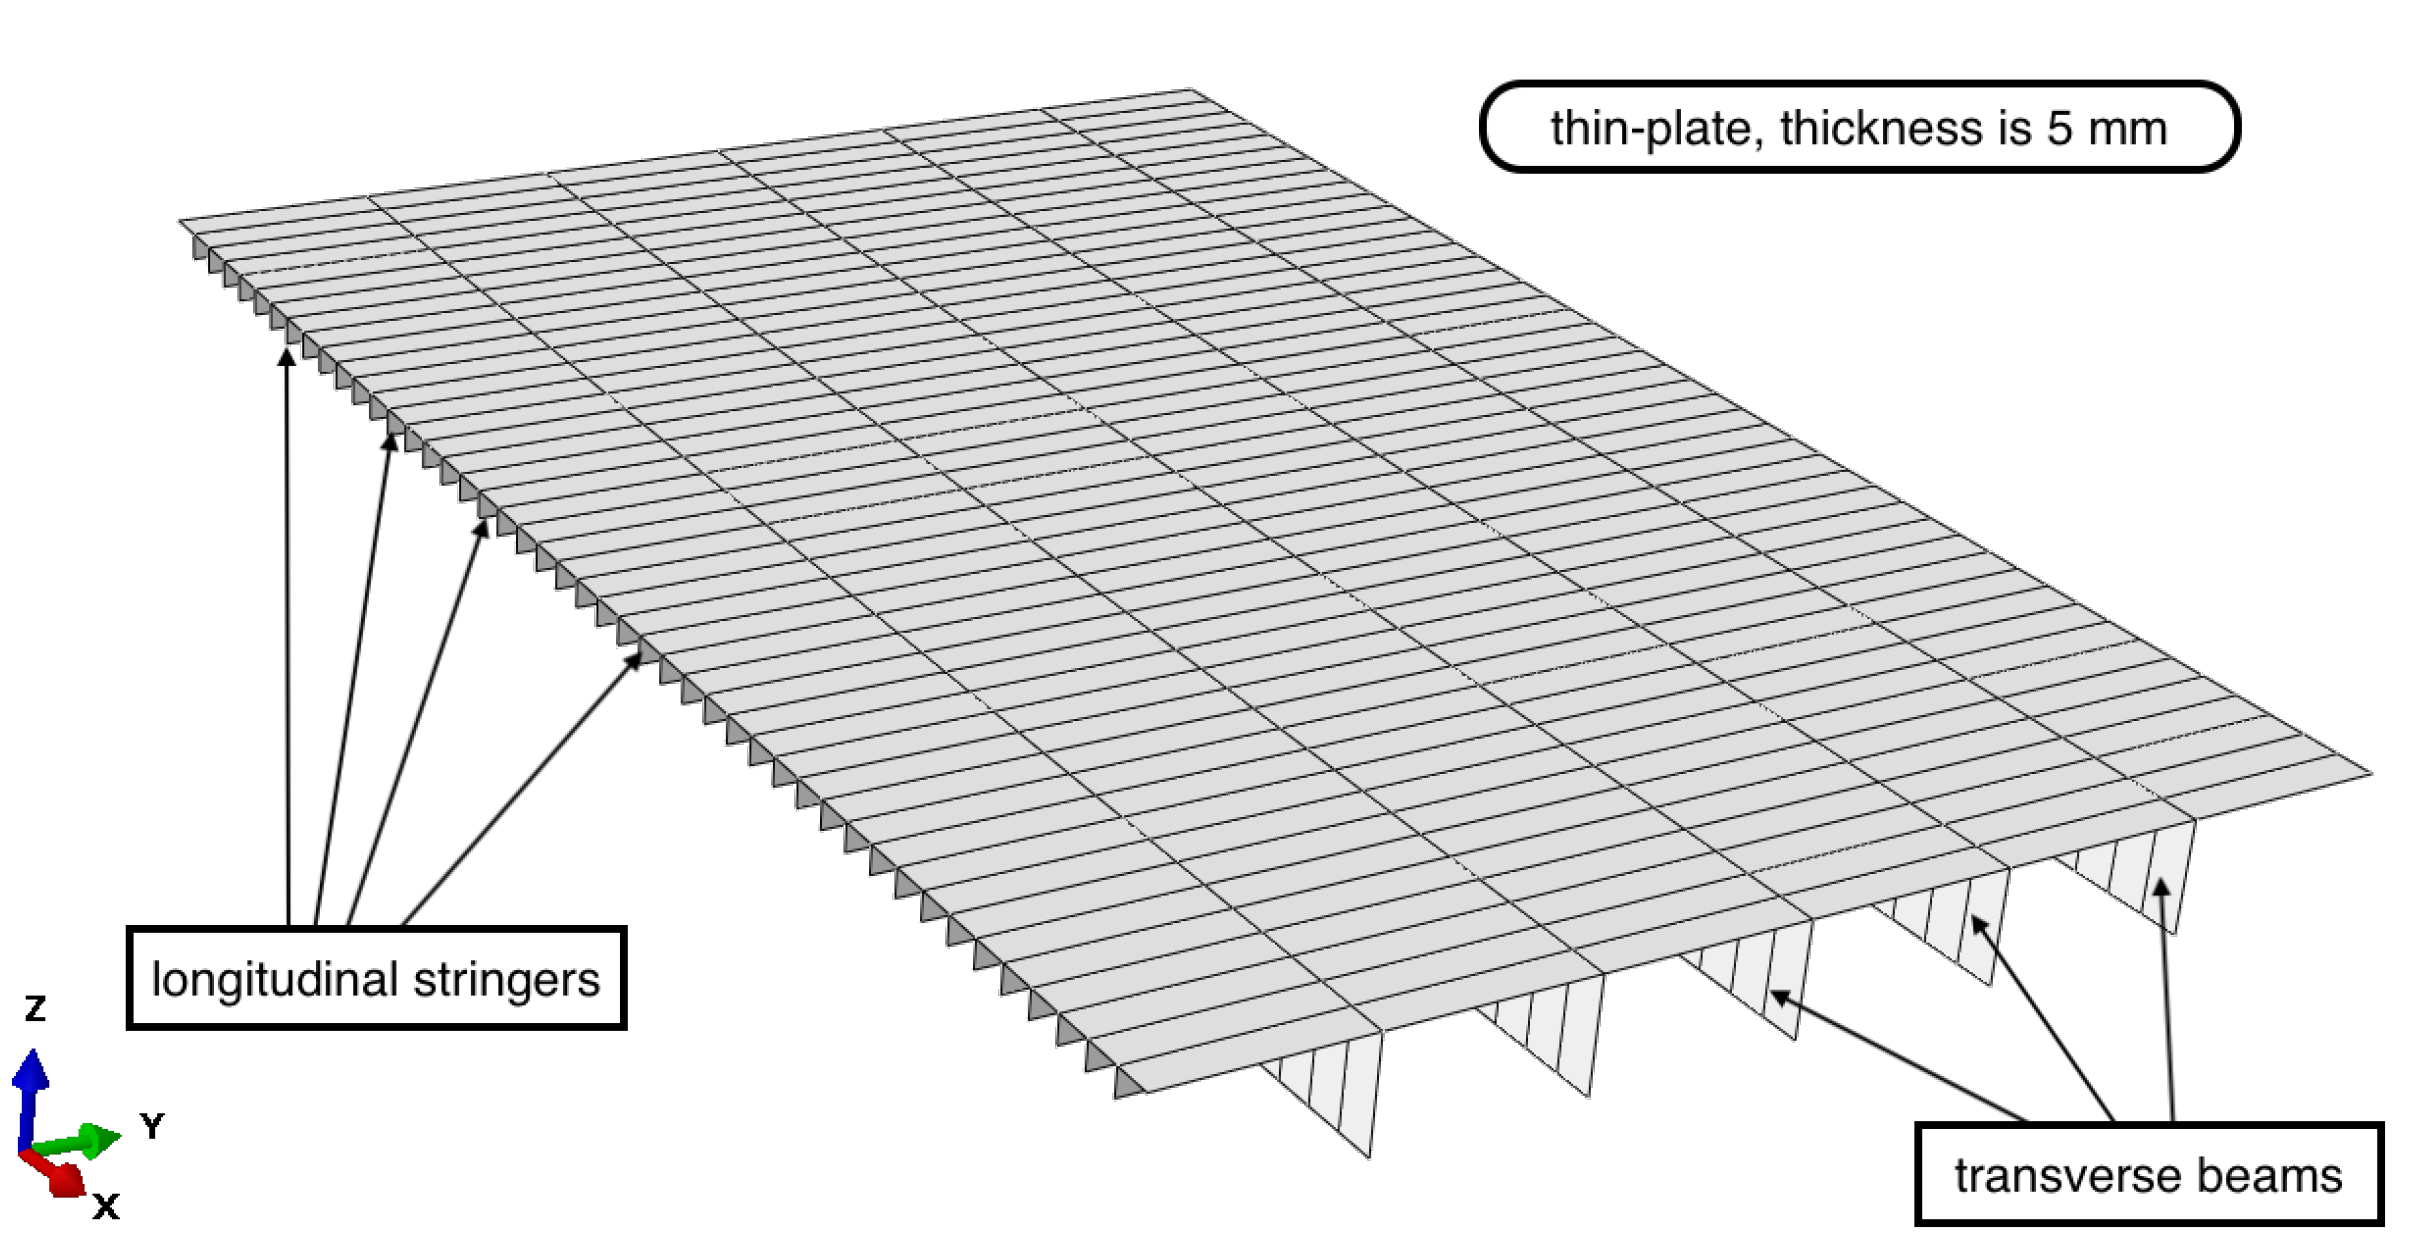
Figure 6.
Coordinate system for segment lifting model (top view of the segment as shown in Figure 5).
Figure 6.
Coordinate system for segment lifting model (top view of the segment as shown in Figure 5).
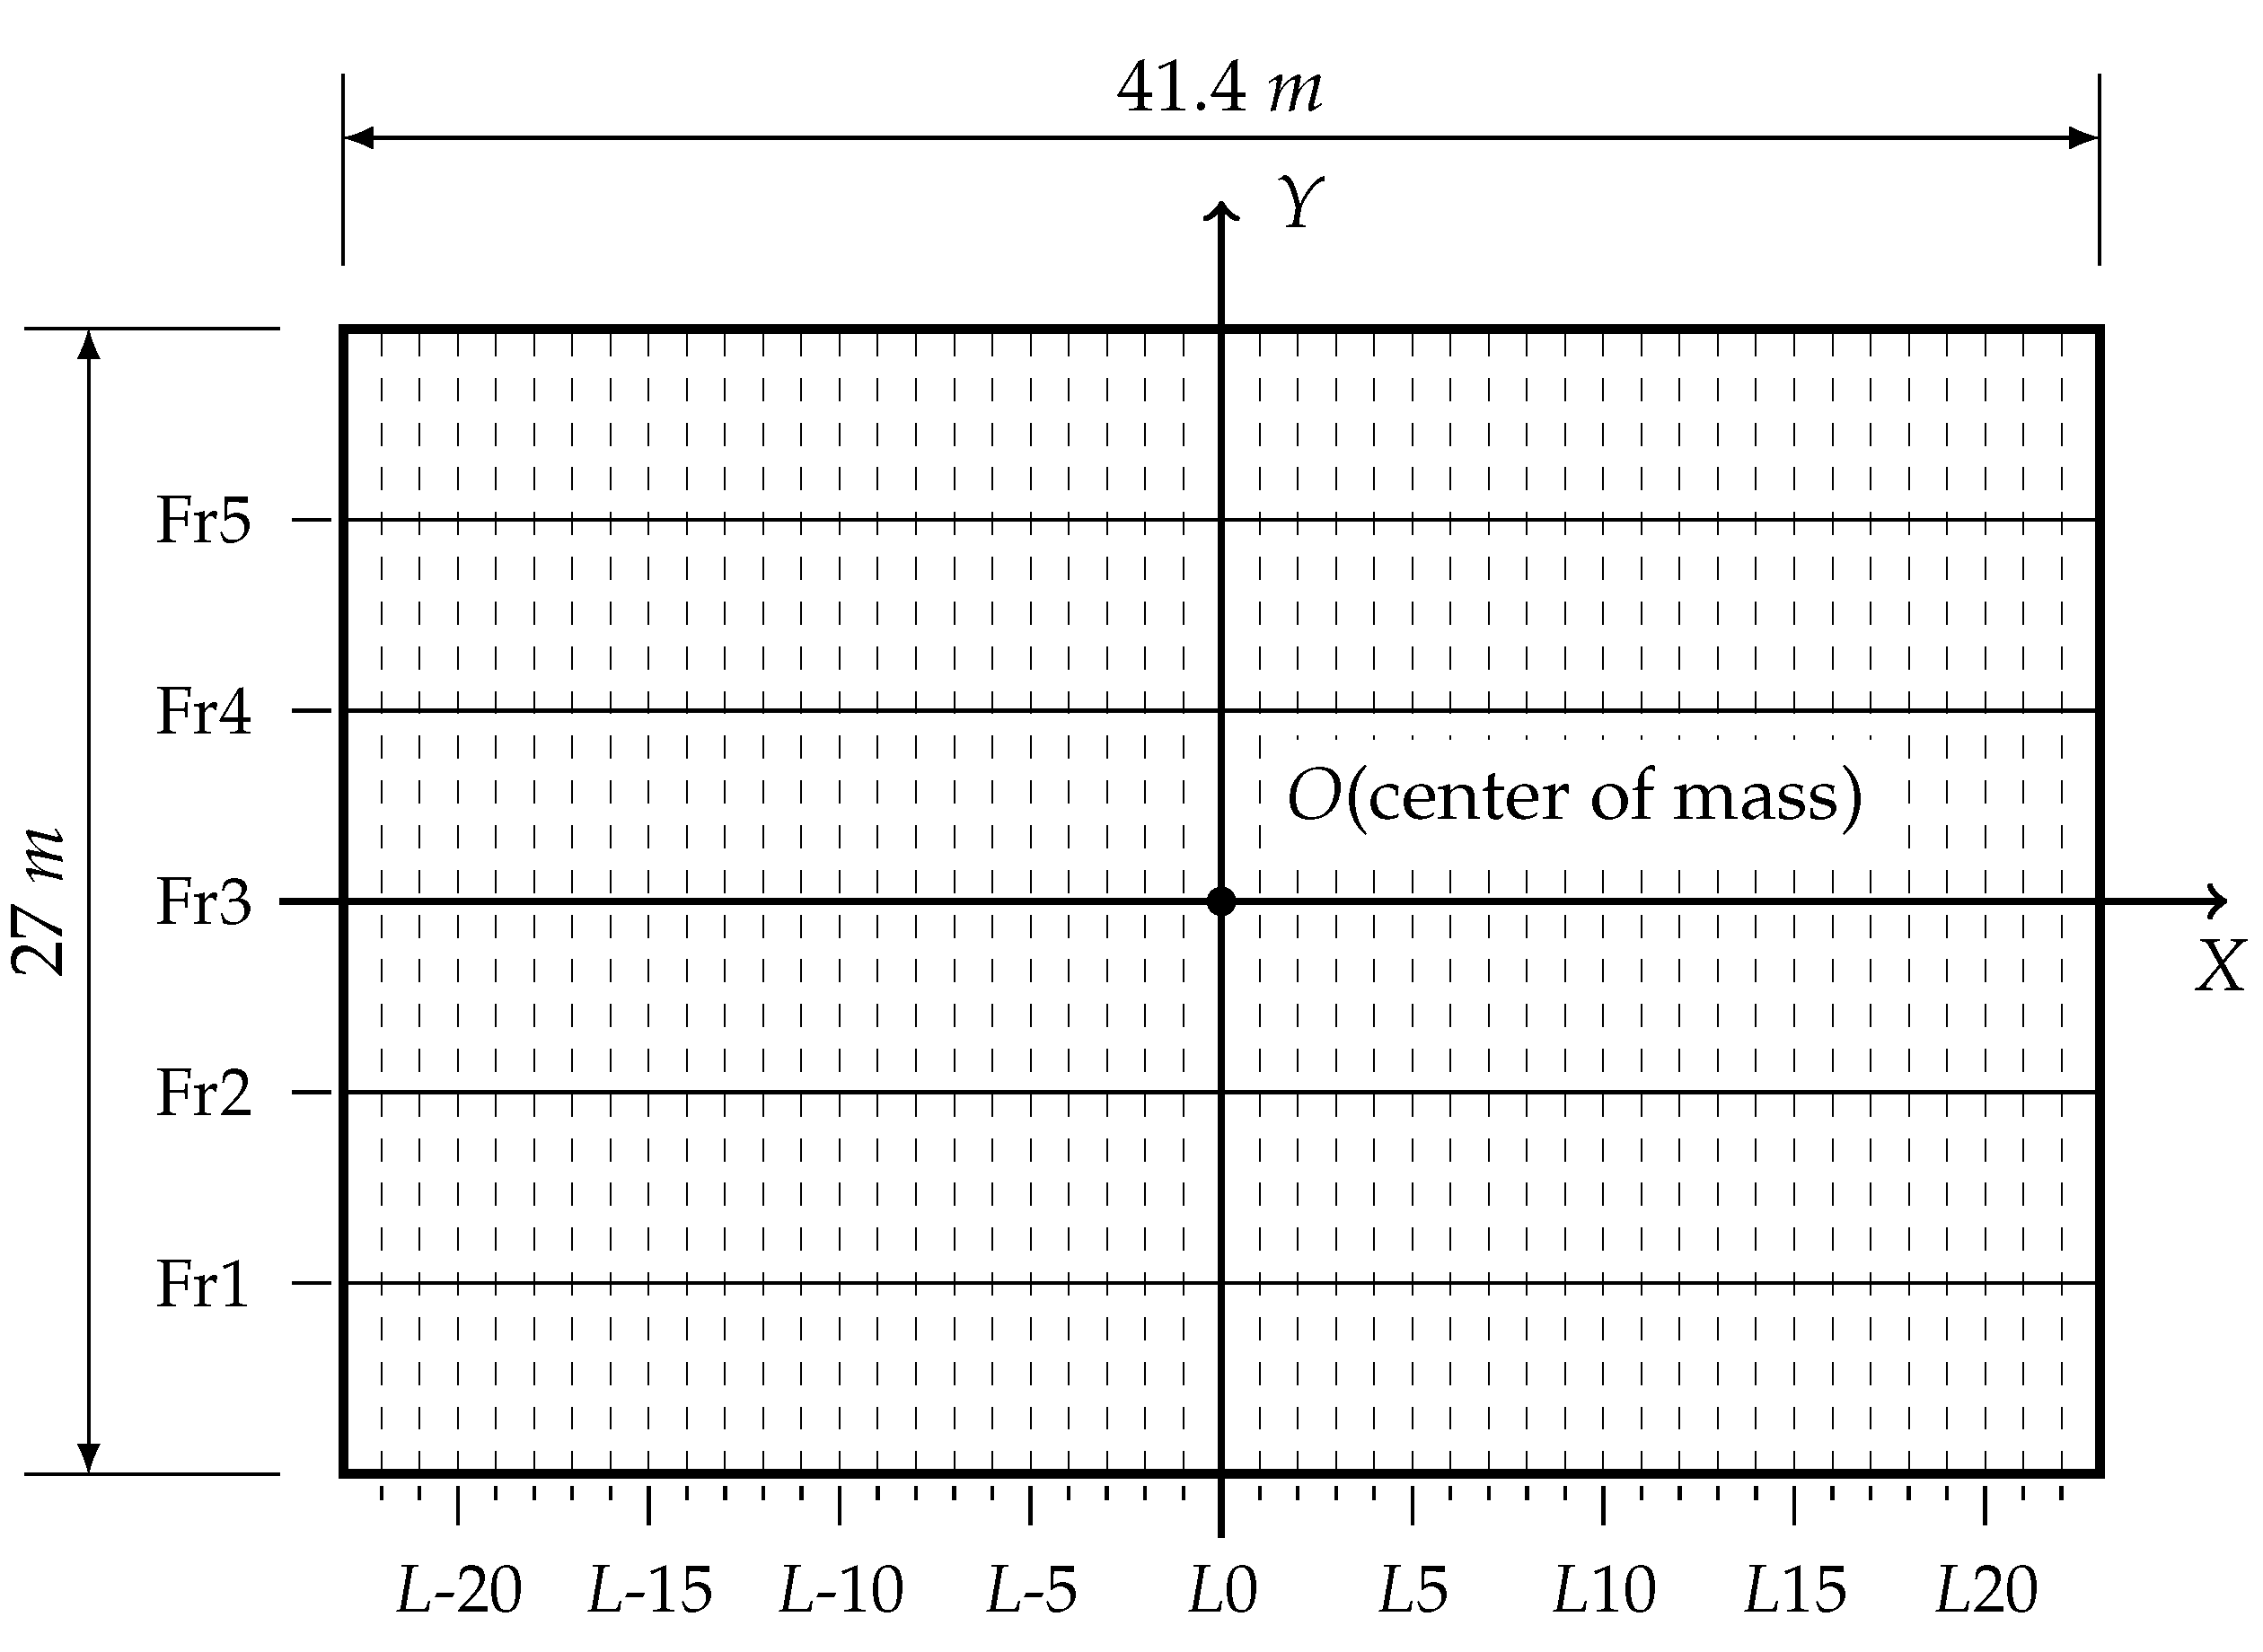
Figure 7.
Gantry crane in the shipyard.
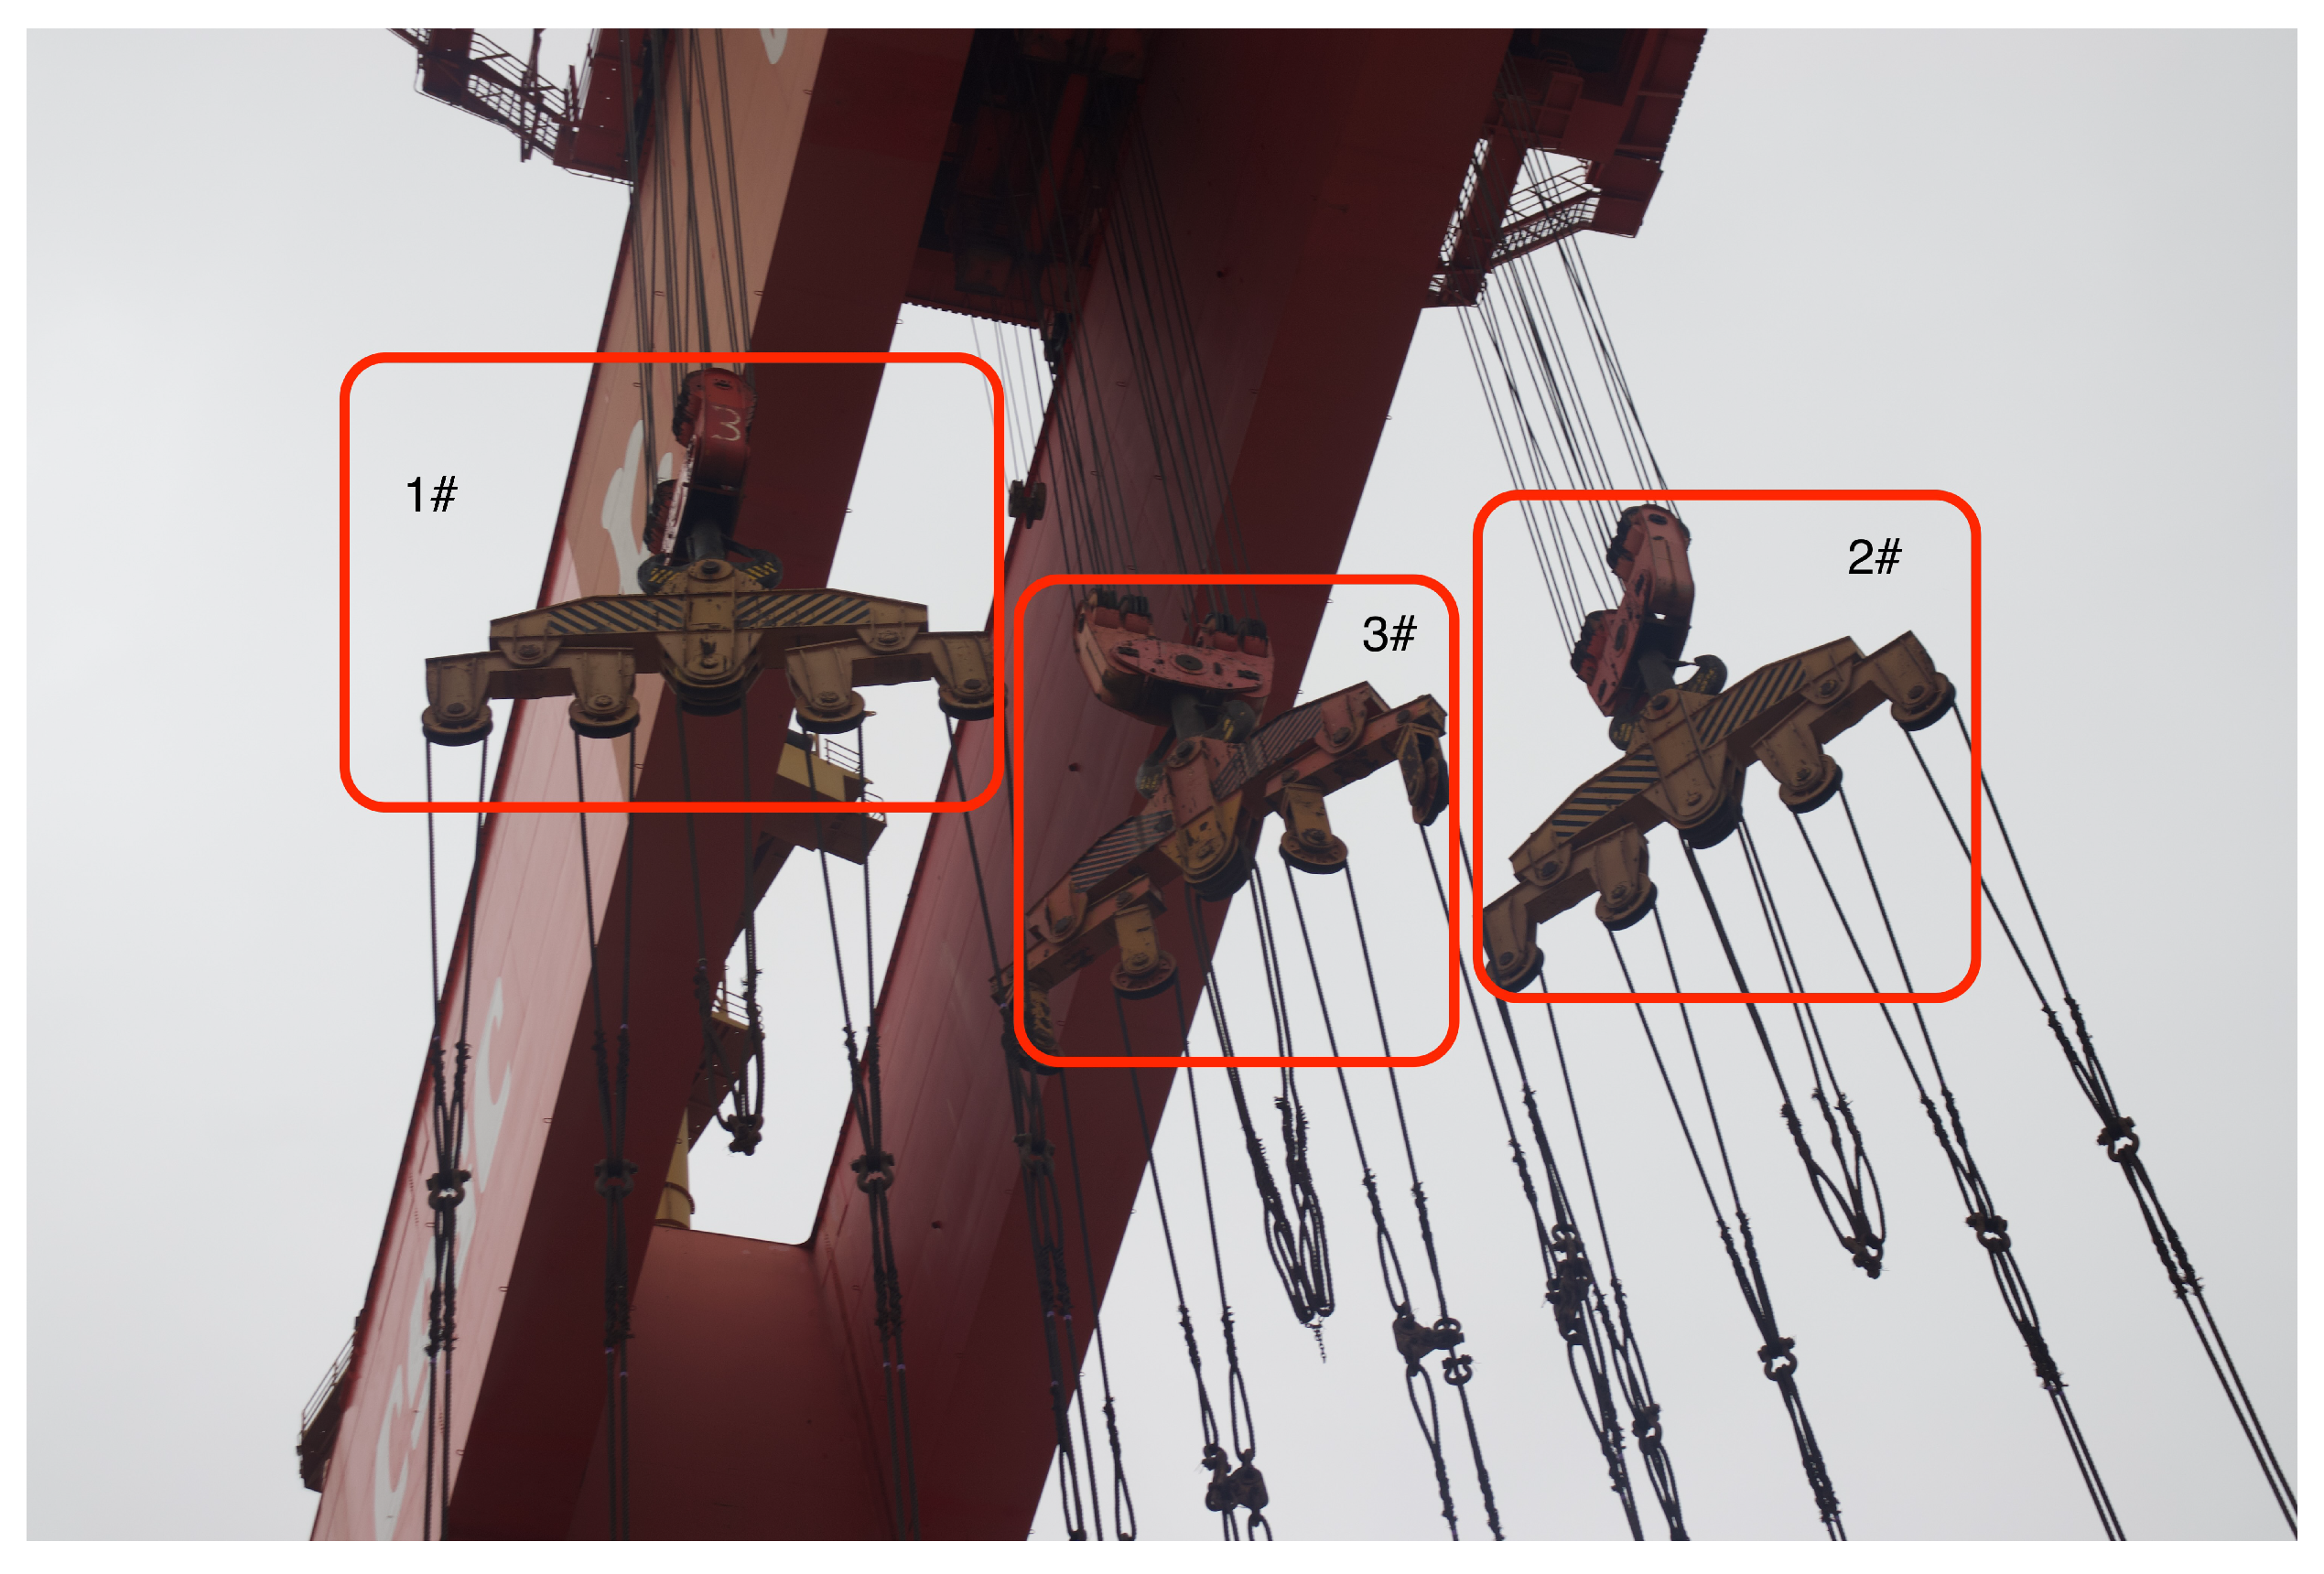
Figure 8.
Simplified set of three main hooks.
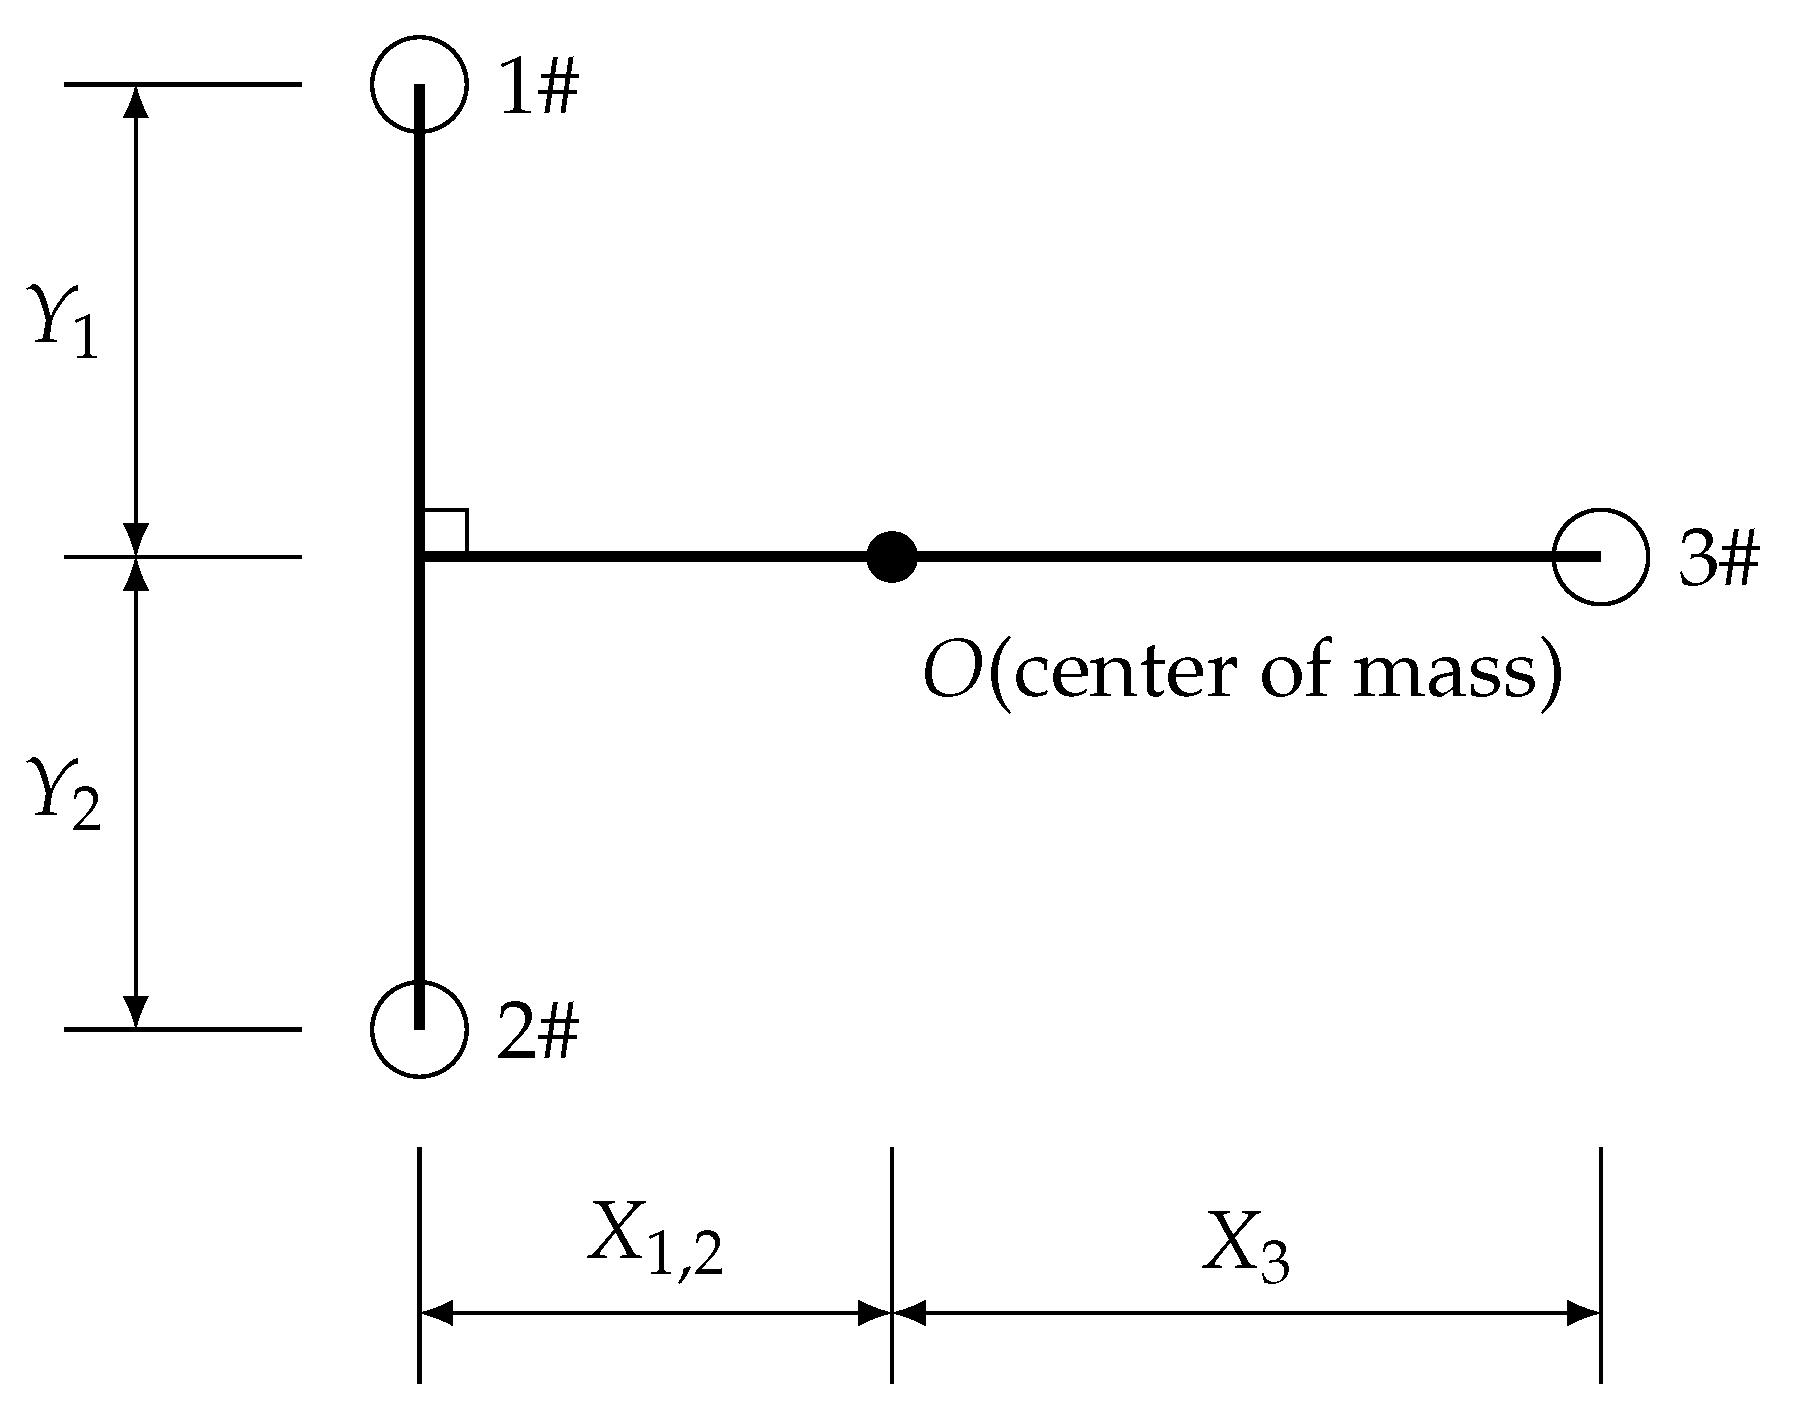
Figure 9.
Illustration of the offset weights to present the nonuniform weight distribution.
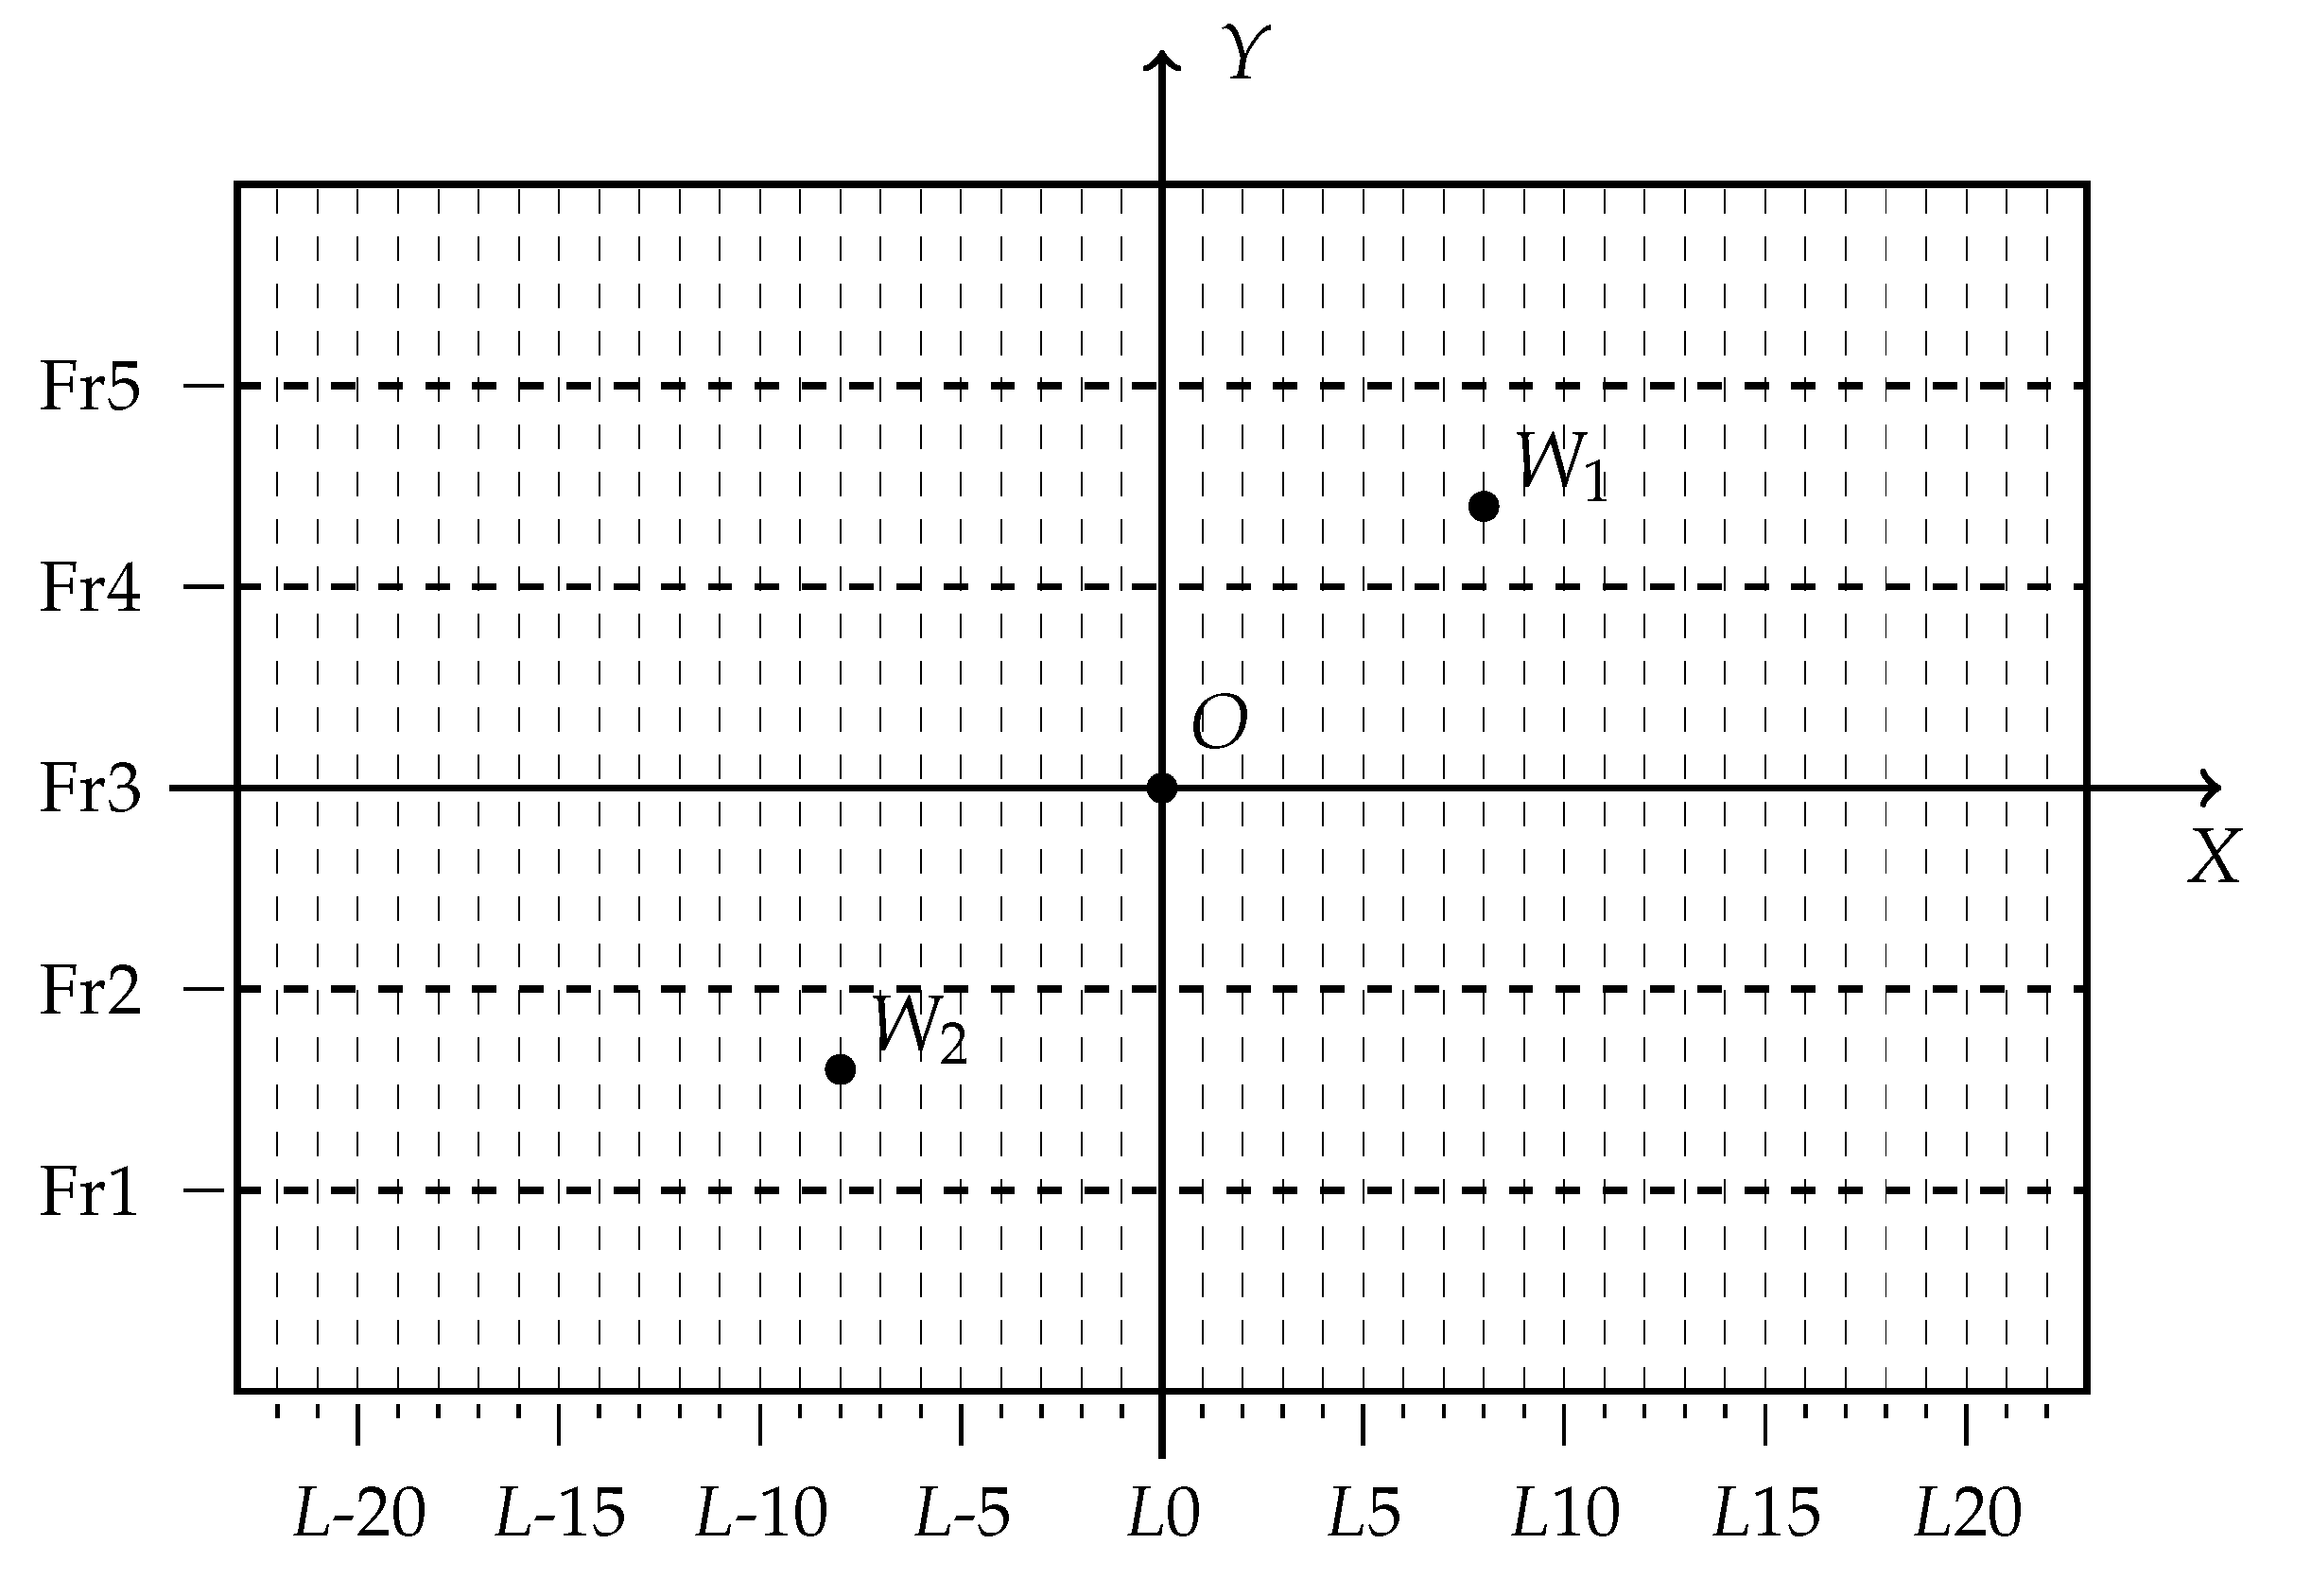
Figure 10.
U3 displacement of case 1 in linear and nonlinear finite element method analyses: (a) linear result and (b) nonlinear result.
Figure 10.
U3 displacement of case 1 in linear and nonlinear finite element method analyses: (a) linear result and (b) nonlinear result.
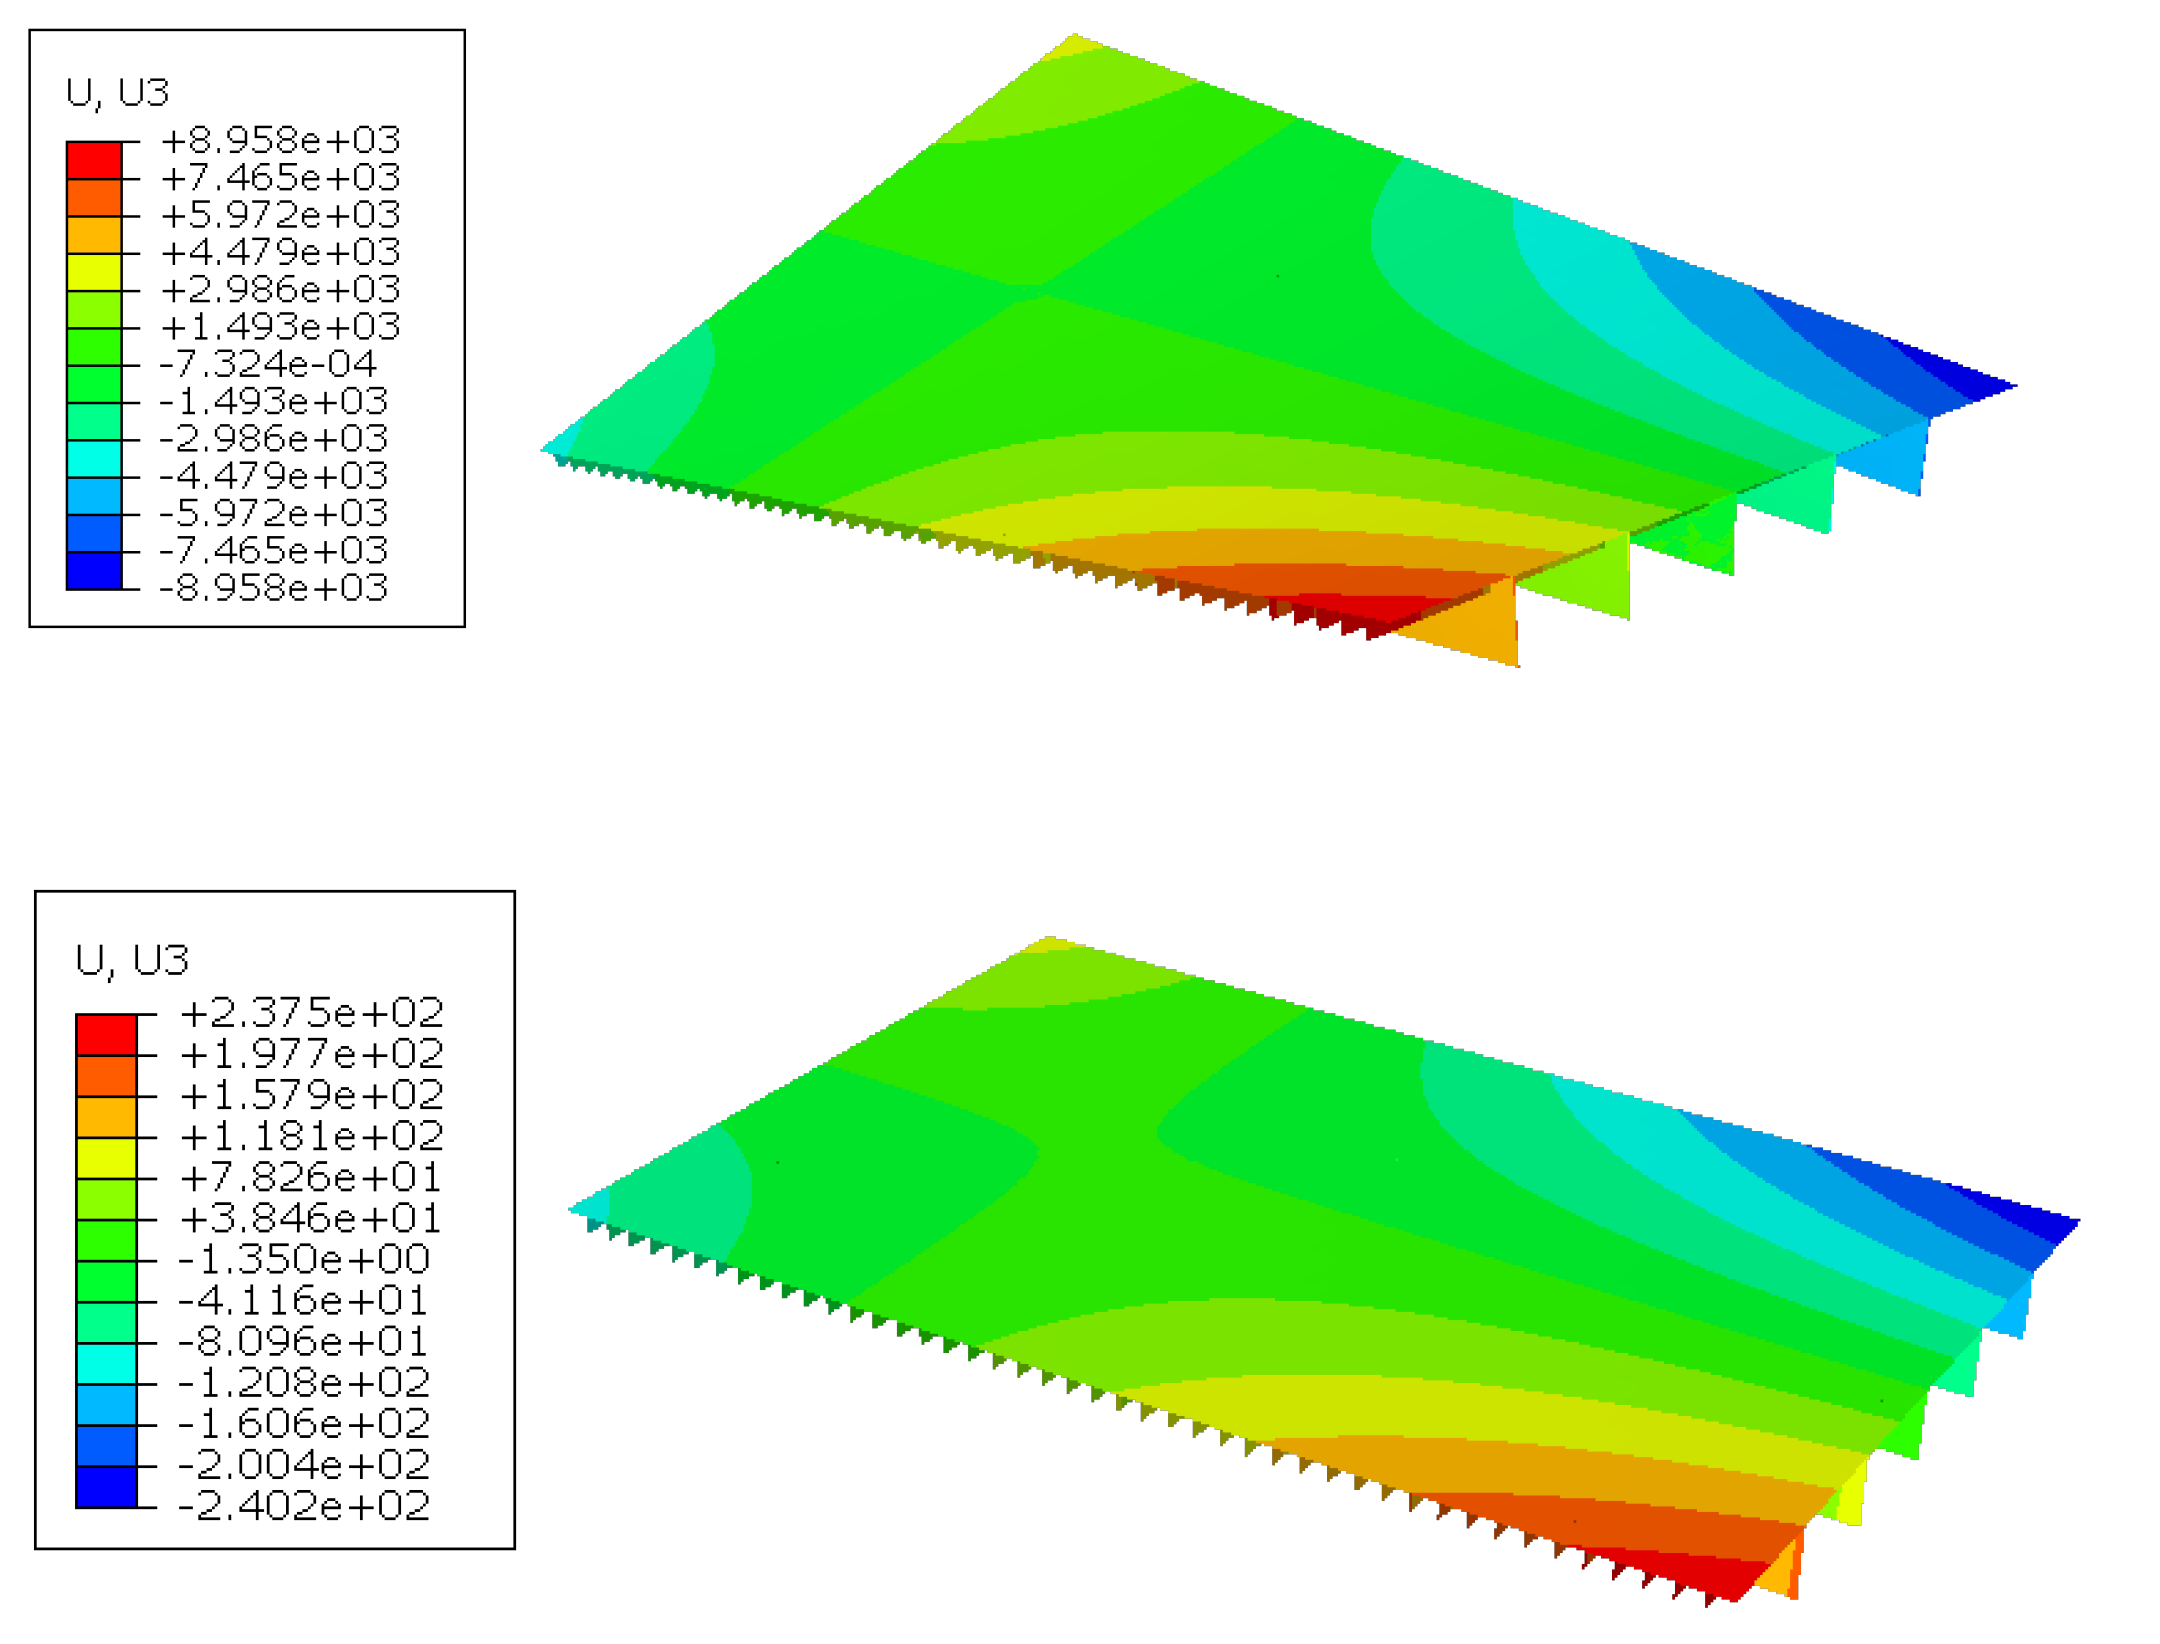
Figure 11.
U magnitude for case 1 (case 2 is identical except the numbers) and constraints of the segment lifting model.
Figure 11.
U magnitude for case 1 (case 2 is identical except the numbers) and constraints of the segment lifting model.
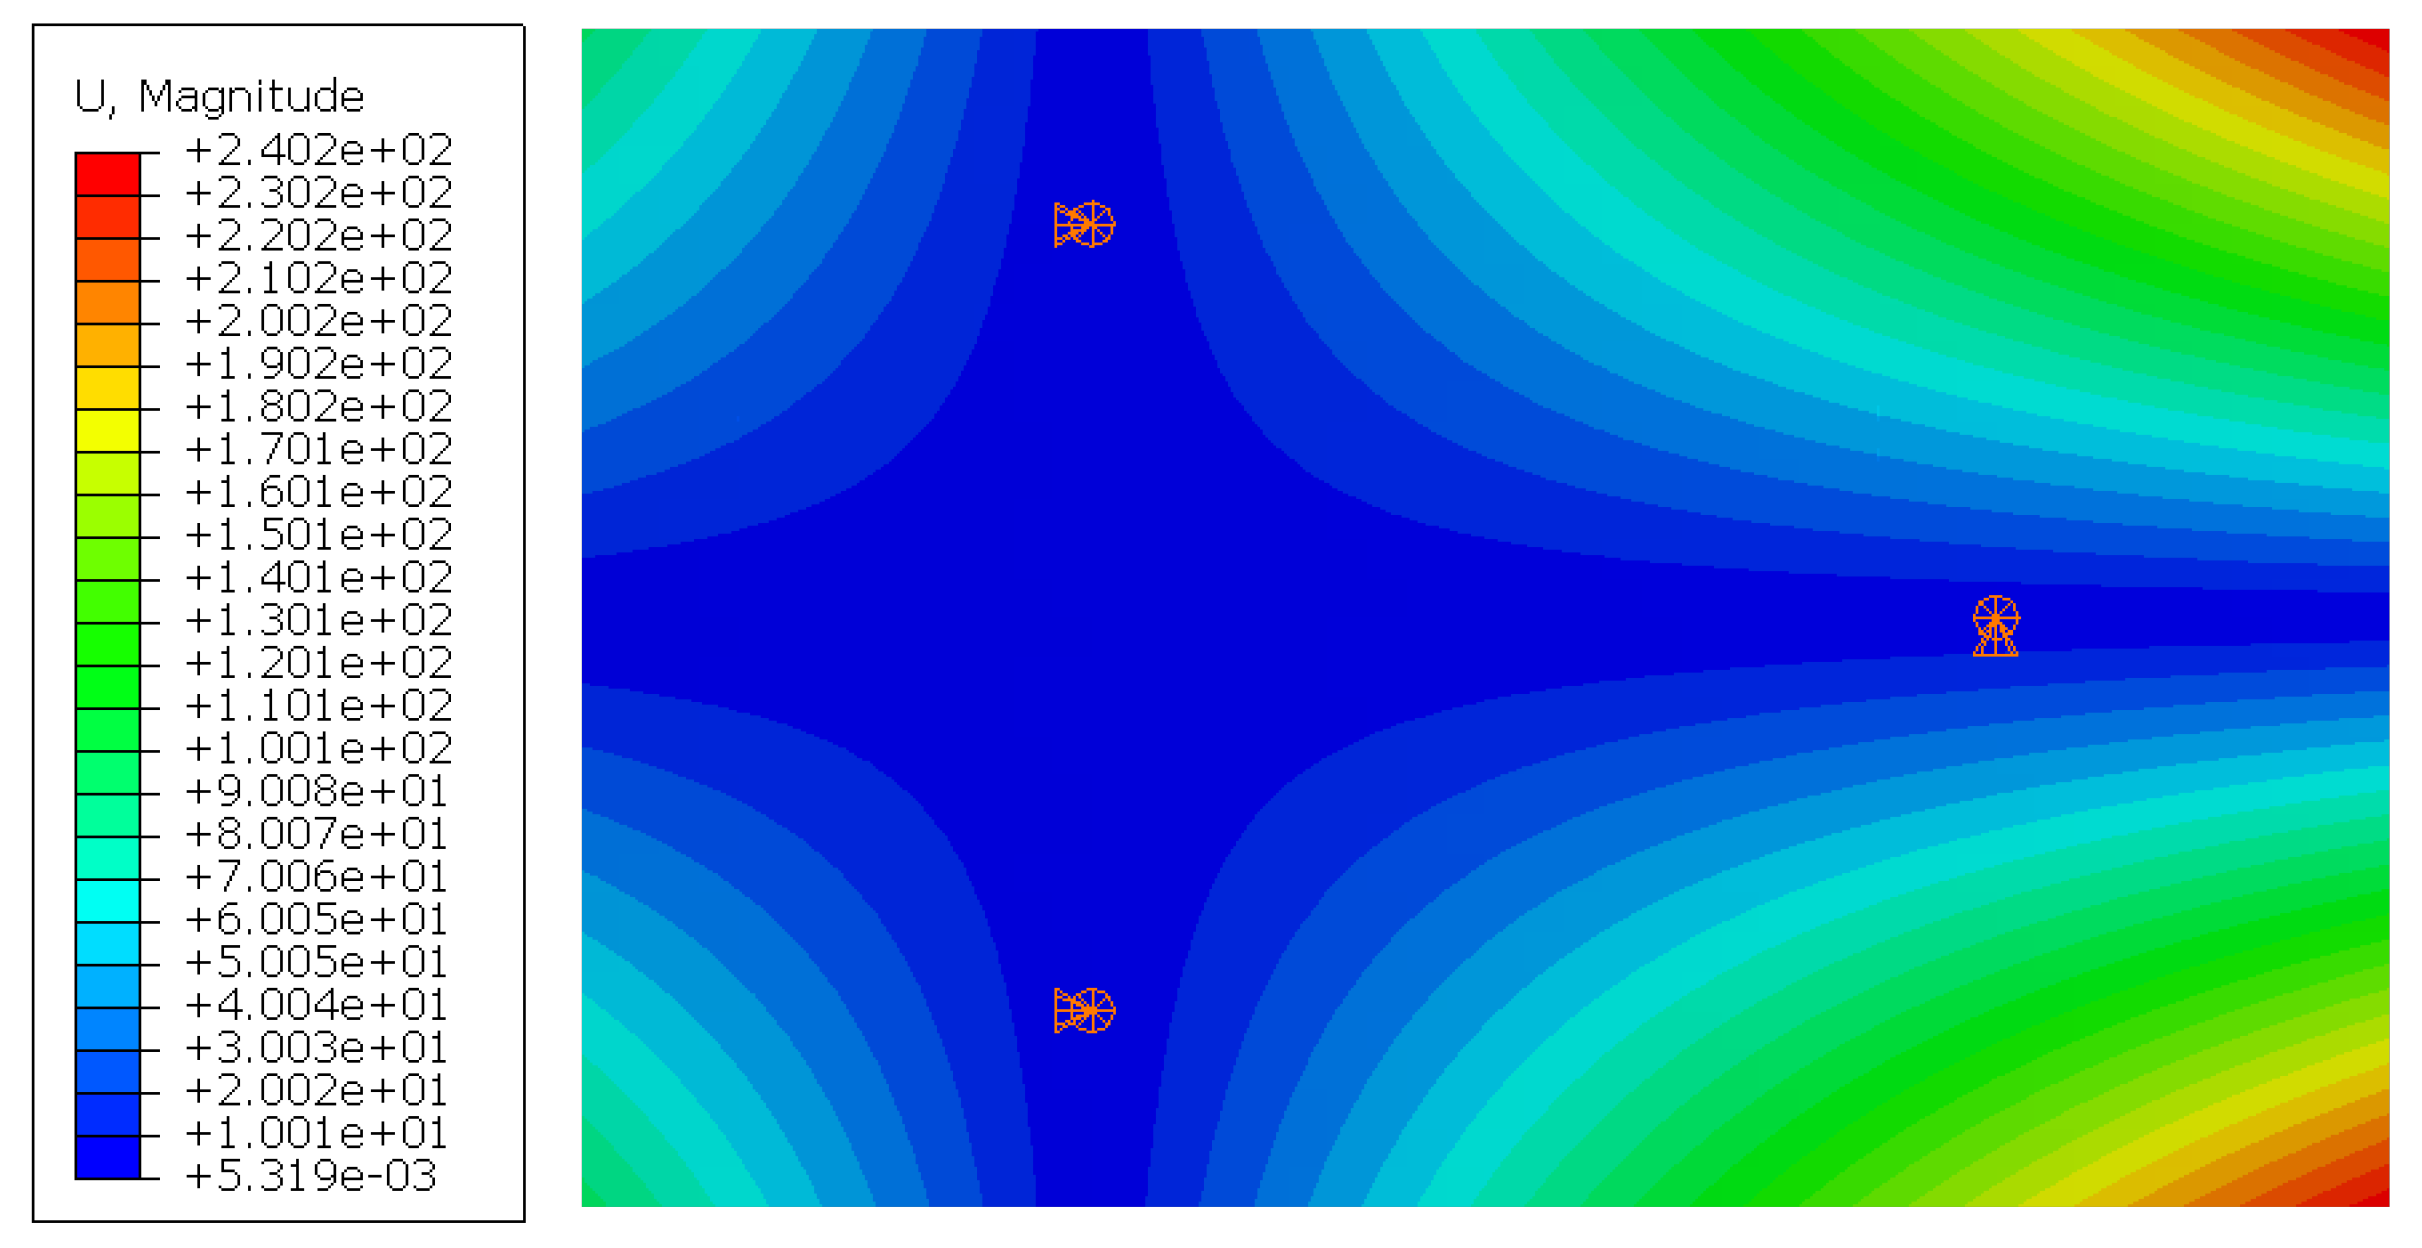
Figure 12.
Torsional deformations and the growth rates of case 1 and case 2: (a) results of nonlinear finite element method computations and (b) results of linear finite element method computations.
Figure 12.
Torsional deformations and the growth rates of case 1 and case 2: (a) results of nonlinear finite element method computations and (b) results of linear finite element method computations.
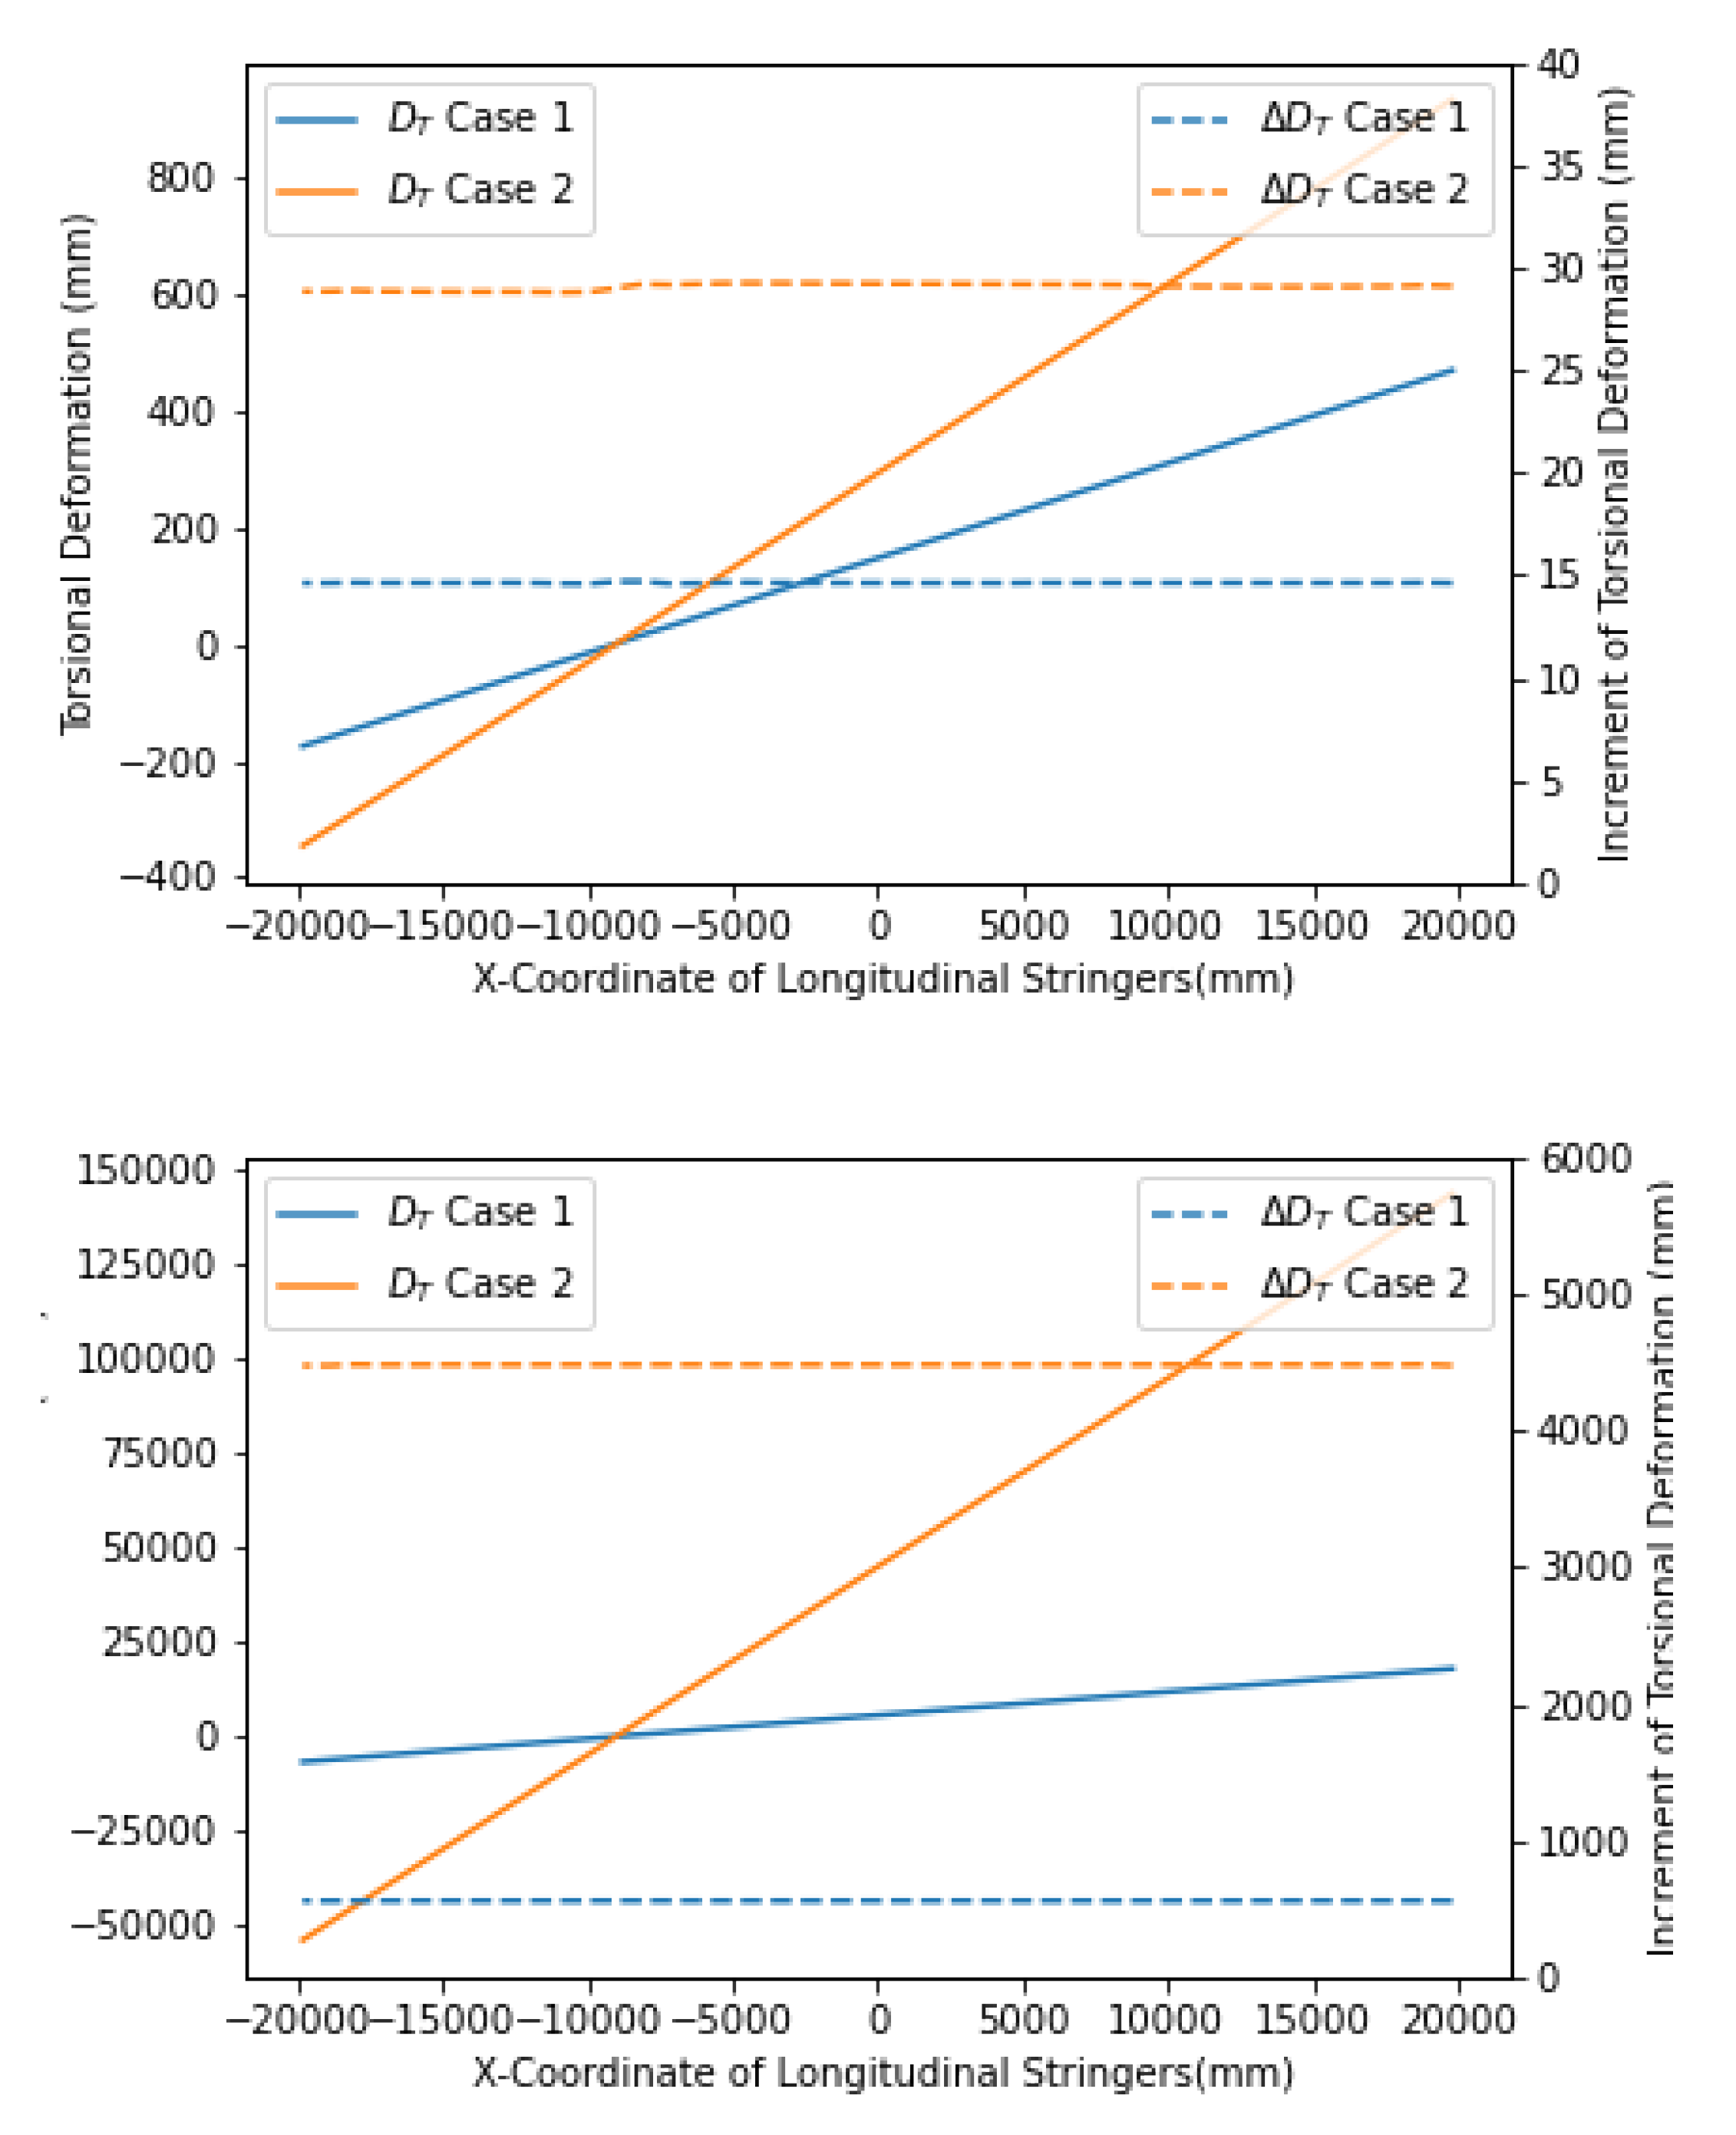
Figure 13.
Von Mises stress distributions in the main deck: (a) linear results, (b) nonlinear results.
Figure 13.
Von Mises stress distributions in the main deck: (a) linear results, (b) nonlinear results.
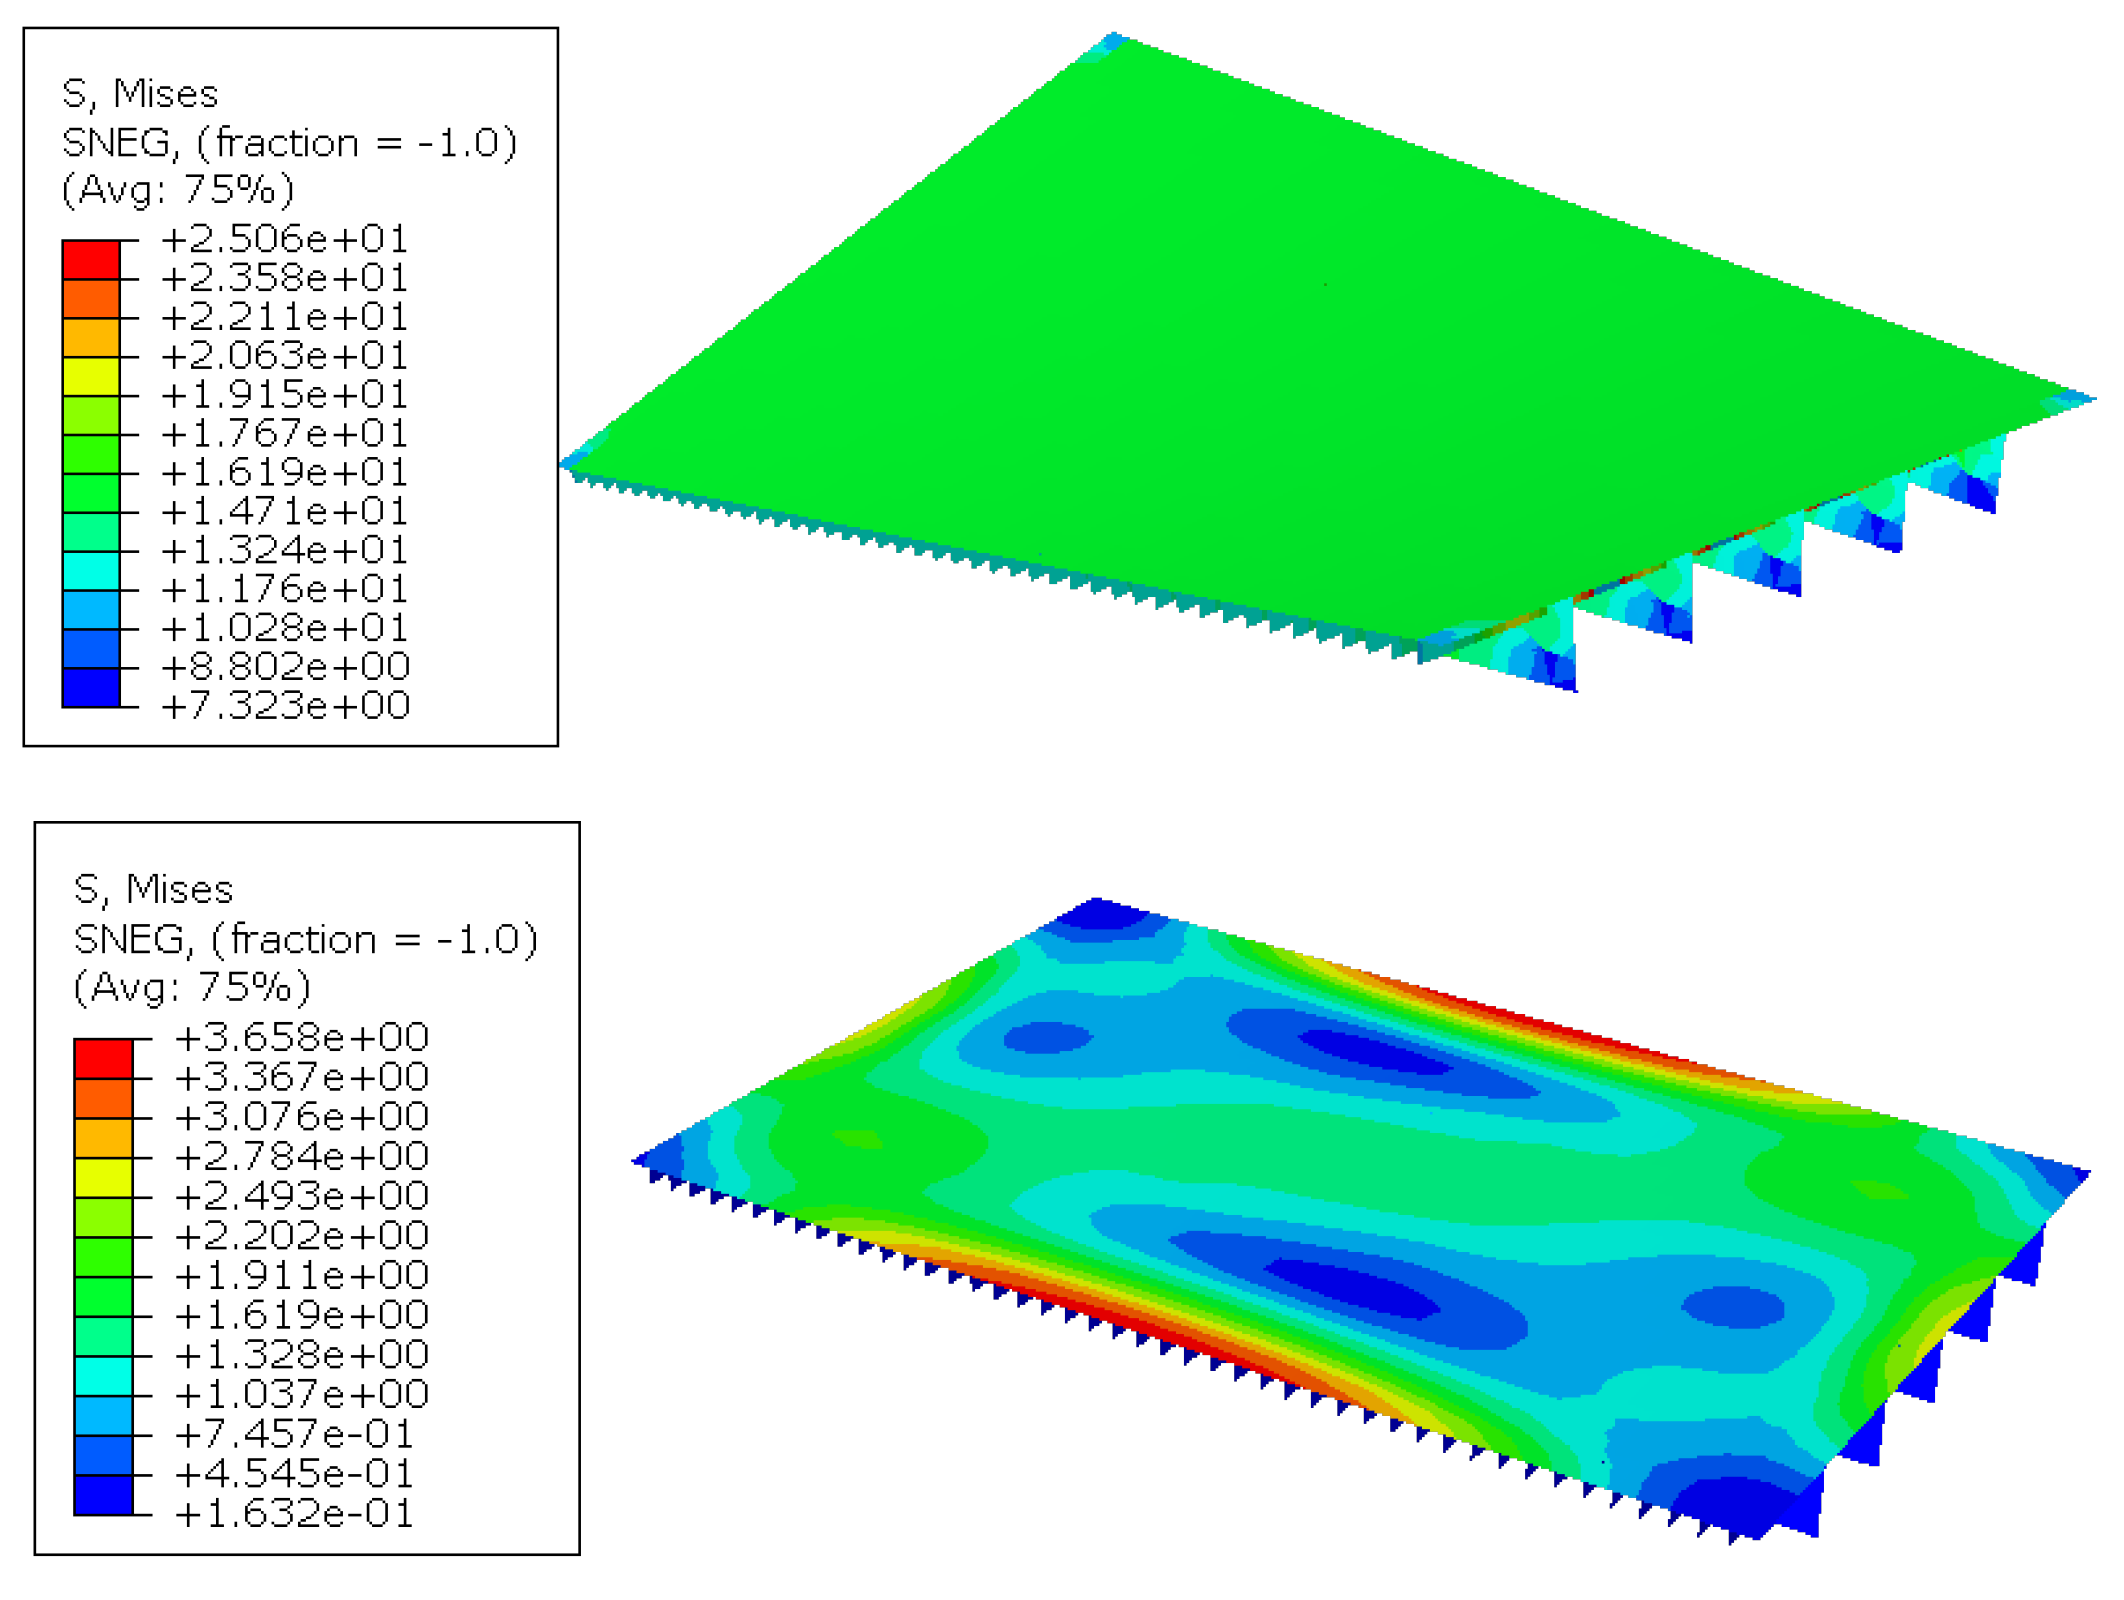
Figure 14.
Stress components in the main deck: (a) S11 (X-direction stress), (b) S22 (Y-direction stress), and (c) S12 (X-Y shear stress).
Figure 14.
Stress components in the main deck: (a) S11 (X-direction stress), (b) S22 (Y-direction stress), and (c) S12 (X-Y shear stress).
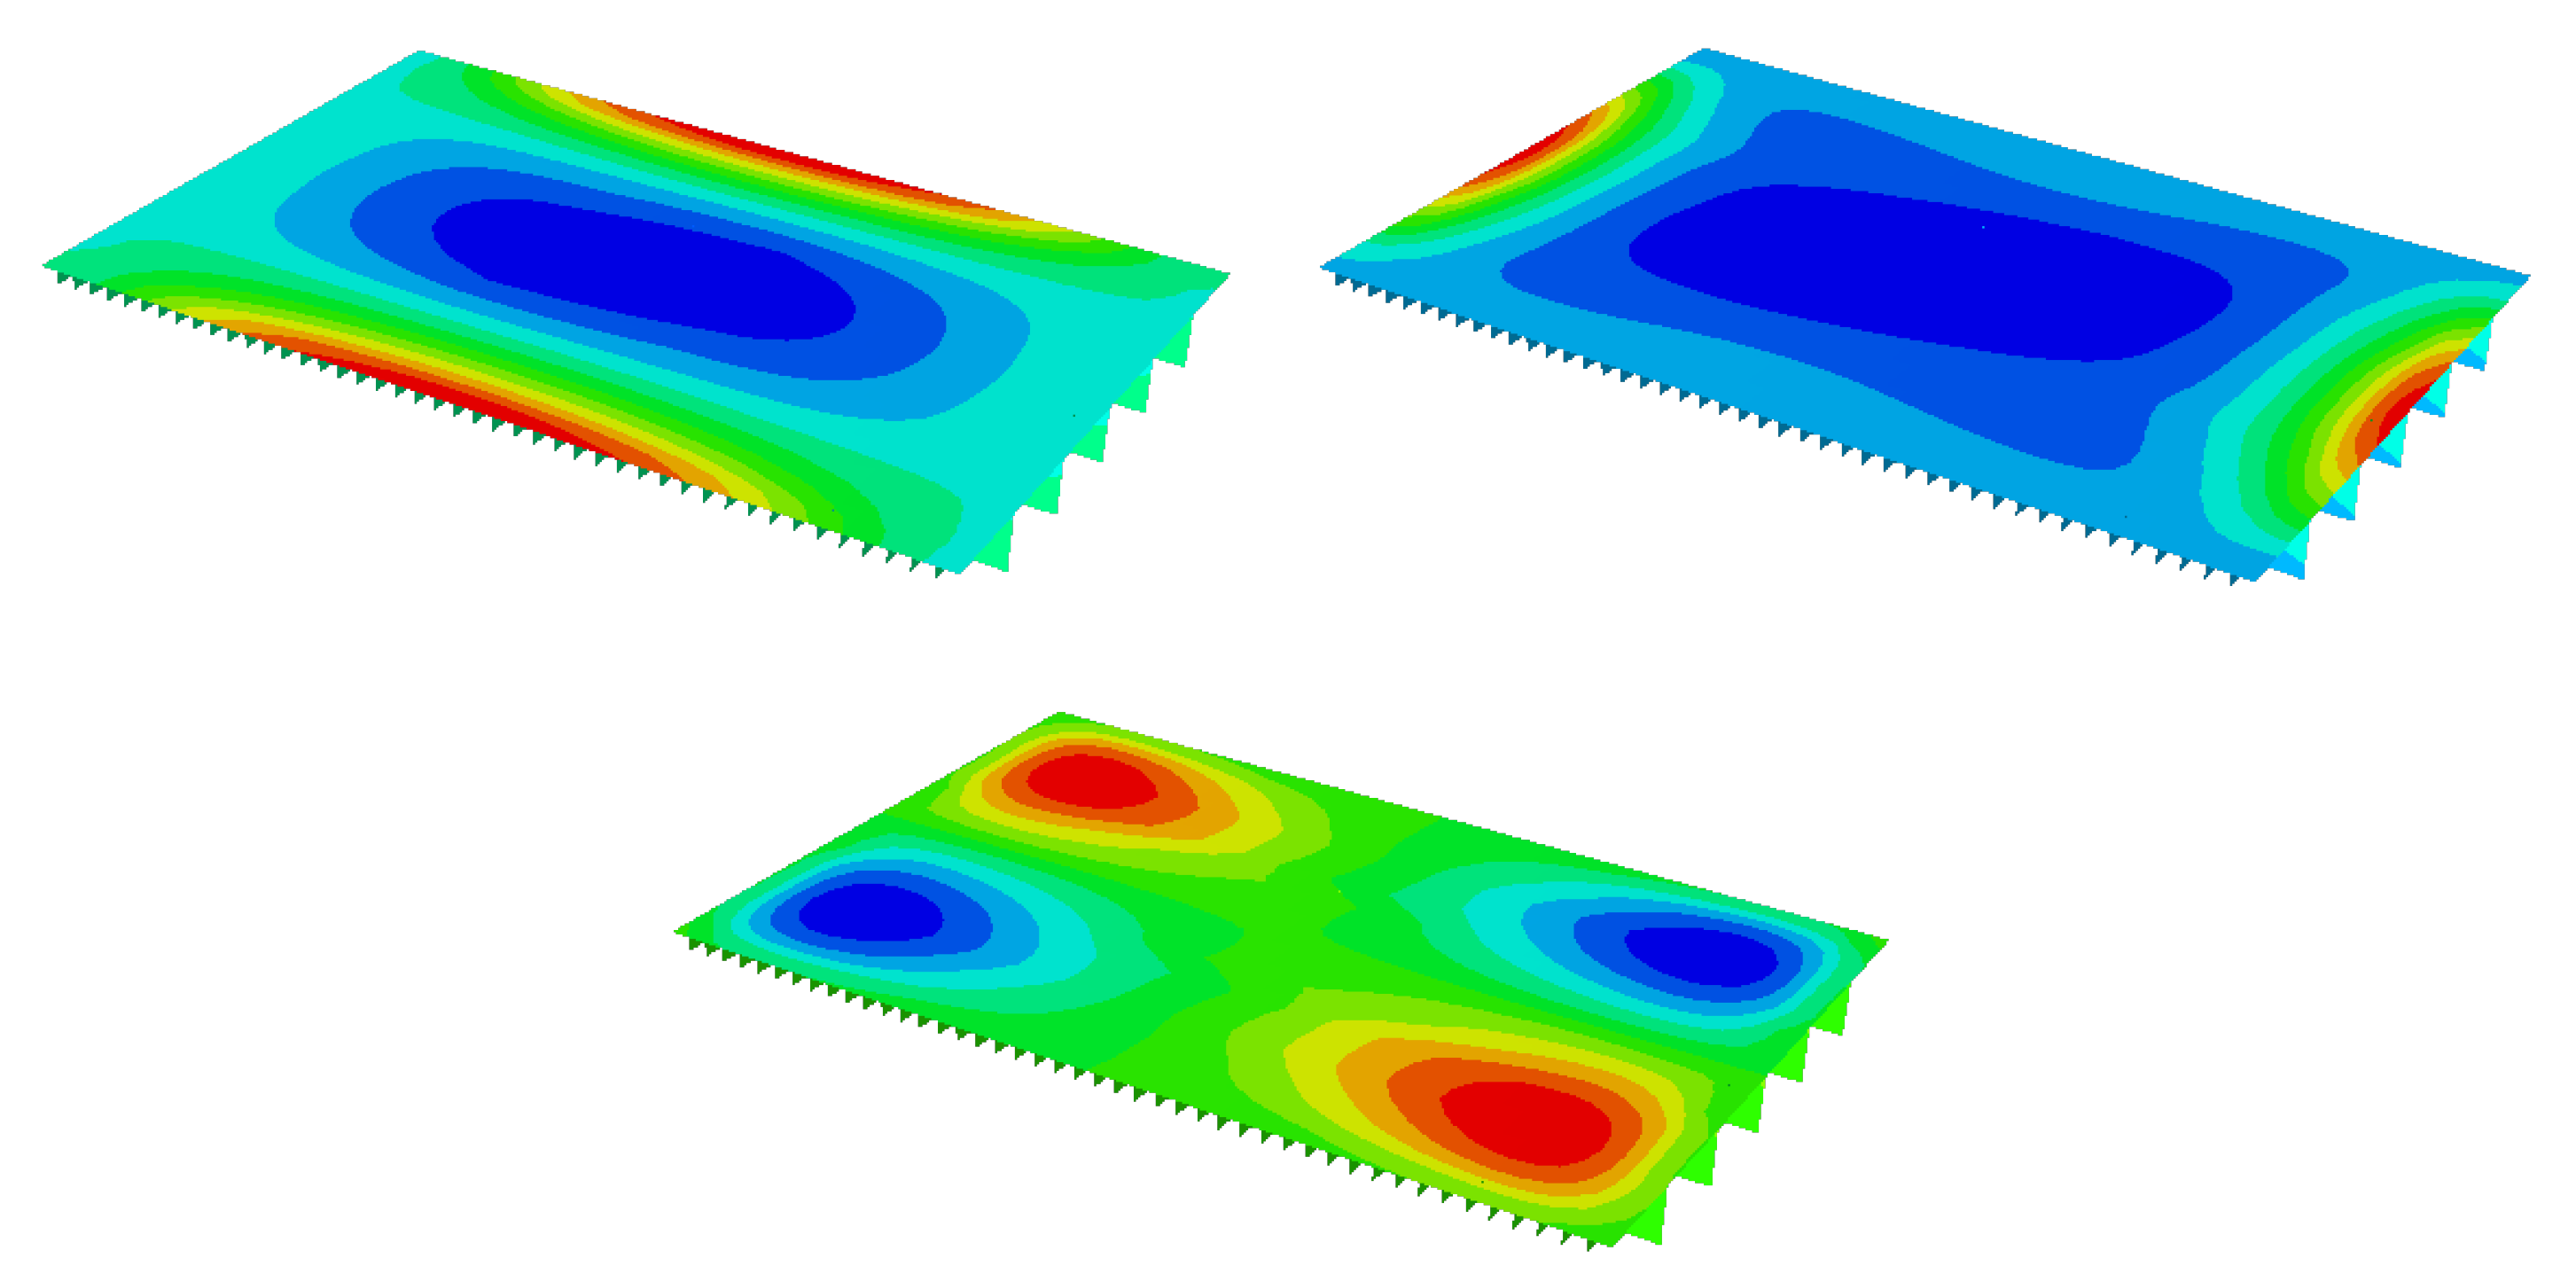
Figure 15.
Linear stress distribution in structural frame.
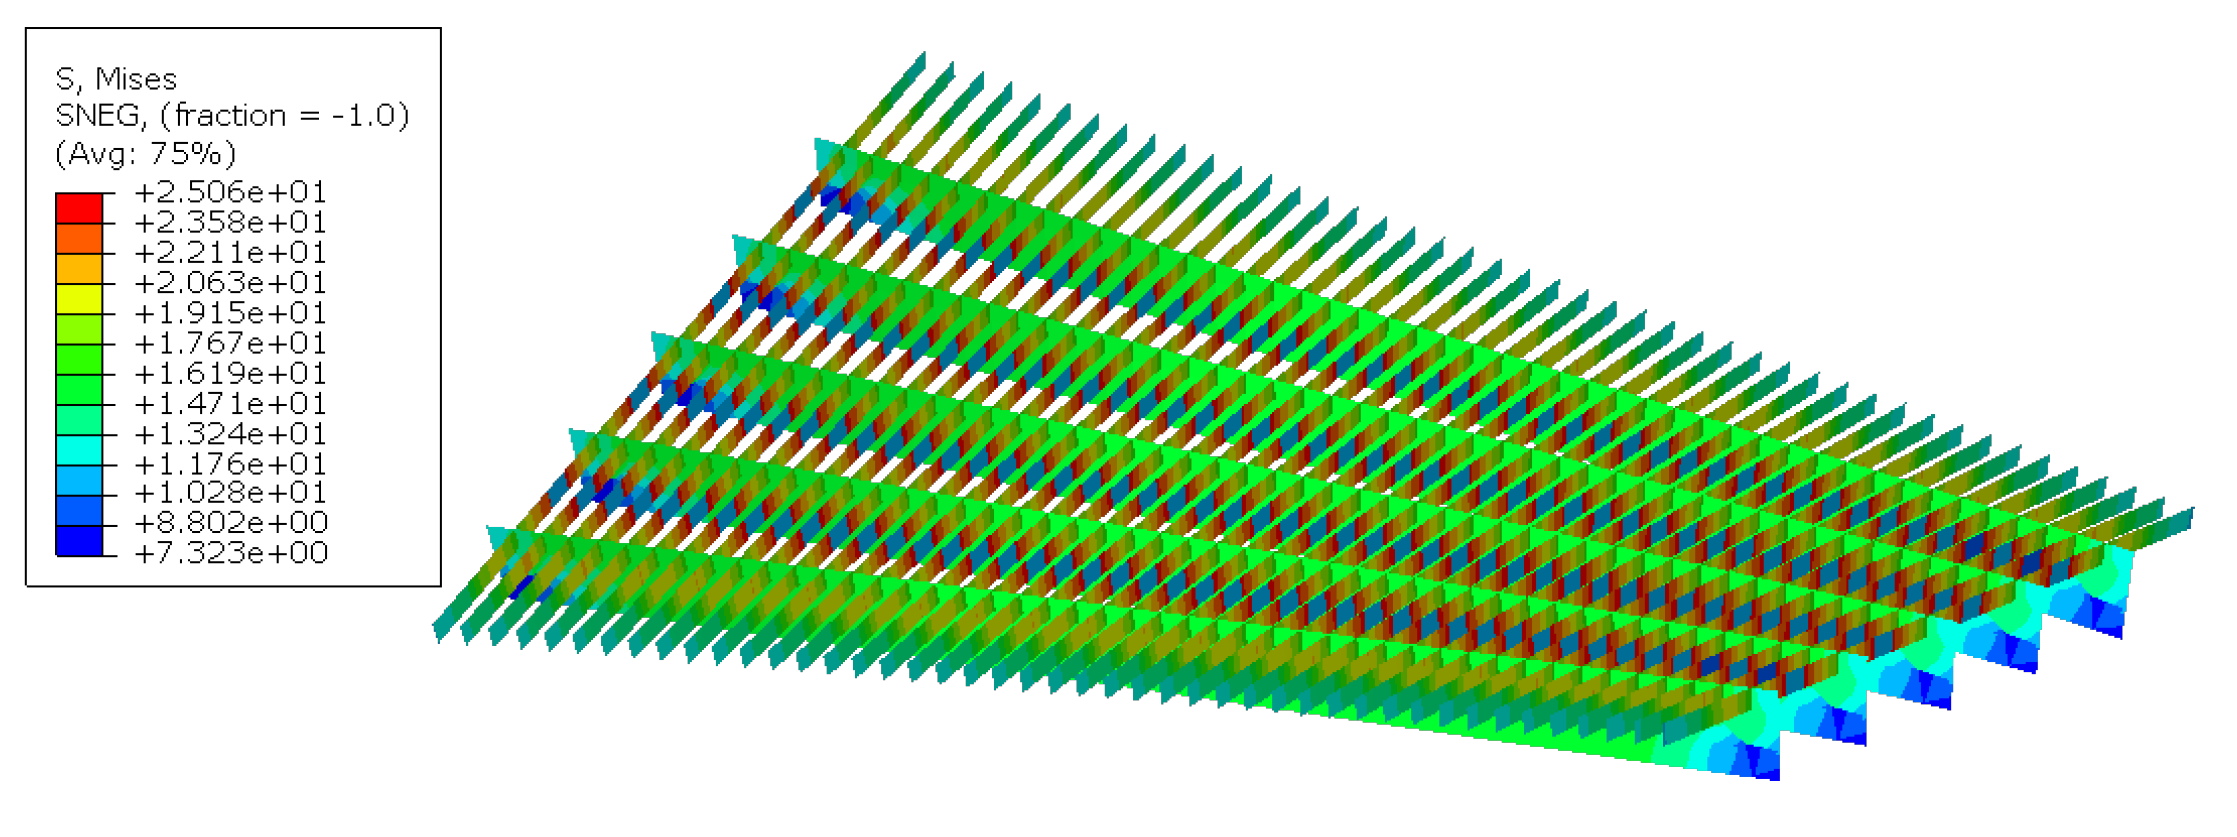
Figure 16.
Nonlinear stress distribution in structural frame.
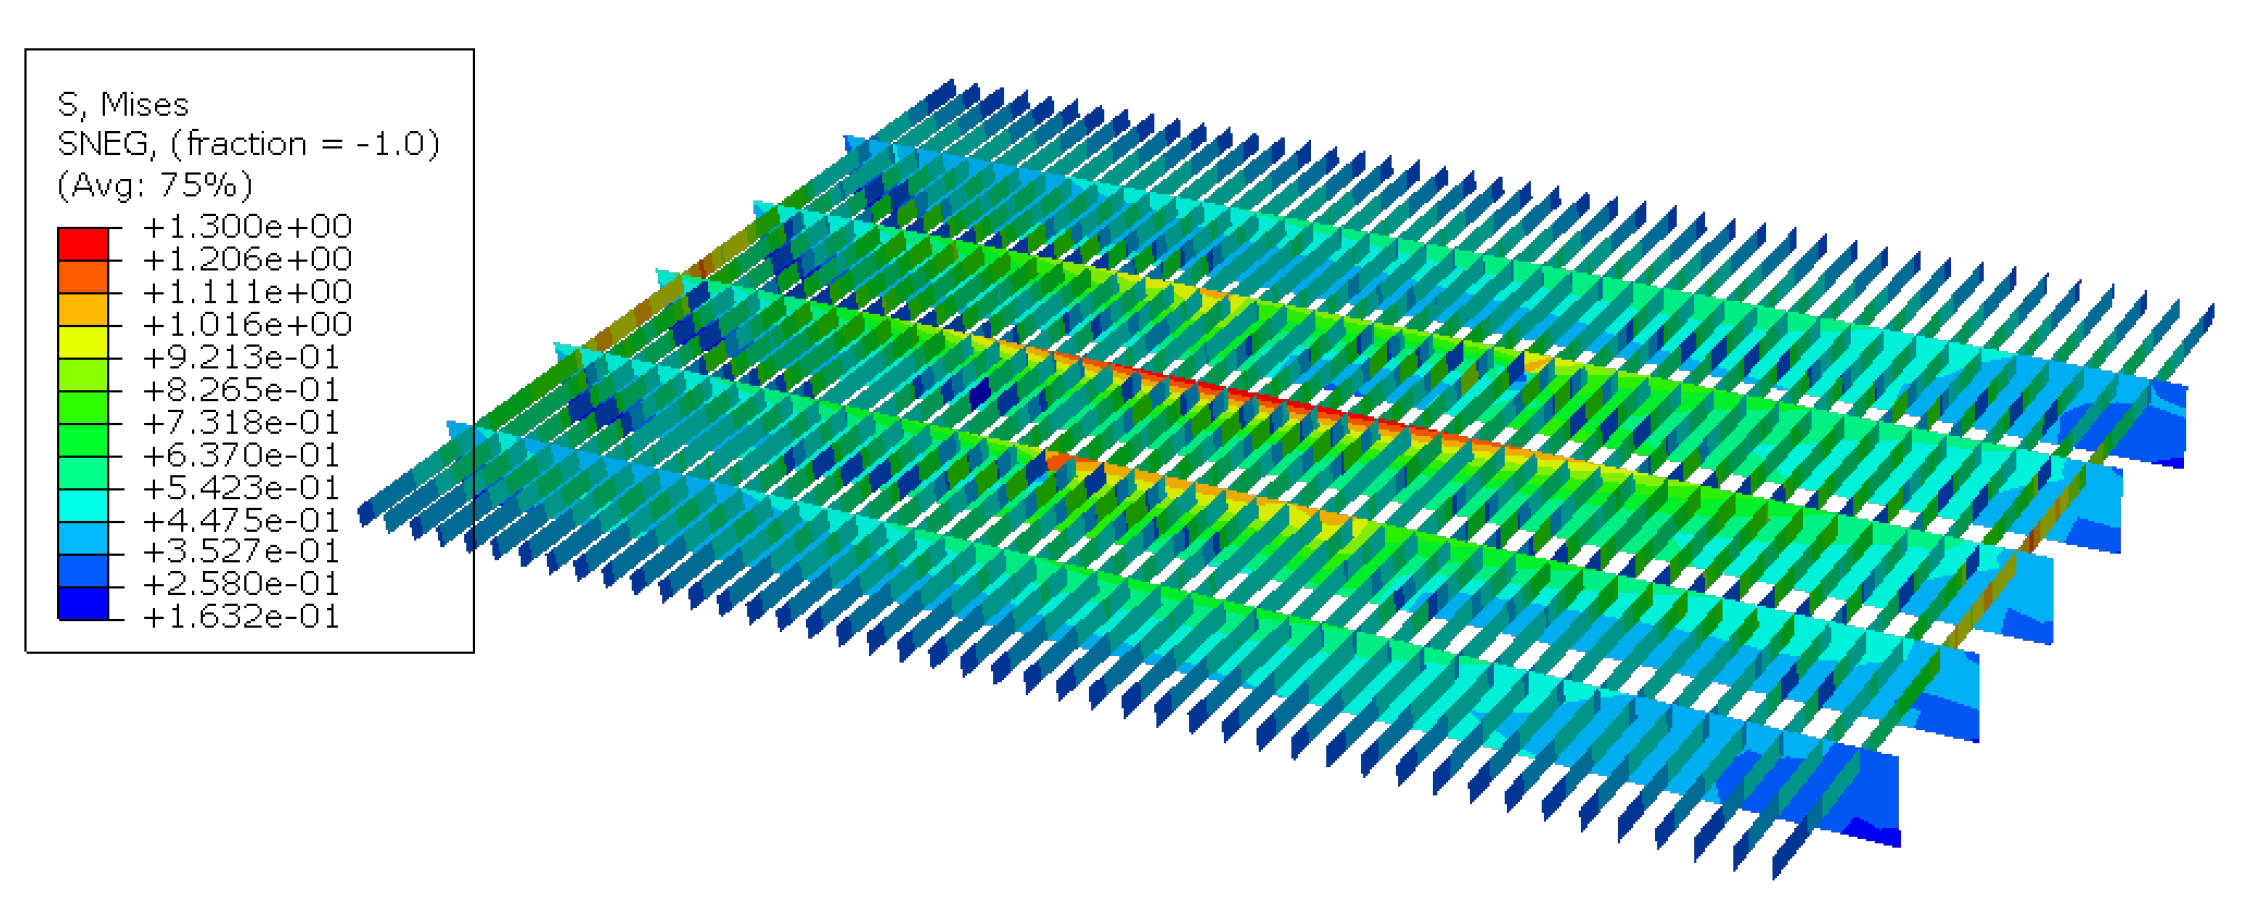
Figure 17.
Detailed linear stress contours of L5 longitudinal stringer.
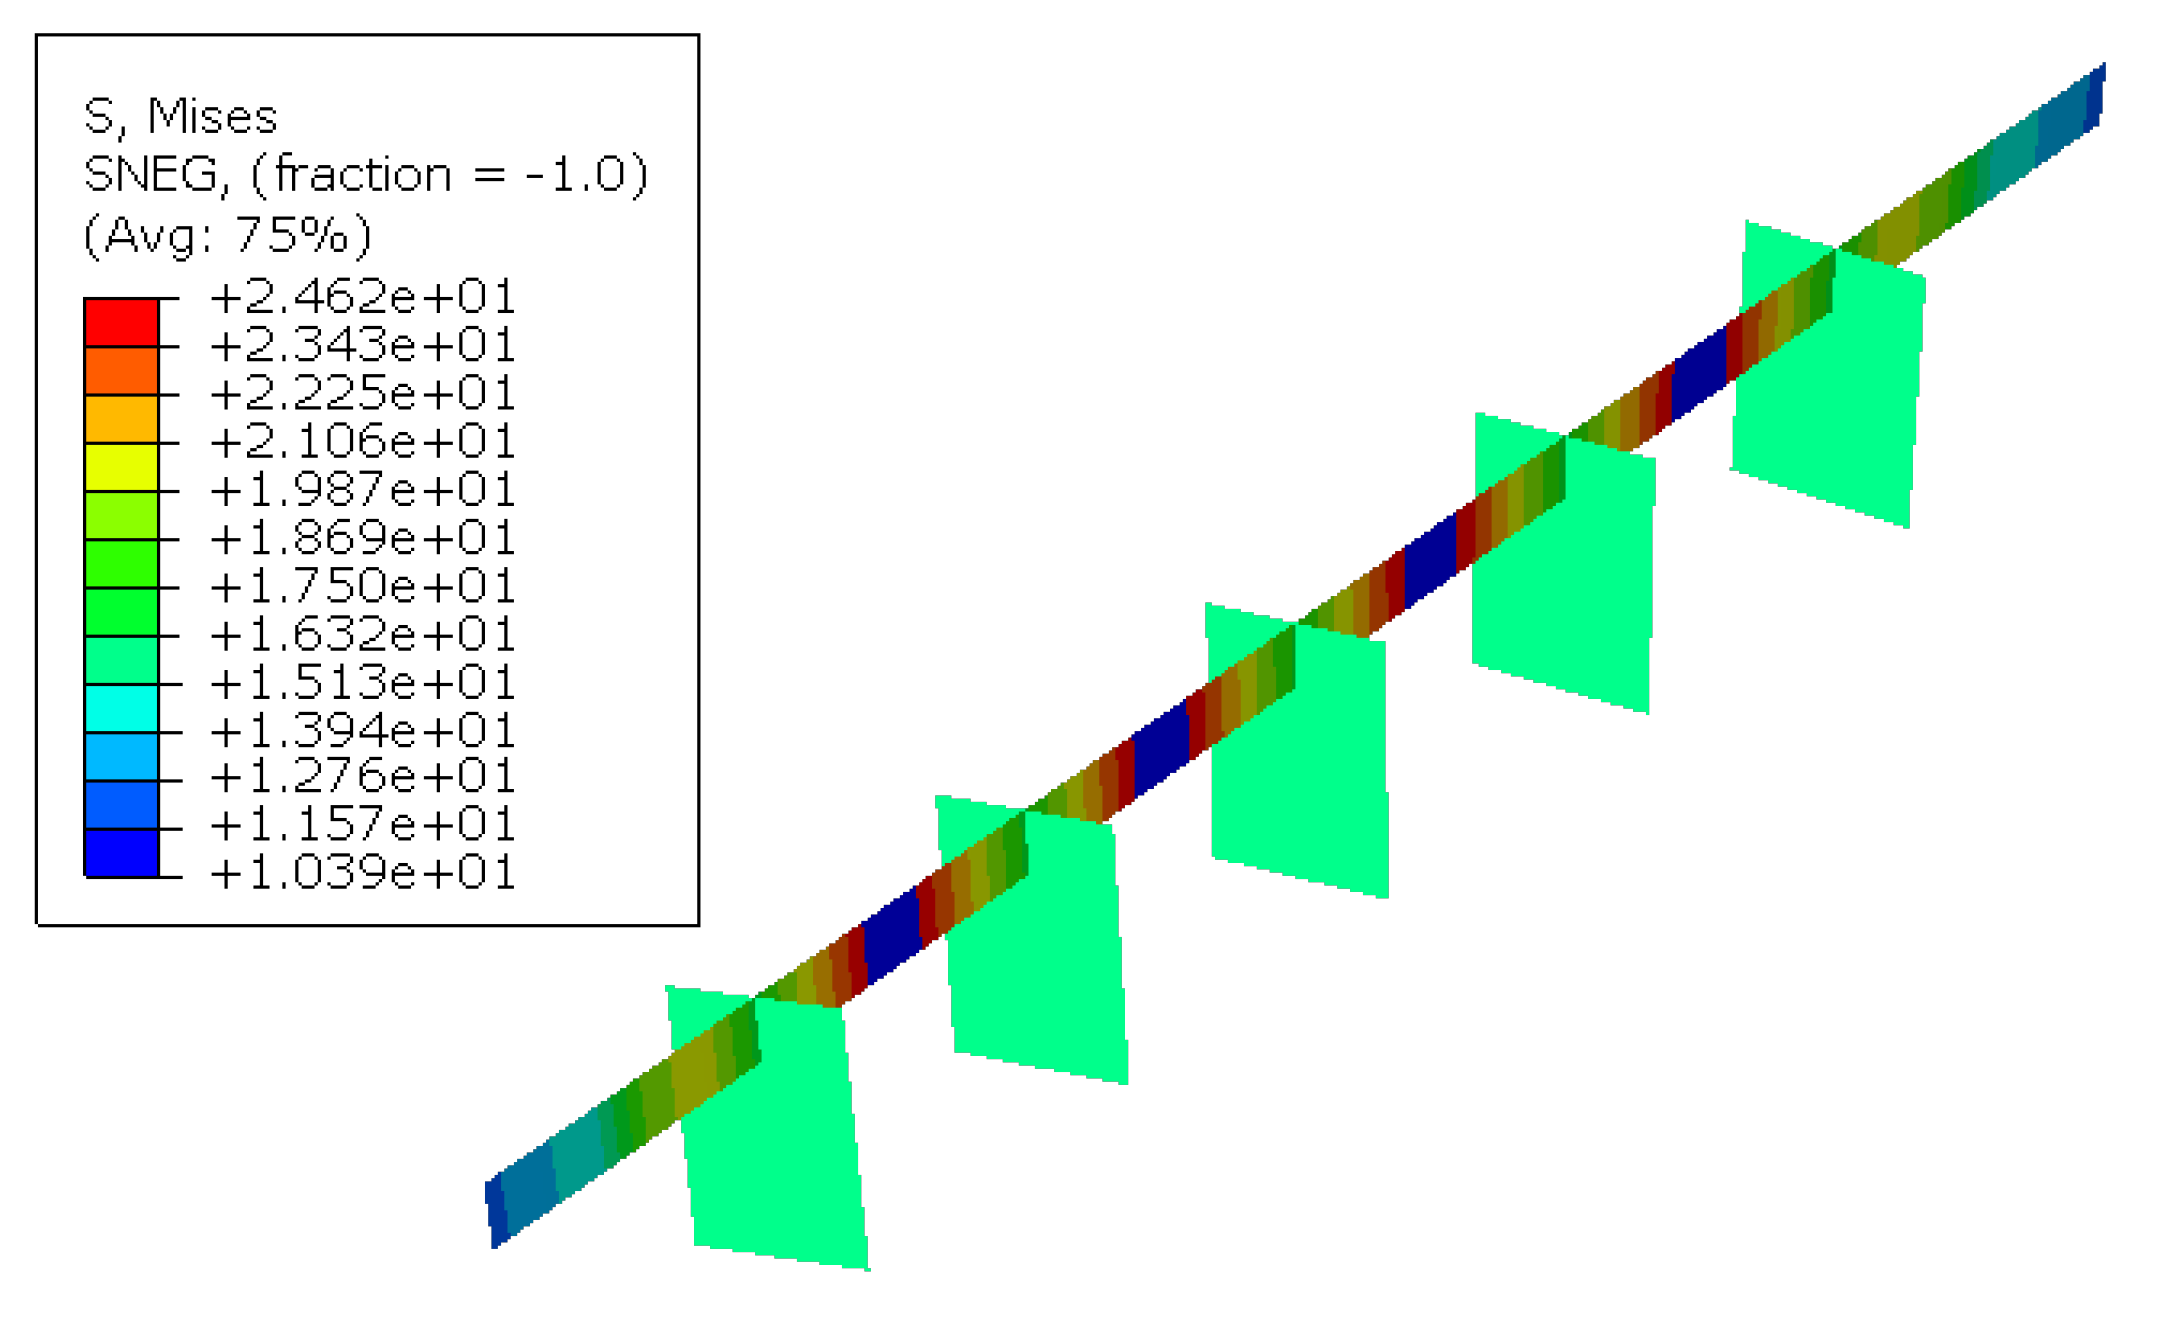
Figure 18.
Detailed nonlinear stress contours of L5 longitudinal stringer.
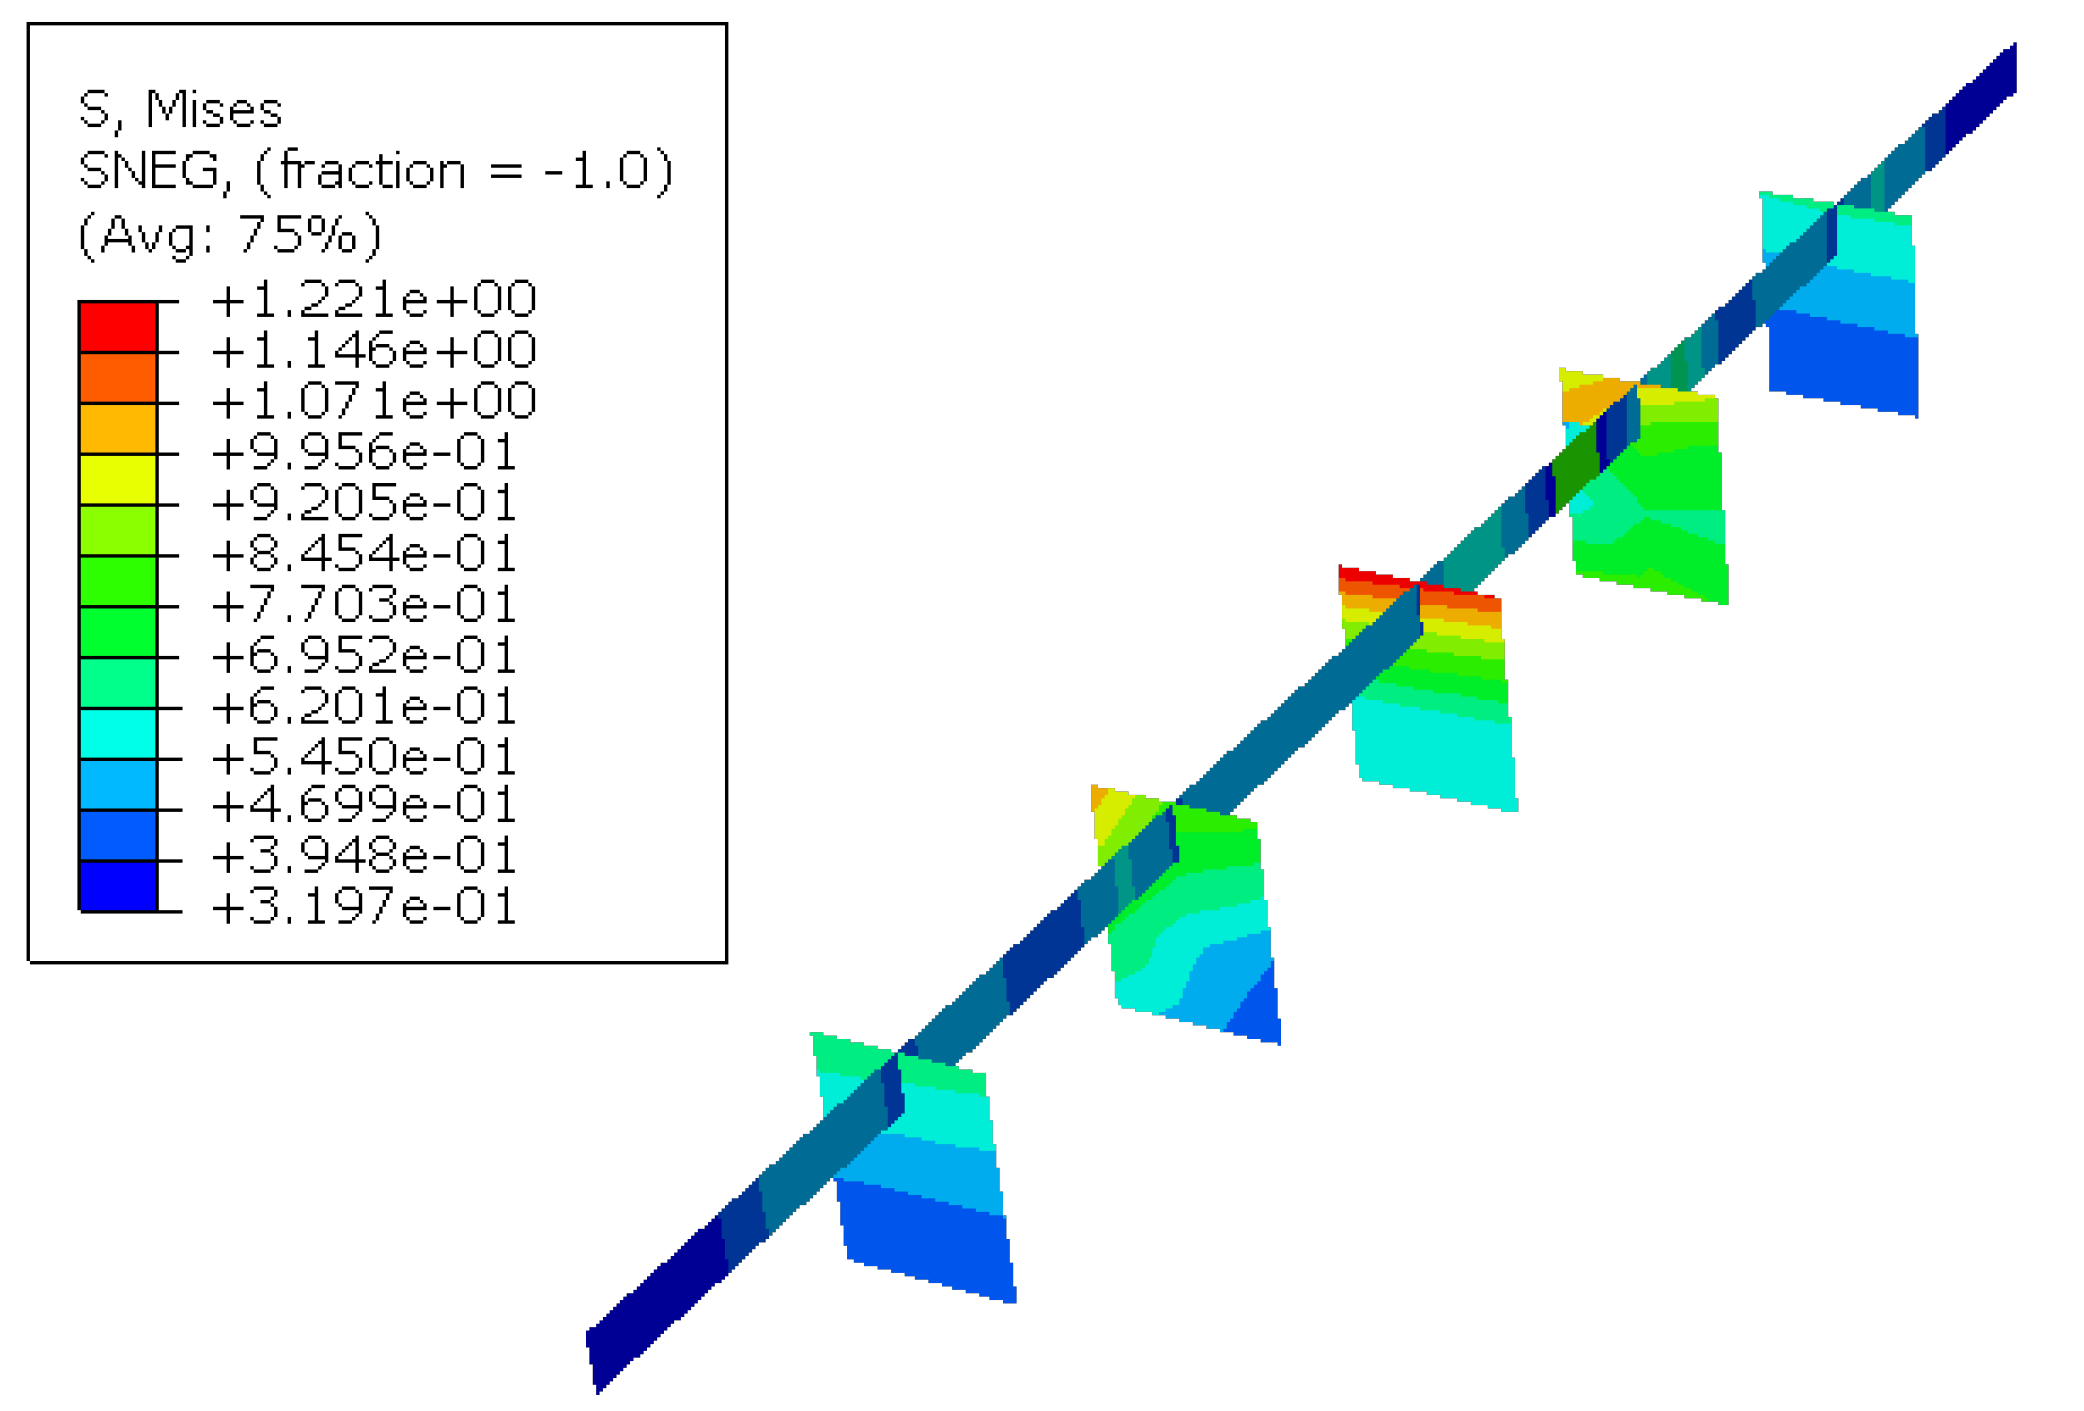
Figure 19.
Linear regressions of strain energy with generalized torsional deformation (nonlinear finite element analysis results): (a) , (b) , and (c) .
Figure 19.
Linear regressions of strain energy with generalized torsional deformation (nonlinear finite element analysis results): (a) , (b) , and (c) .
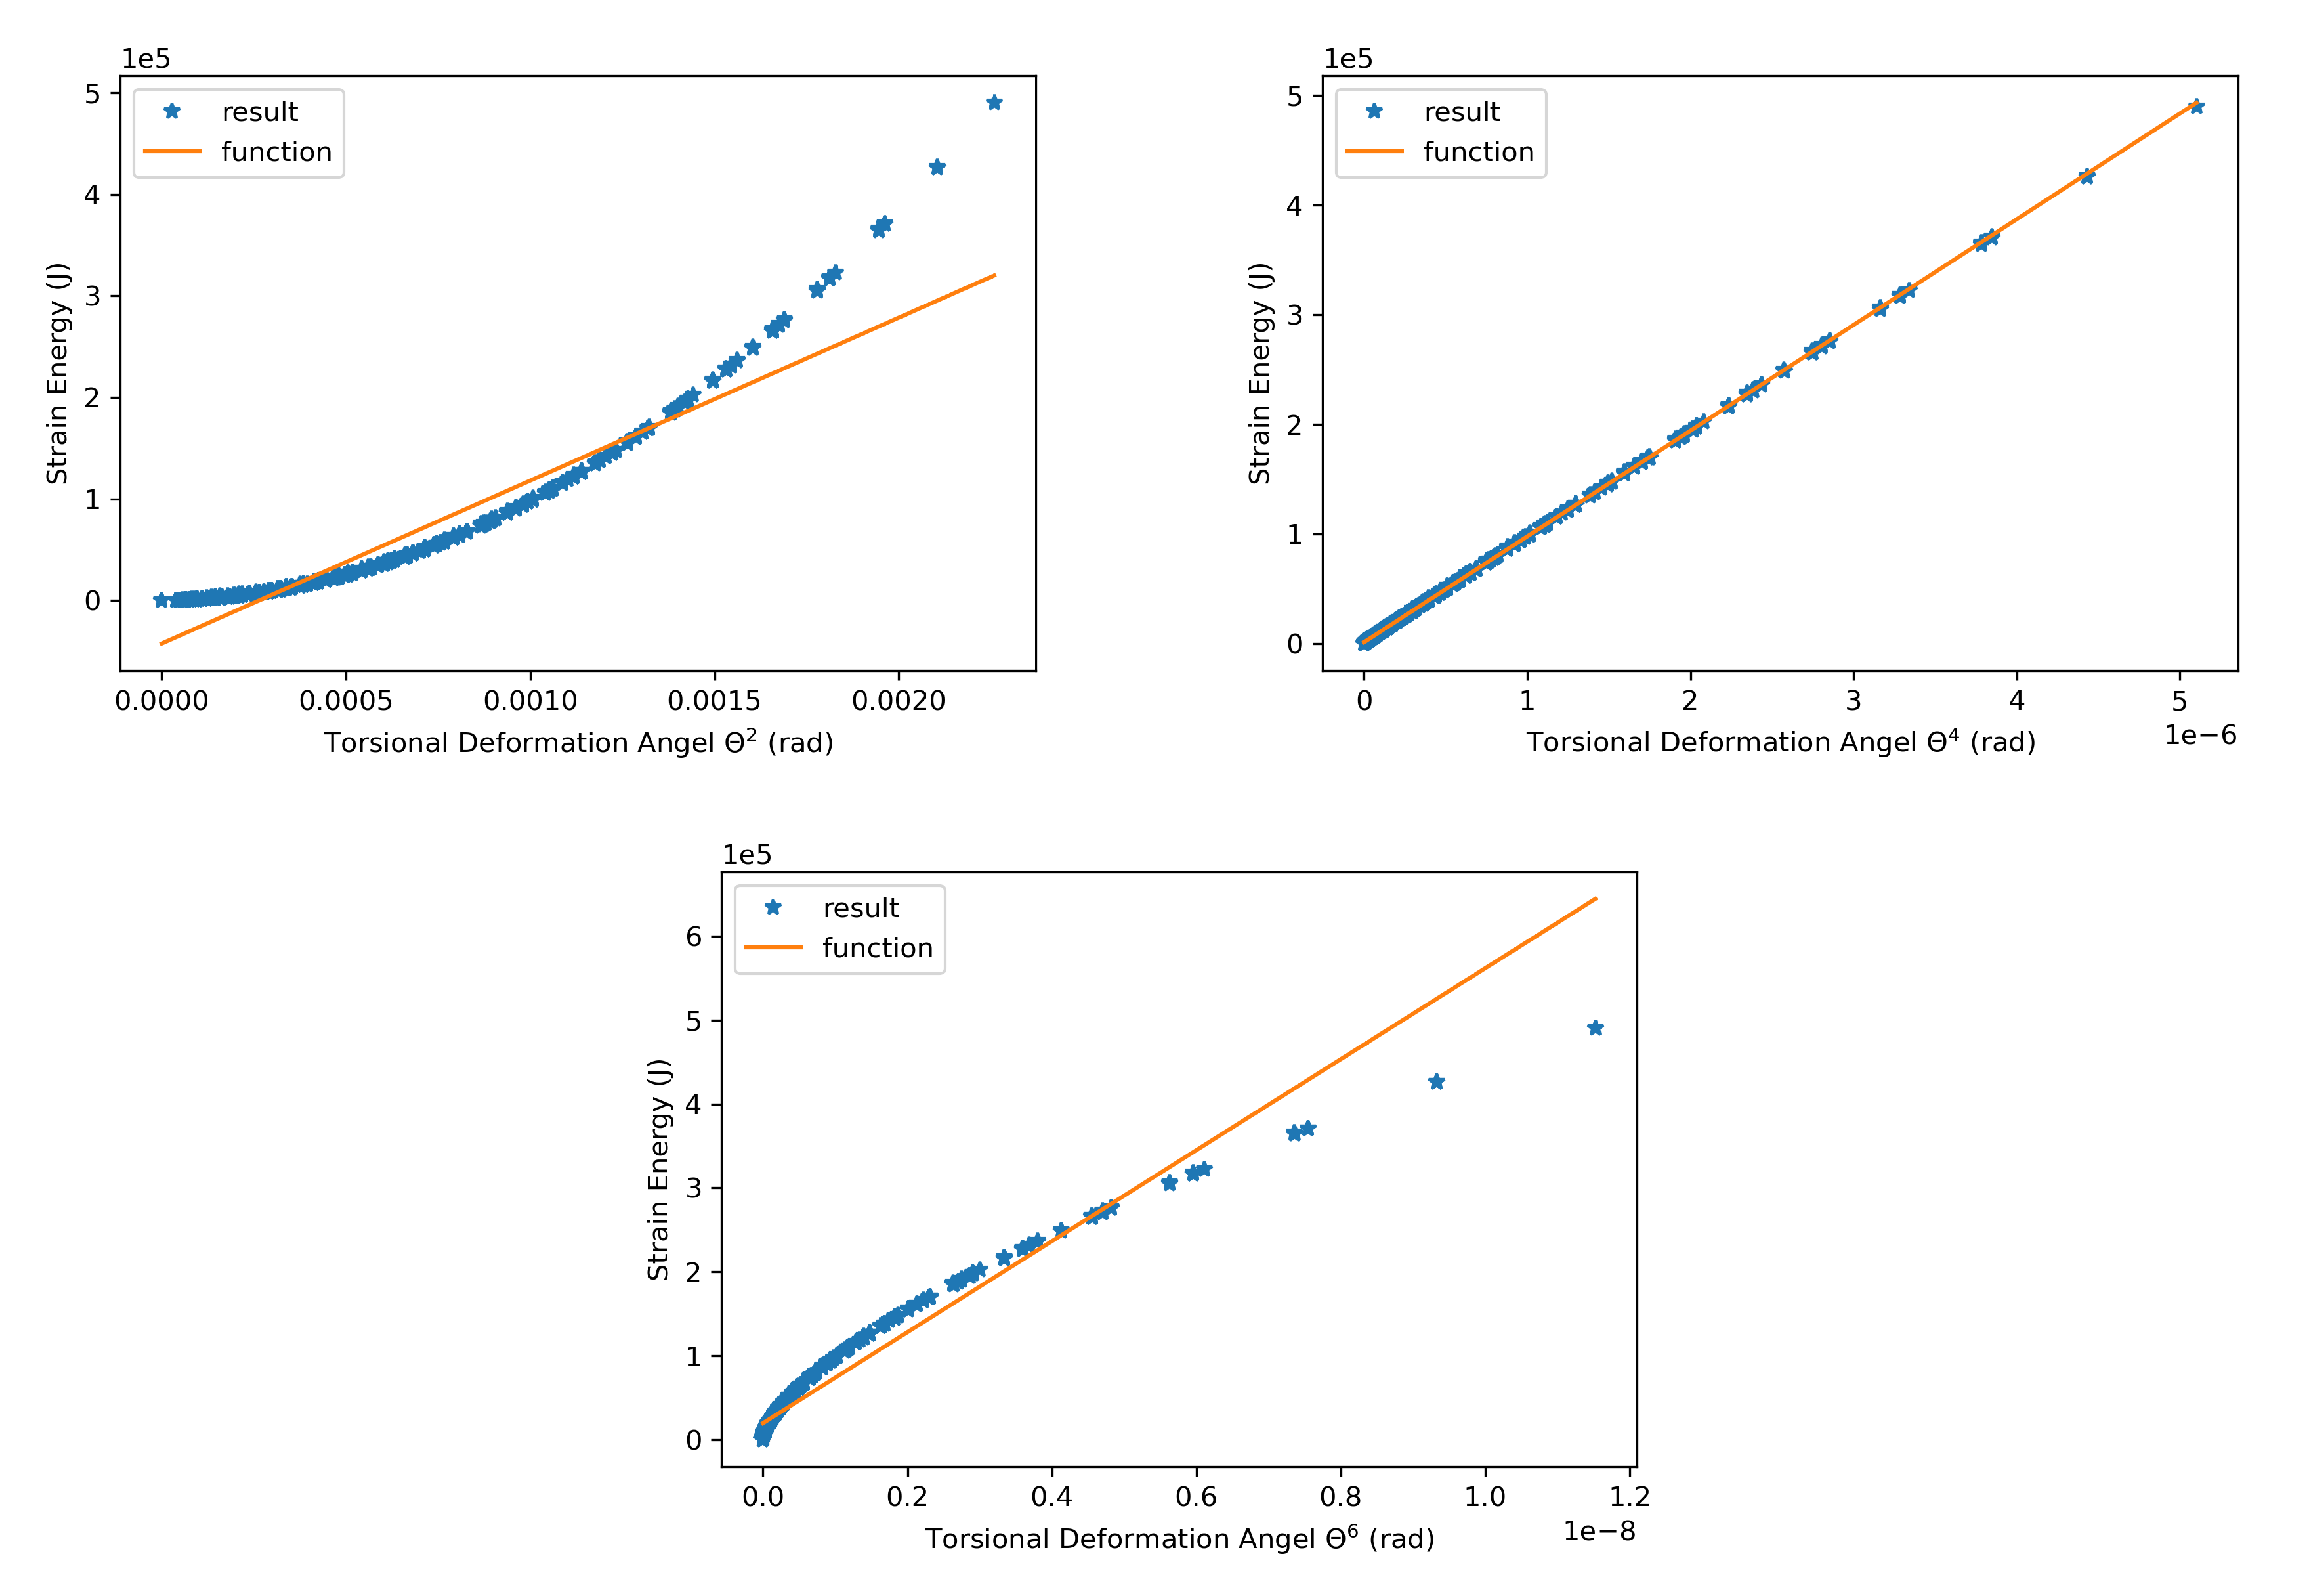
Figure 20.
Functional relation between the generalized torsional deformation and the offset weight parameters ().
Figure 20.
Functional relation between the generalized torsional deformation and the offset weight parameters ().
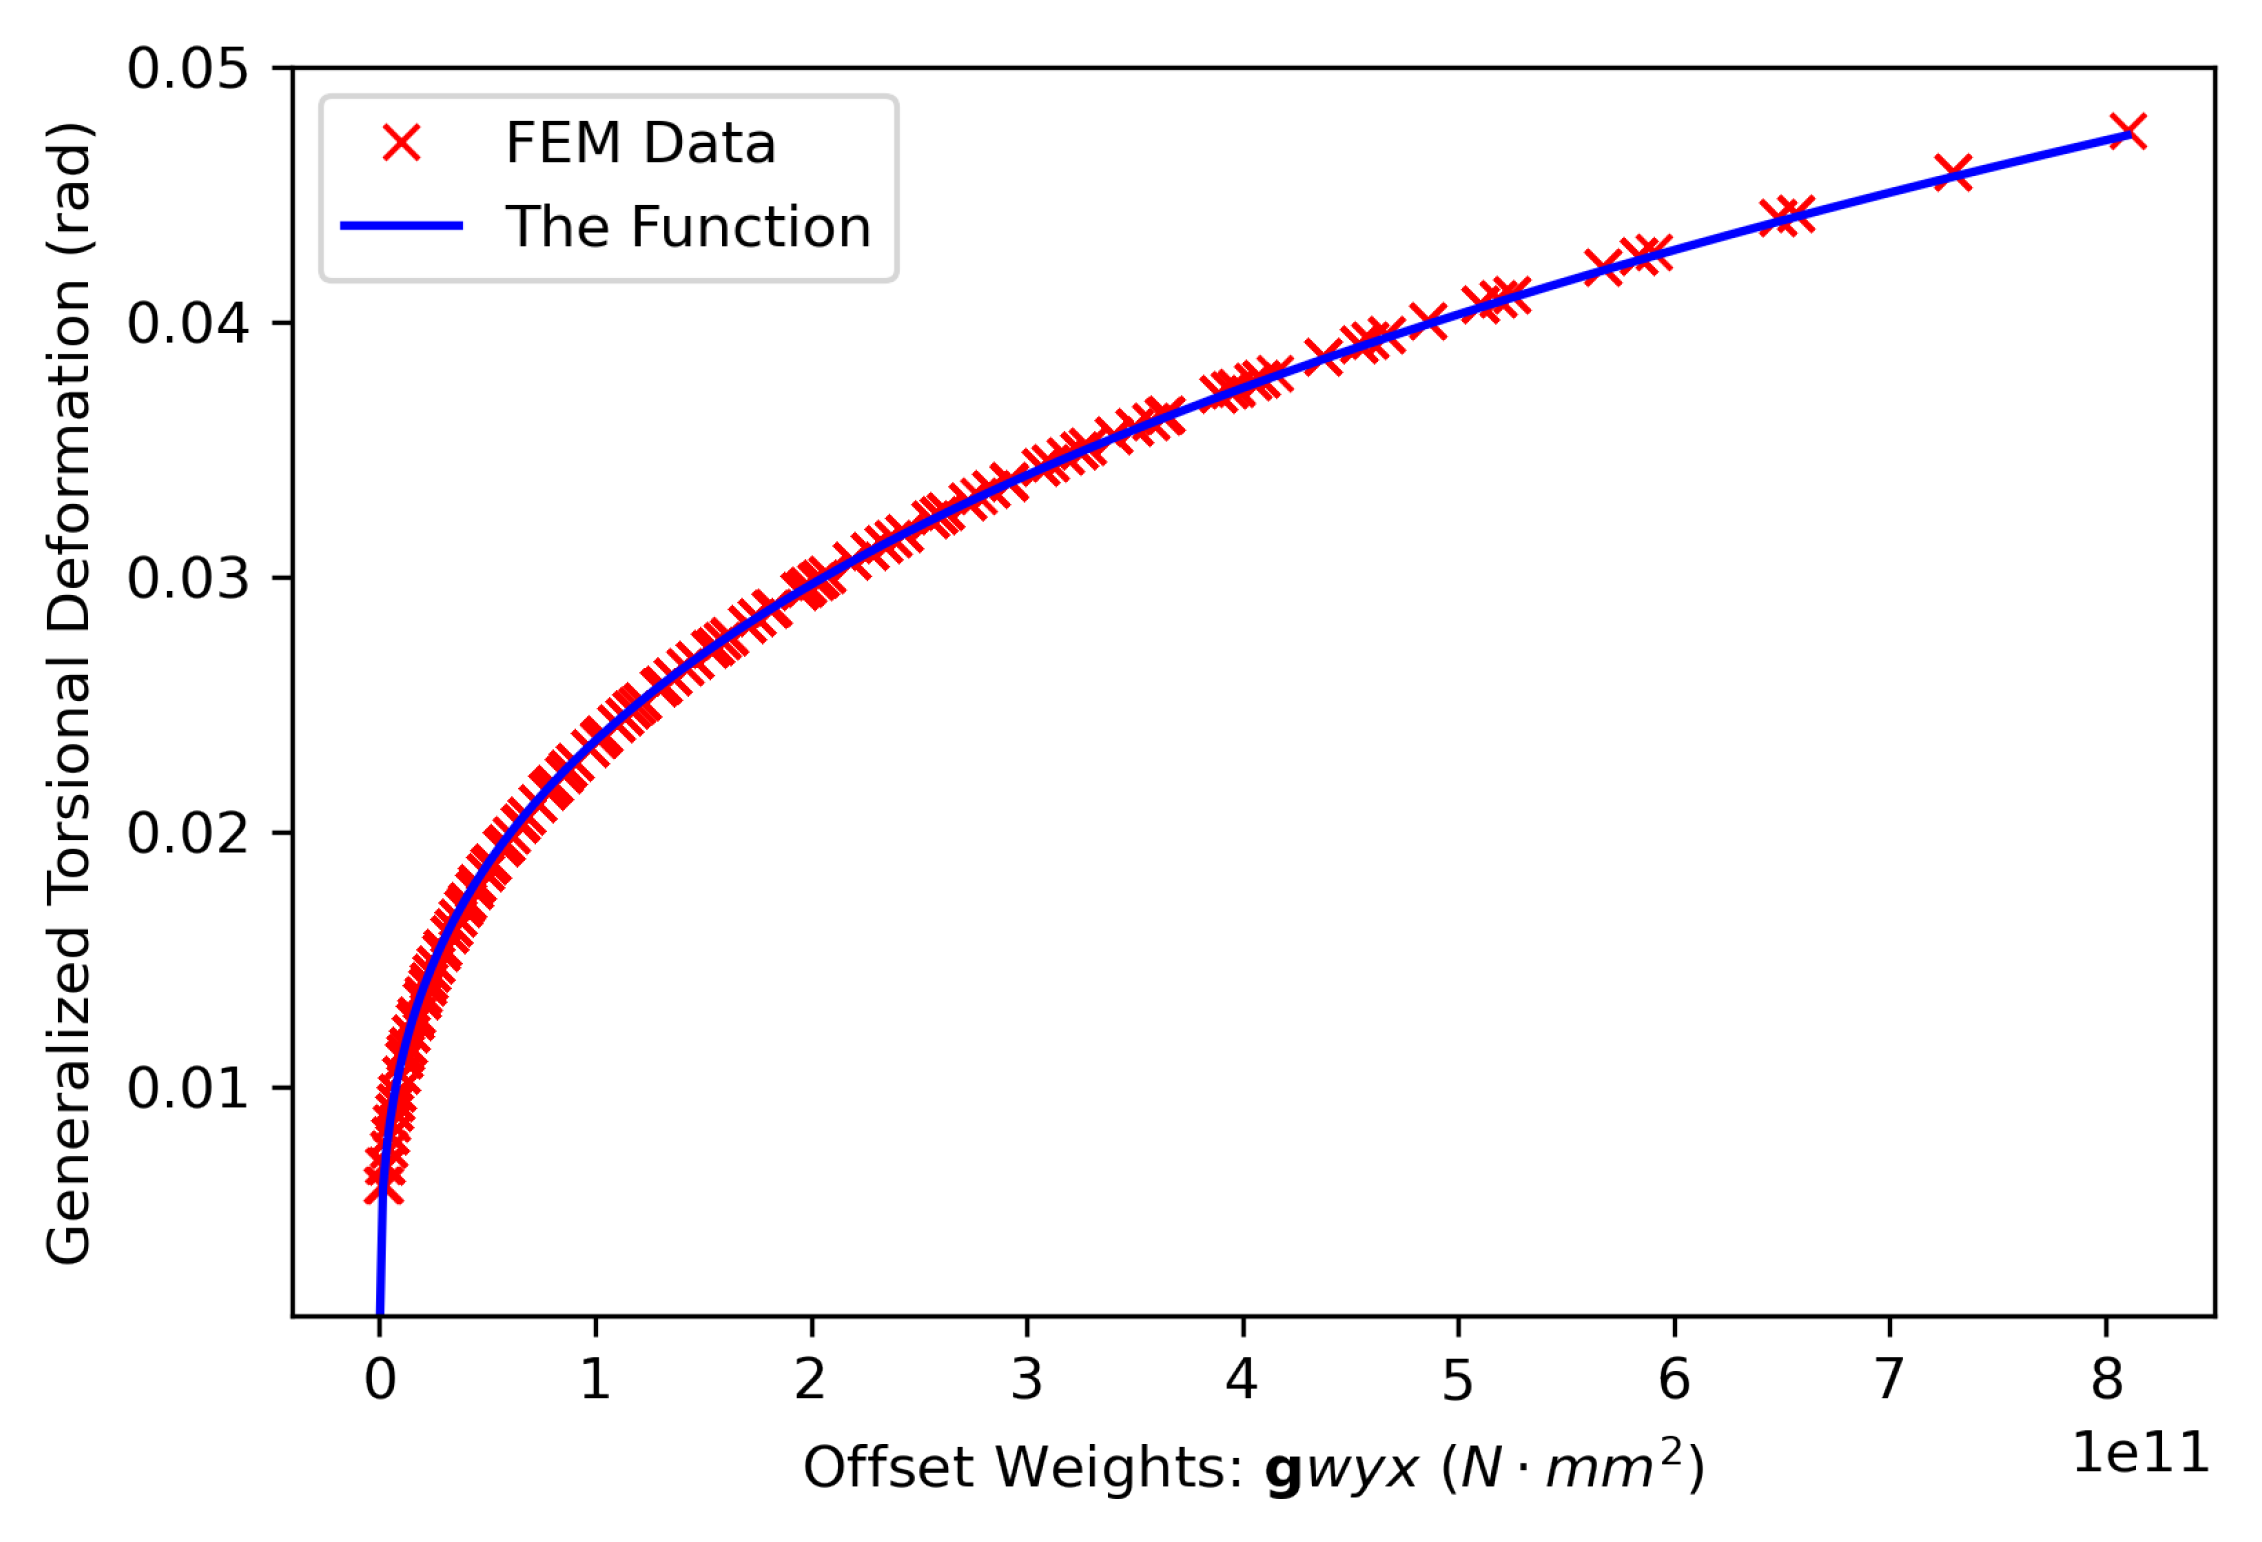
Figure 21.
Functional relation between the generalized torsional deformation and the offset weight parameters ().
Figure 21.
Functional relation between the generalized torsional deformation and the offset weight parameters ().
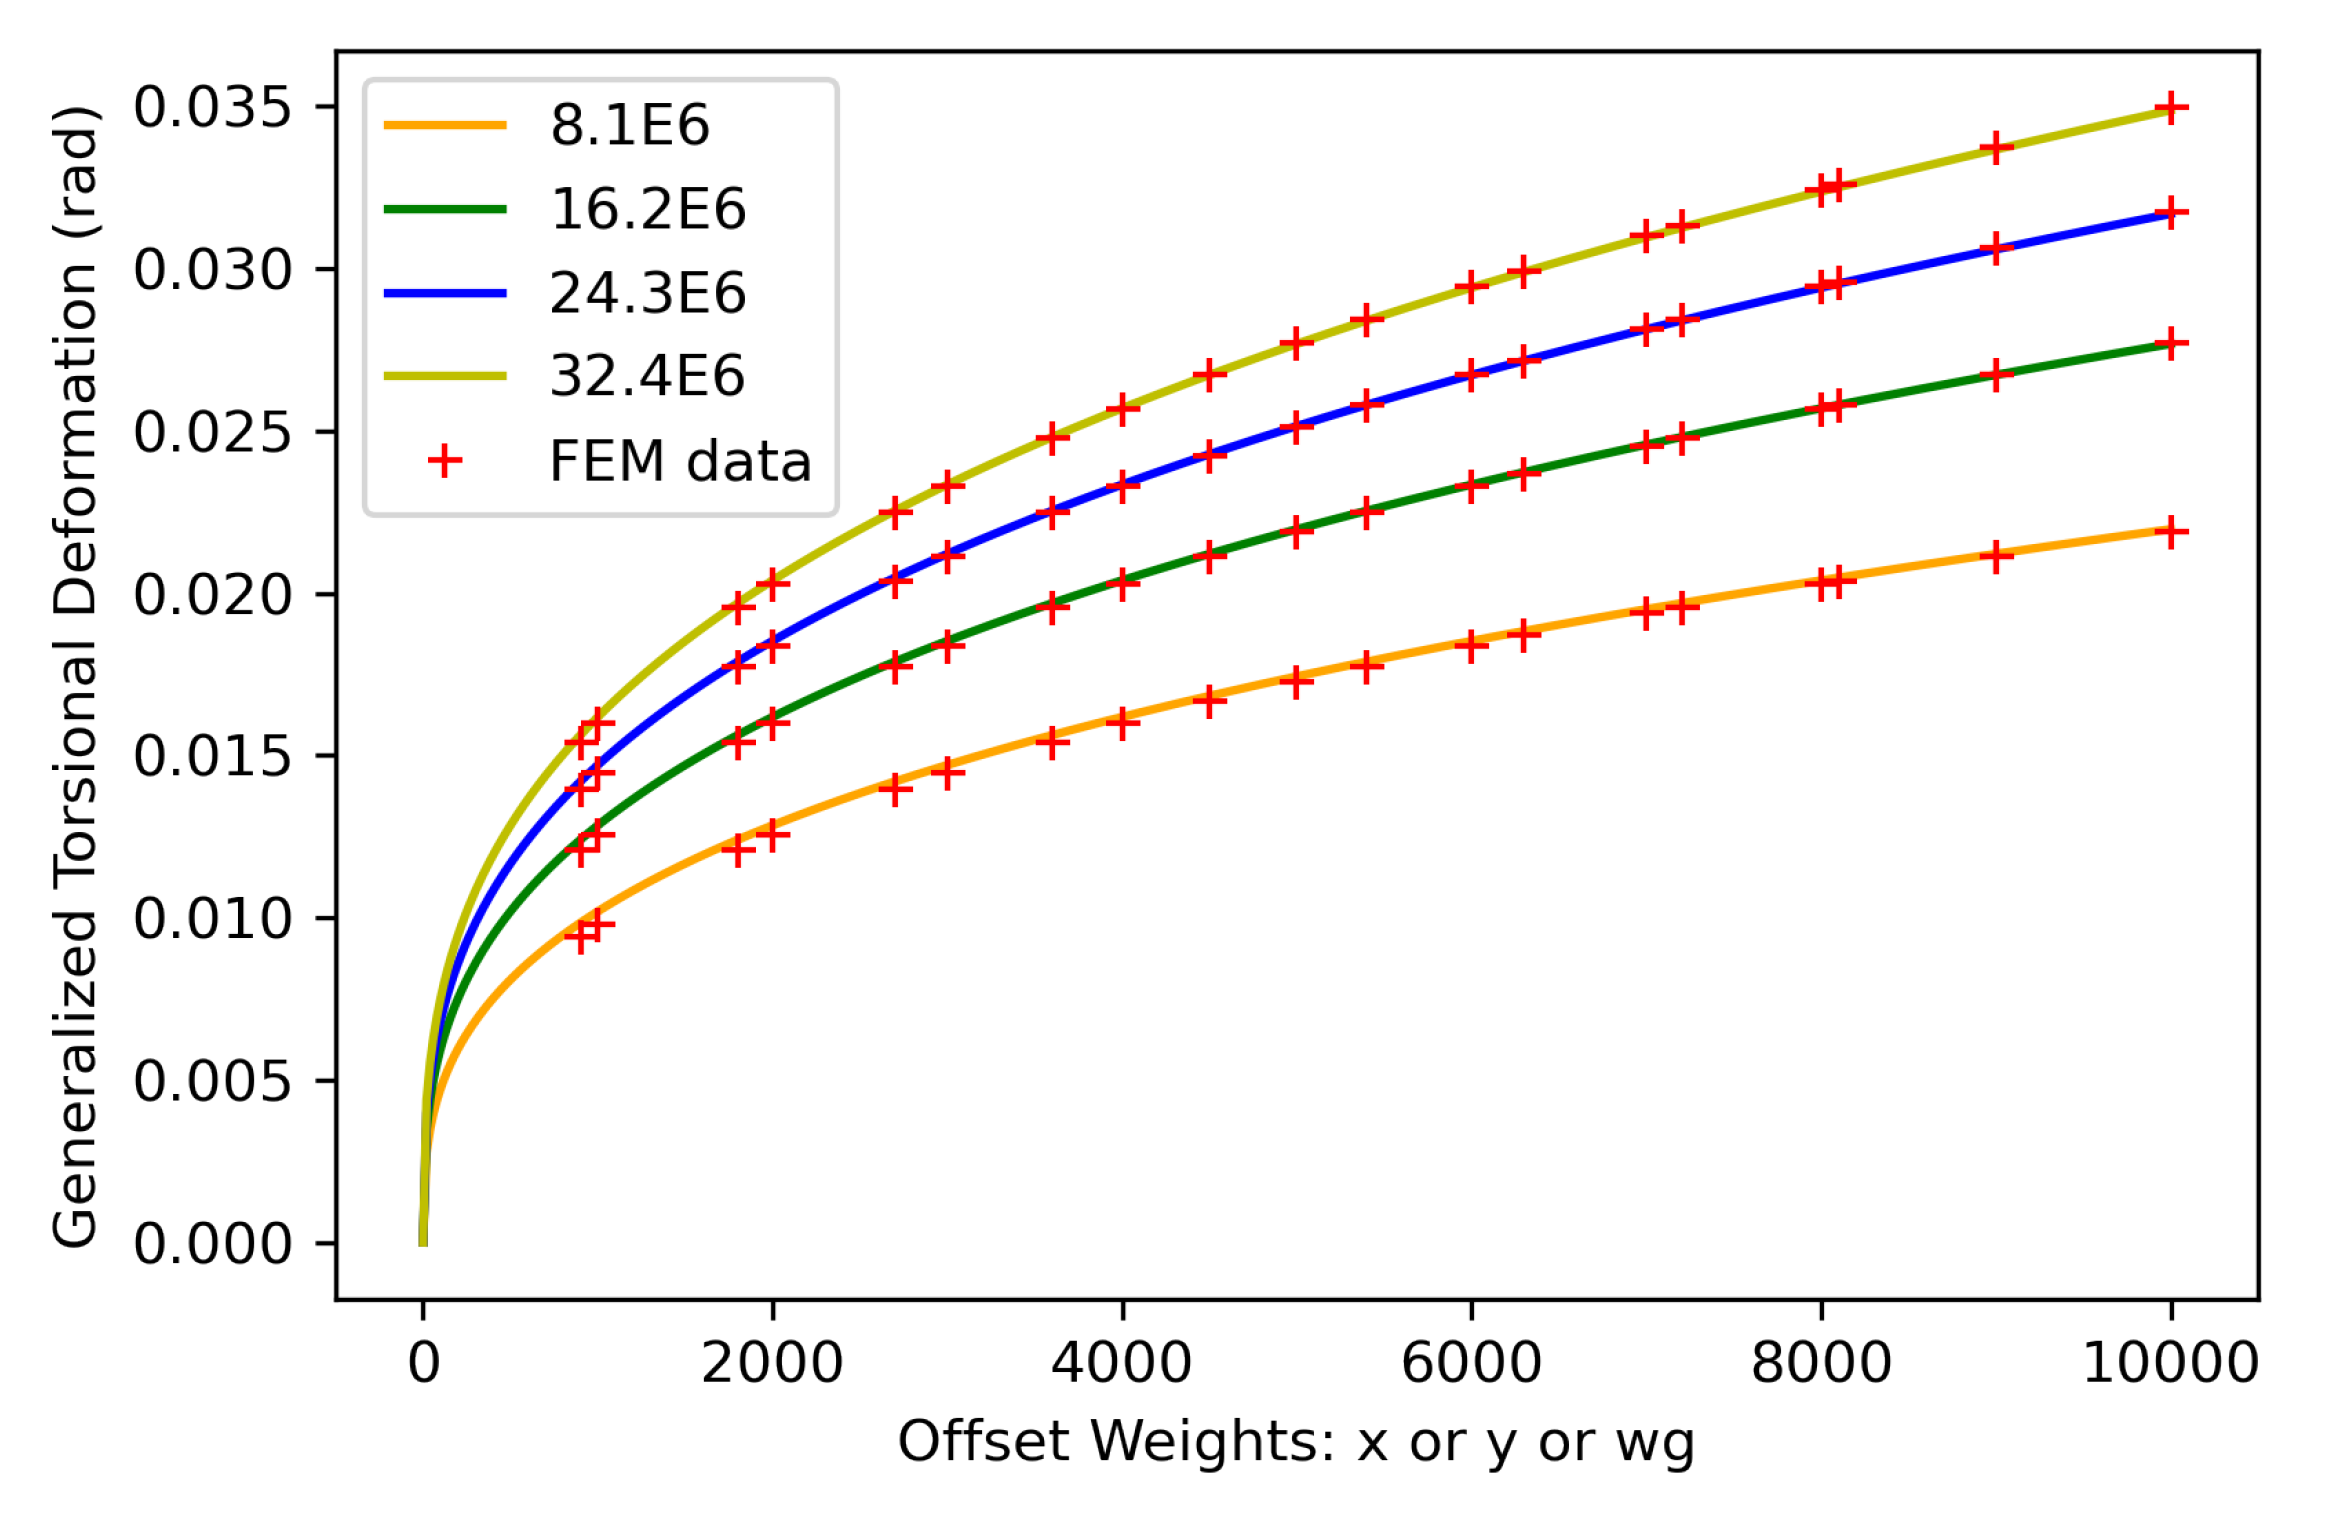

Table 1.
Material properties and structural dimensions.
| Item | Value |
|---|---|
| Young’s modulus | MPa |
| Poisson’s radio | 0.3 |
| Acceleration of gravity () | mm/ |
| Thickness of plates | 5 mm |
| Height of longitudinal stringers | 600 mm |
| Height of transverse beams | 2400 mm |
| Distance between longitudinal stringers | 900 mm |
| Distance between transverse beams | 4500 mm |
| Number of nodes | 25949 |
| Number of elements | 26040 |
| Element types | S4R |
Table 2.
Location of the three lifting points.
| Item | X | Y | Z |
|---|---|---|---|
| Lifting point 1# | −9000 mm | 9000 mm | 0 mm |
| Lifting point 2# | −9000 mm | −9000 mm | 0 mm |
| Lifting point 3# | −11700 mm | 0 mm | 0 mm |
Table 3.
Displacement boundary conditions of the three lifting points.
| Item | U1 | U2 | U3 | UR1 | UR2 | UR3 |
|---|---|---|---|---|---|---|
| 1# | SET | UNSET | SET | UNSET | UNSET | UNSET |
| 2# | SET | UNSET | SET | UNSET | UNSET | UNSET |
| 3# | UNSET | SET | SET | UNSET | UNSET | UNSET |
Table 4.
Working condition sets for Section 4 and 5.
Table 4.
Working condition sets for Section 4 and 5.
| Case | |||
|---|---|---|---|
| Case 1 | 4500 mm | 4500 mm | 0.5 ton |
| Case 2 | 9000 mm | 9000 mm | 1.0 ton |
Table 5.
Study cases for torsional deformation and strain energy with different offset weight arrangements.
Table 5.
Study cases for torsional deformation and strain energy with different offset weight arrangements.
| Method | |||
|---|---|---|---|
| Linear | 900–9000 mm | 900–9000 mm | 0.1–1 ton |
| Nonlinear | 900–9000 mm | 900–9000 mm | 0.1–1 ton |
Table 6.
Mean and standard deviation of torsional angle changes .
| Case | Method | Mean | Standard deviation |
|---|---|---|---|
| Case 1 | nonlinear | 14.6283 | 0.02003 |
| Case 1 | linear | 559.3828 | 0.18935 |
| Case 2 | nonlinear | 29.0532 | 0.15522 |
| Case 2 | linear | 4475.0629 | 1.52921 |
Disclaimer/Publisher’s Note: The statements, opinions and data contained in all publications are solely those of the individual author(s) and contributor(s) and not of MDPI and/or the editor(s). MDPI and/or the editor(s) disclaim responsibility for any injury to people or property resulting from any ideas, methods, instructions or products referred to in the content. |
© 2024 by the authors. Licensee MDPI, Basel, Switzerland. This article is an open access article distributed under the terms and conditions of the Creative Commons Attribution (CC BY) license (http://creativecommons.org/licenses/by/4.0/).
Copyright: This open access article is published under a Creative Commons CC BY 4.0 license, which permit the free download, distribution, and reuse, provided that the author and preprint are cited in any reuse.


