Submitted:
10 December 2024
Posted:
11 December 2024
Read the latest preprint version here
Abstract
Lubricant friction modifier additives are used on lower-viscosity engine oils to mitigate the impact on boundary friction. In this work, the use of Graphene nanoplatelets, with an average of 9 layers, was first investigated as an additive to a fully formulated SAE 0W-20 engine oil during reciprocating tribological tests at 40 and 120 °C and Hertzian pressure up to 1.2 GPa. Then, engine fuel consumption was evaluated in a vehicle emission test by adding 0.1% of GNP, in an improved booster, onto a fully formulated 5W-20 SAE oil. Adding 0.1% of GNP reduced fuel consumption by 2.6% in the FTP-75 cycle and 0.8% in the Highway cycle.
Keywords:
Graphene
; Friction
; Fuel Economy
; viscosity
1. Introduction
The search for reducing fuel consumption and CO2 emission has led to continuous search for reducing the mechanical losses caused by friction. For combustion engines, lower viscosity oils are being introduced to reduce engine-dominant hydrodynamic friction losses but with the risk of increasing boundary friction [1,2]. To protect engine parts against potential damage related to metal-to-metal contact, due to the increasing trend in reducing oil viscosity, some lubricant formulation strategies are applied. These initiatives include introducing the right type of friction modifier, choosing high viscosity index base oils and selecting efficient viscosity index improvers based on olefin copolymers to minimize shear thinning, as demonstrated in previous works [3,4,5,6]. Combining those efforts with engine adaptations to operate in the presence of ultra-low viscosity oils, results of fuel economy at homologation test cycles may reach values up to 5.5% depending on the baseline oil of a given engine, as shown in [7,8].
Graphene-based materials, due to unique properties such as low shear resistance, high stiffness, and thermal conductivity, are attractive materials for tribological applications, including improvement on the properties of lubricants. [9,10].
This work describes the use of graphene nanoplatelets as a lubricant additive. Lubricants were tested both in laboratory and in vehicle tests.
2. Materials and Methods
2.1. Graphene Characterization
Graphene samples, after deposition as a powder over a conductive carbon adhesive tape, were characterised by scanning electron microscopy (SEM) using a Hitachi SU5000 model. Raman spectroscopy was used to characterize the structure of the samples using a Witec Alpha 300 RA equipment (Ulm, Germany) with a 532 nm laser. A typical Raman spectrum of graphene has three main bands that describe the crystalline quality of the material and stacking characteristics, such as the number of coupled interlayers. The D band, located at 1350 cm−1, is activated by the disorder generated at 1580 cm−1, caused by stretching the C-C covalent bonds common in all carbon systems with sp2 hybridization. The 2D band, located at approximately 2700 cm−1, is the over-tone of the D band, with two transverse optical phonons.
Raman spectra were the inputs of an improved version of the protocol described in [11] to quantify crystalline defects and the number of graphene-coupled interlayers (see Table 1 and Figure 1 and Figure 2). The GNP has on average 9 layers and a lateral size of 71.1 nm. Under higher magnification SEM, it is possible to notice that its sheets are aggregated in a spherical manner (Figure 3).
2.2. Booster with Graphene
To ensure effective interaction between graphene and lubricants, a molecule featuring a highly reactive cyclic group and an oxygen functional group was used to functionalise the graphene powders (samples L66_1 and L66_2). This functionalization process was followed by treatment with an organic long-chain compound to enhance compatibility with the lubricant matrix. Both samples underwent advanced preparation methods tailored to optimize their performance in lubrication systems.
L66_1 was produced on an industrial scale using a high-energy mixing process, yielding a concentrated formulation with approximately 38% graphene nanoplatelets (GNP). L66_2, on the other hand, followed the same preparation method as L66_1 but incorporated an additional exfoliation step through purely shear mixing. This extra step was introduced to further reduce graphene aggregation, resulting in a more homogenous dispersion. The effectiveness of this modification was evidenced by a notable decrease in the viscosity of L66_2, see Figure 4.
The specific substances and techniques employed for graphene functionalization and mixing are proprietary and cannot be disclosed.
2.3. Reciprocating Friction Tests
For the tribological tests, the additives L66_1 and L66_2 were mixed with a fully formulated oil, SAE 0W-20 SN. To mix the GNP additives, the oil was heated to 40°C and the GNP mass required to achieve a 0.2 w/w% concentration was weighed on an analytical scale. The additive was then added to the warmed oil. The mixture was first stirred manually with a glass rod and then placed in an ultrasonic bath for 45 minutes. After this period, no sediment was observed. The mixture was stored, and photographs were taken as a function of time, as presented in Figure 5. Immediately after mixing (as new), and after 10 days, the dispersion remained visually stable. However, after 20 days, some sedimentation of the additive was observed at the bottom. The dispersion could easily be restored by gentle shaking and a brief ultrasonic bath treatment.
Tribological tests were conducted using an SRV tribometer (Optimol, Germany). This test involved the reciprocating sliding of a ball against the flat surface of a 24 mm diameter AISI H13 steel disc specimen. To ensure consistent roughness across all tests, the disc was polished, with the final polishing stage performed using a paste containing 1 µm diamond particles. After polishing, the surface roughness (Sa) was measured using a 3D laser interferometer. The ball was made of AISI 52100 steel, presenting a diameter of 10 mm. See Table 2.
Tribological tests were conducted in triplicate. Each repetition followed the procedure detailed in Table 3. Each repetition lasted 105 minutes, divided into steps of 15 minutes each. Five drops of oil were applied at each test start, covering the entire disc surface. After each test, residual oil was observed on the surface, indicating consistent lubrication throughout the test.
2.4. Vehicle emission tests
Vehicle tests were part of a larger test program comparing different lubricants and the GNP was added to a fully formulated 5W-20 oil. After the tests with SAE 5W-20 reference oil for the vehicle emission test, the engine was started and ran until the oil temperature reached the operation value, 90 °C. The engine was stopped and 500 ml of oil was removed. From these, 250 ml was kept as a sample after the test and the other 250 ml, while still hot, was used to disperse the graphene additive. The mix was conducted only manually with the help of a “spoon”. Then the 250 ml plus additive was returned to the engine. The engine was completed with a volume of new oil considering the small amount of additive to ensure that the test sequence started with the same volume as with the reference oil. The engine was again restarted and run for a few minutes before being conditioned (“soaking period”) according to the test procedure standard.
The experimental emissions tests were performed with a large sport utility vehicle in an emissions laboratory following a combined cycle over a chassis dyno, according to NBR7024 [12], composed of 55% in an urban cycle (FTP75) and 45% in a highway cycle. To better investigate the influence of the GNP additive, the urban, FTP75, cycle was divided in three phases: Ph1, Ph2 and Ph3. See Figure 6 and table 4. Ph3 has an identical vehicle speed profile as Ph1 but as the engine, and oil, are already hot, fuel consumption is significantly lower than on Ph1. Due to the temperature on the aftertreatment 3-way catalytic converter, almost all pollutant emissions occur on Ph1. See discussion on [13].

Table 4.
Emission test cycle details.
| Units | PH1 & 3 | Ph2 | Highway | |
|---|---|---|---|---|
| Duration | s | 505 | 864 | 12.75 |
| Distance | km | 5.78 | 6.21 | 16.58 |
| Mean Velocity | km/h | 41.20 | 25.88 | 77.73 |
| Max. Velocity | km/h | 91.2 | 55.2 | 96.56 |
| Stops | 6 | 13 | None |
The vehicle is equipped with a 4-cylinder, spark ignition, direct injection, turbocharged engine coupled to a 6-gear automatic transmission by a torque converter. At least two tests were performed with each lubricant version and the test uncertainties were compensated in terms of vehicle speed profile and battery voltage based on ECU data measurements by ETAS Inca. The test compensation factors were determined by 1-D numerical simulation with a vehicle mathematical model in a GT-Suite v.2024 from Gamma Technologies. The test compensation is detailed in [14].
3. Results
3.1. Reciprocating Friction Tests
The data was analyzed using the "all data" file generated by the SRV software. This file records CoF (Coefficient of Friction) data for one minute at intervals of 5 minutes, with measurements taken every 1.9 x 10⁻⁵ seconds during the recording minute. In this setup, each step consists of three such 5-minute intervals, totalling 15 minutes of testing under specific conditions (e.g., load or temperature). For each step, an average COF is calculated for the three individual measurements, and the overall CoF for the step is determined as the average of these three values. Figure 7 presents the CoF results for each step. Here, L66_1 and L66_2 refer to the dispersion of SAE 0W-20 with the respective additive variant.
Adding L66_1 and L66_2 decreased CoF compared to the reference oil, SAE 0W-20, under all test conditions. The CoF values for L66_1 and L66_2 were similar; L66_2 presented lower CoF than L66_1 in the first test steps, with the difference between the two additive variants reducing along the test. It can be speculated that along the test the GNP exfoliated in fewer layers and also created a tribofilm in the surface. Such processes reduced the advantages of the more exfoliated and dispersed L66_2 in comparison to the 66_1 while in others, L66_1 shows a slight advantage. The largest difference between the L66 additives and the reference oil was observed in the test steps with 5N.
Another way to analyze the tribological results is in terms of friction losses. The energy dissipation due to the friction force is calculated through the force-displacement amplitude (F–D) hysteresis loops for each cycle during the test. Figure 8 shows one typical example of each lubricant variant and test step. Figure 9 shows the average results. As for the CoF, L66_2 presented a slight advantage compared to L66_1 in most of the test steps.
3.2. Fuel Consumption
As mentioned before, to allow more detailed analysis, the FTP75 cycle was divided into three phases. Phase Ph1 and Ph3 have identical speed profiles, but Ph1 starts with the engine at room temperature, so oil viscosity is significantly higher than on Ph3. For this reason and to normal combustion issues, fuel consumption is also significantly higher on Ph1 than on Ph3. Figure 10 shows the delta fuel consumption (difference with respect to the consumption using the reference oil) in each of the three FTP75 phases, as well as the accumulated one, the one on Highway cycle and the NBR7024 that is composed of 55% of the FTP75 and 45% of the highway values. Compared with the 5W-20 reference oil, tests with additive presented a fuel saving of 2.6% on the FTP75, 0.8% on the highway with the combined NBR2524 standard of 1.9% fuel saving. Figure 10 shows the range obtained with the minimum and average compensations described in [14]. The values in the plot refer to the ones with the average compensation.
4. Discussion
Paying attention to Figure 10, it can be observed that, as expected, fuel-saving reductions with the GNP additive were more significant on the Ph1 and Ph2 phases, where friction losses have more impact on fuel consumption. Internal combustion engines present several lubricated systems, which vary in terms of the predominant lubrication regime. In part of the systems, such as in cam-follower, the boundary lubrication may prevail, while in journal bearings hydrodynamic lubrication is expected to be the most important. Thus, the decrease in fuel consumption with the use of the GNP additives can be due to both boundary and hydrodynamic effects. Besides, graphene additives have shown the potential of increasing the lubricant conductivity. On the conducted tests, the oil with GNP additive showed a slighter quicker temperature drop during the vehicle stop interval between the cold and hot phases. See Figure 11. Such behavior suggests that the addition of graphene increased the oil thermal conductivity as seen by other authors. Alqahtani [16] obtained a 20% increase in thermal conductivity on a SAE 5W-30 with a concentration of 0.09 wt% of graphene. A similar increase of thermal conductivity was seen on [17,18]. In the vehicle test described in this work, the oil with GNP started the hot phase at approximately 2°C cooler. The impact on viscosity is negligible, but such an increase in thermal conductivity could be beneficial in terms of wear and on applications such Electrical Vehicles [19] and rolling bearings [17,20].
5. Conclusions
The use of Graphene nanoplatelets, with an average of 9 layers, after functionalization to work as a lubricant additive, reduced both the CoF and Friction losses on a reciprocating test. Specifically at the more severe test condition, 40N and 120 °C, the L66_2 additive reduced in 5% and 8%, respectively the CoF and the Energy losses in comparison with the reference oil, a fully formulated SAE 0W-20.
On vehicle emission tests, adding 0.1% w/w of GNP on a fully formulated 5W-20 SAE oil reduced fuel consumption by 2.6% in the FTP-75 cycle and 0.8% in the Highway, resulting in 1.9% in the combined cycle.
Author Contributions
“Conceptualization, E.T., F.R.; investigation, W.C., P.G., D.F., R.S., F.R.; resources, W.C., P.G., S.R., J.C., R.S., F.R.; writing—original draft preparation, E.T., F.R.; writing—review and editing, all authors. All authors have read and agreed to the published version of the manuscript.”
Funding
Part of this work was funded by the “Fundação da Universidade Federal do Paraná” with the project 27192.24, ROTA2030
Conflicts of Interest
The authors declare no conflicts of interest
References
- Tormos, B.; Pla, B.; Bastidas, S.; Ramírez, L.; Pérez, T.; Fuel economy optimization from the interaction between engine oil and driving conditions, Tribology International, Volume 138, 2019, Pages 263-270, ISSN 0301-679X. [CrossRef]
- Taylor, R.; Morgan, N.; Mainwaring, R.; Davenport T.; How much mixed/boundary friction is there in an engine — and where is it? Proceedings of the Institution of Mechanical Engineers, Part J: Journal of Engineering Tribology. 2020;234(10):1563-1579. [CrossRef]
- Kennedy, M.; Hoppe, S.; Esser, J. Weniger Reibleistung Durch Neue Kolbenringbeschichtung. MTZ - Motortechnische Zeitschrift 2014, 75, 48–51. [Google Scholar] [CrossRef]
- Schommers, J.; Scheib, H.; Hartweg, M.; Bosler, A. Reibungsminimierung Bei Verbrennungsmotoren. MTZ - Motortechnische Zeitschrift 2013, 74, 566–573. [Google Scholar] [CrossRef]
- Tamura, K.; Kasai, M.; Nakamura, Y.; Enomoto, T. Impact of Boundary Lubrication Performance of Engine Oils on Friction at Piston Ring-Cylinder Liner Interface. SAE Int J Fuels Lubr 2014, 7, 875–881. [Google Scholar] [CrossRef]
- Tamura, K.; Kasai, M.; Nakamura, Y.; Enomoto, T. Influence of Shear-Thinning of Polymer-Containing Engine Oils on Friction at the Piston Ring-Cylinder Liner Interface. In Proceedings of the SAE Technical Papers; SAE International, 2013; Vol. 11.
- Michlberger, A.; Morgan, P.; Delbridge, E.E.; Gieselman, M.D.; Kocsis, M. Engine Oil Fuel Economy Testing - A Tale of Two Tests. SAE Int J Fuels Lubr 2017, 10, 478–486. [Google Scholar] [CrossRef]
- Holmberg, K.; Kivikytö-Reponen, P.; Härkisaari, P.; Valtonen, K.; Erdemir, A. Global Energy Consumption Due to Friction and Wear in the Mining Industry. Tribol Int 2017, 115, 116–139. [Google Scholar] [CrossRef]
- Tomanik, E.; Christinelli, W.; Souza, R.M.; Oliveira, V.L.; Ferreira, F.; Zhmud, B. Review of Graphene-Based Materials for Tribological Engineering Applications. Eng 2023, 4, 2764–2811. [Google Scholar] [CrossRef]
- Nyholm, N.; Espallargas, N. Functionalized carbon nanostructures as lubricant additives—A review. Carbon 2023, 201, 1200–1228. [Google Scholar] [CrossRef]
- Silva, D.L.; Campos, J.L.E.; Fernandes, T.F.; Rocha, J.N.; Machado, L.R.; Soares, E.M.; Miquita, D.R.; Miranda, H.; Rabelo, C.; Neto, O.P.V.; et al. Raman spectroscopy analysis of number of layers in mass-produced graphene flakes. Carbon 2020, 161, 181–189. [Google Scholar] [CrossRef]
- NBR7024, ASSOCIAÇÃO BRASILEIRA DE NORMAS TÉCNICAS (ABNT). NBR7024: Veículos rodoviários automotores leves – Medição do consumo de combustível – Método de ensaio. Rio de Janeiro, 2010, 13p.
- Tomanik, E., Miedviedieva, N., Tomanik, V., Miedviediev, B., Use of digital twins to analyze and predict CO2 and emissions on Hybrid vehicles. International Scientific Conference INTELLIGENT TRANSPORT SYSTEMS: Ecology, Safety, Quality, Comfort. Kiev, Ukraine, November 26-27, 2024.
- Rovai, F., Tomanik, E. “Lubricant viscosity impact in fuel economy: experimental un-certainties compensation”. Lubricants, to be published.
- Rustamov, I., Xiang, L., Xia, Y., Peng W., Tribological and mechanical endowments of polyoxymethylene by liquid-phase exfoliated graphene nanofiller. Polymer International, 2024. [CrossRef]
- Alqahtani, B.; Hoziefa, W.; Abdel Moneam, H.M.; Hamoud, M.; Salunkhe, S.; Elshalakany, A.B.; Abdel-Mottaleb, M.; Davim, J.P. Tribological Performance and Rheological Properties of Engine Oil with Graphene Nano-Additives. Lubricants 2022, 10, 137. [Google Scholar] [CrossRef]
- Ota, J.; Hait, S.; Sastry, M.; Ramakumar, S. Graphene dispersion in hydrocarbon medium and its application in lubricant technology. RSC Adv., 2015, 5, 53326. [Google Scholar] [CrossRef]
- Contreras E., G. Oliveira, E. Bandarra. Experimental analysis of the thermohydraulic performance of graphene and silver nanofluids in automotive cooling systems, International Journal of Heat and Mass Transfer, V. 132, 2019, pp.375-387, ISSN 0017-9310. [CrossRef]
- Canter N., Tribology and Lubrication for E-Mobility: Findings from the Inaugural STLE Conference on Electric Vehicles, 2022.
- Nassef, M.; Soliman, M.; Nassef, B.; Daha, M.; Nassef, G. Impact of Graphene Nano-Additives to Lithium Grease on the Dynamic and Tribological Behavior of Rolling Bearings. Lubricants 2022, 10, 29. [Google Scholar] [CrossRef]
Figure 1.
(a) Characteristic Raman spectrum. (b) Scatter plot with the frequency distributions of the G-band full-width at half-max (ΓG) and the ratio between the integrated areas of the D and G bands (AD/AG) multiplied by the fourth power. (c) Layers Distribution.
Figure 1.
(a) Characteristic Raman spectrum. (b) Scatter plot with the frequency distributions of the G-band full-width at half-max (ΓG) and the ratio between the integrated areas of the D and G bands (AD/AG) multiplied by the fourth power. (c) Layers Distribution.
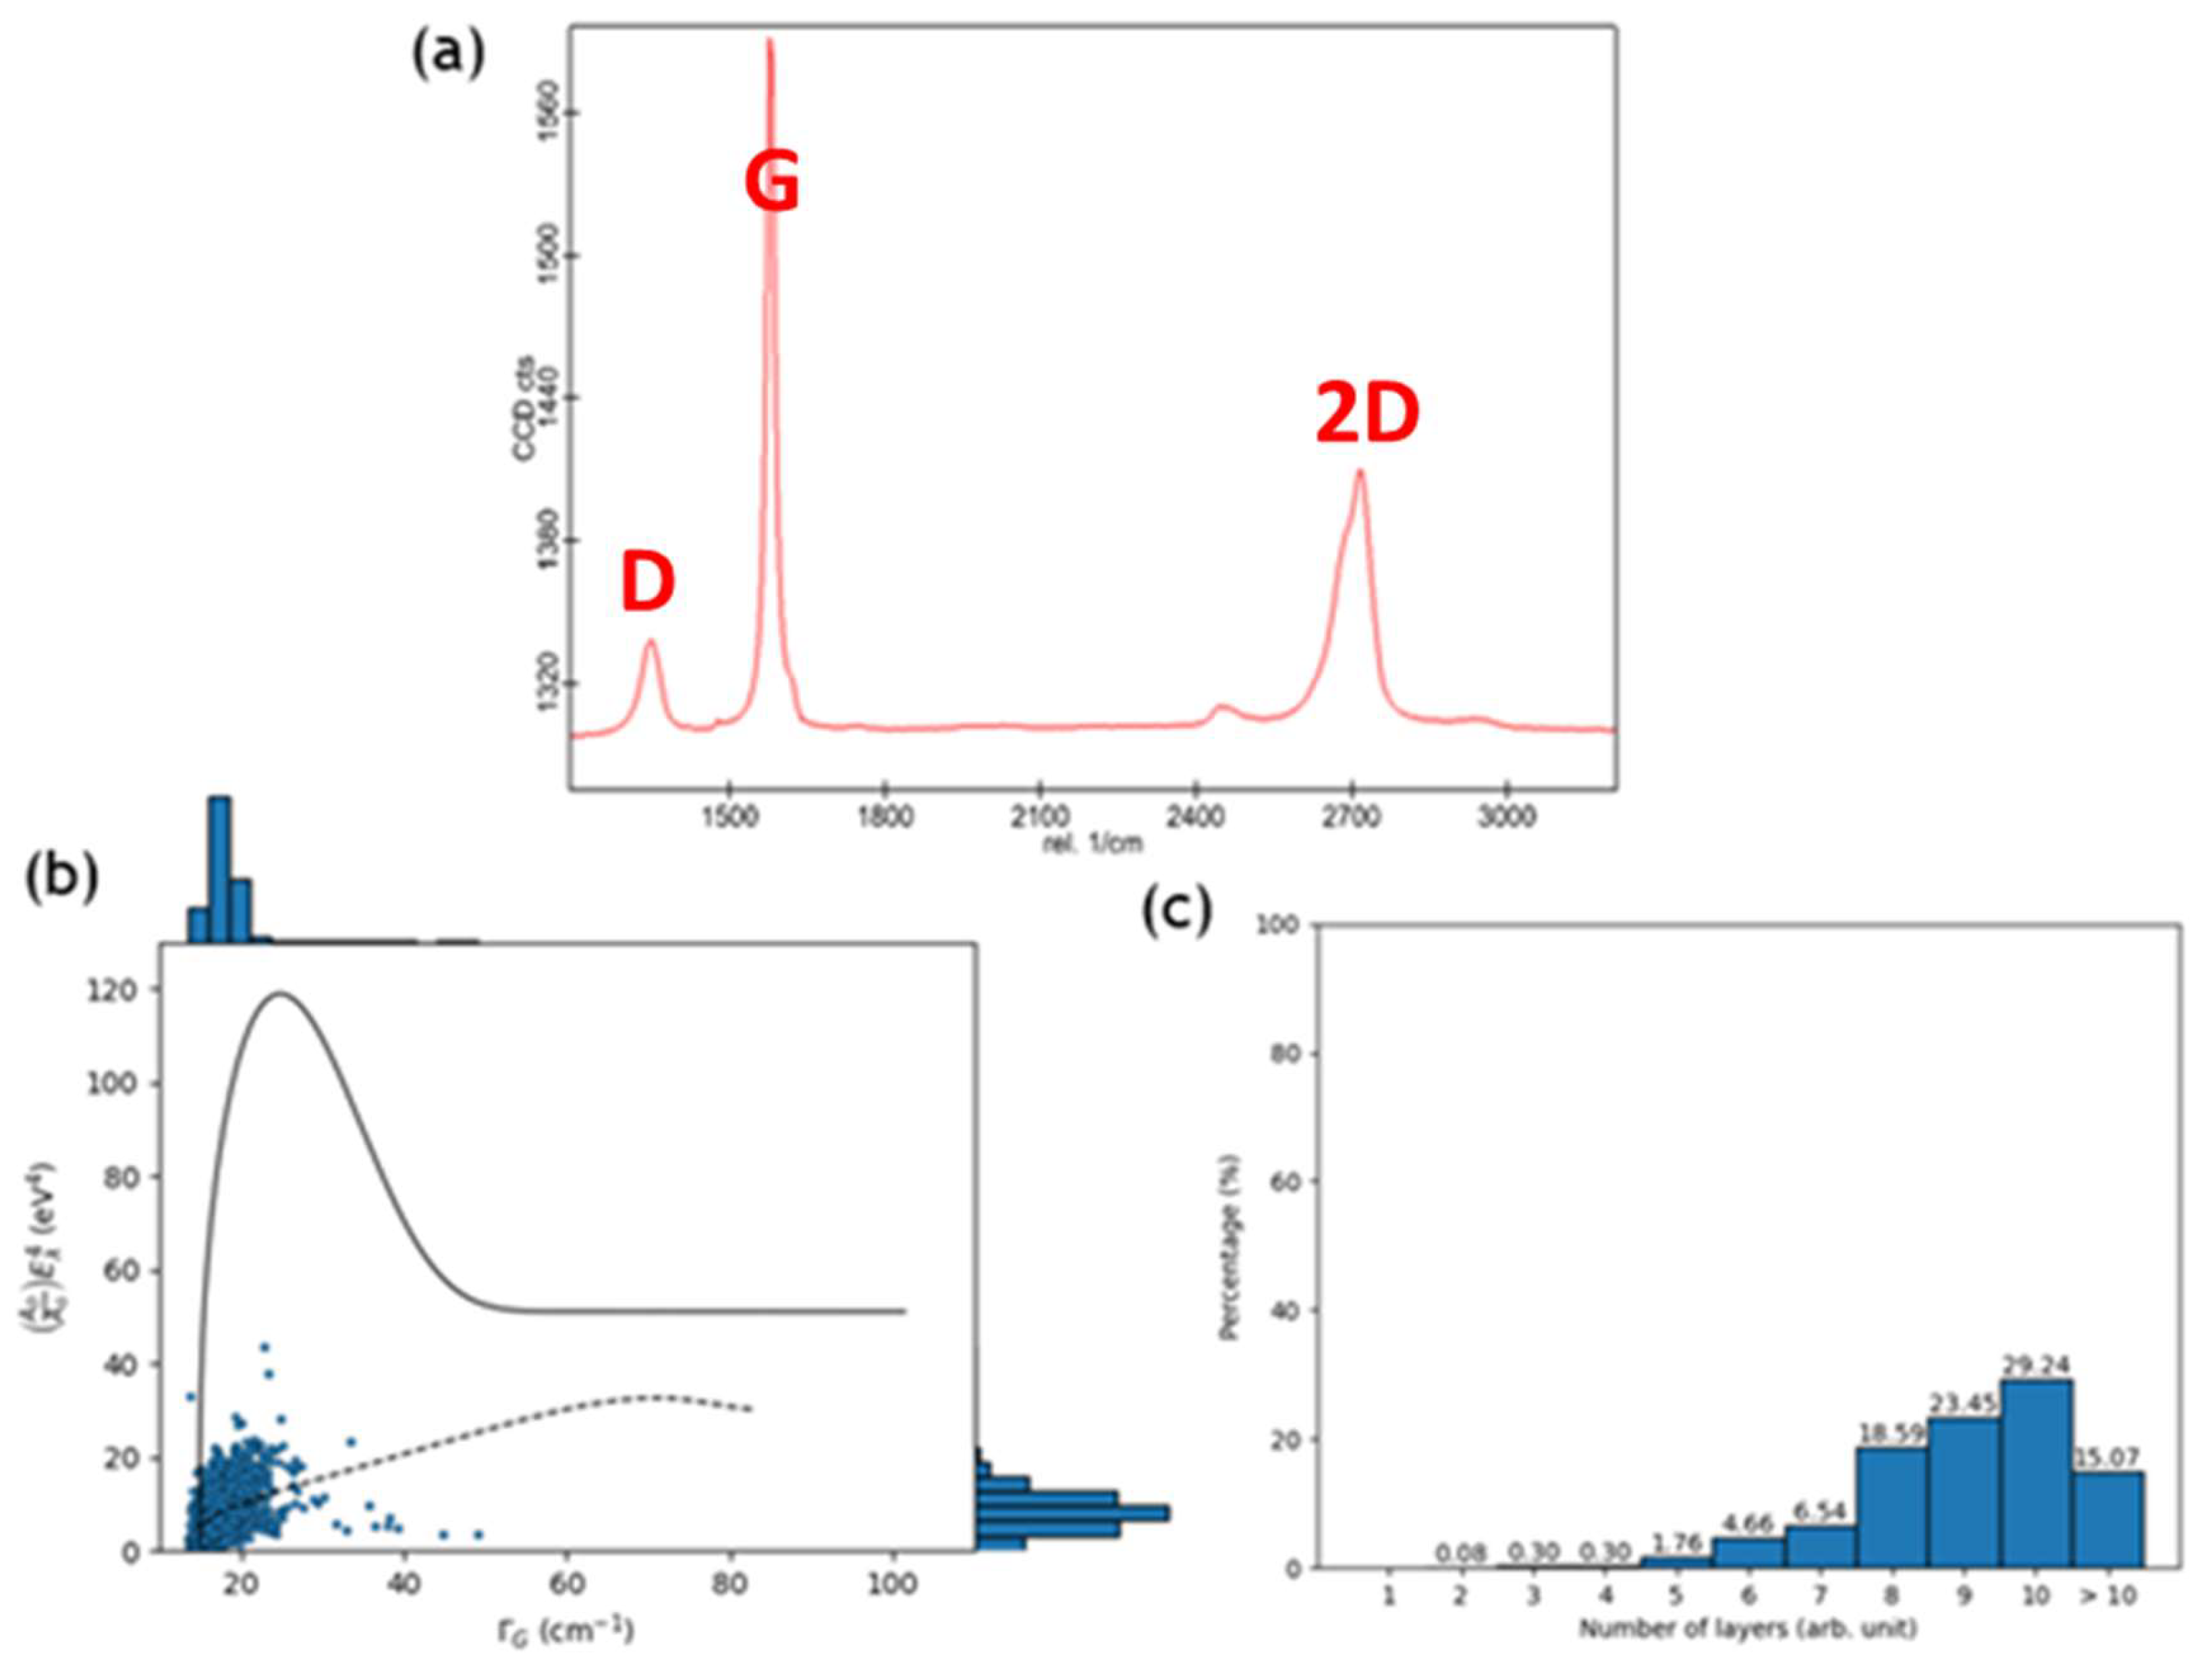
Figure 2.
Thermogravimetric and derivative curves obtained under air gas flow of 100 mL/min and at a heating rate of 10 °C/min.
Figure 2.
Thermogravimetric and derivative curves obtained under air gas flow of 100 mL/min and at a heating rate of 10 °C/min.
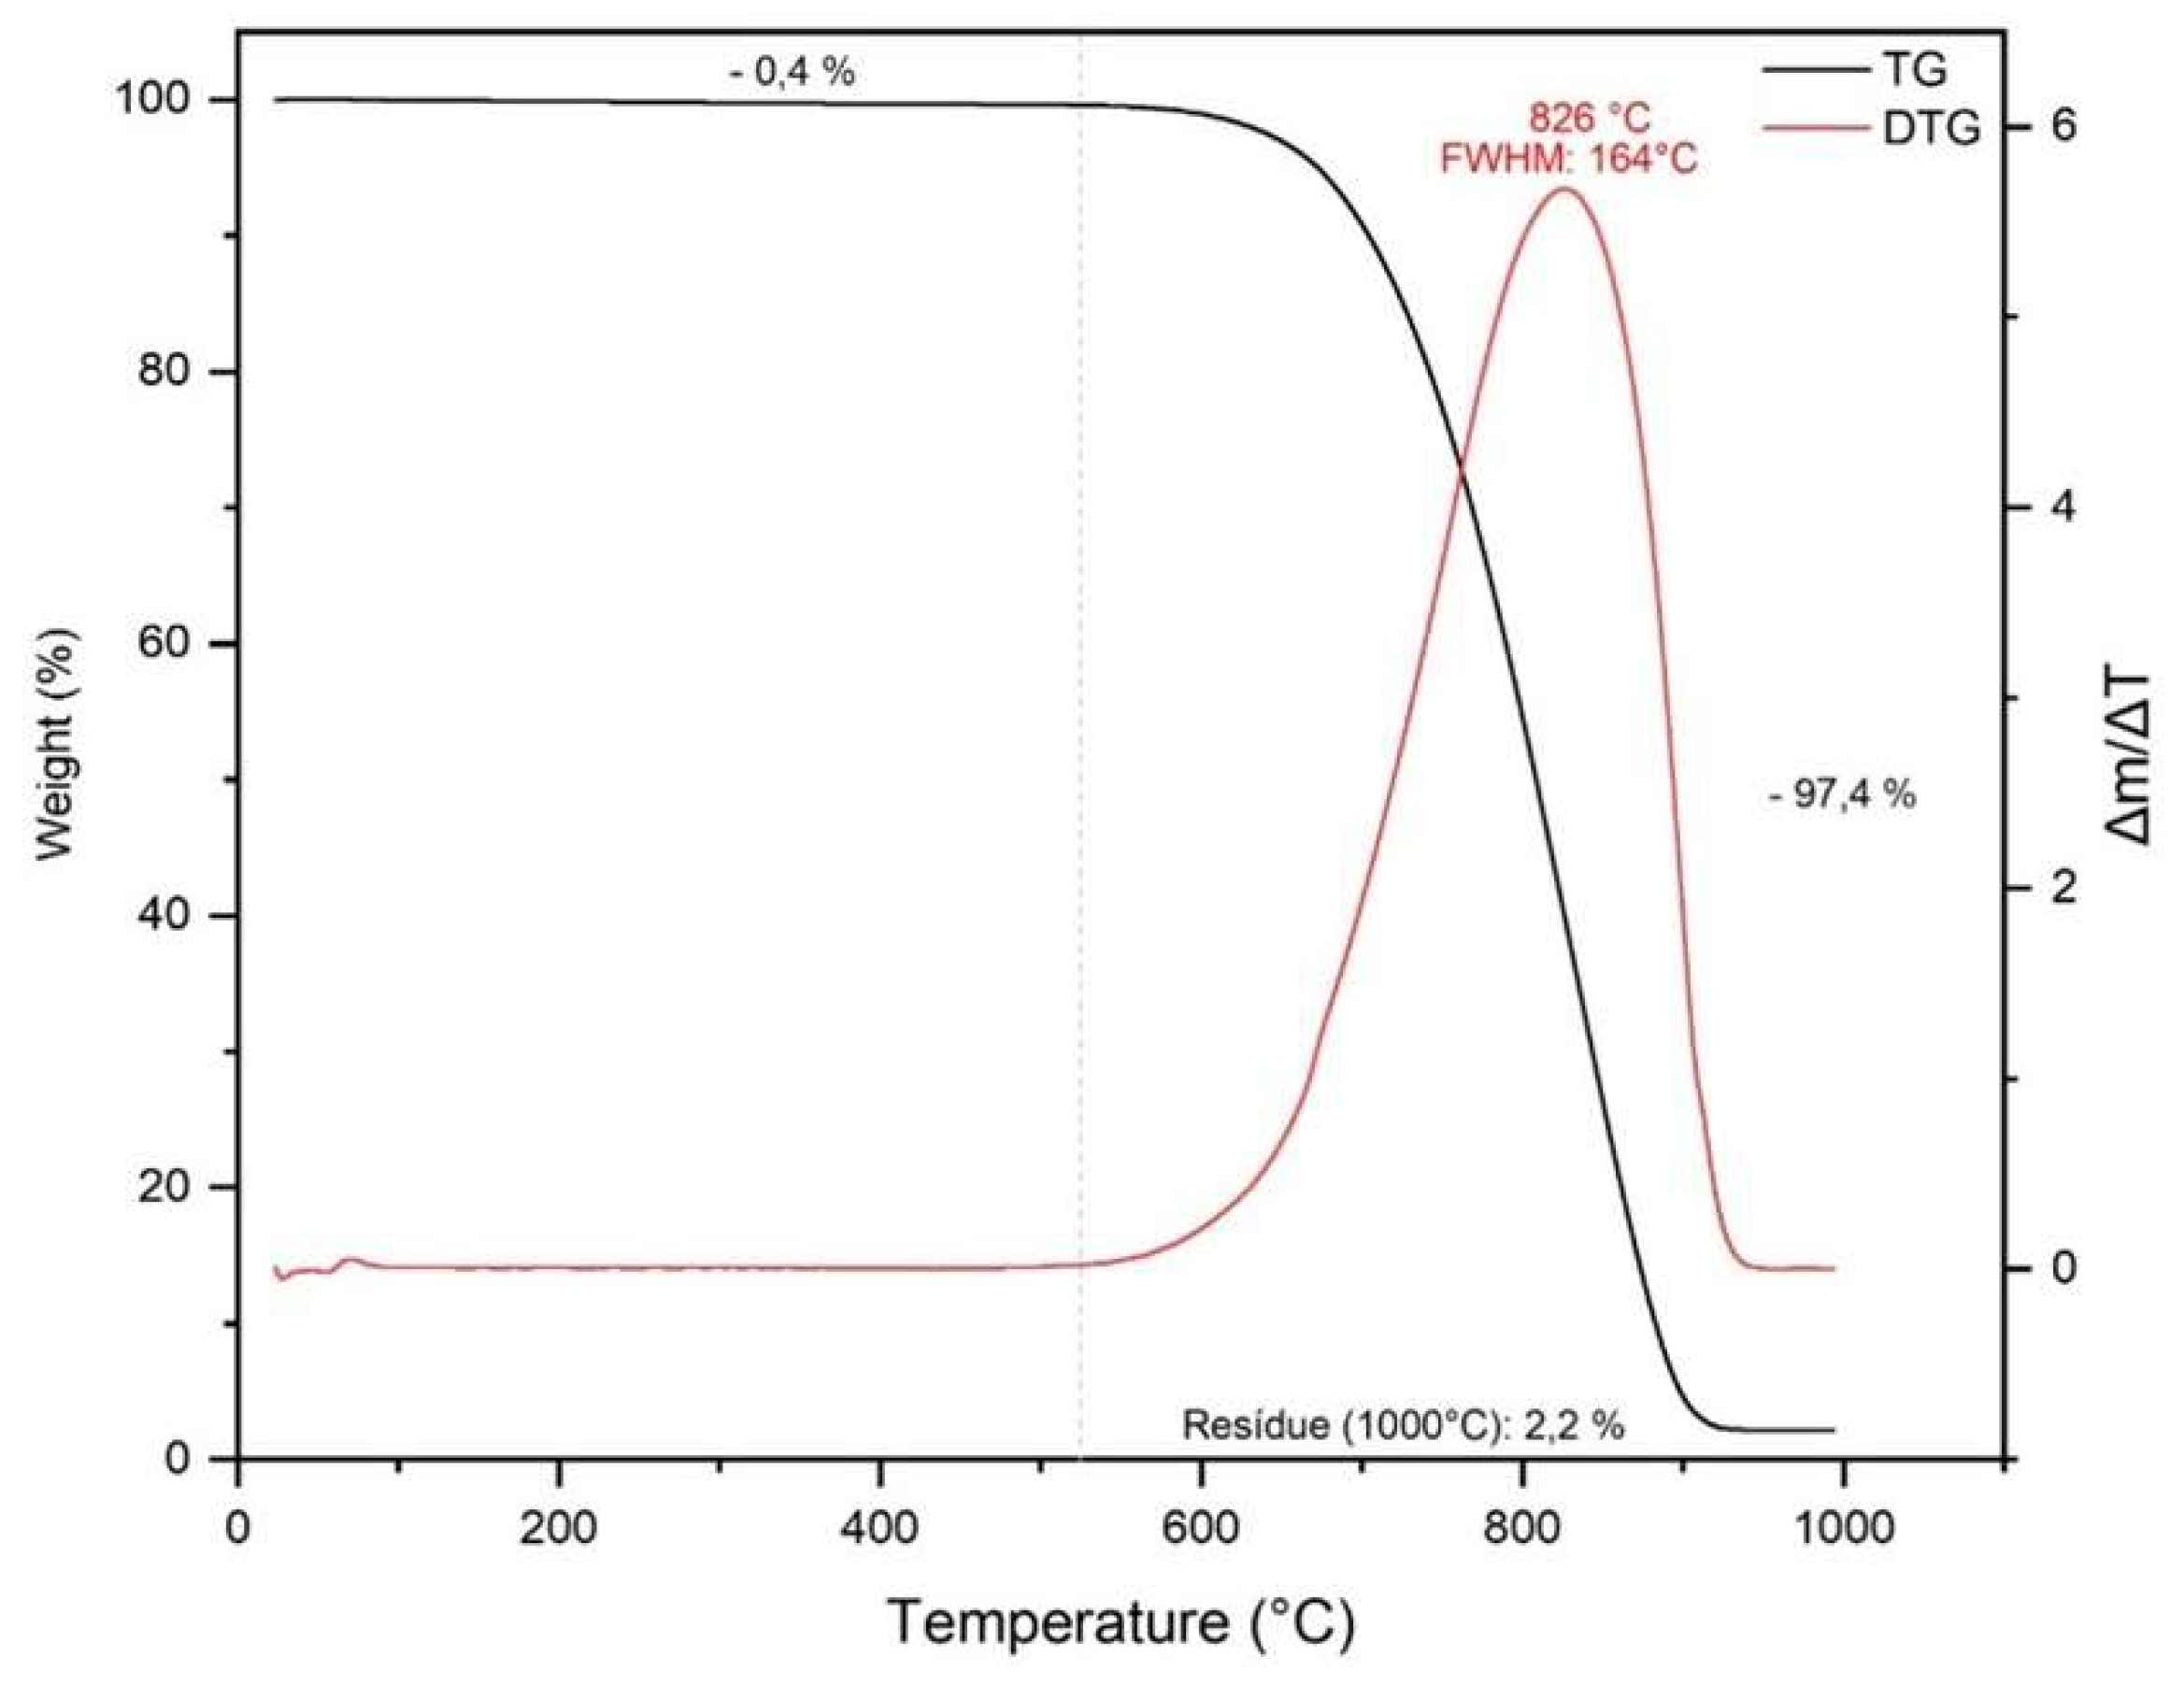
Figure 3.
GNP scanning electron microscopy - SEM photos with crescent zooms.
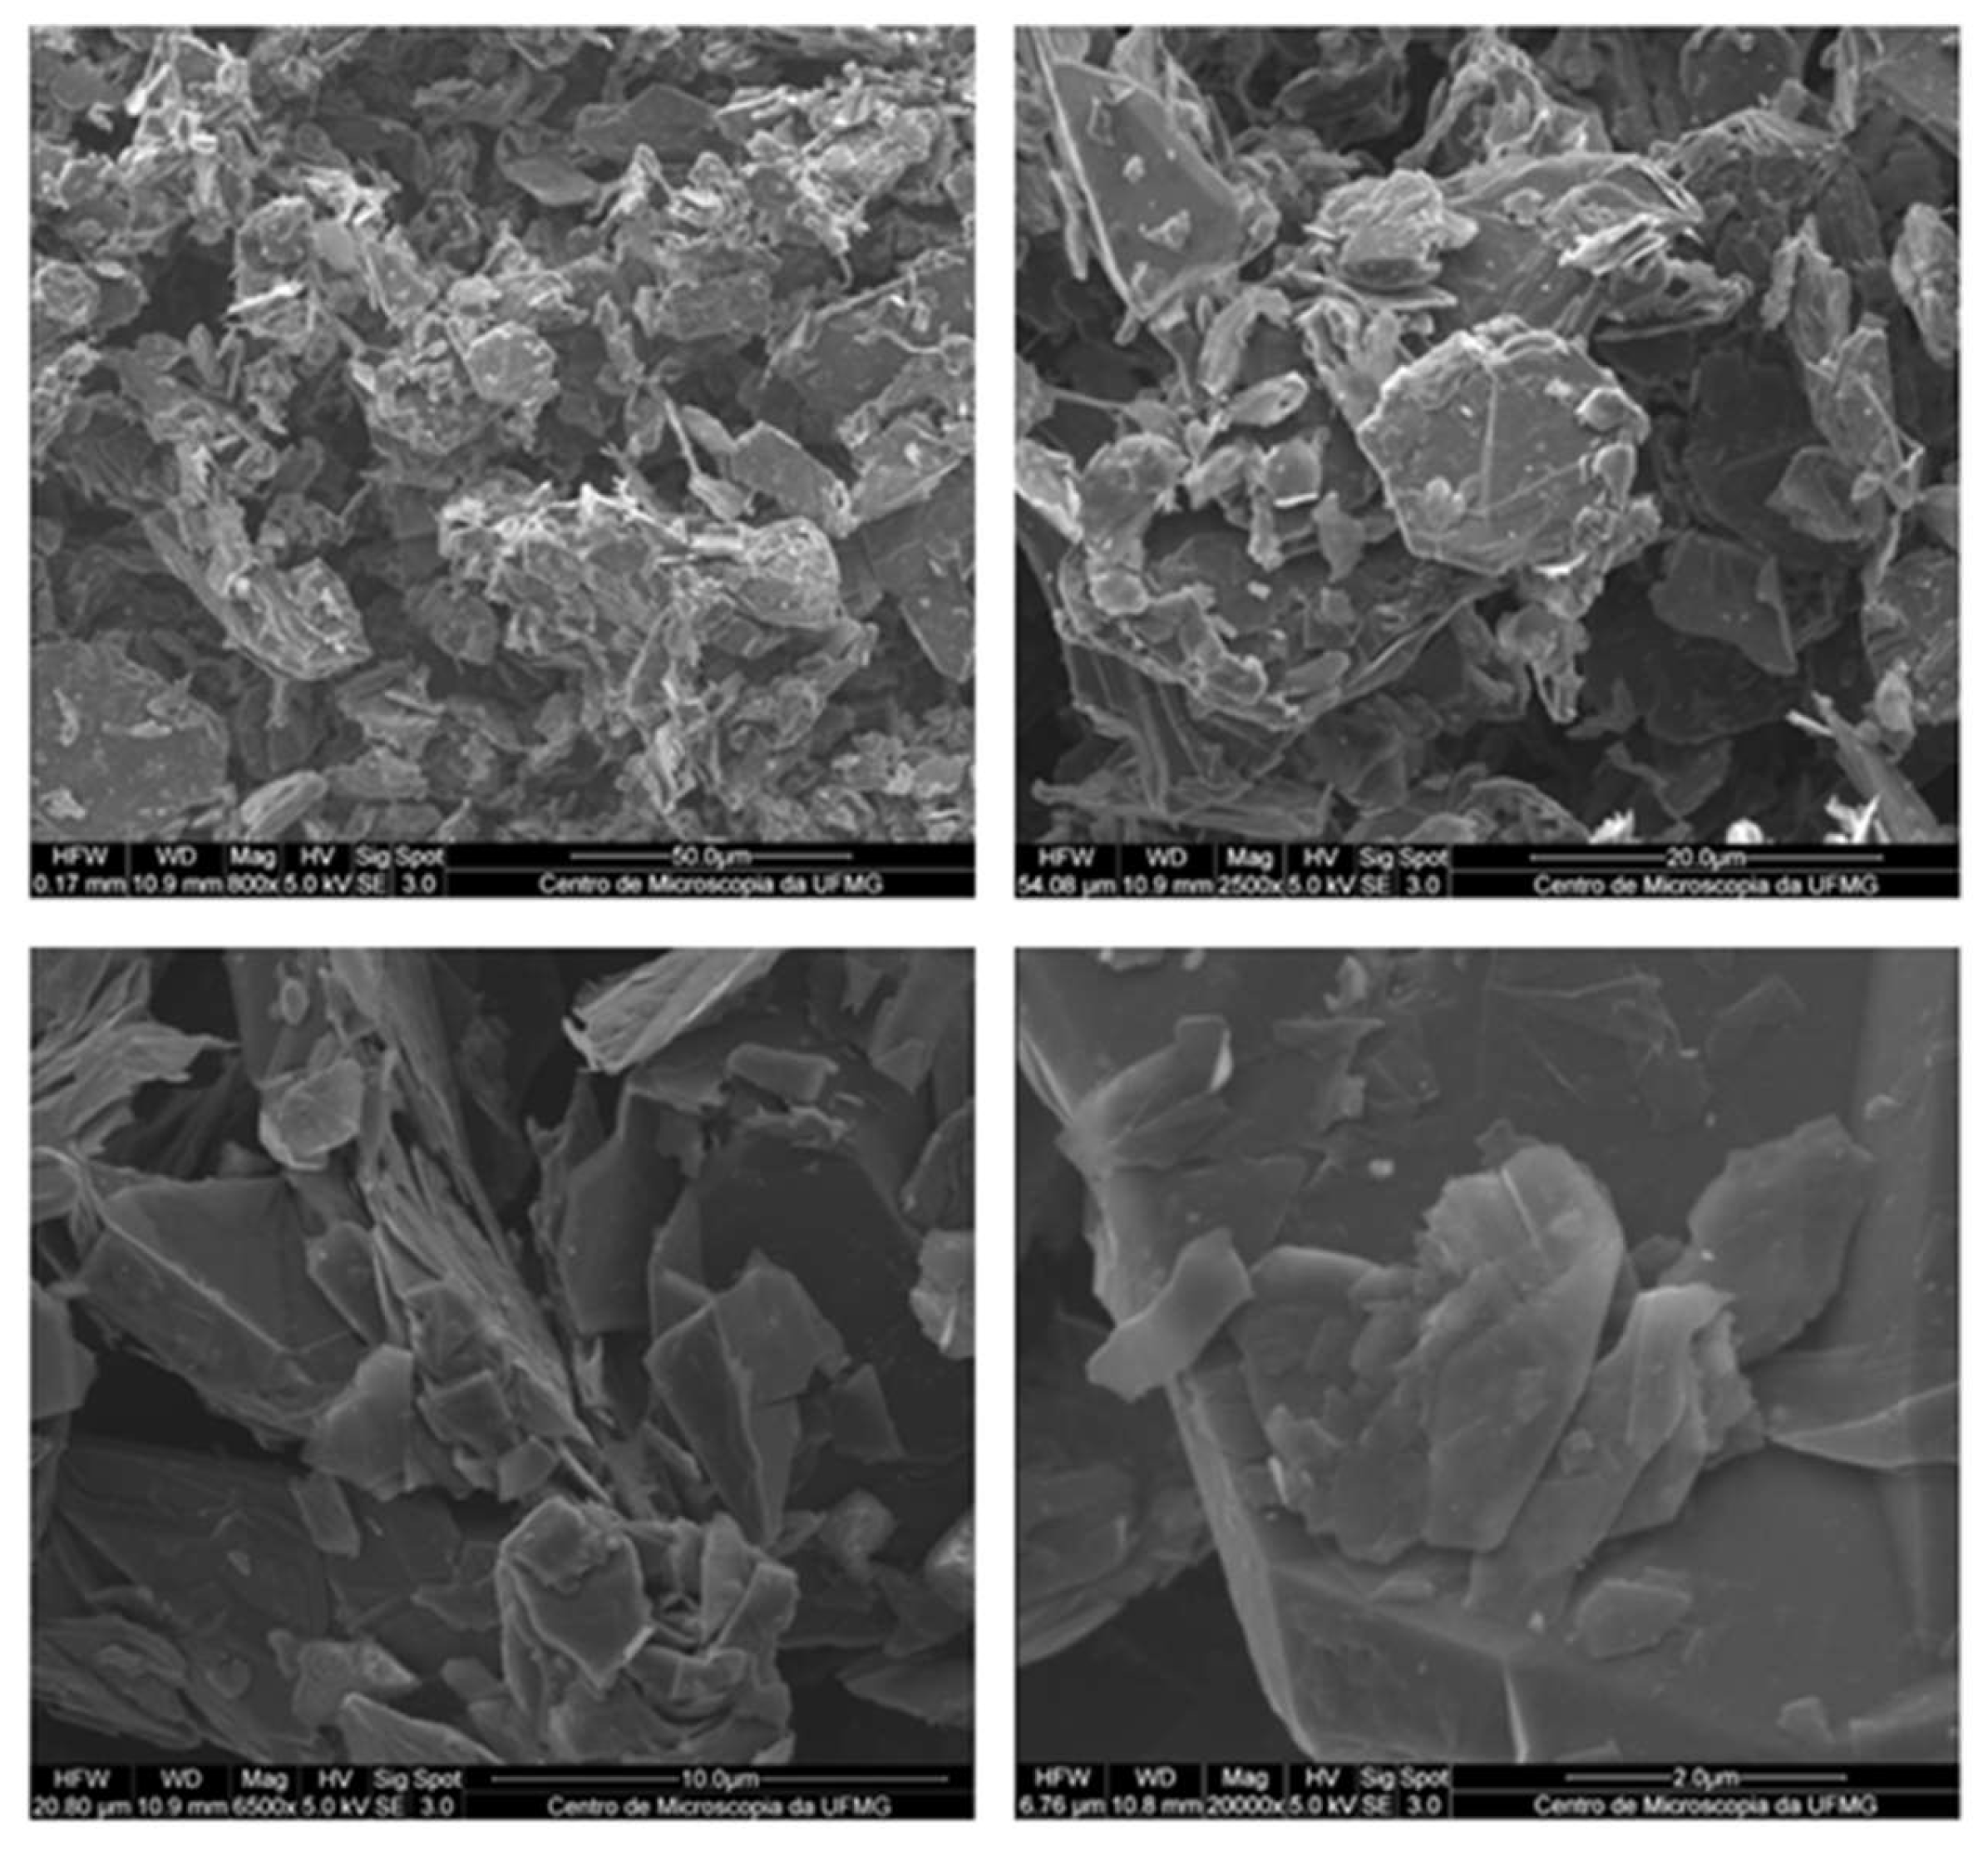
Figure 4.
Viscosity of the additives L66_1 and L66_2.
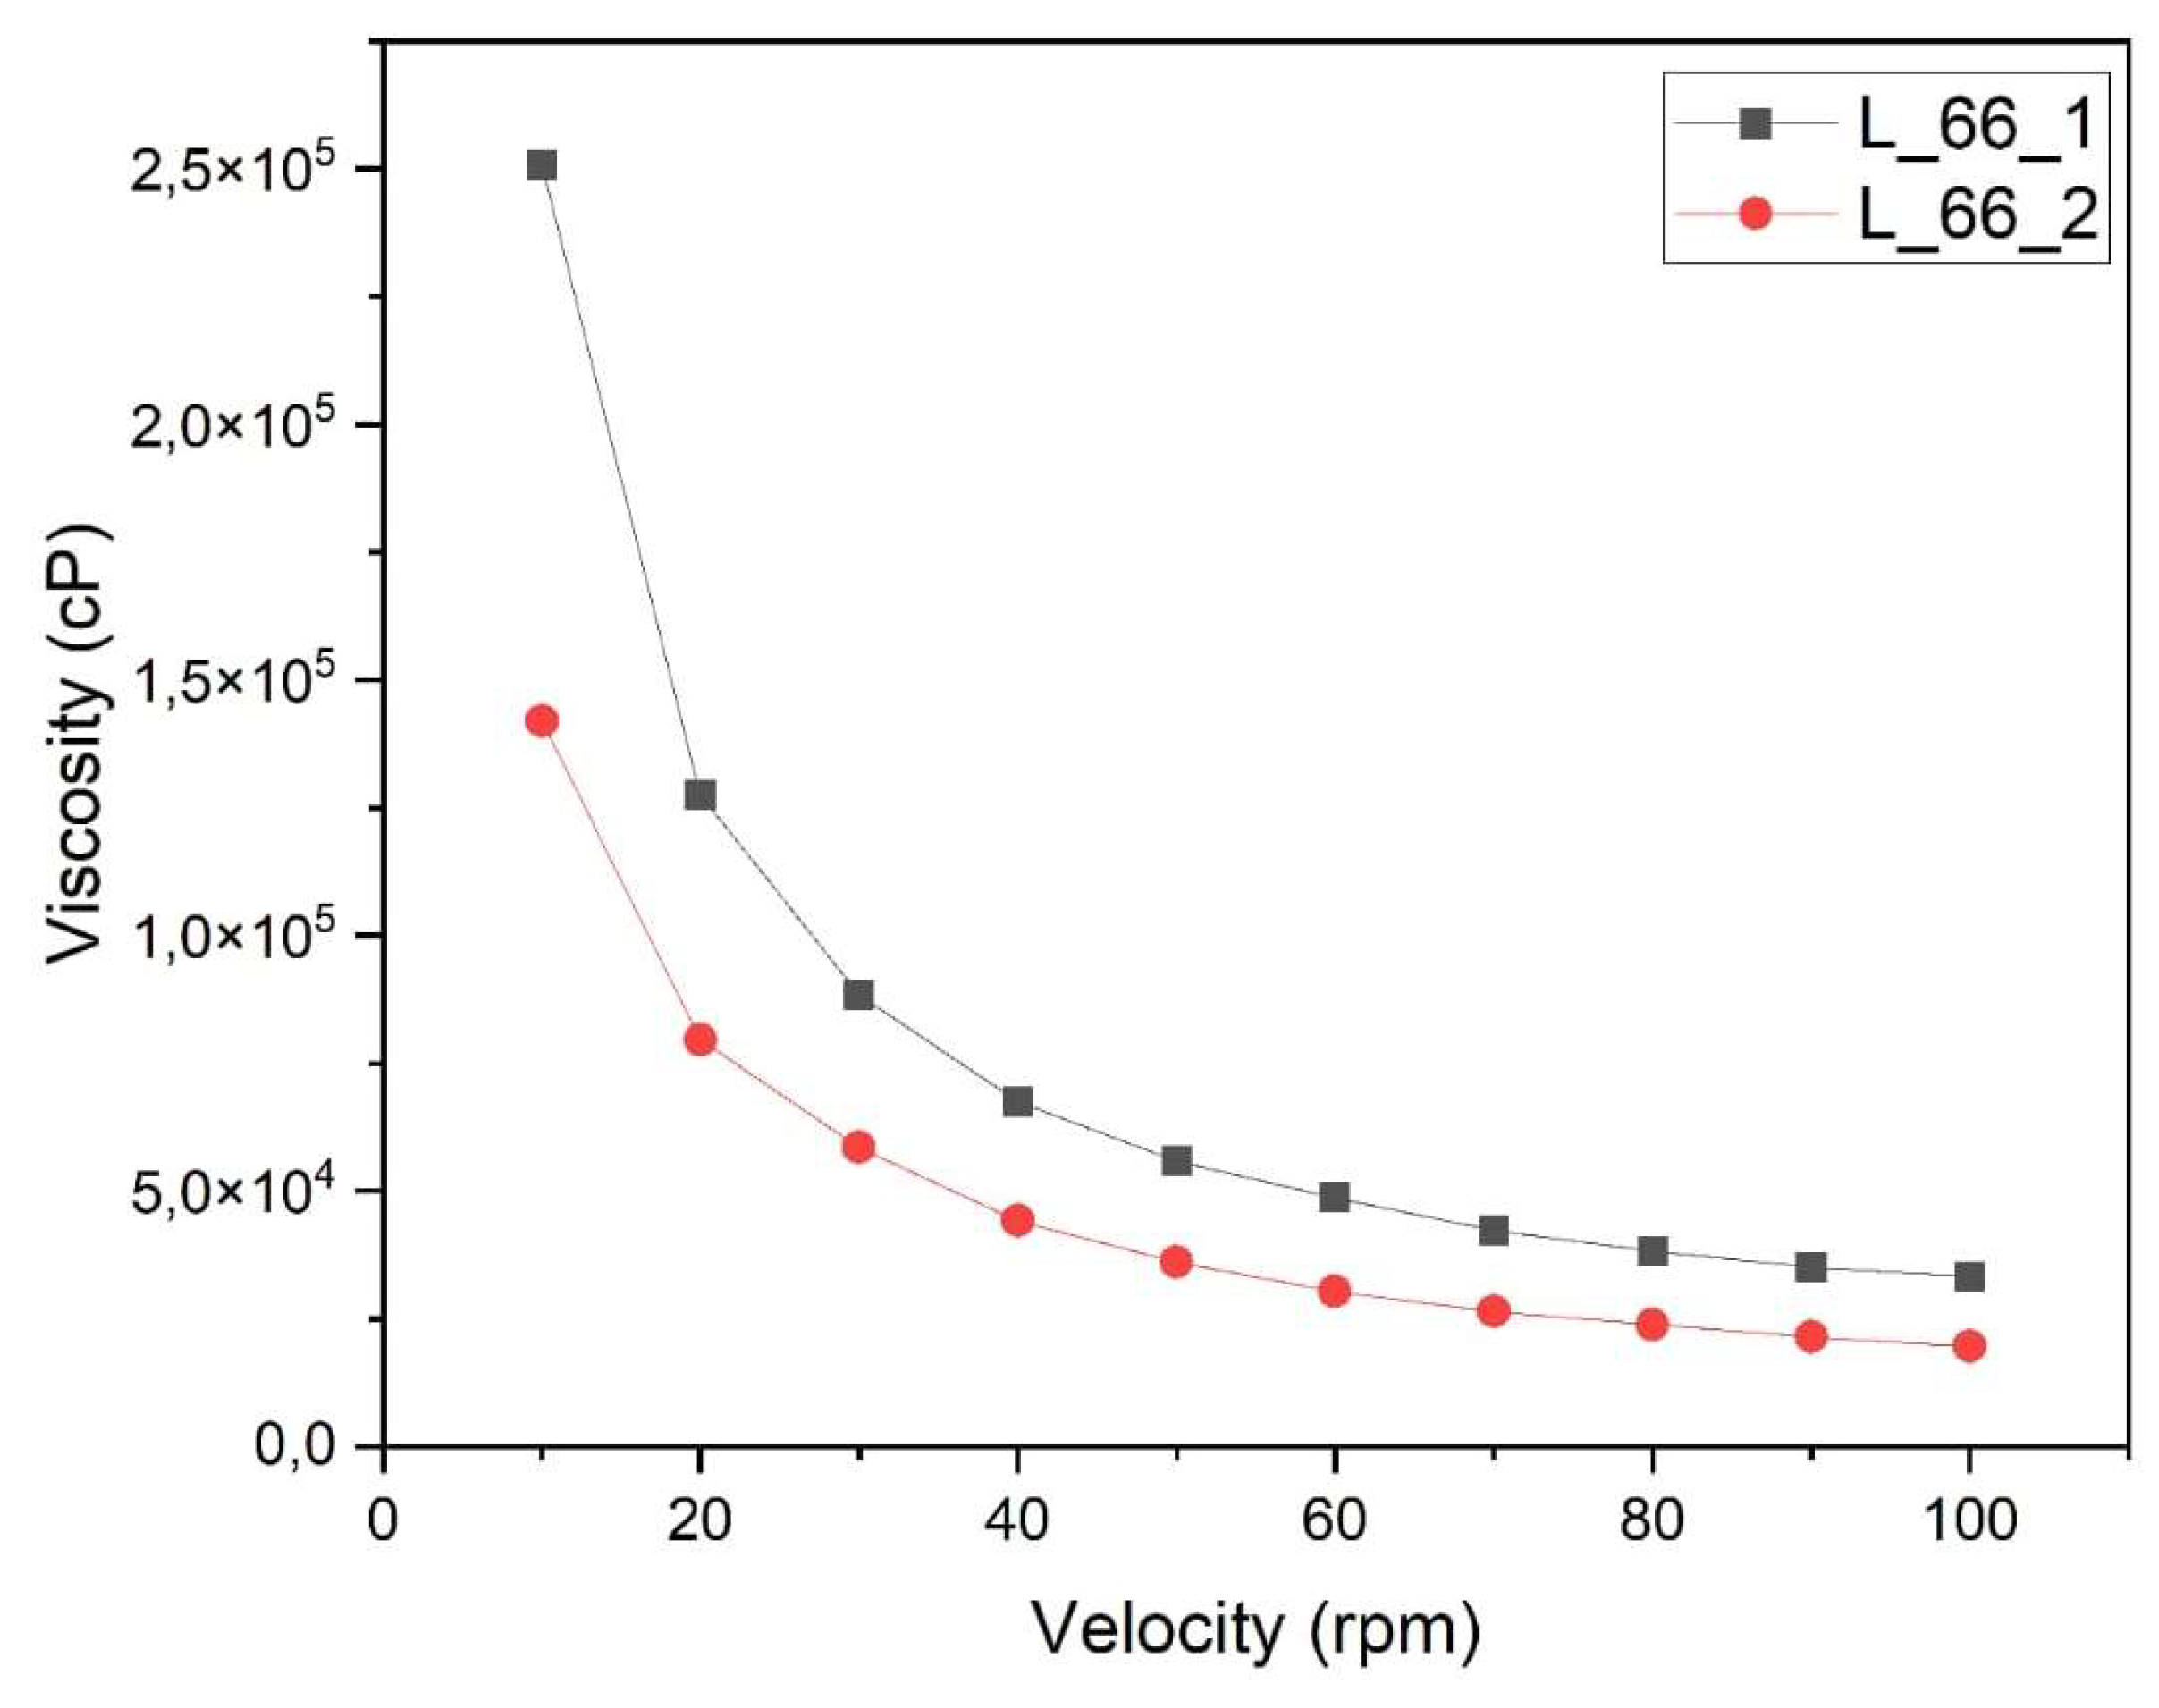
Figure 5.
L66_1 on 0W20 a) as new, b) after 10 days c) after 20 days,.
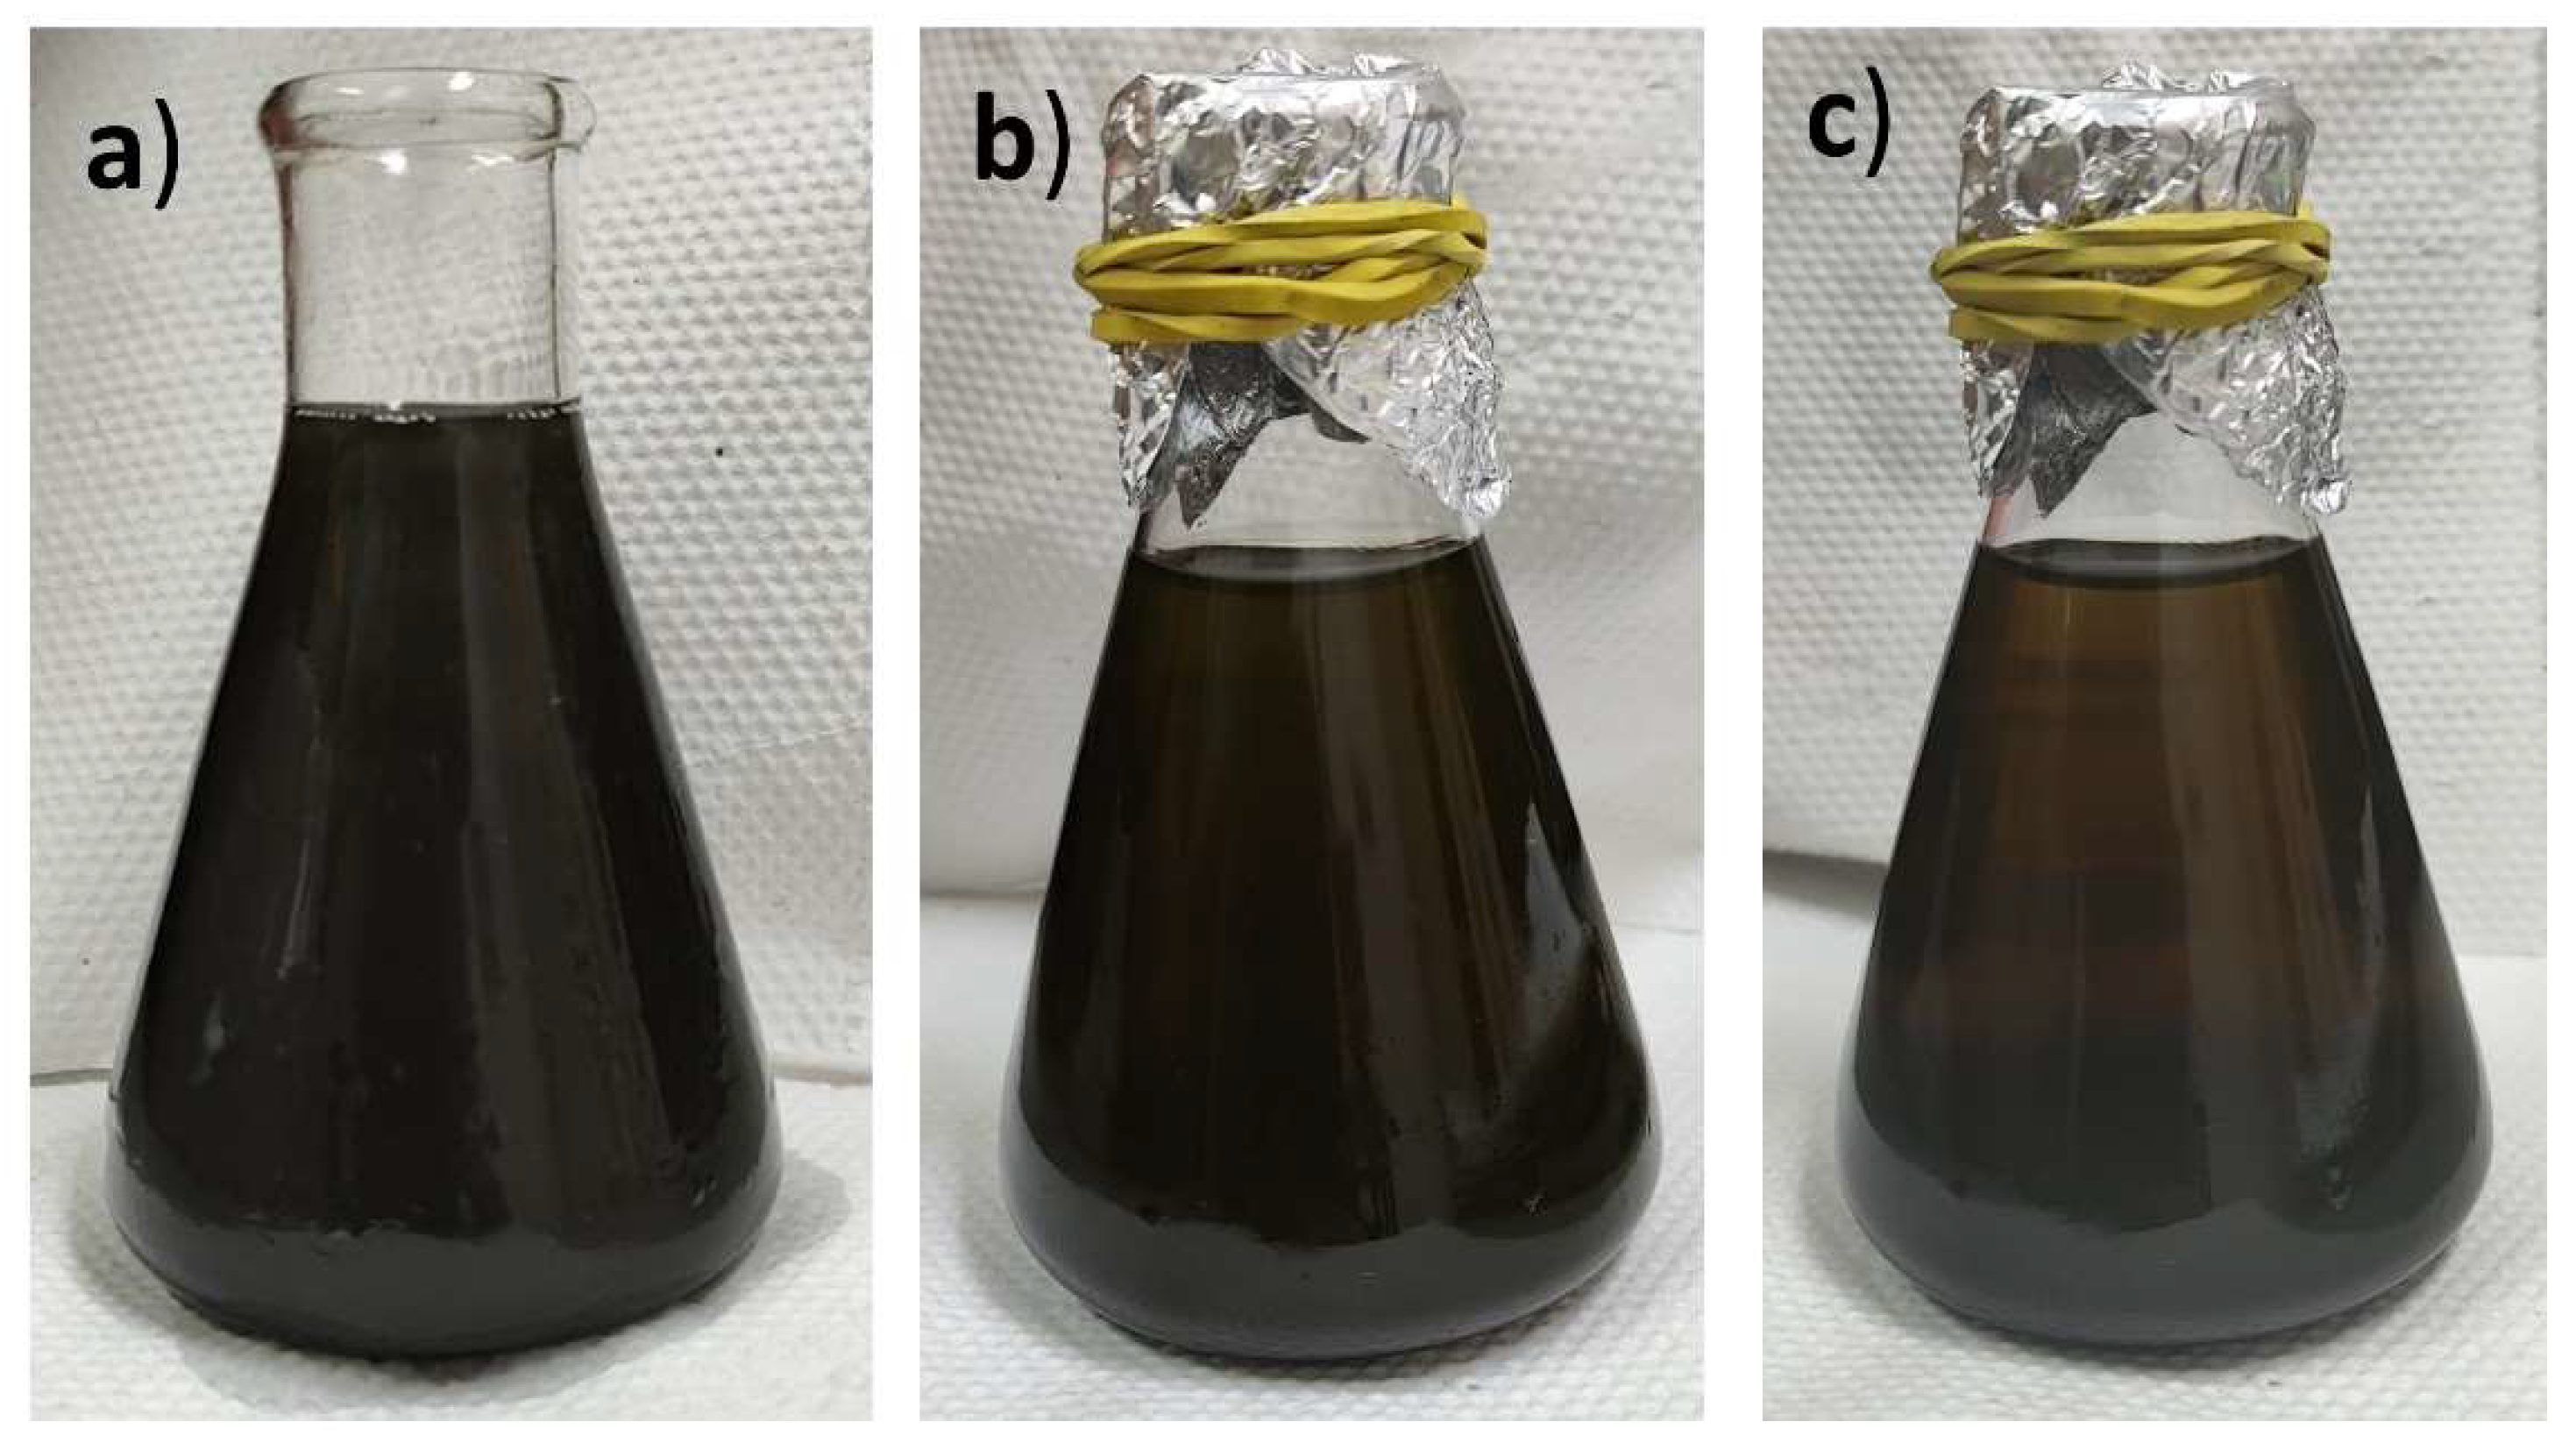
Figure 6.
NBR7024 chassis emissions test. Ph1 to Ph3 are identical to the FTP75 emission test.
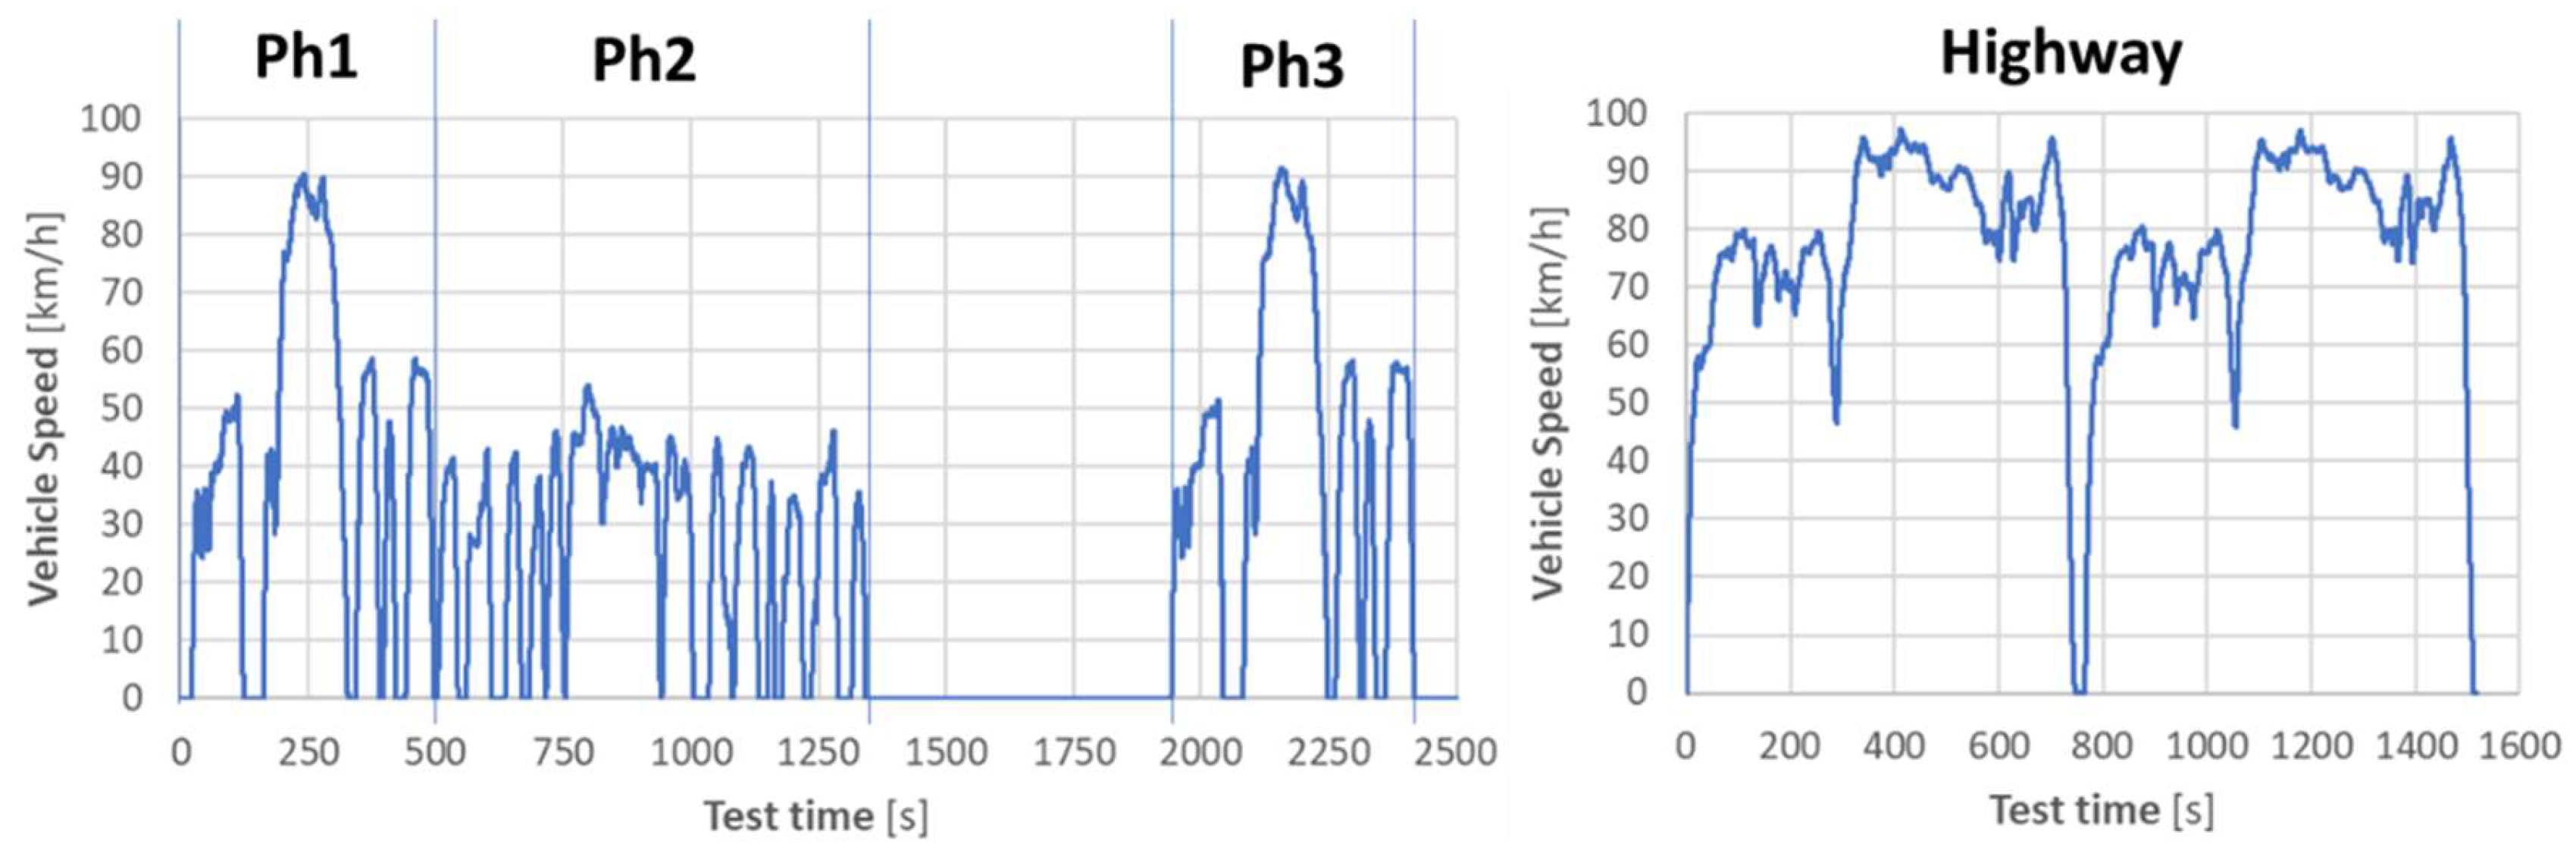
Figure 7.
Cycle average CoF.
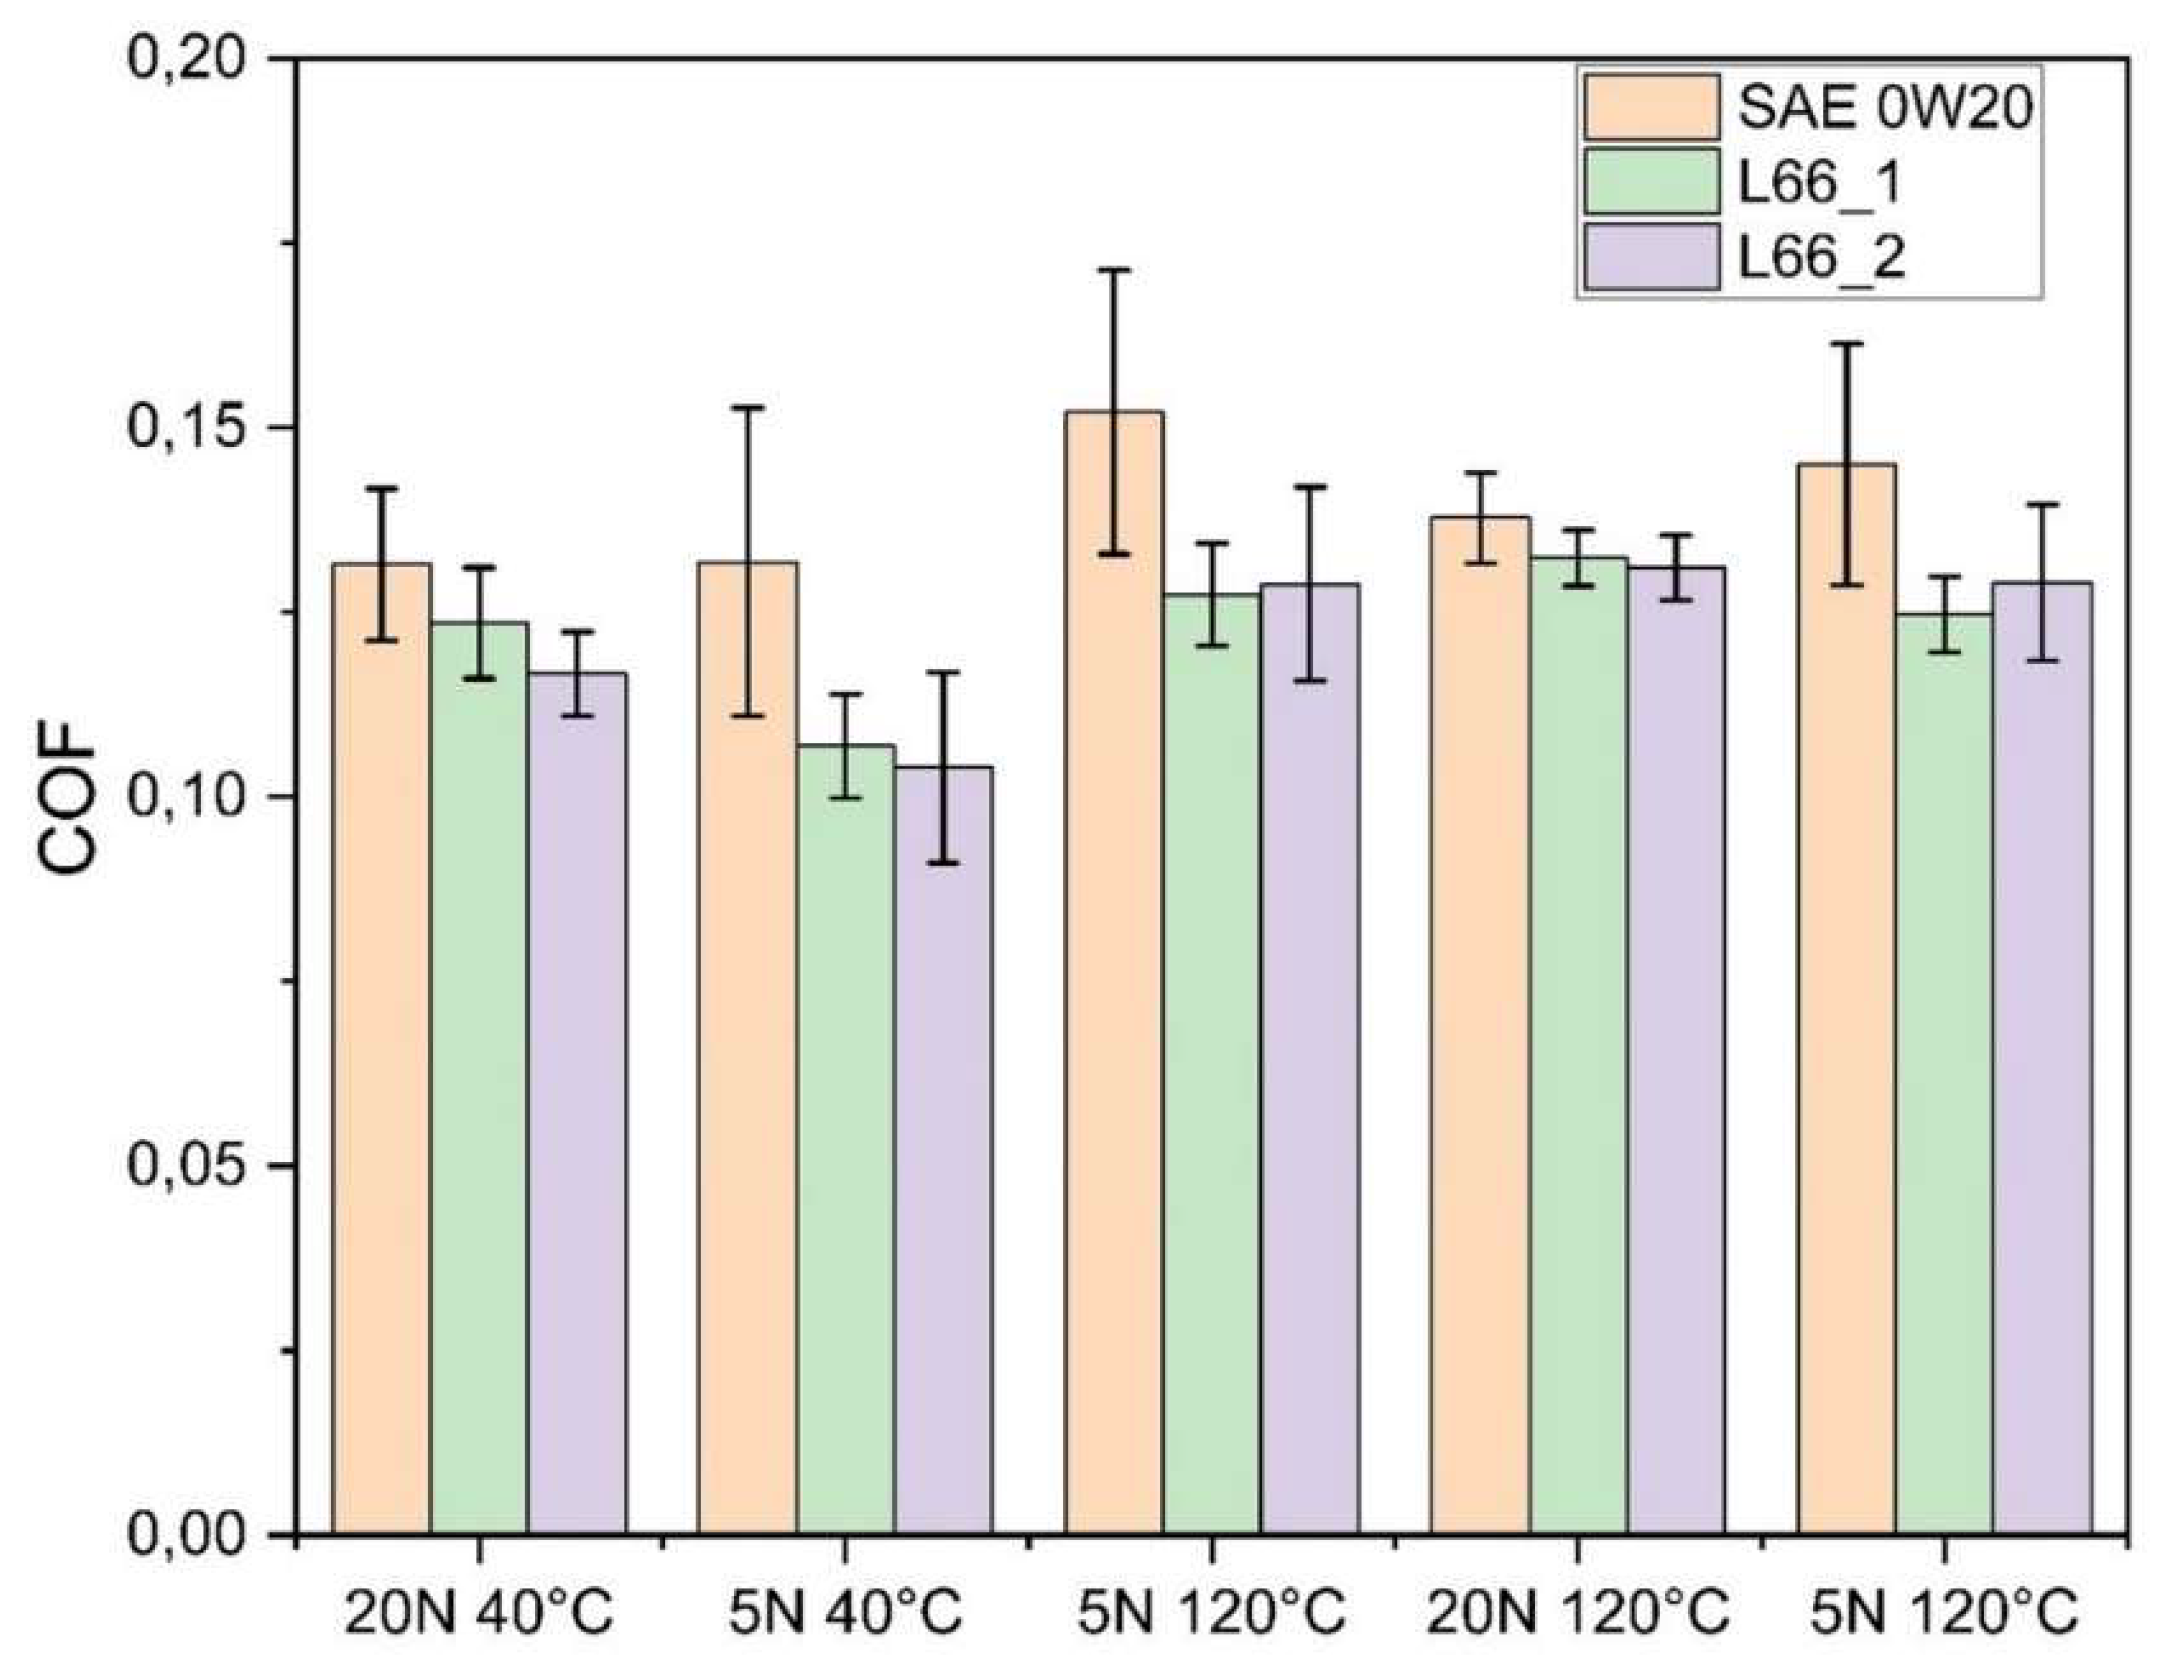
Figure 8.
friction force-Displacement curves for the steps with 20N of applied load. (a-b), reference oil 0W-20m (c-d) with L66_1, (e-f) with L66_2.
Figure 8.
friction force-Displacement curves for the steps with 20N of applied load. (a-b), reference oil 0W-20m (c-d) with L66_1, (e-f) with L66_2.
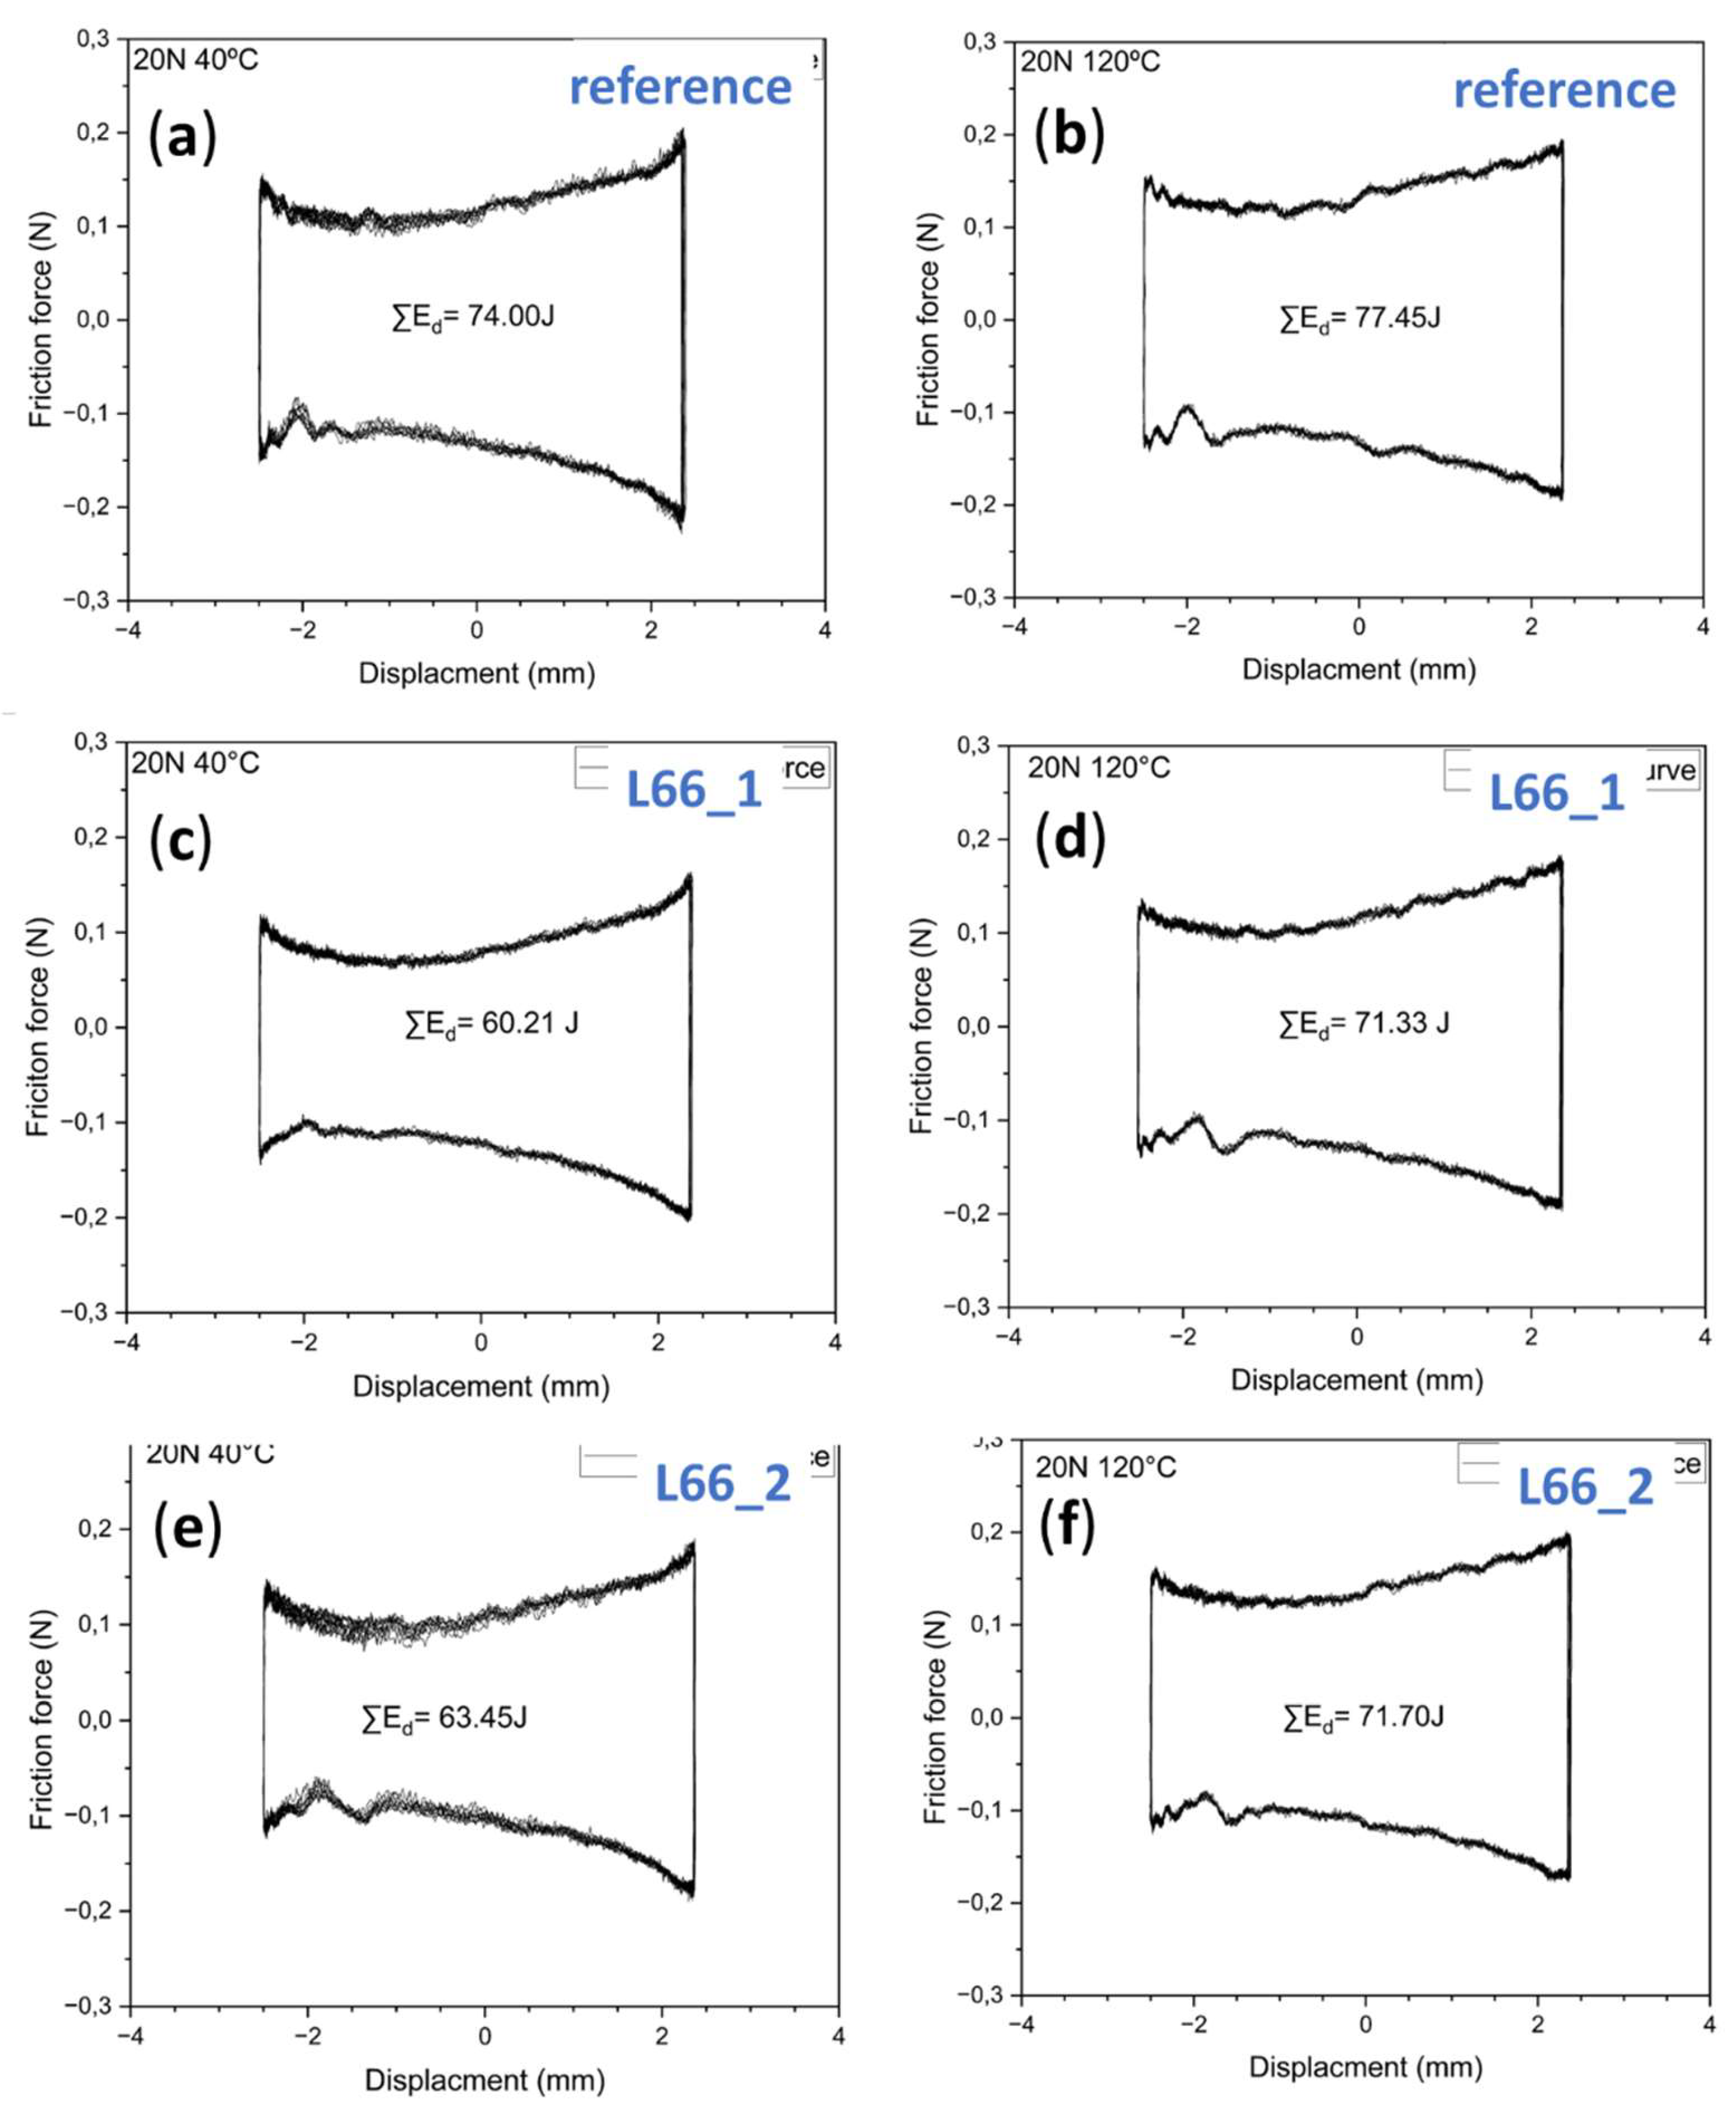
Figure 9.
Dissipated Energy on the reciprocating tests.
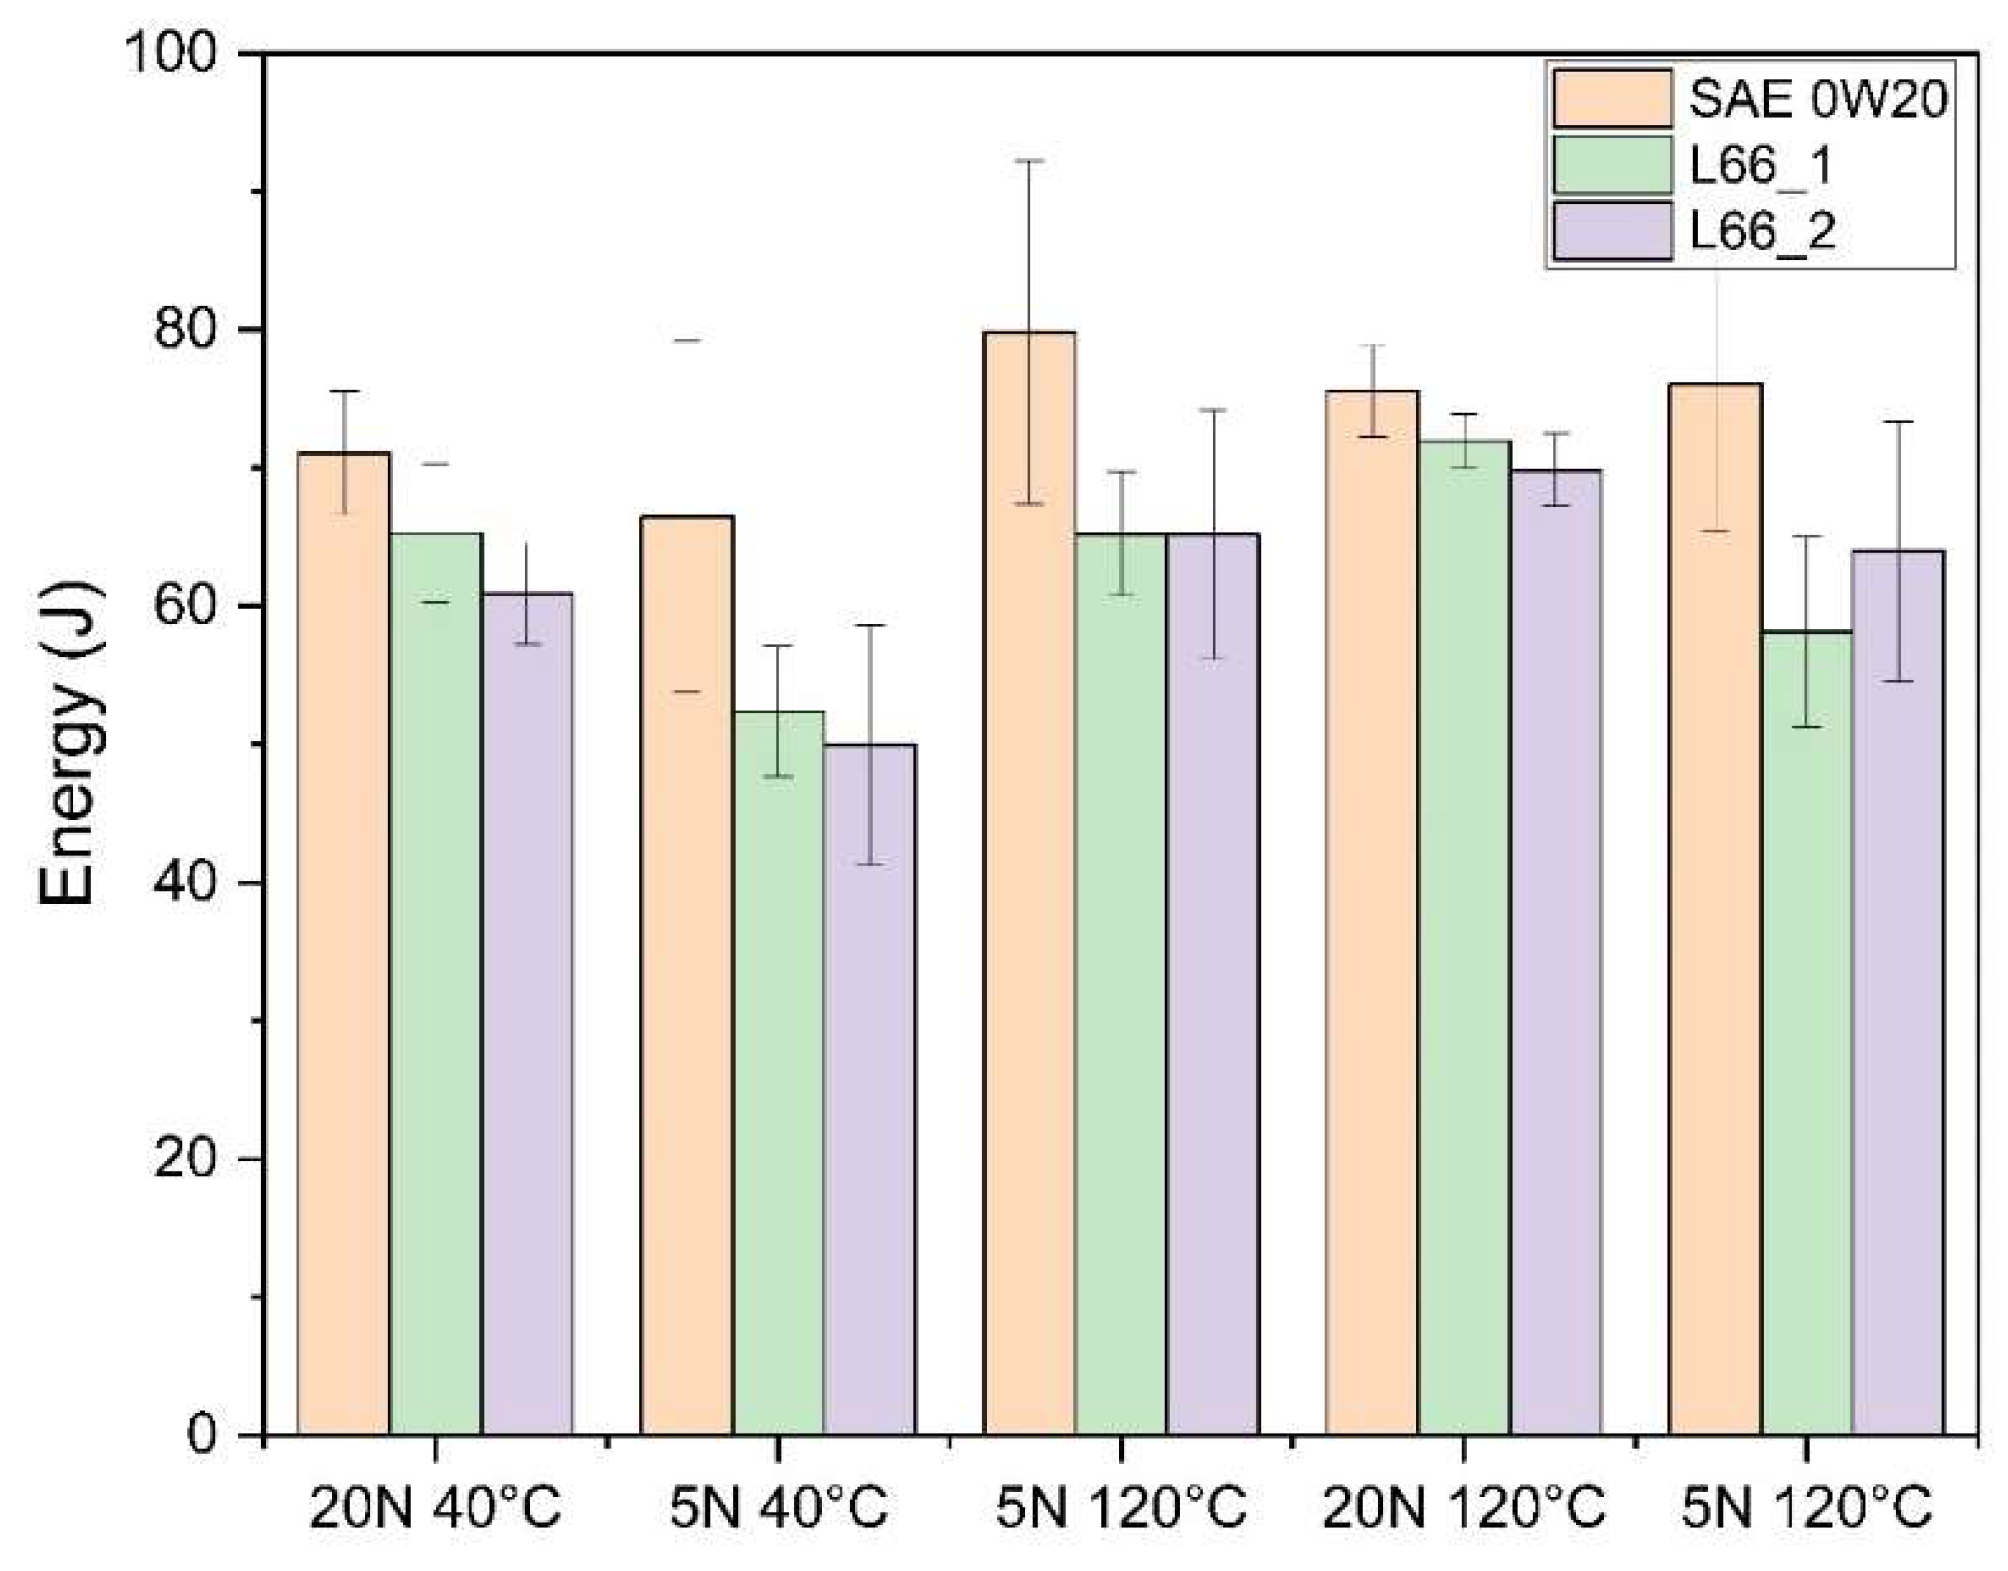
Figure 10.
Delta fuel consumption with the L66_2, 0.1% GNP on the different test steps.
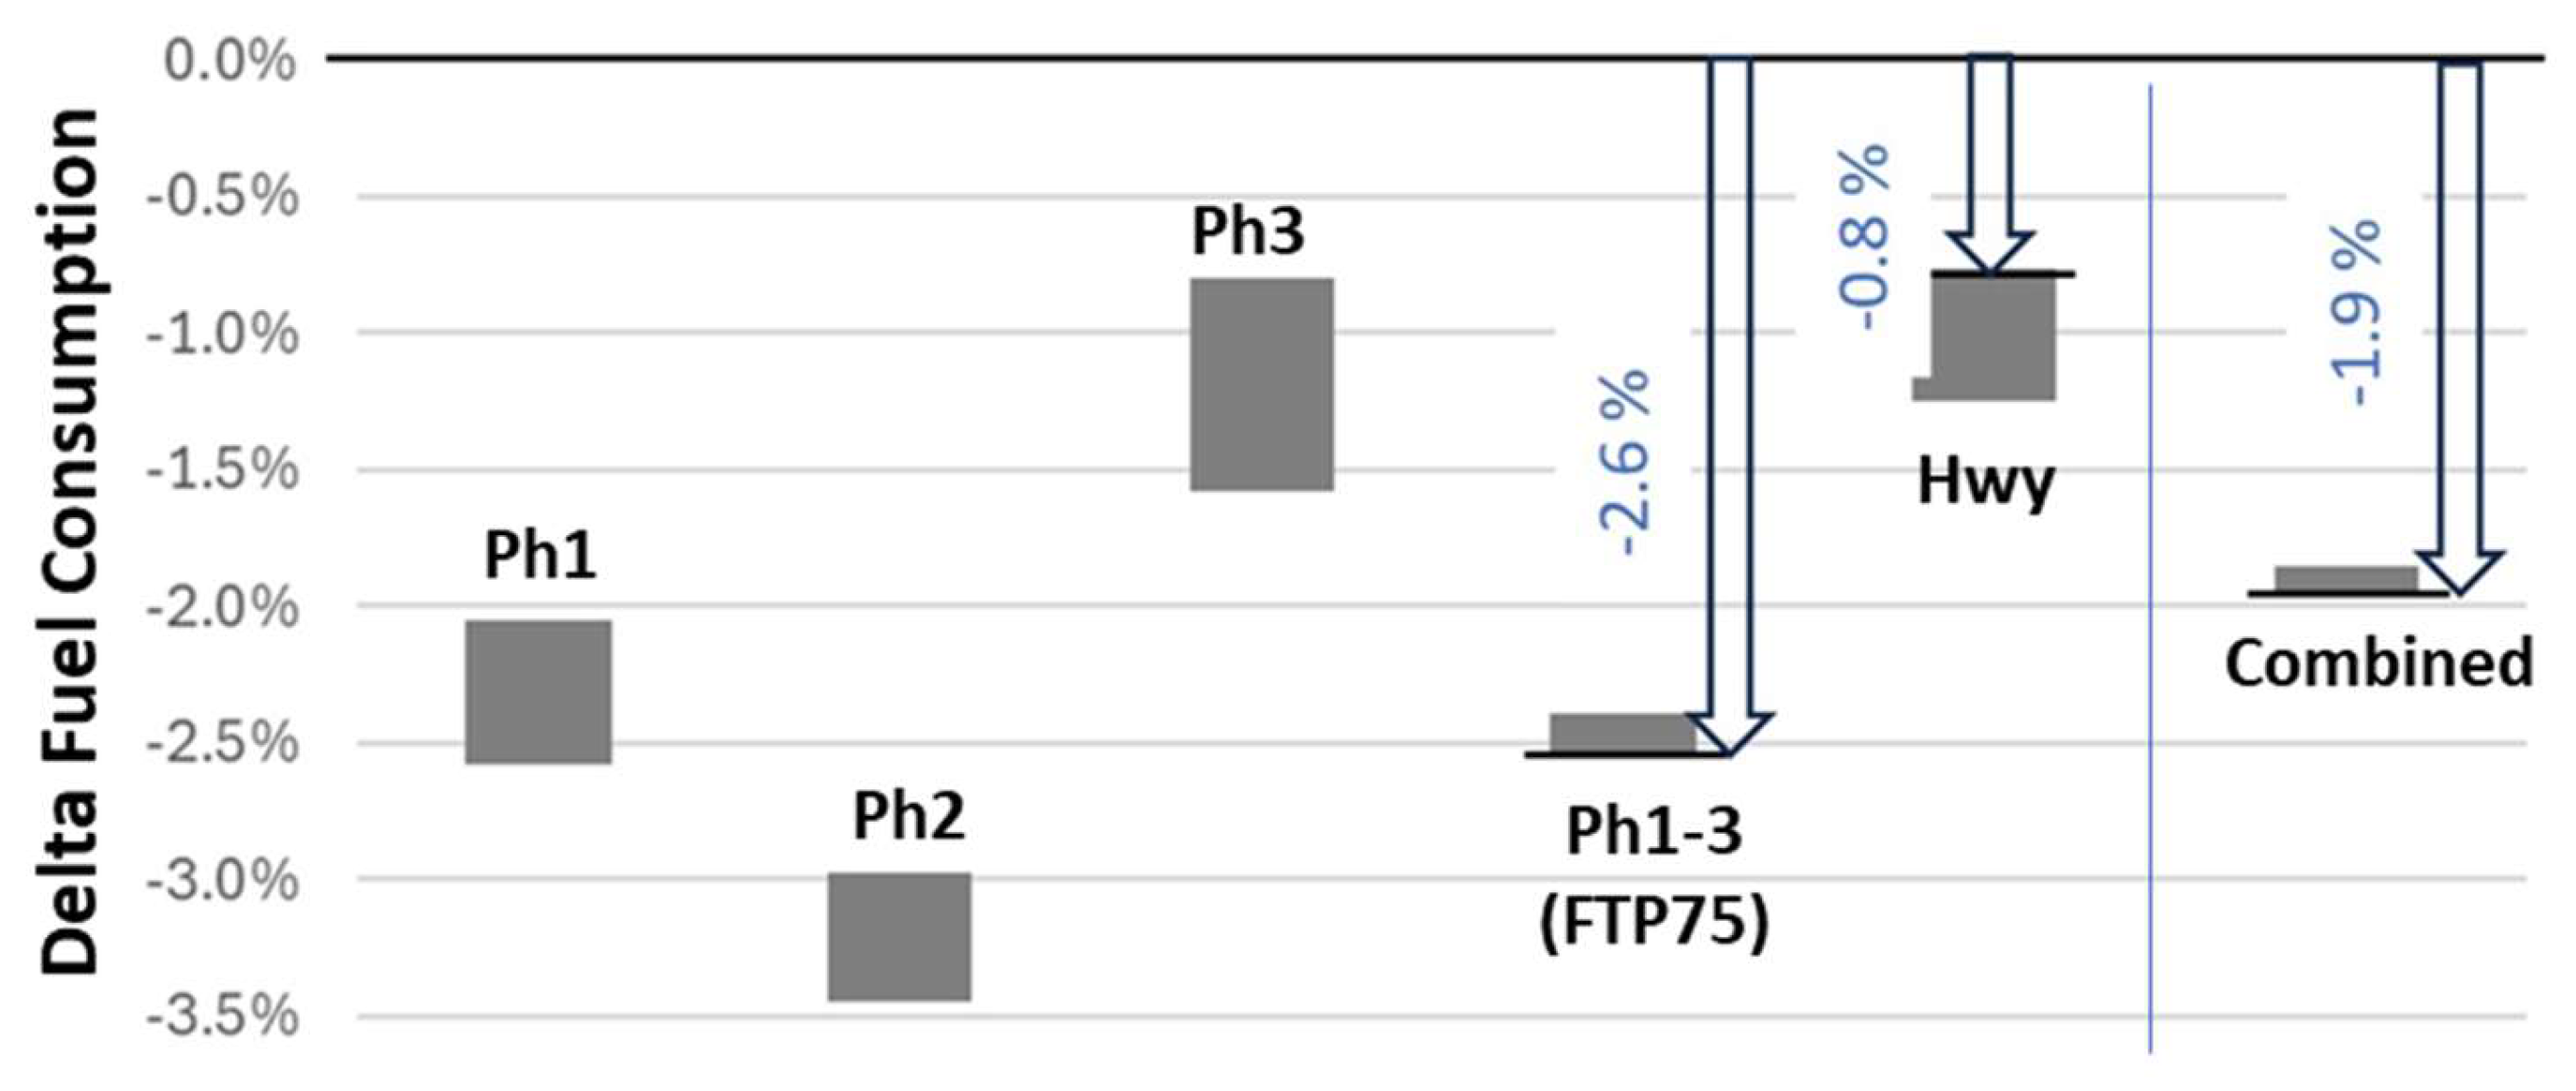
Figure 11.
Oil temperature along the test.
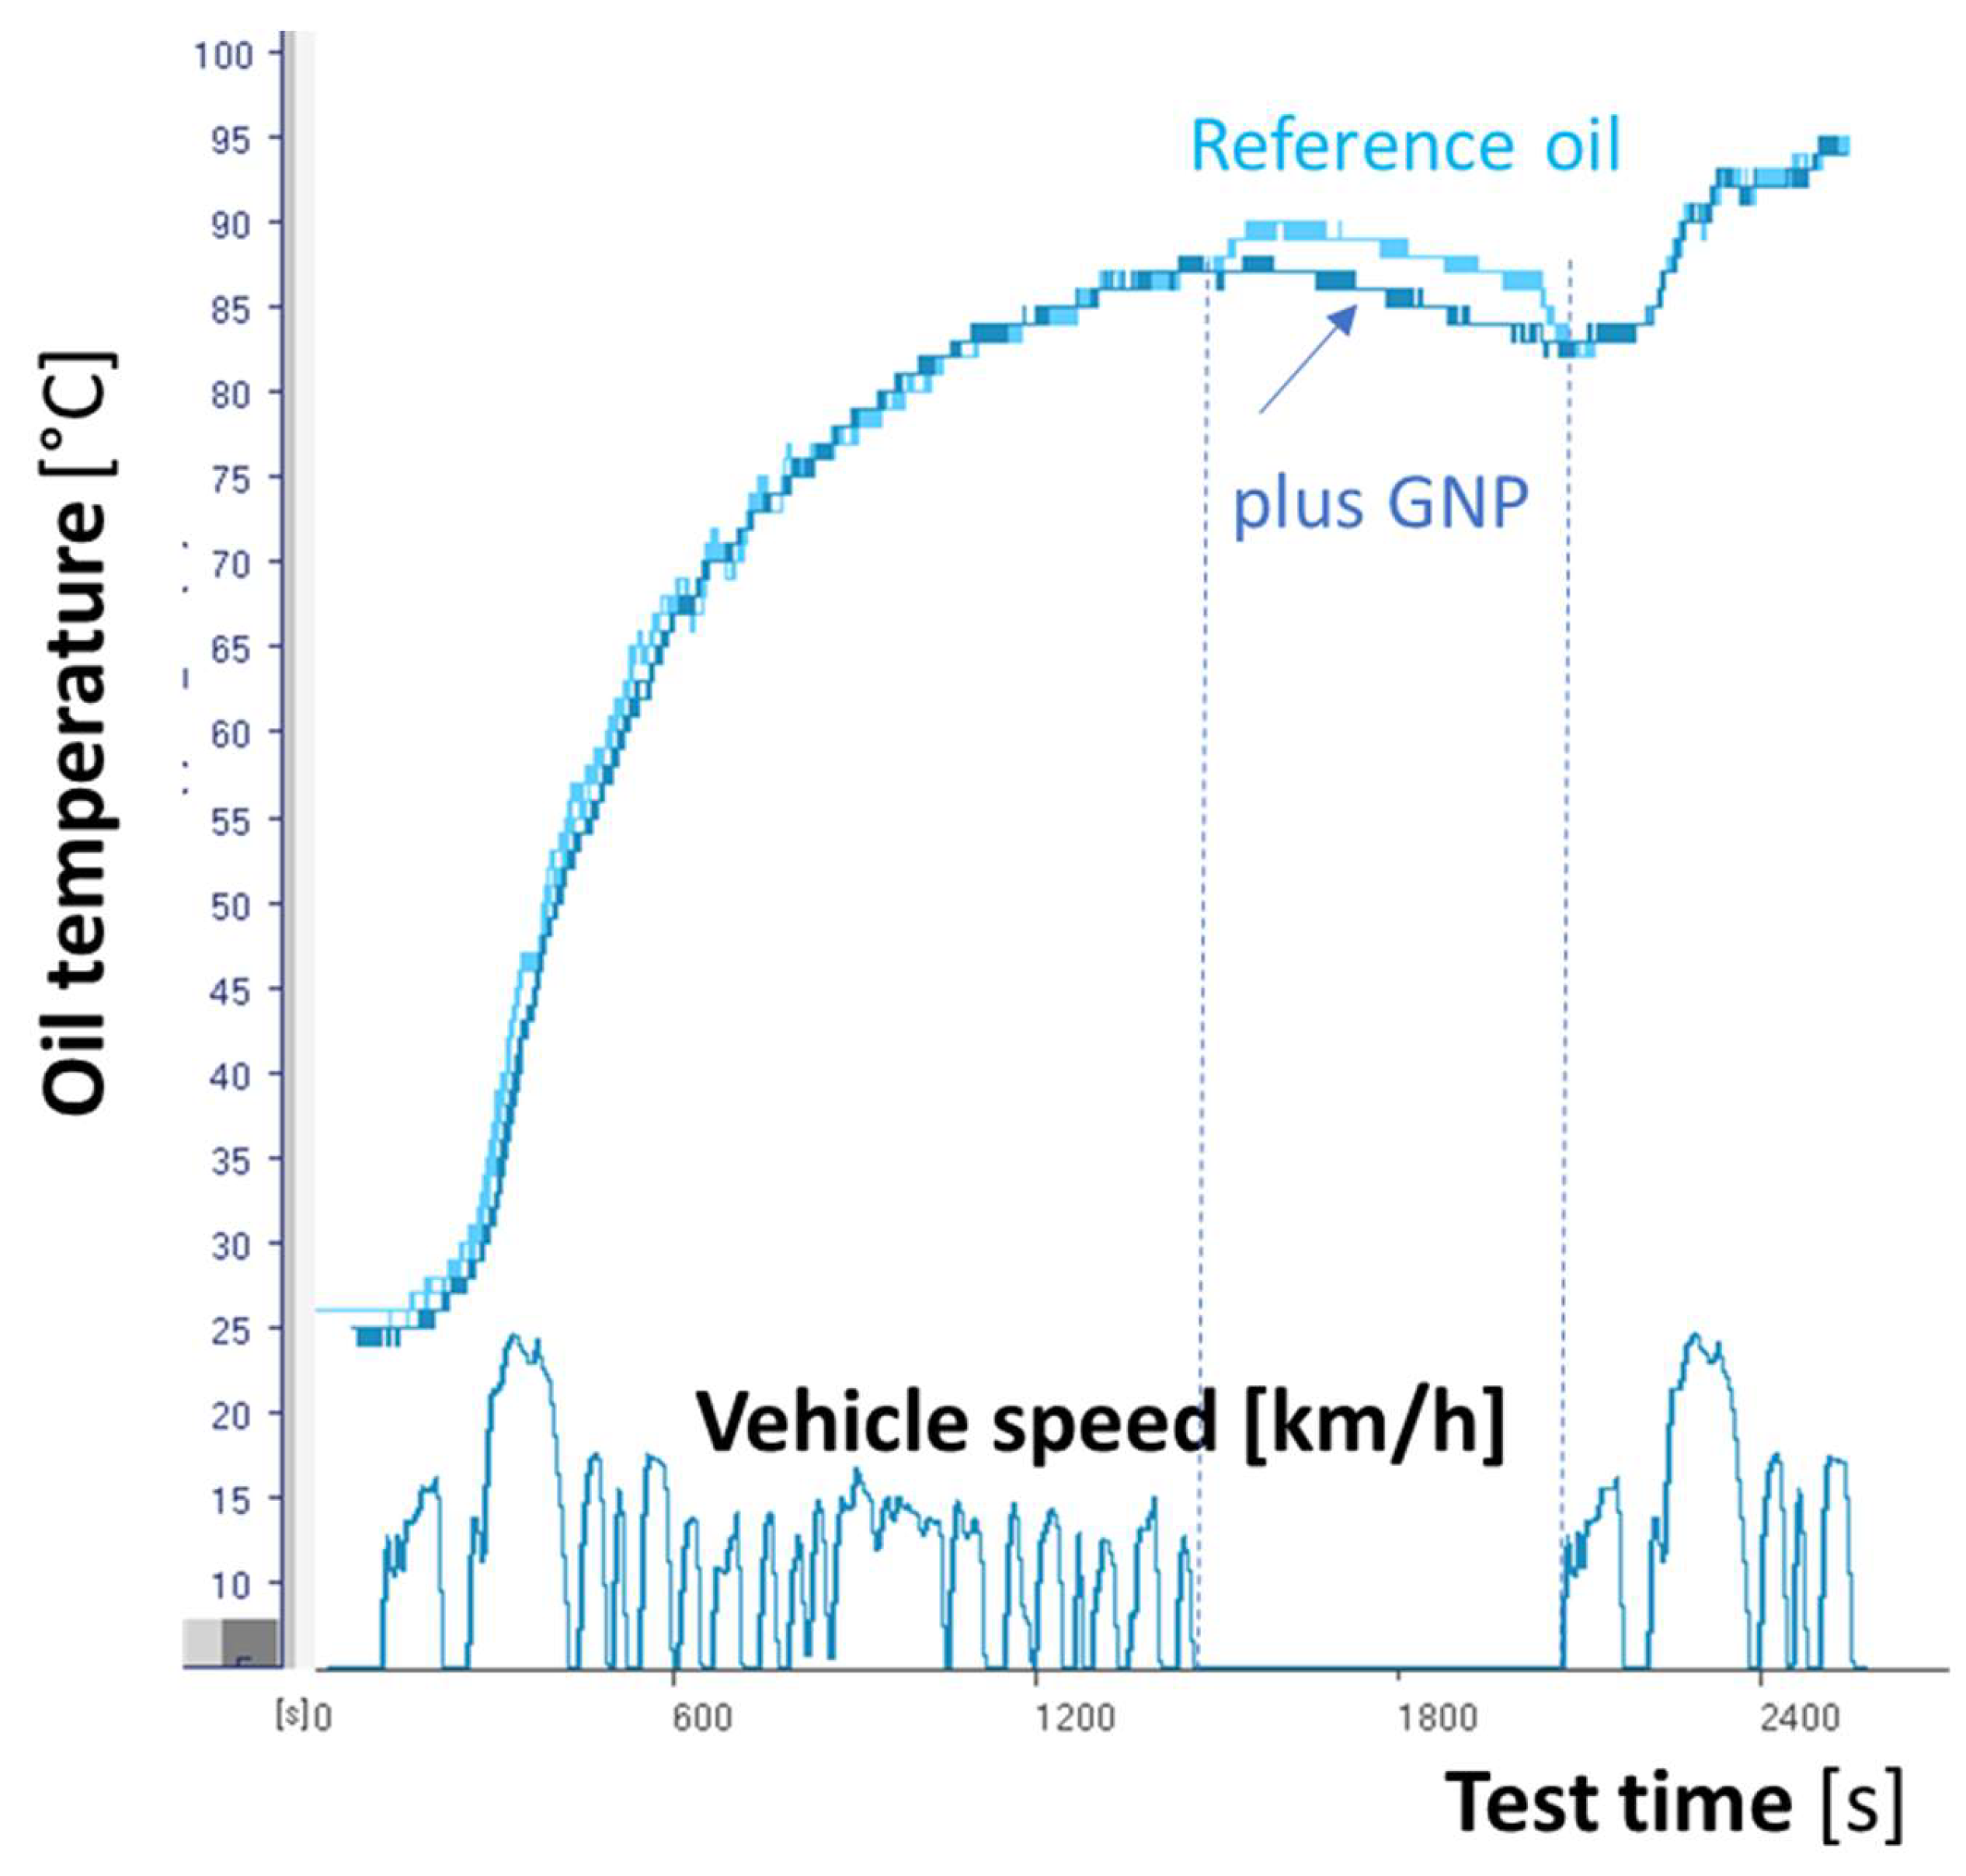
Table 1.
GNP characterization.
| Characteristic | unit | Mean | Q90 |
|---|---|---|---|
| Number of layers - <N>2D (nm) | - | 9 | 11 |
| Surface density of point defects - nD | 1010 cm-2 | 2.8 | 4.3 |
| Lateral size - La | nm | 71.1 | 99.4 |
| D to G peak intensity ratio (ID/IG) | 0.28 | 0.44 | |
| Percentile of volume-based particle size distribution | 9.6 (D50) | 19.3 (D90) |
Table 2.
– SRV sample parameters.
| Sample | Diameter (mm) | Material | Hardness (Hv) | Young Modulus (GPa) | Poisson Ratio | Roughness Sa (µm) |
|---|---|---|---|---|---|---|
| Ball | 10 | AISI 52100 | 813 + 6 | 210 | 0.3 | 0.042 + 0.004 |
| Disc | 24 | AISI H13 | 615 | 210 | 0.3 | 0.012 + 0.002 |
Table 3.
Tribological test procedure.
| Parameter | Unit | |||||
|---|---|---|---|---|---|---|
| Temperature | °C | 40 | 120 | |||
| Load | N | 20 | 5 | 5 | 20 | 5 |
| Max. Hertzian Pressure | GPa | 1.2 | 0.5 | 0.5 | 1.1 | 0.5 |
| Stroke | mm | 5 | ||||
| Frequency | Hz | 5 | ||||
| Duration | min/per step | 15 | ||||
Disclaimer/Publisher’s Note: The statements, opinions and data contained in all publications are solely those of the individual author(s) and contributor(s) and not of MDPI and/or the editor(s). MDPI and/or the editor(s) disclaim responsibility for any injury to people or property resulting from any ideas, methods, instructions or products referred to in the content. |
© 2024 by the authors. Licensee MDPI, Basel, Switzerland. This article is an open access article distributed under the terms and conditions of the Creative Commons Attribution (CC BY) license (http://creativecommons.org/licenses/by/4.0/).
Copyright: This open access article is published under a Creative Commons CC BY 4.0 license, which permit the free download, distribution, and reuse, provided that the author and preprint are cited in any reuse.


