
Submitted:
09 December 2024
Posted:
10 December 2024
You are already at the latest version
Abstract
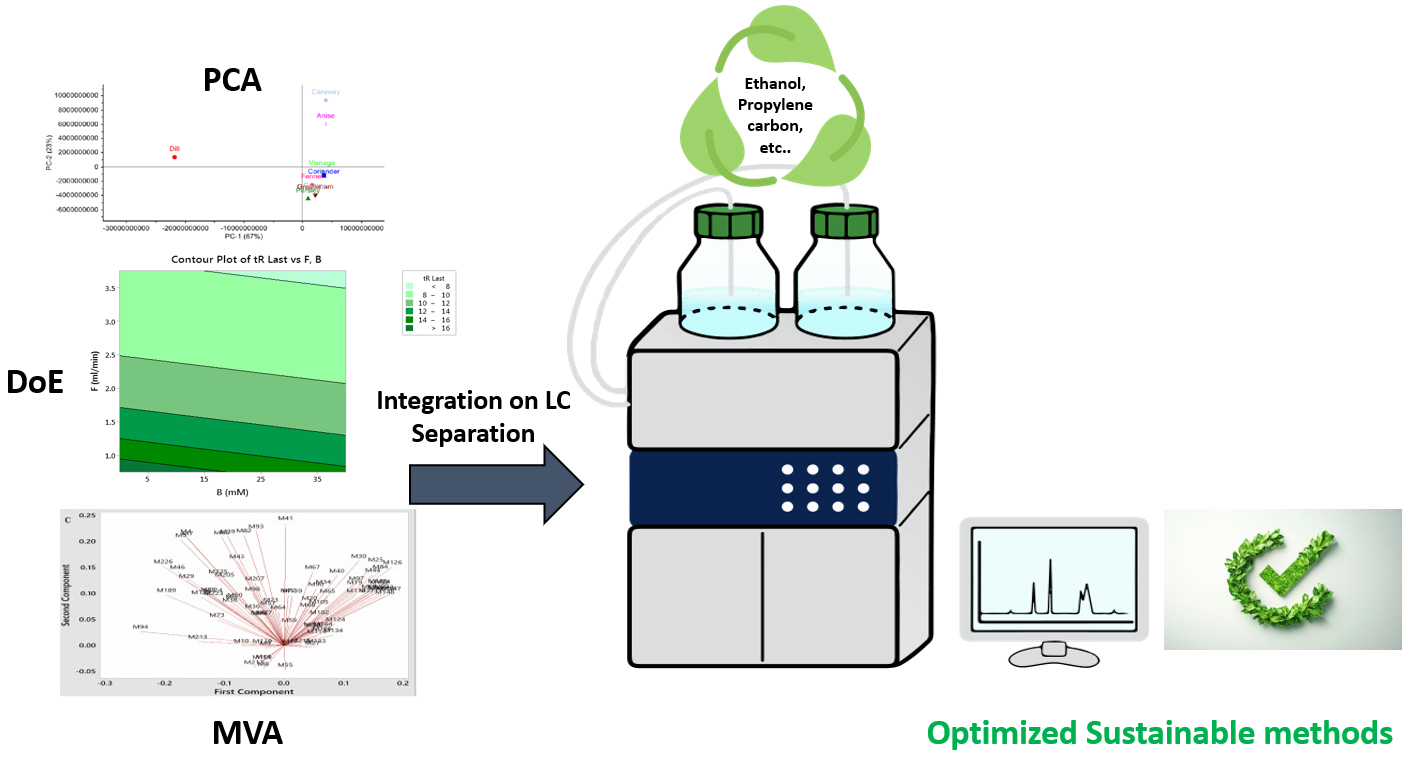
Chemometrics, which applies mathematical and statistical methods to aid experimental design, data analysis, and process optimization, is gaining more importance. It plays an important role in enhancing the sustainability of analytical methods when integrated with green analytical chemistry. Applying chemometrics to liquid chromatographic methods can speed up the analytical method, saving time, energy, and solvent consumption. This would be reflected by a low energy footprint and environmental impact. This review briefly discusses the application of chemometric methods like multivariant data analysis, design of experiment, retention time prediction, and peak deconvolution in green liquid chromatographic analysis of pharmaceuticals. The integration of chemometrics in sustainable chromatographic analysis will continue to revolutionize the field and further whitening analytical methods with better performance.
Keywords:
Chemometrics
; Green analytical chemistry
; Sustainability
; Liquid chromatography
1. Introduction
Chromatography is highly consumed by the chemical community worldwide as a result of its enormous benefit to pharmaceutical industries. Pharmaceutical industries are considered the chief consumers of Liquid Chromatography on both levels, their analytical and research laboratories. On the other hand, continuous advancements in chromatography are highly necessary to improve its capabilities and applicability in serving the heavy consumption and challenges of the pharmaceutical industry. Thus, considerable improvements are achieved by the manufacturers of stationary phases, instrumentation, and software aiming at solving problems raised by the pharmaceutical industry. Those challenges include; method development, chemical purity of drug substances, starting materials as well as critical intermediates. Additionally, High pressure liquid chromatography (HPLC) is used in formulation testing as well as studying the degradation products in stability-indicating assays (either due to deficient manufacturing or intentionally done in forced degradation assays) [1,2,3]. However, the complexity of the samples and the stricter requirements are still thought-provoking against the continuous developments in chromatography. The new analytical tools can generate more and more complex data, which increases the difficulty of extracting useful information and deducing correct results, especially when multi-component samples are analyzed[4,5].
In addition, chromatography users are seeking new approaches to enhance the quality of separation as well as the required time and effort and importantly consumption of organic solvent and waste disposal. Liquid chromatography emits huge amounts of toxic waste that affects our environment and is considered a significant concern[6]. For those aims, chromatographers became aware of the benefits of the Computer-assisted method development over the conventional approaches that uses trial and error. Since the 1970s, computational power in analytical chemistry has appeared with the use of chemometrics. Chemometrics first appeared in 1971 under the Swedish word “kemometri” combining both terms chemistry and -metri. Three years later, chemometrics was first explained by the International Chemometrics Society[7,8] , chemometrics is defined by the IUPAC Gold Book as the application of statistics to the analysis of chemical data (from organic, analytical or medicinal chemistry) and design of chemical experiments and simulations[9]. In brief, applying chemometrics in modern analyses offers reliable qualitative as well as quantitative analysis by employing multivariate data processing algorithms. Thus, not only better understanding and extraction of the maximum information about the variability of the HPLC method is achieved, but also, optimum procedures for measurements are designed with the help of chemometrics [10,11,12].
Various chemometric strategies can be used in the chromatographic analysis of pharmaceuticals, namely, raw drug material, drug and its metabolite, commercial drug dosage form, herbal medicine and drug– food supplements, and active compounds in biological fluids. Chemometrics aims at extracting more useful information from signals such as spectra, chromatogram, and other several formats obtained from chemical instruments [13].
Chemometrics also helps in reducing the complex physical manipulations with samples and instruments. For instance; the use of chemometrics significantly aids in handling non-ideal analytical signals leading to the simplification of the complex sample preparation steps required before separation. Chemometrics can support the two cornerstone techniques in the pharmaceutical industry; spectrometry and chromatography to accomplish the rapid analysis with higher accuracy. In other words, chemometrically aided chromatographic models have been accomplished but also in UV-visible spectrophotometric and spectrofluorometric analyses techniques have been successfully implemented [14,15,16]. In all cases, chemometrics minimizes the consumption of non-environmentally friendly reagents and solvents leading to a greener analytical chemistry method. This complies with the raised awareness of the sustainability of analytical methods since analytical chemistry has a great ecological impact. Studies were able to measure the greenness impact when chemometric tools are applied in analytical procedures using numerical value [8].
As a multidisciplinary field, chemometrics applies mathematical and statistical principles to analyze chemical data thus, transforming raw data into knowledge for further understanding and conducting the chemical process. Chemometrics can support compliance of analytical methods with FDA and EMA regulatory agencies by ensuring method robustness, reliability, and validity [17,18,19,20].The integration of mathematical and statistical chemometrics methods in supporting the go green in liquid chromatography is a powerful tool to consider for stronger sustainability in analytical chemistry. In this review, the impact of applying chemometric methods for sustainable Liquid Chromatographic-Based Pharmaceutical Analysis will be discussed and the most common chemometric techniques (MDA, PCA, PLS, DoE and QSRR) will be described.
2. Discussion
Key principle chemometrics techniques to consider for enhancing the greenness of chromatographic methods include multivariant data analysis (MDA), design of experiment (DoE), Retention Time Prediction, and Peak Deconvolution. The principles provide mathematical and statistical tools for data analysis, experimental design, and process optimization to achieve analytical methods development, improvement and interpretation of results [21].
2.1. Multivariant Data Analysis (MDA).
MDA analyze complex data sets with multiple variables and is usually applied in liquid chromatographic analysis to help understand the relationship between different chromatographic parameters and to identify patterns in the data.
Multivariate analysis, for that matter, can be defined as a set of techniques useful in the analysis of datasets containing more than one variable. Such techniques usually turn out to be fruitful in pharmaceutical fields since analysts are allowed to extract meaningful information, perform regression, or classify data when variables are correlated. The improved computing power developments made it practical to apply such advanced methods in pharmaceutical product research and development. A specific example could be illustrated by the analysis of drug release profiles across different formulations of a pharmaceutical product, where multiple input factors such as excipient type, manufacturing process parameters, and environmental conditions could be simultaneously considered using multivariate techniques. This methodology assists in determining the ideal conditions of formulation, which produce the required characteristics of drug release [22].
The classification of multivariate techniques is informed by three important considerations that a researcher has to consider concerning their goals and the type of data involved:
- Can the variables be classified as independent and dependent?
- How many variables are taken to depend on an analysis?
- Are both the dependent and independent variables measured metric or nonmetric?
These issues are crucial in determining whether dependence or interdependence techniques are relevant for the analysis[22].
Multivariate Analysis, MVA, is a fundamental statistical technique that concurrently analyzes several variables to allow the study of complex relationships and the optimization of processes. Some techniques within the boundaries of this area will be further discussed in the article including Principal Component Analysis (PCA), Partial Least Squares (PLS), Cluster Analysis (CA), and Design of Experiments (DoE). These methodologies support dimensionality reduction, pattern recognition, and systematic experimental design, significantly enhancing the efficiency and accuracy of analytical procedures [23,24]. For example, PCA simplifies datasets into orthogonal components from correlated variables, maintaining variance for better interpretability. DoE structures experiments to investigate multiple factors and interactions in a systematic way, enabling the identification of optimal conditions using fewer experimental runs. Both approaches are of particular relevance in pharmaceutical analysis, where accuracy and efficiency are of the essence [25].
MVA techniques in LC play a vital role in the improvement of method development and operational efficiency. MVA, by correlating experimental factors like mobile phase composition, pH, column type, and temperature with critical chromatographic outputs, enables robust, reproducible separations while minimizing experimental efforts [6].
PCA has been extensively applied to optimize mobile phase pH and buffer concentrations, ensuring consistent separations during stability studies of active pharmaceutical ingredients (APIs). DoE simplifies gradient elution development by identifying solvent compositions and flow rates that achieve optimal resolution with minimal solvent use. Such methods have proven highly effective in impurity profiling and dissolution testing, saving both time and resources. While Cluster Analysis offers new opportunities in method development. This is because analytes are grouped by CA based on their chromatographic behavior. Laboratories can now develop simplified methods for similar structure analogs, reducing solvent and energy consumption in high-throughput analyses. CA, for example, has already been used in the simplification of some complicated separations, thus allowing the reduction of gradient steps in the pharmaceutical formulation of multicomponents as carried out by Snyder et al. [24].
MVA shares the spirit of green chemistry and fosters sustainable use in LC. Methods such as DoE allow for the optimization of solvent ratios, which reduces the need for organic solvents such as acetonitrile and methanol. Greener alternatives include ethanol and water-based modifiers, which have been adopted in several LC workflows with similar separation efficiency.
Temperature optimization, done under the guide of MVA, decreases energy use and prolongs column lifetimes, which are at the core of green LC approaches. One recent application involves the adjustment of LC methods for determining pharmaceutical residues in environmental water using MVA. Researchers have successfully achieved high sensitivity with minimal amounts of waste by optimizing conditions related to injection volume, flow rate, and solvent composition. Besides, PLS and PCA have been applied to predict retention time variability for column usage optimization, reducing the number of experimental runs and thereby saving resources. This not only decreases environmental impact but also enhances economy in pharmaceutical quality control and method development.
Recent applications of MVA demonstrate its transformative impact on LC methodologies. PCA has been employed to assess retention time variability across multiple column batches, identifying factors that enhance reproducibility and robustness. DoE applications in impurity profiling have streamlined solvent usage and analysis time, offering significant operational efficiencies.
In other related studies, MVA integration into sustainable practices has also been emphasized, such as transitioning traditional LC methods into greener approaches. Optimization of the composition of solvents and utilization of temperature-modulated separations resulted in laboratories reaching environmental and operational benefits with no loss to method performance [6,23,25].
As chemometric tools PCA and PLSR have opened the gate to hyphenated mass spectrometric chromatographic techniques to be the backbone of metabolomic, proteomic and lipidomic studies. The evolution of the number of scientific publications in that field is attributed to the integration of chemometrics with hyphenated HPLC or GC techniques (Figure 1). Plant [26]and human [27] omic studies are extensively reported in the literature using PCA for clustering study groups in an unsupervised manner followed by PLS for supervised fitting of the data into specific models to find correlation between variables.
2.1.1. Partial component analysis (PCA)
PCA can serve to identify key variables affecting liquid chromatographic performance and reveal the impact of different parameters on the greening of the chromatographic method. Furthermore, it could identify the optimal parameters for conducting a green chromatographic analysis[26].
Chemometrics, often executed through multivariate statistical methods, may serve as an alternative to traditional chemical data processing, facilitating easier measurement techniques that generally bypass sample pre-treatment and reduce analysis duration. It is a promising route to the ultimate greening of analytical chemistry since it enables results to be obtained solely from calculations, thus reducing the need for complicated measurements involving chemicals and solvents [28]. The approach does not eliminate the need for measurement completely. However, it allows the results to be obtained with much simpler measurement procedures [29].
Multivariate analysis (MVA) is commonly employed to investigate numerous process parameters that influence multiple response variables[30]. The predominant multivariate analytical methods for finding essential process components that directly affect response variables are principal component analysis (PCA) and partial least squares analysis (PLSA) [31]. Principal component analysis (PCA), a prevalent chemometric technique, is employed to investigate the relationships among samples (such as patients, food samples, organisms, chromatographic columns, and spectra) and variables (including compound concentrations, spectral peaks, chromatographic peak areas, and elemental compositions). This method decomposes extensive datasets into simpler components that can be graphically represented, facilitating the visualization of relationships among objects [29]. It is used as a chemometric tool for identifying critical method risk variables (CMRVs) and critical method performance attributes (CMPAs) [31]. This facilitates the optimization of analytical techniques by assessing the impact of various parameters on the responses and understanding the correlation between experimental variables and responses, resulting in more efficient and effective analytical methodologies. PCA is utilized to comprehend variations in responses resulting from changes in method variables. Numerous principal components (PCs) exist, each elucidating a percentage of variation among the variables and their responses. Principal components accounting for over 90% of the variance in chosen responses based on method variables are retrieved. Two principal components (PCs) are typically utilized for each response variable[32]. The scree plot illustrates the graphical relationship between eigenvalues and extracted PCs for method performance attributes (MPAs). The components with eigenvalues exceeding 1.0 are designated as main components (PCs) for elucidating changes in MPAs, indicating that these MPAs can be classified as CMPAs. MPAs for HPLC methodologies comprise resolution, number of theoretical plates (N), retention factor, and peak area [31,33].
Based on early experimental data and the scientific foundation of the HPLC method, around 20 methodological variables were selected for method development[31]. PCA was utilized for the risk evaluation of discovered methodological variables. The identified methodological variables can encompass the following; the volume of solvent utilized in sample preparation, such as isopropyl alcohol or ethanol ( as more environmentally friendly alternatives to acetonitrile and toluene), the pH of the mobile phase, the flow rate, the strength of the buffer (derived from a mixture employed as the aqueous phase in the mobile phase composition), the sample injection volume, the type of modifier (whether PCA or factor analysis (FA)), the organic mobile phase component, the aqueous mobile phase component, the type of reagent ( whether analytical grade or HPLC grade chemicals), analyst variation, sampling variation, weighing variation as well as the type of column, column temperature, detection wavelength, instrumental variation, temperature and finally relative humidity and light. Nonetheless, not all of these methodological variables exert comparable effects on the chosen responses. Their risk evaluation is elucidated by their loading factors. The loading factor represents the correlation of a certain variable with the corresponding principal component. Consequently, it may be either positive or negative, with a higher value indicating a stronger association[34]. In practice, loading factor values exceeding 0.6 are regarded as significant variables. In each principal component, the method variable with a factor loading over 0.6 is designated as a critical method risk variable (CMRV) for the development of the HPLC technique illustrated by bi-plots [31,33] Consequently, CMRVs are chosen for the optimization of the targeted green analytical chemistry (GAC) assisted HPLC methodologies.
Ultimately, PCA plots derived from several MRVs and MPAs provide the identification of CMRVs with loading factors exceeding 0.6, which exert the most significant variation impact on CMPAs with eigenvalues more than 1.0, hence enabling the optimization of these CMRVs later by various DoE methodologies.
2.1.2. Partial least square regression (PLSR)
PLS can help transfer to green and white chromatographic methods via modeling a relationship between chromatographic conditions and outcome and thus help to understand how a change in experimental variables can affect performance. It can be used to identify the most critical factor that affects chromatographic performance and optimize these factors to reduce solvent use and enhance separation efficiency with minimal environmental impact [26].
Evaluating complicated datasets and multi-component mixtures using chemometric techniques such as Principal Component Regression/Analysis (PCR/PCA) and Partial Least Squares (PLS) offer considerable advantages [35]. PLS regression (also known as projection on latent structures) integrates and generalizes multiple linear regression and PCA features. Its objective is to forecast a set of dependent variables based on a set of predictors or independent variables. To make this prediction, a group of orthogonal components with the highest predictive power—known as latent variables—are extracted from the predictors and latent variables can be displayed [36]. The goal of PLS is to identify latent variables that optimize the correlation between the predictor and response variables in contrast to PCR that focuses on identifying the components that most effectively account for the variation observed in the data [35]. PLS ensures that there is a direct correlation between the responses and the retrieved variables by progressively removing uncorrelated data that is not helpful for prediction thus creating latent variables [37]. Since PLS models can over fit the data, cross-validation methods like the bootstrap and jackknife are conducted to ensure the accuracy of the prediction[36].
In favor of green analytical chemistry (GAC), it is advised to minimize or completely prevent the use of teratogenic and carcinogenic solvents for the improvement of both the environment and the analysts' safety. Therefore, the PLSR is employed for the identification of high-risk method variables and CMPAs for the creation of the target method to benefit GAC and reduce the consumption of solvents. PLSR can generate the PCs linked to the probable CMPAs by displaying loading of method variables and score loading of method performance attributes. Where, the method variable in each PC with a factor loading of value more than 0.6 is determined to be a CMRV. Whereas possible MPAs with a score loading of value greater than 0.6 are recognized as CMPAs for further study during the method's development [31].
Identification of CMRVs and CMPAs can help in identifying the most influential factors that can impact the performance of an analytical method. By understanding these risk factors, researchers can implement measures to mitigate their effects and ensure the reliability of the method resulting in minimizing risks associated with factors such as reagent consumption, waste generation, and environmental impact.
2.2. Design of Experiments (DoE)
DoE involves a structural approach to aid in planning and conducting the experiments.According to the upcoming International Council for Harmonization (ICH) Q14 guideline, development of an analytical method becomes more robust when analytical quality by design (AQbD) approach is adopted and supported by the principles of quality risk management, and design of experiments (DoE). In order to ensure product quality and efficiency, the FDA promotes the use of QbD for new drug applications. Many analytical techniques including; spectrophotometric, RP-HPLC, and high-performance thin-layer chromatography methods have been developed and published by the implementation of the AQbD approach as per ICH Q8 (R2), Q9, and Q10 guidelines [11,38].
Thus, AQbD accomplish enhanced understanding and control strategy to the analytical procedure on practical level upon utilizing DoE approach [39,40,41].The major applications of DoE in Pharmaceutical industry are analytical method development, enhancement and improvement, method validation, and quantitation of the influence of analytical methods on product and process acceptance and out-of-specification (OOS) rates. Therefore, simultaneous implementation of QbD activities including DoE in both synthetic steps and analytical development steps minimizes the risks and offers the highest quality product, ensuring regulatory compliance [11,39,40,42].
DoE is a sequence of experiments that will be performed for several chosen values of the design variables. Previously discussed chemometric tools such as PCA and PLS can be applied for the identification of the critical method variables in the development of an LC method. However, the impact of such variables on the critical analytical attributes (CAAs) can be further studied with the aid of DoE [11].
The main stages of DoE are screening followed by optimization and finally validation and robustness testing (Figure 2). First, a screening experiment is performed in order to investigate the variables and interactions that significantly affect the results. This could be achieved with designs such as; full factorial design, fractional factorial design, D-optimal design and Plackett-Burman design [43,44,45,46]. Once the most significant variables are identified from the screening step, the optimization step is conducted to find out an optimum. Starting with determination of the lower and upper levels of the variables and then setting the experiments that will be performed between those levels. This step can find the settings of factors that generate optimal values for the response. Moreover, this step can determine the influence of the factors on the response with the appliance of statistical designs such as central composite designs (CCD), Doehlert matrix (DM) and Box-Behnken design (BBD). Additionally, modeling and optimizing of complex relationships between multiple variable is achieved by what is called the Response surface methodology (RSM) [47,48,49]. RSM refine models by fitting the response to experimental data via a function that could be graphically plotted (as a three-dimensional or two-dimensional graph) . Finally, the validation of the method is tested for its robustness to show the lack of significant effect [23,50,51,52].
Among the important principles in DoE are; (1) replication in which statistical validation and repeatability are tested within the DoE frame by repetition of experiments with a particular set of levels for all the studied factors. Randomization (2) in which, the experimental runs are randomized in their order to avoid bias. Blocking (3) grouping the experimental material into blocks such that variability within each block is minimized. This sieves the noise that is caused by known sources of variation[53,54].Many software products are specialized in developing and analyzing experimental design including; Fusion Pro, MODDE and Design-Expert as well as statistical software that offer a DoE (e.g., JMP, Matlab, MINITAB, Statistica, and Statgraphics).[55]
As a multivariate system, Liquid Chromatography is a good candidate to consider in optimization with the aid of DoE in which various analytical parameters such as (extraction, mobile phase, column type, detector, elution gradient, etc.) that should be adjusted to resolve complex matrices. Unlike the One-Factor-At-A-Time (OFAT) approach, that require a large number of experimental runs, and efforts to redevelop the method upon validation. DoE can avoid risks failure, especially if the analyst aims at method transfer [44,56]. In brief, using the OFAT approach opposes the need for cost-effective and fast method optimization and above all achievements with greener analytical methods. For this purpose, DoE can identify the optimal conditions yielding the best results from a few selected experiments and thus, can help in designing a green LC method during the planning of experiment. From a greener perspective, systemic variation of multiple factors such as; solvent composition, flow rate and temperature could be accomplished with DoE to identify the optimal condition and considering the usage of green solvent to achieve fast analysis with low solvent and energy consumption. This would result in time and cost-effective optimal separation and accordingly, minimizing environmental impact and enhancing greenness [57,58,59,60,61,62].
Among the green alternatives to Acetonitrile and Methanol (the most commonly used solvents in LC) are ethanol, acetone and propylene carbonate (PC)[63]. Ethanol is considered a green solvent as a result of its low toxicity, bio-sourcing, lower disposal costs in comparison to ACN and MeOH and moreover better safety profile for handling by operators [64,65,66,67]. Nevertheless, ethanol based mobile phase has been reported to cause high column backpressure due to the high viscosity of ethanol/water mixtures. Approaches to reduce viscosity of ethanol-based mobile phases include the use of high column temperature however, performing such high temperature LC does not agree with principle of greenness [67,68,69].
In some reports, ethanol mobile phase has accomplished a successful green LC separation upon implementing the DoE approach [67,70,71,72,73,74]. Yabré etal, has successfully developed a green and robust RP-HPLC method using DoE approach in which ethanol was the mobile phase running at a flow rate as slow as 0.4 mL/min to counteract such a drawback [72]. Additionally, Abdel-Moety etal has used monolithic-based C18 column to achieve low backpressure when using ethanol as mobile phase with the aid of experimental design[75]. Kokilambigai, K.S. etal has developed a reliable green HPLC method by means of DoE in which, ethanol volume and flow rate of the mobile phase were studied at five diverse levels[73]. While Ghonim, R. et al managed to develop a green method by increasing the temperature to 32° and resolved four different APIs using experimental design [76].
Others, has proven the efficiency of using DoE in the optimization of a green analytical procedure using acetonitrile based mobile phase but considering other method parameters such as, organic phase ratio, injection volume and flow rate[77]. Nevertheless, the high UV cut-off of ethanol (at 210 nm) is masked if its cut-off was avoided, or when mass-spectrometry (MS) is used in detection instead or if the compounds in analysis have strong UV chromophores [76,78].
The use of Propylene carbonate as a green solvent alternative in the mobile phase is growing. Propylene carbonate in mixture with ethanol or with phosphate buffer as well as propylene carbonate and ethanol mixtures were reported in green LC separations [79,80,81,82,83]. However, employing chemo metric approaches has never been recognized yet.
On the other hand, reports applying DoE on Ultra pressure liquid chromatography (UPLC) has shown distinct edge over traditional HPLC procedures in terms of separation efficiencies as well as in time and cost-effectiveness. The use of submicron sized stationary phase in UHPLC columns (i.e., <2 µm), reduce the run time, thus eventually reducing the consumption of solvents and minimizing waste production and thus UPLC is considered is an excellent means for green analytical methods [70,84,85].
With regard to the sample preparation step for further LC analysis, sample preparation methods are assessed for their greenness in terms of the sample volume, the amounts and nature of chemicals needed and eventually, the amount of generated waste. In order to achieve a sensitive, accurate, and precise SPME protocol, the identification and experimental control of the influencing variables, and their possible interactions is needed. For those purposes, several reports have employed the DoE approach for sample pretreatment steps [70,86,87,88]. For example, in an untargeted metabolomics study for Gram-negative bacteria C. crescentus, eight diverse sample preparation settings were studied for their impact on the nature and inconsistency of the recovered sample with the support of the DoE [89]. On the other hand, careful designing of the experiments with DoE to reduce the number of experiments is a successful strategy to reduce waste aiming at greener analysis. Optimization of single-drop micro-extraction was accomplished with the use of popular CCD design in which influence of various factors including sample, drop volumes and extraction time, stirring rate and sampling depth were investigated[90]. Others reported the use of DoE designs to optimize dispersive liquid–liquid micro-extraction methods in which the recovery for specific extraction was optimized [91,92].
2.3. Retention time prediction
Retention time prediction is a principle that uses chemometric tools as quantitative structure-retention relationship (QSRR model) to predict the retention time of chemicals based on molecular descriptors.
For a long time, the optimization of liquid chromatographic (LC) method development relied on OFAT experimentation, which was considered the gold standard. However, this approach has significant drawbacks: it requires an excessive number of experimental runs and fails to detect potential interactions between factors. Towards the end of the last century, these limitations were addressed with the introduction of new chemometric strategies one of which is known as quantitative structure–retention relationship (QSRR) models [95]. The application of the QSRR model in liquid chromatography aids method development and optimization by predicting how different compounds will behave under certain chromatographic conditions. When applied in method transfer from classical to a green and white liquid chromatographic method, retention time prediction can help to predict the behaviour of molecular under the new green solvent that replaces the old toxic one or under a new mobile phase composition with a smaller percentage of organic solvent. By doing so, it reduces the needed extensive trial-and-error experiments and enable fast method transfer. [96,97,98]
QSRR is used to establish mathematical correlations between the chromatographic parameters such as retention time determined for a representative series of analytes in given separation systems to one or more descriptive parameters (descriptors) related to the structure of the molecules [99,100]. These descriptive parameters can either be experimentally determined or theoretically derived from the 2D or 3D structures of the analytes. The theoretical descriptors are considered more useful since they allow the model produced to be extended to the prediction of the property of interest of unavailable analytes. The theoretical descriptors are subdivided into five main subsets according to the molecular features they reflect as illustrated in Table 1. In addition to using these descriptors in their traditional forms, it is possible to include additional modified descriptors [101].
Chromatography (especially HPLC) can yield a great amount of quantitatively comparable, precise, and reproducible retention data for large sets of structurally diversified analytes. These data can be mutually related since they are all measured under the same experimental conditions or can be standardized through straightforward interpolation or extrapolation. Therefore, quantitative structure– (chromatographic) retention relationships (QSRRs) have been considered as a model approach to establish strategy and methods of property predictions [99,100]. First, QSRR reports resulted from the application of the methodology used for studies of quantitative structure–(biological) activity relationships (QSARs) –so called Hansch approach to the analysis of chromatographic data [102]. The presently applied methodology and goals of QSRR studies is schematically presented in Figure [1].
QSRRs models can be extended to predict the retention for a new analyte. At first, the QSRRs in HPLC published up until 1997 had no retention prediction potency of actual practical value as oversimplification such as plotting retention versus molecular mechanics calculated energy of analyte-stationary phase model interaction shows nothing but a poor correlation and certainly does not mean that solvent effects are unimportant in LC [103]. Recently, Wise and co-workers derived a predictive QSRR to identify polycyclic aromatic hydrocarbons (PAH) and methyl-substituted PAH chromatographed on monomeric and polymeric C18 HPLC stationary phases by calculating a large set of electronic, topological spatial, and thermodynamic molecular descriptors was examined using the partial least squares (PLS) statistical technique. The obtained QSRR model accounts well for retention differences among analytes and recognizes the differences in analyte shape selectivity between the two stationary phases studied [104].
Recently, QSRR models have significant applications in different fields such as proteomics, metabolomics, food intoxication and others, where they enhance the efficiency, accuracy, and sustainability of analytical processes.
In proteomic analysis, the preliminary step is peptide separation. However, little information from HPLC, usually employed for the separation, is utilized in proteomics. Meanwhile, prediction of the retention time for a given peptide, combined with routine MS/MS data analysis, could help to improve the confidence of peptide identifications. The chromatographic retention behavior of peptides is usually related to their amino acid composition[105]. However, different values of retention coefficients of the same amino acid in different peptides in different neighborhoods are commonly observed. Specific retention coefficients were derived by regression analysis[106] or by artificial neural networks [107] with the use of a set of peptides retention. The QSRR model describing gradient HPLC retention time, 35 peptides on an XTerra MS column (Waters, Milfors, MA, USA) with 0–60% acetonitrile gradient developed within 20 min was very good: correlation coefficient R = 0.966, standard error of estimate s = 1.06, F-test value F = 144 and significance level p <10–17 [108].
Bączek et al, applied QSRR technique for prediction of RP-HPLC retention of peptides obtained by online digestion of myoglobin. To characterize the structure of a peptide quantitatively, and then to predict its retention time under gradient HPLC conditions. The predictive power of the QSRR model was checked by relating the predicted gradient retention times of the peptides to the experimental retention times obtained after on-line digestion of myoglobin. The results suggest that because of the use of QSRR for prediction of peptide retention, confirm both correctness of peptide identifications and indications of potential false positive and false negative results[106].
The use of QSRR models in food intoxication studies [109], specifically to predict the retention times (RTs) of contaminants during liquid chromatography. The main idea is that instead of purchasing physical reference standards (which might be unavailable, costly, or time-consuming to obtain)[110,111]. This prediction helps confirm the identification of contaminants such as pesticides, drugs, antibiotics, and mycotoxins, making the process more efficient and reliable [112,113].
Metabolomics studies are divided into targeted and untargeted approaches that can be performed with nuclear magnetic resonance (NMR) spectroscopy [114], capillary electrophoresis [115], high performance liquid chromatography (HPLC), and gas chromatography (GC) coupled with mass spectrometry (MS) or rarely NMR (or both of them) [116].
The first time QSRR was used for simultaneous identification of metabolites and drugs by Gorynsk et al, in 2013 they develop and describe appropriate QSRR models of dataset consisting of 146 drugs, metabolites and banned compounds from World Anti-Doping Agency (WADA) lists, was used that provide usable predictive capability, allowing false positive identification to be removed during the interpretation of metabolomics data while additionally increasing confidence of experimental results in doping control area [117].
Moreover, QSRR aids in HPLC method development, as HPLC is commonly used to separate pharmaceutical mixtures due to the wide variety of available stationary phases. However, choosing the right initial chromatographic system for method development is critical and often takes a lot of time. Typically, a trial-and-error approach is used, where analysts rely on their experience to test multiple starting systems [118]. QSRR aids in method development by predicting chromatographic behavior, thereby reducing the need for extensive experimental trials. This enhances cost-efficiency, saves time, and aligns with the principles of White Analytical Chemistry (WAC), which emphasizes creating analytical methods that are not only environmentally friendly but also robust, reliable, and cost-effective, while minimizing unnecessary experimentation [119,120].
If statistically significant and physically meaningful QSRR are obtained, then they can address the problem of choosing an appropriate chromatographic column by conducting a quantitative comparative analysis of stationary phases as by Tache, et al [121] without the need of the list of proposed solutions including the chromatographic tests as reported by stella et al [122].
Moreover, QSRR can be integrated into a Quality by design (QbD) framework, which is central to WAC, by predicting chromatographic outcomes and ensuring the method is both robust and reliable from the start [123].
Taraji et al, utilized a combined QSRR-DoE approach to propose an optimal design space in a quality-by-design (QbD) workflow to facilitate the Hydrophilic Interaction Liquid Chromatography (HILIC) method development. The mathematical QSRR-DoE model was shown to be highly predictive when applied to an independent test set of unseen compounds[123].
QSRR supports the principles of both white and green analytical chemistry by predicting the retention times of analytes in different chromatographic conditions, which can help select greener solvents or solvent mixtures that minimize environmental impact while maintaining analytical performance, reducing experimental work, minimizing hazardous reagent usage, enhancing method robustness and improving the overall sustainability of chromatographic analyses.
2.1.1. Peak Deconvolution
Despite the advances in chromatography that have led to highly efficient separations, peak overlap remains a common issue. Peak integration is challenging, particularly for asymmetric peaks, as chromatographic resolution decreases. Davis and Giddings, on the basis of statistical theory of overlap, estimated that a multicomponent chromatogram needs to be approximately 95% empty to achieve a 90% chance of an analyte appearing as an isolated peak [124]. Even with modern high-efficiency separations, certain critical pairs, such as deuterated and non-deuterated molecules, enantiomers, or complex mixtures with many peaks, often face resolution challenges. In enantiomeric separations, the separation window may appear mostly empty, yet the enantiomers can still show poor resolution. Routine drop perpendicular skimming methods often lead to ambiguity when integrating overlapping peaks. As a result, developing methods that can effectively separate all necessary components for quantitation (typically aiming for baseline separation, with a resolution of 1.5) remains a major challenge in chromatographic analysis for both research and pharmaceutical industry levels. Techniques traditionally well established in optical spectroscopy and nuclear magnetic resonance (NMR) are now being applied in liquid chromatography (LC) for post-acquisition signal processing [125].
As previously mentioned, an aim of chemometrics is to extract more useful information from signals such as spectra, chromatogram, and other several formats obtained from chemical instruments. In chromatography, the similarity of physical and chemical features of analyzed pharmaceuticals gives rise to co-eluted peaks or overlapping peaks[13.
By applying mathematical operations to raw chromatographic data, it is possible to improve the resolution of overlapping peaks and reduce peak widths, while retaining the original area information necessary for quantification with some adjustments. Advanced signal processing techniques such as the Fourier deconvolution of extra column effects, iterative curve fitting, multivariate curve resolution (MCR), and modified power law can offer simple yet effective solutions that can significantly improve analyses in GC, LC, and supercritical fluid chromatography (SFC), particularly for difficult separations. eliminating the need for time-consuming method development, such as changing stationary or mobile phases [125,126].
Multivariate curve resolution–alternating least squares (MCR-ALS) is a signal proceeding tool that can estimate underlying elution and spectral profiles for a chromatogram, even in the case of complete overlap of peaks (Rs = 0).
From a chromatographic perspective, the key requirement is to collect data from multiple channels, the use of photodiode array detectors (DAD) in HPLC systems has made this process more accessible by enabling the construction of a multidimensional data matrix. The aim of Multivariate Curve Resolution-Alternating Least Squares (MCR-ALS) is to break down the observed data matrix (D) of a chromatogram into elution profiles (C) and pure spectral profiles (ST) that best fit the data matrix, as expressed in equation 1. E represents the experimental error in the estimated convergence [127,128].
Data matrix (D)=Elution profile(C)* Spectral profile (ST) + Error (E) [13]
Vosough and Esfahani developed a HPLC-DAD method for Quantification of five antibiotics in wastewaters with use of MCR-ALS algorithm. Quantitative determination of sulfamethoxazole, metronidazole, chloramphenicol, sulfadiazine, and sulfamerazine was carried out after a solid-phase extraction procedure. Standard addition in combination with MCR-ALS algorithm was applied due to matrix interference and sensitivity changes. Application of the MCR/ALS algorithm was able to resolve highly drifted background constituents and strongly overlapped peaks of the analytes and matrix interferences [129].
Alternating Trilinear Decomposition-Assisted Multivariate Curve Resolution (ATLD-MCR) and Multivariate Curve Resolution-Alternating Least Squares (MCR-ALS), combined with HPLC-DAD, were utilized to quantify ten molecularly targeted anti-tumor drugs in three complex biological matrices: plasma, urine, and cell culture media. During the experiment, varying degrees of time shifts were observed across different samples. Despite slight time shifts during chromatographic analysis, the three proposed methods yielded satisfactory results. Additionally, compared to other published techniques, the proposed chemometric methods combined with HPLC-DAD were able to rapidly, simultaneously, and accurately determine a range of molecularly targeted anti-tumor drugs in different complex biological matrices, even in the presence of severe peak overlaps, significant time shifts, slight baseline drifts, and various unknown background interferences [130].
In the applications of chemometrics in chromatographic analysis, the multivariate optimization methodologies are very efficient chemometric tools for the identification of main factor effects and their interactions on experimental response to overcome the disadvantages of "one factor at a time" optimization. these techniques streamline the quantification process in complex chromatographic analysis, improving both the resolution and reliability of the results, which is highly beneficial for applications such as pharmaceutical testing, environmental analysis, and biochemical research [131].
2.2. Application of chemometrics in sustainabilityof LC pharmaceutical analysis
Chemometrics to aid sustainable APIs analysis :
Many published references discussed the role of chemometrcis in the enhancement of LC techniques especially in terms of increasing method greenness and here are some examples:
A liquid chromatographic method has been established for the separation of metformin, glipizide, gliclazide, glibenclamide and glimepiride using experimental design. The main intention of this method is to optimize suitable chromatographic conditions for the proper elution of the drug molecules with minimal analysis time. The relationship between the individual and combined effect of critical process parameters and chromatographic efficiency was made clear and was achieved with the aid of experimental design methodology. In such separations, the method can be optimized at its best by employing quality by design (QbD) which is a systematized approach for the development of an analytical method that incorporates multifaceted combinations of independent variables and their interactions by applying design of experiments (DoE), to obtain optimal experimental conditions, No method with the aid of DoE, has been developed till now for the separation of metformin, glipizide, gliclazide, glibenclamide and glimepiride using experimental design. Therefore, the authors have made an attempt to develop a validated chromatographic method with the help of Central Composite Design (CCD)[132].
Another manuscript is concerned with another type of chemometrically assisted method which is the optimization and validation of UPLC method intended for the quantitative analysis of simvastatin in pharmaceutical preparations. To achieve the desired chromatographic response and to simultaneously optimize the most important chromatographic parameters with a limited number of experiments in a minimum amount of time which is mainly made to establish a greener and more sustainable method of analysis- Box-Behnken design was used, the optimized and validated method gives rapid and efficient separation and represents an improvement over the existing methods especially in the terms of sensitivity, low cost of analysis per sample and the environmental impact of the method.
The optimization of the chromatographic method involved an investigation of the quantitative effects of different experimental variables on the performance of chromatographic separation using a chemometric approach. The Box-Behnken design approach was used to study the individual and combined effects of three independent factors, i.e. the percent of organic modifier in the mobile phase (x1), column temperature (x2), and flow rate (x3), Additionally, seven factors (column, acetonitrile content, temperature, pH of mobile phase, molarity of the buffer used, flow rate and wavelength) were assessed in twelve experiments according to Plackett– Burman design, to obtain complete information about the method performance. The proposed methodology represents an efficient and easily accomplishable approach for resolving the problem of searching the optimum chromatographic conditions in minimum time. The optimized method represents an improvement over the existing reported methods especially in terms of sensitivity, low cost per sample and "greenness" of the method [133].
Many chemometrics techniques resolve problems encountered during LC techniques for example this analytical method focuses on novel multivariate UV-chemometric method and HPLC-QbD method for simultaneous determination of Vardenafil (VR) and Dapoxetine (DP) in active pharmaceutical ingredient and their marketed formulation, the spectrophotometric data were processed by CLS, PCR, PLS and MLR methods to determine the active substances, without prior separation from tablet marketed formulation. Analytical figures of merit, such as sensitivity, selectivity, analytical sensitivity, LOD, and LOQ were determined. In HPLC-QbD, four critical factors were selected after screening and Box-Behnken design was applied for optimization. Twenty-five experiments were done, and a quadratic model was used for all response variables. Desirability plot, surface plot, design space, and three-dimensional plots were calculated. The developed methods were validated and successfully applied for simultaneous determination of VR and DP in tablet dosage form. The results obtained by UV-Chemometric methods were statistically compared with an HPLC-QbD method, which concludes both the methods can be appliedto tablet analysis [39].
Others have tackled the challenge of the development of a liquid chromatographic method for the determination of impurities in pharmaceutical compounds. Traditional trial-and-error approaches are no longer encouraged in the pharmaceutical industry, as their time-consuming nature and the use of large quantities of solvents and other resources render them uneconomical.
The application of recent advances to chromatographic separation is expected to provide a better and more systematic platform for chromatographic separation to deepen our understanding of parameters critical for separation and ensure that the most appropriate parameters are selected within the method’s operational design space. Such software-based applications employ various chromatographic and selectivity-based theories such as the hydrogen subtraction model, linear solvation theory, and selectivity cube to optimize separation based on differences in selectivity while requiring the lowest number of experiments [134].
Chemometrics to aid sustainable impurity profiling:
In the pharmaceutical industry, impurity profiling is a critical tool in Quality Control. Analyzing organic and inorganic impurities in APIs helps manufacturers to ensure the safety, efficacy, and consistency of the products. Moreover, such analysis offers data about the limits of detection and limits of quantitation of impurities within APIs and/or finished products [135].
A spectrum of analytical methods is used to separate and identify the impurities in pharmaceuticals. These include; capillary electrophoresis CE, electron paramagnetic resonance, GC, and HPLC. Despite the economical, and environmentally beneficial use of UV–visible spectrophotometry. However, spectral overlap hinders its use in the direct determination of compounds in pharmaceuticals unless chemometrics is employing (PLS) and (PCR) models [136,137,138,139,140,141].
On the other hand, the use of sophisticated hyphenated analytical tools such as; LC-MS (Liquid Chromatography-Mass Spectrometry) and LC-NMR (Liquid Chromatography-Nuclear Magnetic Resonance) for the characterization of pharmaceutical impurities generate complex data that requires further statistical chemometric approaches[142,143] . Principal components analysis (PCA) was utilized to offer rapid sorting of batches of Simvastatin tablets as per their impurity profile using LC Coupled to Time-of-Flight Mass Spectrometry[144]. Alternatively, experimental designs have effectively optimized reversed phase HPLC conditions for the aim of impurity profiling of valacyclovir and its related products [145], as well as robustness testing for dosage forms containing clarithromycin, norfloxacin, doxycycline, tinidazole and omeprazole [146]. Additionally, integration of experimental designs and principles of green chemistry has proven efficiency in green quantitative LC analysis of degradation products and synthesis by-products, of pharmaceutical products such as; dextromethorphan in which ethanol was the mobile phase[147]. Moreover, a green and robust analytical method, for the quantitative analysis of artesunate and amodiaquine impuritieshas been developed [72] [148,149] .
It is worth mentioning that those reported their analytical methods using ethanol based mobile phases. While an RP-HPLC method was optimized to simultaneously determine dimenhydrinate with cinnarizine and their toxic impurities employing green analytical technique [150].
Further application of Multivariate curve resolution-alternating least squares (MCR-ALS) method as peak deconvolution tools can help resolve overlapping peaks in a complex mixture and eventually can help in the identification of possible impurities and thus speed up the pharmaceutical research and development stage.
In a study by Arase, S., the developed peak deconvolution algorithm has compromised between achieving faster analysis along acquiring accurate quantitative results by setting simple time and wavelength ranges[151,152].
In conclusion, employing chemometrics will support regulatory compliance and quality control by ensuring that drug product meets safety and efficacy standards. These features are especially significant for applications such as drug research and development.
Chemometrics to aid sustainable bioanalytical applications
The chromatographic analysis of pharmaceuticals by HPLC procedures is influenced by many methodological risk factors. For the regulatory submission of the analytical method, it must be robust, accurate, and precise. Analytical quality by design (AQbD) is a systematic methodology for developing analytical techniques based on the principles of quality risk management (QRM), which is achieved by multivariate statistical analysis, and design of experiments (DoE). The AQbD technique facilitates the development of the HPLC method with the required criteria for chromatographic drug analysis. It involves a reduced quantity of organic solvents in comparison to traditional method development approaches by suggesting a reduced number of experimental runs covering the whole response spectrum.
DoE is an important tool for elucidating the graphical relationship between CMRVs and CMPAs, facilitating the optimization of the HPLC methods. Various experimental designs, including full factorial design, central composite design, and Box-Behnken design, are utilized for response surface modeling based on DoE[33]. Screening designs are helpful since they facilitate the identification of the factors that exert the greatest influence on the system's response[153]. For a system with three factors, the number of experiments required is 8 for full factorial design, 17 for Box-Behnken design (BBD), and 20 for central composite design (CCD)[154]. Thus, material and energy savings are achieved by eliminating factors that do not affect the analytical response and numerous experimental runs[155]. Following the implementation of factorial design, the response function is evaluated to identify variable values that approximate optimum performance.
The CMRVs and CMPAs found by multivariate analytical methods are subsequently analyzed for their response surfaces using BBD, CCD, or full factorial design. The design-expert program recommends a limited number of experimental runs, which are conducted in the laboratory, and the measured responses are recorded for data analysis. Statistical analysis of the data is conducted using ANOVA, multiple regression analysis, and response surface plots. A polynomial equation is derived for all dependent parameters, accompanied by contour and surface plots illustrating the influence of independent variables on dependent variables[31,33]The main effects, interactions, and quadratic effects of the selected method variables are assessed for significance. If considered significant with p-values below 0.05[31], it indicates that the proposed mathematical models are the optimal fit for predicting responses. Furthermore, predicted R2 and adjusted R2 values exceeding 0.9, when accounting for degrees of freedom, show that the regression model adequately fits the data[156]. The 2D and 3D response surface plots were examined for the navigation of the analytical design space (ADS) as per quality target analytical profile (QTAP). The ADS is utilized to construct a control plan for the life cycle management of the established HPLC method, recommending optimal CMRV ranges for reliable responses with high efficient, accurate and precise models eliminating the need for numerous experimental runs and trials to find the optimum values of CMRVs previously identified by PCA and PLS models.
Chemometrics to Aid Sustainable Stability Testing
In developing pharmaceuticals, ensuring that drugs remain safe and effective throughout their shelf life is essential. Stability testing is used to achieve this by exposing drugs to different conditions like temperature, humidity, and light to monitor their degradation over time. Although this process is necessary, it can take a lot of time and resources[157].
That’s where chemometrics comes in. Chemometrics can optimize data analysis, cut down resource use, and increase predictive accuracy in stability testing. This article explores how chemometrics can promote sustainability in stability testing, with techniques like multivariate data analysis (MDA), Design of Experiments (DoE), partial least squares (PLS) regression, and principal component analysis (PCA). Through real-world examples and predictive tools, we’ll see how chemometrics improves both scientific accuracy and environmental responsibility[157].
MDA is useful in stability testing because drugs degrade due to multiple environmental factors. MDA can evaluate how a drug product degrades when exposed to high temperature and humidity at the same time. By better understanding how these factors affect the stability of the drug and its components, scientists can make smarter decisions about packaging, formulation, and storage.[158]
DoE is another crucial chemometric tool in forced degradation studies. These studies speed up the breakdown of drug substances and products under extreme conditions like heat, light, and oxygen to identify breakdown products and evaluate methods that indicate stability. DoE lets scientists systematically study the effects of different variables, like temperature and pH, in a controlled way. With DoE, scientists can more accurately predict how long a drug will last and how it degrades [159,160].PCA simplifies large datasets by focusing on the most important variables affecting a drug’s stability. For example, it can be used to analyze how moisture affects a crystalline drug form. PLS is commonly used in accelerated stability studies to model how storage conditions impact degradation rates. It’s especially effective for predicting long-term stability using short-term data [161,162].
Chemometrics greatly enhances the sustainability of stability testing in the pharmaceutical industry by making data collection, analysis, and prediction more efficient. Table 2 summarizes different Application of Chemometric Tools in Sustainable Stability Testing along with an example for each tool.
3. Conclusions
Chemometrics techniques like MDA, PCA, PLS, and DoE offer more in-depth evaluation of LC data under various conditions, reducing unnecessary testing and conserving resources. Predictive models like ASAP and PCS help forecast long-term outcomes, allowing for smarter decisions that support both product integrity and environmental goals. By adopting chemometric methods, pharmaceutical companies can meet the rising demand for sustainability while maintaining high standards of safety and efficacy. This approach not only reduces the environmental impact of drug development but also speeds up the time it takes to bring safe products to market, benefiting both the industry and patients.
Author Contributions
Conceptualization, Eldeeb, S.; methodology, El deeb,S., Aboushady, D.; software, Aboushady, D.; validation, formal analysis, investigation, writing—original draft preparation, all authors; writing—review and editing, Aboushady, D. Eldeeb, S..; visualization, Aboushady, D.; supervision, Eldeeb, S. ;project administration, Eldeeb S.; funding acquisition, Eldeeb S.. All authors have read and agreed to the published version of the manuscript.
Funding
This research received no external funding.
Data Availability Statement
No new data were created or analyzed in this study.
Acknowledgments
The corresponding author thanks Merck Life Science KGaA, Darmstadt, Germany, for kindly supporting research activities on sustainable analytical chemistry.
Conflicts of Interest
The authors declare no conflicts of interest.
References
- Nikolin, B., et al., High perfomance liquid chromatography in pharmaceutical analyses. Bosn J Basic Med Sci, 2004. 4(2): p. 5-9. [CrossRef]
- Almeida, C.M.M., Overview of Sample Preparation and Chromatographic Methods to Analysis Pharmaceutical Active Compounds in Waters Matrices. 2021. 8(2): p. 16.
- de Jesus Gaffney, V., et al., Occurrence and behaviour of pharmaceutical compounds in a Portuguese wastewater treatment plant: Removal efficiency through conventional treatment processes. Environmental Science and Pollution Research, 2017. 24(17): p. 14717-14734. [CrossRef]
- Cao, Z., E. Kaleta, and P. Wang, Simultaneous Quantitation of 78 Drugs and Metabolites in Urine with a Dilute-And-Shoot LC–MS-MS Assay. Journal of Analytical Toxicology, 2015. 39(5): p. 335-346. [CrossRef]
- Skov, T. and R. Bro, Solving fundamental problems in chromatographic analysis. Analytical and Bioanalytical Chemistry, 2008. 390(1): p. 281-285. [CrossRef]
- El Deeb, S., Enhancing Sustainable Analytical Chemistry in Liquid Chromatography: Guideline for Transferring Classical High-Performance Liquid Chromatography and Ultra-High-Pressure Liquid Chromatography Methods into Greener, Bluer, and Whiter Methods. 2024. 29(13): p. 3205.
- Roberto de Alvarenga Junior, B. and R. Lajarim Carneiro, Chemometrics Approaches in Forced Degradation Studies of Pharmaceutical Drugs. Molecules, 2019. 24(20). [CrossRef]
- Saveliev, M., V. Panchuk, and D. Kirsanov, Math is greener than chemistry: Assessing green chemistry impact of chemometrics. TrAC Trends in Analytical Chemistry, 2024. 172: p. 117556. [CrossRef]
- International Union of, P. and C. Applied, chemometrics.
- Mousavi, L., et al., Combining chemometrics and the technique for the order of preference by similarity to ideal solution: A new approach to multiple-response optimization of HPLC compared to desirability function. Microchemical Journal, 2020. 155: p. 104752. [CrossRef]
- Prajapati, P., et al., Chemometric and Design of Experiments-Based Analytical Quality by Design and Green Chemistry Approaches to Multipurpose High-Pressure Liquid Chromatographic Method for Synchronous Estimation of Multiple Fixed-Dose Combinations of Azilsartan Medoxomil. Journal of AOAC INTERNATIONAL, 2022. 106(1): p. 250-260. [CrossRef]
- Massart, D.L.V., B.G.M.; Buydens, L.M.C.; De Jong, S.; Lewi, P.J. and Smeyers-Verbeke, J. , Handbook of Chemometrics and Qualimetrics: Part A. 1997: Elsevier Science.
- Komsta, Ł., Heyden, Y.V., Sherma, J., Chemometrics in chromatography. 1st Edition ed. 2017, Boca Raton: CRC Press.
- Mathew, C. and S.J.A.J.o.P.A. Varma, Green Analytical Methods based on Chemometrics and UV spectroscopy for the simultaneous estimation of Empagliflozin and Linagliptin. 2022. 12(1): p. 43-48.
- Rahman, M.A.A., et al., Novel analytical method based on chemometric models applied to UV–Vis spectrophotometric data for simultaneous determination of Etoricoxib and Paracetamol in presence of Paracetamol impurities. BMC Chemistry, 2023. 17(1): p. 176. [CrossRef]
- Gu, H.-W., et al., A green chemometrics-assisted fluorimetric detection method for the direct and simultaneous determination of six polycyclic aromatic hydrocarbons in oil-field wastewaters. Spectrochimica Acta Part A: Molecular and Biomolecular Spectroscopy, 2018. 200: p. 93-101. [CrossRef]
- Singh, S., H. Shakeel, and R. Sharma, Overview of chemometrics in forensic toxicology. Egyptian Journal of Forensic Sciences, 2023. 13(1): p. 53. [CrossRef]
- González-Domínguez, R., A. Sayago, and Á. Fernández-Recamales, An Overview on the Application of Chemometrics Tools in Food Authenticity and Traceability. Foods, 2022. 11: p. 3940. [CrossRef]
- Hussain, C.M., C.G. Hussain, and R. Keçili, White analytical chemistry approaches for analytical and bioanalytical techniques: Applications and challenges. TrAC Trends in Analytical Chemistry, 2023. 159: p. 116905. [CrossRef]
- Xuan, D.T., H.M.T. Nguyen, and V.D. Hoang, Recent applications of analytical quality-by-design methodology for chromatographic analysis: A review. Chemometrics and Intelligent Laboratory Systems, 2024. 254: p. 105243. [CrossRef]
- Cela, R., et al., Chemometric-assisted method development in reversed-phase liquid chromatography. Journal of chromatography. A, 2012. 1287. [CrossRef]
- Olkin, I. and A.R. Sampson, Multivariate Analysis: Overview, in International Encyclopedia of the Social & Behavioral Sciences, N.J. Smelser and P.B. Baltes, Editors. 2001, Pergamon: Oxford. p. 10240-10247.
- Bezerra, M.A., et al., Response surface methodology (RSM) as a tool for optimization in analytical chemistry. Talanta, 2008. 76(5): p. 965-977. [CrossRef]
- Lee, T.D., Introduction to Modern Liquid Chromatography, Third Edition. Journal of The American Society for Mass Spectrometry, 2011. 22(1): p. 196-196. [CrossRef]
- Tome, T., et al., Development and Optimization of Liquid Chromatography Analytical Methods by Using AQbD Principles: Overview and Recent Advances. Organic Process Research & Development, 2019. 23(9): p. 1784-1802. [CrossRef]
- Amiri, A. and F. Ghaemi, Solid-phase extraction of non-steroidal anti-inflammatory drugs in human plasma and water samples using sol–gel-based metal-organic framework coating. Journal of Chromatography A, 2021. 1648: p. 462168. [CrossRef]
- Ali, S.E., et al., A Comparative Metabolomics Approach Reveals Early Biomarkers for Metabolic Response to Acute Myocardial Infarction. Scientific Reports, 2016. 6(1): p. 36359. [CrossRef]
- Beckman, E.J., Supercritical and near-critical CO2 in green chemical synthesis and processing. The Journal of Supercritical Fluids, 2004. 28(2): p. 121-191. [CrossRef]
- Sharma, S.K.D., H Principles of Green Chemistry. In Green Organic Reactions. 1 ed. Materials Horizons: From Nature to Nanomaterials, ed. S.S. Gopinathan Anilkumar. 2021: Springer Singapore. 15–32.
- Prajapati, P., et al., Risk Assessment-Based Enhanced Analytical Quality-by-Design Approach to Eco-Friendly and Economical Multicomponent Spectrophotometric Methods for Simultaneous Estimation of Montelukast Sodium and Bilastine. J AOAC Int, 2021. 104(5): p. 1453-1463. [CrossRef]
- Prajapati, P., et al., Implementation of White Analytical Chemistry–Assisted Analytical Quality by Design Approach to Green Liquid Chromatographic Method for Concomitant Analysis of Anti-Hypertensive Drugs in Human Plasma. Journal of Chromatographic Science, 2023. [CrossRef]
- Prajapati, P., et al., Application of Principal Component Analysis and DoE-Driven Green Analytical Chemistry Concept to Liquid Chromatographic Method for Estimation of Co-formulated Anti-Hypertensive Drugs. J AOAC Int, 2023. 106(4): p. 1087-1097. [CrossRef]
- Prajapati, P., et al., Multivariate Analysis and Response Surface Modeling to Green Analytical Chemistry-Based RP-HPLC-PDA Method for Chromatographic Analysis of Vildagliptin and Remogliflozin Etabonate. J AOAC Int, 2023. 106(3): p. 601-612. [CrossRef]
- Dien, J., D.J. Beal, and P. Berg, Optimizing principal components analysis of event-related potentials: matrix type, factor loading weighting, extraction, and rotations. Clin Neurophysiol, 2005. 116(8): p. 1808-25. [CrossRef]
- Amin, K.F.M., R.H. Obaydo, and A.M. Abdullah, Eco-friendly chemometric analysis: Sustainable quantification of five pharmaceutical compounds in bulk, tablets, and spiked human plasma. Results in Chemistry, 2024. 11: p. 101761. [CrossRef]
- Abdi, H., Partial least squares regression and projection on latent structure regression (PLS Regression). 2010. 2(1): p. 97-106. [CrossRef]
- Nurani, L.H., et al., Chemometrics-Assisted UV-Vis Spectrophotometry for Quality Control of Pharmaceuticals: A Review. 2023, 2023. 23(2): p. 26 %J Indonesian Journal of Chemistry. [CrossRef]
- P.B, P., et al., Design of Experiments (DoE) - Based Enhanced Quality by Design Approach to Hydrolytic Degradation Kinetic Study of Capecitabine by Eco-friendly Stability Indicating UV-Visible Spectrophotometry. American Journal of PharmTech Research, 2020. 10: p. 115-133. [CrossRef]
- Patel, M.N. and C.S. Kothari, Multivariate Approaches for Simultaneous Determination of Avanafil and Dapoxetine by UV Chemometrics and HPLC-QbD in Binary Mixtures and Pharmaceutical Product. Journal of AOAC INTERNATIONAL, 2019. 99(3): p. 649-663. [CrossRef]
- Raman, N.V.V.S.S., U.R. Mallu, and H.R. Bapatu, Analytical Quality by Design Approach to Test Method Development and Validation in Drug Substance Manufacturing. 2015. 2015(1): p. 435129. [CrossRef]
- European Medicines Agency ICH Guideline Q14 on Analytical Procedure Development Step 2b. . 2022 [cited 2022 [(accessed on 31 March 2022)].]; Available from: Available online: https://www.ema.europa.eu/en/documents/scientific-guideline/ich-guideline-q14-analytical-procedure-development-step-2b_en.pdf,.
- Park, G., et al., Analytical Quality by Design (AQbD) Approach to the Development of Analytical Procedures for Medicinal Plants. 2022. 11(21): p. 2960.
- Lundstedt, T., et al., Experimental design and optimization. Chemometrics and Intelligent Laboratory Systems, 1998. 42(1): p. 3-40. [CrossRef]
- Aboushady, D., M.K. Parr, and R.S. Hanafi, Quality-by-Design Is a Tool for Quality Assurance in the Assessment of Enantioseparation of a Model Active Pharmaceutical Ingredient. 2020. 13(11): p. 364.
- Gangnus, T. and B.B. Burckhardt, Improving sensitivity for the targeted LC-MS/MS analysis of the peptide bradykinin using a design of experiments approach. Talanta, 2020. 218: p. 121134. [CrossRef]
- Zheng, H., et al., Time-Saving Design of Experiment Protocol for Optimization of LC-MS Data Processing in Metabolomic Approaches. Analytical Chemistry, 2013. 85(15): p. 7109-7116. [CrossRef]
- Aboushady, D., R.S. Hanafi, and M.K. Parr, Quality by design approach for enantioseparation of terbutaline and its sulfate conjugate metabolite for bioanalytical application using supercritical fluid chromatography. Journal of Chromatography A, 2022. 1676: p. 463285. [CrossRef]
- Araujo, P. and S. Janagap, Doehlert uniform shell designs and chromatography. J Chromatogr B Analyt Technol Biomed Life Sci, 2012. 910: p. 14-21. [CrossRef]
- Anderson, V.L., McLean, R.A. , Design of Experiments: A Realistic Approach. 1st Edition ed. 1974, Boca Raton: CRC Press.
- Thorsteinsdóttir, U.A. and M. Thorsteinsdóttir, Design of experiments for development and optimization of a liquid chromatography coupled to tandem mass spectrometry bioanalytical assay. 2021. 56(9): p. e4727. [CrossRef]
- Farooq, M.A., et al., An innovative approach for planning and execution of pre-experimental runs for Design of Experiments. European Research on Management and Business Economics, 2016. 22(3): p. 155-161. [CrossRef]
- Székely, G., et al., Experimental design for the optimization and robustness testing of a liquid chromatography tandem mass spectrometry method for the trace analysis of the potentially genotoxic 1,3-diisopropylurea. 2014. 6(9): p. 898-908. [CrossRef]
- D. M., B. and B. Narasimha Murthy, Advanced Designs of Experiment Approach to Clinical and Medical Research, in Design of Experiments and Advanced Statistical Techniques in Clinical Research. 2020, Springer Singapore: Singapore. p. 77-131.
- Easterling, R.G., Fundamentals of Statistical Experimental Design and Analysis. 2015: Wiley.
- Fontdecaba, S., P. Grima, and X. Tort-Martorell, Analyzing DOE With Statistical Software Packages: Controversies and Proposals. The American Statistician, 2014. 68(3): p. 205-211. [CrossRef]
- Ganorkar, S.B. and A.A. Shirkhedkar, Design of experiments in liquid chromatography (HPLC) analysis of pharmaceuticals: analytics, applications, implications and future prospects. 2017. 36(3). [CrossRef]
- Székely, G., et al., Design of experiments as a tool for LC–MS/MS method development for the trace analysis of the potentially genotoxic 4-dimethylaminopyridine impurity in glucocorticoids. Journal of Pharmaceutical and Biomedical Analysis, 2012. 70: p. 251-258. [CrossRef]
- Alves, C., et al., Analysis of tricyclic antidepressant drugs in plasma by means of solid-phase microextraction-liquid chromatography-mass spectrometry. 2007. 42(10): p. 1342-1347. [CrossRef]
- Hibbert, D.B., Experimental design in chromatography: A tutorial review. Journal of Chromatography B, 2012. 910: p. 2-13. [CrossRef]
- Zappi, A., et al., Extracting Information and Enhancing the Quality of Separation Data: A Review on Chemometrics-Assisted Analysis of Volatile, Soluble and Colloidal Samples. 2023. 11(1): p. 45.
- Henderson, R.K., et al., Expanding GSK's solvent selection guide – embedding sustainability into solvent selection starting at medicinal chemistry. Green Chemistry, 2011. 13(4): p. 854-862. [CrossRef]
- Jurjeva, J. and M. Koel, Implementing greening into design in analytical chemistry. Talanta Open, 2022. 6: p. 100136. [CrossRef]
- Funari, C.S., et al., Acetone as a greener alternative to acetonitrile in liquid chromatographic fingerprinting. 2015. 38(9): p. 1458-1465. [CrossRef]
- Castillo, A., A.F. Roig-Navarro, and O.J. Pozo, Capabilities of microbore columns coupled to inductively coupled plasma mass spectrometry in speciation of arsenic and selenium. Journal of Chromatography A, 2008. 1202(2): p. 132-137. [CrossRef]
- Płotka, J., et al., Green chromatography. Journal of Chromatography A, 2013. 1307: p. 1-20. [CrossRef]
- Joshi, D.R. and N. Adhikari, An Overview on Common Organic Solvents and Their Toxicity. Journal of Pharmaceutical Research International, 2019. 28(3): p. 1-18. [CrossRef]
- Yabré, M., et al., Greening Reversed-Phase Liquid Chromatography Methods Using Alternative Solvents for Pharmaceutical Analysis. 2018. 23(5): p. 1065.
- Gałuszka, A., Z. Migaszewski, and J. Namieśnik, The 12 principles of green analytical chemistry and the SIGNIFICANCE mnemonic of green analytical practices. TrAC Trends in Analytical Chemistry, 2013. 50: p. 78-84. [CrossRef]
- Tang, S.L.Y., R.L. Smith, and M. Poliakoff, Principles of green chemistry: PRODUCTIVELY. Green Chemistry, 2005. 7(11): p. 761-762. [CrossRef]
- Nassef, H.M., et al., Greens assessment of RP-UPLC method for estimating Triamcinolone Acetonide and its degraded products compared to Box-Behnken and Six Sigma designs. Green Chemistry Letters and Reviews, 2024. 17(1): p. 2301315. [CrossRef]
- Ferey, L., et al., UHPLC method for multiproduct pharmaceutical analysis by Quality-by-Design. Journal of Pharmaceutical and Biomedical Analysis, 2018. 148: p. 361-368. [CrossRef]
- Yabré, M., et al., Development of a green HPLC method for the analysis of artesunate and amodiaquine impurities using Quality by Design. Journal of Pharmaceutical and Biomedical Analysis, 2020. 190: p. 113507. [CrossRef]
- Kokilambigai, K.S. and K.S. Lakshmi, Analytical quality by design assisted RP-HPLC method for quantifying atorvastatin with green analytical chemistry perspective. Journal of Chromatography Open, 2022. 2: p. 100052. [CrossRef]
- Perumal, D.D., M. Krishnan, and K.S. Lakshmi, Eco-friendly based stability-indicating RP-HPLC technique for the determination of escitalopram and etizolam by employing QbD approach. Green Chemistry Letters and Reviews, 2022. 15(3): p. 671-682. [CrossRef]
- Abdel-Moety, E.M., et al., A combined approach of green chemistry and Quality-by-Design for sustainable and robust analysis of two newly introduced pharmaceutical formulations treating benign prostate hyperplasia. Microchemical Journal, 2021. 160: p. 105711. [CrossRef]
- Ghonim, R., et al., Environmentally benign liquid chromatographic method for concurrent estimation of four antihistaminic drugs applying factorial design approach. BMC Chemistry, 2024. 18(1): p. 26. [CrossRef]
- Sharma, T., et al., Implementation of analytical quality-by-design and green analytical chemistry approaches for the development of robust and ecofriendly UHPLC analytical method for quantification of chrysin. 2020. 3(9): p. 384-398. [CrossRef]
- Mohamed, H.M., Green, environment-friendly, analytical tools give insights in pharmaceuticals and cosmetics analysis. TrAC Trends in Analytical Chemistry, 2015. 66: p. 176-192. [CrossRef]
- Tache, F., et al., Greening pharmaceutical applications of liquid chromatography through using propylene carbonate-ethanol mixtures instead of acetonitrile as organic modifier in the mobile phases. J Pharm Biomed Anal, 2013. 75: p. 230-8. [CrossRef]
- Natalija, N., et al., Green Strategies toward Eco-Friendly HPLC Methods in Pharma Analysis, in High Performance Liquid Chromatography, N. Oscar, et al., Editors. 2023, IntechOpen: Rijeka. p. Ch. 5.
- Fayaz, T.K.S., et al., Propylene carbonate as an ecofriendly solvent: Stability studies of Ripretinib in RPHPLC and sustainable evaluation using advanced tools. Sustainable Chemistry and Pharmacy, 2024. 37: p. 101355. [CrossRef]
- Aly, A.A., T. Górecki, and M.A. Omar, Green approaches to comprehensive two-dimensional liquid chromatography (LC × LC). Journal of Chromatography Open, 2022. 2: p. 100046. [CrossRef]
- Atapattu, S.N., Applications and retention properties of alternative organic mobile phase modifiers in reversed-phase liquid chromatography. Journal of Chromatography Open, 2024. 5: p. 100135. [CrossRef]
- Ladeira, P.C.C., et al., The Development of a Rapid, Cost-Effective, and Green Analytical Method for Mercury Speciation. 2024. 12(6): p. 424.
- Imam, M.S. and M.M. Abdelrahman, How environmentally friendly is the analytical process? A paradigm overview of ten greenness assessment metric approaches for analytical methods. Trends in Environmental Analytical Chemistry, 2023. 38: p. e00202. [CrossRef]
- Spietelun, A., et al., Recent developments and future trends in solid phase microextraction techniques towards green analytical chemistry. Journal of Chromatography A, 2013. 1321: p. 1-13. [CrossRef]
- Saleh, S.S., et al., Analytical tools for greenness assessment of chromatographic approaches: Application to pharmaceutical combinations of Indapamide, Perindopril and Amlodipine. Microchemical Journal, 2020. 159: p. 105557. [CrossRef]
- Ferreira, S.L.C., et al., Box-Behnken design: An alternative for the optimization of analytical methods. Analytica Chimica Acta, 2007. 597(2): p. 179-186. [CrossRef]
- Pezzatti, J., et al., Choosing an Optimal Sample Preparation in Caulobacter crescentus for Untargeted Metabolomics Approaches. 2019. 9(10): p. 193.
- Stalikas, C., et al., Developments on chemometric approaches to optimize and evaluate microextraction. Journal of Chromatography A, 2009. 1216(2): p. 175-189. [CrossRef]
- Welch, C.J., et al., Greening analytical chromatography. TrAC Trends in Analytical Chemistry, 2010. 29(7): p. 667-680. [CrossRef]
- Asadollahzadeh, M., et al., Response surface methodology based on central composite design as a chemometric tool for optimization of dispersive-solidification liquid–liquid microextraction for speciation of inorganic arsenic in environmental water samples. Talanta, 2014. 123: p. 25-31. [CrossRef]
- Marrubini, G., et al., Experimental designs for solid-phase microextraction method development in bioanalysis: A review. Analytica Chimica Acta, 2020. 1119: p. 77-100. [CrossRef]
- Tortorella, S. and S. Cinti, How Can Chemometrics Support the Development of Point of Need Devices? Analytical Chemistry, 2021. 93(5): p. 2713-2722. [CrossRef]
- Jovana, K., et al., QSRR Approach: Application to Retention Mechanism in Liquid Chromatography, in Novel Aspects of Gas Chromatography and Chemometrics, C.M. Serban, H. Vu Dang, and D. Victor, Editors. 2022, IntechOpen: Rijeka. p. Ch. 7.
- Manzon, D., et al., Quality by Design: Comparison of Design Space construction methods in the case of Design of Experiments. Chemometrics and Intelligent Laboratory Systems, 2020. 200: p. 104002. [CrossRef]
- Sakamoto, T., et al., Succinimidyl (3-[(benzyloxy)carbonyl]-5-oxo-1,3-oxazolidin-4-yl)acetate on a triazole-bonded phase for the separation of dl-amino-acid enantiomers and the mass-spectrometric determination of chiral amino acids in rat plasma. Journal of Chromatography A, 2019. 1585: p. 131-137. [CrossRef]
- Andries, J.P.M., M. Goodarzi, and Y.V. Heyden, Improvement of quantitative structure–retention relationship models for chromatographic retention prediction of peptides applying individual local partial least squares models. Talanta, 2020. 219: p. 121266. [CrossRef]
- Kaliszan, R., QSRR: Quantitative Structure-(Chromatographic) Retention Relationships. Chemical Reviews, 2007. 107(7): p. 3212-3246. [CrossRef]
- Kaliszan, R. and T. Bączek, QSAR in Chromatography: Quantitative Structure–Retention Relationships (QSRRs), in Recent Advances in QSAR Studies: Methods and Applications, T. Puzyn, J. Leszczynski, and M.T. Cronin, Editors. 2010, Springer Netherlands: Dordrecht. p. 223-259.
- Katritzky, A.R., V.S. Lobanov, and M. Karelson, QSPR: the correlation and quantitative prediction of chemical and physical properties from structure. Chemical Society Reviews, 1995. 24(4): p. 279-287. [CrossRef]
- Hansch, C. and T. Fujita, p-σ-π Analysis. A Method for the Correlation of Biological Activity and Chemical Structure. Journal of the American Chemical Society, 1964. 86(8): p. 1616-1626. [CrossRef]
- Hanai, T., Chromatography in silico, basic concept in reversed-phase liquid chromatography. Analytical and Bioanalytical Chemistry, 2005. 382(3): p. 708-717. [CrossRef]
- Lippa, K.A., L.C. Sander, and R.D. Mountain, Molecular Dynamics Simulations of Alkylsilane Stationary-Phase Order and Disorder. 1. Effects of Surface Coverage and Bonding Chemistry. Analytical Chemistry, 2005. 77(24): p. 7852-7861. [CrossRef]
- Kaliszan, R., P. Wiczling, and M.J. Markuszewski, pH Gradient Reversed-Phase HPLC. Analytical Chemistry, 2004. 76(3): p. 749-760. [CrossRef]
- Meek, J.L., Prediction of peptide retention times in high-pressure liquid chromatography on the basis of amino acid composition. 1980. 77(3): p. 1632-1636. [CrossRef]
- Palmblad, M., et al., Prediction of Chromatographic Retention and Protein Identification in Liquid Chromatography/Mass Spectrometry. Analytical Chemistry, 2002. 74(22): p. 5826-5830. [CrossRef]
- Petritis, K., et al., Use of Artificial Neural Networks for the Accurate Prediction of Peptide Liquid Chromatography Elution Times in Proteome Analyses. Analytical Chemistry, 2003. 75(5): p. 1039-1048. [CrossRef]
- Schymanski, E.L., et al., Identifying Small Molecules via High Resolution Mass Spectrometry: Communicating Confidence. Environmental Science & Technology, 2014. 48(4): p. 2097-2098. [CrossRef]
- Bade, R., et al., Critical evaluation of a simple retention time predictor based on LogKow as a complementary tool in the identification of emerging contaminants in water. Talanta, 2015. 139: p. 143-149. [CrossRef]
- Bade, R., et al., LC-HRMS suspect screening to show spatial patterns of New Psychoactive Substances use in Australia. Science of The Total Environment, 2019. 650: p. 2181-2187. [CrossRef]
- McEachran, A.D., et al., A comparison of three liquid chromatography (LC) retention time prediction models. Talanta, 2018. 182: p. 371-379. [CrossRef]
- Noreldeen, H.A.A., et al., Quantitative structure-retention relationships model for retention time prediction of veterinary drugs in food matrixes. International Journal of Mass Spectrometry, 2018. 434: p. 172-178. [CrossRef]
- Garcia-Perez, I., et al., Identifying unknown metabolites using NMR-based metabolic profiling techniques. Nature Protocols, 2020. 15(8): p. 2538-2567. [CrossRef]
- He, B., et al., Analytical techniques for biomass-restricted metabolomics: An overview of the state-of-the-art. Microchemical Journal, 2021. 171: p. 106794. [CrossRef]
- Letertre, M.P.M., G. Dervilly, and P. Giraudeau, Combined Nuclear Magnetic Resonance Spectroscopy and Mass Spectrometry Approaches for Metabolomics. Analytical Chemistry, 2021. 93(1): p. 500-518. [CrossRef]
- Goryński, K., et al., Quantitative structure–retention relationships models for prediction of high performance liquid chromatography retention time of small molecules: Endogenous metabolites and banned compounds. Analytica Chimica Acta, 2013. 797: p. 13-19. [CrossRef]
- Jinno, K. and K.D. Bartle, A computer assisted chromatography system: Hüthig, Heidelberg, 1990 (ISBN 3-7785-1487-0). viii + 271 pp. Analytica Chimica Acta, 1991. 243: p. 321-322. [CrossRef]
- Kaliszan, R., Retention data from affinity high-performance liquid chromatography in view of chemometrics. Journal of Chromatography B: Biomedical Sciences and Applications, 1998. 715(1): p. 229-244. [CrossRef]
- Nowak, P.M., R. Wietecha-Posłuszny, and J. Pawliszyn, White Analytical Chemistry: An approach to reconcile the principles of Green Analytical Chemistry and functionality. TrAC Trends in Analytical Chemistry, 2021. 138: p. 116223. [CrossRef]
- Tache, F., et al., Estimation of the lipophilic character of flavonoids from the retention behavior in reversed phase liquid chromatography on different stationary phases: A comparative study. Journal of Pharmaceutical and Biomedical Analysis, 2012. 57: p. 82-93. [CrossRef]
- Stella, C., et al., Silica and other materials as supports in liquid chromatography. Chromatographic tests and their importance for evaluating these supports. Part II. Chromatographia, 2001. 53(1): p. S132-S140. [CrossRef]
- Taraji, M., et al., Rapid Method Development in Hydrophilic Interaction Liquid Chromatography for Pharmaceutical Analysis Using a Combination of Quantitative Structure–Retention Relationships and Design of Experiments. Analytical Chemistry, 2017. 89(3): p. 1870-1878. [CrossRef]
- Davis, J.M. and J.C. Giddings, Statistical theory of component overlap in multicomponent chromatograms. Analytical Chemistry, 1983. 55(3): p. 418-424. [CrossRef]
- Vanderheyden, Y., K. Broeckhoven, and G. Desmet, Peak deconvolution to correctly assess the band broadening of chromatographic columns. Journal of Chromatography A, 2016. 1465: p. 126-142. [CrossRef]
- Wahab, M.F., et al., Power Law Approach as a Convenient Protocol for Improving Peak Shapes and Recovering Areas from Partially Resolved Peaks. Chromatographia, 2019. 82(1): p. 211-220. [CrossRef]
- Patel, D.C., et al., Separations at the Speed of Sensors. Analytical Chemistry, 2018. 90(5): p. 3349-3356. [CrossRef]
- Castledine, J.B. and A.F. Fell, Strategies for peak-purity assessment in liquid chromatography. Journal of Pharmaceutical and Biomedical Analysis, 1993. 11(1): p. 1-13. [CrossRef]
- Sousa, A.V., et al. Automatic Lane and Band Detection in Images of Thin Layer Chromatography. in Image Analysis and Recognition. 2004. Berlin, Heidelberg: Springer Berlin Heidelberg.
- Chang, Y.-Y., et al., Comparison of three chemometric methods for processing HPLC-DAD data with time shifts: Simultaneous determination of ten molecular targeted anti-tumor drugs in different biological samples. Talanta, 2021. 224: p. 121798. [CrossRef]
- Komsta, Ł., Y. Vander Heyden, and J. Sherma, Chemometrics in Chromatography. 2018: CRC Press.
- Bukkapatnam, V., M. Annapurna, and K. Routhu, Experimental Design Methodology for Simultaneous Determination of Anti-Diabetic Drugs by Reverse Phase Liquid Chromatographic Method. Indian Journal of Pharmaceutical Sciences, 2021. 83. [CrossRef]
- Gigovska, M., et al., Chemometrically assisted optimization, development and validation of UPLC method for the analysis of simvastatin. Macedonian Pharmaceutical Bulletin, 2018. 64: p. 25-38. [CrossRef]
- Agrawal, R., S. Belemkar, and C. Bonde, A Stepwise Strategy Employing Automated Screening for Reversed-Phase Chromatographic Separation of Itraconazole and Its Impurities. Chromatographia, 2019. 82(12): p. 1767-1775. [CrossRef]
- Nath, D. and B. Sharma, Impurity Profiling-A Significant Approach in Pharmaceuticals. Current Pharmaceutical Analysis, 2019. 15(7): p. 669-680. [CrossRef]
- Attimarad, M., et al., Mathematically Processed UV Spectroscopic Method for Quantification of Chlorthalidone and Azelnidipine in Bulk and Formulation: Evaluation of Greenness and Whiteness. 2022. 2022(1): p. 4965138. [CrossRef]
- Elsonbaty, A., et al., Analysis of quinary therapy targeting multiple cardiovascular diseases using UV spectrophotometry and chemometric tools. Spectrochimica Acta Part A: Molecular and Biomolecular Spectroscopy, 2020. 238: p. 118415. [CrossRef]
- Attia, K.A.M., et al., A sustainable data processing approach using ultraviolet-spectroscopy as a powerful spectral resolution tool for simultaneously estimating newly approved eye solution in the presence of extremely carcinogenic impurity aided with various greenness and whiteness assessment perspectives: Application to aqueous humor. 2023. 47(5): p. 17475198231195811. [CrossRef]
- Hassan, S.A., et al., Advanced chemometric methods as powerful tools for impurity profiling of drug substances and drug products: Application on bisoprolol and perindopril binary mixture. Spectrochimica Acta Part A: Molecular and Biomolecular Spectroscopy, 2022. 267: p. 120576. [CrossRef]
- Sharaf, Y.A., et al., Green Chemometric Determination of Cefotaxime Sodium in the Presence of Its Degradation Impurities Using Different Multivariate Data Processing Tools; GAPI and AGREE Greenness Evaluation. 2023. 28(5): p. 2187.
- Halim, M.K., O.M. Badran, and A.E.F. Abbas, Greenness, blueness and whiteness evaluated-chemometric approach enhanced by Latin hypercube technique for the analysis of lidocaine, diclofenac and carcinogenic impurity 2,6-dimethylaniline. Sustainable Chemistry and Pharmacy, 2024. 38: p. 101463. [CrossRef]
- Gathungu, R.M., et al., The integration of LC-MS and NMR for the analysis of low molecular weight trace analytes in complex matrices. Mass Spectrom Rev, 2020. 39(1-2): p. 35-54. [CrossRef]
- Skibiński, R. and J. Trawiński, Application of an Untargeted Chemometric Strategy in the Impurity Profiling of Pharmaceuticals: An Example of Amisulpride. Journal of Chromatographic Science, 2016. 55(3): p. 309-315. [CrossRef]
- Plumb, R.S., et al., A Rapid Simple Approach to Screening Pharmaceutical Products Using Ultra-Performance LC Coupled to Time-of-Flight Mass Spectrometry and Pattern Recognition. Journal of Chromatographic Science, 2008. 46(3): p. 193-198. [CrossRef]
- KATAKAM, P., et al., An Experimental Design Approach for Impurity Profiling of Valacyclovir-Related Products by RP-HPLC. 2014. 82(3): p. 617-630.
- Elkhoudary, M.M., A.A.R. Salam, and M.G. Hadad, Robustness Testing in HPLC Analysis of Clarithromycin, Norfloxacin, Doxycycline, Tinidazole and Omeprazole in Pharmaceutical Dosage forms Using Experimental Design. Current Pharmaceutical Analysis, 2014. 10(1): p. 58-70. [CrossRef]
- Boussès, C., et al., Using an innovative combination of quality-by-design and green analytical chemistry approaches for the development of a stability indicating UHPLC method in pharmaceutical products. Journal of Pharmaceutical and Biomedical Analysis, 2015. 115: p. 114-122. [CrossRef]
- Wiberg, K., Quantitative impurity profiling by principal component analysis of high-performance liquid chromatography–diode array detection data. Journal of Chromatography A, 2006. 1108(1): p. 50-67. [CrossRef]
- Kamel, E.B., Two green chromatographic methods for the quantification of tamsulosin and solifenacin along with four of their impurities. 2022. 45(7): p. 1305-1316. [CrossRef]
- Edrees, F.H., et al., Experimentally designed chromatographic method for the simultaneous analysis of dimenhydrinate, cinnarizine and their toxic impurities. RSC Advances, 2021. 11(3): p. 1450-1460. [CrossRef]
- Arase, S., et al., Intelligent peak deconvolution through in-depth study of the data matrix from liquid chromatography coupled with a photo-diode array detector applied to pharmaceutical analysis. Journal of Chromatography A, 2016. 1469: p. 35-47. [CrossRef]
- Pérez, R.L. and G.M. Escandar, Liquid chromatography with diode array detection and multivariate curve resolution for the selective and sensitive quantification of estrogens in natural waters. Analytica Chimica Acta, 2014. 835: p. 19-28. [CrossRef]
- Kalinowska, K., M. Bystrzanowska, and M. Tobiszewski, Chemometrics approaches to green analytical chemistry procedure development. Current Opinion in Green and Sustainable Chemistry, 2021. 30: p. 100498. [CrossRef]
- Narenderan, S.T., S.N. Meyyanathan, and V.V.S.R. Karri, Experimental design in pesticide extraction methods: A review. Food Chemistry, 2019. 289: p. 384-395. [CrossRef]
- Dejaegher, B. and Y.V. Heyden, Experimental designs and their recent advances in set-up, data interpretation, and analytical applications. J Pharm Biomed Anal, 2011. 56(2): p. 141-58. [CrossRef]
- Patel, M.N., et al., Correction to: Comparative Study of the UV-Chemometrics, Ratio Spectra Derivative and HPLC-QbD Methods for the Simultaneous Estimation of Carisoprodol, Paracetamol and Caffeine in Its Triple Combination Formulation CARISOMA. Chromatographia, 2021. 84(3): p. 313-313. [CrossRef]
- Bystrzanowska, M. and M. Tobiszewski, Chemometrics for Selection, Prediction, and Classification of Sustainable Solutions for Green Chemistry—A Review. 2020. 12(12): p. 2055.
- Roberto de Alvarenga Junior, B. and R. Lajarim Carneiro, Chemometrics Approaches in Forced Degradation Studies of Pharmaceutical Drugs. 2019. 24(20): p. 3804.
- Huynh-Ba, K. and M. Dong, Stability Studies and Testing of Pharmaceuticals: An Overview. Lc Gc North America, 2020. 38: p. 325.
- Lafossas, C., F. Benoit-Marquié, and J.C. Garrigues, Analysis of the retention of tetracyclines on reversed-phase columns: Chemometrics, design of experiments and quantitative structure-property relationship (QSPR) study for interpretation and optimization. Talanta, 2019. 198: p. 550-559. [CrossRef]
- Ansari, S., et al., Bi2O3/ZnO nanocomposite: Synthesis, characterizations and its application in electrochemical detection of balofloxacin as an anti-biotic drug. Journal of Pharmaceutical Analysis, 2021. 11(1): p. 57-67. [CrossRef]
- Godoy, J.L., J.R. Vega, and J.L. Marchetti, Relationships between PCA and PLS-regression. Chemometrics and Intelligent Laboratory Systems, 2014. 130: p. 182-191. [CrossRef]
- Golubović, J.B., et al., Quantitative structure retention relationship modeling in liquid chromatography method for separation of candesartan cilexetil and its degradation products. Chemometrics and Intelligent Laboratory Systems, 2015. 140: p. 92-101. [CrossRef]
- Feng, X., et al., Determination of the paracetamol degradation process with online UV spectroscopic and multivariate curve resolution-alternating least squares methods: comparative validation by HPLC. Analytical Methods, 2013. 5(19): p. 5286-5293. [CrossRef]
- Attia, K.A., et al., Stability indicating methods for the analysis of cefprozil in the presence of its alkaline induced degradation product. Spectrochim Acta A Mol Biomol Spectrosc, 2016. 159: p. 1-6. [CrossRef]
- Marín-García, M., et al., Investigation of the photodegradation profile of tamoxifen using spectroscopic and chromatographic analysis and multivariate curve resolution. Chemometrics and Intelligent Laboratory Systems, 2018. 174: p. 128-141. [CrossRef]
Figure 1.
Number of publications in metabolomics reported by Scopus [1999–2023].
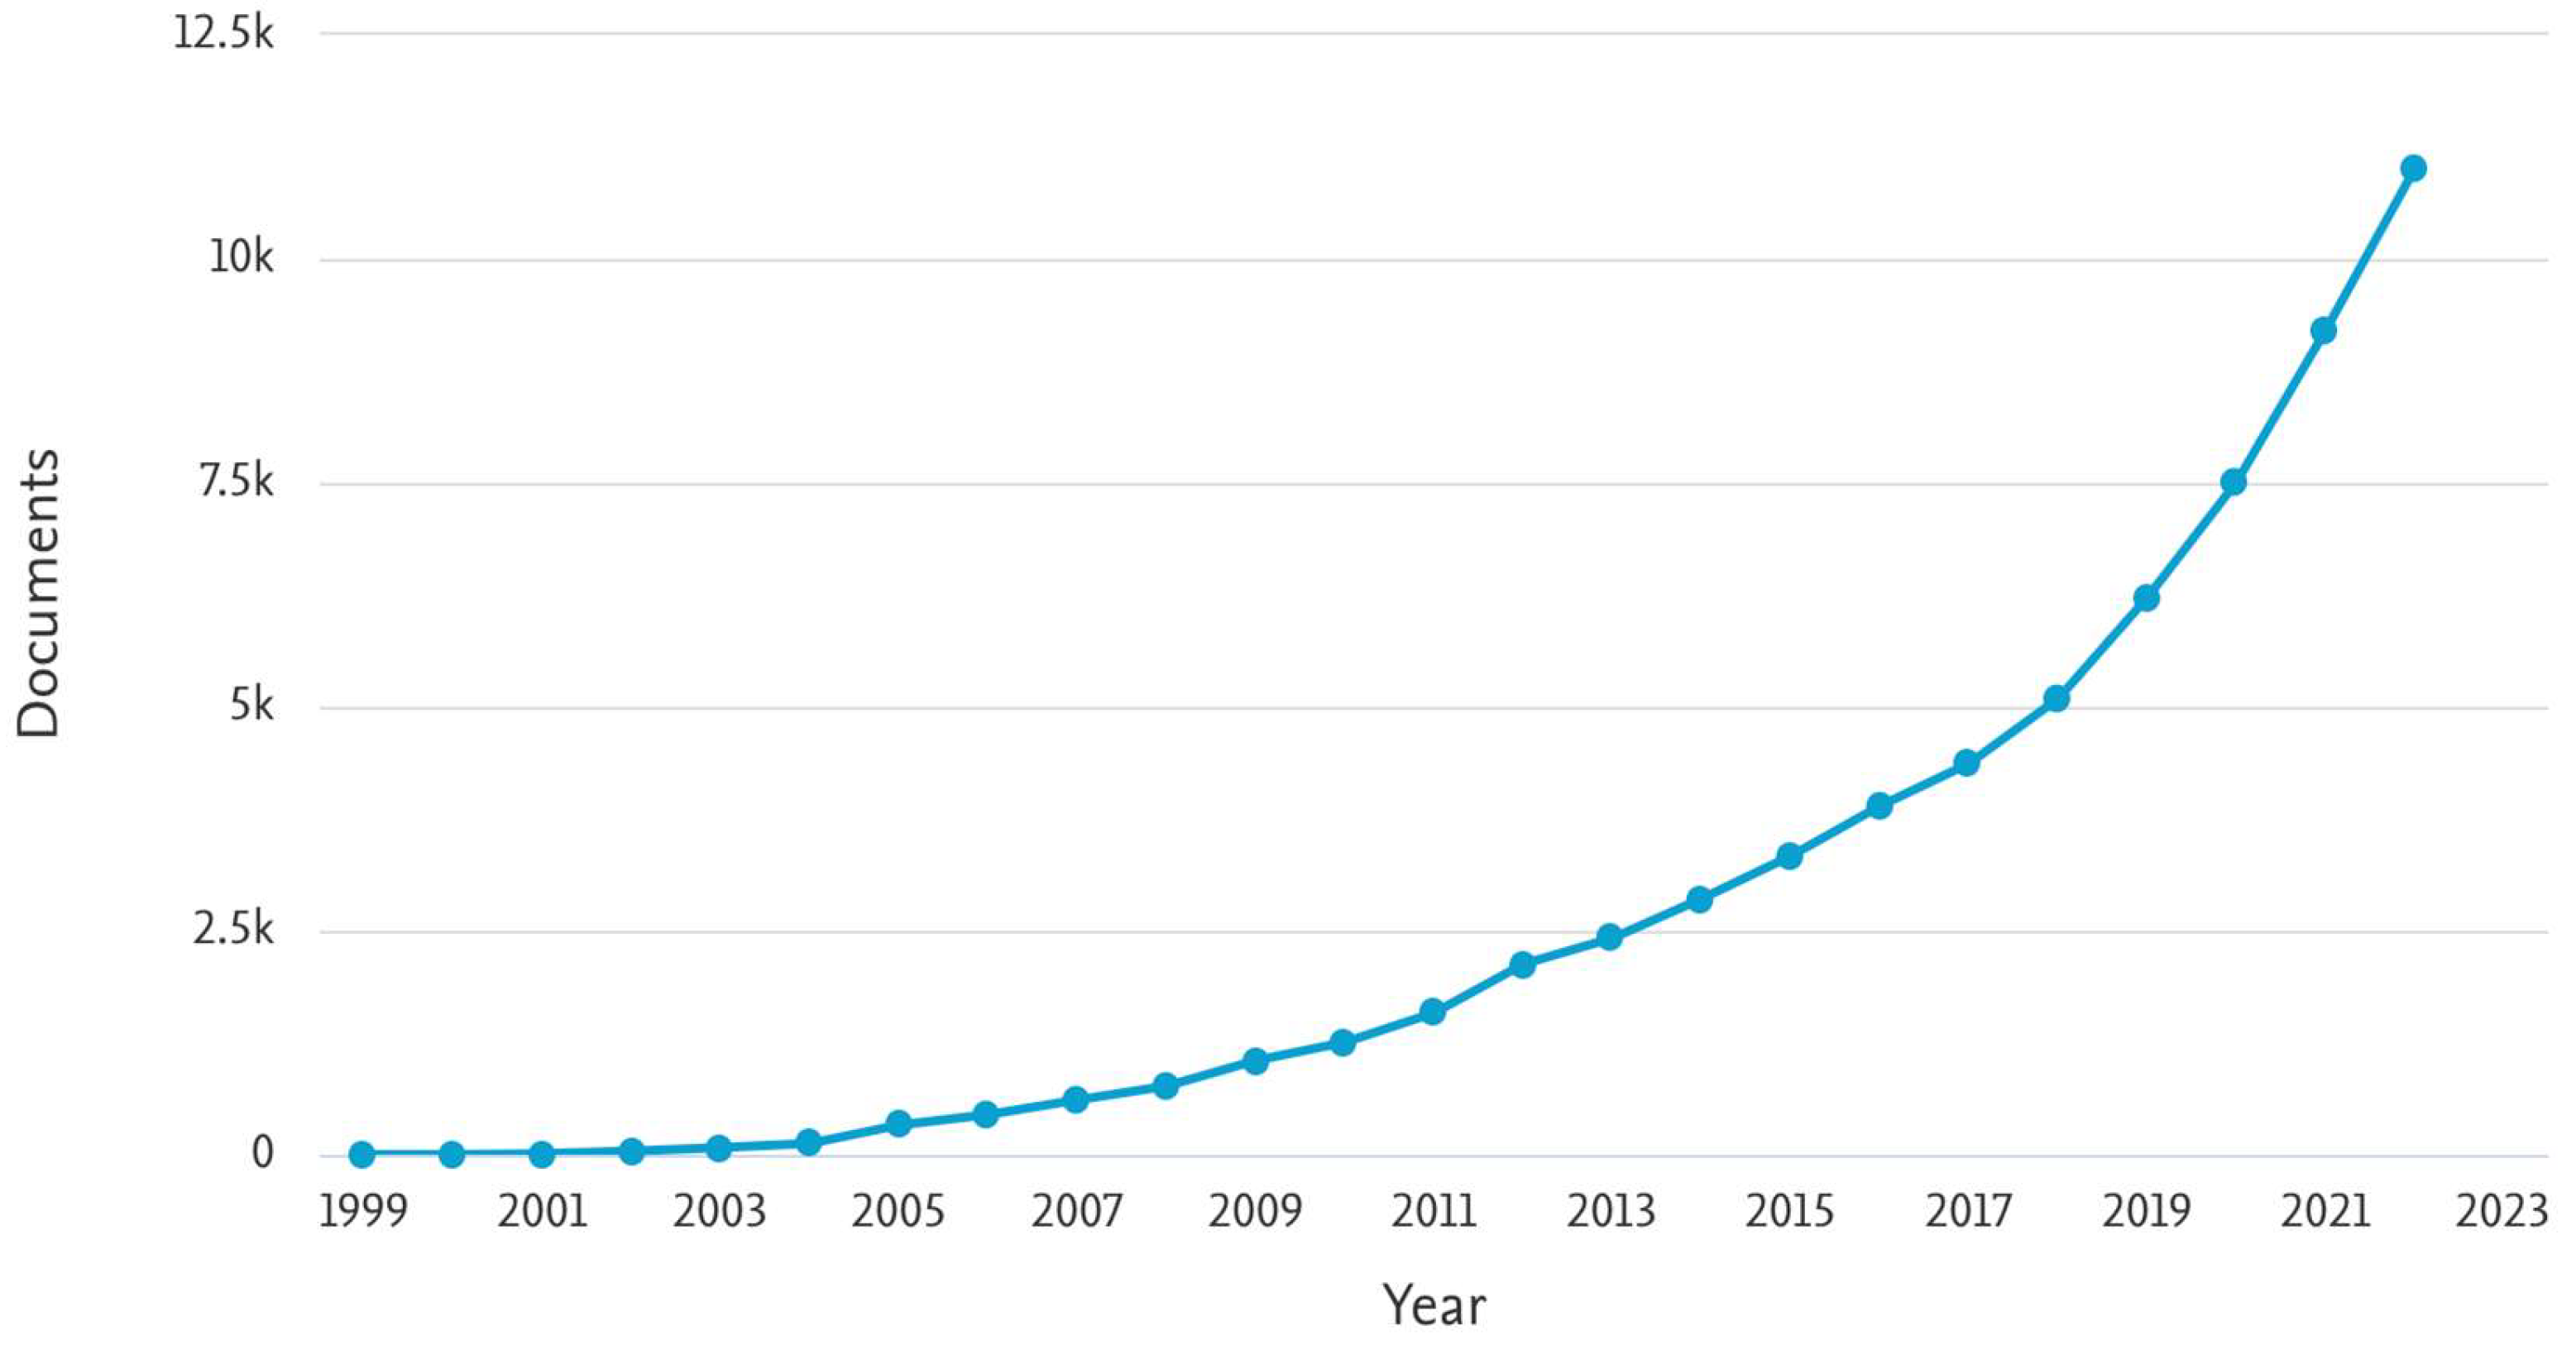
Figure 2.
The three stages, screening, optimization and robustness testing for a design of experiment approach[50].
Figure 2.
The three stages, screening, optimization and robustness testing for a design of experiment approach[50].
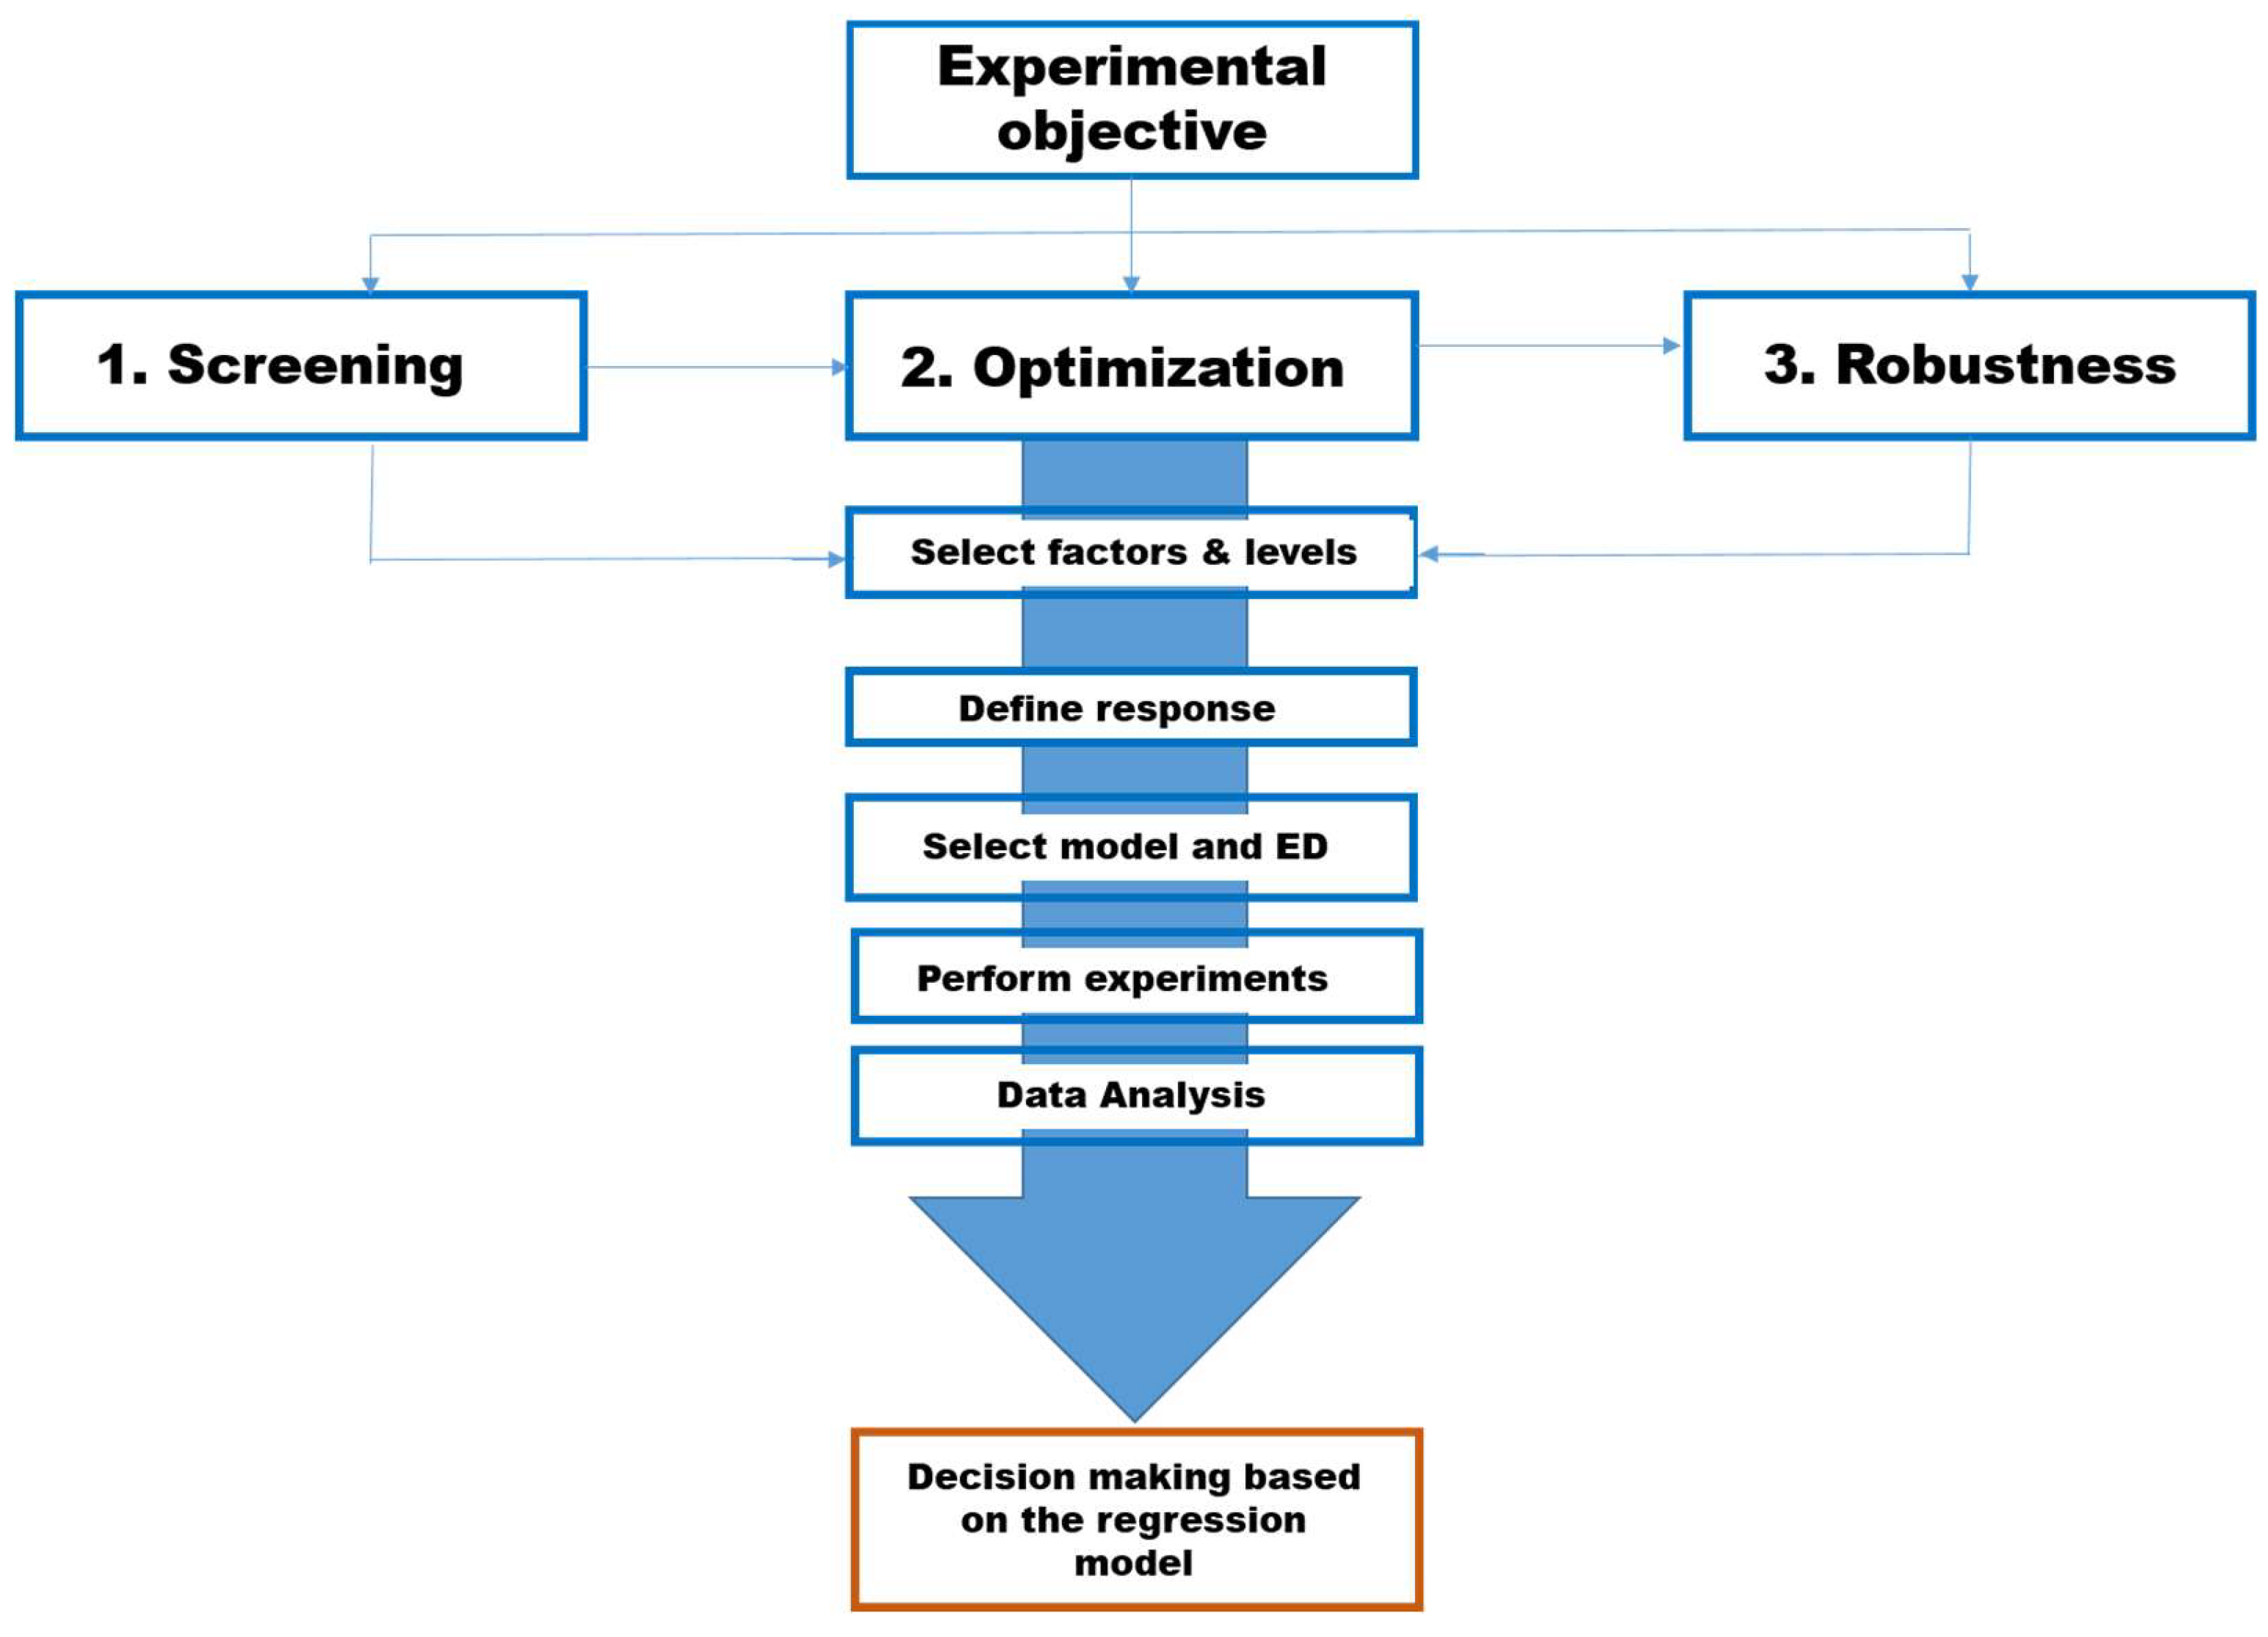
Figure 3.
Methodology and goals of QSRR studies[100].
Figure 3.
Methodology and goals of QSRR studies[100].
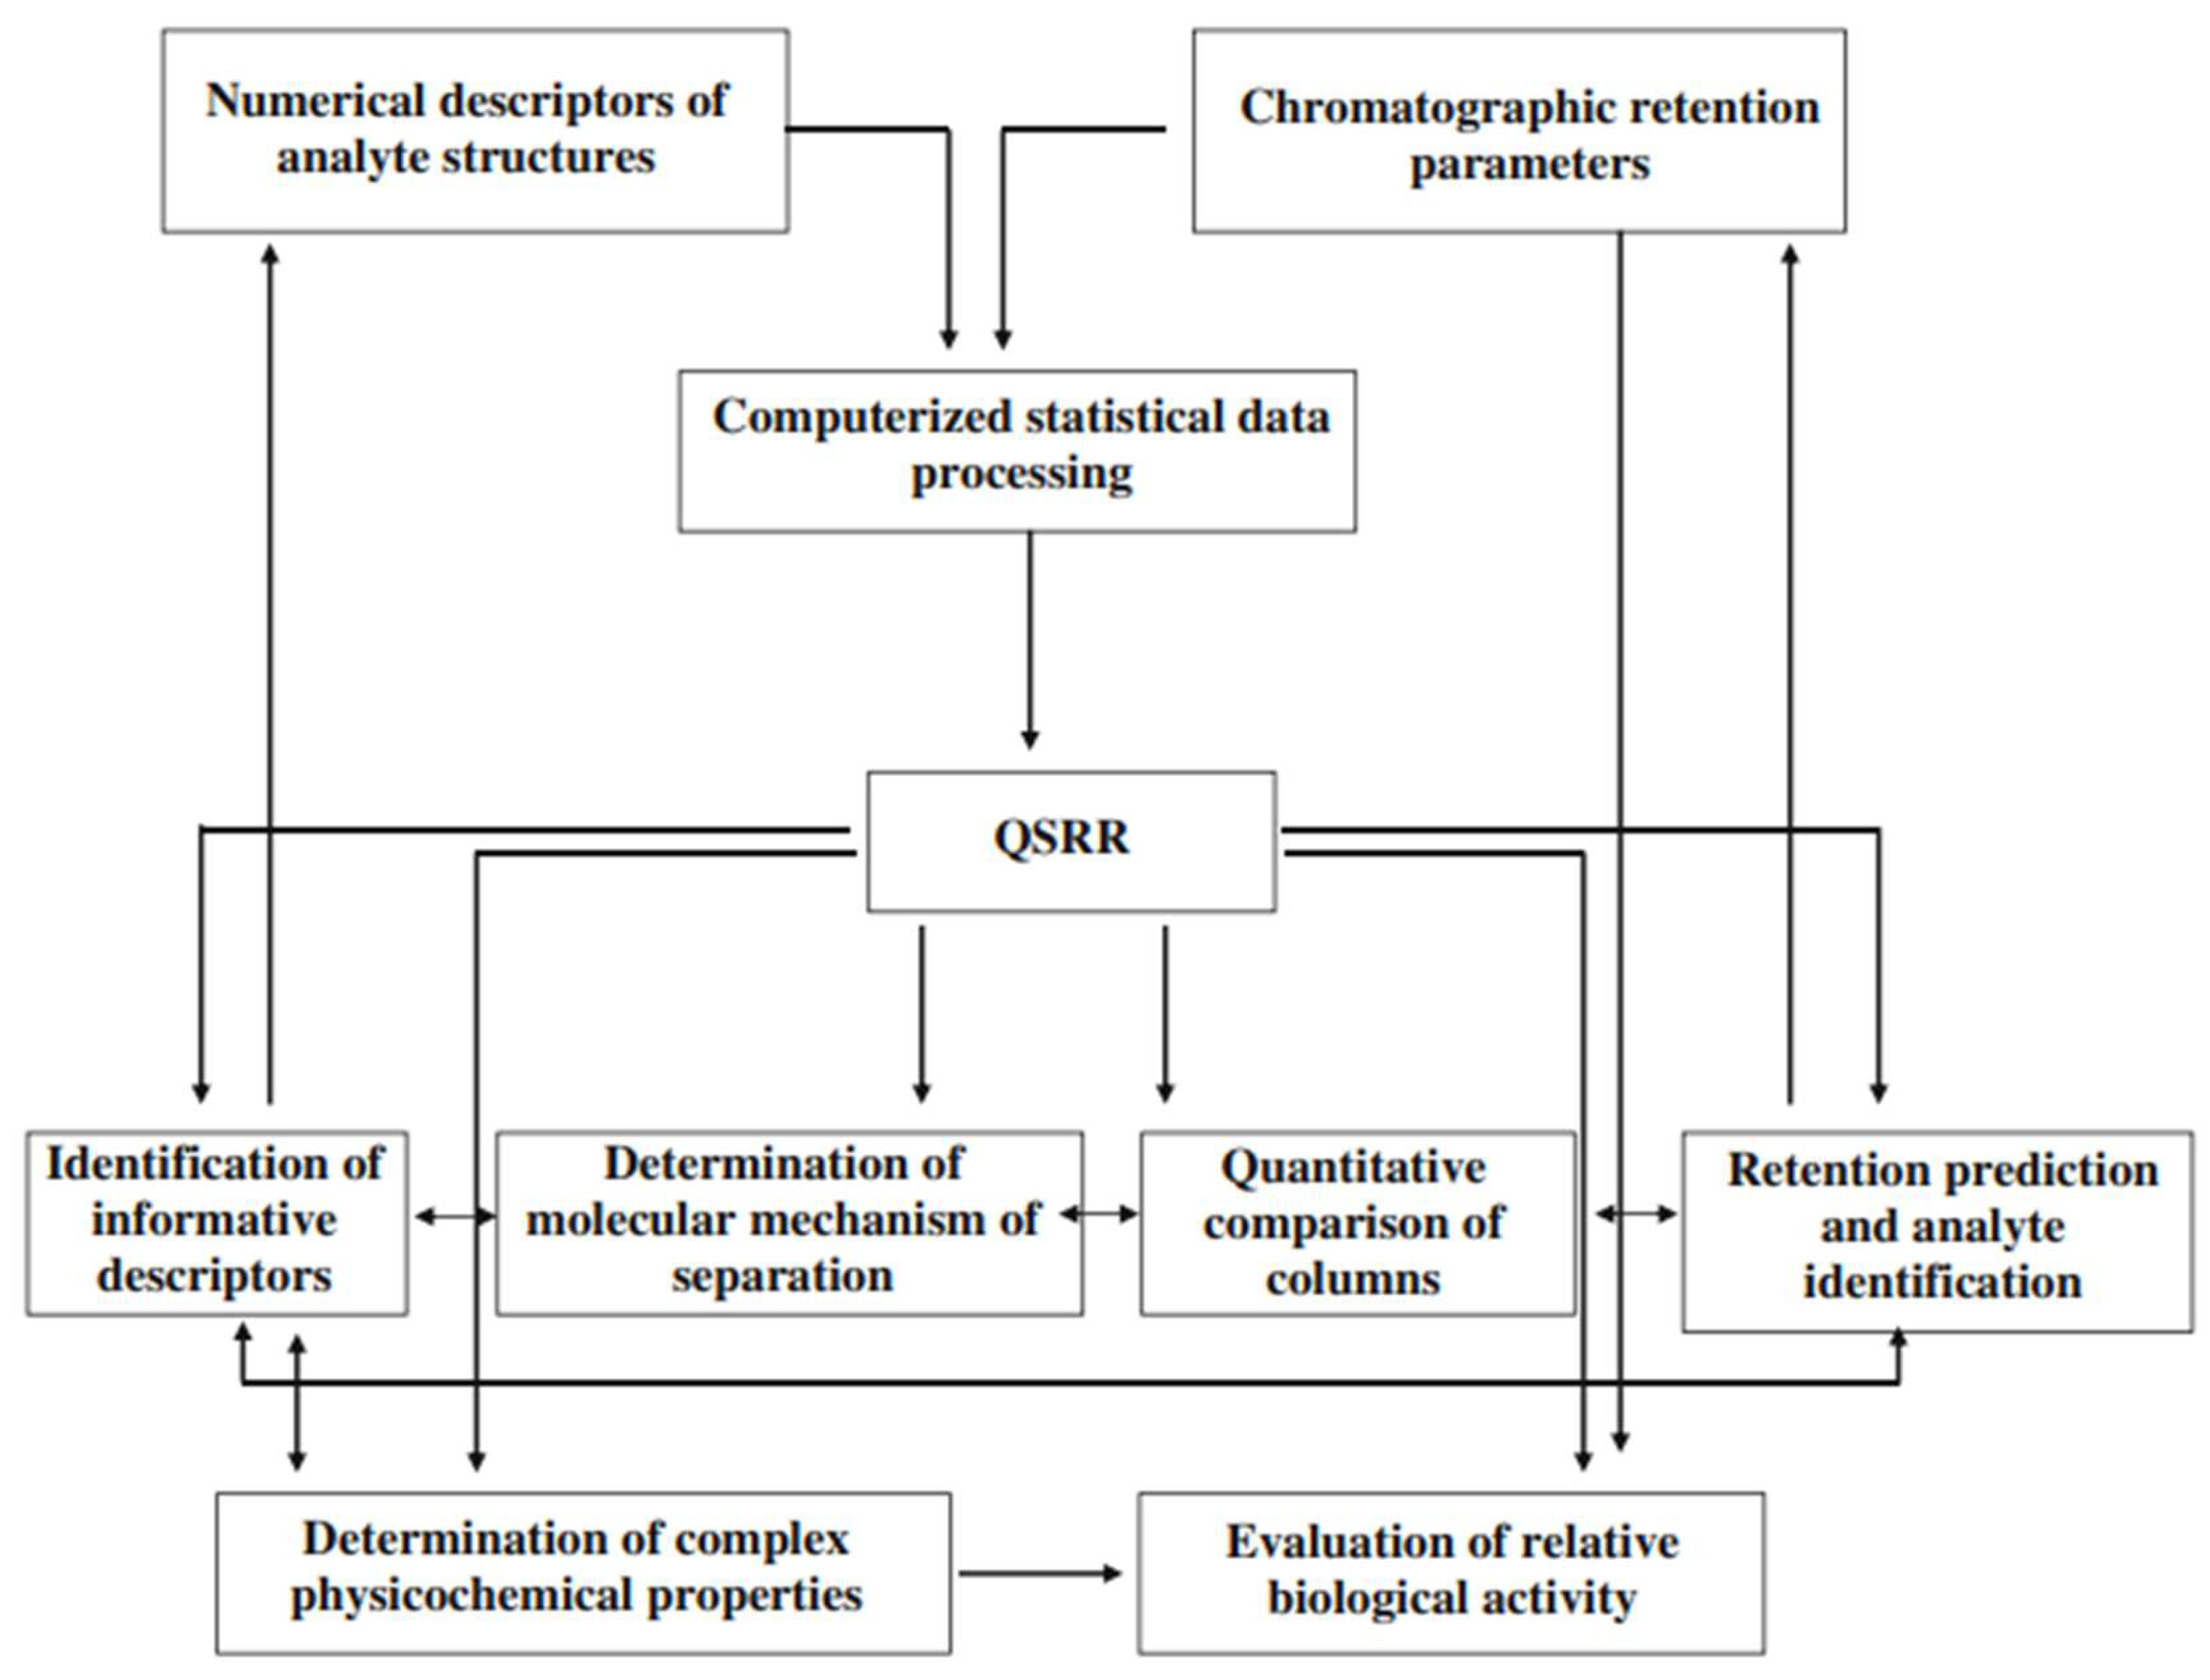

Table 1.
Main types of molecular descriptors.
| Types | Definition | Examples |
|---|---|---|
| Constitutional descriptors | They are derived from the molecular formula and describe the composition and connectivity of atoms within a molecule without considering its 3D structure | 1-Molecular weight 2-count of atoms and bonds 3-counts of rings |
| Topological descriptors | These descriptors capture information about the molecule's topology and how the atoms are connected to one another without considering their 3D spatial arrangement | 1- Wiener Index: 2- Kier and Hall Indices 3- Randic Index (Connectivity Index) |
| Electrostatic descriptors | They describe the distribution of electronic charge within a molecule. | 1-Partial Atomic Charges 2-polarity indices 3- charged partial surface area |
| Geometrical descriptors | These descriptors capture the 3D geometry of a molecule, which is critical for understanding its interactions with other molecules | 1-Molecular volume 2-Solvent-accessible molecular surface 3-Principale moment of intera |
| Quantum-chemical descriptors | They are derived from quantum chemical calculations. And provide information about internal electronic property which are crucial for understanding its reactivity, stability, and interactions with other molecules or environments | 1- HOMO and LUMO Energies 2- Dipole Moment 3- Electron Density Distribution |
Table 2.
Application of Chemometric Tools in Forced Degradation Studies.
| Chemometric Tool | Application | Variables/Factors | Experimental Design | Key Results/Findings | Example Study |
|---|---|---|---|---|---|
| DoE (Design of Experiments) | Used for systematic method optimization by exploring the effects of multiple factors on outputs | Variables: solvent composition, temperature, pH, etc. | Fractional factorial design or other experimental designs | Identifies critical factors affecting chromatographic separation and drug stability | Example: DoE was applied to optimize RP-HPLC conditions for degradation products of candesartan cilexetil [163]. |
| PCA (Principal Component Analysis) | Dimensionality reduction, used to identify key components in complex datasets | PCA uses components derived from spectral or chromatographic data | No specific design; based on matrix decomposition of the data set | Helps in identifying major components contributing to variability, removing noise from data | Example: PCA identified four components in alkaline degradation of paracetamol [164]. |
| PLS (Partial Least Squares) | Correlates input variables (X) with responses (Y) to predict concentration profiles | Variables: UV-VIS spectra, MS data, chromatographic factors | PLS regression is used to maximize the covariance between predictor variables and response variables | Provides concentration profiles and spectral profiles in the context of forced degradation | Example: PLS was used for correlating degradation profiles of Cefprozil upon Basic hydrolysis [165] |
| MCR-ALS (Multivariate Curve Resolution-Alternating Least Squares) | Decomposes complex mixtures into individual chemical species to study degradation profiles | Variables: Spectral data (UV-VIS, MS), concentration profile of analytes | Iterative least-squares approach with constraints (e.g., non-negativity, unimodality) | Extracts pure component spectra and concentration profiles, identifies intermediates and degradation pathways | Example: MCR-ALS revealed four components in the photodegradation of tamoxifen[166] |
| ANN (Artificial Neural Networks) | Used to model nonlinear relationships and predict chromatographic behavior | Input variables: molecular descriptors (polarizability, H-bond donors, etc.), chromatographic conditions | ANN uses multi-layer feedforward networks and Box-Behnken design for training and validation | Achieves high predictive accuracy (R² > 0.99) and avoids overfitting in chromatographic optimization | Example: ANN predicted retention factors and optimized RP-HPLC conditions for the separation of degradation products of candesartan cilexetil [163]. |
Disclaimer/Publisher’s Note: The statements, opinions and data contained in all publications are solely those of the individual author(s) and contributor(s) and not of MDPI and/or the editor(s). MDPI and/or the editor(s) disclaim responsibility for any injury to people or property resulting from any ideas, methods, instructions or products referred to in the content. |
© 2024 by the authors. Licensee MDPI, Basel, Switzerland. This article is an open access article distributed under the terms and conditions of the Creative Commons Attribution (CC BY) license (http://creativecommons.org/licenses/by/4.0/).
Copyright: This open access article is published under a Creative Commons CC BY 4.0 license, which permit the free download, distribution, and reuse, provided that the author and preprint are cited in any reuse.


