1. Introduction
Japanese quince (Chaenomeles japonica (Thumb.) Lindl. Ex Spach) (JQ) is ornamental plant originating from Asia. In Europe is best adopted in northern part of Europe, including Poland. The fruit are used to produce candied fruits, juices, wines [
1] or jams. The seeds of Japanese quince contain 6% to 16% of oil, depending of extraction method [
2]. Cold-pressed oil from Japanese quince (Chaenomeles japonica) seeds (JQSO) is gaining recognition for its unique nutritional and functional properties. Extracted without heat or chemical solvents, preserves the oil’s bioactive compounds. Its fatty acid profile is dominated by three fatty acids C18:2(52%), C18:1(35%) and C16:0(10%) [
2,
3,
4]. So, JQSO is a rich source of essential fatty acids, particularly linoleic acid (omega-6) and oleic acid (omega-9), Additionally, JQSO contains significant amounts of α-tocopherol (97% of total tocopherol isomers), which is one of the highest among many other oils, as well as carotenoids, with dominant presence of beta-carotene, and polyphenolic compounds [
3,
5]. These compounds exhibit antioxidant and anti-inflammatory effects [
3,
6,
7]. They enhance the oil’s antioxidant properties, neutralizing free radicals and protecting cells from oxidative stress. The oil also exhibits very good oxidative stability, an important factor for shelf life and usability in various applications. JQSO includes phytosterols where most present is β-sitosterol (82%) which acts as stabilizer of phospholipid bilayers in cell membranes.
Five phenols (−)-epicatechin, (+)-catechin, chlorogenic acid, rutin, and isoquercitrin were identified in all the three cultivars Rasa, Darius, and Rondo, using the HPLC method [
8]. The predominant phenols in all cultivars were flavan-3-ols (catechin and epicatechin), which account for around 94% of the total amount [
8]. It was also reported that all cultivars have accumulated high levels of proanthocyanidins [
8]. Similar results were demonstrated where 11 phenols were determined with a distribution of procyanidins (57.8%), (−)-epicatechin (33%), and chlorogenic acid (4.4%) [
9]. In addition, 24 phenols were identified in the study of five Chaenomeles species including JQ, and they reported variations in their antioxidant activity and the quantity of compounds, such as chlorogenic acid, catechin, epicatechin, procyanidins B1 and B2 [
10]. From 12 detected phenols in seeds, procyanidin B2 and C1, and (−)-epicatechin were predominant [
11].
Compared to other cold-pressed oils like flaxseed or sunflower oil, JQSO offers a unique balance of fatty acids and antioxidants including its the highest tocopherol content among many commonly used oils. This makes it a valuable ingredient not only in food [
5] but also in cosmetics and pharmaceuticals [
3,
12].
In above presented studies all chemical characteristic of JQSO including fatty acids composition, presence of sterols, total phenolics, presence of tocopherols and antioxidants has been thoroughly described. However, in our opinion, there are some other properties that could further characterize this oil based on physical methods, providing deeper insight into molecular level of the reported parameters. To fulfill those expectations, we applied differential scanning calorimetry (DSC), Langmuir monolayer studies, and spectroscopic methods, including UV-Vis absorption, excitation-emission matrix fluorescence, synchronous fluorescence and FTIR spectra.
DSC is extensively used studying the conformational transitions of macromolecules and measuring directly the enthalpy associated with such processes. The enthalpy, as a thermodynamic potential, contains all the information regarding thermodynamic behavior of the system. DSC thermograms provides detailed information regarding energetics and mechanisms of the existing transitions.
Monolayer studies and oscillatory dilatational rheology provide information regarding the effectiveness of intermolecular interactions within this monolayer, which are attributed to the structural properties of the oil, including the presence of both saturated and unsaturated fatty acids that facilitate the formation of stable molecular structures. Meanwhile, the viscoelasticity modulus represents the viscoelastic properties of the monolayer, combining both elasticity and viscosity, and offers insight into the oil’s ability to withstand mechanical deformations. Such information is important because it determines oils emulsification ability.
The FTIR spectra are collected to determine the functional groups present in the oil and to give insight into composition of the sample. Absorption spectra in the ultraviolet (UV) and visible (Vis) regions with its position and intensity provide essential information about the electronic structure of molecules. Thus, allowing for its identification and determine its concentration, especially in mixtures.
2. Results and Discussion
2.1. Differential Scanning Calorimetry (DSC) Measurements
Differential scanning calorimetry (DSC) is a widely used calorimetric technique for the characterization of the thermal behavior of oils and fats. The parameters obtained from thermograms are very often statistically correlated with composition, chemical parameters or oxidative stability of edible oils. DSC technique used on oils and fats, allows to determine solid fat content study polymorphic crystal forms, obtain enthalpy and thermal properties of the transitions. The information derived from heat capacity function allow the determination of enthalpy of the system ΔH, entropy ΔS and melting temperature Tm and all of them giving opportunity to calculate standard Gibbs energy ΔG0 for the transition.
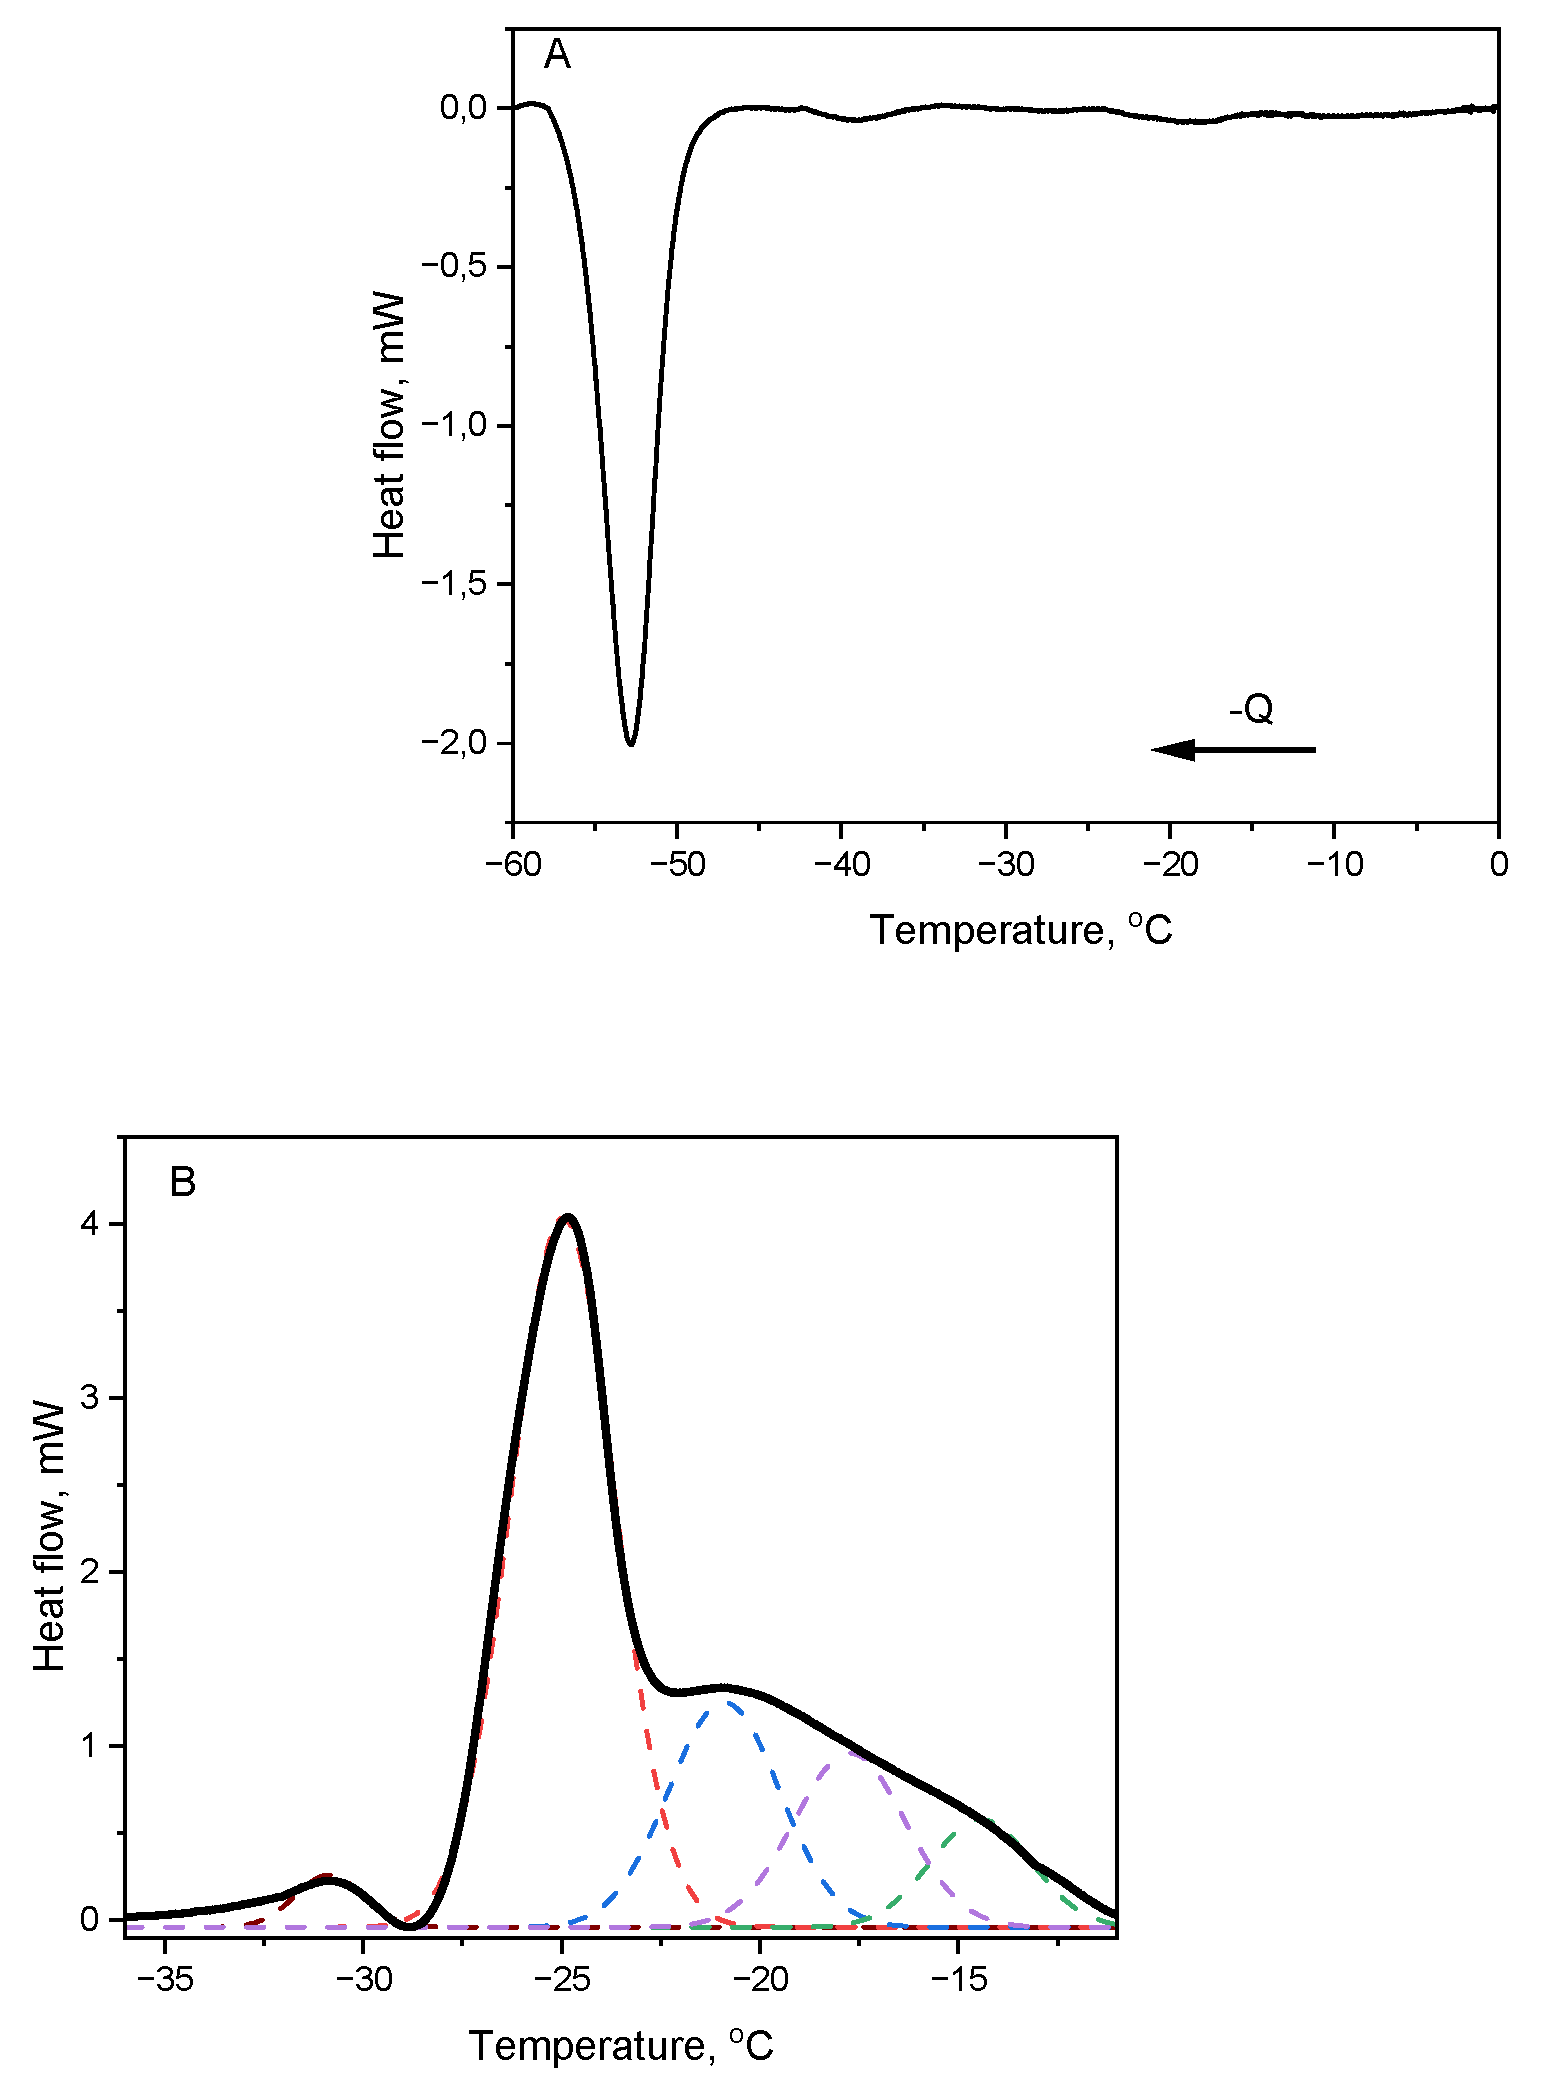
The cooling and heating profiles of Japanese quince seed oil (JQSO) are shown in
Figure 1. It shows for cooling trace one strong, wide band with maximum at -52,8 °C,
Figure 1a, indicating crystallization of different triglycerides (TAG) fractions present in oil. Such low crystallization temperature indicates on the dominant presence of TAGs composed from unsaturated fatty acids. However, on thermogram we may notice barley seen bands at -39°C and -18°C indicating, very probably, presence of TAGs or other structural forms as diglycerides composed of mixed saturated and unsaturated fatty acids.
The melting phase transitions were observed in the form of one very week band at -30.9 °C, one sharp peak with maximum at -28.4°C overlapped with lower intensity but wide band showing maximum at -21.6 °C, covering range from -22°C to -10°C (
Figure 1b). The parameters of the bands, including position of maximum T and its enthalpy ΔH, calculated from the crystallization and melting plots are presented in
Table 1. It shows complex presence of TAG structures.
Deconvolution of DSC Transitions
To retrieve all thermodynamic components involved in the melting process, we applied the deconvolution method to the entire heating trace. The graphical results of the calculations are presented as plots with broken lines in
Figure 1b. From this fitting procedure we obtained five peaks located at -30.8°C, -24.9°C, -20.9°C, -17.7°C and -14.4°C. Interestingly, the widths of all fitted peaks are around 3°C, indicating similarity between structures.
In the DSC method, the area under the curve is proportional to the enthalpy of the transition. Therefore, we may assume that fresh, cold-pressed JQSO contains at least five different TAG structures. Additionally, the area of the last three deconvolved peaks decreasing with rising temperature, indicating structural differences among them. This pattern clearly illustrates the sequence of melting intermediates well describing the whole melting process of JQSO.
According to [
6,
11] the fatty acids profile of JQSO is dominated by C18:2, C 18:1 and C16:0 fatty acids which constitute over 90% of total fats. Therefore, diversity of formed TGAs will be rather small with similarity of thermal properties. Similar approach to presence of TGAs in olive oil was reported [
13].
2.2. ATR-FTIR Spectra
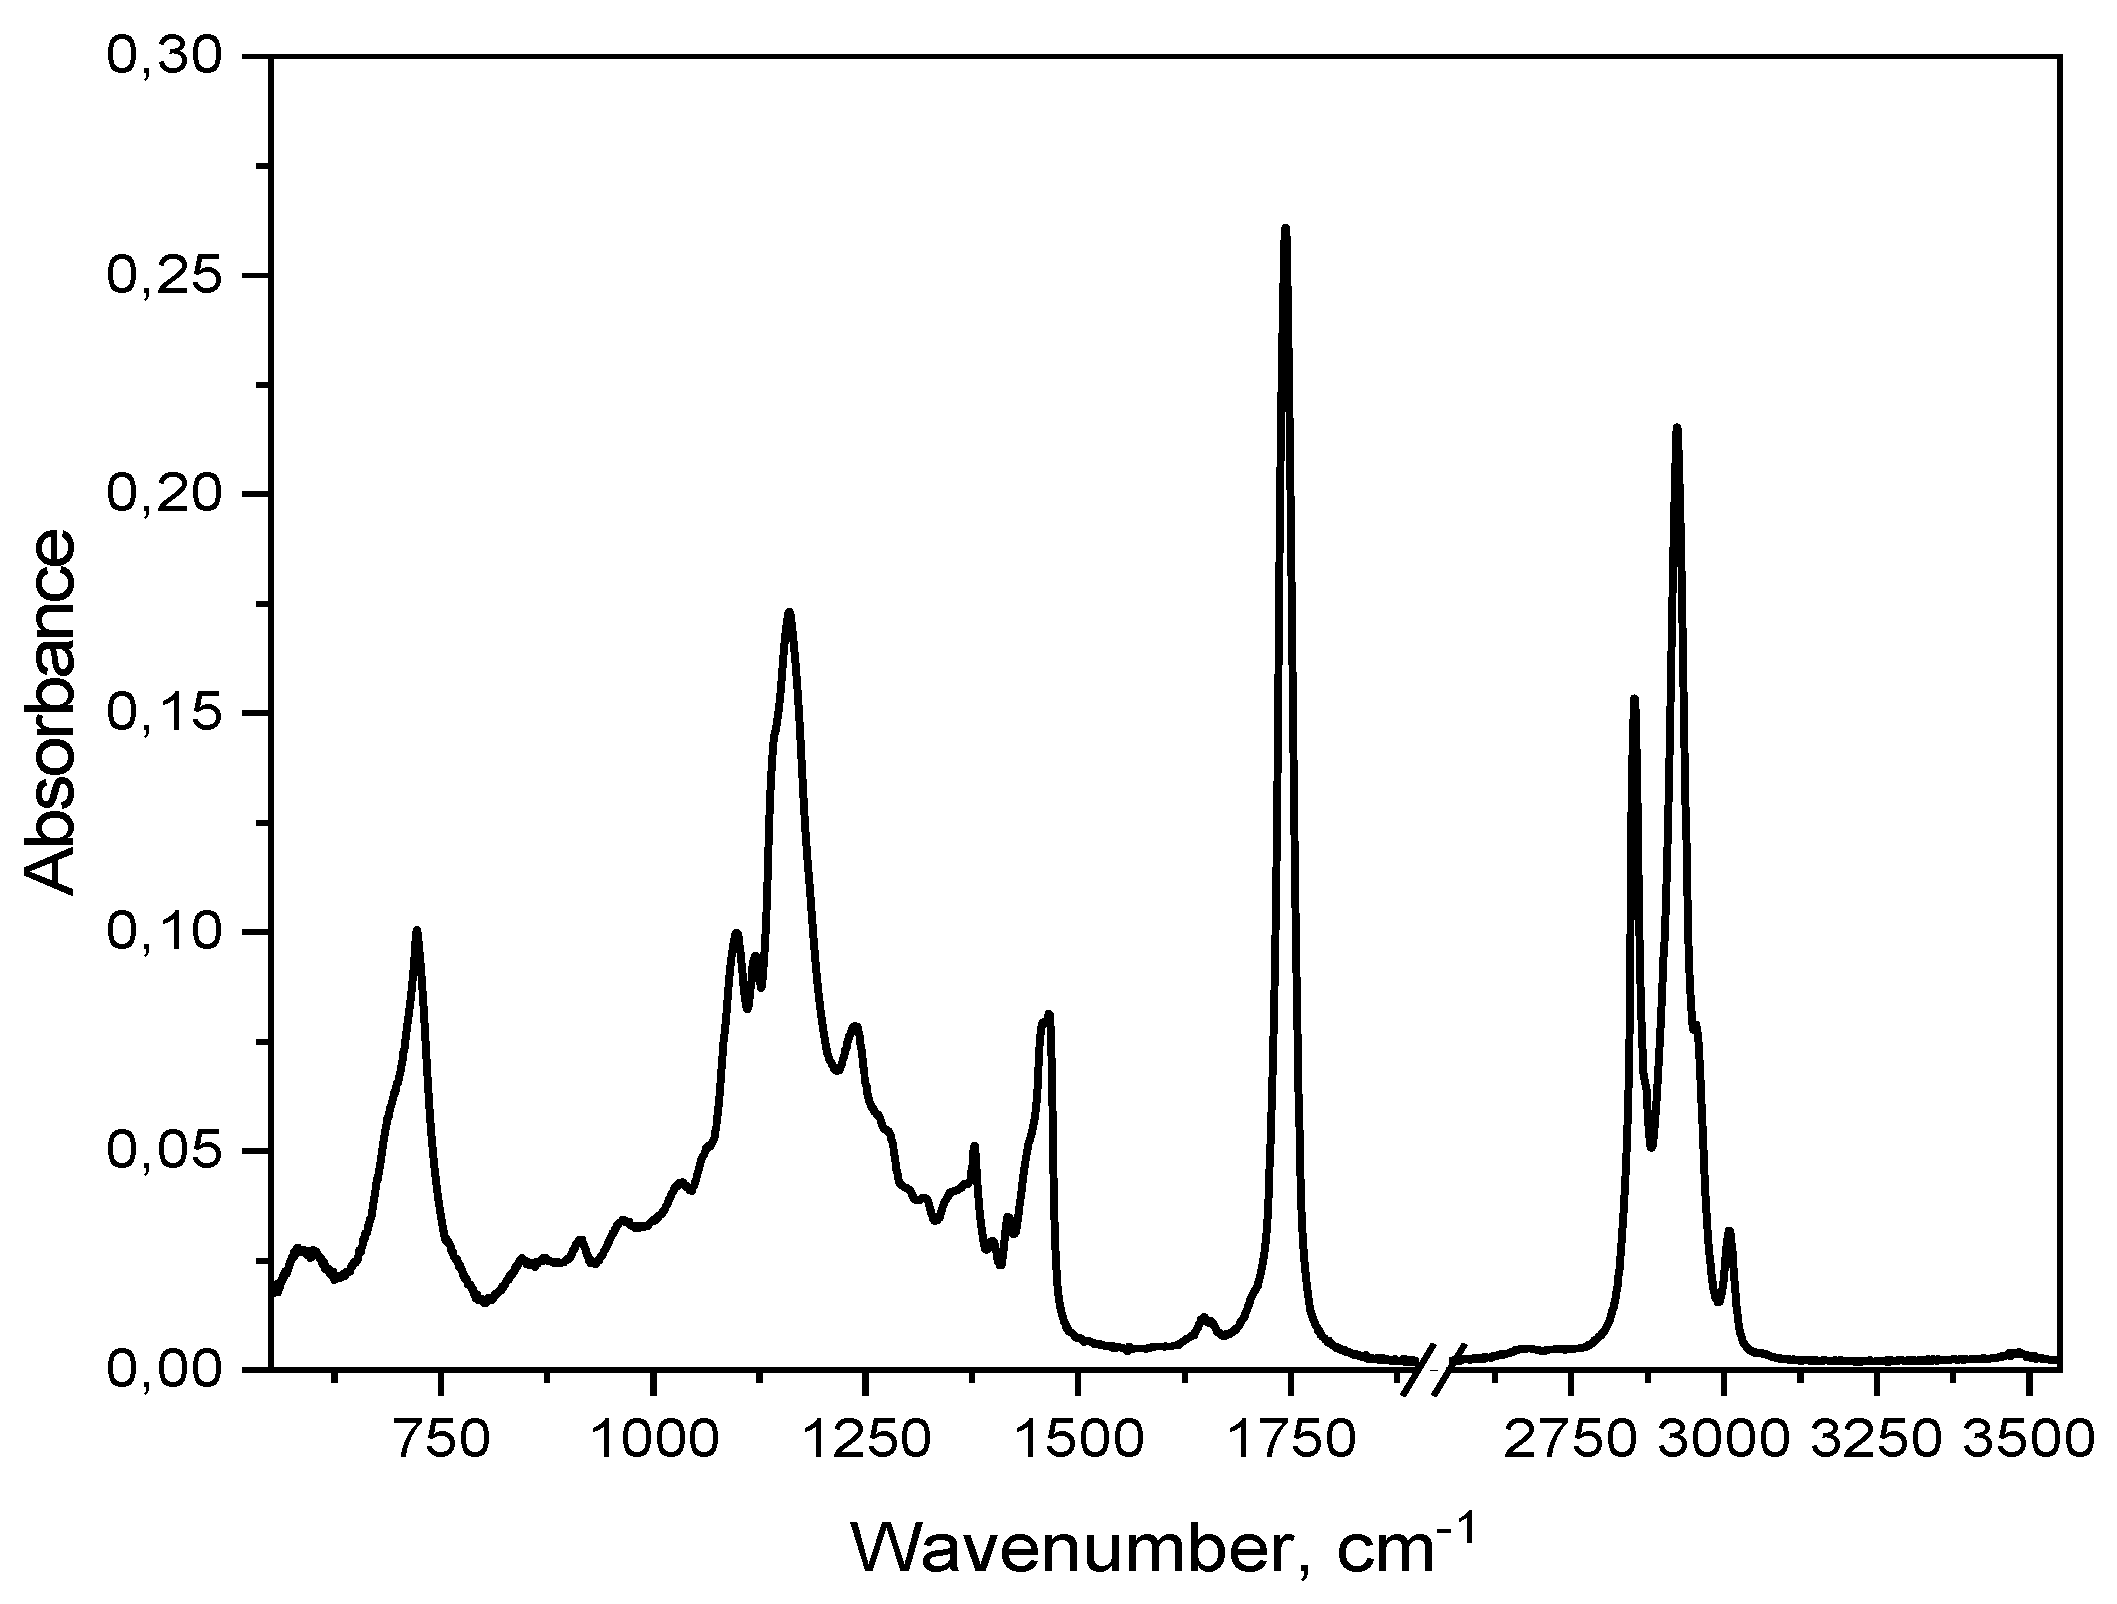
The measured FTIR spectrum,
Figure 2, indicates the presence of groups characteristic for fatty acids and triacylglycerols, i.e. the groups -CH
3, -CH
2, -C=O, -OH, and the cis and trans structures of the carbon double bonds (C=C). We may identify a few bands which characterize edible oils. Band in range 3005–2850 cm
-1 reflects starching vibrations of C-H in aliphatic groups (CH
2 and CH
3). Band around 1740 cm
-1 is related to stretching vibration C=O in esters, main component of TGA. Band 1465–1370 cm
-1 bending vibrations of C-H in CH
2 and CH
3. Band 1235–1160 cm
-1 stretching vibrations of C-O in esters. Band around 722 cm
-1 bending vibrations CH
2. The analysis of the position of characteristic spectral bands makes it possible to evaluate the composition of the obtained oil, especially in terms of the ratio of saturated to unsaturated fatty acids. A good measure of the presence of unsaturated fatty acids was the calculation of the peak ratio of 3008.5/2923 cm
-1, which expresses the presence of C-H bonds involved in
cis C=C bond. Calculated value of 0.148 indicates on relatively low amount of unsaturated fatty as compared to rapeseed 0.18 [
14] or elderberry 0.24 [
15] oils. The exact position of a weak band between 3006 and 3012 cm
-1, ascribed to (=C-H) stretching vibrations, depends on the fatty acids’ composition in oil. In this case, the position of 3008.5 cm
-1 indicates the presence of acyl groups of oleic and linoleic acids [
16], and this finding is supported by fatty acids composition studies where was shown a negligible amount of 18:3 linoleic acid, as reported by [
2].
Strong intensities of the bands at 1744, 1235, 1160 and 1120 cm-1 indicate on the dominant presence of TGA in this oil. Additionally, clearly visible presence of a band at 1120 cm-1 which characterize ester linkage within TGA, in this case, is indicative of high degree of esterification of this oil.
2.3. Monolayer Studies
2.3.1. Monolayer Compression
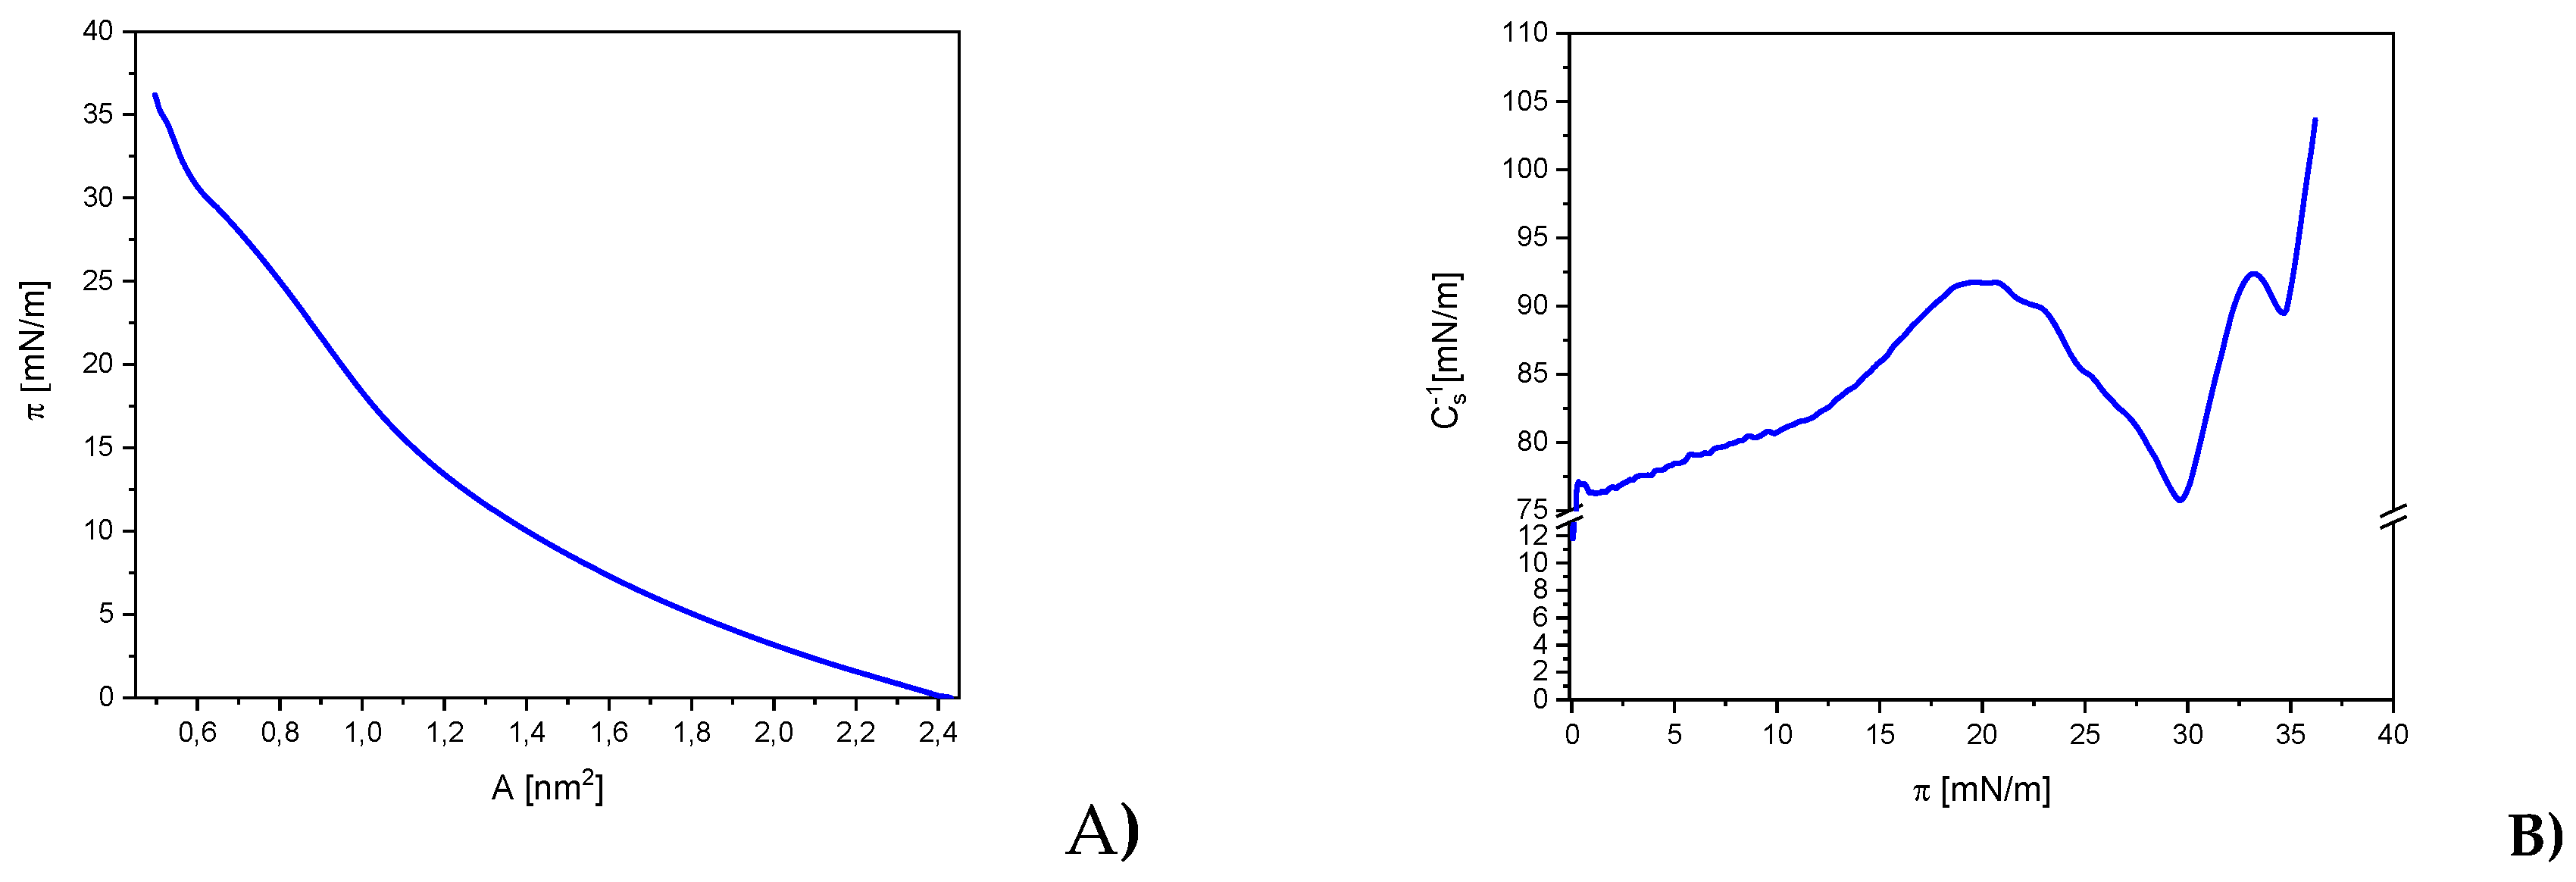
In this study, the thermodynamic properties of Langmuir monolayers formed by JQSO were measured using surface pressure (π) isotherms as a function of the mean molecular area (A) (
Figure 3). To quantitatively analyze and visualize molecular interactions, the characteristic parameters of the π-A isotherms were determined, including: extrapolated average molecular area (A
EXP), average molecular area at the collapse point (A
C), and surface pressure at the collapse point (π
C). A
EXP was determined by extrapolating the tangent to the first linear segment of the isotherm to the point π = 0. The values of the parameters determined based on the recorded isotherm are presented in the
Table 2.
Explanatory notes: The data in the table are presented as the mean ± standard deviation (SD).
During monolayer compression, depending on the molecular interactions, various thermodynamic phases may occur, such as: expanded liquid (LE), liquid (L), condensed liquid (LC), and solid (S) states [
17]. The A
EXP value of approximately 1.49 nm² indicates that the molecules of JQSO occupy a relatively large surface area during the initial stages of monolayer formation. This value suggests that the oil molecules are dispersed, with a more loosely arranged spatial distribution compared to other plant oils containing higher amounts of polyunsaturated fatty acids [
18,
19]. The high A
EXP value for this oil may also indicate the presence of long carbon chains in the molecules, which could result in lower intermolecular interactions during the early stages of monolayer formation. The A
C value of approximately 0.50 nm² suggests a tendency for the oil molecules to arrange more densely as the surface pressure increases. The reduction in available molecular surface area due to compression implies that the molecules of JQSO tend to form a more compact and ordered structure as pressure rises, transitioning to a more condensed phase. Meanwhile, the π
C value, reaching approximately 36.2 mN/m, suggests that the JQSO monolayer exhibits good mechanical stability. This indicates that the oil molecules effectively interact with each other, forming a robust layer capable of withstanding relatively high surface pressure. Such a result points to the effectiveness of intermolecular interactions within this monolayer, which may be attributed to the structural properties of the oil, including the presence of both saturated and unsaturated fatty acids that facilitate the formation of stable molecular structures. Presence of such composition of one saturated, palmitic acid 10%, and unsaturated fatty acids, oleic 34% and linoleic 52%, was confirmed [3, 4, 8]
2.3.2. The compressibility Modulus (Cs⁻¹)
Based on the recorded π-A isotherms and the measurements of monolayer behavior under dynamic conditions, the compressibility modulus (Cs⁻¹) and surface viscoelasticity (ε) were determined using equations 1 and 2, respectively. The analysis of these parameters provided additional information for characterizing the mechanisms of stability in lipid monolayers and their physicochemical properties. The relationships between the compression modulus Cs⁻¹ and surface pressure π (Cs⁻¹-π), presented in
Figure 3b, allowed for a detailed analysis of the phase state of compressed Langmuir monolayers. The determined values of Cs⁻¹ and ε are presented in
Table 2. The C
s-1 modulus reflects how the monolayer responds to compression, indicating the elasticity and packing density of oil molecules at the air-water interface. Higher values of this modulus suggest a stiffer and more stable monolayer, indicative of a well-packed and condensed oil structure.
The classification of the phase states of the Langmuir films was based on the criterion by Davies and Rideal [
20]. According to this criterion, Cs⁻¹ values range from 12.5 to 50 mN∙m
−1 correspond to the LE phase, from 50 to 100 mN∙m
−1 to the L phase, from 100 to 250 mN∙m
−1 to the LC phase, and above 250 mN∙m
−1 indicate the S state. The minima in Cs⁻¹-π plots indicate the surface pressures at which phase transitions or significant molecular reorganization occurs.
On the curves showing the dependence of Cs⁻¹ on π for the oil monolayers, distinct maxima corresponding to the LE and LC phases can be observed. The value of Cs⁻¹, approximately 103.6 ± 1.9 mN/m, indicates the high rigidity of the JQSO monolayer. The high value of this parameter suggests that the oil molecules tend to form a stable, compact structure under compression, particularly in LC phase. This means that the oil exhibits stronger intermolecular interactions, resulting in greater resistance to compression and a more stable monolayer compared to other oils with more compressible structures.
2.3.3. Surface Viscoelasticity Modulus (ε)
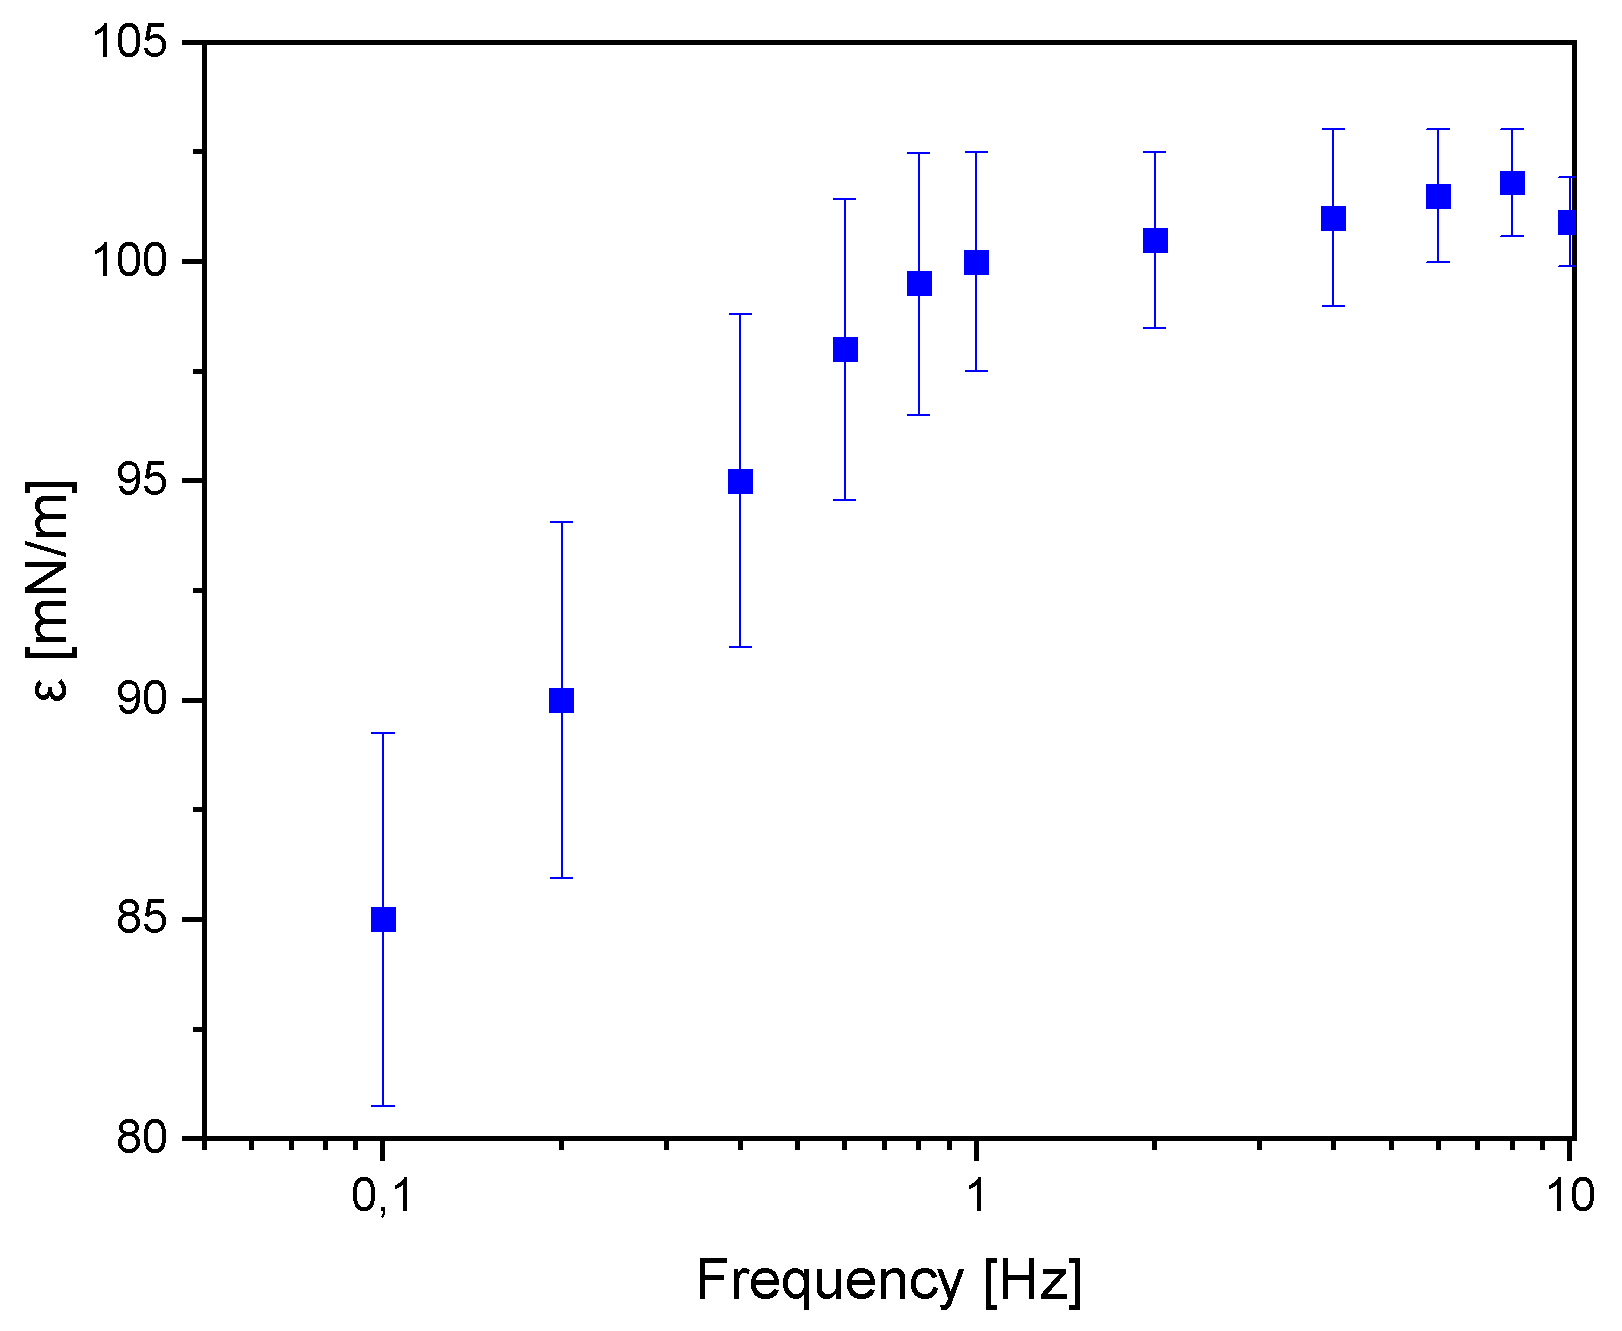
In the oscillating barriers method, the barriers are set into oscillatory motion with a specific frequency and amplitude. Dilatational interfacial rheology can be studied through various types of deformations, such as transient or harmonic surface changes.
In the case of surface elasticity, the recorded ε values can be divided into three zones. In the first zone, when dynamic elasticity does not exceed 50 mN/m, long-range forces lead to the formation of a regular structure, with distances between particles larger than their diameter. Further oscillatory movement of the barriers causes these forces to be exceeded, and the particles become more closely packed. In this zone, ε value can range from 50 to 250 mN/m. The third zone, corresponding to ε values above 250 mN/m, is characterized by high compression and a densely packed monolayer [
21].
The value of ε ~100.9 mN/m, indicates that monolayer of JQSO exhibits high resistance to mechanical deformations, combining both elastic and viscous properties. This is shown in
Figure 4 where above 1 Hz of deformation frequency the monolayer is stable and rigid. Such ε value suggests that the oil’s layer is not only elastic and capable of recovering its original structure after deformation, but also able to resist damage and tearing. Higher ε values are indicative of stronger molecular interactions, which enhance the stability and resistance to stretching of the monolayer. The ε modulus represents the viscoelastic properties of the monolayer, combining both elasticity (storage component) and viscosity (loss component), offering insight into the oil’s ability to withstand mechanical deformations. Higher ε values indicate stronger intermolecular interactions, suggesting that the oil monolayer is more resilient and can maintain its structural integrity under stress, which is often correlated with oils rich in saturated or monounsaturated fatty acids. In conclusion we may say that JQSO demonstrates favorable physicochemical properties, making it a potentially valuable material for applications requiring stable surface layers.
2.4. Absorption and Fluorescence Spectra
2.4.1. Absorption Spectra
Absorption spectra in the UV and visible (UV-Vis) regions with its position and intensity provide essential information about the electronic structure of molecules. By measuring the amount of light absorbed at different wavelengths, we obtain the spectra characteristic for each molecule. Thus, allowing for its identification and determine its concentration, especially in mixtures.
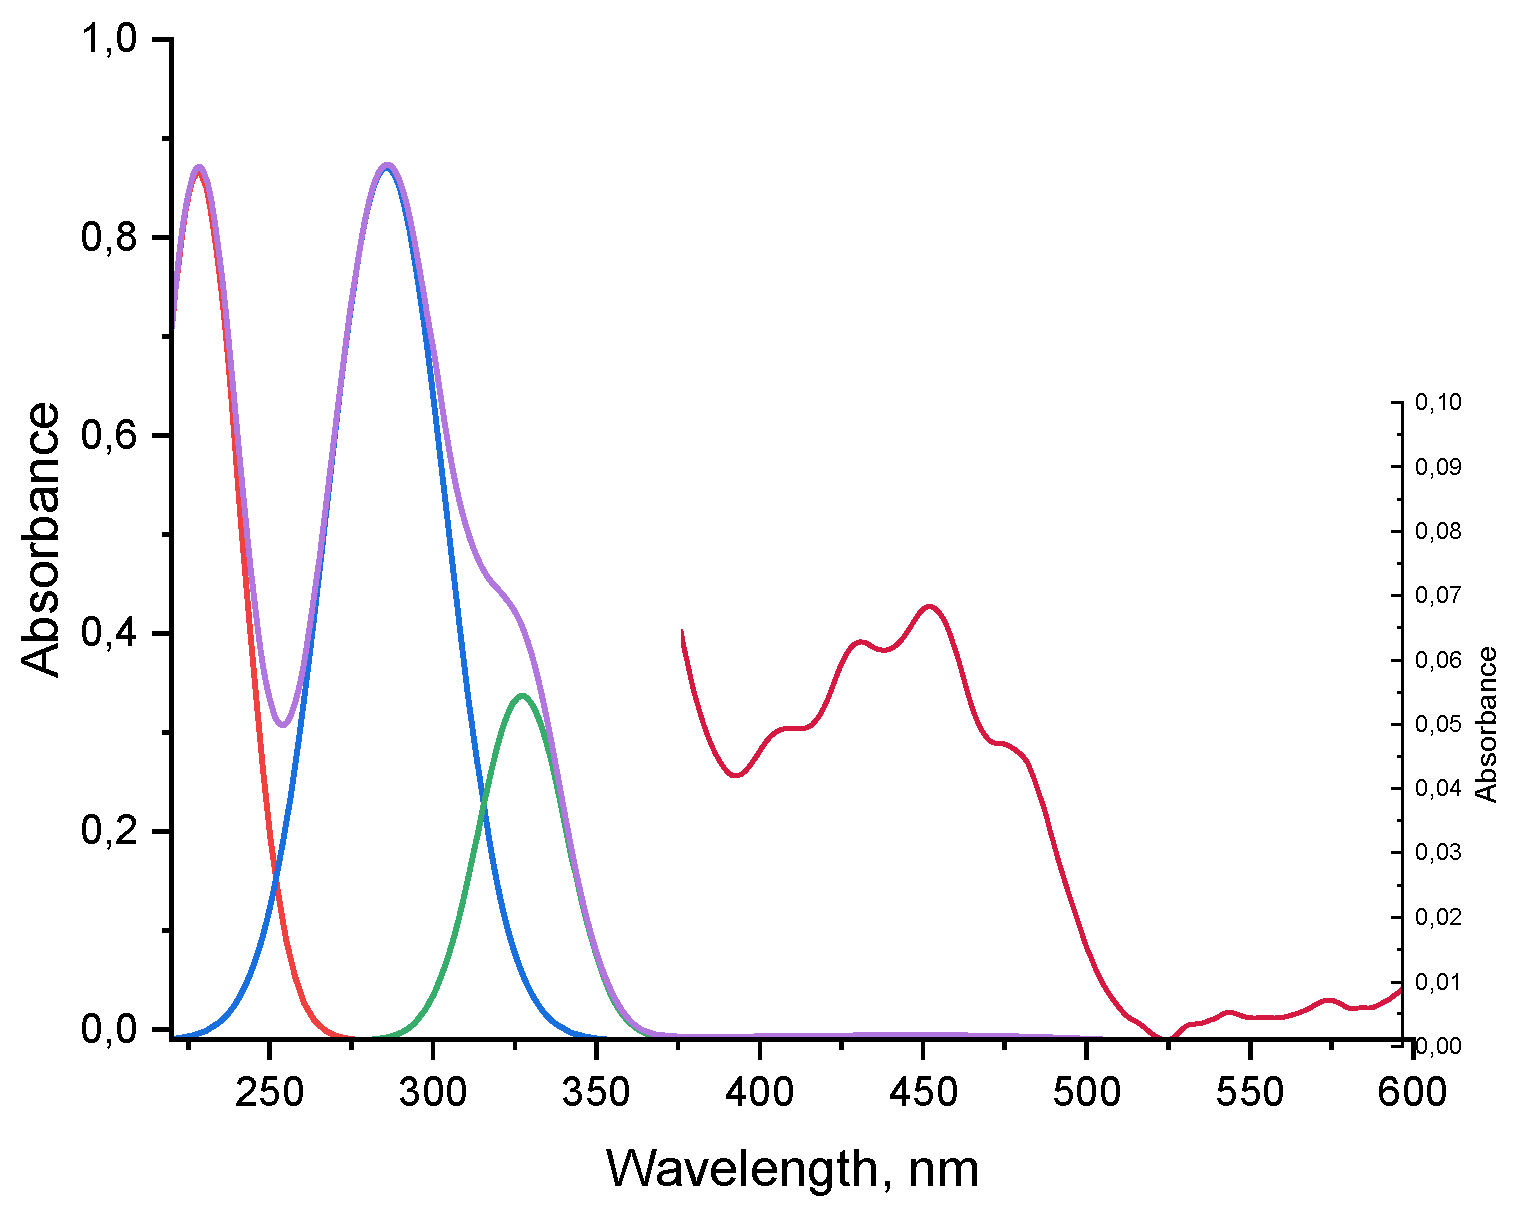
Absorption spectrum of JQSO in UV-Vis region is shown in
Figure 5. It reveals strong maxima in UV range at 228, 285 and 327 nm, and in visible region very low intensity, wide band with four peaks at 405, 430, 453 and 480 nm. Despite their weakness, they indicate the presence of molecules with antioxidant and healthy properties. The strong peak at 228 nm indicates the presence of molecules bearing carbonyl n-π transitions, the peak at 285 nm indicates the presence of tocopherols, and the strong peak at 327 is ascribed to presence of phenolic compounds. Interestingly, in this oil no chlorophyll or its derivatives were detected. Similar finding was reported for coconut oil, palm oil or cottonseed oil. Absorption peaks in visible region are related to polyphenols, flavonoids and carotenoids [
8].
2.4.2. Fluorescence Spectra
Total Luminescence Spectra
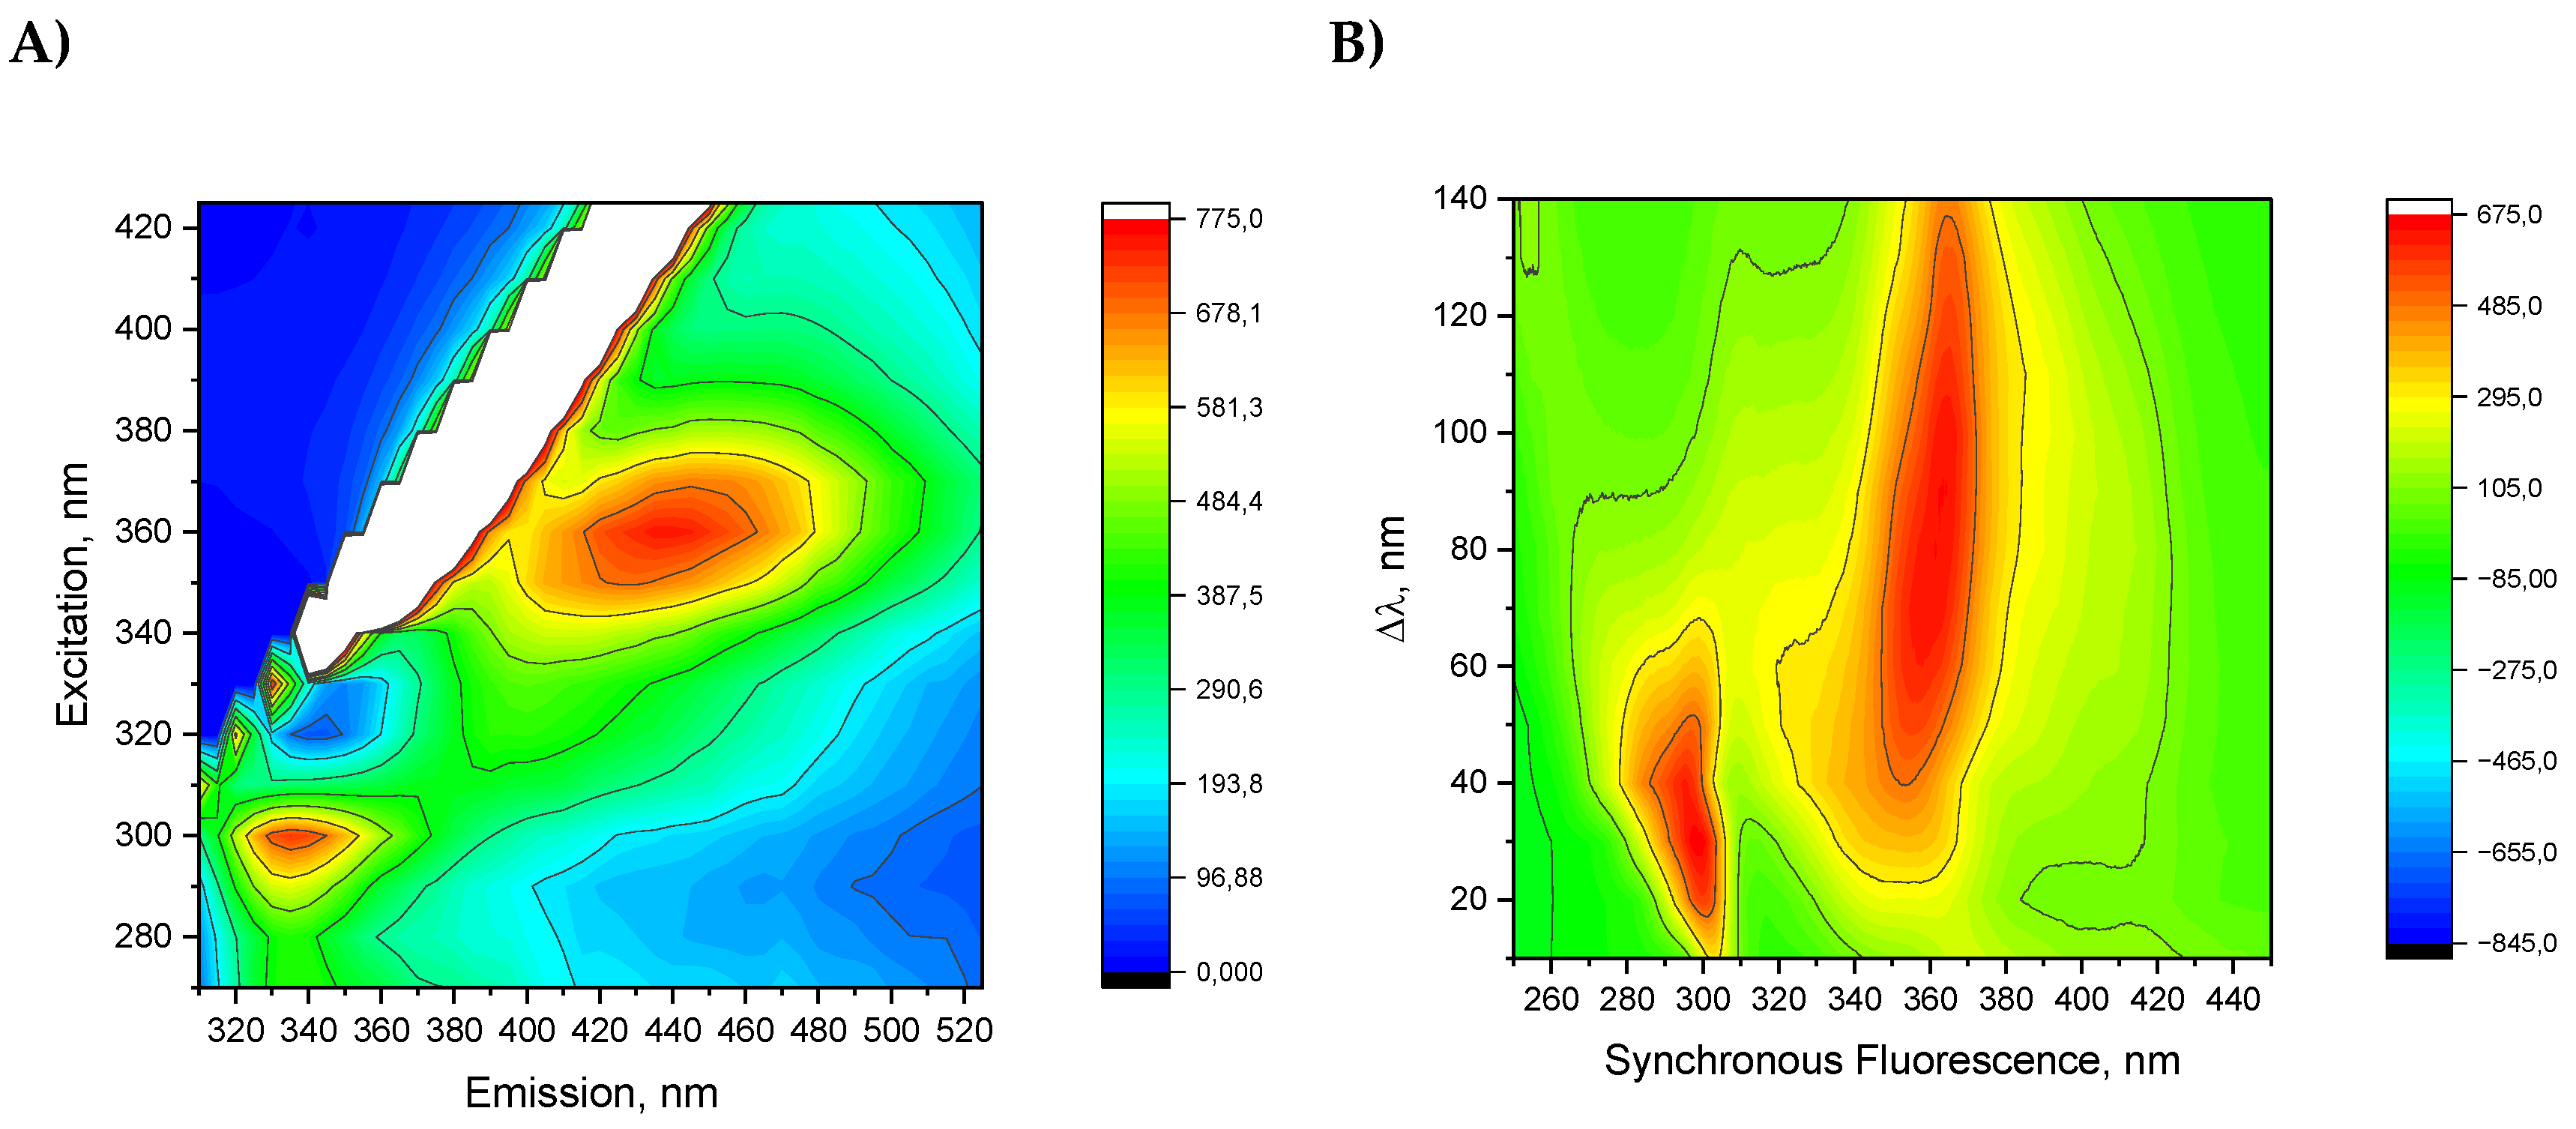
Figure 6a shows total luminescence spectrum which gives to possibility to examine fluorescent landscape of all fluorescent molecules present in oil. The results are presented as a two-dimensional contour map, after removing Rayleigh and Raman scattering, where excitation and emission wavelengths are coordinates. It shows two areas with intense emission. Such results indicate the presence of a number of fluorescent compounds in the oil sample, and range of excitation spectra correlates with the absorption spectrum. However, due to the number of fluorescent compounds and the effective overlapping of spectra, it was impossible to reliably identify fluorescent molecules. One area determined by observed excitation-emission maxima 300/330 nm, and another with much bigger area 360/440 nm. However, the region of intense and excitation includes between 340 nm to 370 nm and emission ranges from 400 nm to 480 nm. The range of 360/440 nm covers different emitting molecules, including phenols, polyphenols, flavonoids, carotenes and riboflavin [
22]. Phenolic compounds show maximum excitation between 265 and 335 nm and maximum emission from 358 to 426 nm [
23]. Possibly, in this wavelength range, one may observe the emissions from phenolic acids, including vanillic, syringic, gallic, p-coumaric, o-coumaric cinnamic, or caffeic acids [
3,
7,
9,
11].
The 300/336 nm area we ascribe to the presence of phenolic compounds that fluoresce when excited in their absorption bands between 260 and 320 nm. The most contribution to observed emissions arises from tocopherols, which absorb in the range of 280 to 290 nm and emit in the range of 310 to 330 nm. Possibly, in this range, one may observe the emissions from simple phenolic acids like vanillic acid, p-coumaric acid, ferulic acid polyphenols like catechin and epicatechin because the presence of such compounds was detected during studies on JQSO reported by [
3,
7,
9,
11].
The observed wide fluorescence landscape of studied JQSO indicates the presence of tocopherols, phenols and flavonoids, where most of which are natural antioxidants and/or possess anti-inflammatory properties [
24,
25]. The presented total fluorescence spectrum gives an overall view of the presence of fluorescent components and may serve as this oil’s fingerprint. Each of the high-fluorescence-intensity areas is related to different emitting molecules. However, the spectra overlap, thus making it hard to identify a specific fluorophore.
Total Synchronous Spectra
To increase the spectral resolution and obtain better discriminant ability in multicomponent sample the Total Synchronous Fluorescence (TSF) method was applied. In this method both monochromators are scanned simultaneously with fixed difference between excitation and emission. This gives very characteristic spectra which usually serve as a finger print for a specific molecule.
Figure 6b shows TSF spectra of JQSO in the form of a contour map in coordinates of abscissa as excitation wavelength and Δλ on the ordinate axis. In the TSF contour shown in
Figure 6b, we observe two separate areas. First one for Δλ from 10 to 50 nm excites molecule to emit in range of 300 nm. The other region with Δλ from 40 nm to 140 nm show maximum emission in range of 360 nm, indicating a number of molecules which are excited. This method does not allow for the assignment of specific compounds; however, it clearly indicates a visible excitation range that may excite specific types of molecules fluorescing under such conditions. Furthermore, specific templates obtained from TSF analysis may be used as a fingerprint or as a tool in oil adulteration studies [
26].
3. Materials and Methods
3.1. Materials
Japanese quince seeds (Chaenomeles japonica) of the “Pink Lady" cultivar were collected from the ripped fruits of wild Japanese quince trees in the Kujawy region in Poland. The seeds were separated and air dried at 40 °C then pressed to obtain oil, using a screw-pressing machine (Counter Intelligence Oilpresso, Netherlands), maintaining temperature at 45 °C. The oil samples were centrifuged (MPW Med. Instruments, Poland) at 5000 rpm (978 x g) for 5 min. Then oil was poured into a brown-glass bottle, purged with nitrogen gas (99.99% purity). The samples were stored in the freezer at −80 °C until analysis.
3.2. Methods
3.2.1. Crystallization and Melting Phase Transition Determination by DSC
The phase transition of cold-pressed Japanese quince oil, crystallization and melting phase transition, were determined using a PerkinElmer differential scanning calorimeter DSC 7 (Waltham, Massachusetts, USA) with an Intracooler II and Pyris software. The instrument was calibrated using indium (m.p. 156.6°C, ∆Hf = 28.45 J/g) and n-dodecane (m.p. −9.65°C, ∆Hf = 216.73 J/g). Pure nitrogen gas (99.99%) was used as the purge gas with a flow of 20 mL/min.
Oil samples (6–7 mg) were weighed into aluminum pans (PerkinElmer, No. 0219-0062, Waltham, Massachusetts, USA) and hermetically sealed. An empty and sealed aluminum pan was used as the reference. The samples were cooled with scanning rates of 2°C/min from 30 to −67°C; then, they were heated to 30°C, at heating rate 5°C/min. Peak temperature (T) and enthalpy (∆H) of crystallization and melting phase transition were measured from the cooling and heating curves. The measurements were conducted in duplicate.
3.2.2. Absorption and Fluorescence Spectra
The UV-VIS absorption spectra were obtained with a BioSpec-nano spectrometer (Shimadzu), enabling measurements of a drop of a sample in a spectral range from 200 to 800 nm. The measurements were repeated three times for two different optical lengths: 0.2 mm and 0.7 mm. Two-dimensional total luminescence spectra (TFS) were measured using a front face sample holder on a Hitachi F-7100 fluorescence spectrometer at room temperature. EES spectra were obtained with emission spectra from 210 to 800 nm at 1.0 nm intervals and excitation wavelengths from 200 to 750 nm in 10 nm steps.
Two-dimensional total synchronous fluorescence spectra (TSF) were obtained by scanning both monochromators simultaneously at constant wavelength differences between emission and excitation monochromators with Δλ step of 10 in range from 10 to 90 nm, with emission spectra from 210 to 750 nm and excitation spectra from 200 to 600 nm were collected
3.2.3. ATR-FTIR Measurements
The FTIR spectra were collected to confirm the composition of the samples, and to determine the functional groups present in the oil. The spectra were collected with the use of a Spectrum Two FT-IR spectrophotometer equipped with a Universal ATR (Attenuated Total Reflectance) unit with a diamond crystal. (Perkin Elmer, Waltham, MA, USA). The measurements were performed in the spectral range from 4000 to 500 cm-1 at a resolution of 4 cm-1 and eight replicates were taken to obtain the spectrum.
3.2.4. Monolayer Studies
Langmuir Monolayer Method
The study of the Langmuir monolayer formed by JQSO was conducted using a computer-controlled Langmuir trough system (KN 2002, KSV NIMA, Helsinki, Finland). The test setup consisted of a 273 cm² Teflon trough, movable hydrophilic barriers made of polyacetyl, and a platinum Wilhelmy plate. The trough was filled with ultrapure deionized water with a resistivity of 18.2 MΩ⋅cm, which served as the subphase. A measured amount of a solution of JQSO in chloroform with 99.8% purity (POCH, Lublin, Poland) was applied to the surface of the subphase using a Hamilton microsyringe (Hamilton Company, Reno, NV, USA). The compression experiment was started after the solvent evaporated. The movable barriers symmetrically compressed the film at a constant rate of 5 mm/min. During the measurement, the change in surface pressure (π) as a function of the available area per molecule (π-A isotherm) was recorded. The temperature of the subphase was maintained at 20°C using a Julabo thermostat (Julabo GmbH, Seelbach, Germany). From the π-A isotherms, the dependence of the compression modulus (CS⁻¹) as a function of surface pressure was determined according to the equation [
27]:
where: A - area per individual molecule, π - surface pressure
Oscillatory Dilatational Rheology
The dilatational viscoelasticity of Langmuir monolayers was studied using the oscillating barrier method. In this experiment, the surface pressure response to small-amplitude sinusoidal variations in surface area was measured. The monolayers were initially compressed to the surface at a pressure of π
c and left to equilibrate for 20 minutes. Then, the barriers began oscillating, inducing small (1%) changes in the area available for the Langmuir monolayers. The experiments were conducted over a frequency range from 0.1 to 1 mHz, with at least 10 oscillation cycles recorded for each frequency. A 60-second interval was maintained between successive oscillation cycles. The relationship for dilatational viscoelasticity ε is given by equation [
28,
29]:
3.2.5. Statistical and Graphical Programs
The graphs, calculations, and chemometric analysis were carried out using OriginPro 2023 (OriginLab Corporation, Northampton, Massachusetts, USA) software.
4. Conclusions
The results of applied molecular physics characteristic to already well-known chemical properties of crude, cold-pressed oil from Japanese quince seeds add more properties not available from previous publications. The DSC, monolayer and spectroscopic methods gave the opportunity to carry out a label-free, fast, and reliable determination of cold-pressed JQSO properties. DSC study gave thermodynamic parameters of observed transition during cooling and heating allowing determine temperatures of crystallization or melting temperature of triglycerides (TGA) formed in oil. The data indicated that TGA are dominated by unsaturated fatty acids. Applied deconvolution to DSC trace during heating indicated presence of main five TGA structures. Fluoresce studies using Total Luminescence and Total Synchronous fluorescence methods gave full landscape of minor compounds present in JQSO and confirmed and visualize the presence of a number of bioactive compounds, indicating high concentration of tocopherols, phenolics, and carotenes. ATR-FTIR spectrum confirmed the presence of groups characteristic for fatty acids and triacylglycerols, with special emphasizes on high degree of esterification of this oil. In this work for the first time, Langmuir monolayer studies on JQSO were applied revealing its high compressibility, indicating its good emulsification properties whereas viscoelasticity modulus values indicate stronger intermolecular interactions, suggesting that the oil monolayer is more resilient and can maintain its structural integrity under stress, which is often correlated with oils rich in saturated or monounsaturated fatty acids.
The presented data are in agreement with previously published results regarding the presence of antioxidants, including tocopherol and phenolic compounds. During the cold-pressing procedure used to obtain the oil, and during measurements, no organic chemicals such as hexane, chloroform, or methanol were used, nor was heat treatment applied; thus, this method may be considered a green chemistry approach. Finally, one general remark regarding the cold-pressed procedure, which does not involve heat or chemical treatment; thus, all sensitive compounds prone to destruction or oxidation are preserved. Moreover, this production method supports sustainability by utilizing seeds that are often discarded during fruit processing, adding value to the agricultural chain and reducing waste.
Author Contributions
Conceptualization, K.P.; methodology, W.K, G.N. P.S., K.P. and J.T.-G.; software, W.K, G.N. P.S., K.P. and J.T.-G.; validation, W.K, G.N. P.S., K.P. and J.T.-G.; formal analysis, W.K, G.N. P.S., K.P. and J.T.-G.; investigation, W.K., P.S. K.P. and J.T.-G.; resources, W.K. and K.P.; data curation, W.K., P.S., K.P. and J.T.-G.; writing—original draft preparation, G.N. and K.P..; writing—review and editing, W.K, G.N. P.S., K.P. and J.T.-G.; visualization, W.K., K.P. and J.T.-G.; supervision, K.P.; project administration, K.P.; All authors have read and agreed to the published version of the manuscript.
Funding
This research received no external funding.
Institutional Review Board Statement
Not applicable.
Informed Consent Statement
Not applicable.
Data Availability Statement
The original contributions presented in the study are included in thearticle, further inquiries can be directed to the corresponding authors.
Conflicts of Interest
The authors declare no conflicts of interest.
References
- Ben-Othman, S.; Bleive, U.; Kaldmäe, H.; Aluvee, A.; Rätsep, R.; Karp, K.; Maciel, L.S.; Herodes, K.; Rinken, T. Phytochemical characterization of oil and protein fractions isolated from Japanese quince (Chaenomeles japonica) wine by-product. Lwt 2023, 178, 114632. [Google Scholar] [CrossRef] [PubMed]
- Górnaś, P.; Siger, A.; Rudzińska, M.; Grygier, A.; Marszałkiewicz, S.; Ying, Q.; Sobieszczańska, N.; Segliņa, D. Impact of the Extraction Technique and Genotype on the Oil Yield and Composition of Lipophilic Compounds in the Oil Recovered from Japanese Quince (Chaenomeles japonica) Seeds. Eur. J. Lipid Sci. Technol. 2019, 121, 1800262. [Google Scholar] [CrossRef]
- Górnaś, P.; Siger, A.; Segliņa, D. Physicochemical characteristics of the cold-pressed Japanese quince seed oil: New promising unconventional bio-oil from by-products for the pharmaceutical and cosmetic industry. Ind. Crops Prod. 2013, 48, 178–182. [Google Scholar] [CrossRef]
- Granados, M..; Vila, R.; Laencina, J.; Rumpunen, K.; Ros, J. Characteristics and composition of chaenomeles seed oil. In .Japanese quince - Potential fruit crop for Northern Europe; Rumpunen, K., Ed.; Swedish University of Agricultural Sciences: Alnarp, Sweden, 2003; pp. 141–147. ISBN 91-631-3765-8. [Google Scholar]
- Mierina, I.; Serzane, R.; Strele, M.; Moskaluka, J.; Seglina, D.; Jure, M. Extracts of Japanese quince seeds - Potential source of antioxidants. In Proceedings of the 6th Baltic Conference on Food Science and Technology: Innovations for Food Science and Production, FOODBALT-2011, Jelgava, Latvia, 5–6 May 2011; Straumite, E., Ed.; Latvia University of Agriculture: Jelgava, Latvia, 2011; pp. 98–103. [Google Scholar]
- Górnaś, P.; Siger, A.; Juhņeviča, K.; Lacis, G.; Šne, E.; Segliņa, D. Cold-pressed Japanese quince (Chaenomeles japonica (Thunb.) Lindl. ex Spach) seed oil as a rich source of α-tocopherol, carotenoids and phenolics: A comparison of the composition and antioxidant activity with nine other plant oils. Eur. J. Lipid Sci. Technol. 2014, 116, 563–570. [Google Scholar] [CrossRef]
- Osman, A. Cold pressed Japanese quince (Chaenomeles japonica (Thunb.) Lindl. ex Spach) seed oil. Cold Press. Oils Green Technol. Bioact. Compd. Funct. Appl. 2020, 541–546. [Google Scholar] [CrossRef]
- Urbanavičiūte, I.; Liaudanskas, M.; Bobinas, Č.; Šarkinas, A.; Rezgiene, A.; Viskelis, P. Japanese quince (Chaenomeles japonica) as a potential source of phenols: Optimization of the extraction parameters and assessment of antiradical and antimicrobial activities. Foods 2020, 9, 1–13. [Google Scholar] [CrossRef] [PubMed]
- Urbanavičiūtė, I.; Viškelis, P.; Urbanavičiūtė, I.; Viškelis, P. Biochemical Composition of Japanese Quince (Chaenomeles japonica) and Its Promising Value for Food, Cosmetic, and Pharmaceutical Industries. Fruit Ind. 2022. [Google Scholar] [CrossRef]
- Du, H.; Wua, J.; Li, H.; Zhong, P.X.; Xu, Y.J.; Li, C.H.; Ji, K.X.; Wang, L.S. Polyphenols and triterpenes from Chaenomeles fruits: Chemical analysis and antioxidant activities assessment. Food Chem. 2013, 141, 4260–4268. [Google Scholar] [CrossRef]
- Ros, J.M.; Laencina, J.; Hellín, P.; Jordán, M.J.; Vila, R.; Rumpunen, K. Characterization of juice in fruits of different Chaenomeles species. LWT - Food Sci. Technol. 2004, 37, 301–307. [Google Scholar] [CrossRef]
- Górnaś, P.; Rudzińska, M. Seeds recovered from industry by-products of nine fruit species with a high potential utility as a source of unconventional oil for biodiesel and cosmetic and pharmaceutical sectors. Ind. Crops Prod. 2016, 83, 329–338. [Google Scholar] [CrossRef]
- Chiavaro, E.; Rodriguez-Estrada, M.T.; Bendini, A.; Cerretani, L. Correlation between thermal properties and chemical composition of Italian virgin olive oils. Eur. J. Lipid Sci. Technol. 2010, 112, 580–592. [Google Scholar] [CrossRef]
- Rajagukguk, Y.V.; Islam, M.; Grygier, A.; Tomaszewska-Gras, J. Thermal and spectroscopic profiles variation of cold-pressed raspberry seed oil studied by DSC, UV/VIS, and FTIR techniques. J. Food Compos. Anal. 2023, 124, 105723. [Google Scholar] [CrossRef]
- Siejak, P.; Neunert, G.; Kamińska, W.; Dembska, A.; Polewski, K.; Siger, A.; Grygier, A.; Tomaszewska-Gras, J. A crude, cold-pressed oil from elderberry (Sambucus nigra L.) seeds: Comprehensive approach to properties and characterization using HPLC, DSC, and multispectroscopic methods. Food Chem. 2025, 464, 141758. [Google Scholar] [CrossRef]
- Poiana, M.A.; Alexa, E.; Munteanu, M.F.; Gligor, R.; Moigradean, D.; Mateescu, C. Use of ATR-FTIR spectroscopy to detect the changes in extra virgin olive oil by adulteration with soybean oil and high temperature heat treatment. Open Chem. 2015, 13, 689–698. [Google Scholar] [CrossRef]
- Piosik, E.; Zaryczniak, A.; Mylkie, K.; Ziegler-Borowska, M. Probing of Interactions of Magnetite Nanoparticles Coated with Native and Aminated Starch with a DPPC Model Membrane. Int. J. Mol. Sci. 2021, 22, 5939. [Google Scholar] [CrossRef]
- Kamińska, W.; Cichocki, W.; Maria Baranowska, H.; Walkowiak, K.; Kmiecik, D.; Łukasz Kowalczewski, P. Characteristics of Langmuir monomolecular monolayers formed by the novel oil blends. Open Chem. 2023, 21. [Google Scholar] [CrossRef]
- Fidalgo Rodríguez, J.L.; Dynarowicz-Latka, P.; Miñones Conde, J. Structure of unsaturated fatty acids in 2D system. Colloids Surfaces B Biointerfaces 2017, 158, 634–642. [Google Scholar] [CrossRef] [PubMed]
- Davies, J.T.; Rideal, E.K. Interfacial Phenomena; Academic Press: New York, 1963. [Google Scholar]
- Ma, G.; Allen, H.C. DPPC Langmuir monolayer at the air-water interface: Probing the tail and head groups by vibrational sum frequency generation spectroscopy. Langmuir 2006, 22, 5341–5349. [Google Scholar] [CrossRef] [PubMed]
- Tena, N.; García-gonzález, D.L.; Aparicio, R. Evaluation of virgin olive oil thermal deterioration by fluorescence spectroscopy. J. Agric. Food Chem. 2009, 57, 10505–10511. [Google Scholar] [CrossRef] [PubMed]
- Rodríguez-Delgado, M.A.; Malovaná, S.; Pérez, J.P.; Borges, T.; García Montelongo, F.J. Separation of phenolic compounds by high-performance liquid chromatography with absorbance and fluorimetric detection. J. Chromatogr. A 2001, 912, 249–257. [Google Scholar] [CrossRef] [PubMed]
- Domínguez-Valencia, R.; Cittadini, A.; Pateiro, M.; Munekata, P.E.S.; Lorenzo, J.M. Elderberry Lipophilic and Hydrophilic Bioactive Compounds: Characterization and Extract Encapsulation. Foods 2023, 12, 4233. [Google Scholar] [CrossRef]
- Przybylska-Balcerek, A.; Szablewski, T.; Szwajkowska-Michałek, L.; Świerk, D.; Cegielska-Radziejewska, R.; Krejpcio, Z.; Suchowilska, E.; Tomczyk, Ł.; Stuper-Szablewska, K. Sambucus nigra extracts–natural antioxidants and antimicrobial compounds. Molecules 2021, 26, 2910. [Google Scholar] [CrossRef] [PubMed]
- Poulli, K.I.; Mousdis, G.A.; Georgiou, C.A. Rapid synchronous fluorescence method for virgin olive oil adulteration assessment. Food Chem. 2007, 105, 369–375. [Google Scholar] [CrossRef]
- Gaines, G.L. Thermodynamic relationships for mixed insoluble monolayers. J. Colloid Interface Sci. 1966, 21, 315–319. [Google Scholar] [CrossRef]
- Luviano, A.S.; Campos-Terán, J.; Langevin, D.; Castillo, R.; Espinosa, G. Mechanical Properties of DPPC-POPE Mixed Langmuir Monolayers. Langmuir 2019, 35, 16734–16744. [Google Scholar] [CrossRef] [PubMed]
- Noskov, B.A.; Bykov, A.G. Dilational rheology of monolayers of nano- and micropaticles at the liquid-fluid interfaces. Curr. Opin. Colloid Interface Sci. 2018, 37, 1–12. [Google Scholar] [CrossRef]
|
Disclaimer/Publisher’s Note: The statements, opinions and data contained in all publications are solely those of the individual author(s) and contributor(s) and not of MDPI and/or the editor(s). MDPI and/or the editor(s) disclaim responsibility for any injury to people or property resulting from any ideas, methods, instructions or products referred to in the content. |
© 2024 by the authors. Licensee MDPI, Basel, Switzerland. This article is an open access article distributed under the terms and conditions of the Creative Commons Attribution (CC BY) license (http://creativecommons.org/licenses/by/4.0/).