
Submitted:
07 December 2024
Posted:
10 December 2024
You are already at the latest version
Abstract
Hsp90, a critical molecular chaperone, is instrumental in modulating an array of signaling path-ways, transcription factors, and cytokines, with its overexpression intricately tied to the onset of tumorigenesis. While the modulation of Hsp90 holds potential for facilitating tissue regeneration, its functional implications in epimorphic regeneration remain largely uncharted. This study ex-plored the role of Hsp90 in tail regeneration in axolotls and compared it to its roles in other epi-morphic regeneration processes, such as tail fin regeneration in zebrafish and tail regeneration in amphioxus. Our findings indicated that Hsp90α, the inducible subtype of Hsp90, exhibited dis-tinctive and dynamic expression patterns throughout these regeneration processes. The knock-down of Hsp90α via morpholinos or the pharmacological inhibition of Hsp90 using geldanamycin following tail amputation in axolotls hindered regeneration. Similar phenotypes of failed regen-eration due to Hsp90 inhibition were also observed in zebrafish and amphioxus. Furthermore, cellular evidence suggested that the suppression of Hsp90 results in diminished cell proliferation and elevated apoptosis, partially accounting for the observed impairment in regeneration. RNA-seq analysis of Hsp90-inhibited and control axolotls and zebrafish provided deeper insights into the regulatory mechanism of Hsp90 in regeneration. Numerous differentially expressed genes identified are transcription factor genes or key signaling genes involved in cell proliferation, apoptosis, cancer development, and the immune response. These findings imply that Hsp90 is essential in epimorphic regeneration processes and its functional roles appear to be conserved among chordates as a pivotal regulator in the regeneration process.
Keywords:
Hsp90
; epimorphic regeneration
; axolotl
; zebrafish
; amphioxus
1. Introduction
Heat shock protein 90 (Hsp90) is an ATP-dependent molecular chaperone in eukaryotes. It was first discovered over 40 years ago in the heat shock response of fruit flies. Now it is clear that this protein is evolutionarily conserved among various species. Caenorhabditis elegans and Drosophila melanogaster contain only one Hsp90 homolog [1], while in mammals and zebrafish, there are two subtypes, Hsp90α, an inducible subtype that can be induced to express under stress, and Hsp90β, a constitutively expressed subtype [1,2]. However, for certain species, such as amphioxus, the information regarding Hsp90 is incomplete. It has been reported that there exists a homologue of Hsp90α [3], but whether it possesses Hsp90β remains uncertain. Numerous studies have revealed that Hsp90 interacts with a wide range of proteins, including many signaling proteins, transcription factors, and other client proteins, thereby participating in numerous biological and pathophysiological processes. For example, Hsp90α has been shown to regulate the stability and activity of some transcription factors such as c-Myc [4,5], Nf-κB [6,7], and p53 [8,9], which are involved in cell proliferation, apoptosis, and differentiation. High expression of Hsp90 is linked to many cancer types [10]. It acts as an inducer or promoter in cancer development and regulation by stabilizing and activating some proteins that are critical for carcinogenesis [11]. Consequently, Hsp90 inhibitors such as geldanamycin, or its derivatives have been trialed in cancer therapies [12] or used to examine Hsp90’s functional role in some biological processes, for example, embryo development of zebrafish [13,14].
There is also evidence suggesting that Hsp90 is involved in the regeneration process, where damaged or lost tissues, organs, and even entire bodies are restored in organisms. Uncovering the cellular and molecular mechanisms underlying the regenerative process in diverse modes is a long-standing goal in the field of regeneration. Recently, it was discovered that Hsp90α participates in tail fin regeneration in fish [15], an epimorphic type characterized by cell proliferation and blastema formation during the regenerative process [16]. Evidence that Hsp90α may be involved in initiating and promoting caudal fin regeneration comes from the elevated expression of Hsp90α in cells near the blastema and blood vessels of the regenerated fin [15]. Our previous transcriptome analysis also indicated that Hsp90α is highly expressed at an early stage of tail regeneration in amphioxus, a vertebrate-like organism undergoing epimorphic regeneration [17]. However, the functional role of Hsp90 in the epimorphic regeneration process and whether its significance in regeneration is conserved across different species are not well understood.
To address this question, this study delved into the role of Hsp90 in tail regeneration in axolotl, an important regenerative model animal in tetrapods, and compared it with its functions in other typical epimorphic regeneration processes, such as tail fin regeneration in zebrafish and tail regeneration in amphioxus.
2. Results
2.1. Dynamic Expression Patterns of Hsp90α During the Tail Regeneration Process in Axolotls
The expression patterns of Hsp90α during regeneration were detected using in situ hybridization and qPCR methods. It was revealed that Hsp90α exhibited a highly dynamic expression pattern throughout the regeneration process. At 1h-3h post-amputation (hpa), it was expressed at the wound site (Figure 1A, B). Subsequently, its expression was upregulated and concentrated in the vicinity of the injured end of the vertebrate, primarily comprising cartilage and spinal cord, at 7 hpa (Figure 1C). At 12 hpa, its expression remained predominantly distributed in the surrounding tissues of the injured vertebrate site at a high level (Figure 1D). However, its expression decreased sharply at 1 day post-amputation (dpa) (Figure 1E) and then increased again in the wounded side of the vertebrae at 3 dpa (Figure 1F). At subsequent stages, such as 5 dpa and 7 dpa, its expression was mainly localized near the vertebrae at relatively low levels (Figure 1G, H).
This highly dynamic expression pattern of Hsp90α is also evident in the qPCR assay. It was demonstrated that following amputation, its expression level increased at 3 hpa and reached a peak at 12 hpa, and then decreased drastically to a basal level like that in an intact tail. Its expression was then upregulated at 3 dpa, while at later stages, such as 5-10 dpa, it continued to fluctuate at relatively low levels (Figure 1J).
2.2. Pharmacological Inhibition of Hsp90 or Knocking Down of Hsp90α During Tail Regeneration of Axolotl
To ascertain whether Hsp90 is essential in the tail regeneration process of axolotls, we blocked its activity with geldanamycin following amputation. The results showed that in the control group, a regenerating blastema appeared at 5 dpa, continued to grow at the following stage and formed a new tail at 28 dpa (Figure 2A). In contrast, in the treatment group, tail regeneration became stagnant, with no regeneration blastema formed until 15 dpa. (Figure 2B). When we pushed the treatment time window back to 9 dpa, the regeneration capacity was partially restored at 10 dpa (Figure 2C).
The significance of Hsp90 in the tail regeneration was further confirmed by knocking down Hsp90α during the tail regeneration process. It was evident that, compared to the normal regenerative process in the control group (Figure 3A), the regenerative process was hindered by the knockdown of Hsp90α via Morpholino (Figure 3B).
2.3. Inhibition of Hsp90 Led to Decreased Cell Proliferation and Increased Cell Apoptosis.
The comparative analysis of cell proliferation in tail regenerates highlights the role of Hsp90 in the regeneration process. In the control group, cell proliferation was mainly concentrated in the regeneration region, yielding a cell proliferative index of approximately 22.5% (based on counting from nine sections from three tail regenerates) (Figure 4A-C, G). In contrast, treatment with the Hsp90 inhibitor geldanamycin led to a significant reduction in cell proliferation. The cell proliferative index decreased dramatically to 6.3%, as observed (Figure 4D-G). This substantial decrease in cell proliferation in the treatment group suggests that Hsp90 is critical for maintaining the proliferative activity necessary for effective tissue regeneration. Overall, these findings indicate that Hsp90 is an important regulator of cell proliferation during tail regeneration, and its inhibition adversely affects the regenerative process by reducing the rate of cell division.
The TUNEL assay results indicate that Hsp90 plays a significant role in modulating cell apoptosis during tail regeneration. In the control group, apoptosis was primarily observed in the upper layer of the apical cap, with a few apoptotic cells present in deeper layers. The average apoptotic index for this group was 5.6% (Figure 5A-C, G). However, the group treated with the Hsp90 inhibitor, geldanamycin, exhibited a marked increase in apoptosis. Apoptotic cells were widespread and prominent throughout the regeneration region, affecting both the wound epidermis and underlying cells (Figure 5D-F). This widespread apoptosis in the treatment group resulted in a significant increase in the average apoptotic index, which rose to 15.8% per section (Figure 5D-G). This suggests that inhibiting Hsp90 leads to an increase in apoptosis during tail regeneration, emphasizing the role of Hsp90 in cell survival and tissue regeneration.
2.4. Inhibition of Hsp 90 During the Axolotl's Tail Regeneration Process of Axolotl Led to Changes in Gene Expression Profile.
To gain molecular insights into the mechanisms by which Hsp90 modulates regeneration, we delved into the alterations in the gene expression profile subsequent to Hsp90 suppression during the regenerative process. This was achieved through a meticulous comparative transcriptome analysis, comparing the control group with the Hsp90α-inhibited group. Employing RNA sequencing in conjunction with de novo assembly, we identified a total of 103,094 transcripts, characterized by an N50 of 3,300 bp, a maximum length reaching 21,472 bp, and an average length of 1,542 bp. Notably, the completeness of our assembly was high, with 947 complete BUSCOs, accounting for 99.3% of the total 954 BUSCO groups examined. Furthermore, we successfully annotated 39,631 genes by cross-referencing with esteemed public protein databases, including Nr, UniProt, Pfam, KOG, KEGG, and GO, utilizing an E value threshold (detailed in Supplementary Table S1).
Based on the level of gene expression, 681 differentially expressed genes (DEGs) were identified between the control group and the treatment group, including 417 upregulated genes and 264 downregulated genes. To better understand the functional roles of these DEGs, KEGG classification was performed. The upregulated genes fell into the various pathways (Supplementary Figure S1A and Supplementary Table S2). A large portion of them belonged to immune system and pathogen-caused disease-related pathways, such as the NOD−like receptor signaling pathway, complement and coagulation cascade, antigen processing and presentation, legionellosis, measles, toxoplasmosis and malaria. Some immune-related pathways have been frequently associated with tumorigenesis. For instance, NOD1 and NOD2, immune receptors that recognize components of the bacterial cell wall, function as tumor suppressors, and their overexpression reduces the proliferation of cancer cells [18]. Additionally, some of these upregulated genes were enriched in pathways that play roles in suppressing cancers and cell division or promoting apoptosis, such as the P53 signaling pathway [19] and Hippo signaling pathway [20].
In contrast, a large number of downregulated genes were grouped into tumorigenesis or cell proliferation-related pathways (Supplementary Figure S1B and Supplementary Table S3), such as IL-17 signaling, growth hormone synthesis, secretion and action, prolactin signaling pathway, small cell lung cancer, relaxin signaling pathway, choline metabolism in cancer and breast cancer. For example, IL-17 is a crucial cytokine in cancer promotion and progression, and the IL-17-mediated TRAF4:ERK5 activation pathway promotes keratinocyte proliferation and tumorigenesis [21].
Among these DEGs, we particularly focused on genes encoding transcription factors, as they have crucial functions in the development and regeneration process. In total, there were 57 genes belonging to thirty transcription factor (TF) families containing 30 upregulated genes and 27 downregulated genes (Supplementary Table S4). Of these upregulated transcription factor genes (Figure 6A), K10 acts as a tumor suppressor [22], the NF-kappa-B inhibitor epsilon downregulates NF-kappa-B, which can inhibit the proliferation and migration and promote the apoptosis of cells [23], and Matrilin-1 is an inhibitor of neovascularization [24].
For the downregulated genes, it was notable that most of these transcription factor genes (11 of 17) are either oncogenes or play roles in promoting cell proliferation or maintaining cell stemness (Figure 6B and Supplementary Table S4). For example, SALL4 is a master regulator that contributes to cell stemness in biological development and tumor growth [25,26]. Plk3 is an oncogene involved in regualting the G (1)/S phase transition [27,28]. Other downregulated genes play various roles, such as B-lymphocyte-induced maturation protein-1 (Blimp1), which crucially regulates embryonic development and terminal differentiation of immune cells [29].
Collectively, these DEGs analyses can explain the reduced cell proliferation and increased apoptosis caused by Hsp90 suppression. Therefore, Hsp90 plays a crucial role in regulating tail regeneration by orchestrating the expression of the genes, many of which are involved in cell proliferation and apoptosis.
2.5. The Significance of Hsp90 in Tail Fin Regeneration of Zebrafish.
Another question is whether Hsp90 is also required in other epimorphic regeneration processes. We examined its significance in the tail fin of zebrafish, an intensively studied models of epimorphic regeneration. Recently it was revealed that Hsp90α was specifically expressed in the fin regeneration process [15]; however, its necessity in regeneration has not been determined.
Here, we first re-examined the gene expression patterns at different regenerative stages. Following amputation, Hsp90α was specifically expressed in the wound site at 3 hours post-amputation (hpa) (Figure 7A) and increased sharply at 10 hpa (Figure 7B). However, its expression sharply decreased at 1 dpa (Figure 7C). At 3 dpa, its expression was upregulated and maintained a high level and specific expression pattern until 7 dpa in the regeneration site (wound epidermis and blastema) (Figure 7D-F). At 14 dpa its expression was down regulated in the regeneration region (Figure 7G). By contrast, as a negative control, no positive staining was visualized in the tail fin (Figure 7H).
Its necessity in the regenerative process was determined by suppression of Hsp90 with geldanamycin following tail fin amputation. In the control group, as Figure 8A demonstrated, it took approximately 2 weeks to accomplish the fin regeneration process. However, in the treatment group, following amputation, wound healing was completely blocked, and no wound epidermis formed to cover the wound surface, and then gradually decayed, especially in the central area as well as the region of inter fin rays (Figure 8B). However, if the treatment time window is limited to the 3 days following amputation, the regeneration process can be partly restored. Wound healing was accomplished in the subsequent days and then the regeneration process continued but was relatively slow compared to that in the control group (Figure 8C).
To further understand the necessity of Hsp90 in tail fin regeneration molecularly, RNA-seq for comparison between the control and geldanamycin-treated group was performed. Compared to the control group, the suppression of Hsp90 downregulated 1764 genes and upregulated 954 genes in the treatment group. These DEGs fell into various GO and KEGG process categories. A large portion of the downregulated genes were enriched in GO items related to development processes (Supplementary Table S5) and belonged to KEEG items, which are key signaling pathways involved in development and carcinogenesis (Supplementary Table S6).
Of these DEGs, we specifically focus on the transcription factor genes. For these upregulated genes (Figure 9A and Supplementary Table S7), a large proportion of them (14 of 57) are tumor suppressor genes or have the function of promoting cell apoptosis or inhibiting cell proliferation. For example, ETS homologous factor (EHF) can suppress cancer progression by inhibiting epithelial-mesenchymal transition (EMT) [30], and can inhibit the occurrence of colon cancer induced by Apc [31]. Cell death-inducing p53 target 1 (cdip1) is a pro-apoptotic gene, and inhibition of CDIP abrogates p53-mediated apoptotic responses [32]. Activating transcription factor 3 (ATF3), a stress-induced transcription factor, functions as a tumor suppressor and is upregulated upon Hsp90 inhibition [33,34]. Another large part of upregulated genes (8 of 57) are highly involved in the immune system (Figure 9A). Interferon regulatory Factor 8 (IRF8), for example, governs the development of myeloid cells such as monocytes/macrophages and dendritic cells [35], and overexpression of IRF8 in HCC cells significantly enhanced antitumor effects in immune-competent mice [36]. Thirty- four out of 167 downregulated genes were involved in promoting cell proliferation and cell cancer occurrence (Figure 9B). Another big portion of downregulated genes, 40 out of 167, play roles in development and regeneration processes including fin regeneration and formation (Figure 9B and Supplementary Table S7).
2.6. The Significance of Hsp90 in Tail Regeneration of Amphioxus.
To confirm the conservation of Hsp90’s necessity in epimorphosis, we traced its functional role in regeneration back to a key evolutionary animal, the cephalochordate amphioxus. It has established that tail regeneration in amphioxus is a vertebrate-like epimorphosis process, thereby offering an opportunity to explore the evolution of regenerative mechanisms in chordates from invertebrates to vertebrates [17]. Initially, we examined the expression patterns of Hsp90α during the tail regeneration of amphioxus. Notably, Hsp90α was robustly expressed at the wound site during the wound healing stage (Figure 10A, B) and its expression was remaied evident, albeit relatively weak, in blastema at subsequent early and late blastemal stages (12-24 dpa) (Figure 10C, D). As a negative control, no positive staining was observed in the tail regenerate (Figure 10E).
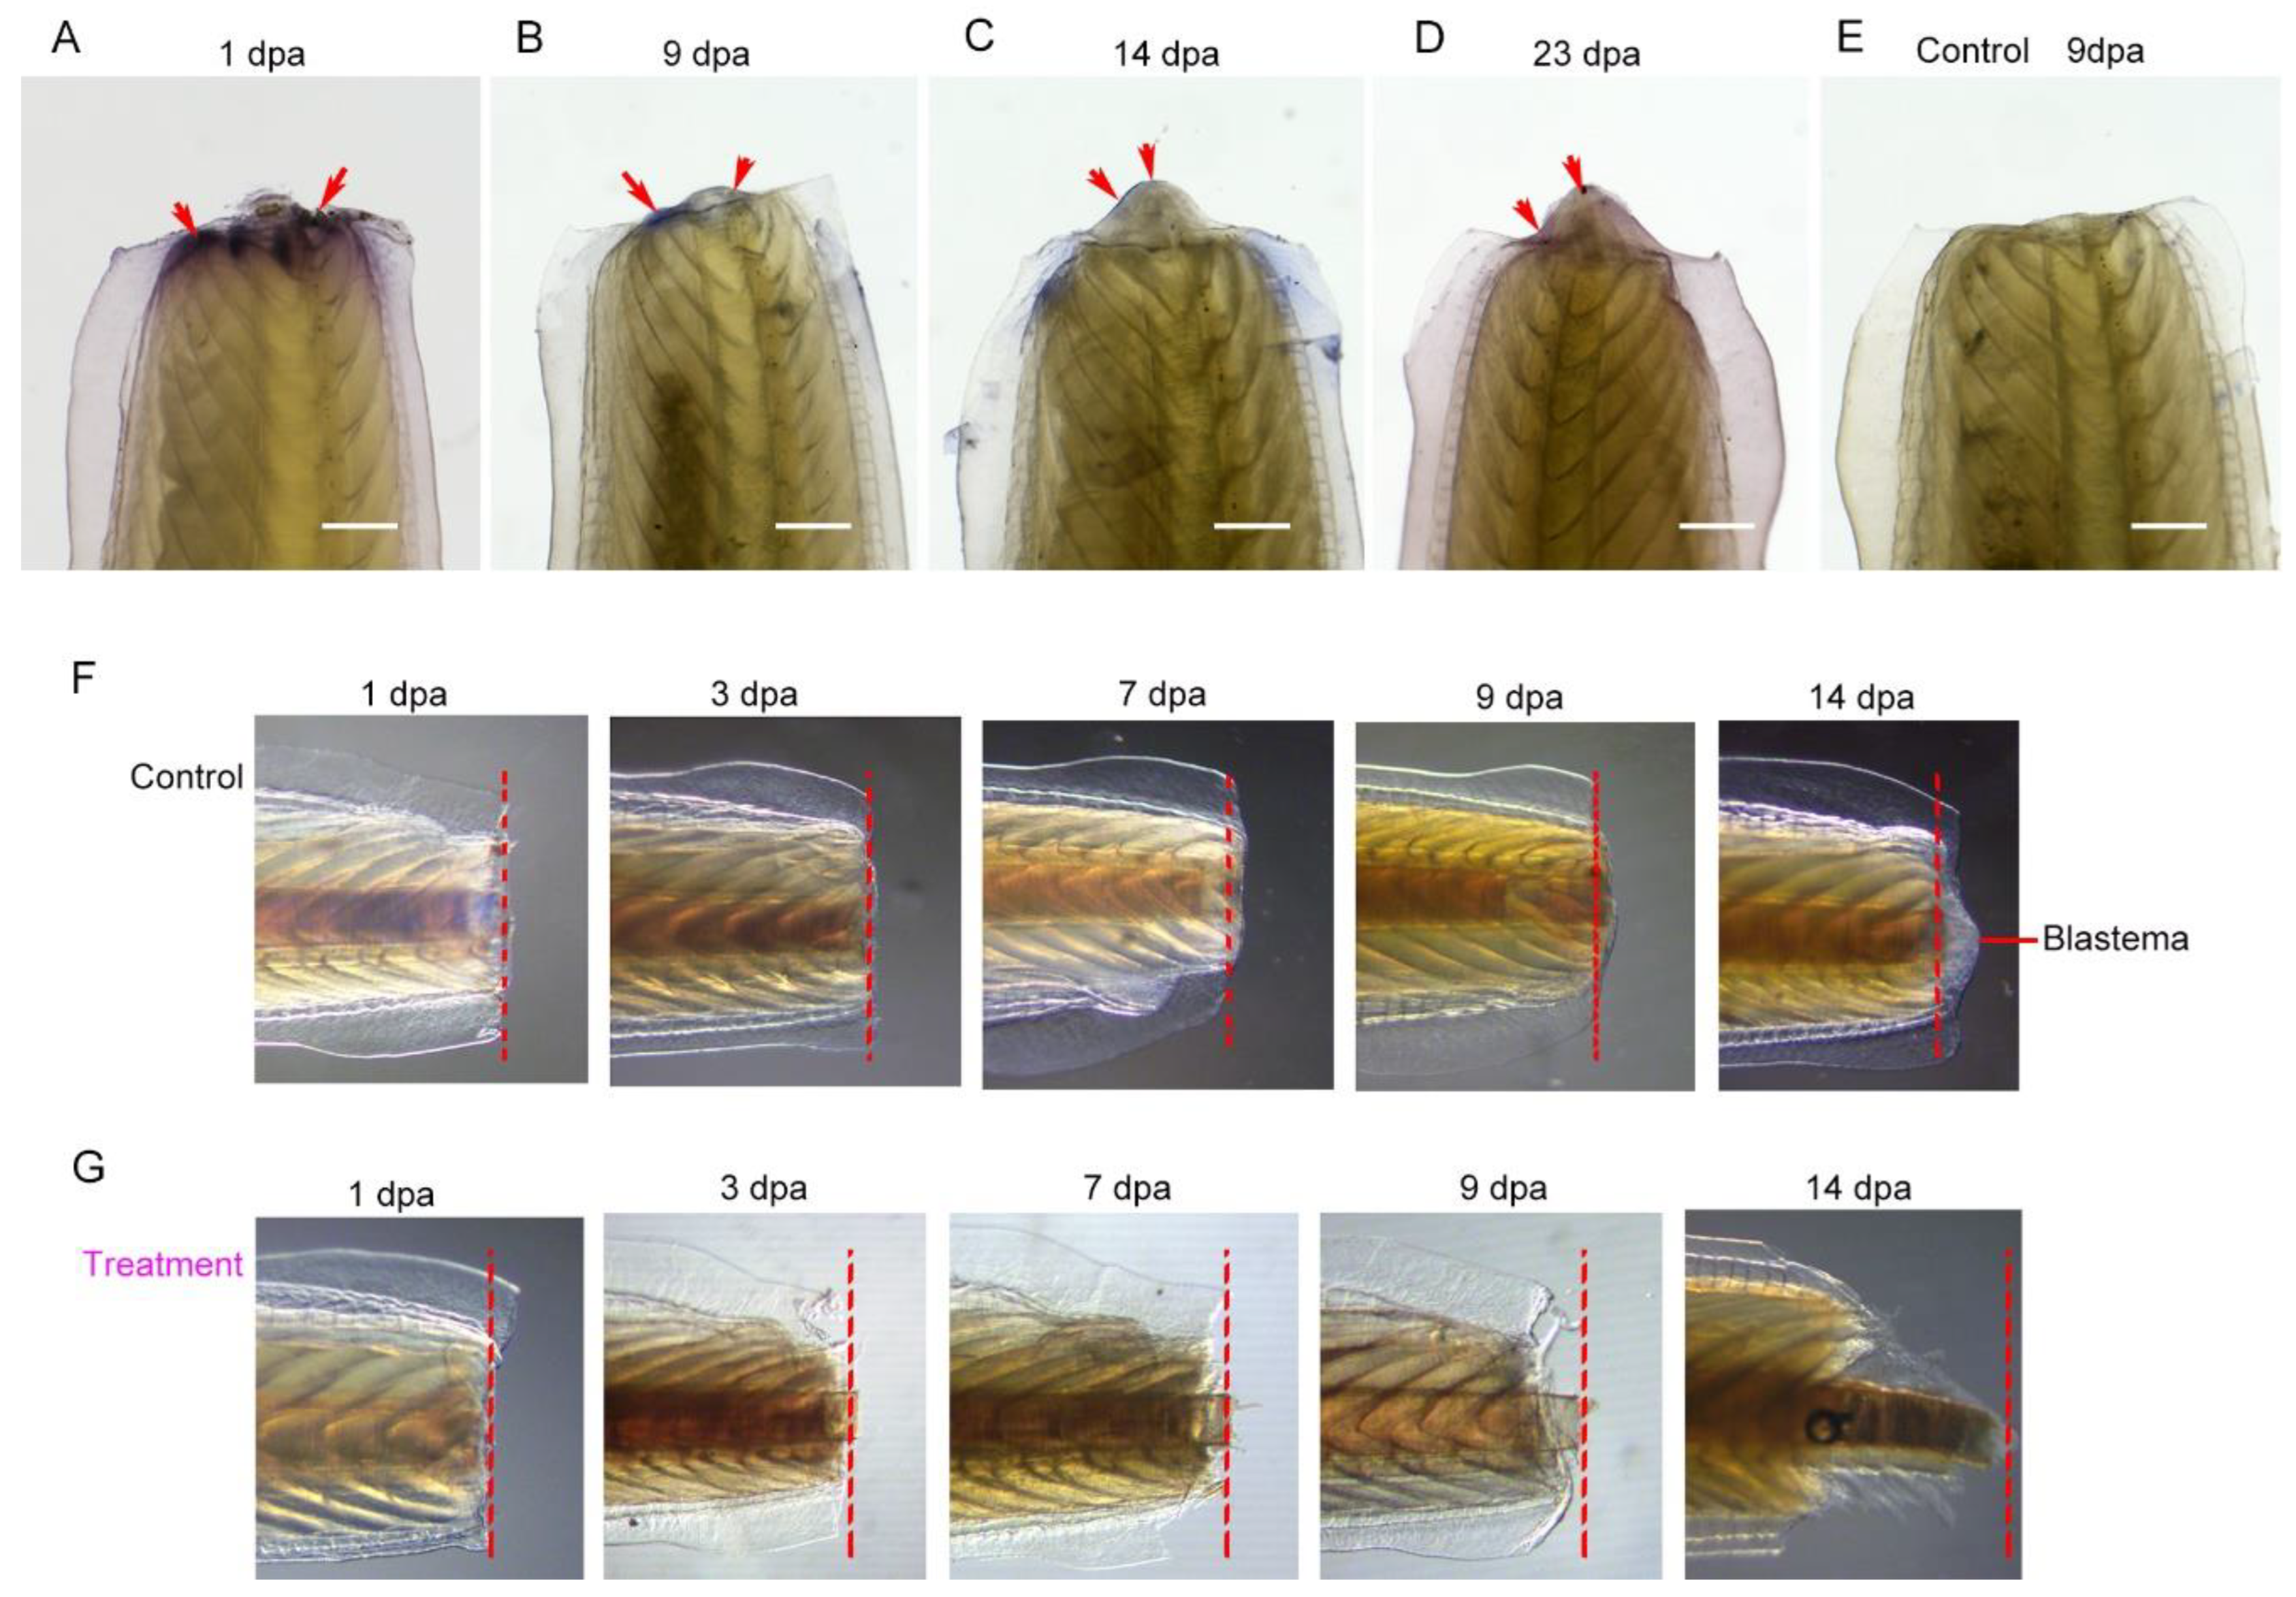
To ascertain whether Hsp90 is indispensable for successful tail regeneration, we inhibited its activity during the tail regeneration process, similar to previous studies in axolotl and zebrafish. As previously reported, wounds in the control group healed successfully at 9 dpa (Figure 10F), followed by the successful formation of the regeneration blastema (Figure 10F). In contrast, inhibition of Hsp90 led to the failure of wound healing, subsequently impeding blastema formation, and ultimately resulting in tail decay (Figure 10G).
3. Discussion
As a stress-induced protein and a highly conserved molecular chaperone, Hsp90 is involved in various biological processes, such as embryo development [13,14], immune response [37], and carcinogenesis [10]. However, its functional role in regeneration process remains largely unknown.
Here, we demonstrate that Hsp90α is expressed in a highly dynamic and specific pattern during three typical epimorphic regeneration processes: tail regeneration in axolotls, tail fin regeneration in zebrafish, and tail regeneration of amphioxus. Knocking down Hsp90α or inhibiting Hsp90 impairs these regeneration processes, suggesting that Hsp90 is essential for epimorphic regeneration. Interestingly, when the inhibition of Hsp90 is removed at a certain point, the stagnant regeneration process in both axolotls and zebrafish is restored to an active state (Figure 2C and Figure 8C). These findings indicate that Hsp90 may function as a trigger or inducer in regeneration.
There are two key observations related to these phenotypes induced by Hsp90 inhibition. Firstly, there is a decrease in cell proliferation due to the suppression of Hsp90 during axolotl tail regeneration. Secondly, there is an increase in cell apoptosis during the tail regenerative process when Hsp90 is inhibited. This regulation of cell apoptosis and proliferation by Hsp90 in regeneration is further supported by changes in gene expression profiles. It is evident that inhibiting Hsp90 leads to the downregulation of numerous genes that promote cell proliferation and maintain stemness. Among these genes, sall4, a key driver of cell stemness [26], is downregulated in both zebrafish and axolotl due to Hsp90 inhibition. Conversely, a significant proportion of upregulated genes are enriched in signaling pathways such as the P53 and Hippo signaling pathways, which play roles in either suppressing cancers and cell division or promoting apoptosis [19,20].
Notably, many of the genes regulated by Hsp90 during regeneration processes are highly involved in tumor formation. Moreover, numerous studies have revealed that overexpression of Hsp90 can induce various cancers. This raises the question of the relationship between regeneration and cancer. The concept of linking regeneration to cancer can be traced back historically to Waddington’s theory, which posits a mechanistic connection between uncontrolled cancerous growth and controlled embryonic development [38]. This theory has been further expanded in recent years to suggest a link between cancer and regeneration [39]. Increasing evidence shows that there are many similarities in cellular processes and gene expression profiles between regeneration and tumorigenesis [40,41]. Our results suggest that, in term of Hsp90, this gene shares similar functions in both regeneration processes and cancers. For instance, as observed in regeneration, Hsp90 also promotes cell proliferation and suppresses apoptosis in cancers [42]. In cancer, inhibiting Hsp90 upregulates the tumor suppressor gene ATF3 [33], and this upregulation of ATF3 induced by Hsp90 inhibition was also observed in the context of regeneration in this study.
In conclusion, our study highlights the necessity of Hsp90 in epimorphic regeneration and its governing role in these processes through regulation of cell proliferation and apoptosis, akin to its function in cancers. Given Hsp90's importance as a molecular chaperone and its ability to interact with a variety of client proteins, further exploration of its additional functions and underlying mechanisms in regeneration is warranted
4. Materials and Methods
4.1. Animals’ Experimental Procedure.
Axolotls (white; obtained from axolotl breeding ground in Changchun, China) with a body length of approximately 5 cm were used for tail amputation. Prior to amputation, the animals were anesthetized with 0.03% MS222 solution (ethyl 3-ami-nobenzoate methanesulfonate salt, Sigma-Aldrich, St. Louis, MO). Prior to tail amputation, the animals were anesthetized with 0.03% MS222 solution (Ethyl 3-ami-nobenzoate methanesulfonate salt, Sigma-Aldrich, St. Louis, MO). The tail-amputated animals and the tail regenerates were used for subsequent experiments.
Zebrafish (wild type, AB line), at 8-10 months old, cultured in our lab, were used in this study. Before tail fin amputation, the animals were anesthetized with 0.01% MS222 solution and then the fin approximately 50% of the fin in length was cut off using a razor blade.
The amphioxus Branchiostoma japonicum used in this study were collected from Shazikou Bay near the city of Qingdao and then cultured in our laboratory. Animals with a body length of approximately 3 cm were selected for tail amputation. The tail amputation was performed as described previously [17].
4.2. Whole-Mount In Situ Hybridization.
To determine the expression patterns of the Hsp90 α during the tail regeneration process of the axolotl, whole mount in situ hybridization was performed on tail regenerates at different stages according to the previously described methods [43,44] with minor modifications. In brief, the tail regenerates were collected and fixed in freshly prepared 4% PFA at 4 °C overnight, then dehydrated with a gradient ethanol and stored in 100% ethanol at -20 °C. The PGM-T-easy vectors (Promega) containing the target gene were linearized with restriction endonuclease NcoI or XhoI, and the sense and antisense gene probes were synthesized by in vitro transcription with T7 or SP6 RNA polymerase and digoxigenin RNA labeling mix (Roche Applied Science). Prior to hybridization, tissues were incubated with 10 μg/ml proteinase K at 37 °C for 10 min to increase tissue permeability. For 48 hours, hybridization was carried out at 60 °C. Alkaline-phosphatase (AP)-conjugated anti-digoxigenin antibody (Roche Applied Science) incubation, at a dilution of 1:2000, was conducted at 4 °C overnight. BCIP and NBT (Roche Applied Science) were used to create the colorimetric alkaline phosphatase reaction.
The expression patterns of the Hsp90α in the tail fin regeneration of zebrafish as well as in the tail regeneration of amphioxus were also detected according to the above protocol. The cDNA sequences of Hsp90α used in this study was presented (Supplementary Table S8).
4.3. Quantitative Real-Time PCR (qRT-PCR).
To examine the expression levels of Hsp90α at the different stages of tail regeneration of axolotl, qRT-PCR was performed. Total RNA was extracted with TRIzol regent (Invitrogen) from tail regenerates at different stages. Single-stranded cDNAs were synthesized with the reverse transcription system (Thermo) according to the manufacturer’s instruction. As previously mentioned, qRT-PCR was carried out using Power SYBR Green PCR Master Mix (Takara) on an ABI 7500 real-time PCR machine (Applied Biosystems) [44]. Data were quantified according to Cycle threshold (CT) values using the 2-ΔΔCT method [45]. Glyceraldehyde-3-phosphate dehydrogenase (GAPDH) was used as the internal reference for q-PCR standardization. Three separate runs of the experiments were carried out in triplicate. The data were expressed as the mean ± standard deviation (SD) and assessed using the paired t test method in the GraphPad Prism software. The statistical significance cutoff criterion was set at P <0.05. The primers employed in this study were as follows: GAPDH-Forward, CGTGACCCCGCCAACATC; GAPDH-Reverse, ACGCTTAGCACCGCCCTTCA; Hsp90α-Forward, AAGAGAGGAAAGCACGGACA; Hsp90α-Reverse, TGCATCACCTGTGTCCATTT.
4.4. Gene Knockdown By Vivo-Morpholinos.
To knock down the expression of Hsp90α protein, the antisense vivo-morpholino (MO) oligonucleotides were designed and synthesized by Gene Tools, LLC (Philomath). The MO sequence was complementary to the 5′ sequence near the start of translation (ATG): 5′-CATCCTGAATCCAAATAGAGGTGTC-3′. For control, the MO with sequence of 5′-CCTCTTACCTCAGTTACAATTTATA-3′(Vivo standard control purchased from Gene Tools, LLC ) was used. After the tail amputation, the axolotls were intraperitoneally injected with MOs (20 μM) at a volume of 50 μL per animal once every two days for a total of 10 days. The MOs (20 μM) were also injected directly into the tissues at multiple points at the wound site approximately 2 μL per animal. The regeneration process was then observed at different time points.
4.5. Pharmacological Treatments.
To better understand the function of Hsp90 during the tail regeneration process of the axolotl, its activity was suppressed with geldanamycin, an Hsp90 inhibitor [46,47,48]. Blue Affi-gel beads (Bio-Rad, 153-7302) were soaked in PBS containing geldanamycin at a concentration of 200 μM at 4°C overnight. Control beads were soaked in PBS. After tail amputation, bead grafting to the wound site was conducted as previously described [16]. Then the animals were kept in an ice box and covered with wet tissue paper for 15 minutes. The animals were then cultured in tap water containing 15 μM geldanamycin, and the water was changed every 3 days. The animals used for controls were kept in pure tap water. The tail regeneration process was recorded at different time points.
4.6. TUNEL Staining.
To investigate the potential role of Hsp90 in regulating cell apoptosis during regeneration, TUNEL staining was performed on sections of tail regenerates treated with geldanamycin and compared to control samples. Tail regenerates at 3 days post-amputation (3-dpa) were collected and fixed in 4% paraformaldehyde (PFA). Longitudinal paraffin sections were then prepared with a thickness of 8 μm. TUNEL staining was conducted using the TUNEL BrightRed Apoptosis Detection Kit (Vazyme Biotech Co., Ltd., Nanjing, China) as previously described [44], with an additional step of staining nuclei with DAPI. The slides were examined using a fluorescence microscope. The apoptotic index was calculated by dividing the number of TUNEL-positive cells by the number of DAPI-stained cells in each tissue section. The results were analyzed using a one-way ANOVA followed by Dunnett’s test for post hoc analysis.
4.7. BrdU Labeling.
To assess whether Hsp90 regulates cell proliferation during regeneration, BrdU labeling was performed on animals treated with geldanamycin and on control animals. BrdU was initially injected intraperitoneally at a concentration of 15 μg/mL in PBS, with a total volume of approximately 40 μL per animal at 1 day post-amputation (dpa). A second BrdU injection was administered at 2 dpa using the same volume and concentration as the first injection. The tails that regenerated by 3 dpa were then collected and fixed in freshly prepared 4% PFA.
Standard paraffin sections with a thickness of 8 μm were then prepared. The sections were dewaxed in xylene and rehydrated through a graded alcohol series. After rinsing with PBS, the sections were incubated in 2N HCl at 37°C for 30 minutes to denature the DNA, followed by neutralization in 0.1 M sodium borate for 15 minutes. To prevent nonspecific binding, the sections were then blocked with 3%BSA. They were then incubated overnight at 4°C with mouse anti-BrdU antibody (Abcam, ab8152) at a 1:100 dilution. Following four washes with PBST (PBS containing 0.1% v/v Tween-20), the sections were incubated in the dark at room temperature with CY3-labeled goat anti-mouse IgG (YESEN, 33208ES60) at a 1:200 dilution. Nuclei were stained with DAPI. After three washes with PBS, the sections were mounted using an anti-fade mounting medium. The slides were examined using a fluorescence microscope. The proliferative index was calculated by dividing the number of BrdU positive cells by the number of DAPI-stained cells in each tissue section. A one-way ANOVA, followed by Dunnett’s post hoc test, was used to compare the geldanamycin-treated group with the control group.
4.8. RNA-Seq Analysis.
To elucidate the molecular mechanism by which Hsp90 regulates tail regeneration in axolotls, RNA-seq analysis was performed. Total RNA was isolated with TRIzol regent (Invitrogen) from tail regenerates from geldanamycin-treated animals (three biological replicates and one individual per extraction) or control groups at 3 dpa.
The cDNA libraries for sequencing were generated with the NEBNext® Ultra™RNA Library Prep Kit for Illumina® (#E7530L, NEB, USA) according to the manufacturer’s instructions as described elsewhere16. The cDNA libraries were paired-end sequenced on an Illumina HiSeq 4000 platform by Beina Gene Biotechnology Co. (Wuhan, China). The depth of sequencing was 6.5 G per sample.
The raw reads obtained were further refined by removing unqualified reads using the fastp software (version 0.21.0; with the default parameter) [49]. Subsequently, these reads were assembled in a de novo process utilizing the Trinity software (version 2.11.0; with the parameter --min_kmer_cov 2) [50]. The quality of the assembled transcripts or unigenes was evaluated based on the size of N50. The completeness of the assembled transcripts or unigenes was assessed using BUSCO (Benchmarking Universal Single-Copy Orthologs) [51]. The assembled transcripts or unigenes were annotated by aligning them to public databases, including the NCBI nonredundant (nr) protein database, Swiss-Prot/TrEMBL, Clusters of Orthologous Groups (COG/KOG), Gene Ontology (GO), and Kyoto Encyclopedia of Genes and Genomes (KEGG) databases.
The expression levels of genes were calculated and normalized using the RPKM (reads per kb per million reads) method [52]. Differentially expressed genes (DEGs) between geldanamycin-treated and control animals were identified employing the R package DESeq2 [53], based on the following criteria: a false discovery rate (FDR) ≤ 0.05 and an absolute fold change ≥ 2. The prediction of transcription factors was performed by comparing the genes to the AnimalTFDB (Animal Transcription Factor Database).
Similarly, comparative RNA seq analysis was carried out between tail fin regenerates at 3 dpa from geldanamycin-treated zebrafish and the control group. The resulting clean reads were mapped to the reference genome using HISAT2. 2.4 [54].
Supplementary Materials
The following supporting information can be downloaded at the website of this paper posted on Preprints.org, Figure S1: KEGG analysis of DEGs of tail regenerates treated with geldanamycin, compared to control group; Table S1: Annotation of unigenes of tail regenerates; Table S2: KEGG analysis of upregulated genes of tail regenerates treated with geldanamycin, compared to control group; Table S3: KEGG analysis of down-regulated genes in tail regenerates treated with geldanamycin, compared to control group; Table S4. Expression levels of transcription factor genes of DEGs in tail regenerates treated with geldanamycin, compared to control group; Table S5: GO analysis of DEGs in tail fin regenerates treated with geldanamycin, compared to control group; Table S6: KEGG analysis of DEGs of tail fin regenerates treated with geldanamycin, compared to control group; Table S7. Expression levels of transcription factor genes of DEGs of tail fin regenerates treated with geldanamycin, compared to control group; Table S8. Sequences of Hsp90α used in this study.
Author Contributions
Conceptualization, Y.L. and D.Q.; methodology, Y.L.; software, Z.L.; validation, Z.L.; formal analysis, X.X.; investigation, Z.L., H.Q., D.R., J.Z., Q.R., Y.X. and Y.L.; resources, Y.L. and D.Q.; data curation, X.X.; writing—original draft preparation, Y.L.; writing—review and editing, Y.L. and D.Q.; visualization, Z.L.; supervision, Y.L.; project administration, Z.L., H.Q.; funding acquisition, Y.L. and D.Q. All authors have read and agreed to the published version of the manuscript.
Funding
This research was funded by the Science & Technology Innovation Project of Laoshan Laboratory (No. LSKJ202203205) and the Open Project of State Key Laboratory of Plateau Ecology and Agriculture, Qinghai University (2023-KF-07).
Institutional Review Board Statement
This study was approved the Ocean University of China's Institutional Animal Care and Use Committee.
Informed Consent Statement
Not applicable.
Data Availability Statement
Data are contained within the article, Supplementary Materials. The raw data of RNA-seq was deposited in NCBI repository under the accession numbers PRJNA1145574 for zebrafish and PRJNA1143947 for axolotl.
Acknowledgments
We thank Dr. Ting Liu for his technical support in tissue sections preparation and Faisal M. for his valuable assistance in correcting the grammatical errors in the manuscript.
Conflicts of Interest
The authors declare no conflicts of interest.
References
- Haslbeck, V.; Kaiser, C.J.; Richter, K. Hsp90 in non-mammalian metazoan model systems. Biochim Biophys Acta 2012, 1823, 712–721. [Google Scholar] [CrossRef] [PubMed]
- Whitesell, L.; Lindquist, S.L. HSP90 and the chaperoning of cancer. Nat Reviews Cancers 2005, 5, 761–772. [Google Scholar] [CrossRef] [PubMed]
- Yao, L.; Qu, B.; Ma, Z.; Chen, Y.; Tan, Y.; Gao, Z.; Zhang, S. Lectin-like and bacterial-agglutinating activities of heat shock proteins Hsp5 and Hsp90α from amphioxus Branchiostoma japonicum. Fish Shellfish immunol 2019, 95, 688–696. [Google Scholar] [CrossRef] [PubMed]
- Lee, Y. C.; Chang, W. W.; Chen, Y. Y.; Tsai, Y. H.; Chou, Y. H.; Tseng, H. C.; Chen, H. L.; Wu, C. C.; Chang-Chien, J.; Lee, H. T.; Yang, H. F.; Wang, B. Y. Hsp90α Mediates BMI1 Expression in Breast Cancer Stem/Progenitor Cells through Facilitating Nuclear Translocation of c-Myc and EZH2. Int J Mol Sci 2017, 18, 1986. [Google Scholar] [CrossRef] [PubMed]
- Zhou, X.; Wen, Y.; Tian, Y.; He, M.; Ke, X.; Huang, Z.; He, Y.; Liu, L.; Scharf, A.; Lu, M.; Zhang, G.; Deng, Y.; Yan, Y.; Mayer, M. P.; Chen, X.; Zou, F. Heat shock protein 90α–dependent b-cell-2–associated transcription factor 1 promotes hepatocellular carcinoma proliferation by regulating myc proto-oncogene c-myc mrna stability. Hepatology 2019, 69, 1564–1581. [Google Scholar] [CrossRef]
- Fan, C. S.; Chen, C. C.; Chen, L. L.; Chua, K. V.; Hung, H. C.; Hsu, J. T.; Huang, T. S. Extracellular HSP90α induces myd88-IRAK complex-associated IKKA/β−NF-ΚB/IRF3 and JAK2/TYK2−STAT-3 signaling in macrophages for tumor-promoting M2-polarization. Cells 2022, 11, 229. [Google Scholar] [CrossRef]
- Ammirante, M.; Rosati, A.; Gentilella, A.; Festa, M.; Petrella, A.; Marzullo, L.; Pascale, M.; Belisario, M. A.; Leone, A.; Turco, M. C. The activity of hsp90α promoter is regulated by NF-ΚB transcription factors. Oncogene 2008, 27, 1175–1178. [Google Scholar] [CrossRef]
- Rehman, A.; Chahal, M. S.; Tang, X.; Bruce, J. E.; Pommier, Y.; Daoud, S. S. Proteomic identification of heat shock protein 90 as a candidate target for p53 mutation reactivation by prima-1 in breast cancer cells. Breast Cancer Res 2005, 7, R765–774. [Google Scholar] [CrossRef]
- Zhang, S.; Wang, C.; Ma, B.; Xu, M.; Xu, S.; Liu, J.; Tian, Y.; Fu, Y.; Luo, Y. Mutant p53 drives cancer metastasis via RCP-mediated Hsp90α secretion. Cell Rep 2020, 32, 107879. [Google Scholar] [CrossRef]
- Birbo, B.; Madu, E. E.; Madu, C. O.; Jain, A.; Lu, Y. Role of hsp90 in cancer. Int J Mol Sci 2021, 22, 10317. [Google Scholar] [CrossRef]
- Lacey, T.; Lacey, H. Linking hsp90's role as an evolutionary capacitator to the development of cancer. Cancer Treat Res. Commun 2021, 28, 100400. [Google Scholar] [CrossRef] [PubMed]
- Li, Z. N.; Luo, Y. HSP90 inhibitors and cancer: Prospects for use in targeted therapies (Review). Oncol Rep 2023, 49, 6. [Google Scholar] [CrossRef] [PubMed]
- Lele, Z.; Hartson, S. D.; Martin, C. C.; Whitesell, L.; Matts, R. L.; Krone, P. H. Disruption of zebrafish somite development by pharmacologic inhibition of Hsp90. Dev Biol 1999, 210, 56–70. [Google Scholar] [CrossRef] [PubMed]
- Yeyati P., L.; Bancewicz, R. M.; Maule, J.; van Heyningen, V. Hsp90 selectively modulates phenotype in vertebrate development. PLoS Genet 2007, 3, e43. [Google Scholar] [CrossRef]
- Li, J.; Sultan, Y.; Sun, Y.; Zhang, S.; Liu, Y.; Li, X. Expression analysis of Hsp90α and cytokines in zebrafish caudal fin regeneration. Dev Comp Immunol. 2021, 116, 103922. [Google Scholar] [CrossRef]
- Tanaka, E. M.; Reddien, P. W. The cellular basis for animal regeneration. Dev Cell 2011, 21, 172–185. [Google Scholar] [CrossRef]
- Liang, Y.; Rathnayake, D.; Huang, S.; Pathirana, A.; Xu, Q.; Zhang, S. BMP signaling is required for amphioxus tail regeneration. Development 2019, 146, dev166017. [Google Scholar] [CrossRef]
- Velloso, F. J.; Sogayar, M. C.; Correa, R. G. Expression and in vitro assessment of tumorigenicity for NOD1 and NOD2 receptors in breast cancer cell lines. BMC Res Notes 2018, 11, 222. [Google Scholar] [CrossRef]
- Hernández Borrero, L. J.; El-Deiry, W. S. Tumor suppressor p53: Biology, signaling pathways, and therapeutic targeting. Biochim Biophys Acta Rev Cancer 2021, 1876, 188556. [Google Scholar] [CrossRef]
- He, L.; Yuan, L.; Yu, W.; Sun, Y.; Jiang, D.; Wang, X.; Feng, X.; Wang, Z.; Xu, J.; Yang, R.; et al. A regulation loop between yap and NR4A1 balances cell proliferation and apoptosis. Cell Rep 2020, 33(3), 108284. [Google Scholar] [CrossRef]
- Wu, L.; Chen, X.; Zhao, J.; Martin, B.; Zepp, J. A.; Ko, J. S.; Gu, C.; Cai, G.; Ouyang, W.; Sen, G.; et al. A novel IL-17 signaling pathway controlling keratinocyte proliferation and tumorigenesis via the TRAF4-ERK5 axis. J Exp Med 2015, 212, 1571–1587. [Google Scholar] [CrossRef] [PubMed]
- Reichelt, J.; Furstenberger, G.; Magin, T. M. Loss of keratin 10 leads to mitogen-activated protein kinase (MAPK) activation, increased keratinocyte turnover, and decreased tumor formation in mice. J Invest Dermatol 2004, 123, 973–981. [Google Scholar] [CrossRef] [PubMed]
- Liu, S.; Zheng, L. L.; Zhu, Y. M.; Shen, H. J.; Zhong, Q.; Huang, J.; Li, C.; Liu, Z.; Yao, M. D.; Ou, R. M.; Zhang, Q. Knockdown of regγ inhibits the proliferation and migration and promotes the apoptosis of multiple myeloma cells by downregulating NF-ΚB Signal pathway. Hematology 2017, 23, 277–283. [Google Scholar] [CrossRef] [PubMed]
- Foradori, M. J.; Chen, Q.; Fernandez, C. A.; Harper, J.; Li, X.; Tsang, P. C.; Langer, R.; Moses, M. A. Matrilin-1 is an inhibitor of neovascularization. J Biol Chem 2014, 289, 14301–14309. [Google Scholar] [CrossRef]
- Sun, B.; Xu, L.; Bi, W.; Ou, W. B. SALL4 oncogenic function in cancers: Mechanisms and therapeutic relevance. Int J Mol Sci 2022, 23, 2053. [Google Scholar] [CrossRef]
- Xiong, J. SALL4: Engine of Cell Stemness. Curr Gene Ther 2014, 14, 400–411. [Google Scholar] [CrossRef]
- Zimmerman, W. C.; Erikson, R. L. Polo-like Kinase 3 is required for entry into S phase. Proc Natl Sci U S A 2016, 104, 1847–1852. [Google Scholar] [CrossRef]
- Helmke, C.; Becker, S.; Strebhardt, K. The role of PLK3 in oncogenesis. Oncogene 2015, 35, 135–147. [Google Scholar] [CrossRef]
- Nadeau, S.; Martins, G. A. Conserved and unique functions of BLIMP1 in immune cells. Front Immunol 2022, 12, 805260. [Google Scholar] [CrossRef]
- Sakamoto, K.; Endo, K.; Sakamoto, K.; Kayamori, K.; Ehata, S.; Ichikawa, J.; Ando, T.; Nakamura, R.; Kimura, Y.; Yoshizawa, K.; et al. EHF suppresses cancer progression by inhibiting ETS1-mediated Zeb expression. Oncogenesis 2021, 10, 26. [Google Scholar] [CrossRef]
- Reehorst, C. M.; Nightingale, R.; Luk, I. Y.; Jenkins, L.; Koentgen, F.; Williams, D. S.; Darido, C.; Tan, F.; Anderton, H.; Chopin, M.; et al. EHF is essential for epidermal and colonic epithelial homeostasis, and suppresses apc-initiated colonic tumorigenesis. Development 2012, 148, dev199542. [Google Scholar] [CrossRef] [PubMed]
- Brown, L.; Ongusaha, P. P.; Kim, H. G.; Nuti, S.; Mandinova, A.; Lee, J. W.; Khosravi-Far, R.; Aaronson, S. A.; Lee, S. W. CDIP, a novel pro-apoptotic gene, regulates TNFA-mediated apoptosis in a p53-dependent manner. EMBO J 2007, 26, 3410–3422. [Google Scholar] [CrossRef] [PubMed]
- Hackl, C.; Lang, S. A.; Moser, C.; Mori, A.; Fichtner-Feigl, S.; Hellerbrand, C.; Dietmeier, W.; Schlitt, H. J.; Geissler, E. K.; Stoeltzing, O. Activating transcription factor-3 (ATF3) functions as a tumor suppressor in colon cancer and is up-regulated upon heat-shock protein 90 (HSP90) inhibition. BMC Cancer 2010, 10, 668. [Google Scholar] [CrossRef] [PubMed]
- Edagawa, M.; Kawauchi, J.; Hirata, M.; Goshima, H.; Inoue, M.; Okamoto, T.; Murakami, A.; Maehara, Y.; Kitajima, S. Role of activating transcription factor 3 (ATF3) in Endoplasmic Reticulum (ER) stress-induced sensitization of p53-deficient human colon cancer cells to tumor necrosis factor (tnf)-related apoptosis-inducing ligand (trail)-mediated apoptosis through up-regulation of death receptor 5 (DR5) by Zerumbone and celecoxib. J Biol Chem 2014, 289(31), 21544–21561. [Google Scholar]
- Xia, X.; Wang, W.; Yin, K.; Wang, S. Interferon Regulatory factor 8 governs myeloid cell development. Cytokine Growth Factor Rev 2020, 55, 48–57. [Google Scholar] [CrossRef]
- Wu, H.; Li, Y.; Shi, G.; Du, S.; Wang, X.; Ye, W.; Zhang, Z.; Chu, Y.; Ma, S.; Wang, D. Hepatic interferon regulatory factor 8 expression suppresses hepatocellular carcinoma progression and enhances the response to anti–programmed cell death protein-1 therapy. Hepatology 2022, 76, 1602–1616. [Google Scholar] [CrossRef]
- Carey, R. M.; Hariri, B. M.; Adappa, N. D.; Palmer, J. N.; Lee, R. J. HSP90 Modulates T2R Bitter Taste Receptor Nitric Oxide Production and Innate Immune Responses in Human Airway Epithelial Cells and Macrophages. Cells 2022, 11(9), 1478. [Google Scholar] [CrossRef]
- Waddington, C. H. Cancer and the theory of organisers. Nature 1935, 135, 606–608. [Google Scholar] [CrossRef]
- Oviedo, N. J.; Beane, W. S. Regeneration: The origin of cancer or a possible cure? Semin Cell Dev Biol 2009, 20, 557–564. [Google Scholar] [CrossRef]
- Charni, M.; Aloni-Grinstein, R.; Molchadsky, A.; Rotter, V. P53 on the crossroad between regeneration and cancer. Cell Death Differ 2017, 24, 8–14. [Google Scholar] [CrossRef]
- Ratajczak, M. Z.; Bujko, K.; Mack, A.; Kucia, M.; Ratajczak, J. Cancer from the perspective of stem cells and misappropriated tissue regeneration mechanisms. Leukemia 2018, 32, 2519–2526. [Google Scholar] [CrossRef] [PubMed]
- Hoter, A.; El-Sabban, M.; Naim, H. The hsp90 family: Structure, regulation, function, and implications in health and disease. Int J Mol Sci 2018, 19, 2560. [Google Scholar] [CrossRef] [PubMed]
- Gardiner, D. M.; Blumberg, B. , Komine, Y.; Bryant, S. V. Regulation of HoxA expression in developing and regenerating axolotl limbs. Development 1995, 121, 1731–1741. [Google Scholar] [CrossRef] [PubMed]
- Huang, T.; Zuo, L.; Walczyńska, K. S.; Zhu, M.; Liang, Y. Essential roles of matrix metalloproteinases in axolotl digit regeneration. Cell Tissue Res 2021, 385, 105–113. [Google Scholar] [CrossRef]
- Livak, K. J.; Schmittgen, T. D. Analysis of relative gene expression data using real-time quantitative PCR and the 2(-Delta Delta C(T)) Method. Methods 2001, 25, 402–408. [Google Scholar] [CrossRef]
- Roe, S. M.; Prodromou, C.; O'Brien, R.; Ladbury, J. E.; Piper, P. W.; Pearl, L. H. Structural basis for inhibition of the hsp90 molecular chaperone by the antitumor antibiotics radicicol and geldanamycin. J Med Chem 1999, 42, 260–266. [Google Scholar] [CrossRef]
- Wagatsuma, A.; Shiozuka, M.; Kotake, N.; Takayuki, K.; Yusuke, H.; Mabuchi, K.; Matsuda, R.; Yamada, S. Pharmacological inhibition of hsp90 activity negatively modulates myogenic differentiation and cell survival in C2C12 cells. Mol Cell Biochem 2011, 358, 265–280. [Google Scholar] [CrossRef]
- Lin, Z.; Peng, R.; Li, Z.; Wang, Y.; Lu, C.; Shen, Y.; Wang, J.; Shi, G. 17-abag, a novel geldanamycin derivative, inhibits lncap-cell proliferation through heat shock protein 90 inhibition. Int J Mol Med 2015, 36, 424–432. [Google Scholar] [CrossRef]
- Chen, S.; Zhou, Y.; Chen, Y.; Gu, J. (2018). fastp: an ultra-fast all-in-one FASTQ preprocessor. Bioinformatics, 2018; 34. [Google Scholar]
- Grabherr, M. G.; Haas, B. J.; Yassour, M.; Levin, J. Z.; Thompson, D. A.; Amit, I.; Adiconis, X.; Fan, L.; Raychowdhury, R.; Zeng, Q. Full-length transcriptome assembly from RNA-seq data without a reference genome. Nat Biotechnol 2011, 29, 644–652. [Google Scholar] [CrossRef]
- Manni, M.; Berkeley, M. R.; Seppey, M.; Simão, F. A.; Zdobnov, E. M. BUSCO Update: Novel and Streamlined Workflows along with Broader and Deeper Phylogenetic Coverage for Scoring of Eukaryotic, Prokaryotic, and Viral Genomes. Mol Biol Evol 2019, 38(10), 4647–4654. [Google Scholar] [CrossRef]
- Mortazavi, A.; Williams, B. A.; McCue, K.; Schaeffer, L.; Wold, B. Mapping and quantifying mammalian transcriptomes by RNA-Seq. Nat Methods 2008, 5, 621–628. [Google Scholar] [CrossRef] [PubMed]
- Love, M. I.; Huber, W.; Anders, S. Moderated estimation of fold change and dispersion for RNA-seq data with deseq2. Genome Biol 2014, 15, 500. [Google Scholar] [CrossRef] [PubMed]
- Kim, D.; Langmead, B.; Salzberg, S. L. HISAT: A fast spliced aligner with low memory requirements. Nat Methods 2015, 12, 357–360. [Google Scholar] [CrossRef] [PubMed]
Figure 1.
Expression patterns of Hsp90α during tail regeneration of axolotl. (A-I) Whole-mount in situ hybridization analysis of Hsp90α expression in tail regenerates at different stages (using antisense probes) and control (using sense probes) respectively. All panels are tail regenerates with distal part at the top. Blue or purple indicates the positive staining pointed by arrows. (J) q-PCR analysis of Hsp90α expression changes during the tail regeneration process. Intact means intact tail, which was used as control. Data are expressed as mean ±s.d. (n=3). *P<0.01 (compared with intact tail).
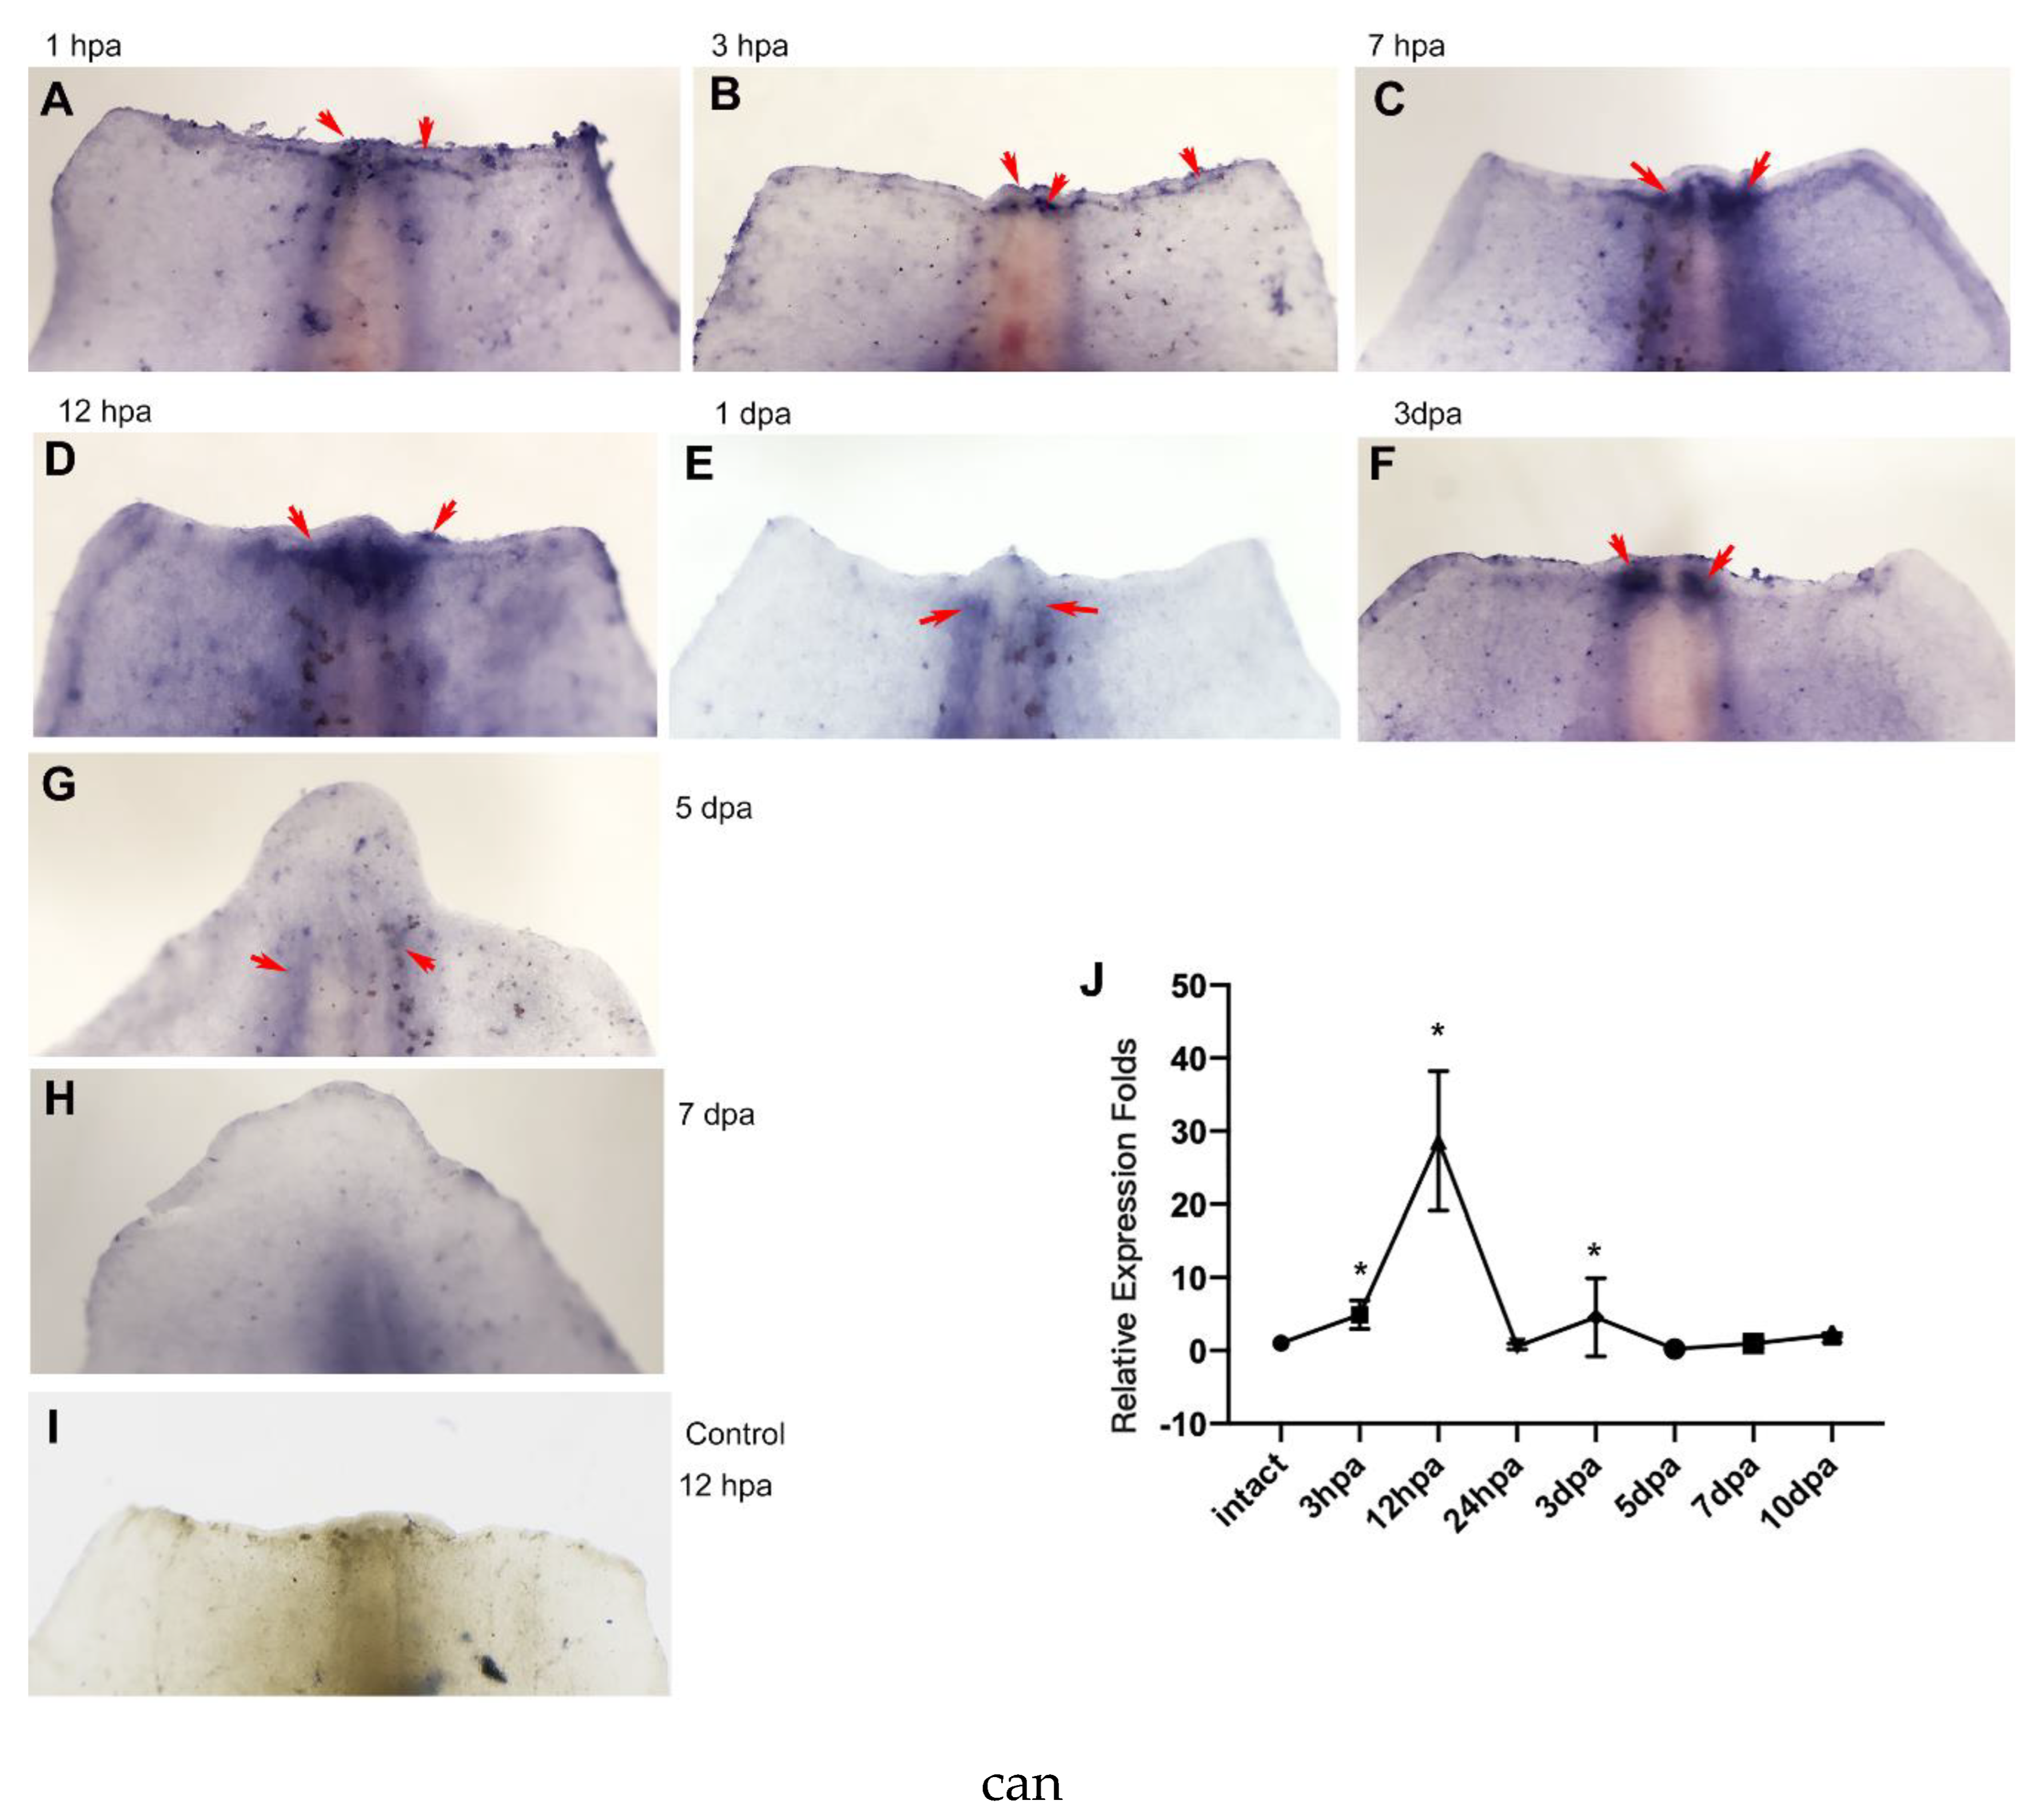
Figure 2.
Inhibition of Hsp90 with geldanamycin impaired tail regeneration. (A) Tail regeneration process of control group. (B) Tail regeneration process (treatment with geldanamycin from immediate amputation to 15 dpa). (C) Tail regeneration process (treatment with geldanamycin from immediate amputation to 10 dpa). dpa means day post amputation. Dashed lines show amputation plane.
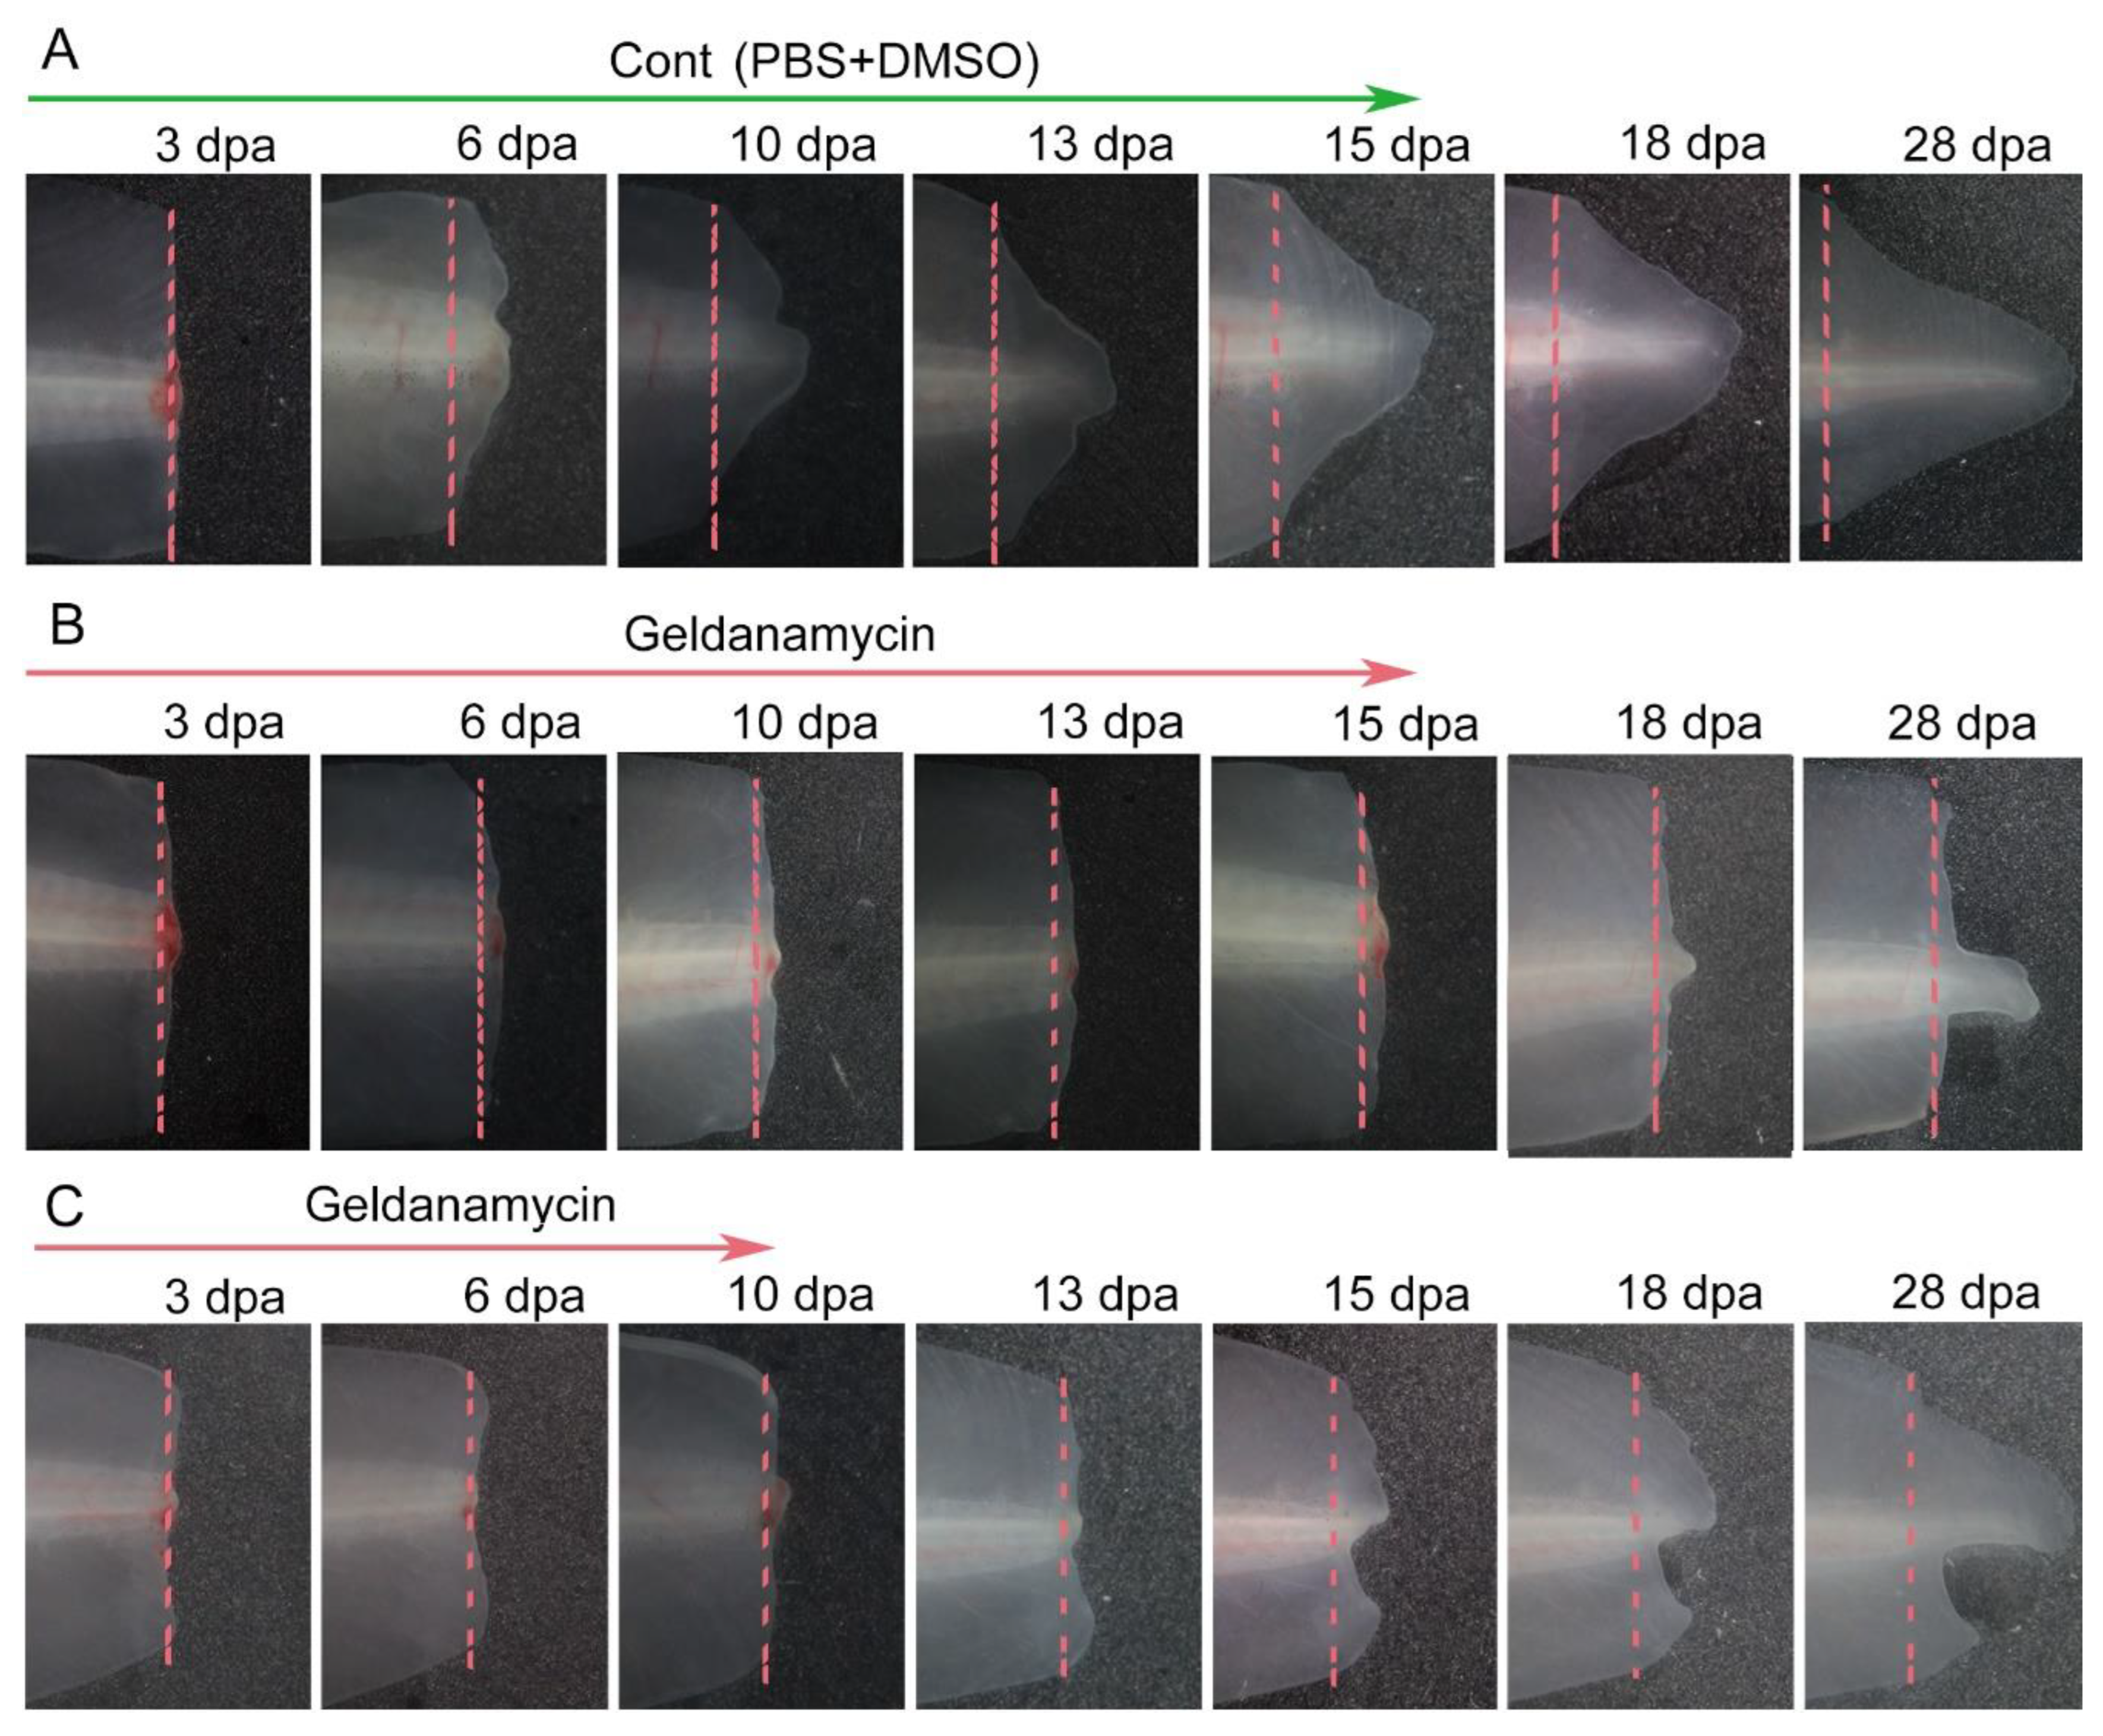
Figure 3.
Hsp90 Knockdown via Vivo-Morpholino impaired tail regeneration. (A) Tail regeneration process of control group (injected with control MO). (B) Tail regeneration process of treatment group (injected with Hsp90 MO). MO means Morpholino. dpa means day post amputation. Dashed lines show amputation plane.
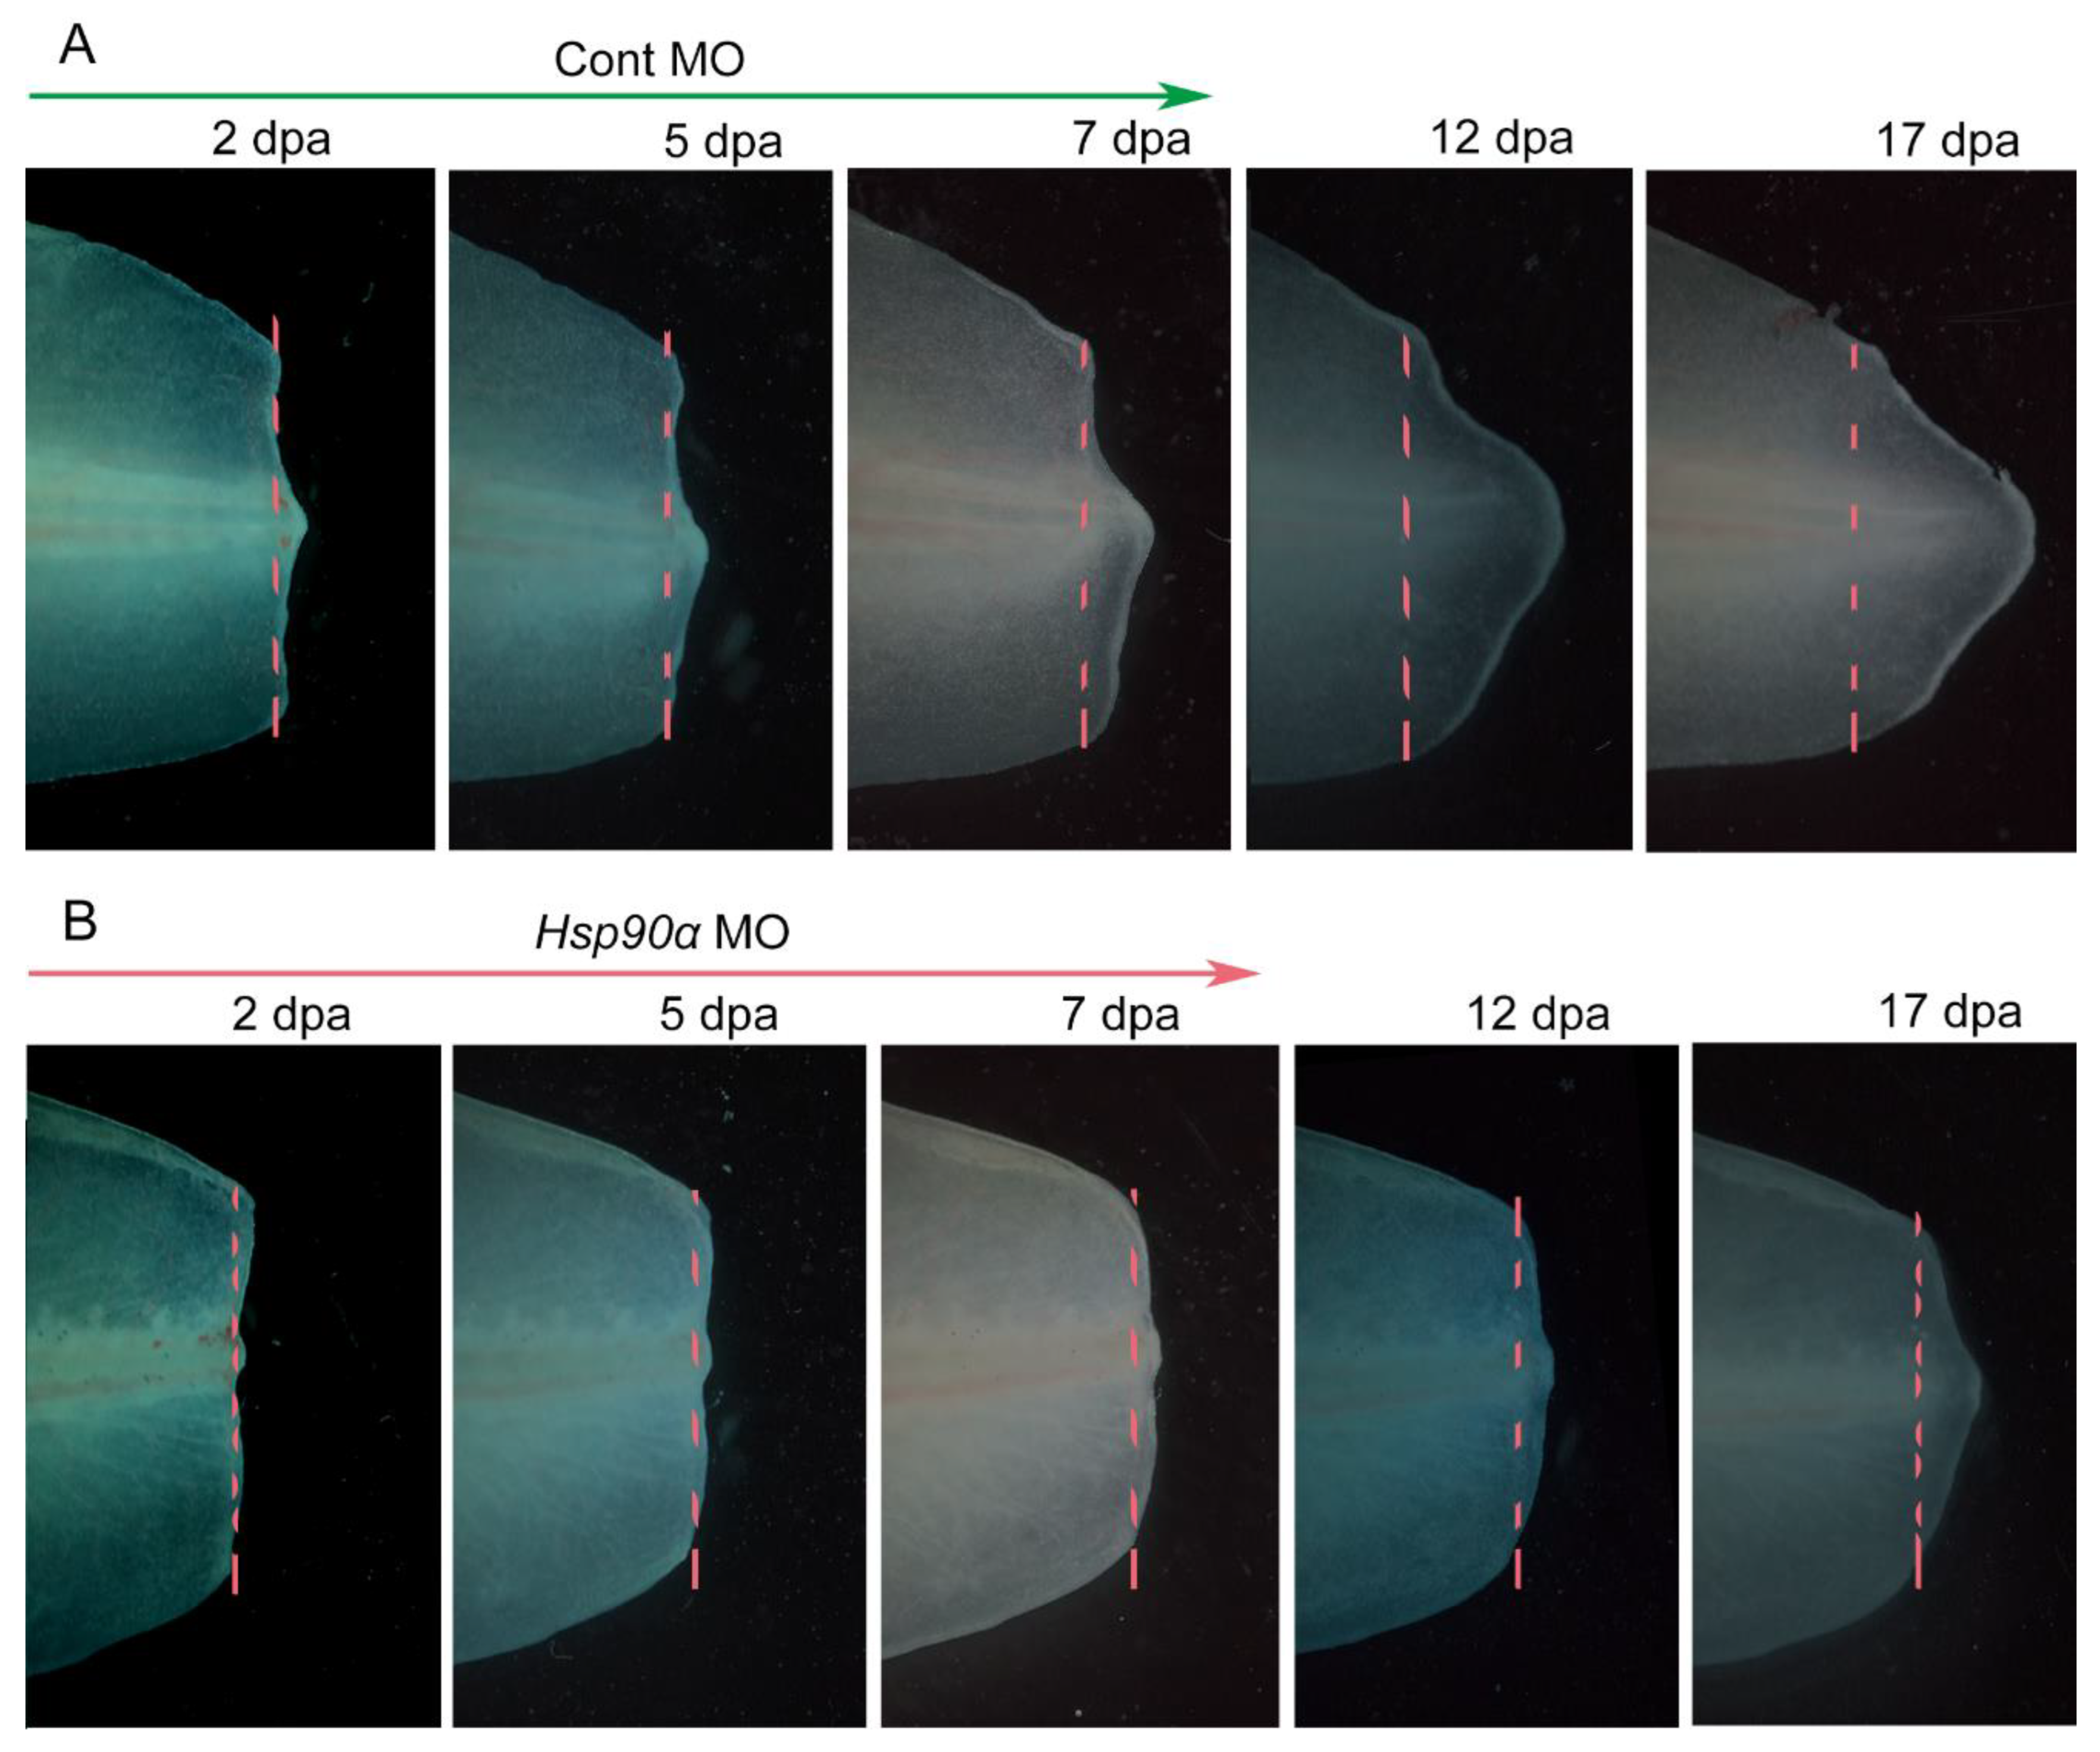
Figure 4.
BrdU labeling assay to assess cell proliferation in tail regenerates following the inhibition of Hsp90 with geldanamycin. (A-C) show sections of tail regeneration at 3 days post-amputation (dpa) in the control group. These sections are stained with DAPI (blue) to highlight the nuclei, BrdU antibody (red) to mark proliferating cells, and a merged image (pink) highlighting areas of overlap. (D-F) display equivalent staining for the tail regeneration at 3 dpa in the group treated with geldanamycin. (G) provides a graphical representation of the cell proliferative index, calculated from sections of the tail regenerates, with asterisks indicating significant differences between the control and treated groups (*P<0.05). The sections are longitudinal, with the regeneration region oriented at the top. The scale bar included in the images denotes 1000 μm.
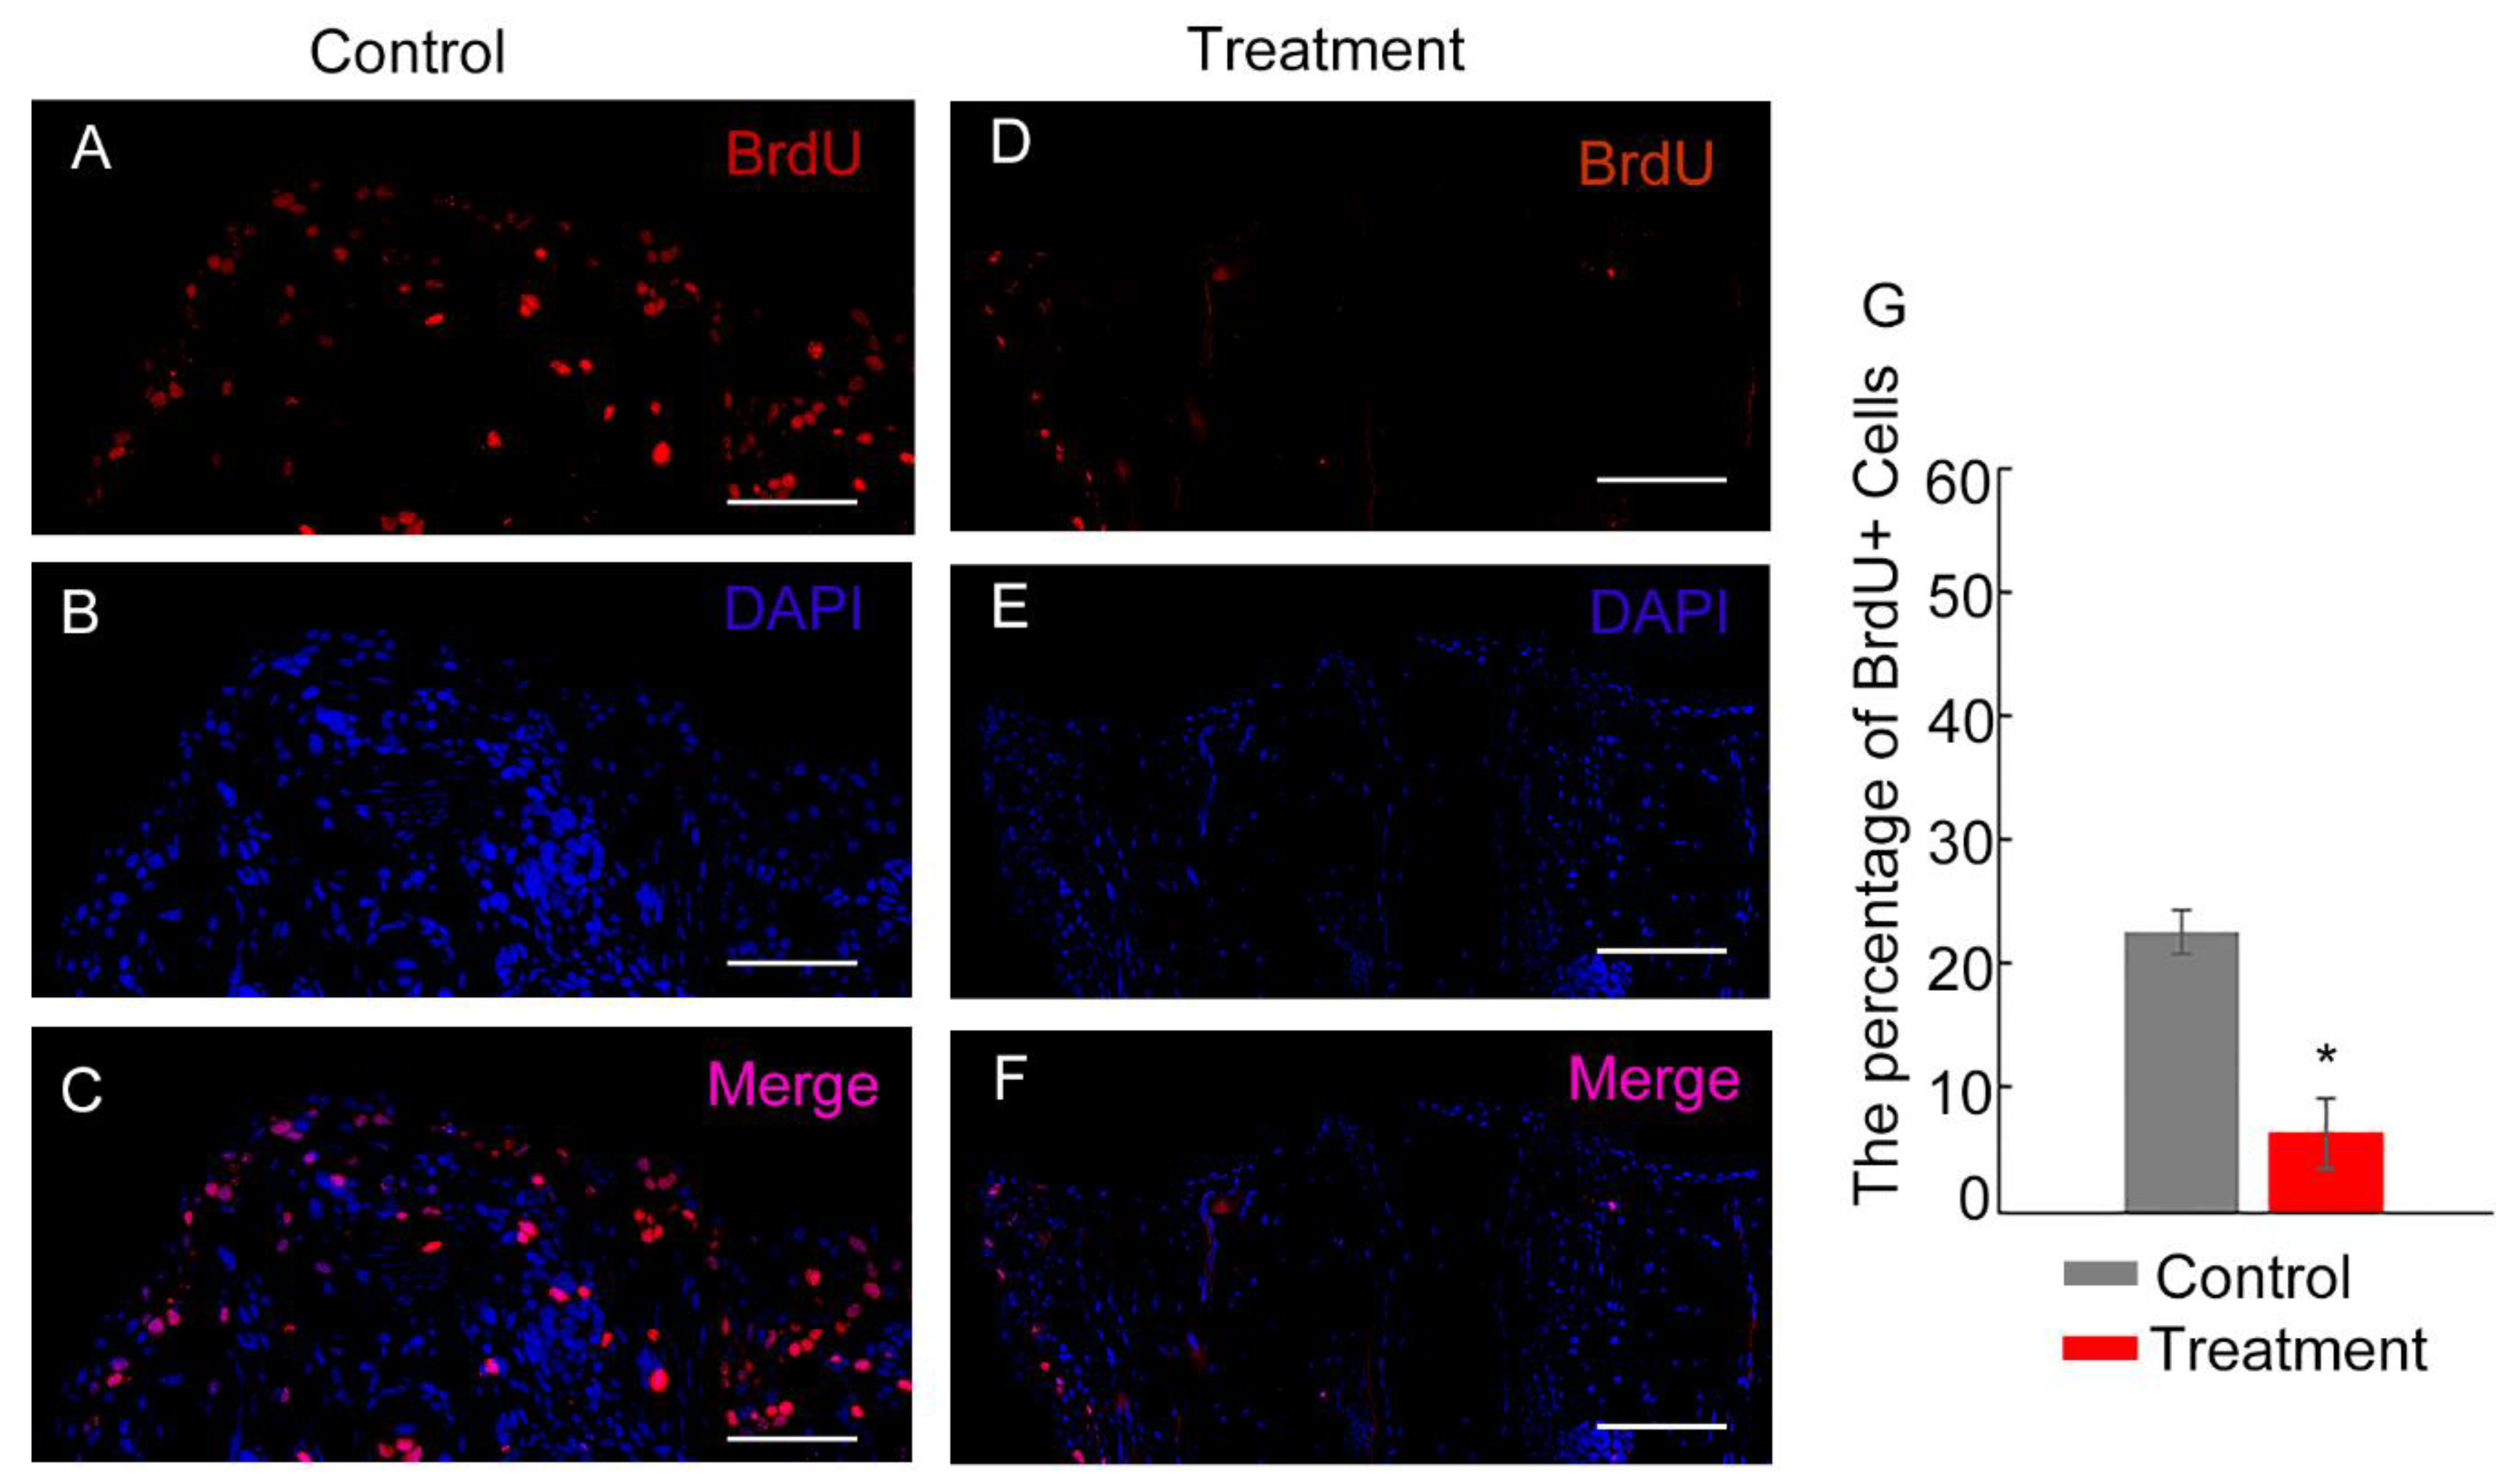
Figure 5.
TUNEL assay to assess apoptosis in tail regenerates following inhibition of Hsp90 with geldanamycin. (A-C) depict tail regeneration at 3 days post-amputation (dpa) in the control group, with sections stained for TUNEL (red), DAPI (blue), and a merged image (pink) showing overlap. (D-F) present similar stainings for the tail regeneration at 3 dpa in the group treated with geldanamycin. (G) graphically represents the cell proliferative index calculated from sections of tail regenerates, highlighting significant differences between the control and treated groups, indicated by asterisks (*P<0.05). The sections are oriented longitudinally with the regeneration region positioned at the top. The scale bar in the images represents 1000 μm.
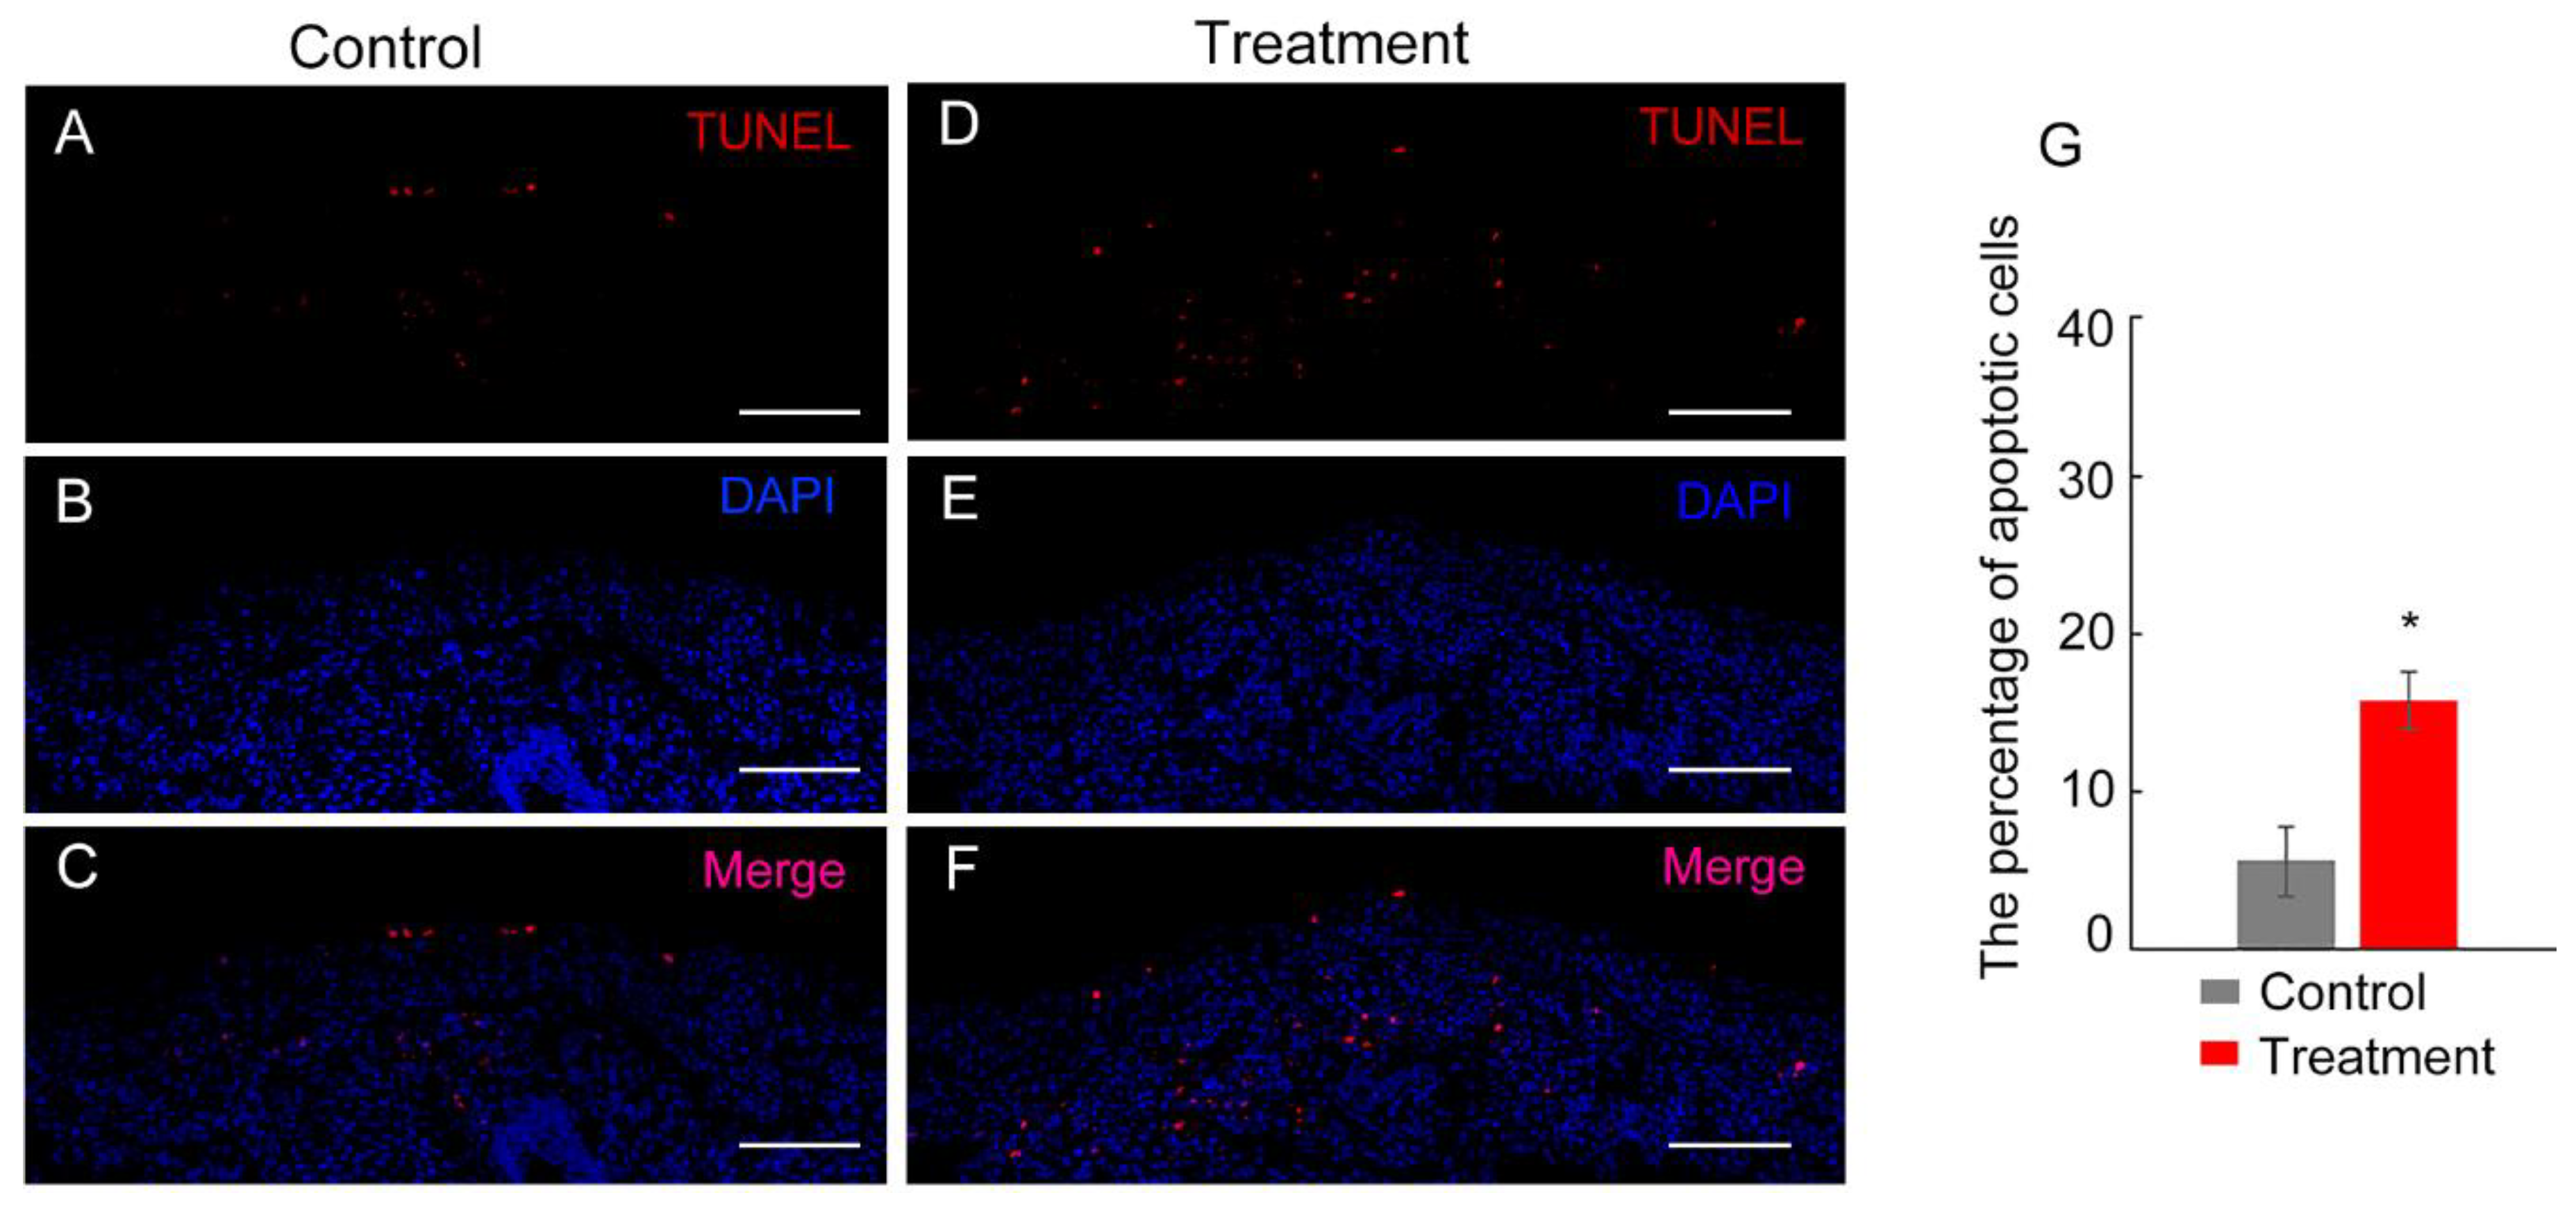
Figure 6.
Expression levels of transcription factor genes of DEGs in tail regenerates treated with geldanamycin, compared to control group (without treatment with geldanamycin). (A) Heatmap showing the levels of 7 upregulated genes. (B) Heatmap showing the levels of 14 downregulated genes. Ax-Hi-3d represents tail regenerates at 3 dpa treated with geldanamycin, and Ax-C-3d represents the control group.
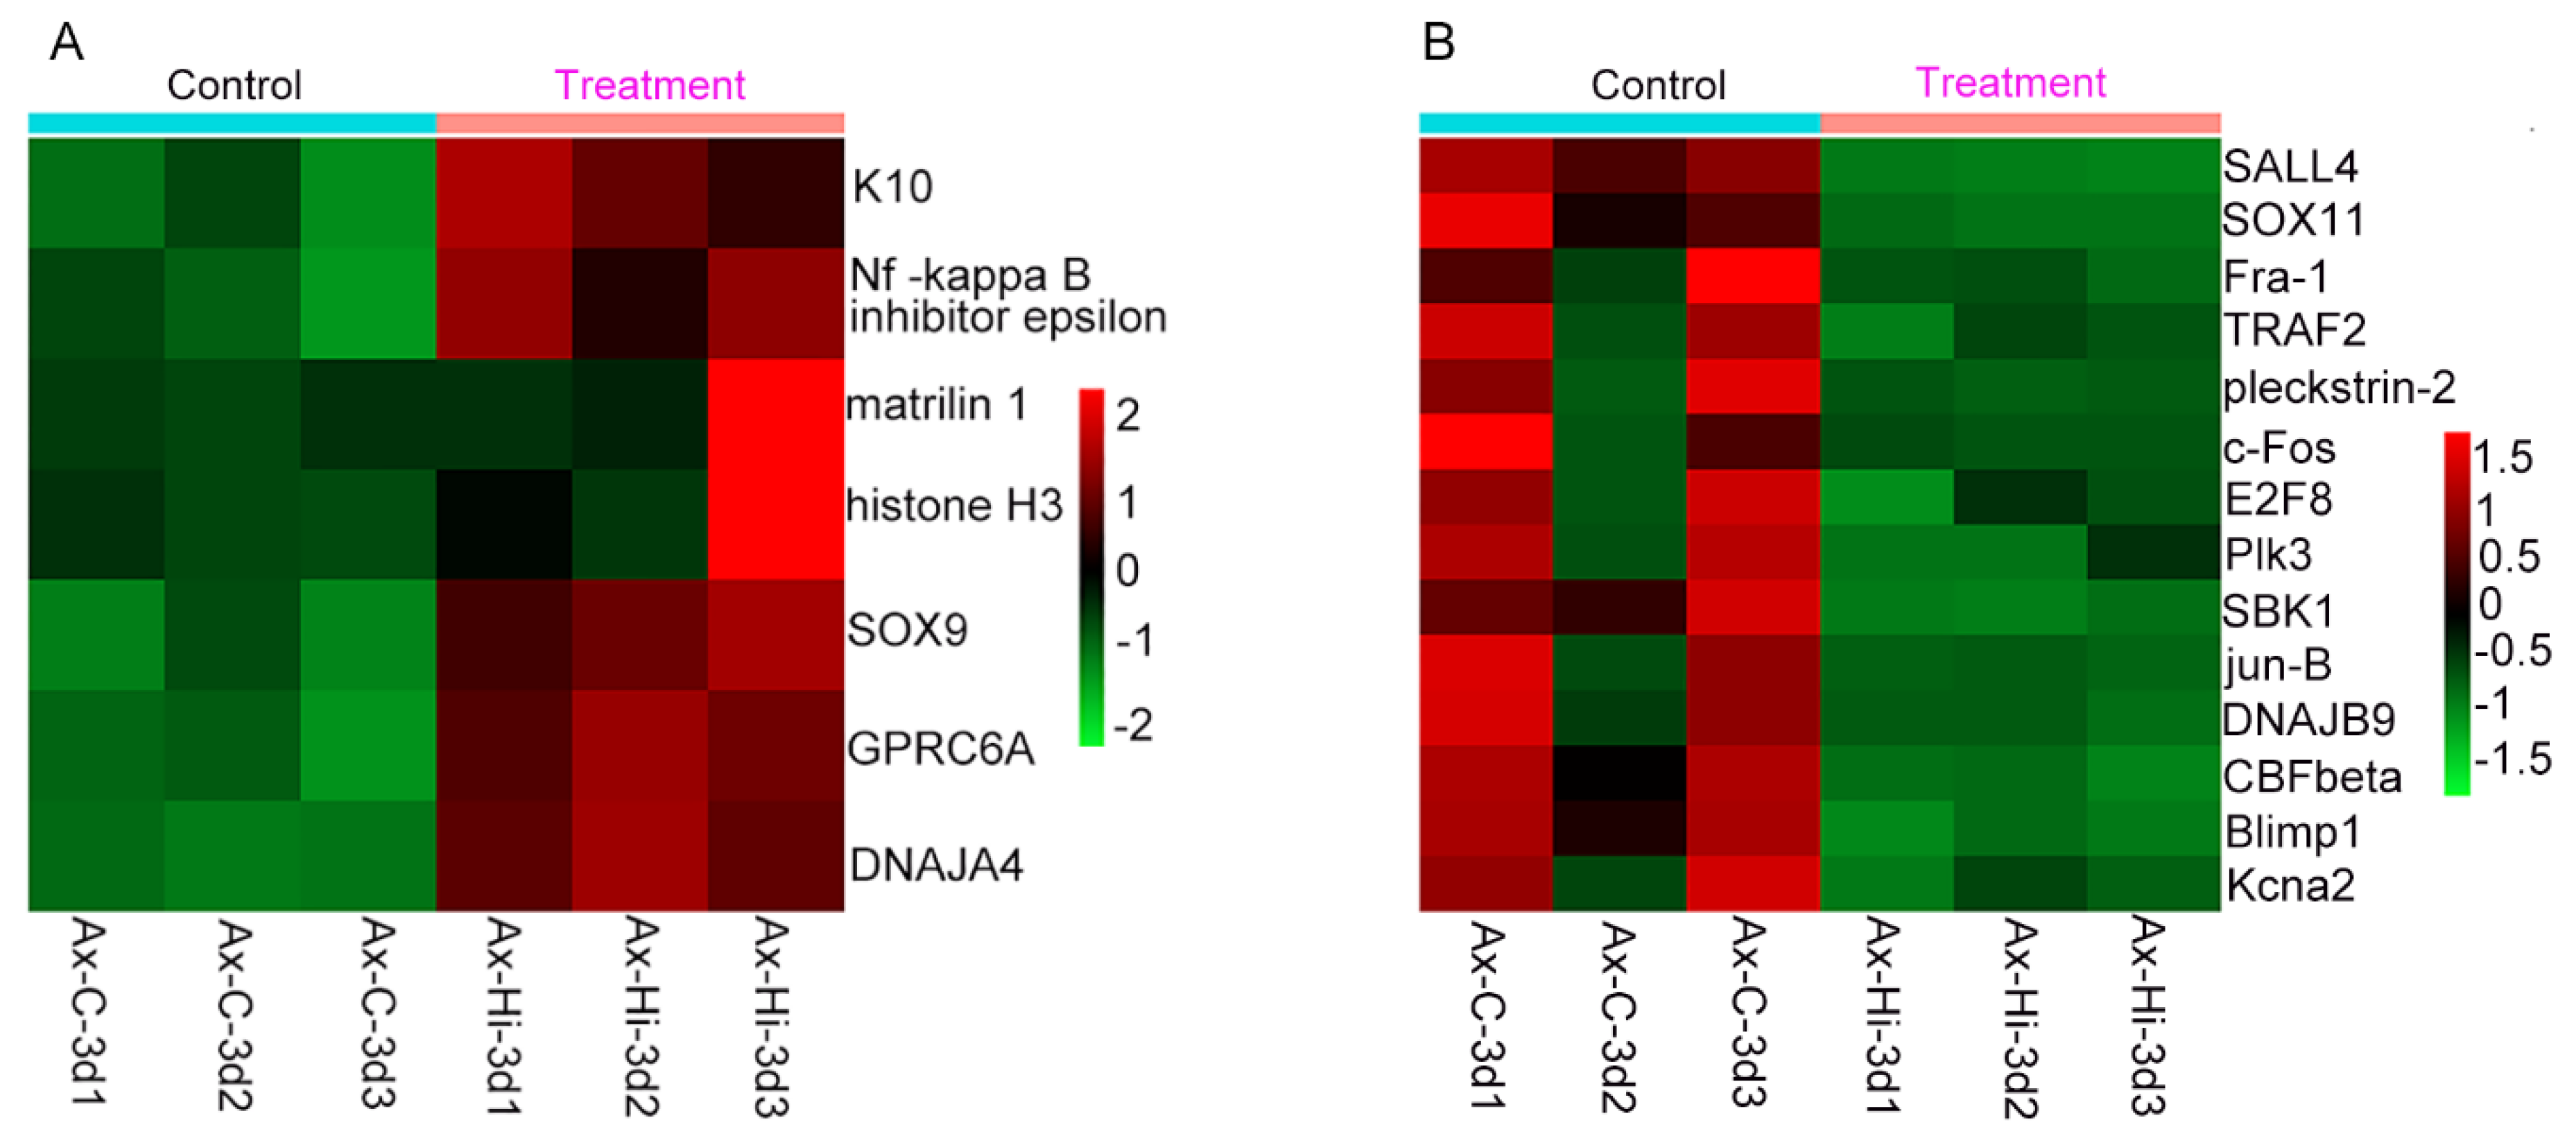
Figure 7.
Expression patterns of Hsp90α during tail fin regeneration of zebrafish. (A-G) Whole-mount in situ hybridization analysis of Hsp90α expression in tail fin regeneration at different stages (using antisense probes). (H) Control (using sense probes). All panels show tail fin regenerate with distal part at the top. Blue or purple indicates the positive staining indicated by arrows. Scale bar represents 1000 μm.
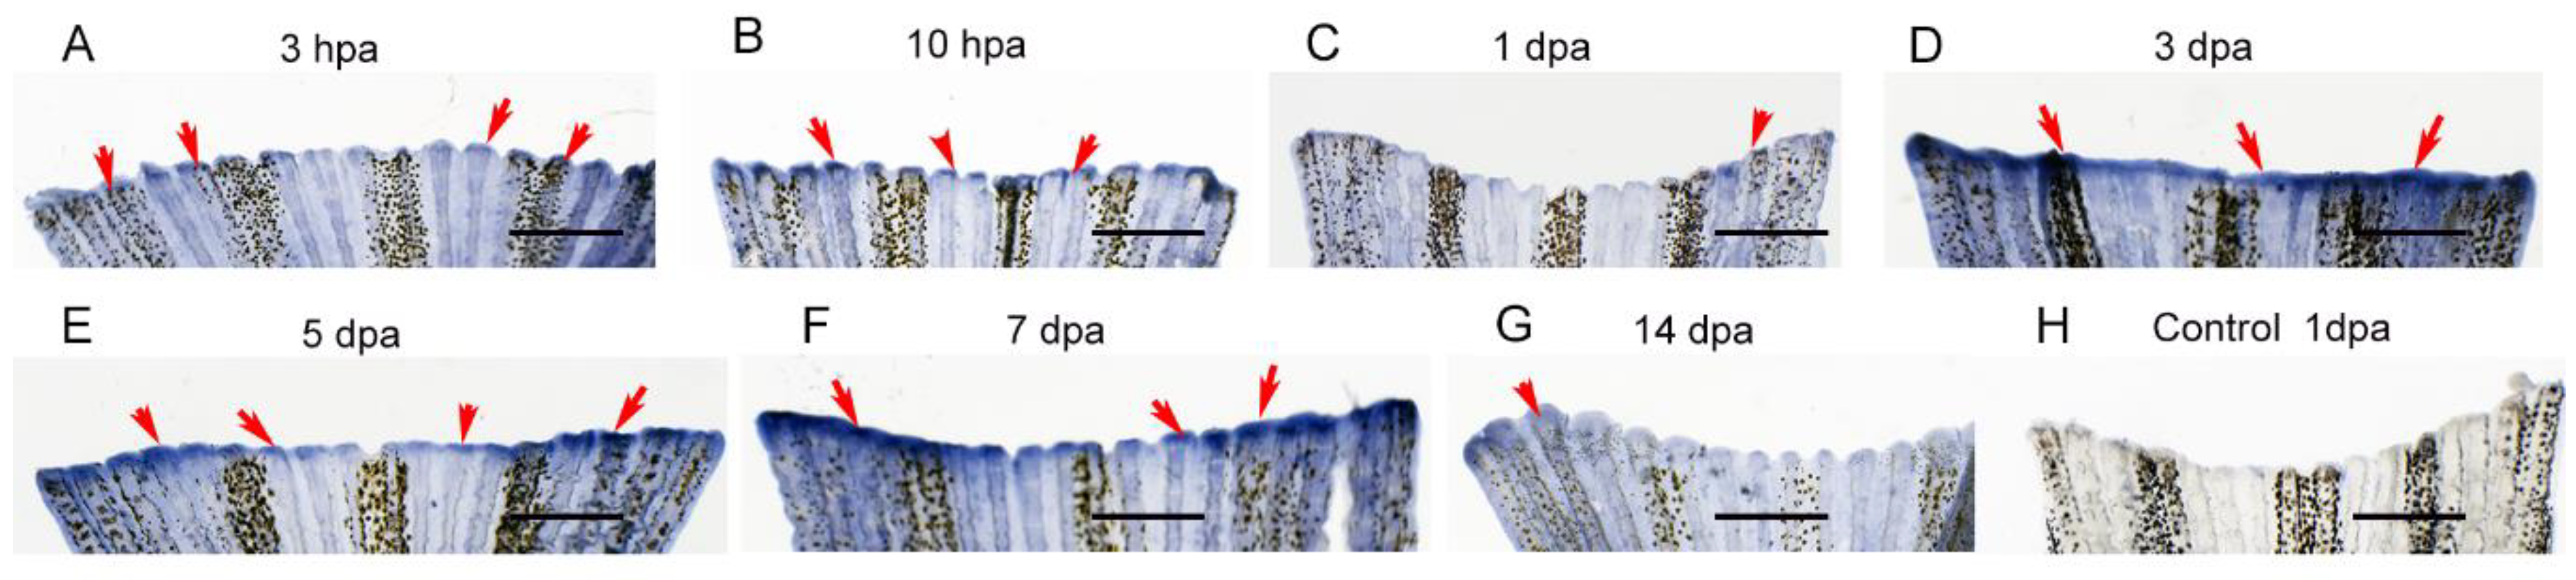
Figure 8.
Inhibition of Hsp90 with geldanamycin impaired tail fin regeneration. (A) Tail fin regeneration process (control group, without treatment with geldanamycin following surgical amputation). (B) Tail fin regeneration process (treatment with geldanamycin from immediate amputation to 19 dpa). (C) Tail fin regeneration process (treatment with geldanamycin from immediate amputation to 3 dpa). Dashed lines show amputation plane.
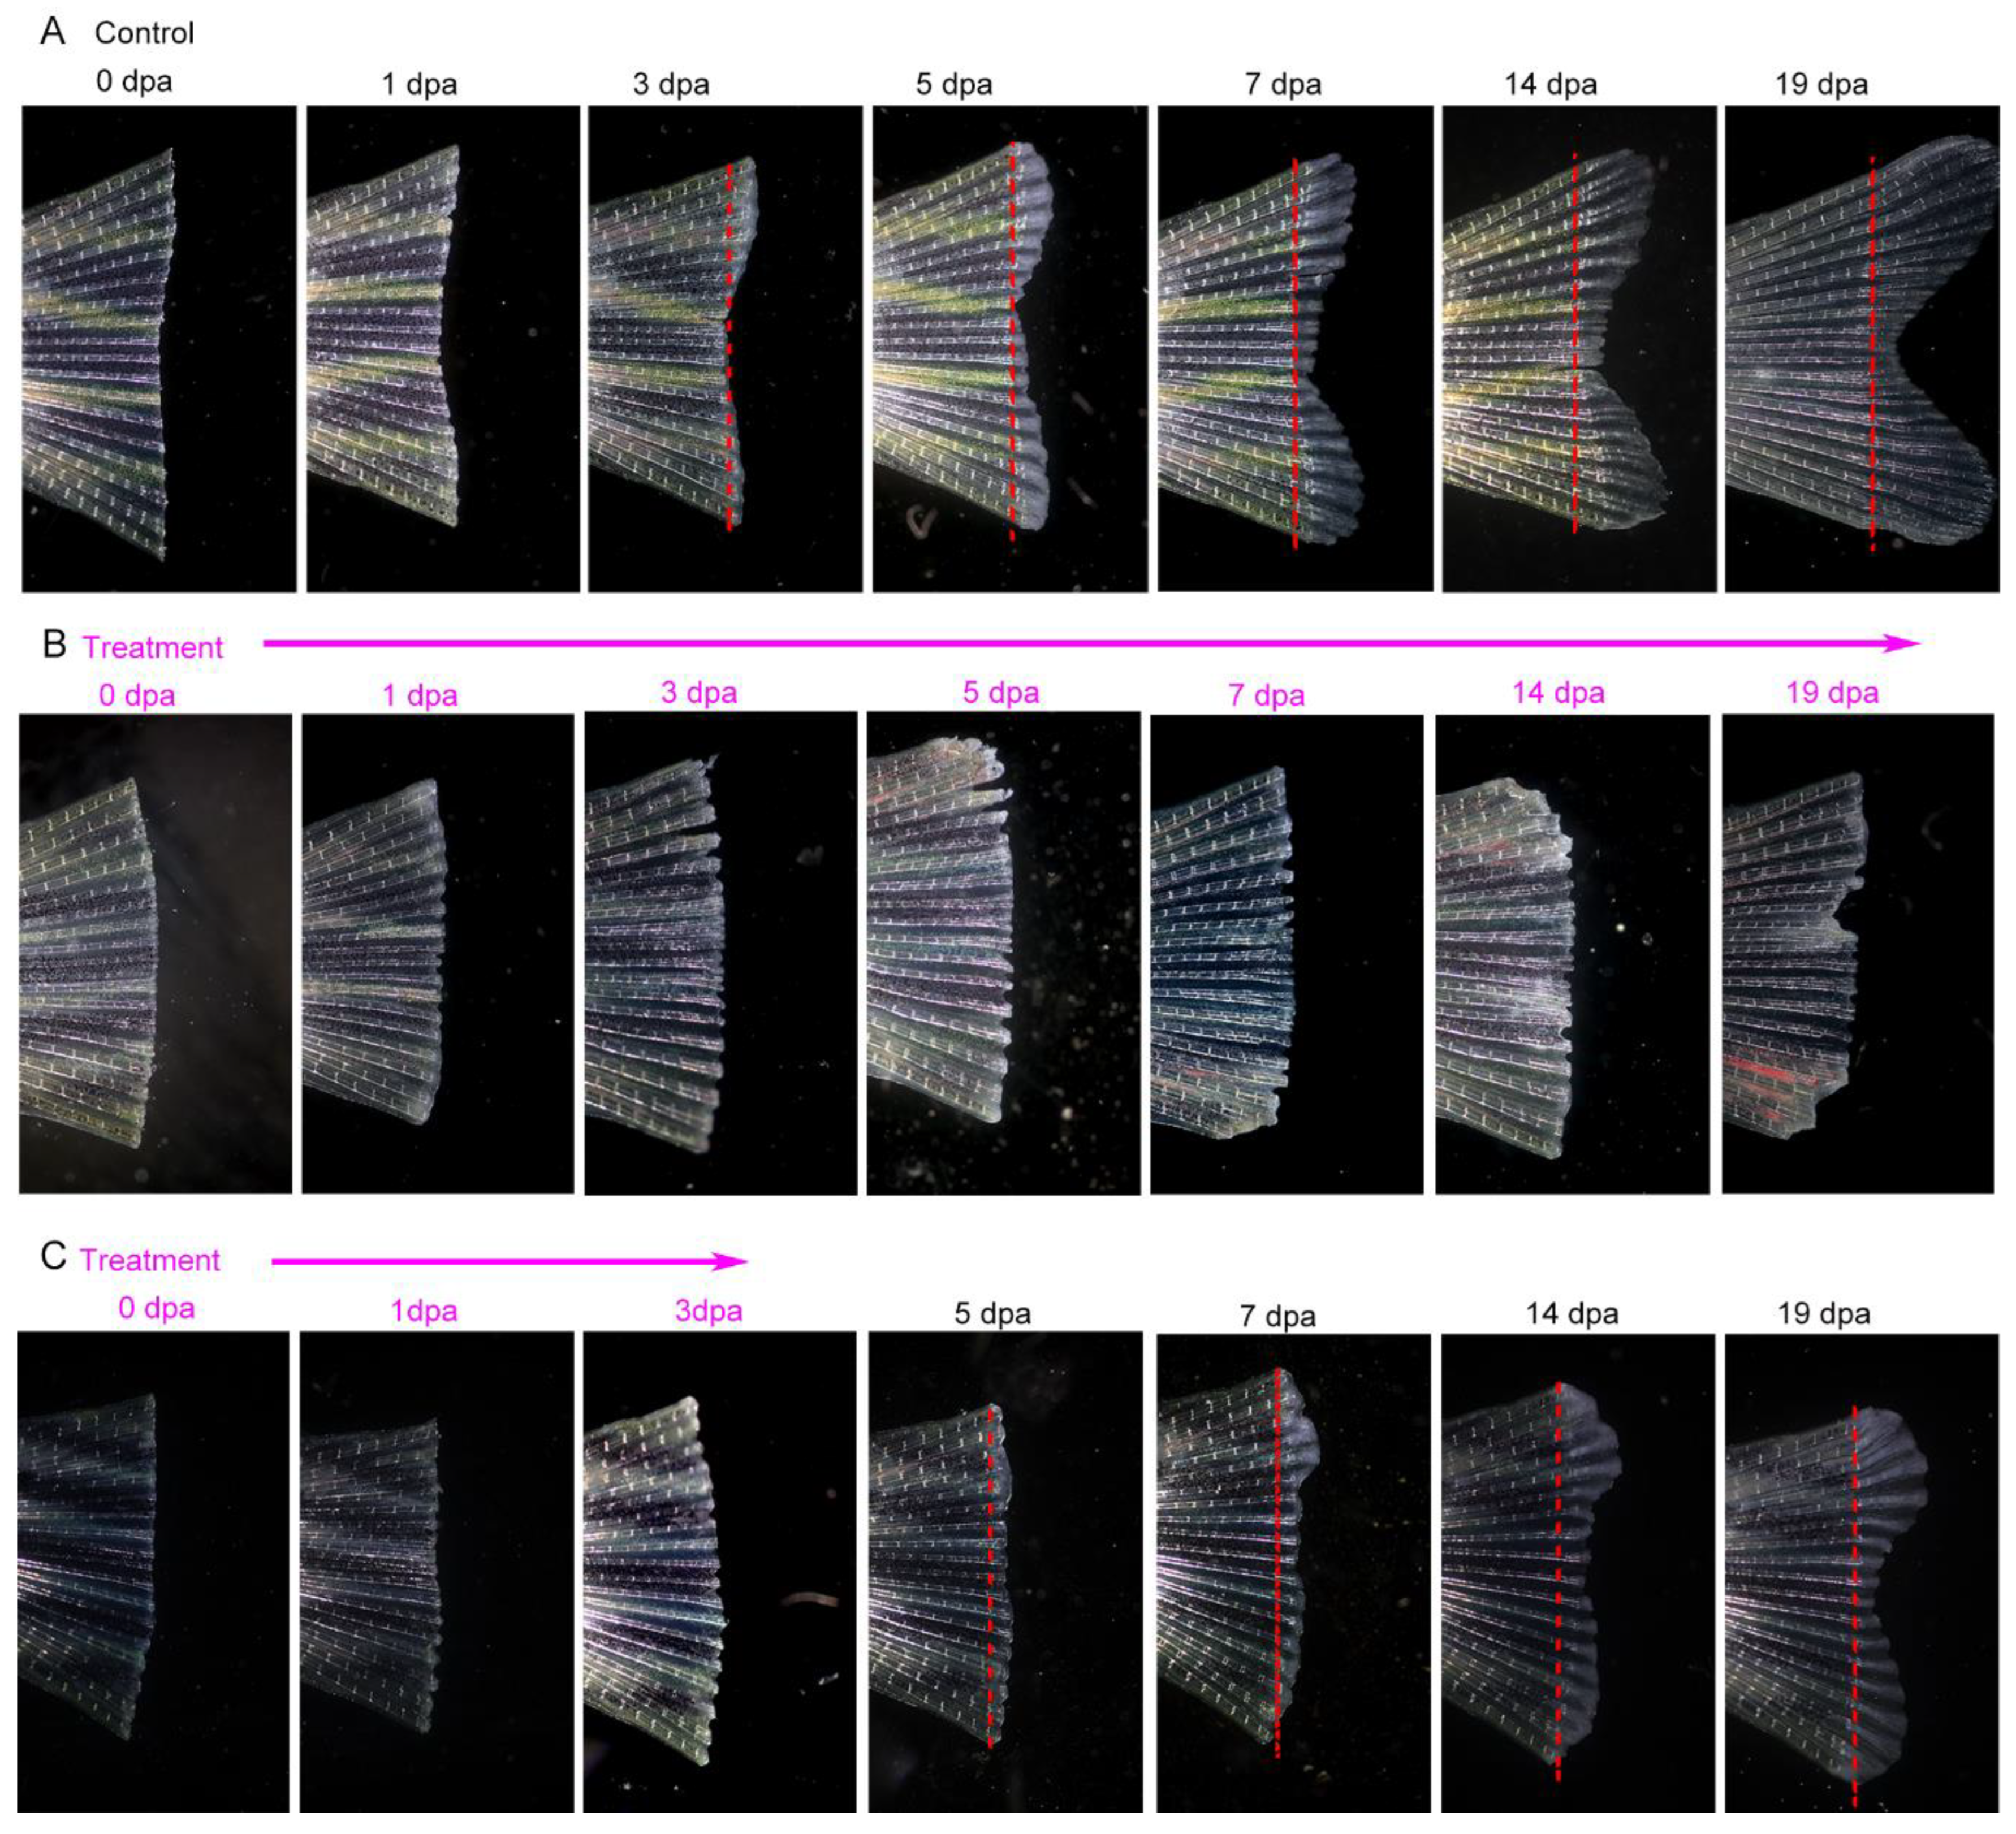
Figure 9.
Expression levels of transcription factor genes of DEGs in tail fin regenerates treated with geldanamycin, compared to control group (without treatment with geldanamycin). (A) Heatmap showing the levels of the upregulated genes. (B) Heatmap showing the levels of downregulated genes. Z-Hi-3d represents tail fins regenerated at 3 dpa treated with geldanamycin, and Z-C-3d represents the control group.
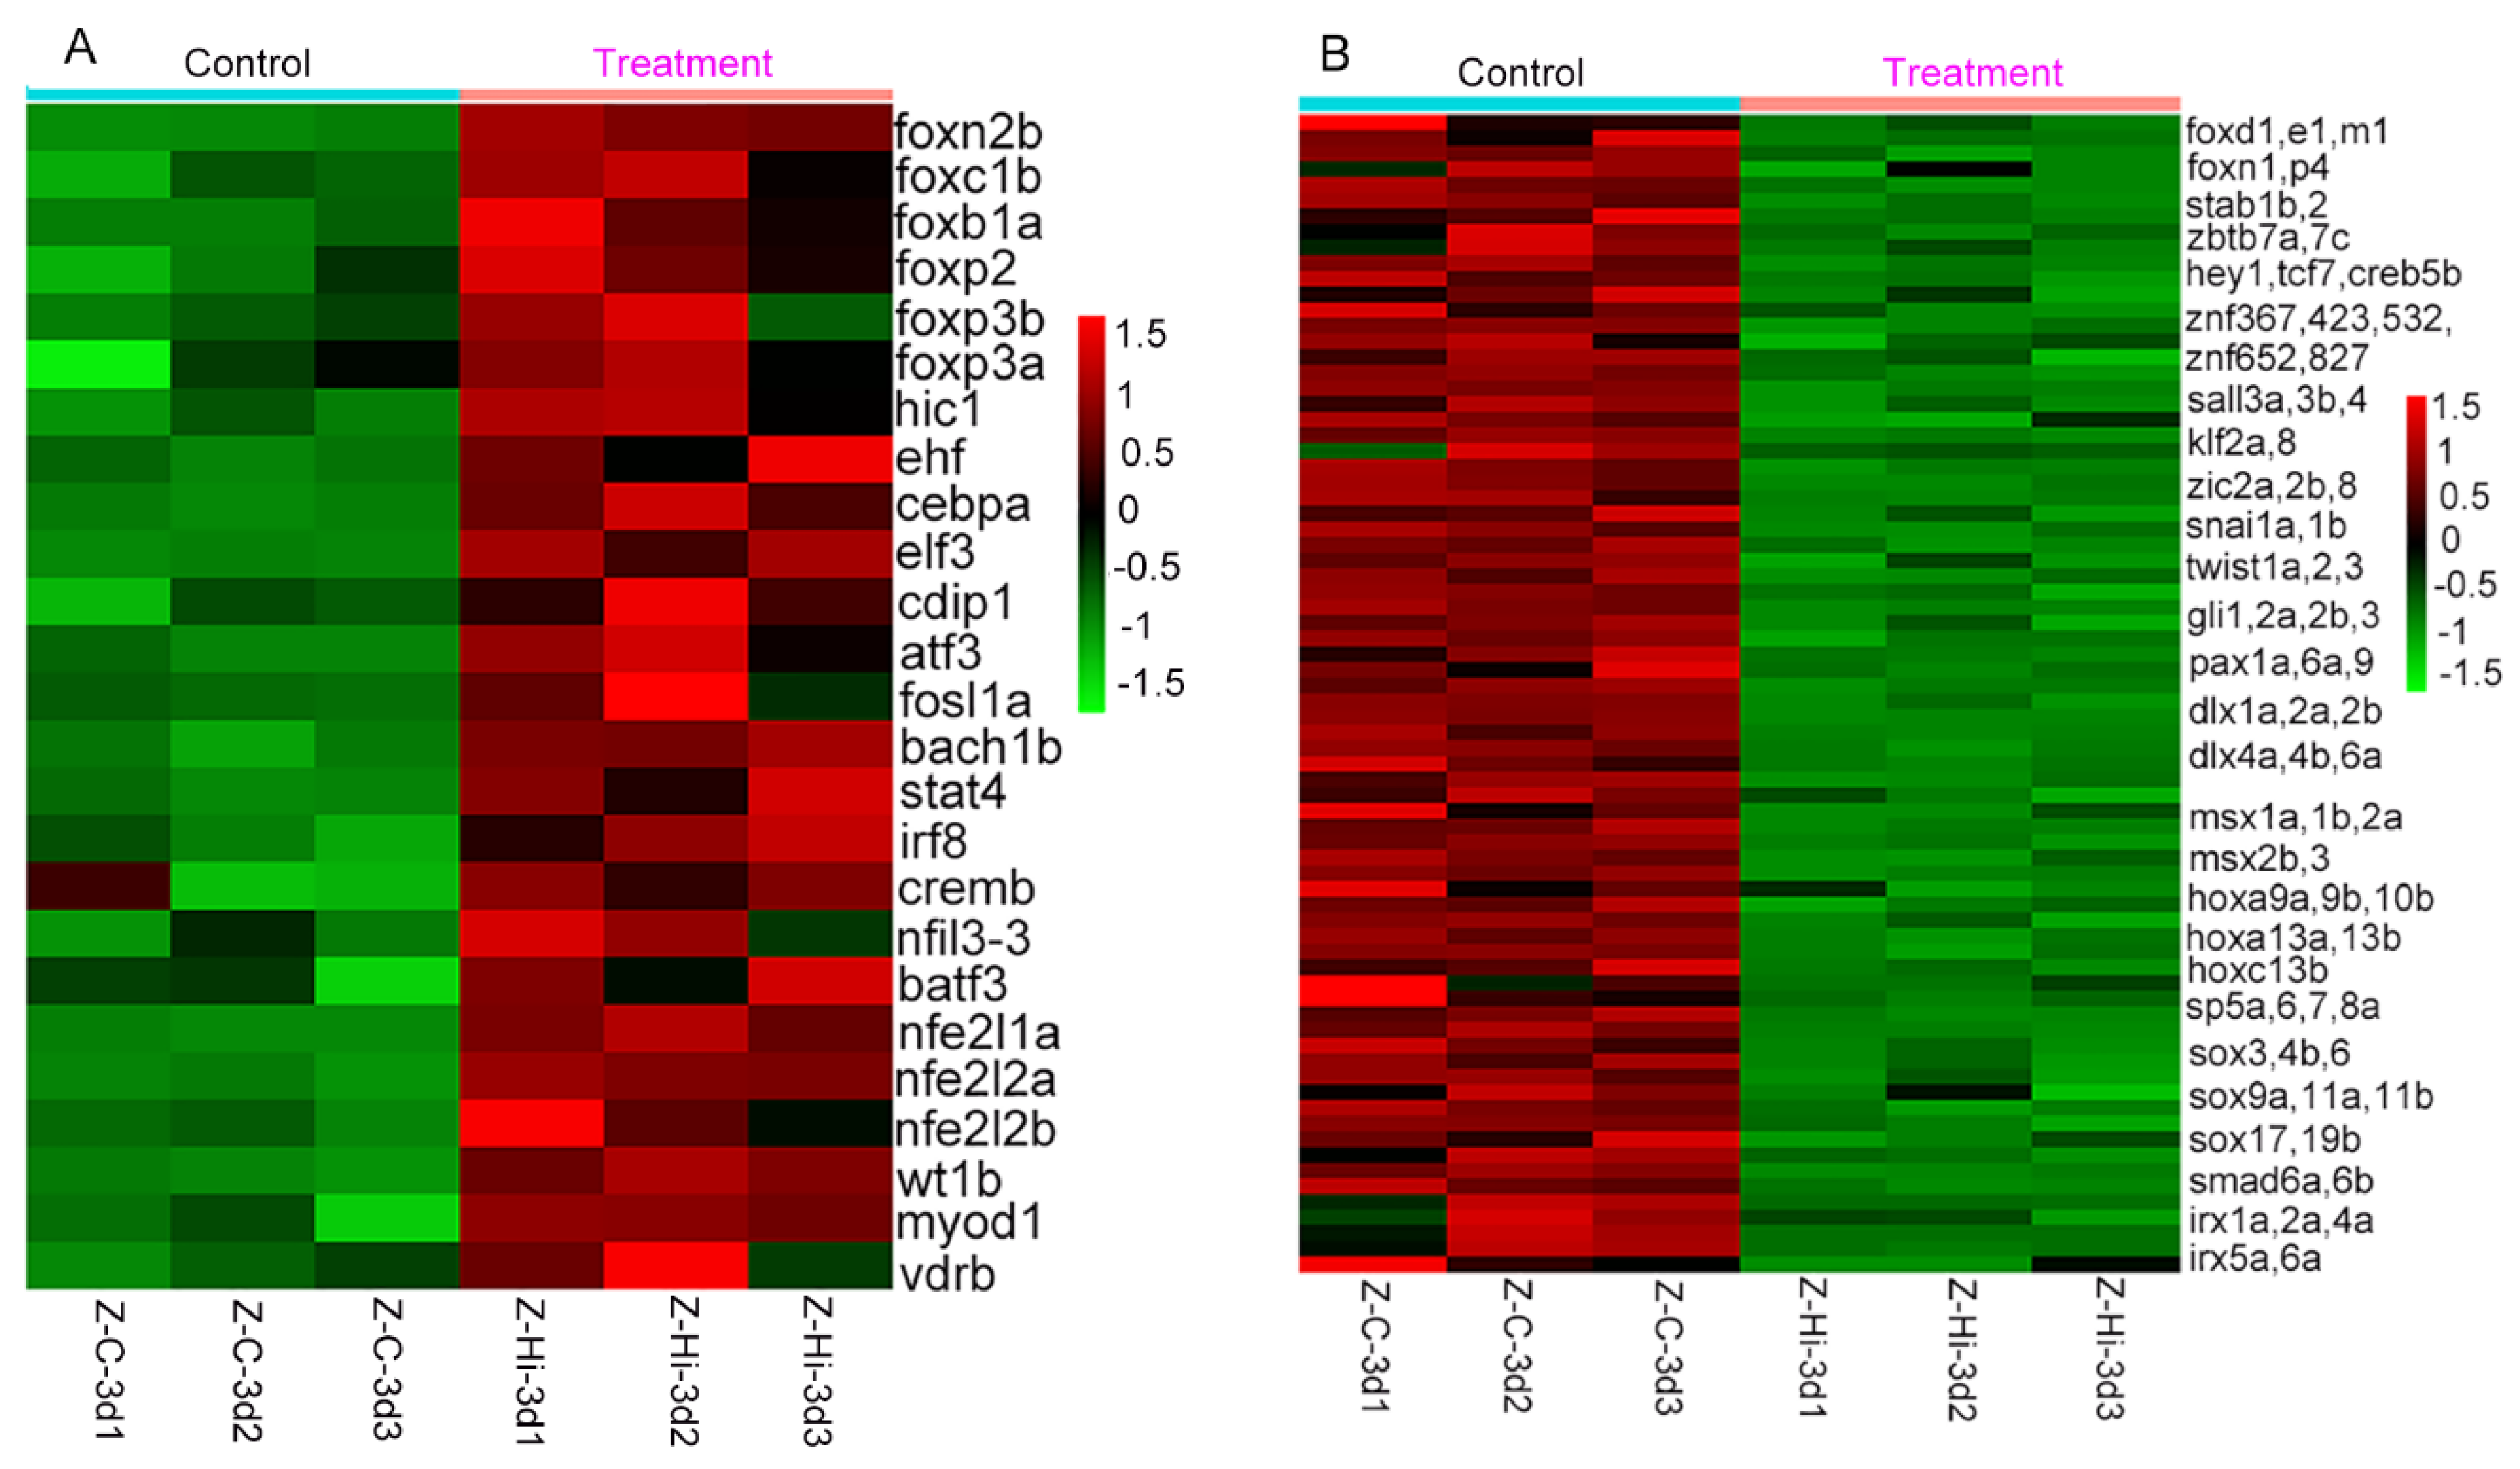
Figure 10.
Expression patterns of Hsp90α and the inhibition of Hsp90 during the tail regeneration of amphioxus. (A-E) Whole-mount in situ hybridization analysis of Hsp90α expression in tail fin regenerates at different stages. All panels show tail regeneration with distal part at the top. Blue or purple indicates the positive staining indicated by arrows. (F and G) inhibition of Hsp90 with geldanamycin impaired tail regeneration. (F), Tail regeneration process (control group); (G), Tail regeneration process (treatment with geldanamycin). Dashed lines show amputation plane. The scale bar represents 1000 μm.
Disclaimer/Publisher’s Note: The statements, opinions and data contained in all publications are solely those of the individual author(s) and contributor(s) and not of MDPI and/or the editor(s). MDPI and/or the editor(s) disclaim responsibility for any injury to people or property resulting from any ideas, methods, instructions or products referred to in the content. |
© 2024 by the authors. Licensee MDPI, Basel, Switzerland. This article is an open access article distributed under the terms and conditions of the Creative Commons Attribution (CC BY) license (http://creativecommons.org/licenses/by/4.0/).
Copyright: This open access article is published under a Creative Commons CC BY 4.0 license, which permit the free download, distribution, and reuse, provided that the author and preprint are cited in any reuse.


