
Submitted:
06 December 2024
Posted:
09 December 2024
You are already at the latest version
Abstract
Brain tumors are relatively rare, but the incidence of malignancy is very high among all cancers because of their abnormal growth and proliferation. Brain tumors are characterized by an uncontrollable growth of cells in the brain, so proper classification is required for effective treatment and prognosis. Magnetic Resonance Imaging is one of those essential tools for the detection of brain tumors. This paper proposes a novel brain tumor classification model based on Image preprocessing, feature extraction and machine learning techniques with their comparative analysis. This research explores Random Forests, Linear Discriminant Analysis, XGBoost, AdaBoost, and Neural Networks machine learning algorithms with various feature extraction methods like PCA—Principal Component Analysis, HOG—Histogram of Oriented Gradients, and LBP—Local Binary Patterns, for increasing the accuracy of tumor classification from MRI. Respectively, accurate classification models will help healthcare providers deliver effective care. Initially images of different sizes are resized to equivalent size, preprocessed with CLAHE. Then the features are extracted from enhanced images which are passed to various machine learning algorithms to classify the brain tumor. We achieved an accuracy of 99.3% with random forest. This study highlights the significance of feature selection and model tuning in order to maximize classification performance. Still, the problem of brain tumor detection is considered complex because of so many variations in data. Further optimization and experimentation are required to improve the algorithm in real-world brain tumor classification applications
Keywords:
Image Preprocessing
; Machine Learning
; Brain Tumors
; Brain Cancer
; Brain Tumor classification
; Feature Extraction
; magnetic resonance imaging
; Comparative analysis
1. Introduction
The brain is a complex organ with billions of nerve cells that controls the nervous system. Any illness that affects this organ therefore has the potential to be harmful to human health. The most dangerous of these ailments are brain tumor. An error in cell division can happen at any time and lead to the development of a brain tumors. After five years and ten years, the survival rates for patients with brain tumors were 36% and 31%, respectively. Brain cancer, a highly destructive and potentially disease, continues to pose significant challenges to the global healthcare community. Brain tumors are distinguished by their high morbidity and mortality rates due to their specific location and tendency to grow invasively in the surrounding area. Most neoplastic brain lesions are metastases arising from cancers outside the central nervous system (which are 5–10-times more common than primary brain tumours) [1].
In 2023, it is expected that approximately 24,810 adults (14,280 men and 10,530 women) in the USA will be detected with primary cancerous tumors affecting the brain and spinal cord. Brain tumors include 85% to 90% of all primary central nervous system (CNS) tumors. It is estimated that 5,230 children under the age of 20 will also be diagnosed with a CNS tumor in the United States in 2023[2].
A tumor is an abnormal and uncontrollable growth of cells in an organ. A brain tumor is an abnormal mass of tissue, which growth the cells within the brain tissue and start causing problems to allow the brain to continue functioning normally. Benign tumors, grades 1 and 2, or malignant, grades 3 and 4. Malignant tumors are also rated according to scaling aggression. Thus, the least aggressive tumors are minimally aggressive and the most aggressive high. Among the histological criteria that can give an exact definition of the grade of the tumor include not only vascularity and invasiveness but also the rate of tumor growth. When a tumor progresses into a higher stage, the patient’s survival and treatment prognosis decreases drastically. Therefore, brain tumor diagnosis and early treatment will certainly improve the patient’s survival chances [3].
In clinical practice, the most widespread primary brain tumors include meningioma, glioma, and pituitary tumors, as illustrated in Figure 1 and detailed in [4]. Meningioma normally begins from the meninges tissues comprising the brain or spinal cord, expressing as a benign growth in the protective membranes. Conversely, glioma, the fatal brain tumor, come from glial cells that support neurons, comprising about one-third of all brain tumor cases [6]. Pituitary tumors, which are benign, form within the pituitary gland [7]. Accurate diagnosis is pivotal for prognosis and treatment decisions, yet traditional biopsy approaches are oppressed with drawbacks such as pain, time consumption, and sampling inaccuracies [8,9]. Additionally, histopathological grading faces encounters like intra-tumor heterogeneity and variations in expert assessments [10], complicating the diagnostic process further. These characteristics pose significant challenges in the diagnosis and management of brain tumors.
So, magnetic resonance imaging (MRI) plays a crucial role in this method, offering higher soft tissue contrast and multi-planar imaging capabilities. MRI allows accurate visualization of tumor location, size, and characteristics, aiding in surgical planning, radiation therapy, and treatment monitoring [11]. Moreover, MRI can distinguish between various tumor types based on their distinct imaging features, guiding treatment selection and predicting patient outcomes. Images obtained from MRI are employed to obtain comprehensive information about internal brain tissues. During the process of brain tumor investigation, detection of the tumor core location is the key task to determine the size and shape of the brain tumor [12].
However, despite MRI's capabilities, challenges persist in brain tumor detection. Accurately segmenting and classifying brain tumors remains a difficult task despite numerous significant efforts and positive advancements. The challenges arise due to the variations in tumor size, shape, and location, making the diagnosis of brain tumors particularly complex. Consequently, manual identification of brain tumors is often time-consuming, prone to errors, and highly challenging. Tumor can display diverse morphological and textural characteristics, making it challenging to differentiate them from healthy brain tissue or other pathologies. Furthermore, small or subtle tumors may avoid detection on conventional MRI scans, leading to delayed diagnosis and potentially minor outcomes for patients. Furthermore, human MRI image analysis is time-consuming and prone to significant error due to the large number of patients. Therefore, there is a pressing need for more accurate and efficient methods for brain tumor detection using MRI [13] and [14].
Machine learning techniques offer promising opportunities to enhance the accuracy and efficiency of brain tumor detection in MRI scans [15]. By leveraging computational algorithms, machine learning can extract complex patterns and relationships from large volumes of imaging data, facilitating the automated explanation and detection of subtle abnormalities [16,17].These techniques can be trained on annotated MRI datasets to identify characteristic features revealing brain tumors, such as shape, intensity, texture, and spatial location. Machine learning models can help with early detection and diagnosis by identifying regions of interest that may indicate the presence of a tumor through the analysis of these features [18] and [19].
Moreover, machine learning techniques can be integrated with a variety of imaging modalities, such as T1-weighted, T2-weighted, and contrast-enhanced MRI sequences. By compiling information from multiple imaging modalities, these models can improve diagnostic accuracy and provide more comprehensive insights into the morphology and biology of tumors [20,21,22]. Additionally, radiologists can read MRI images more quickly by using machine learning-based techniques that rank suspicious regions for review. In the end, this can enhance patient outcomes by cutting down on diagnostic errors and interpreting times [23].
Overall, the integration of machine learning techniques into brain tumors detection workflows holds immense potential to revolutionize clinical practice by enhancing diagnostic accuracy, enabling early tumors detection, and ultimately improving patient care [24,25].
The following are this study's main contributions:
- Pre-processing the MRI Images using Contrast Limited Adaptive Histogram Equalization (CLAHE).
- features are extracted using Histograms of Oriented Gradients (HOGs), Local Binary Patterns (LBPs) and Principal Component Analysis (PCA).
- To classify the brain tumor into tumor and non tumor, Five machine learning techniques (Random Forests, Linear discriminant analysis (LDA), XGBoost, AdaBoost, Neural Network) are implemented.
- The comparison of implemented machine learning techniques is performed using accuracy, sensitivity, specificity, and precision.
- The impact of different feature extraction methods on different metrics was also studied.
The organization of the study is such that Section 2 gives related work and a problem statement, Section 3 describes the proposed research methodology, Section 4 illustrates modeling, Section 5 shows the results of the experiment and discussion. Section 6 gives a conclusion of the research with future works to be done.
2. Related Work
Ali et al. [26] developed a hybrid method combining pre-trained deep learning CNN models with supervised machine learning classifiers to improve brain tumor classification. They used MRI scans of four types of brain tumors: glioma, meningioma, pituitary, and no tumor. The CNN models GoogleNet, ShuffleNet, and NasNet-Mobile were employed to extract features from these images. These extracted features were then classified using k-Nearest Neighbor (KNN), Support Vector Machine (SVM), and Linear Discriminant Analysis (LDA). Among these combinations, ShuffleNet with SVM achieved the highest performance, with an accuracy of 98.40%, precision of 97%, and recall of 96.75%.
Tseng et al. [27] presented an optimized approach for brain tumor identification using the Xtreme Gradient Boosting (XGBoost) method, enhanced by image processing and feature selection techniques. All the input images are processed through the CLAHE method. Image segmentation is performed using the K-Means algorithm to accentuate regions of interest. Particle Swarm Optimization is sought for feature selection related to the most relevance. Finally, the data is classified through XGBoost, Naive Bayes, and the ID3 algorithm. It has been obtained that the proposed model PSO-XGBoost obtains 97% accuracy, 97% specificity, 98% precision, and 98% recall.
Zello et al. [28] developed a plain ML model aimed at distinguishing cancer types based on genetic lesions. Dataset downloaded from TCGA having 9,927 samples spanning 32 different cancer. On a dataset comprising the ten most common tumor types, the XGBoost classifier performed the best (BACC 77%; AUC 97%).
Elazab et al. [29] introduces a hybrid deep learning model for visualizing and grading gliomas, which are primary brain tumors caused by glial cells. Accurate classification and grading of gliomas are crucial for prognosis and treatment planning. The proposed technique combines YOLOv5 and ResNet50 to improve tumor localization and feature extraction from histopathology images. YOLOv5 localizes and classifies tumors in large whole slide images (WSIs), while ResNet50 is integrated into YOLOv5 for enhanced feature extraction and stable training dynamics. The hybrid model is tested using the Cancer Genome Atlas dataset and shows superior performance compared to standard methods, achieving 97.2% accuracy, 97.8% precision, 98.6% sensitivity, and a Dice similarity coefficient of 97%.
Rajkumar et al. [30] developed an optimized Eagle Adaboost Mechanism (OEAM) for efficiently tracking the tumor region. Post-tumor identification, segmentation is done, and the predicted tumor type and stages of severity are classified using Eagle Fitness. The approach is validated in an environment from MATLAB and achieved 99% accuracy in segmenting the region of some types of tumors.
The study [31] developed a mixed deep and machine learning computer-aided diagnostic system for early detection of brain tumors. They used classification with AlexNet and ResNet-18 using the SVM, The hybrid AlexNet + SVM achieved 95.10% accuracy, 95.25% sensitivity, and 98.50% specificity. The system could potentially aid a doctor in correctly diagnosing their patient, ultimately bringing an improvement in the survival rate of patients suffering from brain tumors.
Ravinder et al. [32] introduced model that combines CNN and GNN to improve brain tumor detection and classification using dataset from kaggle. The model addresses the limitations of traditional methods that overlook non-Euclidean distances and pixel proximity in image data. By employing a GCNN, the model effectively considers these distances, enhancing its ability to detect and classify brain tumors (Meningioma, Pituitary, or Glioma). These graphs are processed by a 26-layer CNN equipped with Batch Normalization and Dropout layers for improved stability and generalization. Among all proposed networks, Net-2 achieved the highest accuracy of 95.01%. This innovative model represents a significant advancement in brain tumor detection, offering a robust alternative for clinical diagnostics.
The BT Classification Model based on CNN (BCM-CNN) was created by ZainEldin et al. [33]. It uses an adaptive dynamic sine-cosine fitness grey wolf optimizer (ADSCFGWO) algorithm to improve CNN hyper parameters. The model optimizes hyperparameters and employs the Inception-ResnetV2 architecture for training. This pre-trained model is used to improve brain tumor diagnosis, producing binary outputs (0 for Normal, 1 for Tumor). Hyperparameters are categorized into those determining the network structure and those for training the network. The ADSCFGWO algorithm combines the strengths of sine cosine and grey wolf algorithms in an adaptive framework. Experimental results demonstrate that the BCM-CNN classifier, with optimized hyperparameters, achieves superior performance. Specifically, the model attained a remarkable accuracy of 99.98% on the BRaTS 2021 Task 1 dataset, highlighting its efficacy in brain tumor classification.
Shanthi et al. [34] suggested the use of an automated, optimized hybrid deep neural network (OHDNN) that consists of two primary stages: classification and pre-processing, for the identification of brain tumors. Initially, the images are gathered and pre-processed through image enhancement and noise removal. These pre-processed images are then used in the classification phase, where the OHDNN, combining Convolutional Neural Networks (CNN) and Long Short-Term Memory (LSTM) networks, is employed. The CNN part generates feature maps, while the LSTM classifier handles the classification. To enhance the performance of the CNN-LSTM classifier, the Adaptive Rider Optimization (ARO) algorithm is used for random selection of classifier parameters. The model was tested on an MRI image dataset, achieving a maximum accuracy of 97.5%.
Amaliah et al. [35] used deep learning and optimization techniques on MRI brain images to identify tumor regions. The segmented images were then classified using the CNN algorithm. The CNN-MSO algorithm outperformed other optimization algorithms in terms of accuracy, sensitivity, and specificity, according to experimental results. The investigation [56] employed modified fuzzy C mean clustering (MFCM) and artificial neural networks (ANN) to segment and categorize brain tumor MR images. The proposed approach extracted shape, intensity, and texture features from the input image, which were optimally chosen using Hybrid Fruit Fly and Artificial Bee Colony (HFFABC). The classification performance exhibited sensitivity, specificity, and efficiency rates of 98.1%, 99.8%, and 99.59%, respectively.
Güler et al. [36] utilized various architectures like VGG, ResNet, DenseNet, and SqueezeNet that were trained for feature extraction from 7022 brain MRI images by dividing them into 60% for training and 40% for testing. Initially, machine learning methods were applied to classify extracted features, followed by an ensemble learning approach where ResNet achieved 100% accuracy.
Waleed et al. [37] utilized the identification and extraction of brain tumors from MRI scans based on MWT and image processing techniques. During the preprocessing phase, the MWT was used to improve and eliminate noise from the input image. Segmentation methods based on thresholding were employed, and statistical classification Methods were used to categorize brain MRI images as normal or abnormal
Srinivasa et al. [38] utilized MRI brain images to locate tumor regions using deep learning and optimization methods. After the images were segmented, the CNN algorithm was used to classify them. The CNN-MSO algorithm outperformed other optimization algorithms in terms of accuracy, sensitivity, and specificity, according to experimental results.
2.1. Problem Statement
Brain tumors had the ability to stimulate repercussions such as physical limitations, compelling patients to undergo rigorous therapy, often supplemented by considerable discomfort, to alleviate or mitigate resultant disabilities. Also, the antagonistic effects on brain function varied depending on tumor dimensions, location, and type. Pressure from tumors on regions governing bodily movement could result in immobility for patients. Earlier diagnosis had the potential to forestall the onset of disability. However, challenges existed in accurately classifying brain tumors due to their diverse sizes, shapes, and intensities, alongside similarities in outward appearance among various pathological types.
3. Proposed Methodology
This section offers a comprehensive discussion on the detection of MRI brain tumors using various ML approaches. The progression of the proposed method is illustrated in Figure 2. Initially, MRI brain tumor data are acquired and undergo pre-processing. Following this, features are extracted using three different methods, and all the extracted features are stored in a NumPy array. The data is then split into training and testing sets using the train_test_split method from the sklearn library. Various ML techniques, including Random Forest, Linear discriminant analysis, XGBoost, AdaBoost, Artificial Neural Network are employed to classify images into tumor and non-tumor categories.
3.1. Dataset Collection
Dataset to evaluate the performance of our proposed work is collected from Kaggle open data website. This dataset comprises 2,328 brain MRI images of patients with tumors and 1,595 images without tumors, totaling 3,923 images. As all of these images had unique dimensions, all the images are resized using cv2.resize() to a standardized dimension of 200x200 pixels. Figure 3(A) illustrates a portion of the dataset, highlighting the varying widths and heights of the images. Therefore, we resized the images. Figure 3(B) displays the scaled versions of the dataset's images.
3.2. Data Pre-Processing
In the medical field, image preprocessing is an extremely important step. Normally, during preprocessing noise reduction or enhancement is performed. This process is carried out using a variety of methods, including image scaling, cropping, median filter filtering, histogram equalization, and image adjustment. We have used StandardScaler for this job. It takes care of making sure all the features are standardized, so no one feature overpowers the others. This helps prevent problems related to overfitting [39].
Data labelling: Images showing a brain tumor are labeled 1, and images showing no brain tumor are labeled 0.
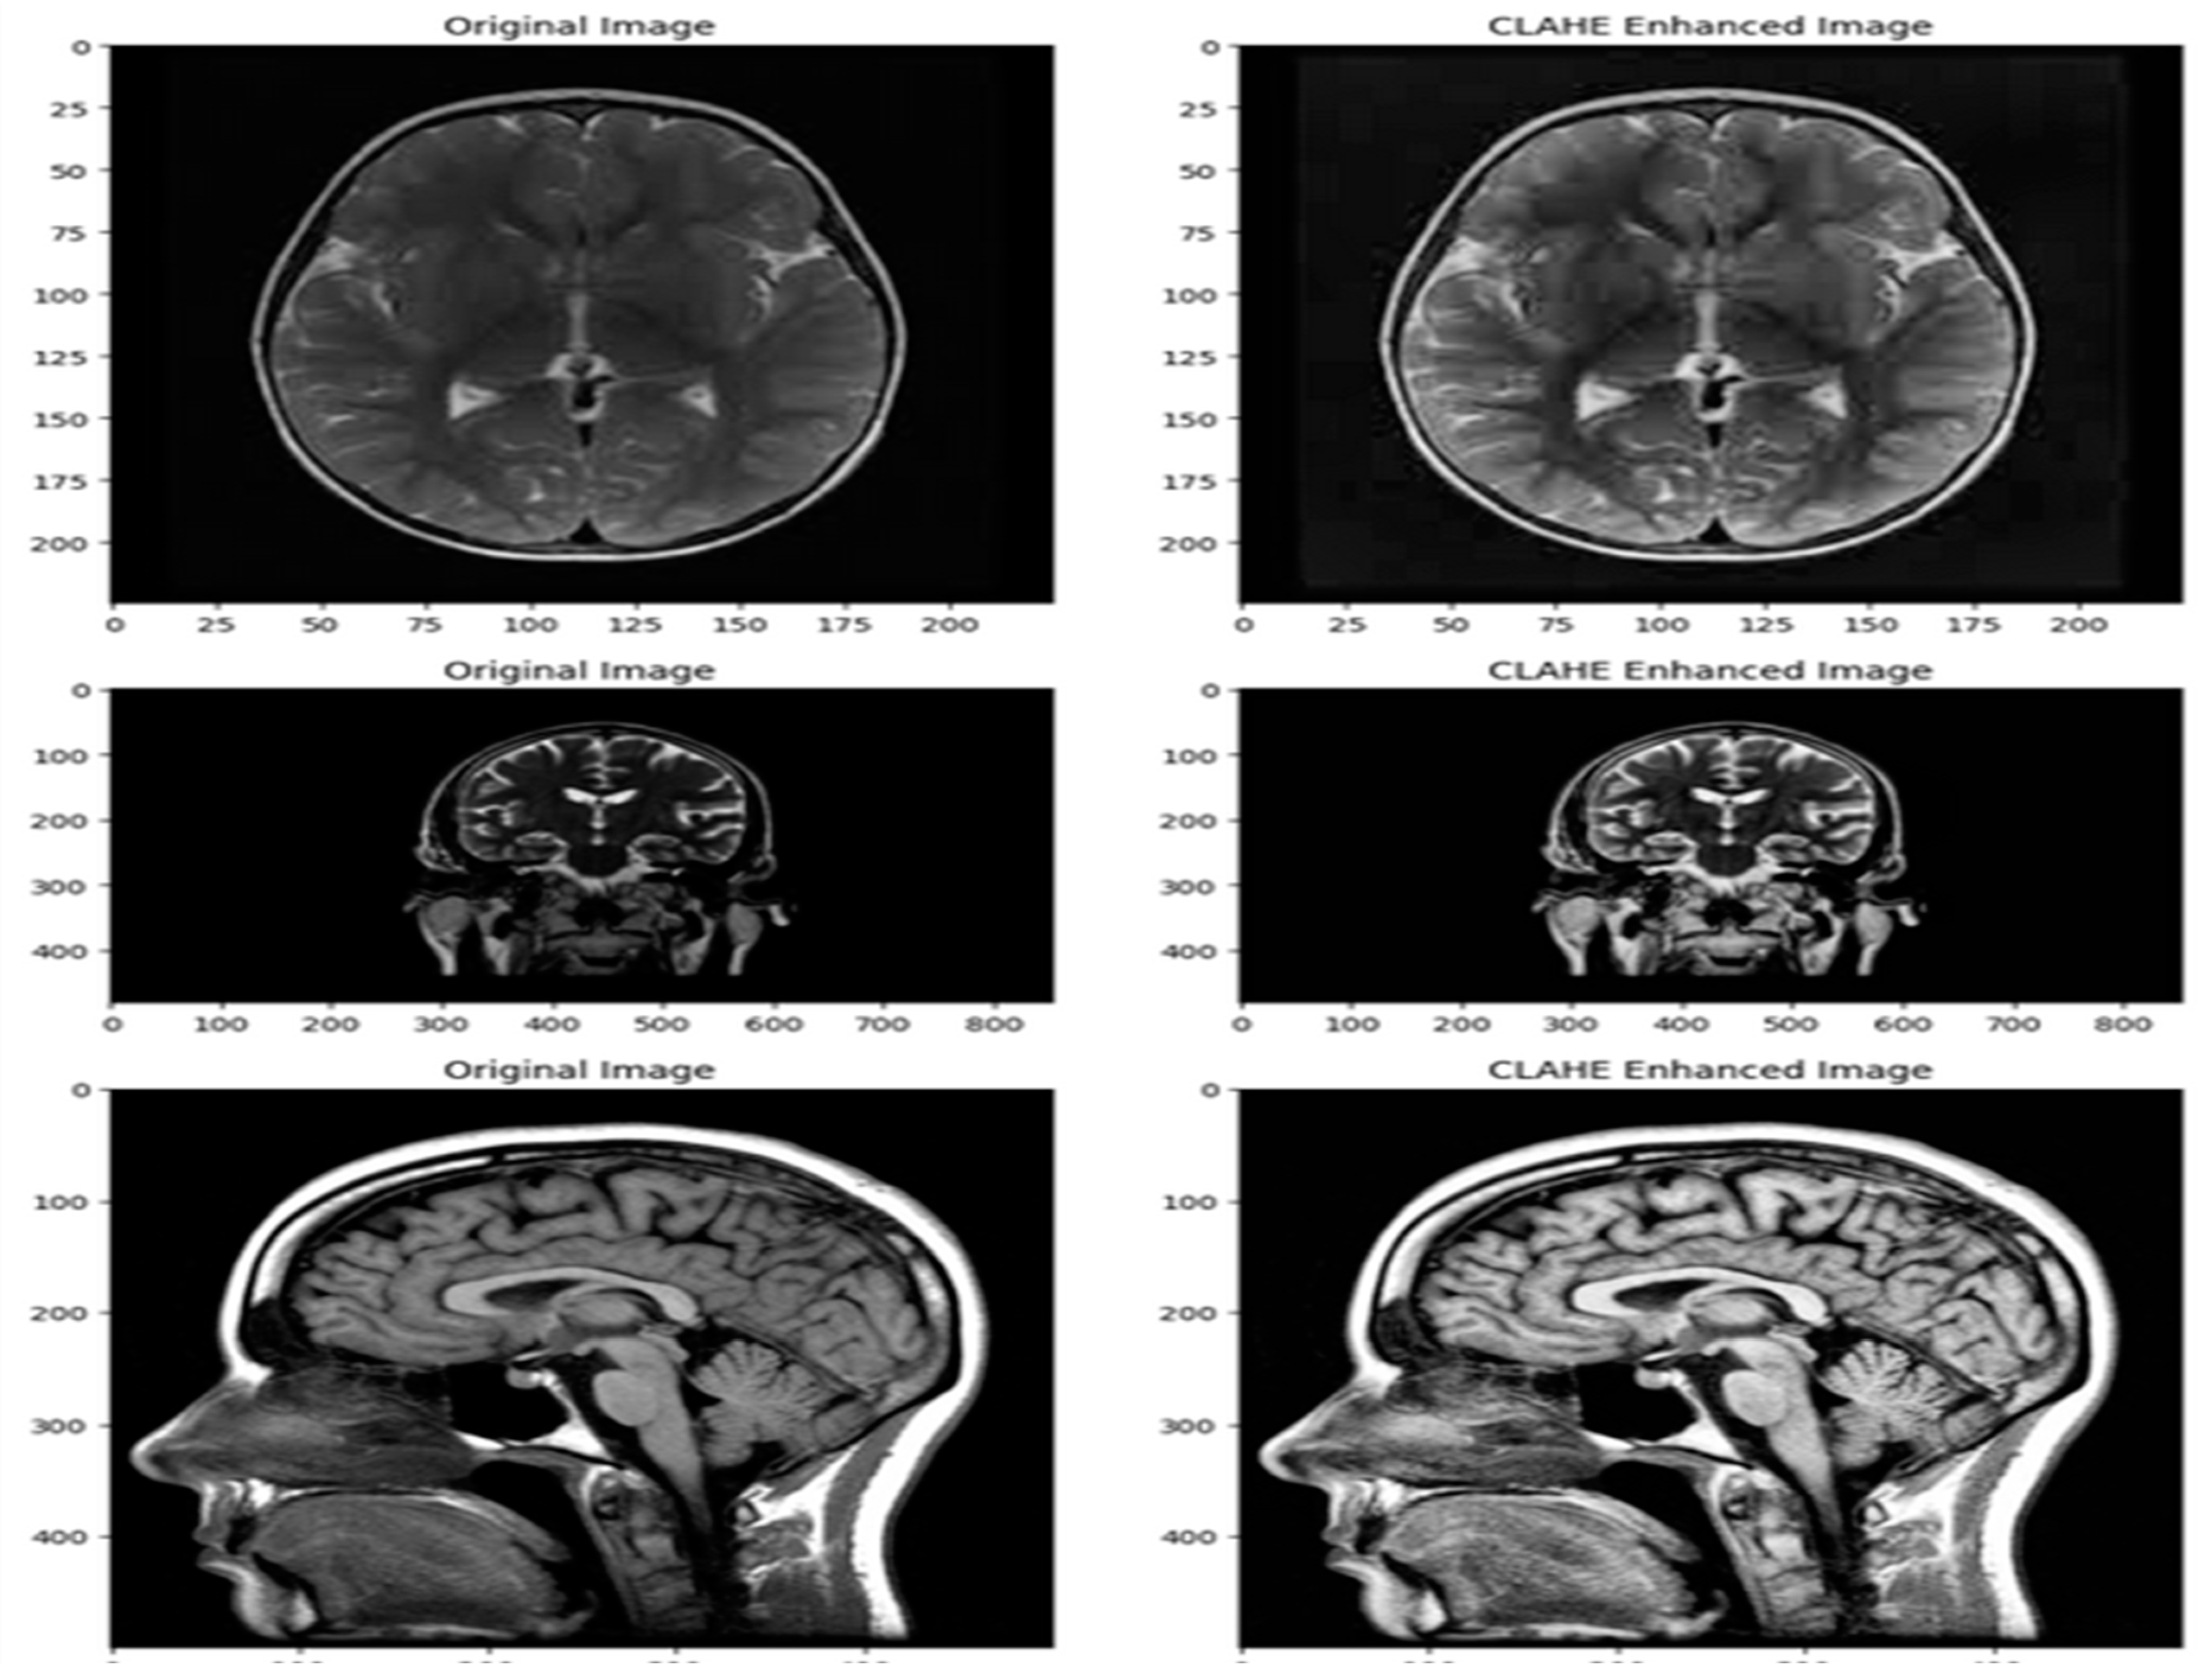
Image pre-processing: To enhance the images, contrast-limited adaptive histogram equalization (CLAHE) was employed. Pre-processing techniques like CLAHE can potentially make skin lesions more visible and clearer. By utilizing bilinear interpolation and bilinear thresholding, CLAHE [58] provides a contrast range that is both limited and consistent, thereby improving the overall quality and visibility of the images as shown in Figure 3.
3.3. Feature Extraction
Feature extraction is a fundamental process in machine learning where we transform raw data(Images, text, numerical etc.) into a set of meaningful features that are more suitable for modelling. The primary objective of feature extraction is to convert raw data, which may be high-dimensional or unstructured, into a structured and compact representation that captures essential patterns and relationships. By extracting relevant features, researchers can enhance model performance, reduce computational complexity, and improve interpretability [40]. In this paper we have implemented three methods for feature extraction from images.
Figure 4.
Sample dataset images of (A) Original Image (B) CLAHE enhanced image.
3.3.1. Principal Component Analysis
In this method OpenCV library (cv2) is used load and pre-process images for subsequent model training. For each image encountered in the directory, it employs the cv2.imread() function to load the image in grayscale mode (0) and subsequently resizes it to a standardized dimension of 200x200 pixels using cv2.resize(). These pre-processing steps ensure uniformity and consistency in the image data, facilitating seamless integration into the machine learning pipeline. The resized images are then appended to a feature array (X), while the corresponding class labels are appended to a target array (Y). Here each element represents an image represented as a 2D NumPy array form[41].
3.3.2. HOG Feature Extraction
Histogram of Oriented Gradients (HOG) can identify the local structure and shape of an image. It functions by measuring the gradient orientation distribution in specific areas of the picture. HOG feature extraction entails several key steps: first, the computation of image gradients to capture edge and texture information; then, the division of the image into small, overlapping cells, followed by the quantization of gradient orientations into predefined bins within each cell. Subsequently, histograms of gradient orientations are constructed for each cell, and normalization techniques are applied to enhance the descriptor's robustness to illumination and contrast variations. Finally, the histogram values from all cells are concatenated to form the HOG feature descriptor for the entire image[42,43]
3.3.3. LBP Feature Extraction
One effective method for examining texture patterns in photos is to extract features using Local Binary Patterns (LBP) analysis. This approach is useful for many different applications because it provides a reliable way to describe local texture variations. LBP feature extraction operates by comparing each pixel in the image with its surrounding neighbourhood, generating binary patterns that encode local texture information. These binary patterns are then used to construct a histogram, capturing the frequency of occurrence of different texture patterns within the image. The resulting histogram serves as the LBP feature vector, representing the distribution of texture patterns[44,45]. After extracting the feature through above methods, all the extracted data is stored in two NumPy array X and Y.
4. Modelling
4.1. Data Splitting: Partitioning the Dataset for Model Training and Test
The machine learning model is trained on observed patterns and relationships within the data using the training set, which typically consists of the majority of the data. The testing set, which is a smaller portion of the data, is kept secret during the training phase to serve as a separate benchmark for assessing the performance of the model [46]. For training and testing purposes, we have split the dataset in this study into two groups: 80% and 20%.
4.2. Training Models
Brain tumor classification requires model training, and the right machine learning algorithms are chosen with great care to maximize diagnostic accuracy and clinical decision-making. In this research, we present a comparative analysis of several popular algorithms for brain tumor classification tasks, including Random Forest[47], Linear discriminant analysis[48], XGBoost[49], AdaBoost[50], Artificial Neural Network[51].
4.3. Brain Tumor Classification
Brain tumor classification is a crucial process in medical imaging analysis, helping clinicians in correctly diagnosis, treatment planning, and patient management. Through the application of machine learning techniques and sophisticated imaging modalities, scientists have achieved notable advancements in automating and enhancing the precision of brain tumor classification procedures. In this study, we classified images as having tumors or not using Random Forests, Linear discriminant analysis, XGBoost, AdaBoost, Artificial Neural Network.
5. Experimental Results and Discussion
In this section, we will study the classification of brain tumors various ML techniques. Here, we implemented the Python 3.10.12 version in Google Colab. When predicting performance, the four fundamental matrices are known as “True Positive (tp)", “True Negative (tn)", “False Positive (fp), and “False Negative (fn)." The model is applied to a dataset of 3923 MRIs, and the number of True Positives (TP), True Negatives (TN), False Positives (FP), and False Negatives (FN) is counted to determine these metrics [52,53]. The accuracy, precision, sensitivity, specificity, and elapsed time of each model are calculated using the following equations to assess their overall performance:
Accuracy:(TP+TN)/(TP+TN+FN+FP)
Sensitivity:(TP/(TP+FN))
Specificity:(TN/(TN+FP))
Precision:(TP/(TP+FP))
Elapsed Time: end_time - start_time
5.1. Confusion Matrix Table
The confusion matrix is an important method to measure the performance of our model in classifying brain tumors. It aids in defining the extent to which the tumor cases have been correctly classified by the model into true positives, true negatives, false positives, and false negatives. Table 1 below shows the confusion matrix in tabular form.
5.2. Accuracy
Accuracy is measured using different values of TP, TN, FP, and FN from Table 1. In this study, we used three different feature extraction methods—Principal component Analysis(PCA), Histogram of Oriented Gradients (HOG) feature extraction, and Local Binary Patterns (LBP) feature extraction—to assess how well different machine learning algorithms performed on tasks related to brain tumor classification. The Accuracy Chart in Figure 5 provides an overview of the accuracy scores attained for every combination of algorithm and feature extraction technique:
- Key Observation
- Random Forest: Achieved high accuracy across all feature extraction methods, with the best performance using PCA (0.993).
- LDA: Showed the lowest accuracy among the algorithms, performing best with LBP feature extraction (0.84).
- XGBoost: Delivered the highest accuracy overall, consistently achieving 0.99 across both HOG and LBP feature extractions, and 0.997 with PCA.
- ADAboost: Exhibited strong performance, especially with PCA (0.988) and slightly lower with HOG and LBP (both 0.97).
- ANN: Showed high accuracy, matching XGBoost with 0.99 for both HOG and LBP, and 0.985 with PCA.
5.3. Sensitivity
In this work, we examined the sensitivity scores of several machine learning algorithms applied to tasks related to brain tumor classification using three distinct feature extraction techniques: local binary patterns (LBP), Histogram of Oriented Gradients (HOG) feature extraction, and PCA. Recall, another name for sensitivity, is the measurement of the percentage of real positive cases that the model correctly identified out of all true positive cases. The sensitivity chart in Figure 6 provides an overview of the scores obtained for each combination of algorithm and feature extraction method:
- Key Observations
- Random Forest: Achieved perfect sensitivity with HOG (1), and very high sensitivity with PCA (0.997) and LBP (0.99).
- LDA: Showed the lowest sensitivity among the algorithms, performing best with PCA (0.83), followed by LBP (0.81), and the lowest with HOG (0.76).
- XGBoost: Delivered perfect sensitivity with both HOG (1) and very high sensitivity with PCA (0.997) and LBP (0.99).
- ADAboost: Exhibited very high sensitivity, especially with PCA (0.99) and HOG (0.99), and slightly lower with LBP (0.978).
- ANN: Showed perfect sensitivity with HOG (1), and very high sensitivity with PCA (0.99) and LBP (0.99).
5.4. Specificity
We examined at the specificity scores of several machine learning algorithms across a range of feature extraction techniques in our analysis of the performance of brain tumor classification, including the PCA, Histogram of Oriented Gradients (HOG) feature extraction, and Local Binary Patterns (LBP) feature extraction. Out of all actual negative cases, specificity quantifies the percentage of true negative cases that the model correctly identified. The specificity chart in Figure 7 provides an overview of the specificity scores for each combination of algorithm and feature extraction technique.
- Key Observations
- Random Forest: Demonstrated high specificity across all feature extraction methods, with the best performance using PCA (0.991).
- LDA: Showed the lowest specificity among the algorithms, performing best with HOG (0.88), followed by PCA (0.88) and LBP (0.87).
- XGBoost: Delivered the highest specificity overall, achieving 0.997 with PCA and 0.98 with both HOG and LBP feature extraction methods.
- ADAboost: Exhibited very high specificity, especially with PCA (0.98) and slightly lower with HOG (0.96) and LBP (0.975).
- ANN: Showed high specificity, matching XGBoost with 0.98 for both PCA and HOG, and 0.988 with LBP.
5.5. Precision
In our analysis of brain tumor classification performance, we examined the precision scores of various machine learning algorithms across different feature extraction methods: PCA, HOG feature extraction, and LBP feature extraction. The precision chart in Figure 8 provides an overview of the precision scores for each combination of algorithm and feature extraction technique.
- Key Observations:
- Random Forest: Demonstrated high precision across all feature extraction methods, with the highest precision using PCA (0.988).
- LDA: Showed the lowest precision among the algorithms, performing best with HOG (0.85), followed by PCA (0.84) and LBP (0.83).
- XGBoost: Delivered the highest precision overall, achieving 0.997 with PCA, 0.976 with HOG, and 0.98 with LBP feature extraction methods.
- ADAboost: Exhibited very high precision, especially with PCA (0.979) and slightly lower with HOG (0.946) and LBP (0.96).
- ANN: Showed high precision, matching XGBoost with 0.98 for HOG, and 0.985 with LBP, and 0.97 with PCA.
5.6. Elapsed Time
The elapsed time table represents the time taken by different machine learning algorithms for processing data using three different feature extraction methods: PCA, HOG (Histogram of Oriented Gradients) Feature Extraction, and LBP (Local Binary Patterns) Feature Extraction. The values are presented in seconds as shown in Figure 9.
- Random Forest: Exhibited moderate elapsed times across all feature extraction methods, with the quickest performance using LBP (62.5 seconds) and the slowest with HOG (136.55 seconds).
- LDA: Showed varied elapsed times, with the quickest performance using HOG (77.3 seconds) and the slowest with LBP (121.07 seconds).
- XGBoost: Demonstrated relatively longer elapsed times compared to Random Forest and LDA, with the quickest performance using LBP (88.04 seconds) and the slowest with PCA (209.91 seconds).
- ADAboost: Had the longest elapsed times among all algorithms, with the quickest performance using LBP (255.32 seconds) and the slowest with PCA (453.7 seconds).
- ANN: Exhibited the shortest elapsed times across all feature extraction methods, with the quickest performance using HOG (41.97 seconds) and the slowest with PCA (84.33 seconds).
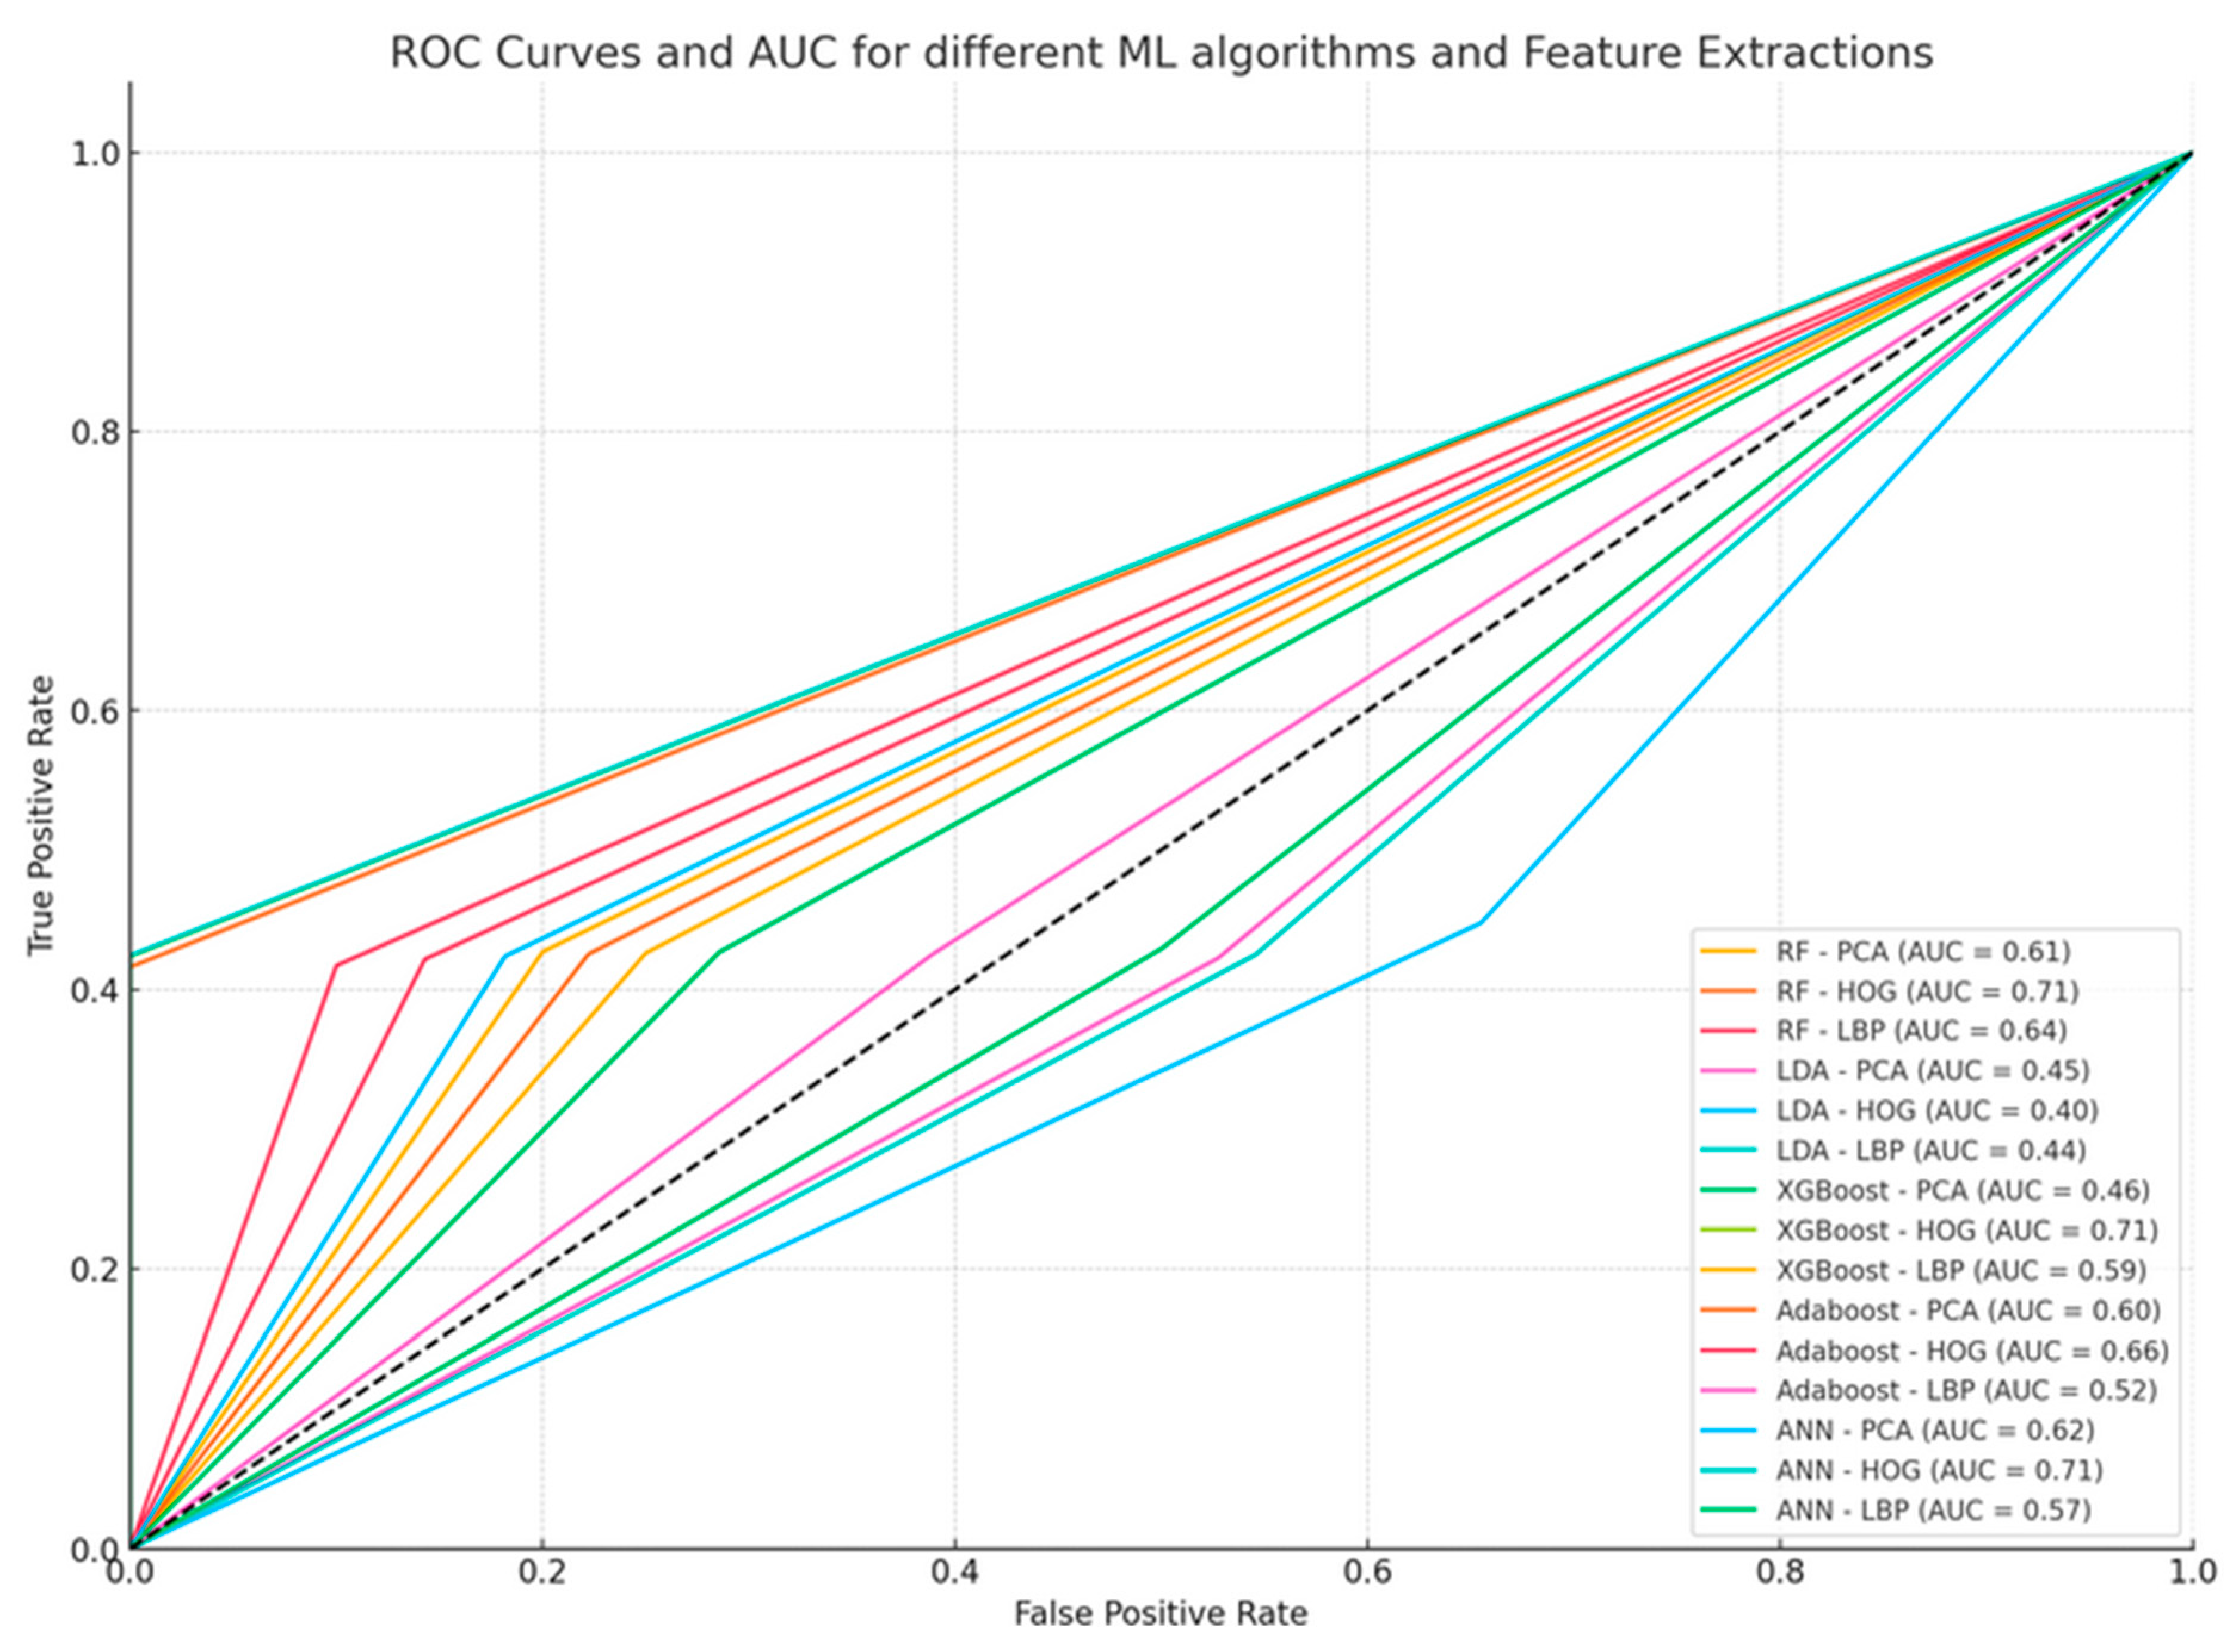
5.7. Area Under Curve
The True Positive Rate (TPR) and False Positive Rate (FPR) for each model and feature extraction technique must be determined in order to create the AUC (Area Under the Curve) curves for the provided data. Here is how to calculate the TPR and FPR:
TPR (or Sensitivity or Recall) = TP / (TP + FN)
FPR = FP / (FP + TN)
These numbers allow us to plot the ROC curves and calculate the AUC for every combination of feature extraction technique and machine learning algorithm.
Figure 10 shows the ROC curves for the different machine learning algorithms and feature extraction techniques. The algorithm and feature extraction technique, as well as the corresponding AUC values, are labeled on the curves.
In all models, PCA and LBP have very consistently achieved good AUC values of 0.79 for RF, XGBoost, and ANN. LBP and PCA generally perform better than HOG. Less so, LBP is sometimes an improvement over HOG. The best, on average, are XGBoost and ANN, with a relatively consistent AUC of 0.79. Random Forest also gave good performance with PCA and LBP. The bad performer in general is Linear Discriminant Analysis, more significantly with the HOG feature extraction method (AUC = 0.47), which is not very well adapted to this kind of feature extraction method. This shows how it is essential to choose a good set of machine-learning algorithms with appropriate feature extraction for optimized classification performance.
6. Discussion
According to our research, our proposed methodology in classifying brain tumors is strongly justified. We experimented with advanced feature extraction in preprocessing images and applying machine learning models. We found it to be a milestone in obtaining the best results for cases of brain tumor classification from non-cancerous cases. Such a process has upgraded the accuracy and reliability of the detection of brain tumors, making it a potential resource for being used as a valuable tool in medical diagnosis.
A comparative analysis of the existing brain tumor detection and classification techniques adapted using different datasets, machine learning models, and the respective accuracies achieved in other studies is presented in Table 2. Famous datasets like Kaggle, based on which studies such as [56,58], and "This Work" were conducted, provide a rich source of MRI images for robust model training. Other studies used institutional datasets, for instance, from MS Medical College Jaipur ([55]) or region-specific datasets, such as those involving Saudi pediatric patients ([63]), meaning that they focus on some demographic or clinical conditions. A significant contribution to model training also comes from the BRATS dataset ([64]), well known for its high-quality and annotated brain tumor images. Some studies, however, did not state the sources of their datasets ([57,59,60]).
In the models adopted, ensemble learning considers models such as XGBoost and Random Forest, commonly used with high rates of accuracy ([27,58]), "This Work." The algorithms show outstanding performance when dealing with complex data patterns. Support Vector Machines (SVM) are used several times in the literature works ([54,56,59,60]) and are preferred because they work well on high-dimensional spaces. Deep learning architectures, such as InceptionV3, VGG19, and DenseNet121, reported very high accuracies, indicating the power of neural networks in image classification tasks. Other algorithms were Naive Bayes (NB), Decision Trees (DT), and K-Nearest Neighbors (KNN) ([27,54,56,60])—often part of a combination with more advanced techniques.
The highest accuracy reported is 99.3% in "This Work" using the Random Forest, showing that the model possesses robust characteristics through feature extraction techniques developed within the given work. Deep learning models, particularly MobileNet, achieved 99.60% accuracy ([62]), and it is very potent for transfer learning when fine-tuning pre-trained models. XGBoost showed good performances across multiple studies and consistently across them ([27,57,59]) at accuracies around 97–98%, showing its application to structured data. SVM was up to 95.3% accurate ([56]), which makes it a very reliable model despite different datasets, of which neural networks proved to be very efficient with 95.86% accuracy ([55]) and 98.7% accuracy ([63]).
Numerous research works bring out the importance of specific creative approaches, like feature engineering and hyperparameter tuning ([27,58]), for improvement to be realized in the model. Ensemble classifiers can further enhance the quality of the results in the dataset as it will boost robustness because they can handle the variability in tumor characteristics ([60,61]). According to study [62], it has shown better accuracy for transfer learning compared to the rest, and this actually shows the high potential of this technique for medical imaging applications. However, there are still some limitations and considerations to be made. In general, larger and more diversified datasets lead to better representatively. Studies with specific small datasets generally will face a lot of difficulties in generalizing its findings ([55,61]). On the other hand, more advanced models, such as deep learning or those using ensemble methods, generally provide increased accuracy but may be comparatively low in terms of interpretability, which can be pretty crucial for clinical settings.
In conclusion, it is evidenced that advanced ensemble methods and deep learning models are lying at the forefront of brain tumor classification, acquiring state-of-the-art classification accuracy. Besides, one should consider the size of the dataset, model interpretability, and computational resources when choosing a model. Comprehensive feature extraction and transfer learning techniques greatly enhance the performance of models, therefore proving them highly effective for critical applications in medical imaging.
7. Conclusion and Future Work
This study implements five Machine Learning algorithms for classifying brain tumors by using different methods of feature extraction: PCA, HOG, and LBP. XGBoost and ANN presented the best accuracy in this study, with all feature extraction methods; in most cases, XGBoost is slightly better than ANN. Random Forest gave an even more accurate response, but not to the extent of XGBoost and ANN. The least accurate was LDA, which means that this method can not be more appropriate for the classification of brain tumors. XGBoost, ANN, and Random Forest were the best in the proper identification of the positive cases (sensitivity). Again, the LDA was the weakest. Concerning specificity, i.e., adequate detection of negative instances, XGBoost and ANN were the leaders, but Random Forest was the next and LDA the last. The highest hereof precision in XGBoost revealed that the number of optimistic predictions mainly was correct. Similarly, ANN and Random Forest also received high precision, while LDA scored the least. ANN turned out fast in practical use. ADAboost turned out the slowest even though its performance metrics were quite good. Random Forest and XGBoost had moderate times but with a good balance in speed and performance. Based on these promising results, future research and development could also look into elevated brain tumor classification through machine learning. One such important area of future improvement includes incorporating these machine learning models with advanced imaging techniques, for example, fMRI and PET scans. Such integration may yield rich data, possibly improving the manner of accuracy and reliability with which they classify tumors. Future research in the field should also address further algorithm optimization toward real-time processing so such algorithms can eventually be included in the clinical environment where there is a diagnosis.
Funding
No Funding
Ethical compliance
No
Declaration of competing interest
No conflict of interest in this work.
Data availability
Data can be shared as and when required by contacting the author.
References
- Al-Galal, S.A.Y.; Alshaikhli, I.F.T.; Abdulrazzaq, M.M. MRI brain tumor medical images analysis using deep learning techniques:A systematic review. Health Technol. 2021, 11, 267–282. [Google Scholar] [CrossRef]
- https://www.cancer.net/cancer-types/brain-tumor/statistics.
- Louis, D.N.; Perry, A.; Wesseling, P.; Brat, D.J.; Cree, I.A.; Figarella-Branger, D.; Hawkins, C.; Ng, H.K.; Pfister, S.M.; Reifenberger, G. The 2021 WHO classification of tumors of the central nervous system: A summary. Neuro-Oncology 2021, 23, 1231–1251. [Google Scholar] [CrossRef] [PubMed]
- Nodirov, J.; Abdusalomov, A.B.; Whangbo, T.K. Attention 3D U-Net with Multiple Skip Connections for Segmentation of Brain Tumor Images. Sensors 2022, 22, 6501. [Google Scholar] [CrossRef] [PubMed]
- Shafi, A.S.M.; Rahman, M.B.; Anwar, T.; Halder, R.S.; Kays, H.E. Classification of brain tumors and auto-immune disease using ensemble learning. Inform. Med. Unlocked 2021, 24, 100608. [Google Scholar] [CrossRef]
- Pereira, S.; Pinto, A.; Alves, V.; Silva, C.A. Brain tumor segmentation using convolutional neural networks in MRI images. IEEE Trans. Med. Imaging 2016, 35, 1240–1251. [Google Scholar] [CrossRef]
- Ahuja, S.; Panigrahi, B.K.; Gandhi, T.K. Enhanced performance of Dark-Nets for brain tumor classification and segmentation using colormap-based superpixel techniques. Mach. Learn Appl. 2022, 7, 100212. [Google Scholar] [CrossRef]
- Pereira, S.; Meier, R.; Alves, V.; Reyes, M.; Silva, C.A. Automatic Brain Tumor Grading from MRI Data Using Convolutional Neural Networks and Quality Assessment. In Lecture Notes in Computer Science (Including Subseries Lecture Notes in Artificial Intelligence and Lecture Notes in Bioinformatics); Springer: Cham, Switzerland, 2018; Volume 11038, pp. 106–114. [Google Scholar]
- Tandel, G.S.; Tiwari, A.; Kakde, O.G. Performance optimisation of deep learning models using majority voting algorithm for brain tumour classification. Comput. Biol. Med. 2021, 135, 104564. [Google Scholar] [CrossRef] [PubMed]
- Komaki, K.; Sano, N.; Tangoku, A. Problems in histological grading of malignancy and its clinical significance in patients with operable breast cancer. Breast Cancer 2006, 13, 249–253. [Google Scholar] [CrossRef]
- Alejandro, F. Frangi, Sotirios A. Tsaftaris and Jerry L. Prince, Simulation and Synthesis in Medical Imaging, IEEE Transactions on Medical Imaging, vol.37, issue.3, pp. 673 – 679, 2018.
- P.B. Kanade, and P. Gumaste, Brain tumor detection using MRI images. vol. Vol. 3. Brain, 2015.
- Amin, J.; Sharif, M.; Haldorai, A.; Yasmin, M.; Nayak, R.S. Brain tumor detection and classification using machine learning: A comprehensive survey. Complex Intell. Syst. 2021, 8, 3161–3183. [Google Scholar] [CrossRef]
- Abdel Razek, A.A.K.; Alksas, A.; Shehata, M.; AbdelKhalek, A.; Abdel Baky, K.; El-Baz,A.;Helmy,E. Clinical Applications of Artificial Intelligence and Radiomics in Neuro-Oncology Imaging. Insights Imaging 2021, 12, 152. [CrossRef] [PubMed]
- Gillies RJ, Kinahan PE, Hricak H. Radiomics: Images Are More than Pictures, They Are Data. Radiology. 2016 Feb;278(2):563-77. [CrossRef]
- Saad NM, Bakar SARSA, Muda AS, Mokji MM (2015) Review of brain lesion detection and classification using neuroimaging analysis techniques. J Teknol 74:1–13.
- Huang M, Yang W, Wu Y, Jiang J, Chen W, Feng Q (2014) Brain tumor segmentation based on local independent projection-based classification. IEEE Trans Biomed Eng 61:2633–2645.
- Khan MA, Arshad H, Nisar W, Javed MY, Sharif M (2021) An integrated design of Fuzzy C-means and NCA-based multiproperties feature reduction for brain tumor recognition. Signal and image processing techniques for the development of intelligent healthcare systems.
- Tandel GS, Biswas M, Kakde OG, Tiwari A, Suri HS, Turk M et al. (2019) a review on a deep learning perspective in brain cancer classification. Cancers 11:1–32.
- El-Dahshan E-SA, Mohsen HM, Revett K, Salem A-BM (2014) Computer-aided diagnosis of human brain tumor through MRI: A survey and a new algorithm. Expert Syst Appl 41:5526–5545.
- Gordillo N, Montseny E, Sobrevilla P (2013) State of the art survey on MRI brain tumor segmentation. Magn Reson Imaging 31:1426–1438.
- Mohan G, Subashini MM (2018) MRI based medical image analysis: Survey on brain tumor grade classification. Biomed Signal Process Control 39:139–161.
- Amreen Batool, Yung-Cheol Byun,Brain tumor detection with integrating traditional and computational intelligence approaches across diverse imaging modalities - Challenges and future directions,Computers in Biology and Medicine, Volume 175,2024,108412,ISSN 0010-4825. [CrossRef]
- Stijn Bonte, Ingeborg Goethals, Roel Van Holen, Machine learning based brain tumour segmentation on limited data using local texture and abnormality, Computers in Biology and Medicine,Volume 98,2018,Pages 39-47,ISSN 0010-4825. [CrossRef]
- Fusun Citak-Er, Zeynep Firat, Ilhami Kovanlikaya, Ugur Ture, Esin Ozturk-Isik, Machine-learning in grading of gliomas based on multi-parametric magnetic resonance imaging at 3T, Computers in Biology and Medicine, Volume 99,2018,Pages 154-160,ISSN 0010-4825. [CrossRef]
- R. Ali, S. Al-jumaili, A. D. Duru, O. N. Uçan, A. Boyaci and D. G. Duru, "Classification of Brain Tumors using MRI images based on Convolutional Neural Network and Supervised Machine Learning Algorithms," 2022 International Symposium on Multidisciplinary Studies and Innovative Technologies (ISMSIT), Ankara, Turkey, 2022, pp. 822-827. [CrossRef]
- Tseng, C., & Tang, C. (2023). An optimized XGBoost technique for accurate brain tumor detection using feature selection and image segmentation. Healthcare Analytics, 4, 100217. [CrossRef]
- Zelli, V. , Manno, A., Compagnoni, C., Ibraheem, R. O., Zazzeroni, F., Alesse, E., Rossi, F., Arbib, C., & Tessitore, A. (2023). Classification of tumor types using XGBoost machine learning model: A vector space transformation of genomic alterations. Journal of Translational Medicine. [CrossRef]
- Elazab, N. , Gab-Allah, W. A., & Elmogy, M. (2024). A multi-class brain tumor grading system based on histopathological images using a hybrid YOLO and RESNET networks. Scientific Reports. [CrossRef]
- Rajkumaar, K., Boda, R., Choppakatla, N. et al. An optimized eagle adaboost model for brain tumor classification and severity analysis system. Multimed Tools Appl (2024). [CrossRef]
- Senan EM, Jadhav ME, Rassem TH, Aljaloud AS, Mohammed BA, Al-Mekhlafi ZG. Early diagnosis of brain tumour MRI images using hybrid techniques between deep and machine learning. Comput Math Methods Med 2022;2022. [CrossRef]
- Ravinder, M., Saluja, G., Allabun, S. et al. Enhanced brain tumor classification using graph convolutional neural network architecture. Sci Rep 13, 14938 (2023). [CrossRef]
- ZainEldin H, Gamel SA, El-Kenawy EM, Alharbi AH, Khafaga DS, Ibrahim A, Talaat FM. Brain Tumor Detection and Classification Using Deep Learning and Sine-Cosine Fitness Grey Wolf Optimization. Bioengineering (Basel). 2022 Dec 22;10(1):18. [CrossRef]
- S. Shanthi, S. Saradha, J.A. Smitha, N. Prasath, H. Anandakumar, An efficient automatic brain tumor classification using optimized hybrid deep neural network, International Journal of Intelligent Networks, Volume 3,2022,Pages 188-196,ISSN 2666-6030. [CrossRef]
- Amaliah Faradibah, Dewi Widyawati, A Ulfah Tenripada Syahar, & Sitti Rahmah Jabir. (2023). Comparison analysis of random forest classifier, support vector machine, and artificial neural network performance in Multiclass brain tumor classification. Indonesian Journal of Data and Science, 4(2), 54-63. [CrossRef]
- Güler, M., & Namlı, E. (2024). Brain tumor detection with deep learning methods’ classifier optimization using medical images. Applied Sciences, 14(2), 642. [CrossRef]
- Waleed A. Mahmoud Al-Jawher, Sarah H. Awad,A proposed brain tumor detection algorithm using Multi wavelet Transform (MWT),Materials Today: Proceedings,Volume 65, Part 5,2022,Pages 2731-2737,ISSN 2214-7853. [CrossRef]
- A. Srinivasa Reddy, Effective CNN-MSO method for brain tumor detection and segmentation, Materials Today: Proceedings,Volume 57, Part 5,2022,Pages 1969-1974,ISSN 2214-7853. [CrossRef]
- Raschka, S., Liu, Y., Mirjalili, V., & Dzhulgakov, D. (2022). Machine learning with PyTorch and scikit-learn: Develop machine learning and deep learning models with Python. Packt Publishing.
- Abraham, A., Pedregosa, F., Eickenberg, M., Gervais, P., Mueller, A., Kossaifi, J., Gramfort, A., Thirion, B., & Varoquaux, G. (2014). Machine learning for neuroimaging with scikit-learn. Frontiers in Neuroinformatics, 8. [CrossRef]
- Raschka, S., Liu, Y., Mirjalili, V., & Dzhulgakov, D. (2022). Machine learning with PyTorch and scikit-learn: Develop machine learning and deep learning models with Python. Packt Publishing.
- Dalal, N., & Triggs, B. (n.d.). Histograms of oriented gradients for human detection. 2005 IEEE Computer Society Conference on Computer Vision and Pattern Recognition (CVPR'05). [CrossRef]
- OpenCV: Cv::HOGDescriptor Struct reference. (n.d.). OpenCV documentation index. https://docs.opencv.org/4.x/d5/d33/structcv_1_1HOGDescriptor.
- Ahonen, T., Hadid, A., & Pietikainen, M. (2006). Face description with local binary patterns: Application to face recognition. IEEE Transactions on Pattern Analysis and Machine Intelligence, 28(12), 2037-2041. [CrossRef]
- OpenCV: Histograms - 1: Find, plot, analyze !!! (n.d.). OpenCV documentation index. https://docs.opencv.org/4.x/d1/db7/tutorial_py_histogram_begins.html Local binary pattern for texture classification — skimage 0.23.2 documentation. (n.d.). scikit-image: Image processing in Python — scikit-image. Retrieved May 6, 2024, from https://scikitimage.org/docs/stable/auto_examples/features_detection/plot_local_binary_pattern.html.
- Sklearn.model_selection.train_test_split. (n.d.). scikit-learn. Retrieved May 6, 2024, from https://scikit-learn.org/stable/modules/generated/sklearn.model_selection.train_test_split.html.
- Breiman, L. (2001). Random Forests. Machine Learning, 45(1), 5-32.
- Hastie, T. , Tibshirani, R., & Friedman, J. (2009). The Elements of Statistical Learning: Data Mining, Inference, and Prediction (2nd Edition). Springer.
- Géron, A. (2019). Hands-On Machine Learning with Scikit-Learn, Keras, and TensorFlow (2nd Edition).
- Schapire, R. E. , & Freund, Y. (2012). Boosting: Foundations and Algorithms. MIT Press.
- Goodfellow, I. , Bengio, Y., & Courville, A. (2016). Deep Learning. MIT Press.
- Arakeri, M.P.; Reddy, G.R.M. Computeraided diagnosis system for tissue characterization of brain tumor on magnetic resonance images. Signal Image Video Process. 2015, 9, 409–425. [Google Scholar] [CrossRef]
- Wang, S.; Zhang, Y.; Dong, Z.; Du, S.; Ji, G.; Yan, J.; Phillips, P. Feed-forward neural network optimized by hybridization of PSOand ABC for abnormal brain detection. Int. J. Imaging Syst. Technol. 2015, 25, 153–164. [Google Scholar] [CrossRef]
- Yu, Z., He, Q., Yang, J., & Luo, M. (2022). A supervised ML applied classification model for brain tumors MRI. Frontiers in Pharmacology, 13. [CrossRef]
- Rinesh, S. , Maheswari, K., Arthi, B., Sherubha, P., Vijay, A., Sridhar, S., Rajendran, T., Waji, Yosef Asrat, Investigations on Brain Tumor Classification Using Hybrid Machine Learning Algorithms, Journal of Healthcare Engineering, 2022, 2761847, 9 pages, 2022. [CrossRef]
- Alaraimi, S. , Naimi, I. A., Manic, S., Hinai, N. A., & Shukaili, S. A. (2024). Enhancing brain tumor assessment: A comprehensive approach using computerized diagnostic tool and advanced MRI techniques. Procedia Computer Science. [CrossRef]
- Uvaneshwari M, Baskar M. Computer-Aided Diagnosis Model Using Machine Learning for Brain Tumor Detection and Classification n.d. [CrossRef]
- J.C.M. dos Santos, G.A. Carrijo, C. de Fátima dos Santos Cardoso, et al., Fundus image quality enhancement for blood vessel detection via a neural network using CLAHE and Wiener filter, Res. Biomed. Eng. 2020. [CrossRef]
- S. Shilaskar, T. Mahajan, S. Bhatlawande, S. Chaudhari, R. Mahajan and K. Junnare, "Machine Learning based Brain Tumor Detection and Classification using HOG Feature Descriptor," 2023 International Conference on Sustainable Computing and Smart Systems (ICSCSS), Coimbatore, India, 2023, pp. 67-75. [CrossRef]
- Guerroudji, M. A. , Hadjadj, Z., Lichouri, M., Amara, K., & Zenati, N. (2023). Efficient Machine Learning-based Approach for Brain Tumor Detection Using the CAD System. IETE Journal of Research. [CrossRef]
- Joo, B. , Ahn, S. S., Park, J., & Kim, H. S. (2022). Fully automated radiomics-based machine learning models for multiclass classification of single brain tumors: Glioblastoma, lymphoma, and metastasis. WFNOS 2022 Abstract Book. [CrossRef]
- Islam, M. M. , Barua, P., Rahman, M., Ahammed, T., Akter, L., & Uddin, J. (2023). Transfer learning architectures with fine-tuning for brain tumor classification using magnetic resonance imaging. Healthcare Analytics. [CrossRef]
- Hamd, Z. Y. , Osman, E. G., Alorainy, A. I., Alqahtani, A. F., Alshammari, N. R., Bajamal, O., Alruwaili, S. H., Almohsen, S. S., Almusallam, R. I., & Khandaker, M. U. (2024). The role of machine learning in detecting primary brain tumors in Saudi pediatric patients through MRI images. Journal of Radiation Research and Applied Sciences. [CrossRef]
- Raghuwanshi, S., Sukhad, A., Rasool, A., Meena, V. K., Jadhav, A., & Shivakarthik, K. (2024). Early detection of brain tumor from MRI images using different machine learning techniques. Procedia Computer Science, 235, 3094-3104. [CrossRef]
Figure 1.
Overview various types of Brain Tumor.
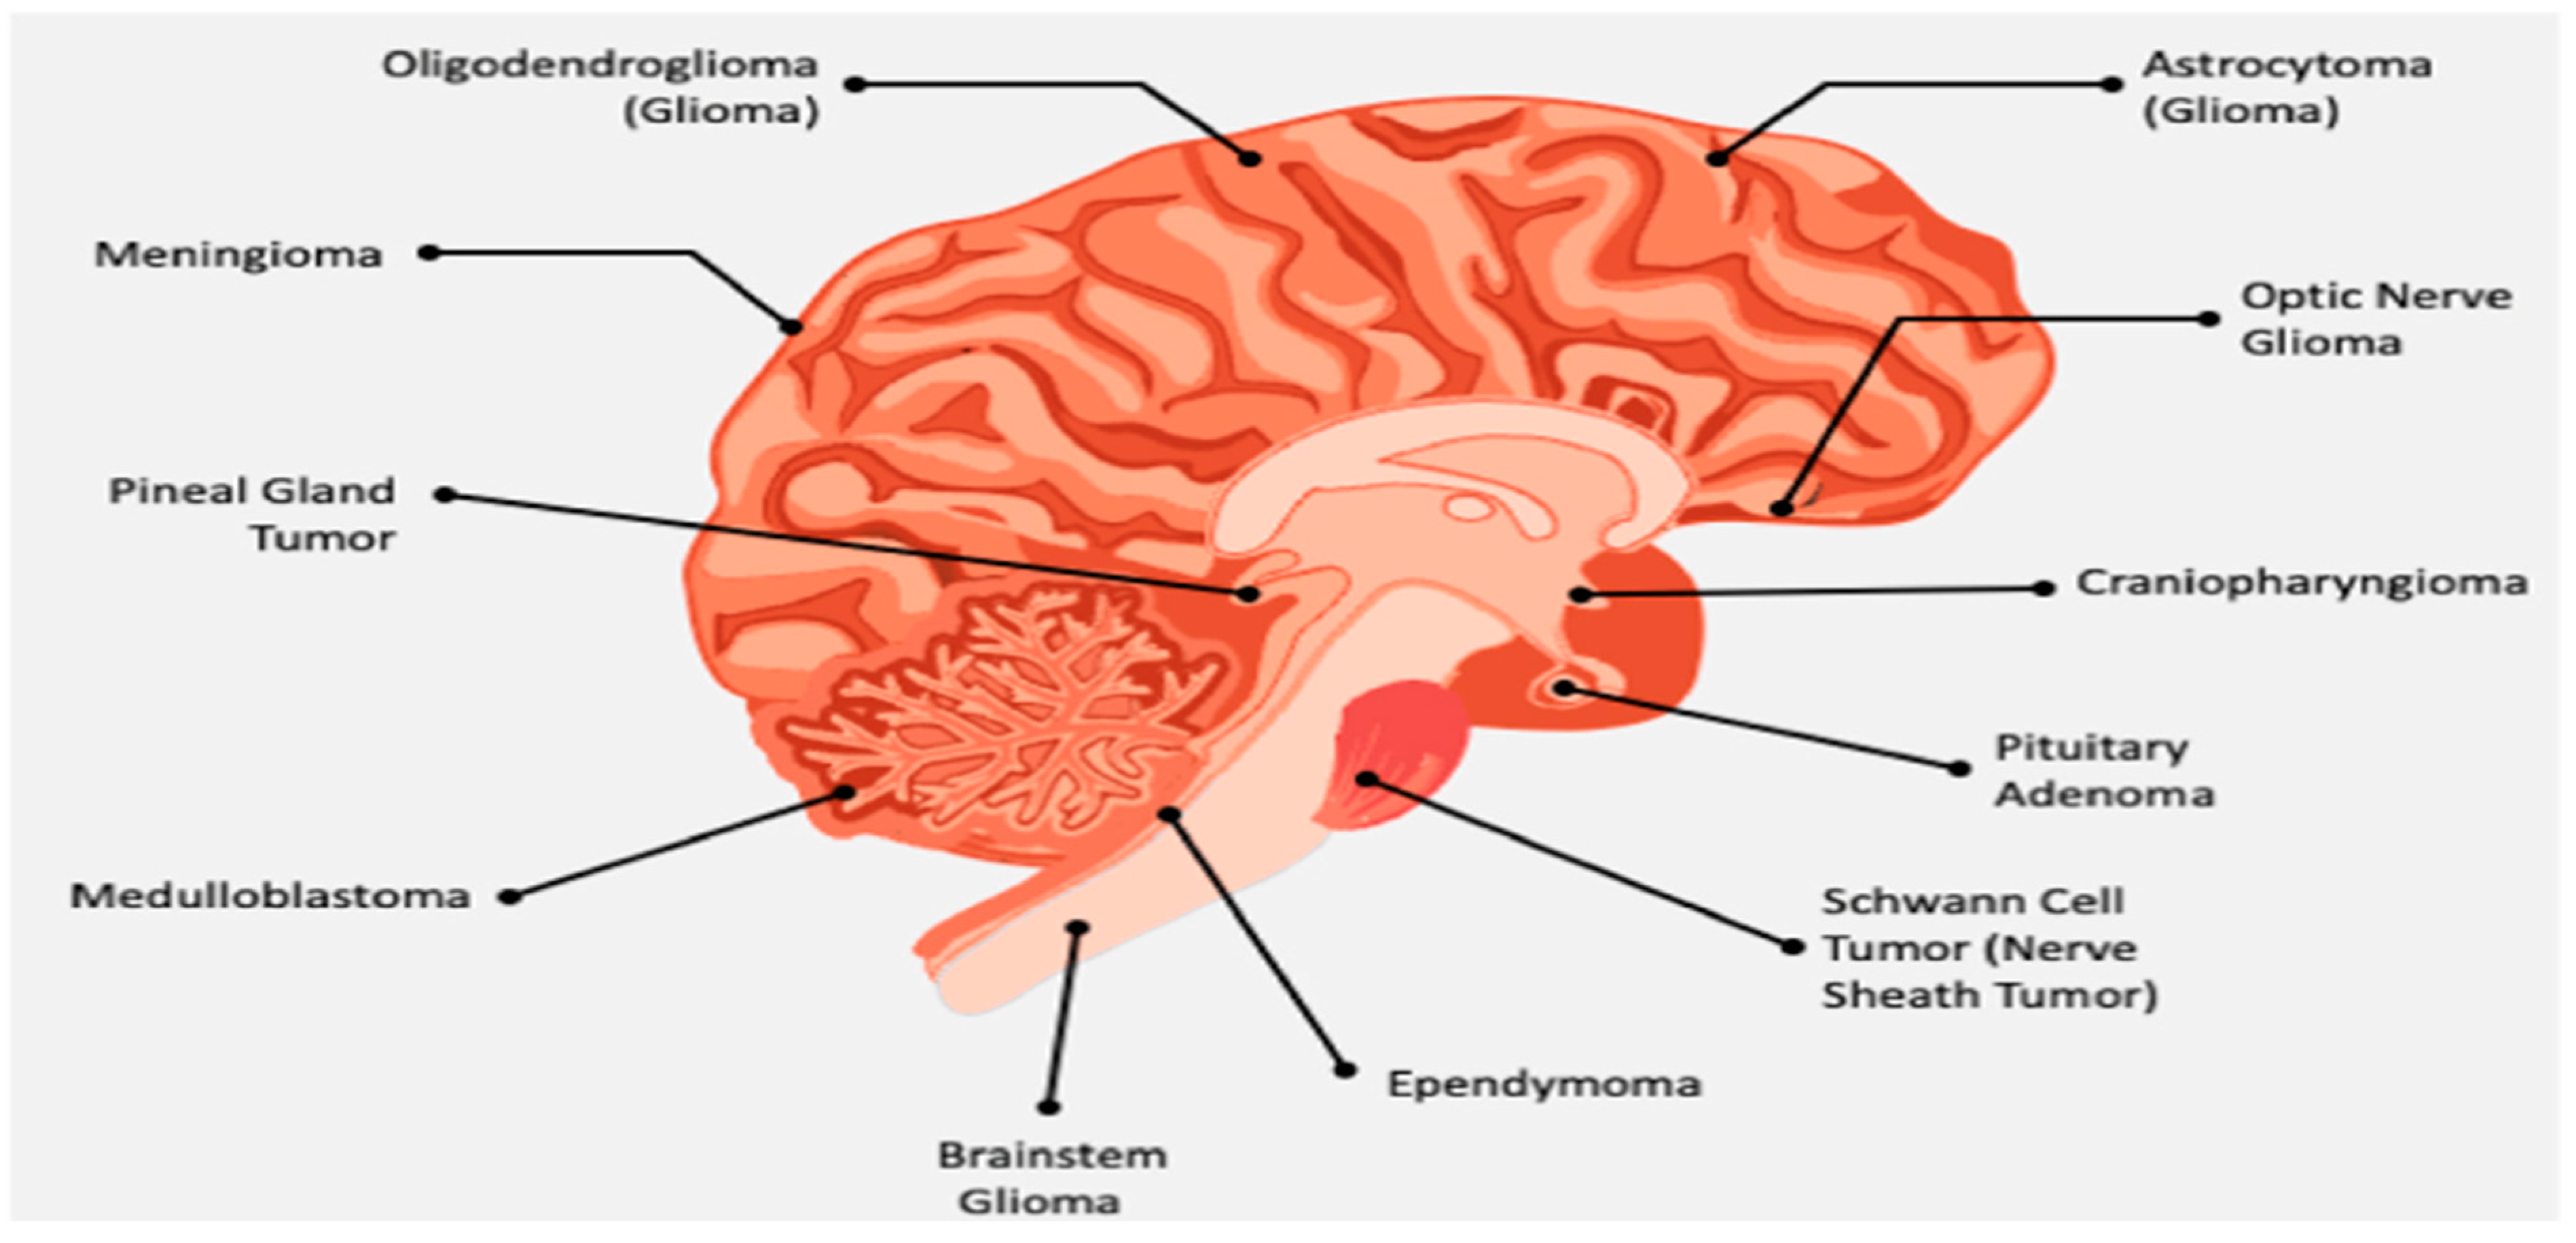
Figure 2.
Workflow of Research work.
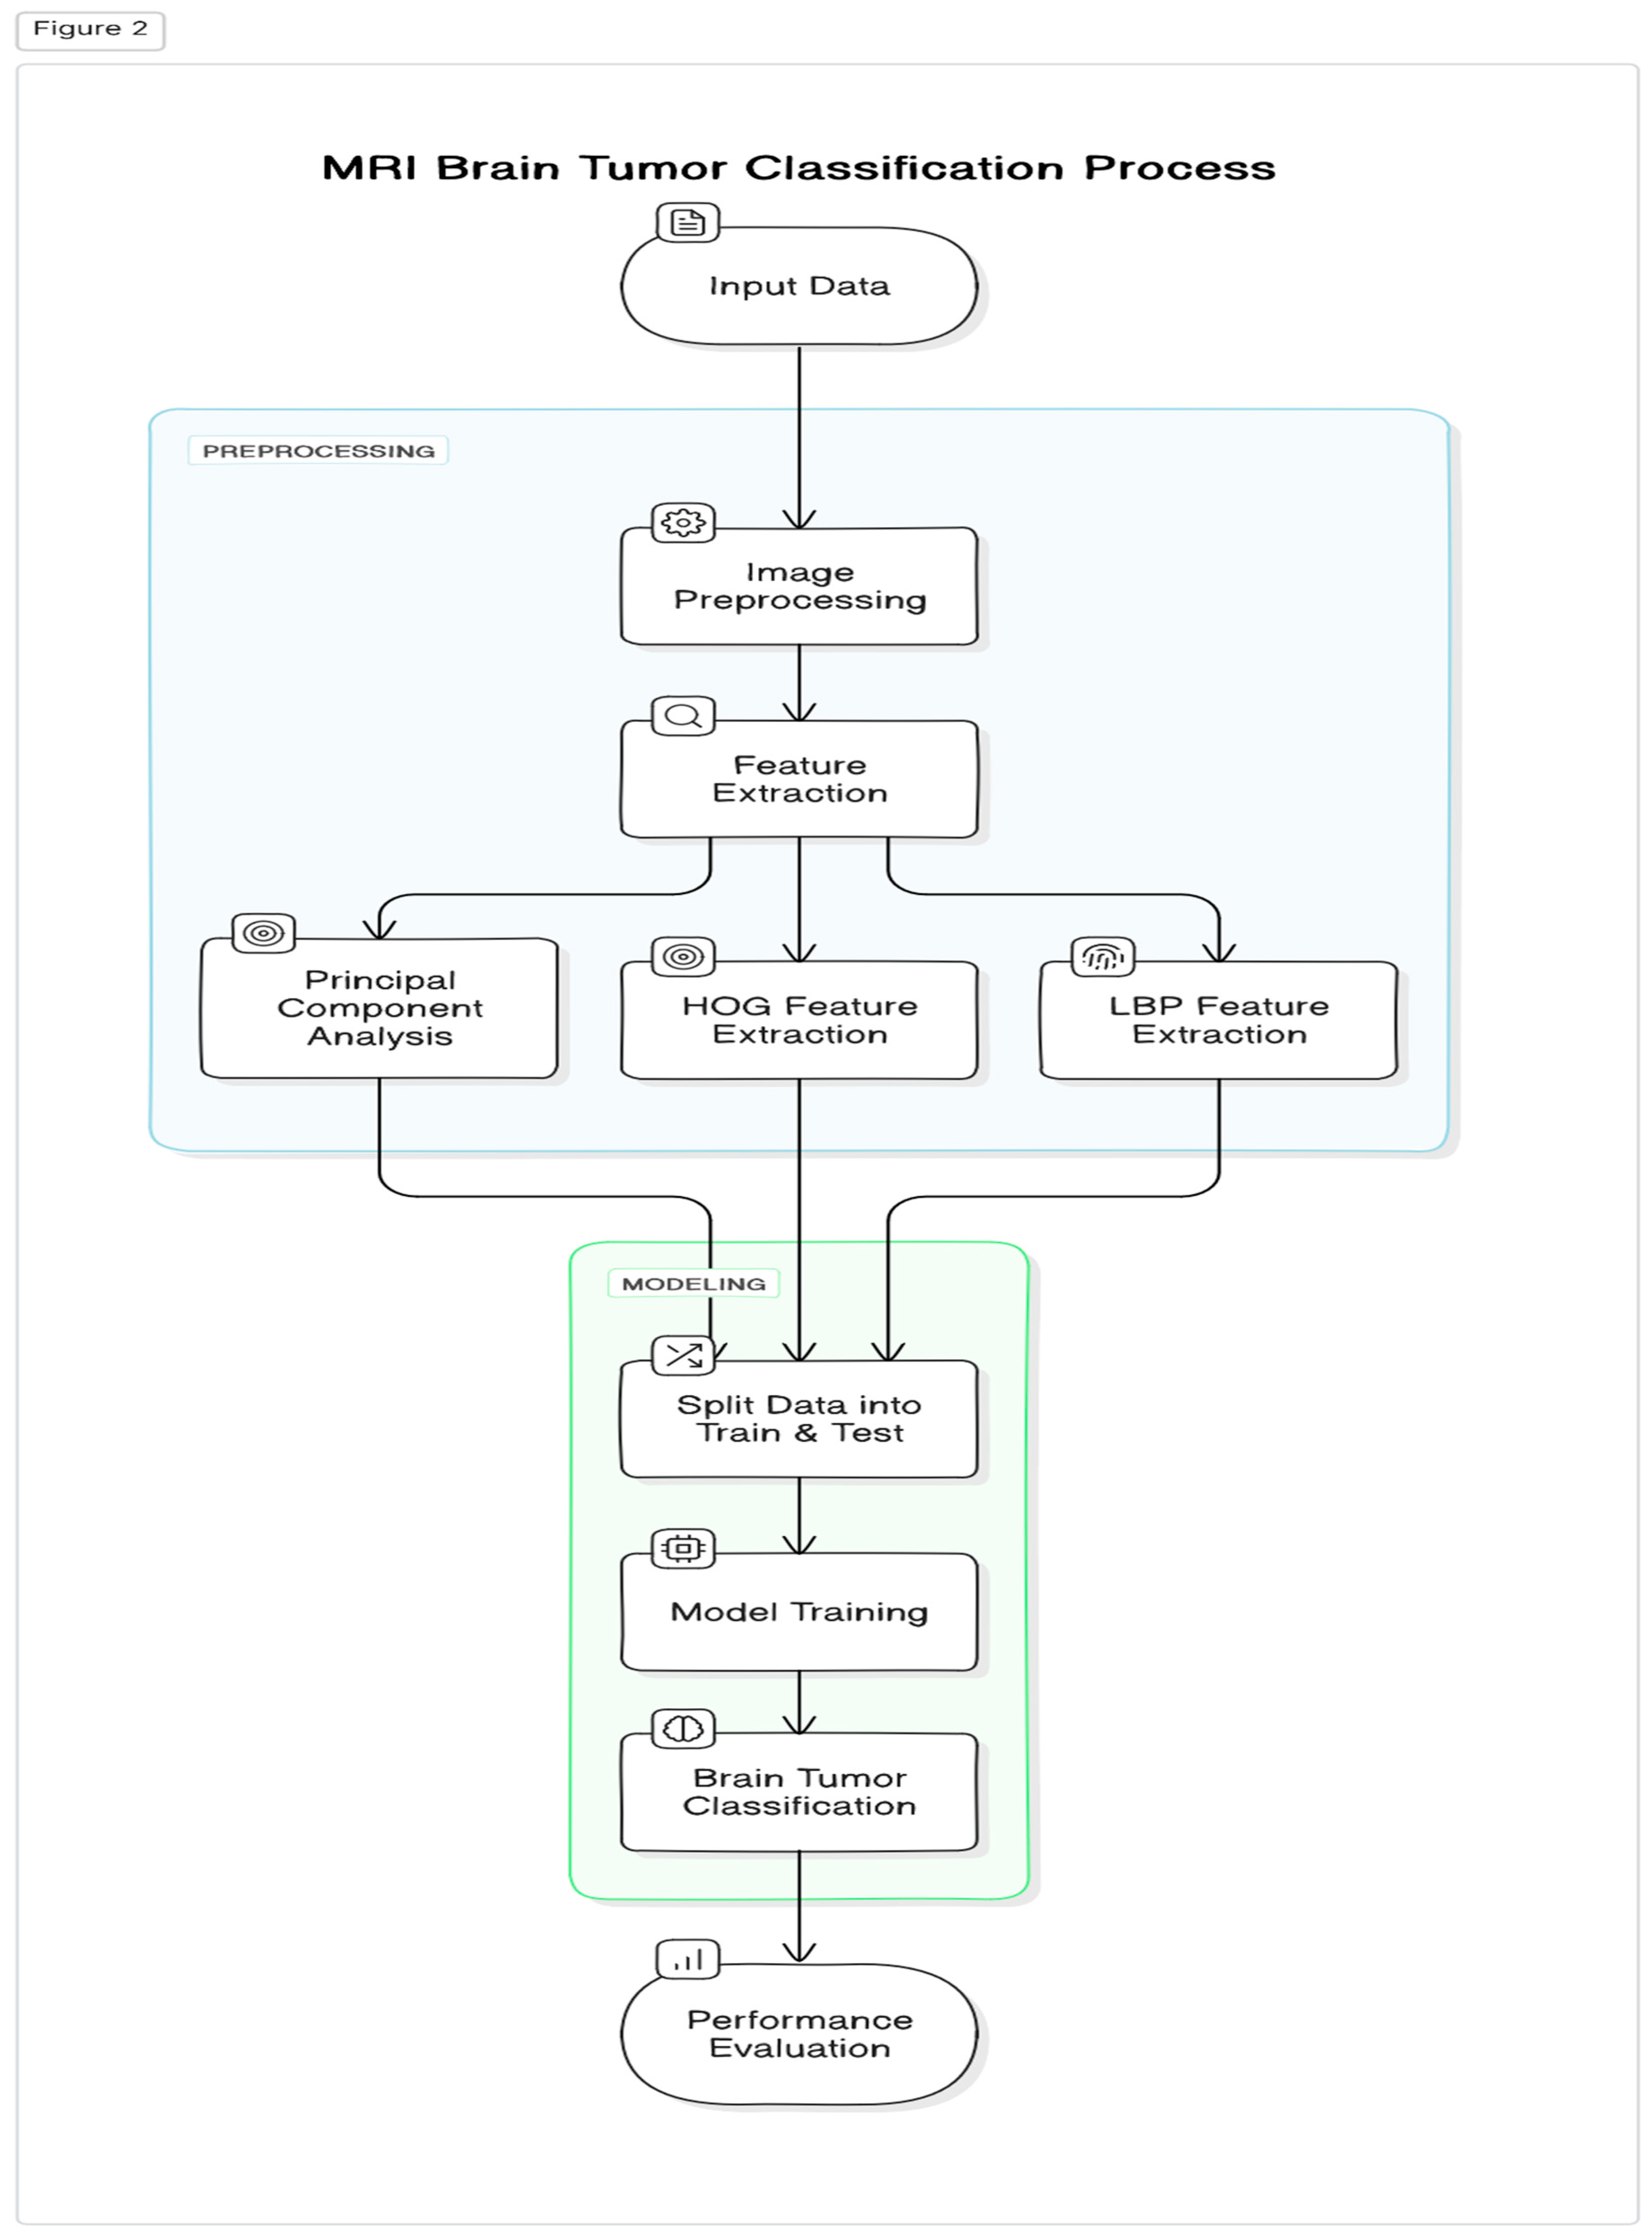
Figure 3.
Sample dataset images of the same size (A) and of different sizes (B).
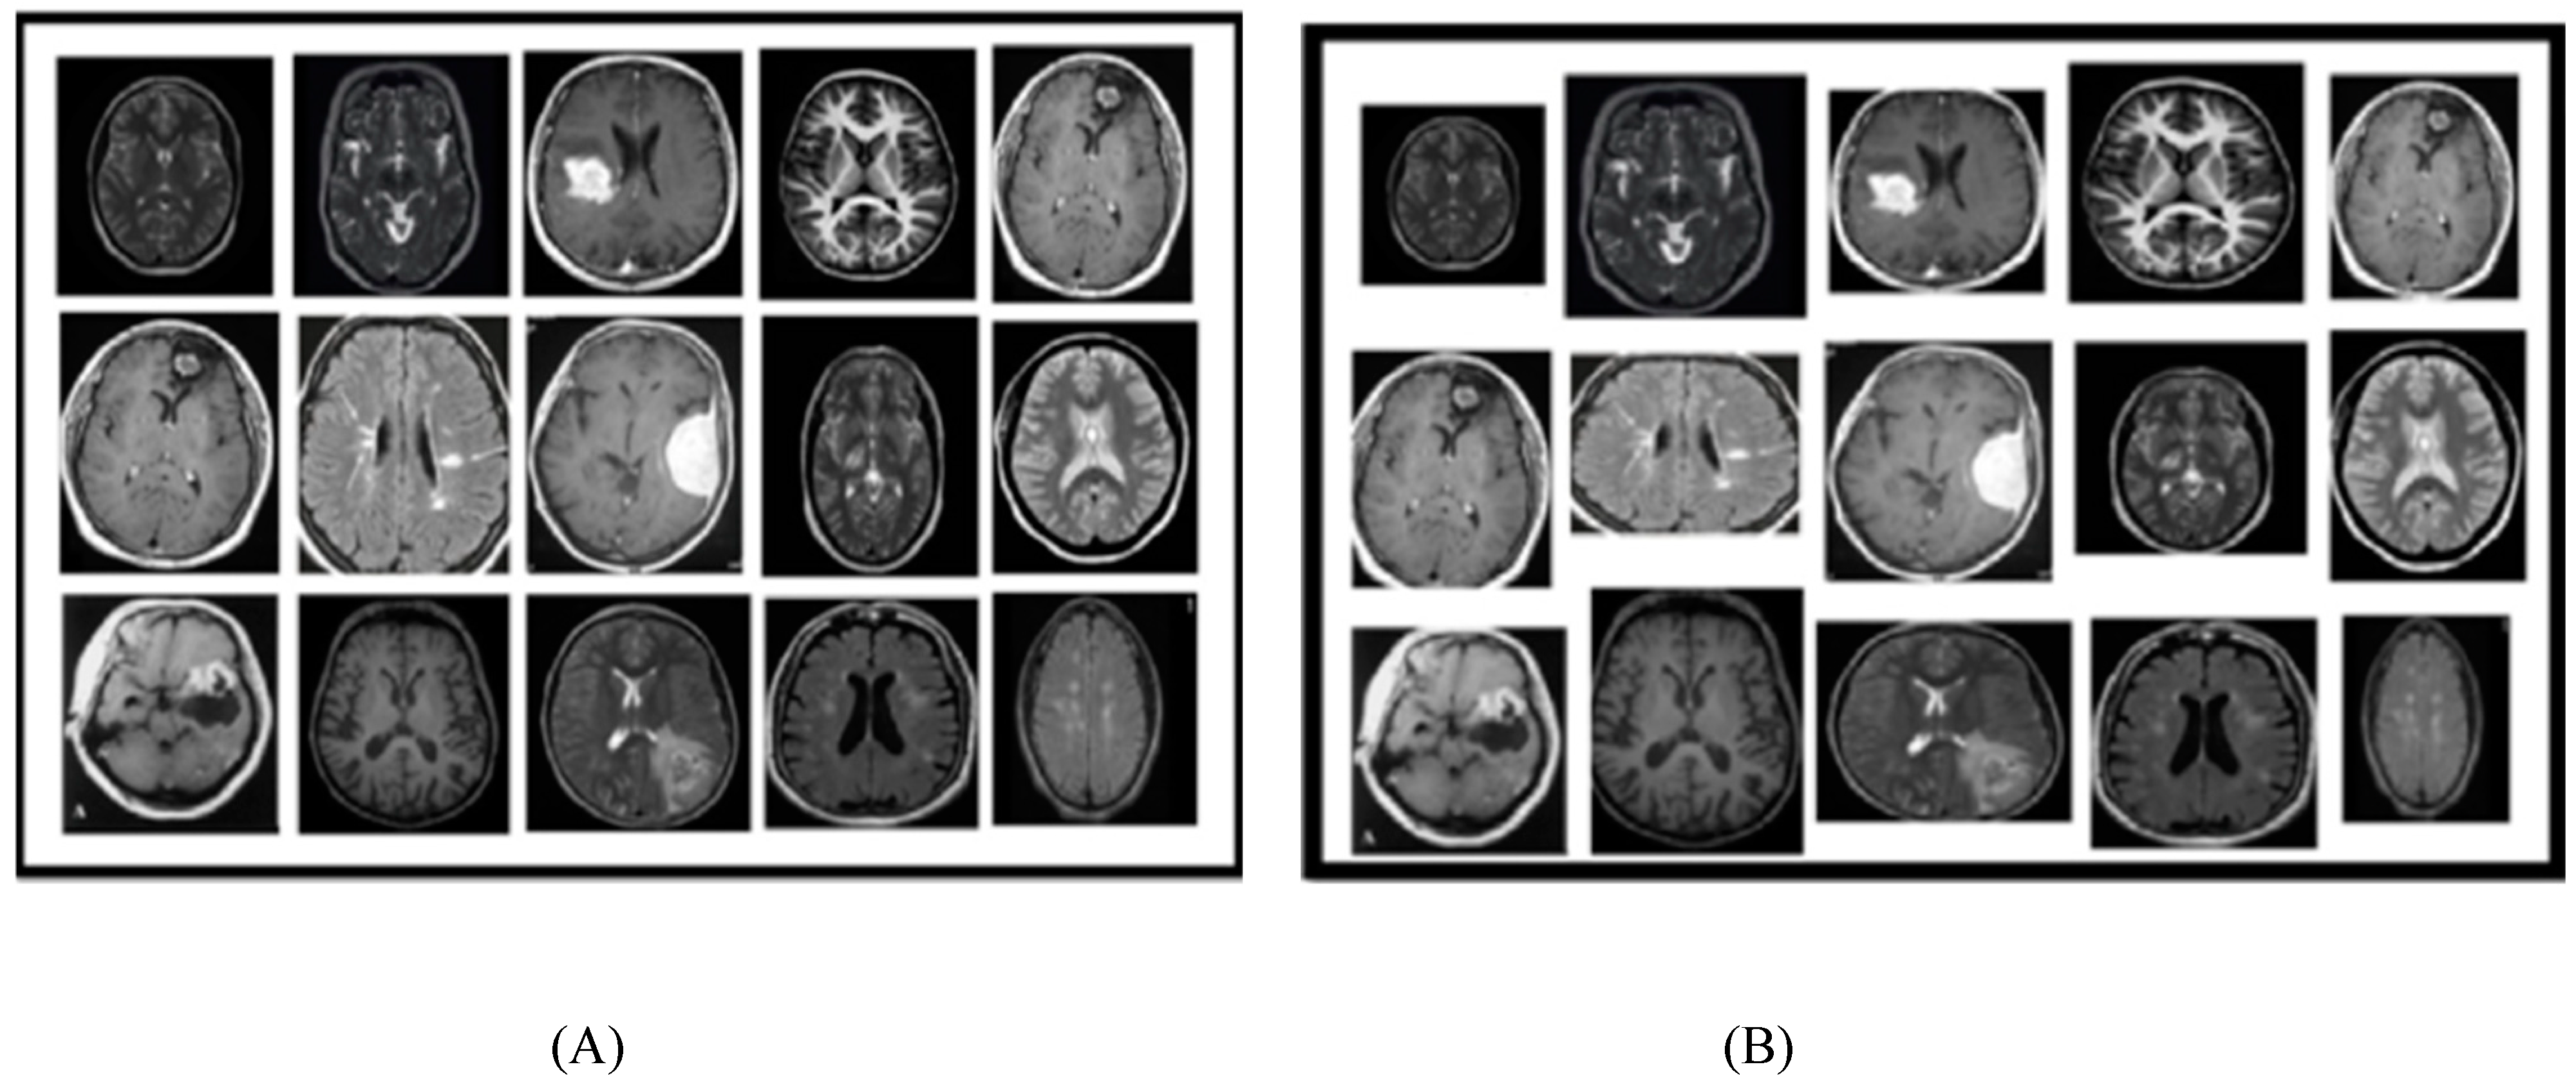
Figure 5.
Comparative analysis of ML Techniques on the basis of Accuracy.
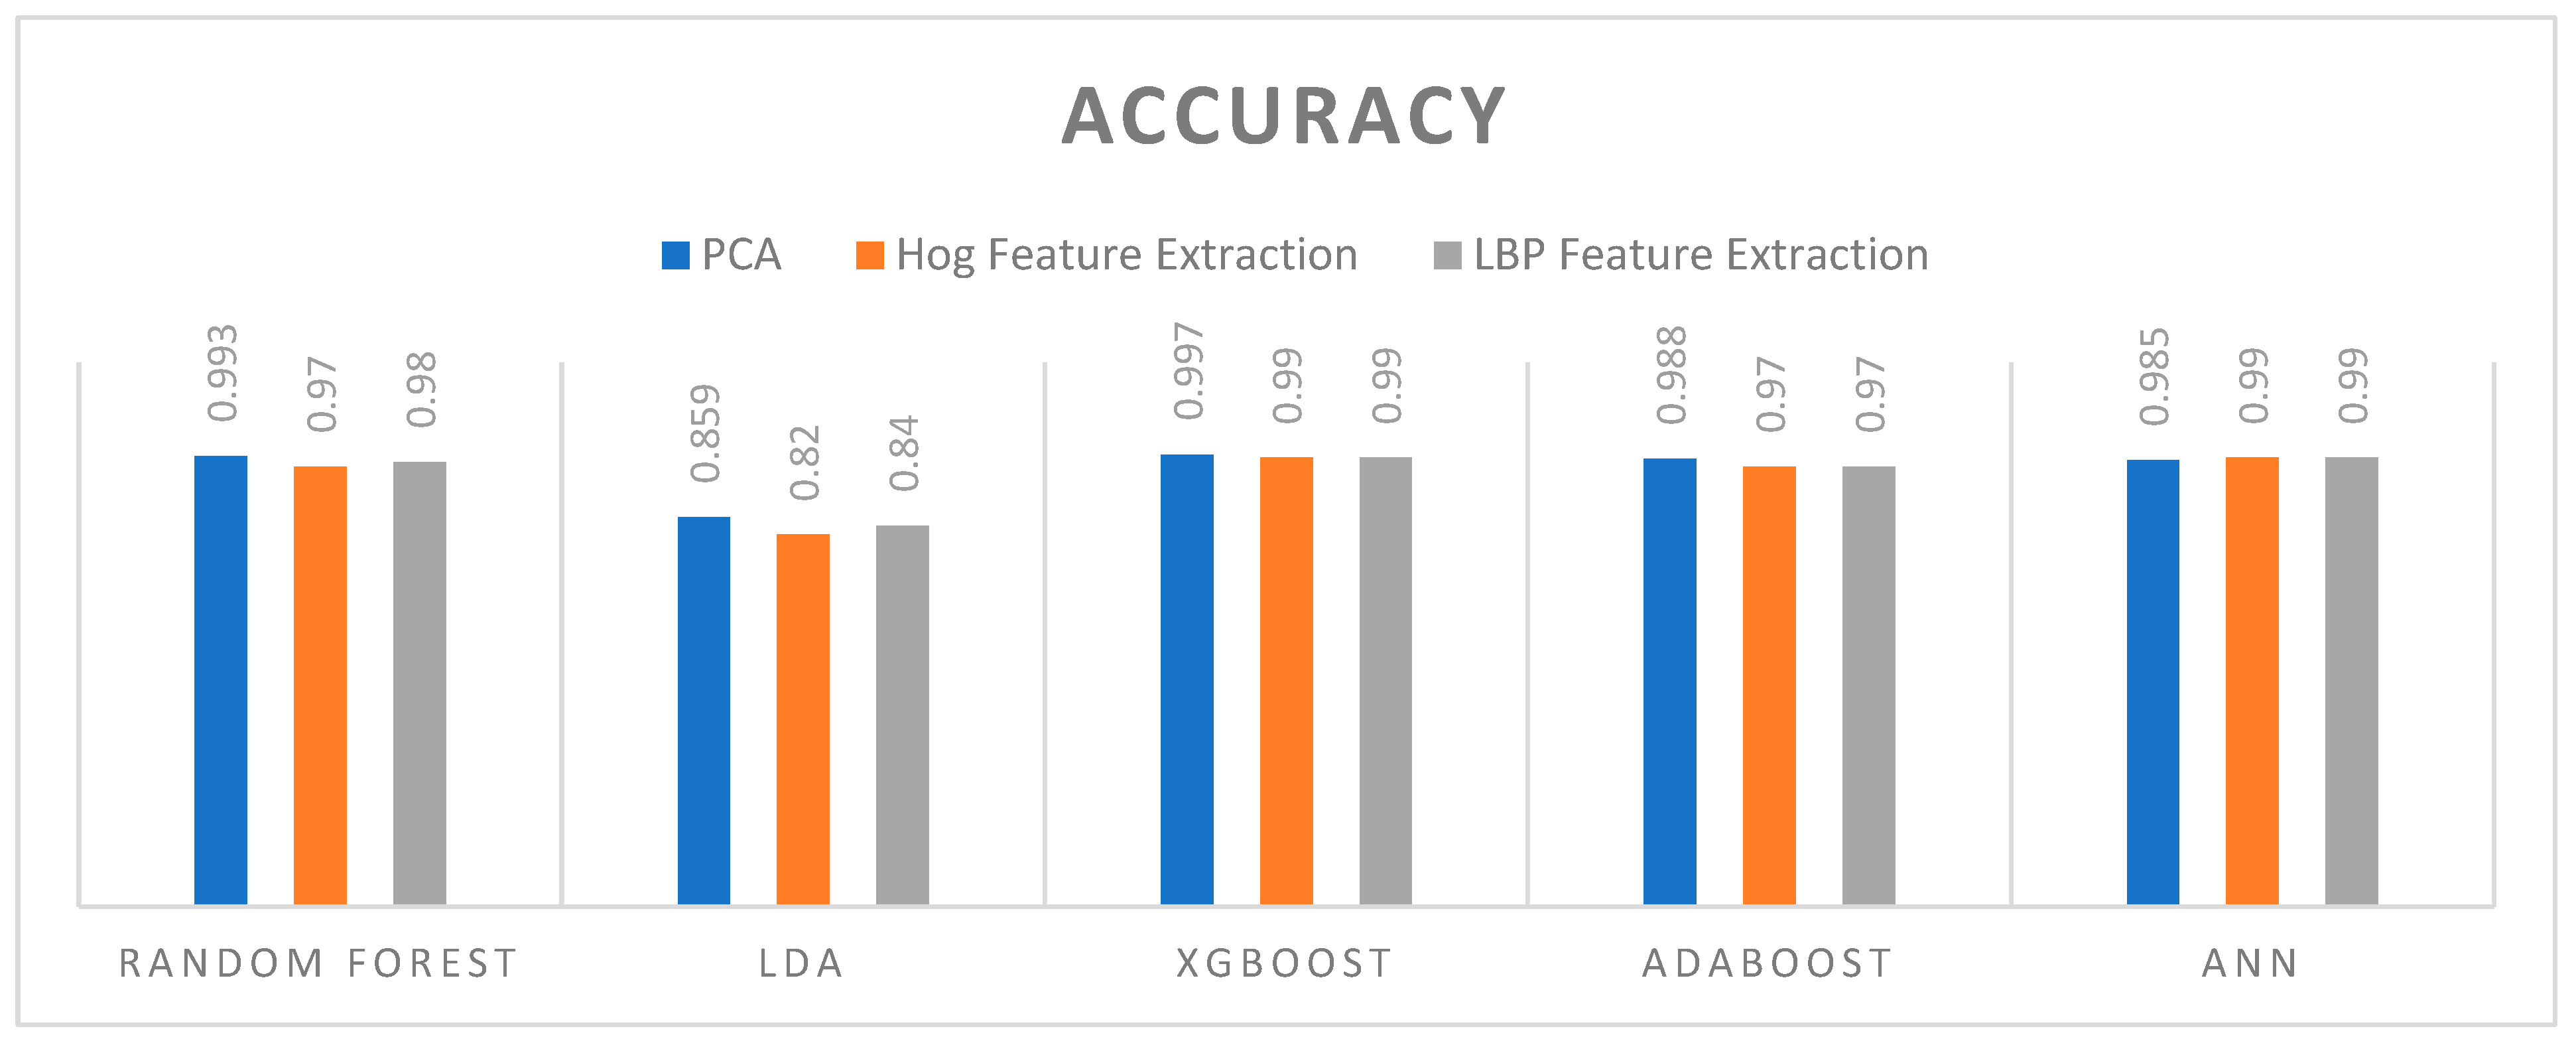
Figure 6.
Comparative analysis of ML Techniques on the basis of sensitivity.
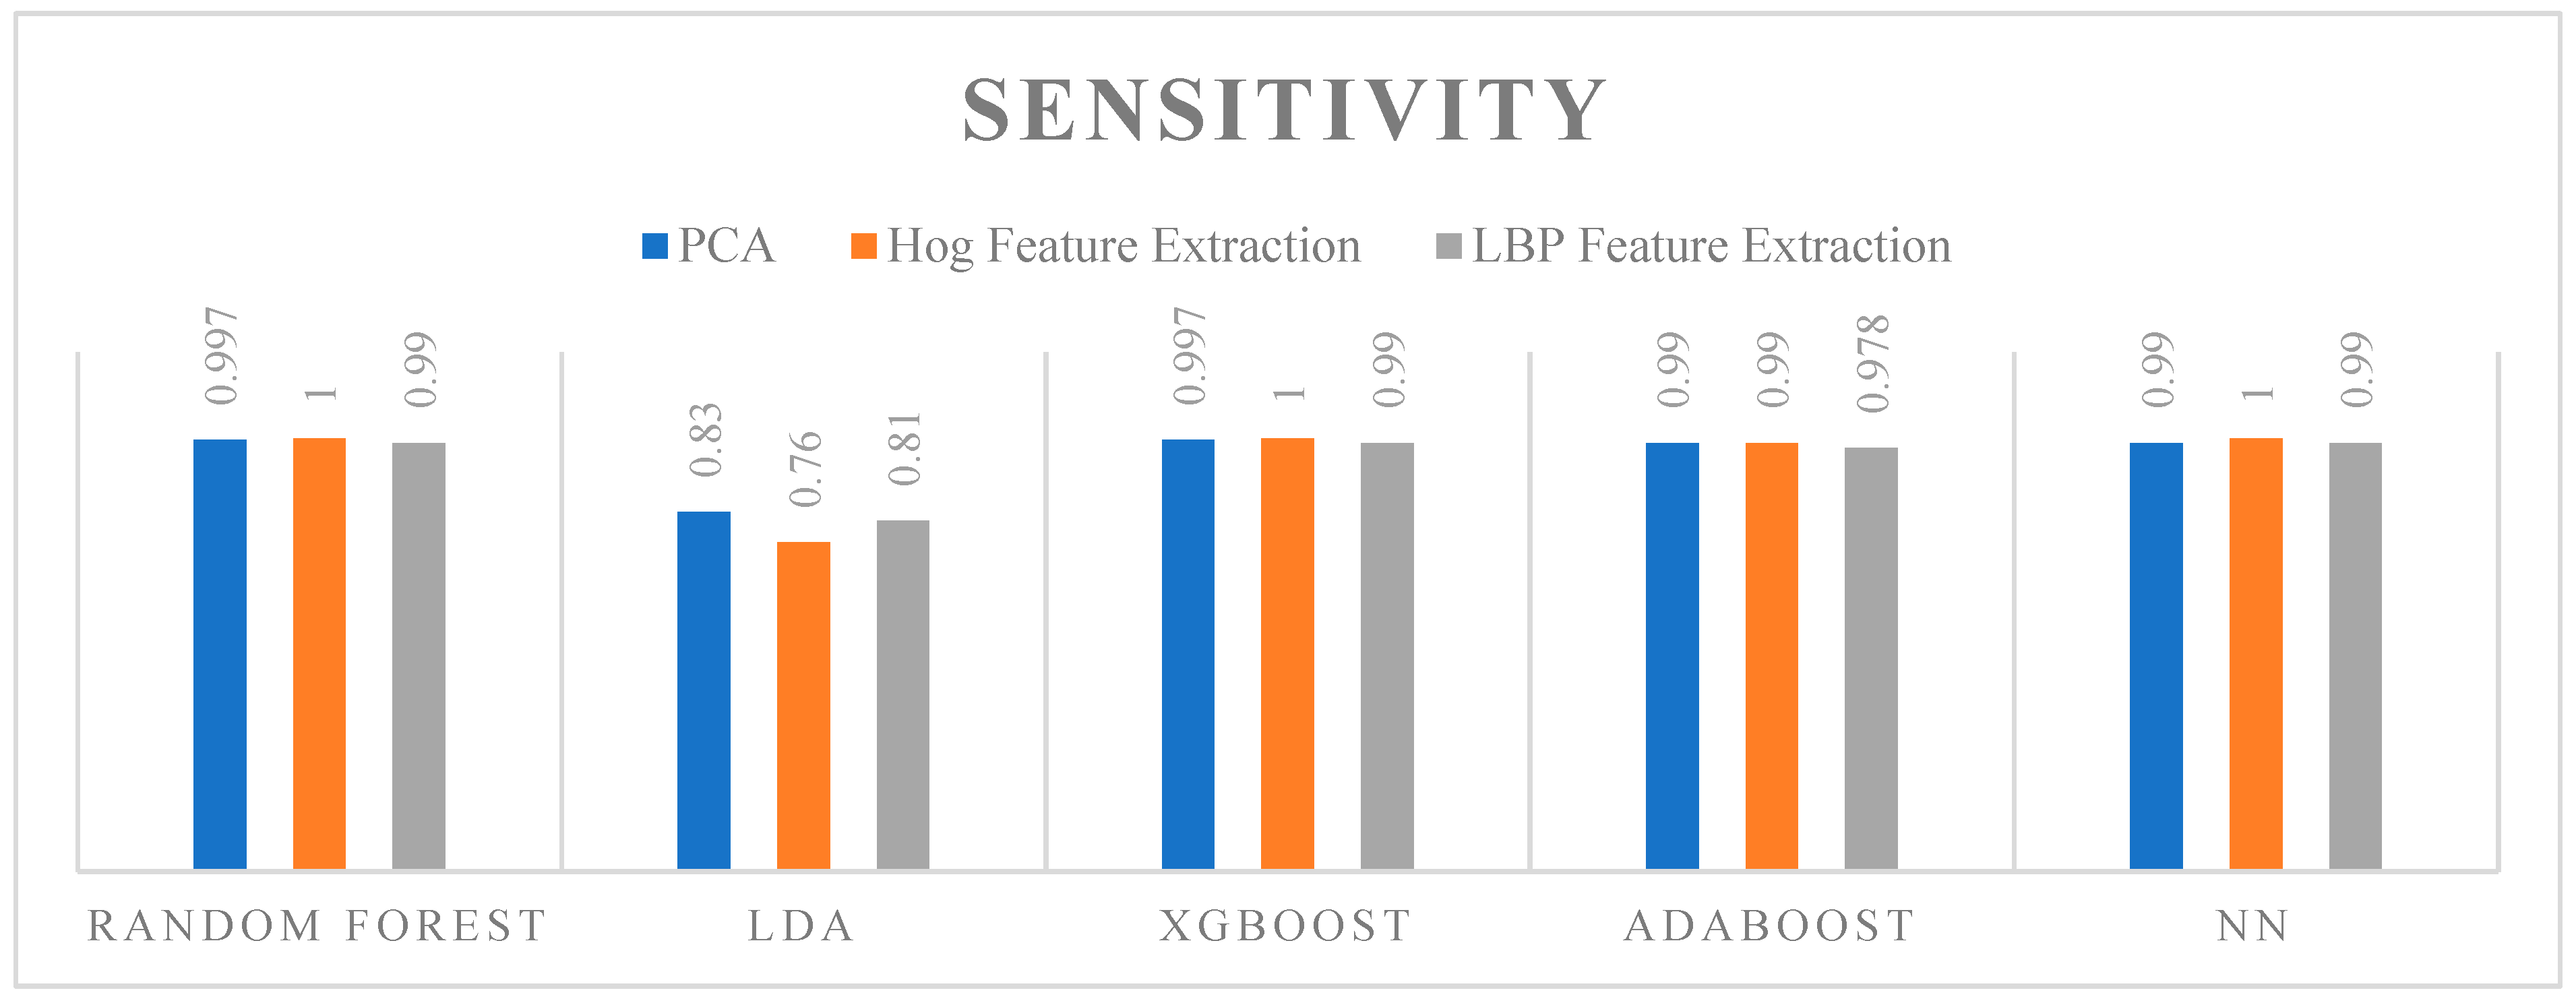
Figure 7.
Comparative analysis of ML Techniques on the basis of Specificity.
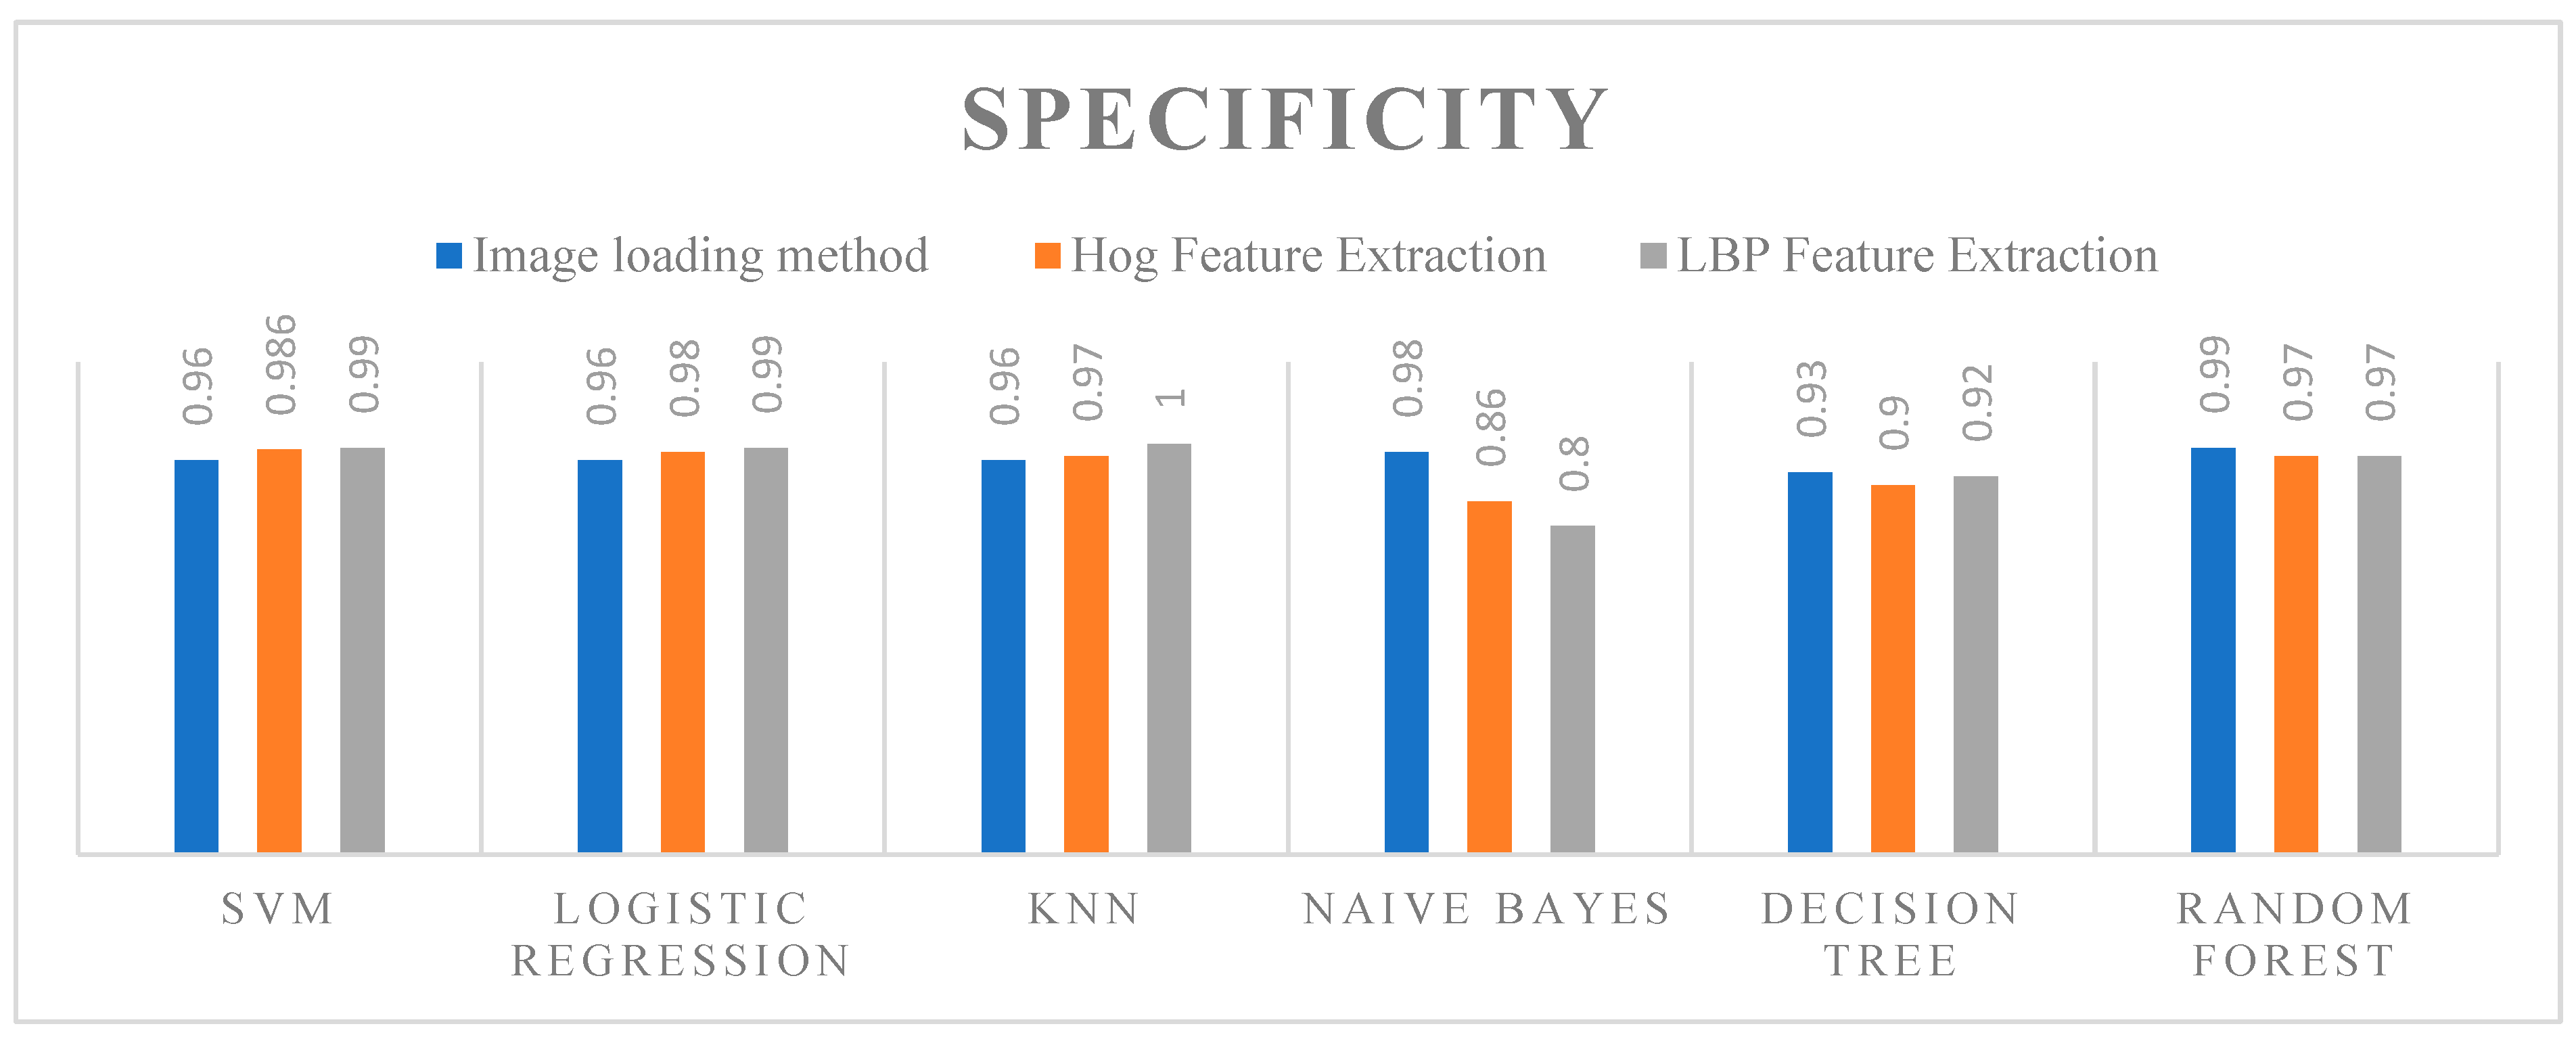
Figure 8.
Comparative analysis of ML Techniques on the basis of Precision.
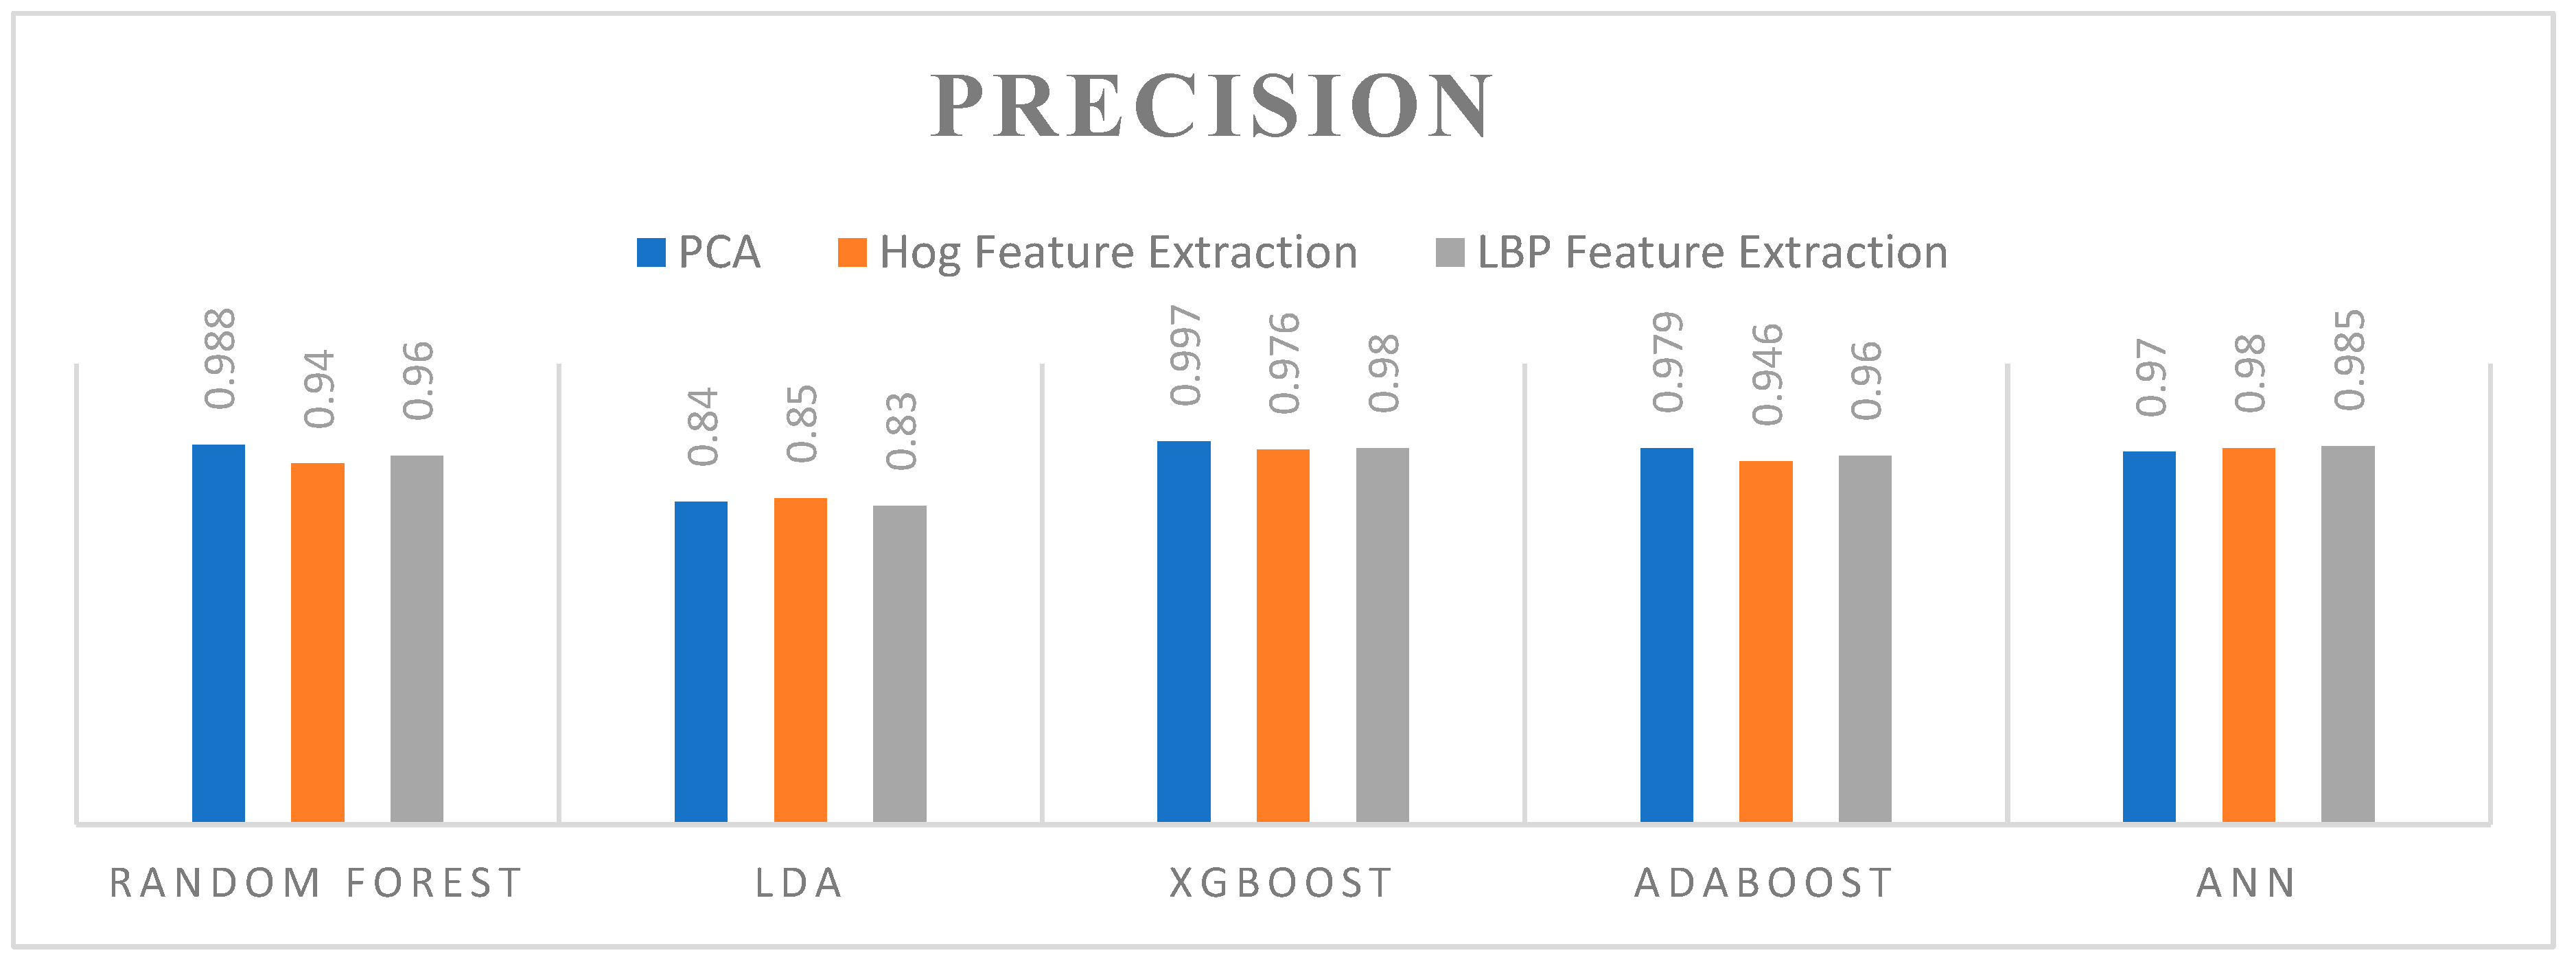
Figure 9.
Comparative analysis of ML Techniques on the basis of Elapsed Time.
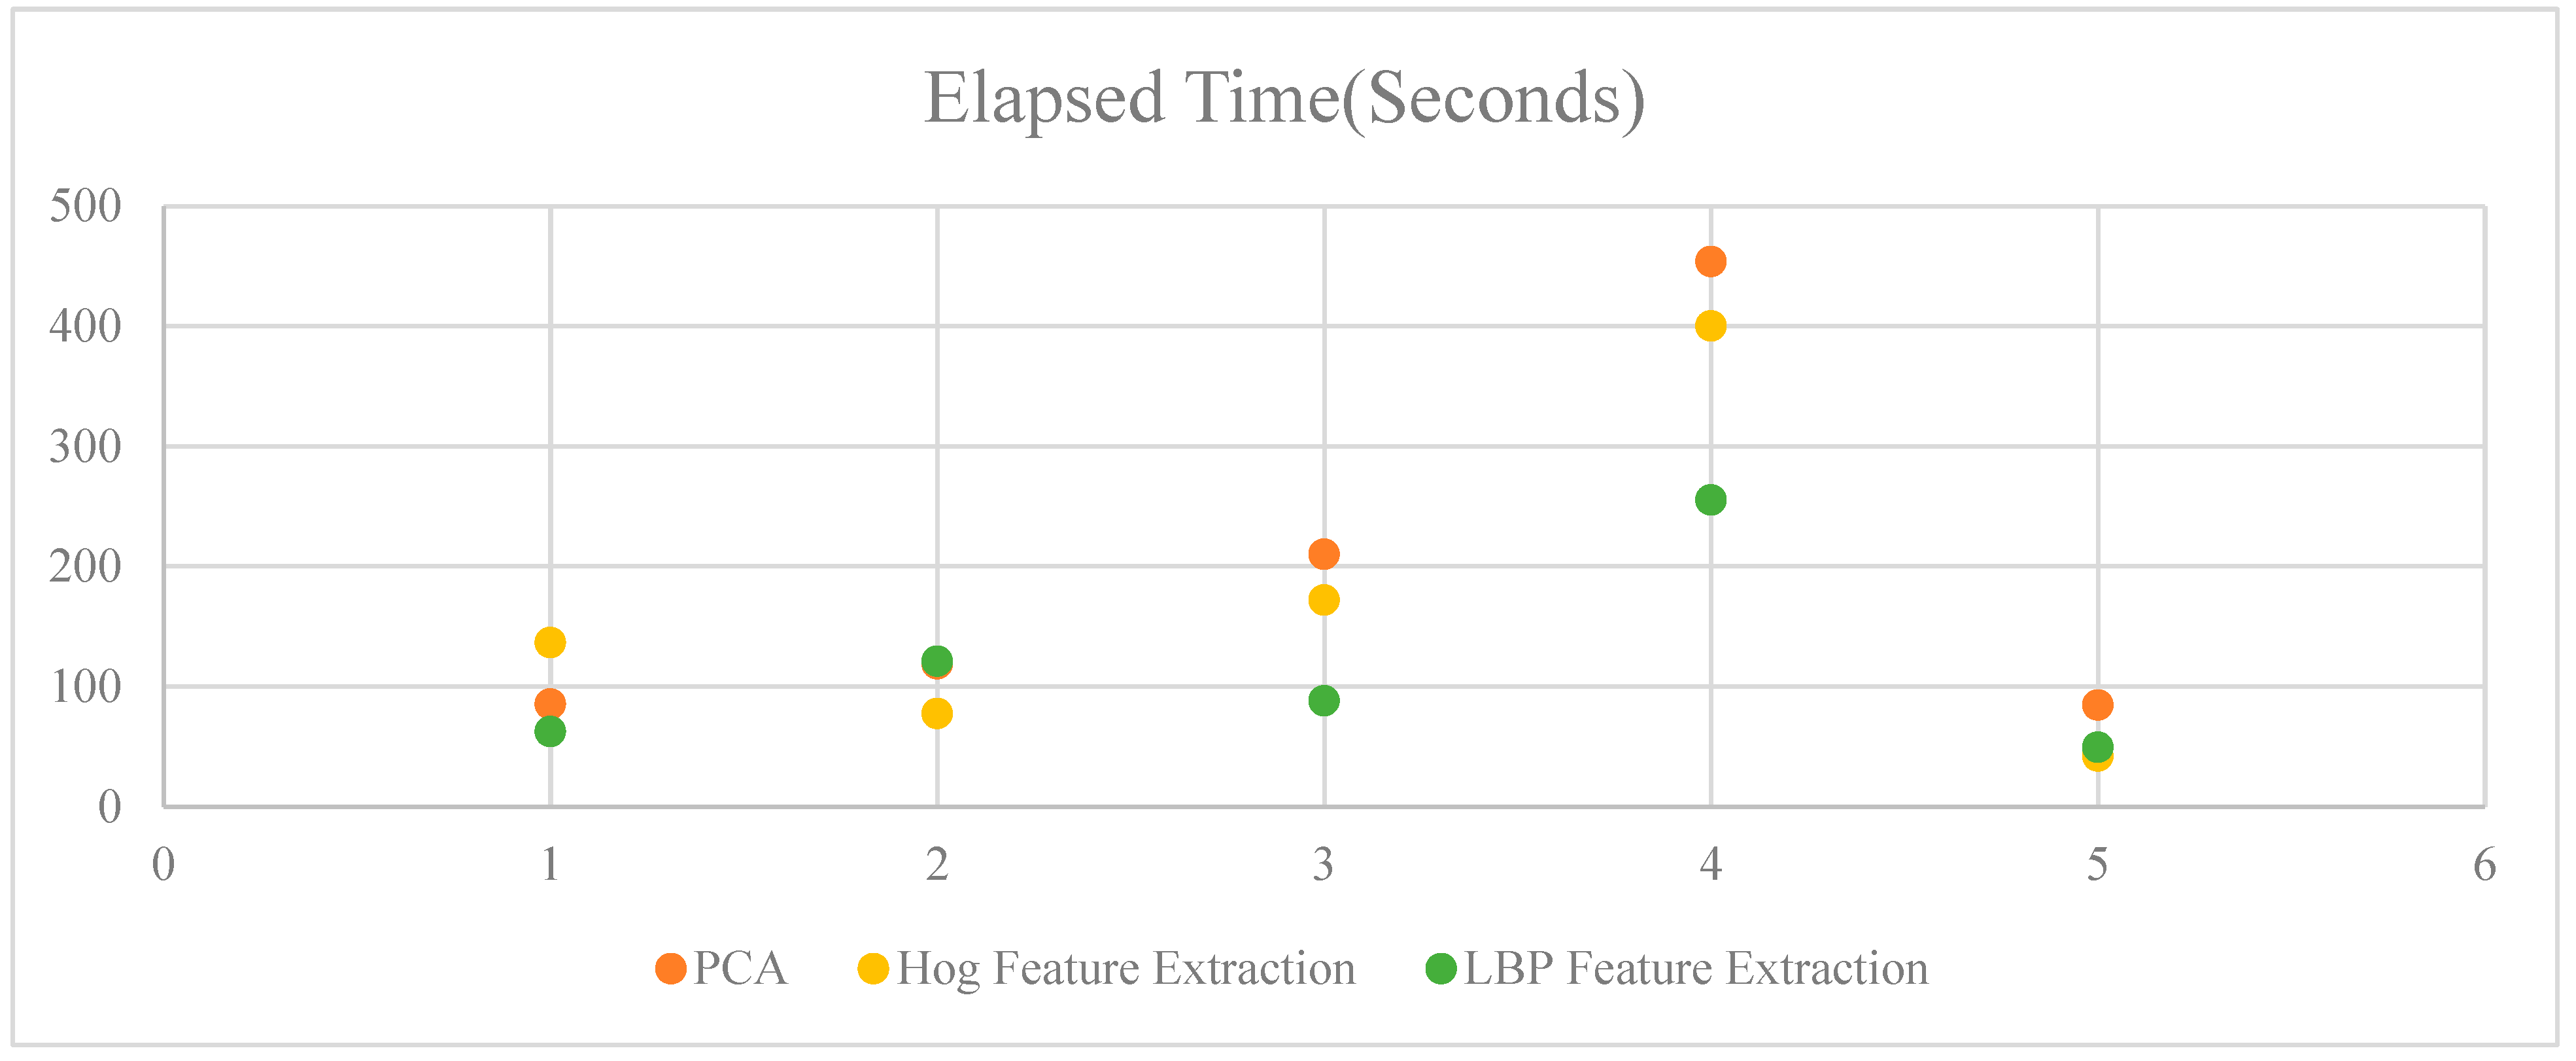
Figure 10.
ROC curves for the different machine learning algorithms and feature extraction methods.

| Methods | PCA Feature Extraction | Hog Feature Extraction | LBP Feature Extraction | |||||||||
| TP | TN | FP | FN | TP | TN | FP | FN | TP | TN | FP | FN | |
| RF | 333 | 4 | 1 | 447 | 319 | 18 | 0 | 448 | 325 | 12 | 2 | 446 |
| LDA | 285 | 52 | 58 | 390 | 289 | 48 | 91 | 357 | 282 | 55 | 66 | 382 |
| XGBoost | 336 | 1 | 1 | 447 | 329 | 8 | 0 | 448 | 331 | 6 | 2 | 446 |
| Adaboost | 330 | 7 | 2 | 446 | 319 | 18 | 2 | 446 | 326 | 11 | 7 | 441 |
| ANN | 328 | 9 | 2 | 446 | 330 | 7 | 0 | 448 | 332 | 5 | 2 | 446 |
Table 2.
Comparative analysis with other research works.
| Ref | Dataset | Model | Accuracy |
|---|---|---|---|
| Tseng et al.[27] | 250 MRI Images | XGBoost, Naive Bayes, ID3 | 97% (XGBoost) |
| Zhengyu et al.[54] | REMBRANDT | Decision Tree (DT),SVM, KNN and NN | 95.9% (NN) |
| Rinesh et al.[55] | Kaggle | k-NN, DNN,PSO, LSVM, and DCNN | 95.30 %(DNN) |
| Saleh et al.[56] | BRATS 2016 | SVM, ANFIS, k-NN, Random Forest, Adaboost, CDT | 95 % (CDT) |
| Uvaneshwari et al.[57] | Not Mentioned | TDC-MOML (XG-Boost) | 97.83% (XGBoost) |
| Santos et al.[58] | Kaggle | RF, KNN, SVM, XGBoost, CatBoost, Extra Trees, Naive Bayes | 98.00 % (Extra Trees) |
| Shilaskar et al.[59] | Not Mentioned | SVM, Gradient Boost, KNN, XG Boost, and LR | 92.02%(XGBoost) |
| Guerroudji et al.[60] | Not Mentioned | Bayesian network SVM, MLP, KNN, RF, DT, XGBoost, LGBM, Gaussian Process, and RBF SVM. | 98%( Bayesian network) |
| Joo et al.[61] | 538 cases (300 glioblastomas, 73 lymphomas, and 165 metastases) | LASSO, Adaboost, and SVM with linear kernal | 76.3%( ensemble classifier) |
| Islam et al.[62] | figshare, SARTAJ,Br35H | InceptionV3, VGG19, DenseNet121, and MobileNet. | 99.60%(MobileNet) |
| Hamd et al.[63] | 6435 MR images | Gradient boosting, LR, Random Forest and ANN | 98.7%(ANN) |
| Raghuwanshi et al.[64] | BRATS | KNN,LR, VGG19, Inception V3 | 95.43%( Inception V3) |
| This Work | Kaggle | RF, XGBoost, AdaBoost, LDA, ANN | 99.3 %(RF) |
Disclaimer/Publisher’s Note: The statements, opinions and data contained in all publications are solely those of the individual author(s) and contributor(s) and not of MDPI and/or the editor(s). MDPI and/or the editor(s) disclaim responsibility for any injury to people or property resulting from any ideas, methods, instructions or products referred to in the content. |
© 2024 by the authors. Licensee MDPI, Basel, Switzerland. This article is an open access article distributed under the terms and conditions of the Creative Commons Attribution (CC BY) license (http://creativecommons.org/licenses/by/4.0/).
Copyright: This open access article is published under a Creative Commons CC BY 4.0 license, which permit the free download, distribution, and reuse, provided that the author and preprint are cited in any reuse.


