
Submitted:
22 July 2025
Posted:
23 July 2025
You are already at the latest version
Abstract
Muscle fatigue is a critical factor influencing athletic performance in soccer. The aim of the present study was to investigate changes in isokinetic torque and power of lower limbs, in young female soccer players, in training microcycle of competitive season. The sample consisted of eleven female soccer players U17 (age: 16.3 ± 0.8 years, height: 166.4 ± 6.4 cm, body weight: 64.7 ± 11.7 kg) who competed in the 3rd national division championship. Participants knee extensors/flexors muscles were assessed in three concentric angular speeds (60°/s, 180°/s, 300°/s) and in counter movement jump, 72 hours before 24, 48 and 72 hours after the match. Statistically significant differences were revealed (F = 5,681, p = 0.038) in isokinetic assessment. Extensors significantly decreased at 60°/s between initial measurements and 48 hours after the match (p = 0.008), as well as 48 to 72 hours postmatch (p = 0.017). Flexors significantly decreased between the measurements at 24 to 48 hours at 300°/s (p = 0.025). Analysis of the Counter Movement Jump (CMJ) data revealed that both CMJ with and without arm swing had no statistically significant differences in performance between all four measurements. Knee muscles isokinetic assessment is a sensitive method for detecting post-match muscle fatigue. Structuring of training microcycle should consider the recovery time-lines and the physiological characteristics of female soccer players to optimize performance.
Keywords:
isokinetic assessment
; knee extensors muscles
; knee flexors muscles
; CMJ
1. Introduction
The evaluation of muscular strength is a critical component in profiling athletic performance, particularly for identifying muscular imbalances and deficits that may compromise functional capacity or increase injury risk. These muscular disparities play a substantial role in both performance enhancement and injury prevention across various athletic populations [1]. Over the past few decades, isokinetic assessment has emerged as a widely utilized method for evaluating muscular strength and balance, primarily due to the capacity of isokinetic dynamometers to produce reliable and valid data [2]. Changes in isokinetic torque, work and power parameters are closely related to changes in the functional performance of the athlete [3]. Muscular assessment with an isokinetic dynamometer will be useful in the process of prevention, training and rehabilitation of athletes [4]. The isokinetic assessment and consequently the capacity to quantify muscle performance of the athletes is particularly crucial in high-performance sports, as it allows coaches, trainers, and sports scientists to implement targeted, evidence-based interventions. Specific and functionally relevant training programs for the lower limbs can be designed based on these assessments, enhancing both performance outcomes and injury resilience [3].
In recent years, the global participation of women in soccer has increased markedly, with FIFA estimating over 40 million female players actively engaged in the sport worldwide [5]. This surge in female participation in soccer boosted the interest of researchers, regarding the physiological requirements of a female soccer match [6,7]. However, the majority of studies have investigated the effect of fatigue, caused by the match, in the ratio of (H) eccentric/(Q) concentric in male soccer players [8,9,10]. Several field-based intermittent protocols in treadmill, that simulate a soccer match, appear to cause significant reductions in the H/Q ratio, ranging from 9.3% to 29.8% in amateur and professional soccer players depending on angular velocity (typically between 120°/s and 300°/s) [8,9]. More recent studies have used field protocols which better mimic actual match play conditions [10]. The researchers showed significant decreases in the ratio (H) eccentric/(Q) eccentric ranging from 14.4% to 17.7% in angular velocities between 60-180°/s [8,10]. Consequently, effective recovery is essential, especially when time between the matches is short. It is necessary to understand all the physiological changes that occur over time after a female soccer match in order to develop effective strategies that will accelerate the recovery process [6].
CMJ assessments are widely used to evaluate lower-limb power output, monitor muscular strength, assess training efficacy, and track the progression of neuromuscular recovery [11]. CMJ performance is influenced by multiple physiological and biomechanical factors, including maximal muscle power, coordination of the upper and lower limbs, and the stretch-shortening cycle [12]. Although CMJ provides valuable insights into neuromuscular status, it remains unclear which specific jump metrics are the most sensitive indicators of fatigue [13]. Most of CMJ analyses are limited to the values of height, maximum and average power which are related to the concentric phase of the jump [14,15]. Furthermore, the easy implementation and low cost of CMJ application allows for repeated measurements of many athletes in a short period of time.
Previous researchers have examined the CMJ reliability using data from just one jump in each assessment [14,16,17]. At the same time, other studies have shown that multiple jumps increase the reliability of CMJ measurement which can improve the evaluation of neuromuscular fatigue [18]. The usual CMJ analyses overlook the performance in the eccentric jump phase, although it is an important factor of stretch-shortening cycle and neuromuscular function [19]. Many studies have shown a significant decrease in jump performance after a simulated match play [20] while others noticed no change right after the game compared to the initial measurements [21]. These findings underline the complexity of assessing neuromuscular fatigue and suggest that a more thorough analysis of CMJ will provide a better illustration of fatigue and its recovery associated with neuromuscular changes.
The purpose of the present study was to investigate the alterations in isokinetic muscular torque and power of lower limbs in young female soccer players during a period of four competitive season microcycles. Specifically, the research intended to examine the course of recovery at 24, 48 and 72 hours after a match in young amateur female soccer players. Given the scarcity of research focusing on amateur or youth female soccer players, this study provides novel insights into sex- and age-specific recovery.
It was hypothesized that isokinetic muscle torque of both the quadriceps (knee extensors) and hamstrings (knee flexors) would exhibit significant reductions at 24-, 48-, and 72-hours post-match in young female soccer players. Muscular power would also decline at the same post-match intervals.
2. Materials and Methods
2.1. Experimental Design
This study employed a repeated-measures design conducted during four matches of the competitive season. This period was chosen to ensure that the athletes were still subject to high training and match loads, thereby closely simulating the demands of competitive soccer. Each participant abstained from any physical training or strenuous activity for 48 hours prior to the initial testing session to ensure a rested baseline. Physical activity levels were controlled 72 hours before each match to minimize external confounding factors. Following each official match (held every 7 days), testing sessions were conducted at three post-match intervals: 24, 48, and 72 hours. Only outfield players (excluding goalkeepers) who completed the full duration of each match were included in the analysis. To preserve the validity of the results, participants were instructed to refrain from any physical activity, including team practices, individual training, or school sports, throughout the testing period.
This procedure was repeated across four consecutive matches to ensure an adequate sample size and allow for within-subject comparisons across multiple recovery phases.
2.2. Participants
A total of 11 healthy young female soccer players (U17; age: 16.3 ± 0.8 years; height: 166.4 ± 6.4 cm; body mass: 64.7 ± 11.7 kg; training experience: 5.5 ± 1.8 years) competing in the third national division were recruited. Inclusion criteria were: a) Minimum of three years of organized soccer training, b) No musculoskeletal injuries in the preceding six months, c) No use of performance-enhancing supplements or medications within the last six months, d) Full participation in each selected match (90 minutes of playtime) e) participation in ≥4 training sessions per week, f) Voluntary participation with written informed consent from parents or legal guardians.
All participants and their guardians received verbal and written explanations of the study's purpose, procedures, and potential risks and were informed that they could withdraw at any time from the study. The study was conducted in accordance with the Declaration of Helsinki and received ethical approval from the local Institutional Review Board (Protocol No. 226/2024).
2.3. Description of the Instruments
For data collection were used: to record somatometric characteristics (height and weight), telescopic height rod with scale (Seca 220e; Gmbh & Co, Hamburg, Germany), Myotester (Myotest SA Switzerland) to evaluate CMJ without arm swing and CMJ with arm swing and Cybex NORM dynamometer (Cybex, division of Lumex, Inc., Ronkonkoma, New York, USA) for the isokinetic evaluation of lower limbs.
2.4. Description of the Tests
2.4.1. Counter Movement Jump (CMJ)
In the CMJ evaluation test: a belt was placed in the waist of the female athlete, on which the Myotester (Myotest SA, Switzerland) device was applied. The athlete, after the sound stimulus, made two jumps with preparatory movement without arm swing. The same process was repeated with arm swing too. The best of the two jumps (jump height in cm) was selected for all analyses.
2.4.2. Isokinetic Evaluation
In the isokinetic evaluation test (knee extension/flexion in a seated position), the participants were positioned on the isokinetic dynamometer chair and stabilized with straps. The placement of the examinees was based on the instructions of the Humac Norm user´s manual for the assessment of knee extension/flexion from a sitting position. A concentric protocol in three angular velocities of 60°, 180°, 300°/s was selected. The range of motion of knee joint and the anatomical zero position, were determined and the gravity correction for the lower limb was recorded. After these procedures the participants performed three maximal-effort knee extension-flexion repetitions, twice for each angular velocity (60°, 180°, 300°/s) with an intermediate rest of 60" between each set and each angular velocity. With the same sequence, the procedure was performed on the other leg too. The absolute peak torque (in Nm) and the relative peak torque (in Nm/BW) for knee extensors and for knee flexors muscle groups were selected for all analyses.
2.5. Measurement Procedure
All measurement sessions were conducted between 3:00 and 5:00 p.m. to account for potential diurnal variations in neuromuscular performance. The initial measurements performed with the assumption that all the participants were free from fatigue (in a rested state). Before testing, each athlete completed a standardized 10 ́ warm-up that included 5 ́ of cycling at low intensity on the cycle ergometer (Monark 839E, Monark Exercise AB, Sweden) and a 5 ́stretching focused on the lower limbs. The first test performed was the CMJ, assessed with a Myotester equipment. Each participant performed two jumps without arm swing and two jumps with arm swing with a 2 ́ intermediate rest. The second and last test was the isokinetic assessment. After the participant was placed on the dynamometer, the measurement protocol was implemented, which included three knee flexion-extension attempts, as described above. The tests as well as the measurement protocols were performed in the same sequence at 24, 48 and 72 hours after the match.
2.6. Statistical Analysis
All statistical analyses were performed using the statistical package IBM SPSS Statistics for Windows, Version 25.0. Armonk, NY: IBM Corp. Descriptive statistics were performed to calculate the averages and standard deviations. Moreover, a test for normal distribution (Shapiro-Wilk test) was applied (all variables were equally distributed). In addition, repeated measurements of variance analysis were performed [GLM Repeated Measures ANOVA: 3(speed)X4(time)X2(muscle groups)]. The level of statistical significance was set at p < 0.05.
3. Results
The analysis of isokinetic assessment data showed an interaction between the velocity, the muscle group and the time. A statistically significant difference revealed between the variables (F = 5.681, p = 0.038). In terms of absolute values, there were statistically significant differences at different time points in the anterior thigh muscles at 60°/s. More specifically, the initial measurements compared to those 48 hours after the match (p = 0.008), as well as the 48 with 72 hours (p = 0.008, p = 0.017). However, there were no statistically significant differences between the four time points at both 180°/s and 300°/s. Regarding the posterior thigh muscles, there were statistically significant differences between the measurements at 24 and 48 hours only at 300°/s (p = 0.025) (Table 1 and Table 2, Figure 1 and Figure 2).
After analyzing the isokinetic assessment data relating to the body weight, an interaction occurred between the velocity, the muscle group and the time. A statistically significant difference revealed between the variables (F = 6.041, p = 0.034). Particularly, it appeared that at 60°/s the anterior thigh muscles had a statistically significant difference between the first measurement performed before the match compared to the measurement at 24 and 48 hours (p24 = 0.034, p48 = 0.005) (Table 3).
There was also a statistically significant difference in the anterior thigh muscles at 60°/s between 48 and 72 hours (p = 0.018). However, in the posterior thigh muscles at 60°/s there were no statistically significant differences between the four time points. The results were similar at 180°/s and 300°/s where there were no statistically significant differences in both anterior and posterior thigh muscles for any time moment (Table 4, Figure 3 and Figure 4).
Analysis of the CMJ data showed that in CMJ without arm swing there were no differences in the performance between the four measurements (Table 5).
The results for the CMJ with arm swing were similar, where minor differences between the height of the four jumps may have also appeared, but the analysis showed that they were not statistically significant (Table 6).
4. Discussion
The present study partially confirmed our initial hypotheses. Specifically, we observed a significant decline in the concentric maximal strength of the anterior thigh muscles in female soccer players following a match, particularly at slower angular velocities. Conversely, the strength of the posterior thigh muscles was diminished only at higher angular velocities on the day following the match.
Analysis of absolute isokinetic torque values revealed statistically significant differences over time in the anterior thigh muscles at 60°/s. Comparisons between baseline measurements and those taken 48 hours post-match indicated a reduction in torque production, attributable to delayed onset muscle fatigue resulting from match-related exertion. Furthermore, significant differences were observed between 48 and 72 hours post-match at 60°/s, suggesting a recovery of strength levels to baseline.
These findings align with those of Ascensão et al. (2008) [22], who assessed the isokinetic torque of knee flexors and extensors of the dominant leg at 90°/s in 16 male soccer players. The researchers found that the maximum torque of the anterior thigh muscles showed its greatest decrease at 48 hours. The above data came into conflict with the study of Silva et al. (2013) [23], where the participants performed maximum concentric isokinetic knee flexions and extensions at different time points at 90°/s. The researchers concluded that the changes in isokinetic strength at 24, 48 and 72 hours after the match were not statistically significant compared to the pre-game measurements. It was obvious that high-level soccer players, due to better training background, had a greater ability to manage the requirements of the match showing a smaller reduction in their performance [24]. On the other hand, in a study conducted on female soccer players were observed differences regarding the time point where the highest reduction of isokinetic torque occurred. Specifically, Andersson et al. (2008) [6] found that the maximum torque of knee extensors was significantly reduced at 5- and 21-hours post-match and returned to the initial levels at 27 hours after the match. Although literature on female athletes remains limited, prior research on male players suggests that decreases in strength post-match may result from impaired voluntary muscle contraction due to muscle shortening or fatigue mechanisms [25].
Regarding the anterior thigh muscles at higher angular velocities (180°/s and 300°/s), no significant differences were detected across the four measured time points. To date, no comparable studies have evaluated female soccer players at these velocities. However, Draganidis et al. (2015) [26] observed persistent reductions in concentric maximal torque at 180°/s in male amateur players up to 60 hours post-match, possibly influenced by continued training sessions and the higher physical stress encountered by non-professional athletes [24]. Concerning the posterior thigh muscles, significant differences were noted only between 24 and 48 hours at 300°/s, corroborating Andersson et al.’s (2008) findings in females where knee flexor torque was significantly reduced at 21 and 27 hours, with recovery by 51 hours [6].
When isokinetic torque was normalized to body weight, an interaction between angular velocity, muscle group, and time was evident. Specifically, anterior thigh muscles exhibited significant decreases at 60°/s at 24 and 48 hours compared to baseline, while no changes were detected at 180°/s and 300°/s. This is the first study to report such velocity-dependent recovery patterns in female players, limiting direct comparison. Posterior thigh muscles showed no significant alterations in relative torque across time points. Delextrat et al. (2011) [24] reported significant fatigue-induced reductions in relative torque of knee flexors following soccer-specific field tests (LIST) in female players, suggesting potential variability due to testing protocols
The analysis of countermovement jump (CMJ) data revealed no significant differences in performance at any time point, both without arm swing and with arm swing. This indicates that match play did not adversely affect lower limb power in young female soccer athletes. This finding contrasts with studies on male semi-professional players by Thomas et al. (2017) [27] and Nedelec et al. (2014) [28], who observed post-match decrements in CMJ performance persisting up to 72 hours.
Limited research exists on neuromuscular recovery in female soccer players; however, Hoffman et al. (2003) [21], documented CMJ reductions post-match across competitive levels in males [27,28]. Conversely, our findings concur with earlier research reporting no post-match impairment in jumping ability, possibly due to the intermittent nature of soccer allowing for adequate recovery between efforts [7]. Additionally, the younger age of participants may have facilitated more rapid neuromuscular recovery.
The observed dissociation between decreased isokinetic torque at low angular velocities and preserved CMJ performance is consistent with previous research indicating that isokinetic strength at slow speeds is not directly correlated with vertical jump performance, which involves higher knee angular velocities [29].
Several limitations of the present study should be considered when interpreting the findings. First, the sample size—both in terms of the number of matches analyzed and the number of participating athletes—was relatively small, which may limit the generalizability of the results. Also, participants’ nutritional habits during the recovery period were not monitored, despite the known influence of dietary intake on recovery and performance outcomes. The absence of dietary control introduces potential variability that may have affected individual recovery responses and test results.
5. Conclusions
This study elucidates the temporal changes in muscle torque and power following a competitive soccer match in young female players. The results demonstrate a significant reduction in concentric maximal strength of the anterior thigh muscles at slow angular velocities post-match, whereas posterior thigh muscle strength was diminished at higher velocities on the day following competition. These findings underscore the utility of isokinetic testing for the detection of match-induced muscular fatigue.
In contrast, CMJ assessments indicated that lower limb power was largely unaffected by match play, suggesting differential recovery patterns between muscle strength and explosive power in this population. Consequently, training and recovery protocols should be individualized to address the unique physiological responses of young female soccer players.
Future research is warranted to expand these findings, particularly focusing on larger cohorts and varying competitive levels, to inform the development of optimized, sex-specific training regimens and recovery strategies in female soccer.
5.1. Practical Applications
The present findings offer valuable insights for the structuring of training microcycles in female soccer. Based on the observed recovery timelines, maximal strength training sessions may be optimally scheduled approximately 72 hours post-match to ensure adequate neuromuscular recovery. Power-oriented training, as assessed through countermovement jump (CMJ) performance, may be safely implemented at any point within the microcycle following the match-day rest period, given the apparent resilience of explosive muscle function in the days after competition. Nonetheless, discrepancies with male soccer data, which suggest power deficits persisting up to 48 hours, highlight the need for further investigation into sex-specific recovery dynamics. Future studies with larger sample sizes are necessary to substantiate these preliminary recommendations and guide evidence-based training periodization for female athletes.
Author Contributions
Conceptualization, I.D., E.S., Y.M. and T.M.,; methodology, I.D., E.S., Y.M. and T.M.,; software, E.S., G.M. and N.K.; validation, E.S., G.M. and N.K.; formal analysis, E.S., G.M. and N.K.; investigation, I.D.; resources, I.D., E.S.; data curation, E.S., G.M. and N.K.; writing—original draft preparation, I.D.; writing—review and editing, I.D., E.S., Y.M., N.K. and T.M.; visualization, E.S., Y.M., A.Μ., N.K. and T.M.; supervision, E.S. Y.M., G.M. and T.M.. All authors have read and agreed to the published version of the manuscript.
Funding
This research received no external funding.
Institutional Review Board Statement
The study was conducted in accordance with the Declaration of Helsinki, and approved by the Institutional Ethics Committee of Department of Physical Education and Sport Science of the ARISTOTLE UNIVERSITY OF THESSALONIKI, (approval number 226/2024).
Informed Consent Statement
Informed consent was obtained from all subjects involved in the study.
Conflicts of Interest
The authors declare no conflicts of interest.
References
- Terreri, A.S.A.; Greve, J.; Amatuzzi, M.M. Avaliação isocinética no joelho do atleta. Revista brasileira de medicina do esporte 2001, 7, 62–66. [Google Scholar] [CrossRef]
- Petersen, J.; Hölmich, P. Evidence based prevention of hamstring injuries in sport. British journal of sports medicine 2005, 39, 319–323. [Google Scholar] [CrossRef] [PubMed]
- Zabka, F.F.; Valente, H.G.; Pacheco, A.M. Avaliação isocinética dos músculos extensores e flexores de joelho em jogadores de futebol profissional. Revista brasileira de medicina do esporte 2011, 17, 189–192. [Google Scholar] [CrossRef]
- Fonseca, S.T.D.; Ocarino, J.M.; da Silva, P.L.; Bricio, R.S.; Costa, C.A.; Wanner, L.L. Caracterização da performance muscular em atletas profissionais de futebol. Revista Brasileira de Medicina do Esporte 2007, 13, 143–147. [Google Scholar] [CrossRef]
- Fédération Internationale de Football Association. Women’s football member associations survey report. Zurich, Switzerland: Fédération Internationale de Football Association 2019. Available online: https://img.fifa.com/image/upload/nq3ensohyxpuxovcovj0.pdf.
- Andersson, H.M.; Raastad, T.; Nilsson, J.; Paulsen, G.; Garthe, I.N.A.; Kadi, F. Neuromuscular fatigue and recovery in elite female soccer: Effects of active recovery. Medicine & Science in Sports & Exercise 2008, 40, 372–380. [Google Scholar]
- Krustrup, P.; Zebis, M.; Jensen, J.M.; Mohr, M. Game-induced fatigue patterns in elite female soccer. The Journal of Strength & Conditioning Research 2010, 24, 437–441. [Google Scholar]
- Greig, M. The influence of soccer-specific fatigue on peak isokinetic torque production of the knee flexors and extensors. The American journal of sports medicine 2008, 36, 1403–1409. [Google Scholar] [CrossRef] [PubMed]
- Rahnama, N.; Reilly, T.; Lees, A.; Graham-Smith, P. Muscle fatigue induced by exercise simulating the work rate of competitive soccer. Journal of Sports Science 2003, 21, 933–942. [Google Scholar] [CrossRef] [PubMed]
- Small, K.; McNaughton, L.; Greig, M.; Lovell, R. The effects of multidirectional soccer-specific fatigue on markers of hamstring injury risk. Journal of science and medicine in sport 2010, 13, 120–125. [Google Scholar] [CrossRef] [PubMed]
- Peterson, M.D.; Alvar, B.A.; Rhea, M.R. The contribution of maximal force production to explosive movement among young collegiate athletes. The Journal of Strength & Conditioning Research 2006, 20, 867–873. [Google Scholar]
- Hopkins, W.G. Measures of reliability in sports medicine and science. Sports medicine 2000, 30, 1–15. [Google Scholar] [CrossRef] [PubMed]
- Taylor, K.; Chapman, D.; Cronin, J.; Newton, M.J.; Gill, N. Fatigue monitoring in high performance sport: A survey of current trends. J Aust Strength Cond 2012, 20, 12–23. [Google Scholar]
- Cormack, S.J.; Newton, R.U.; McGuigan, M.R.; Doyle, T.L. Reliability of measures obtained during single and repeated countermovement jumps. International journal of sports physiology and performance 2008, 3, 131–144. [Google Scholar] [CrossRef] [PubMed]
- Cormie, P.; McBride, J.M.; McCaulley, G.O. Power-time, force-time, and velocity-time curve analysis of the countermovement jump: Impact of training. The Journal of Strength & Conditioning Research 2009, 23, 177–186. [Google Scholar]
- McLellan, C.P.; Lovell, D.I.; Gass, G.C. The role of rate of force development on vertical jump performance. The Journal of Strength & Conditioning Research 2011, 25, 379–385. [Google Scholar]
- Sheppard, J.M.; Cormack, S.; Taylor, K.L.; McGuigan, M.R.; Newton, R.U. Assessing the force-velocity characteristics of the leg extensors in well-trained athletes: The incremental load power profile. The Journal of Strength & Conditioning Research 2008, 22, 1320–1326. [Google Scholar]
- Taylor, K.L.; Cronin, J.; Gill, N.D.; Chapman, D.W.; Sheppard, J. Sources of variability in iso-inertial jump assessments. International journal of sports physiology and performance 2010, 5, 546–558. [Google Scholar] [CrossRef] [PubMed]
- Nicol, C.; Avela, J.; Komi, P.V. The stretch-shortening cycle: A model to study naturally occurring neuromuscular fatigue. Sports medicine 2006, 36, 977–999. [Google Scholar] [CrossRef] [PubMed]
- Oliver, J.; Armstrong, N.; Williams, C. Changes in jump performance and muscle activity following soccer-specific exercise. Journal of sports sciences 2008, 26, 141–148. [Google Scholar] [CrossRef] [PubMed]
- Hoffman, J.R.; Nusse, V.; Kang, J. The effect of an intercollegiate soccer game on maximal power performance. Canadian journal of applied physiology 2003, 28, 807–817. [Google Scholar] [CrossRef] [PubMed]
- Ascensão, A.; Rebelo, A.; Oliveira, E.; Marques, F.; Pereira, L.; Magalhães, J. Biochemical impact of a soccer match—Analysis of oxidative stress and muscle damage markers throughout recovery. Clinical biochemistry 2008, 41, 841–851. [Google Scholar] [CrossRef] [PubMed]
- Silva, J.R.; Ascensão, A.; Marques, F.; Seabra, A.; Rebelo, A.; Magalhães, J. Neuromuscular function, hormonal and redox status and muscle damage of professional soccer players after a high-level competitive match. European journal of applied physiology 2013, 113, 2193–2201. [Google Scholar] [CrossRef] [PubMed]
- Delextrat, A.; Baker, J.; Cohen, D.D.; Clarke, N. Effect of a simulated soccer match on the functional hamstrings-to-quadriceps ratio in amateur female players. Scandinavian journal of medicine & science in sports 2013, 23, 478–486. [Google Scholar]
- Rampinini, E.; Bosio, A.; Ferraresi, I.; Petruolo, A.; Morelli, A.; Sassi, A. Match-related fatigue in soccer players. Medicine & Science in Sports & Exercise 2011, 43, 2161–2170. [Google Scholar] [CrossRef] [PubMed]
- Draganidis, D.; Chatzinikolaou, A.; Avloniti, A.; Barbero-Álvarez, J.C.; Mohr, M.; Malliou, P. . & Fatouros, I.G. Recovery kinetics of knee flexor and extensor strength after a football match. PLoS ONE 2015, 10, e0128072. [Google Scholar]
- Thomas, K.; Dent, J.; Howatson, G.; Goodall, S. Etiology and recovery of neuromuscular fatigue following simulated soccer match-play. Med Sci Sports Exerc 2017, 49, 955–964. [Google Scholar] [CrossRef] [PubMed]
- Nedelec, M.; McCall, A.; Carling, C.; Legall, F.; Berthoin, S.; Dupont, G. The influence of soccer playing actions on the recovery kinetics after a soccer match. The Journal of Strength & Conditioning Research 2014, 28, 1517–1523. [Google Scholar]
- Iossifidou, A.; Baltzopoulos, V.; Giakas, G. Isokinetic knee extension and vertical jumping: Are they related? Journal of sports sciences 2005, 23, 1121–1127. [Google Scholar] [CrossRef] [PubMed]
Figure 1.
Muscular torque of anterior thigh muscles at 60, 180, 300°/s, at the four different time points of measurement (means ± SD). *denotes a significant difference (p<0.05); **denotes a significant difference (p<0.01).
Figure 1.
Muscular torque of anterior thigh muscles at 60, 180, 300°/s, at the four different time points of measurement (means ± SD). *denotes a significant difference (p<0.05); **denotes a significant difference (p<0.01).
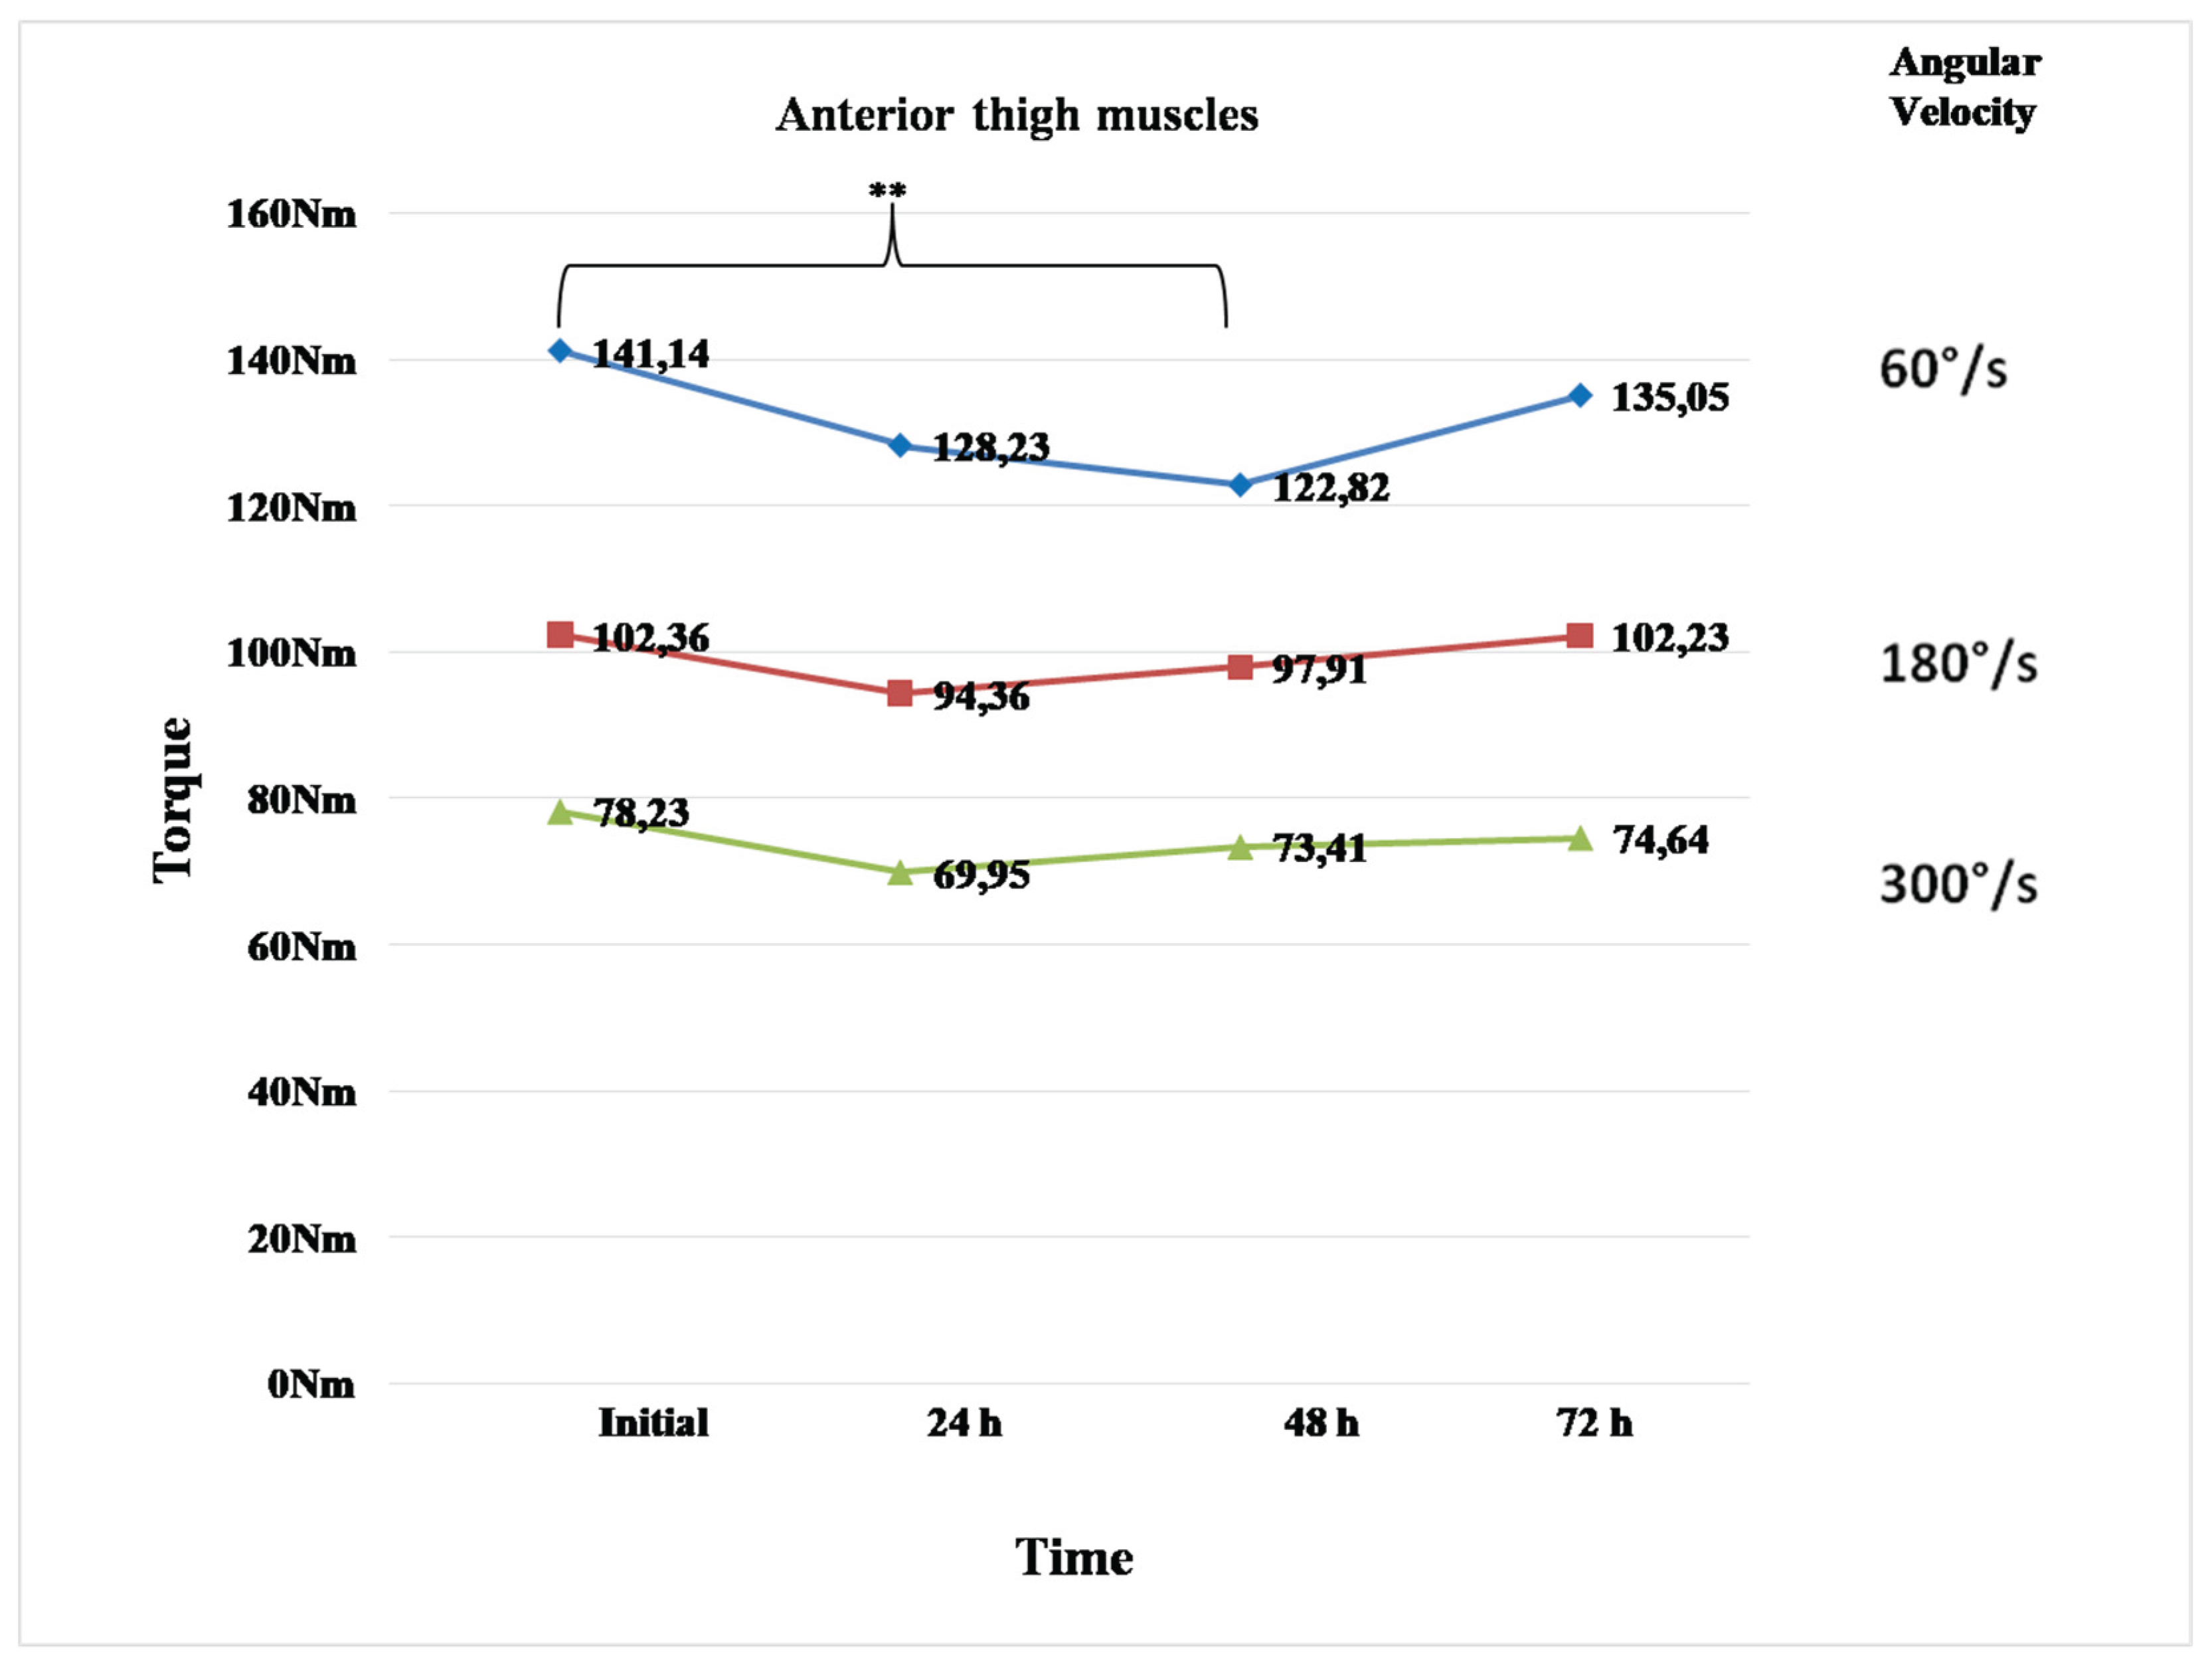
Figure 2.
Muscular torque of posterior thigh muscles at 60, 180, 300°/s, at the four different time points of measurement (means ± SD). *denotes a significant difference (p<0.05).
Figure 2.
Muscular torque of posterior thigh muscles at 60, 180, 300°/s, at the four different time points of measurement (means ± SD). *denotes a significant difference (p<0.05).
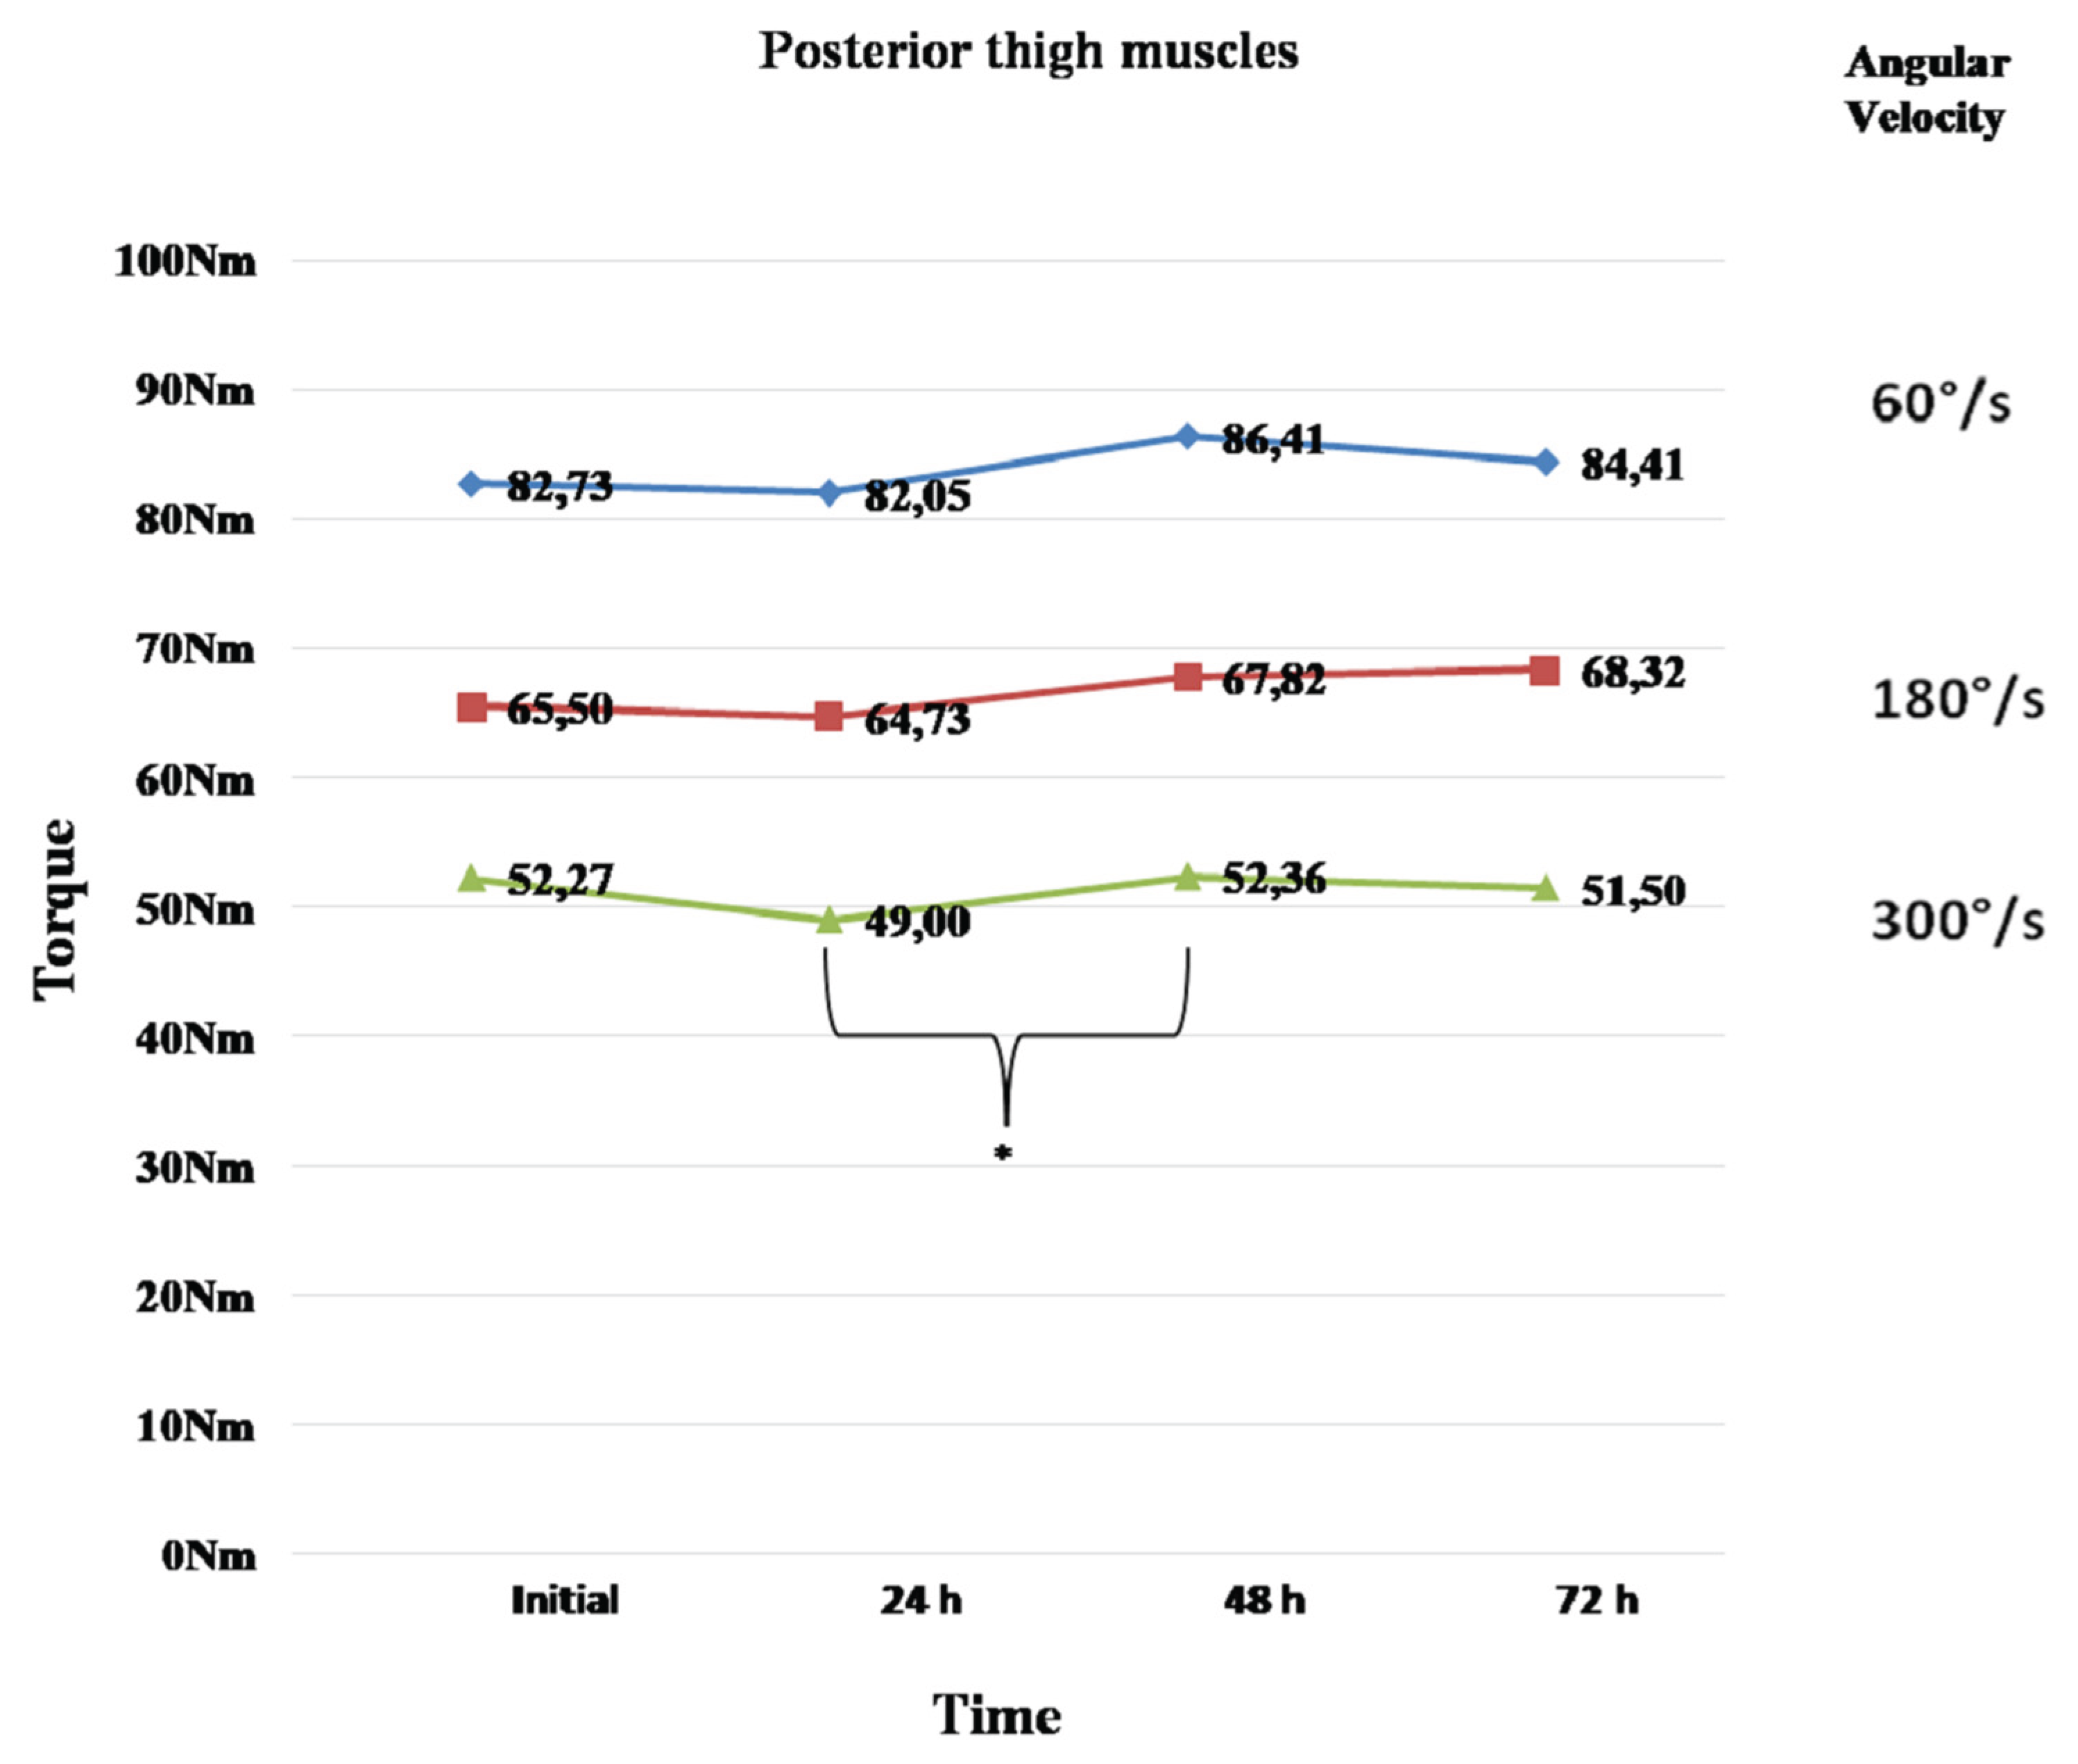
Figure 3.
Relative (Nm/kg) muscular torque of anterior thigh muscles at 60, 180, 300°/s, at the four different time points of measurement (means ± SD). *denotes a significant difference (p<0.05); **denotes a significant difference (p<0.01).
Figure 3.
Relative (Nm/kg) muscular torque of anterior thigh muscles at 60, 180, 300°/s, at the four different time points of measurement (means ± SD). *denotes a significant difference (p<0.05); **denotes a significant difference (p<0.01).
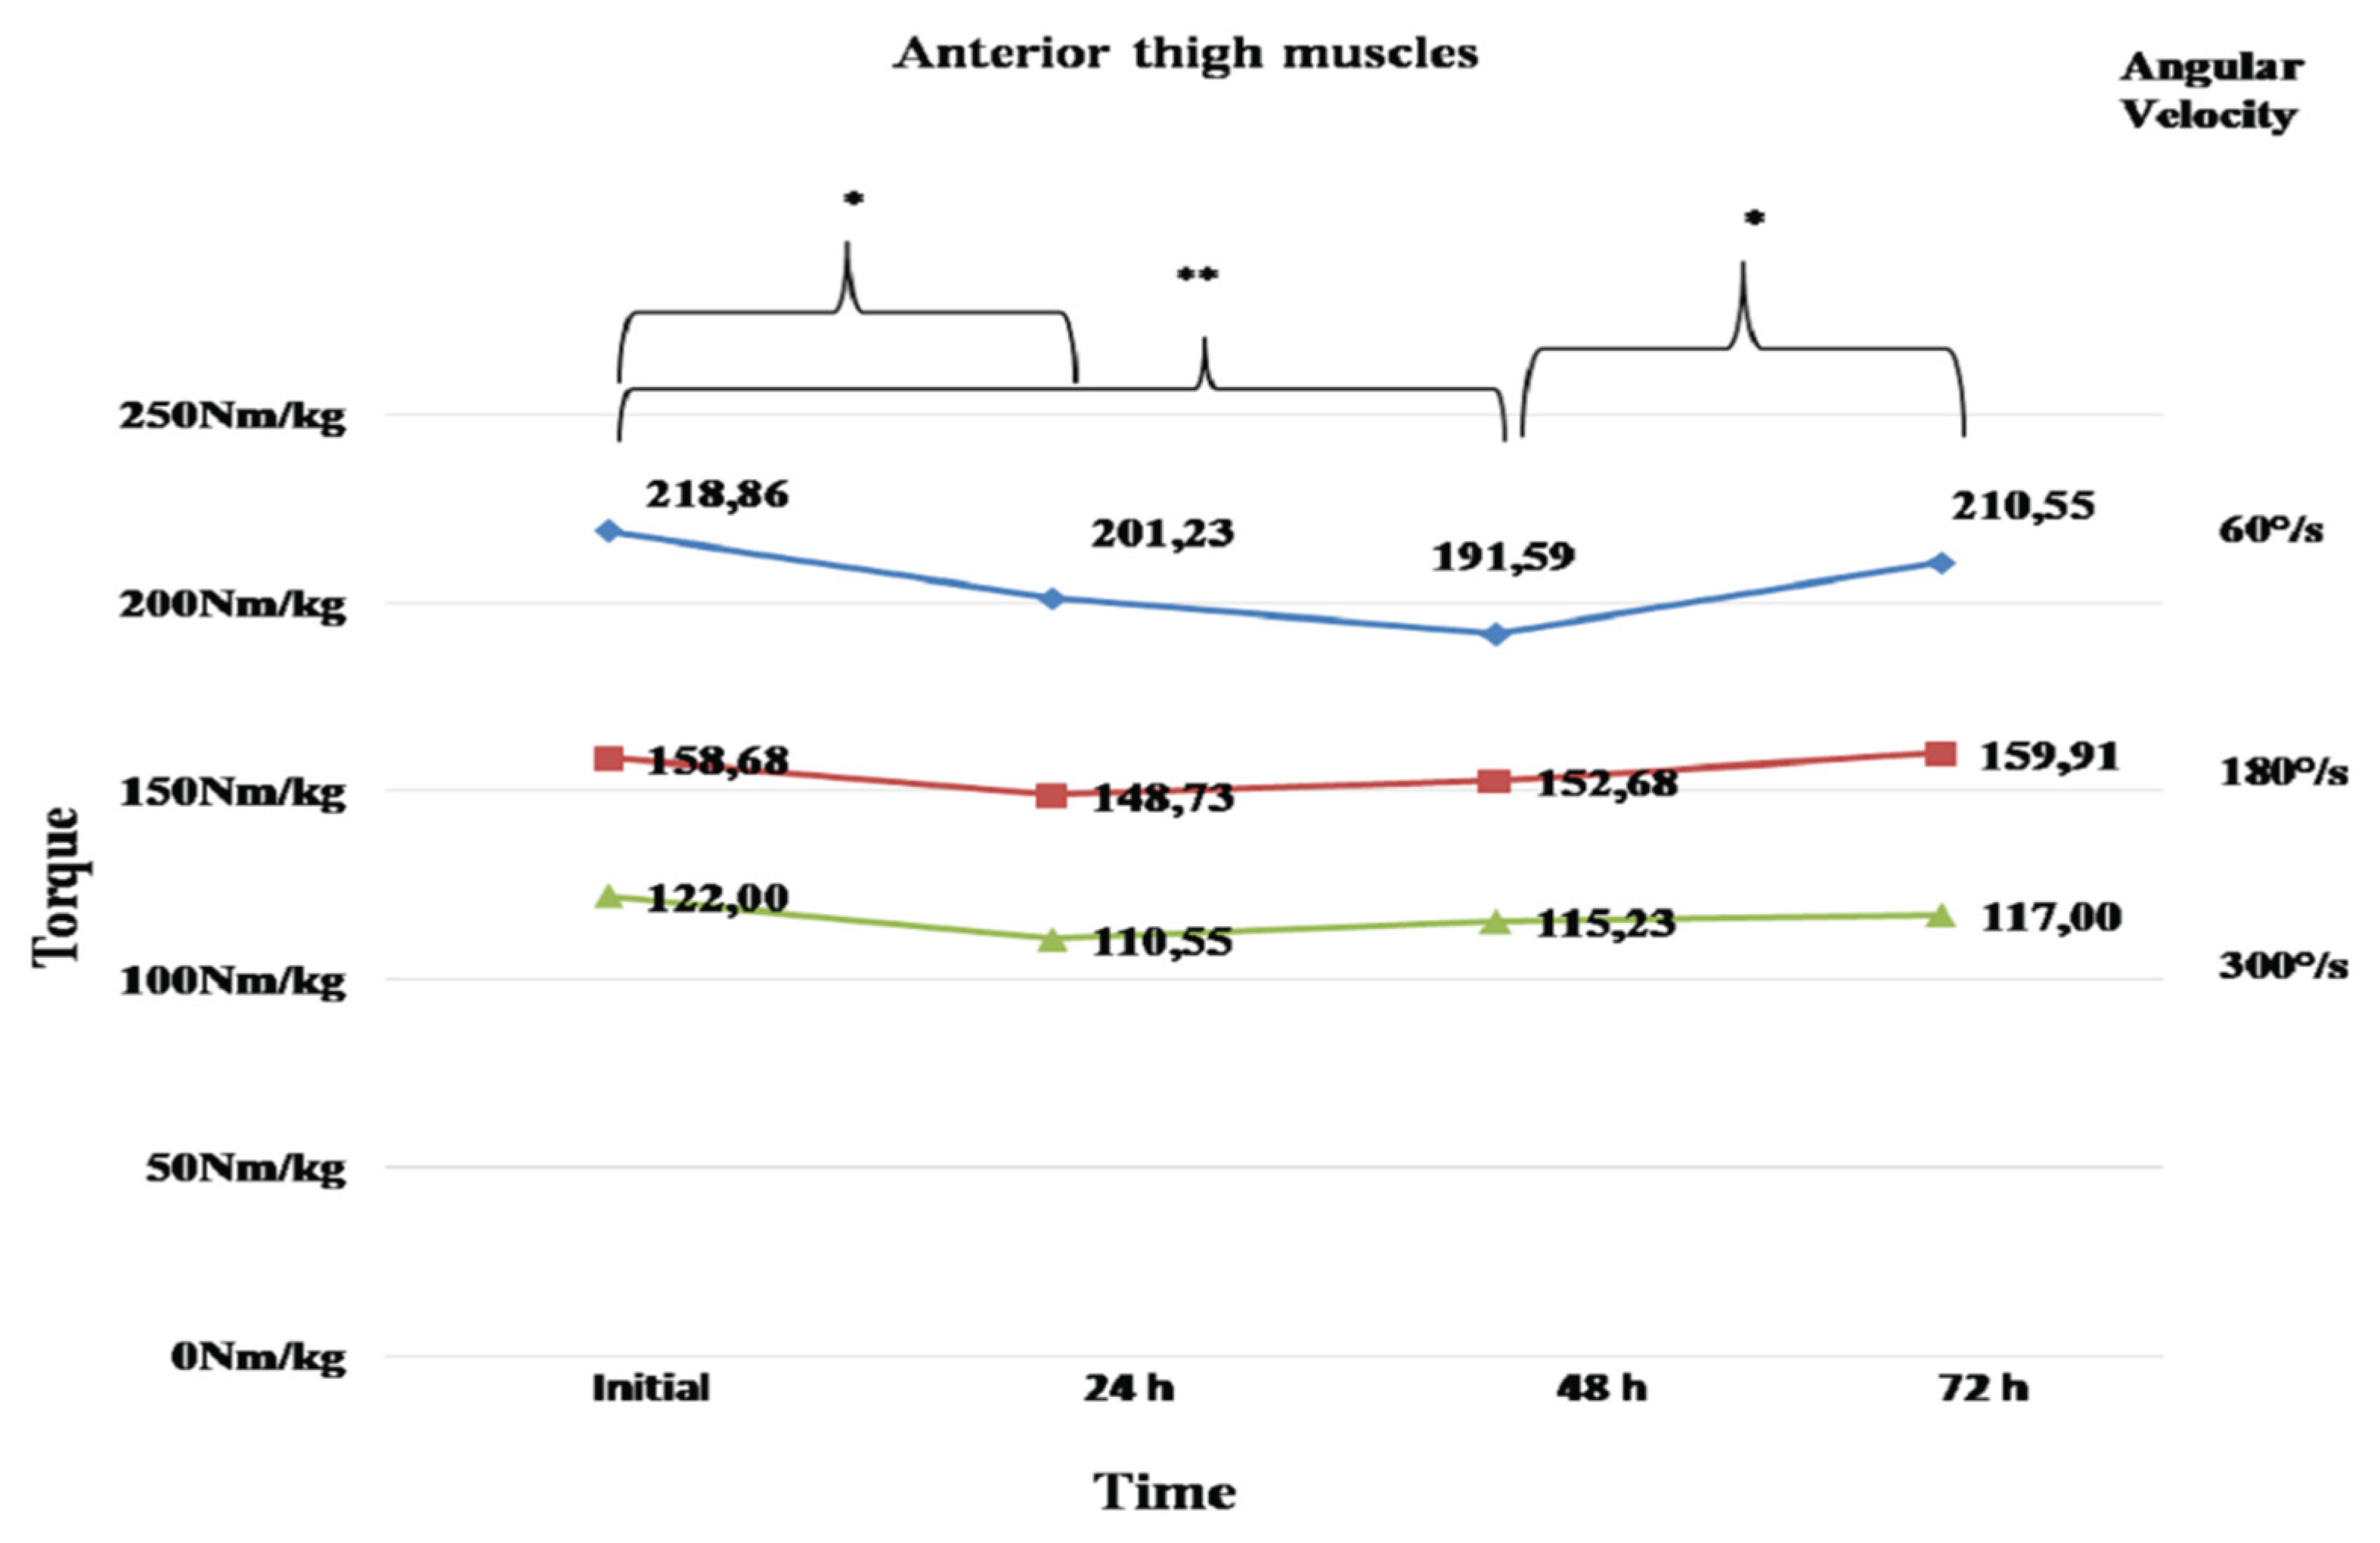
Figure 4.
Relative (Nm/kg) muscular torque of posterior thigh muscles at 60, 180, 300°/s, at the four different time points of measurement.
Figure 4.
Relative (Nm/kg) muscular torque of posterior thigh muscles at 60, 180, 300°/s, at the four different time points of measurement.
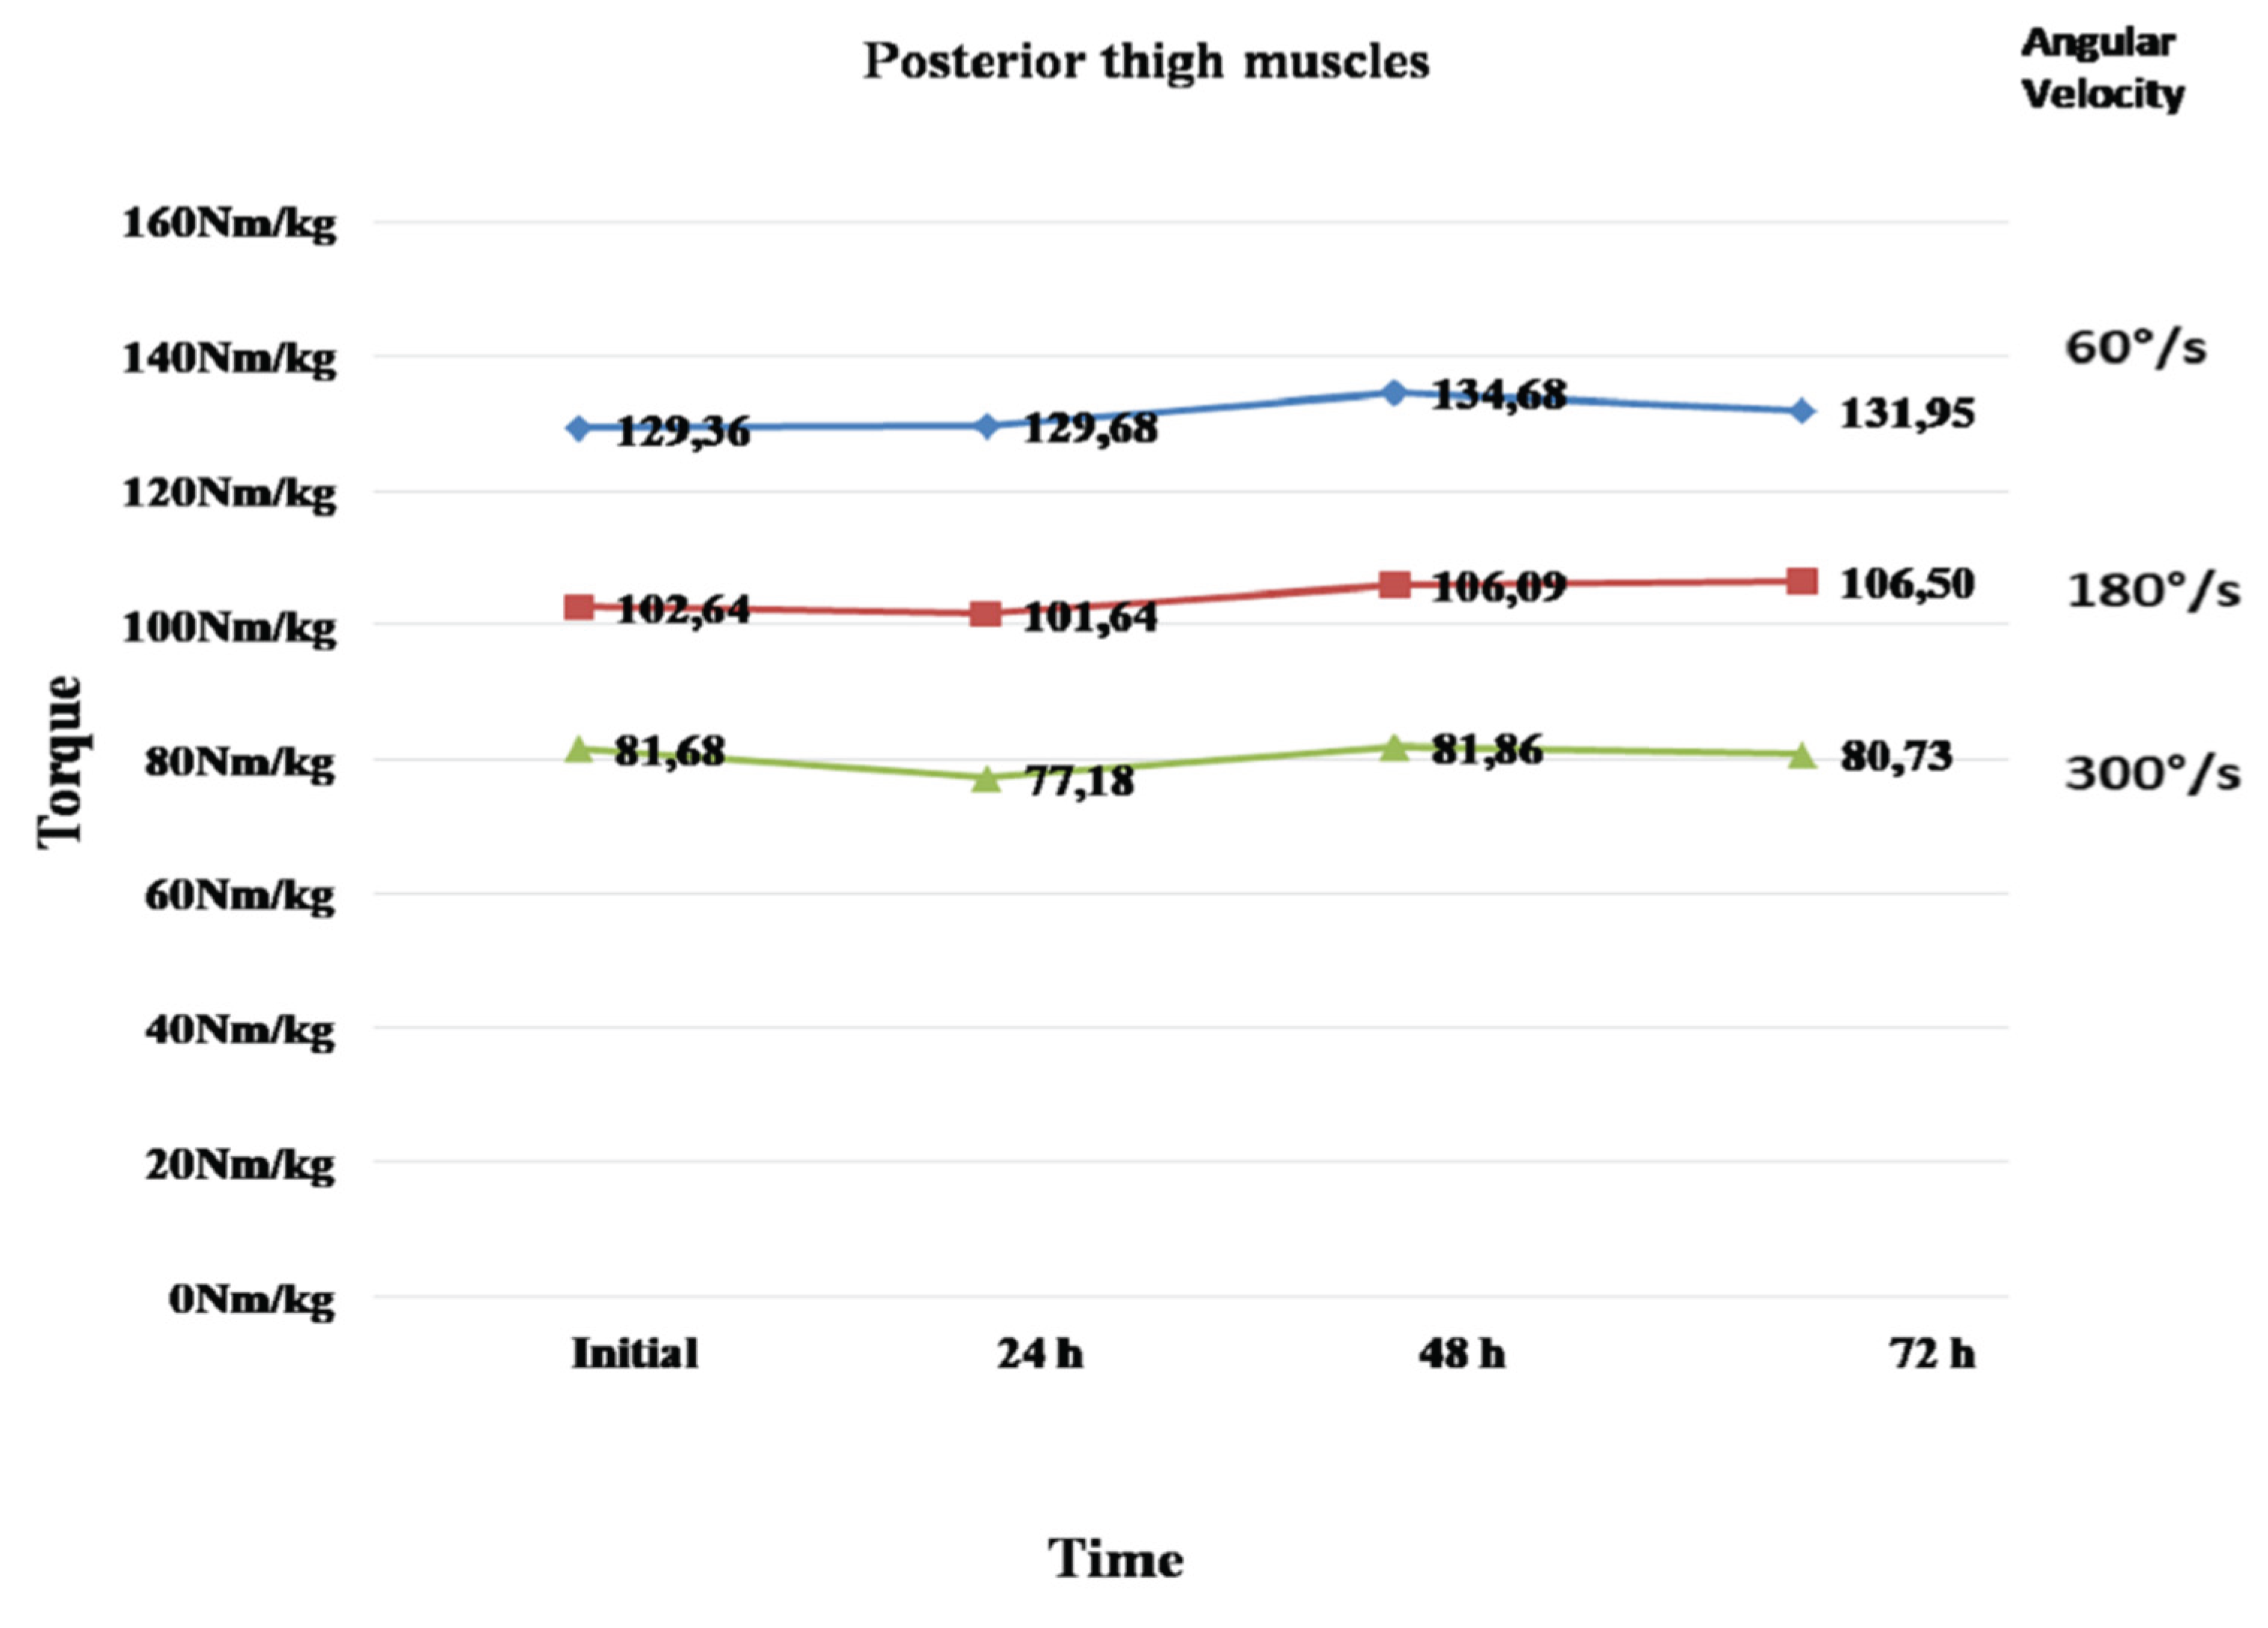

Table 1.
Generalized linear model between variables angular velocity, leg, muscle group and time.
| Multivariate Testsa | ||||||
| Effect | Value | F | Hypothesis df | Error df | Sig. | |
| Velocity * Muscle group * time | Pillai's Trace | 0,872 | 5.681b | 6,000 | 5,000 | 0,038 |
| Wilks' Lambda | 0,128 | 5.681b | 6,000 | 5,000 | 0,038 | |
| Hotelling's Trace | 6,817 | 5.681b | 6,000 | 5,000 | 0,038 | |
| Roy's Largest Root | 6,817 | 5.681b | 6,000 | 5,000 | 0,038 | |
| a. Design: Intercept b. Exact statistic | ||||||
Table 2.
Post Hoc Tests for variables angular velocity, leg, muscle group and time.
| Pairwise Comparisons | ||||||
| Measure: | ||||||
| Muscle group |
Angular Velocity |
No Measurement | Mean Difference (I-J) | Std. Error | Sig.b | |
| Anterior thigh muscles | 60°/s | Initial | 24 h | 12,909 | 4,361 | 0,083 |
| 48 h | 18.318* | 4,201 | 0,008 | |||
| 72 h | 6,091 | 3,746 | 0,581 | |||
| 24 h | Initial | -12,909 | 4,361 | 0,083 | ||
| 48 h | 5,409 | 2,948 | 0,456 | |||
| 72 h | -6,818 | 3,379 | 0,358 | |||
| 48 h | Initial | -18.318* | 4,201 | 0,008 | ||
| 24 h | -5,409 | 2,948 | 0,456 | |||
| 72 h | -12.227* | 3,130 | 0,017 | |||
| 72 h | Initial | -6,091 | 3,746 | 0,581 | ||
| 24 h | 6,818 | 3,379 | 0,358 | |||
| 48 h | 12.227* | 3,130 | 0,017 | |||
| Posterior thigh muscles | 300°/s | Initial | 24 h | 3,273 | 1,852 | 0,495 |
| 48 h | -0,091 | 1,666 | 1,000 | |||
| 72 h | 0,773 | 1,950 | 0,999 | |||
| 24 h | Initial | -3,273 | 1,852 | 0,495 | ||
| 48 h | -3.364* | 0,915 | 0,025 | |||
| 72 h | -2,500 | 1,191 | 0,320 | |||
| 48 h | Initial | 0,091 | 1,666 | 1,000 | ||
| 24 h | 3.364* | 0,915 | 0,025 | |||
| 72 h | 0,864 | 0,560 | 0,634 | |||
| 72 h | Initial | -0,773 | 1,950 | 0,999 | ||
| 24 h | 2,500 | 1,191 | 0,320 | |||
| 48 h | -0,864 | 0,560 | 0,634 | |||
| Based on estimated marginal means; *. The mean difference is significant at the .05 level; b. Adjustment for multiple comparisons: Sidak | ||||||
Table 3.
Generalized linear model between variables angular velocity, leg, muscle group and time relating to body weight.
Table 3.
Generalized linear model between variables angular velocity, leg, muscle group and time relating to body weight.
| Multivariate Testsa | ||||||
| Effect | Value | F | Hypothesis df | Error df | Sig. | |
| Velocity* Muscle group * time | Pillai's Trace | 0,879 | 6.041b | 6,000 | 5,000 | 0,034 |
| Wilks' Lambda | 0,121 | 6.041b | 6,000 | 5,000 | 0,034 | |
| Hotelling's Trace | 7,249 | 6.041b | 6,000 | 5,000 | 0,034 | |
| Roy's Largest Root | 7,249 | 6.041b | 6,000 | 5,000 | 0,034 | |
| a. Design: Intercept; b. Exact statistic | ||||||
Table 4.
Post Hoc Tests for variables angular velocity, leg, muscle group and time relating to body weight.
Table 4.
Post Hoc Tests for variables angular velocity, leg, muscle group and time relating to body weight.
| Pairwise Comparisons | ||||||
| Measure: | ||||||
| Mean Difference (I-J) | Std. Error | Sig.b | ||||
| Velocity | Muscle group | No Measurement | ||||
| 60°/s | Anterior thigh muscles | Initial | 24 h | 17.636* | 5,052 | 0,034 |
| 48 h | 27.273* | 5,803 | 0,005 | |||
| 72 h | 8,318 | 6,013 | 0,731 | |||
| 24 h | Initial | -17.636* | 5,052 | 0,034 | ||
| 48 h | 9,636 | 4,526 | 0,306 | |||
| 72 h | -9,318 | 4,651 | 0,365 | |||
| 48 h | Initial | -27.273* | 5,803 | 0,005 | ||
| 24 h | -9,636 | 4,526 | 0,306 | |||
| 72 h | -18.955* | 4,866 | 0,018 | |||
| 72 h | Initial | -8,318 | 6,013 | 0,731 | ||
| 24 h | 9,318 | 4,651 | 0,365 | |||
| 48 h | 18.955* | 4,866 | 0,018 | |||
Table 5.
CMJ without arm swing.
| Multivariate Testsa | ||||||
| Effect | Value | F | Hypothesis df | Error df | Sig. | |
| CMJ without arm swing | Pillai's Trace | 0,046 | .128b | 3,000 | 8,000 | 0,941 |
| Wilks' Lambda | 0,954 | .128b | 3,000 | 8,000 | 0,941 | |
| Hotelling's Trace | 0,048 | .128b | 3,000 | 8,000 | 0,941 | |
| Roy's Largest Root | 0,048 | .128b | 3,000 | 8,000 | 0,941 | |
| Design: Intercept; Within Subjects Design: CMJ without arm swing; b. Exact statistic | ||||||
Table 6.
CMJ with arm swing.
| Multivariate Testsa | ||||||
| Effect | Value | F | Hypothesis df | Error df | Sig. | |
| CMJ with arm swing | Pillai's Trace | 0,488 | 2.546b | 3,000 | 8,000 | 0,129 |
| Wilks' Lambda | 0,512 | 2.546b | 3,000 | 8,000 | 0,129 | |
| Hotelling's Trace | 0,955 | 2.546b | 3,000 | 8,000 | 0,129 | |
| Roy's Largest Root | 0,955 | 2.546b | 3,000 | 8,000 | 0,129 | |
| a. Design: Intercept; Within Subjects Design: CMJ with arm swing; b. Exact statistic | ||||||
Disclaimer/Publisher’s Note: The statements, opinions and data contained in all publications are solely those of the individual author(s) and contributor(s) and not of MDPI and/or the editor(s). MDPI and/or the editor(s) disclaim responsibility for any injury to people or property resulting from any ideas, methods, instructions or products referred to in the content. |
© 2025 by the authors. Licensee MDPI, Basel, Switzerland. This article is an open access article distributed under the terms and conditions of the Creative Commons Attribution (CC BY) license (http://creativecommons.org/licenses/by/4.0/).
Copyright: This open access article is published under a Creative Commons CC BY 4.0 license, which permit the free download, distribution, and reuse, provided that the author and preprint are cited in any reuse.


