Submitted:
06 December 2024
Posted:
09 December 2024
You are already at the latest version
Abstract
In order to improve the vibration isolation effect of the floating raft vibration isolation system, a new experimental platform for floating raft vibration isolation with two stiffnesses was built. First, the mathematical model of the vibration isolation system was established. The vibration transfer function of the vibration isolation system was deduced by using the substructure derivative synthesis method and the four-end parameter matrix method. The transfer function under the structural parameters was calculated, and the influence of structural parameters on the vibration transfer function was analyzed. Then the floating raft modal test was carried out and the three-dimensional finite element model of the floating raft vibration isolation structure was established. The finite element analysis results were compared with the test results to verify the validity of the finite element model, and then the vibration characteristics of the support structure were studied. Finally, by measuring the acceleration responses at the upper and lower ends of the isolator, the difference is taken as the evaluation index of the vibration isolation effect to investigate the isolation effect of the isolator under the conditions of on-land and underwater usage, and to preliminarily explore its influence on the underwater acoustic radiation of the device. The results demonstrate that the vibration isolator with two stiffnesses can reduce the vibration transmission within a specific frequency range in both on-land and underwater application scenarios, which holds guiding significance for the research of vibration isolation technology in practical engineering.
Keywords:
transfer function
; vibration isolation of floating raft
; Isolation effectiveness
; vibration level difference
; vibration isolator
1. Introduction
The innovation of floating raft vibration isolation directly affects the combat effectiveness of ships. Vibration isolation technology for naval ships can effectively reduce the damage of mechanical vibration to the structure, reduce noise changes, and improve ships' stealth. Scholars have paid close attention to the appropriate framework of a vibration isolation system. A giant floating raft vibration isolation system necessitates a plan with a simple structure and a low cost [1,2,3].
Floating raft vibration isolation is a complex system with high nonlinearity, and it isn't easy to simulate it accurately by theoretical calculation. Some scholars have established a discrete transfer function mathematical model to obtain practical reference results using simulation and experimental methods [4]. In the field of ship vibration control and floating raft structure design, a floating raft design scheme of air compressor unit [5] has been proposed to maintain the stability of the floating raft system and avoid the system resonance to a certain extent. Calculating the strength, mode, vibration response, and good power of the mechanism provides the reference for vibration isolation control. To maximize the overall vibration efficiency of the control system, low-frequency support and a low-frequency mounting system (LFMS) test stand was developed [6]. Thrust bearings and Marine thrusters are added to the floating raft, and gas springs are installed to adjust the position of the suspended raft. The experimental results show that LFMS has a remarkable vibration isolation effect above 10 Hz. Considering the influence of infrastructure [7], the effect of vibration isolators on evaluating flexible infrastructure is studied. The impact was assessed by comparing the maximum amplitude response of the structure, and experimental tests confirmed the rationality of the theoretical results. The device's effectiveness is analyzed using a damped damper and a structural vibration control method to optimize structural parameters. Experimental results show that [8], compared with standard dampers, this method can reduce the amplitude ratio to zero and suppress higher vibration modes with fewer dampers. Based on the control scheme of filtered-x least mean square control strategy with dynamic variable step size [9], the mathematical representation of the governing system is determined by the observer/Kalman filter identification method, which effectively reduces the system sound of submarines and other ships and improves the active vibration isolation effect of the floating raft system. Simulation and experiment establish the usefulness of this strategy. A novel silent hybrid "smart spring" isolation technology is created to deal with discrete frequency vibration sources [10,11]. This technique has the potential to offer outstanding isolation performance. Weng et al. [12] built a floating raft vibration isolation dummy payload with switching tractor trailer control, using vibration acceleration response as the indicator of the vibration isolation efficacy. The empirical findings confirm the computer results. Sun et al. [13] found a computational formula for the beam-based floating raft system using a derivative matrix. They studied the effects of several parameters, such as the setting position, dissipative, and volume of the dynamic vibration absorber, on its damping effect, as well as its damping effect at multiple excitation frequencies. Their findings demonstrated that it might increase the vibration-isolation performance of traditional floating raft systems. In contrast to Sun, Song et al. [14] utilized periodic structure theory to develop a floating raft vibration isolation system to examine a flexible raft system's vibration and noise radiation suppression. Using numerical calculations, the suppression effects were improved. When the system stability is good, the higher the weight of the approximate pontoon, the better the system performance. When the system stability is good, the smaller the system support stiffness, the better for the system, as far as the natural working conditions allow. This gives a reference for determining counterweight and stiffness [15]. In contrast, the intermediate raft's extra mass might strain the system. To save costs and promote convenience, the overall weight of the construction is kept as light as feasible. Compared to a typical numerical solution and other quasi-zero-stiffness (QZS) devices, Li et al. [16] proved that the friction coefficient greatly minimizes the resonant crest in the vibration-isolated floating raft system using two layers of QZS. Fang et al. [17] built a vibration isolation device for cabin auxiliary equipment to evaluate the influence of shell thickness, excitation source and thickness changes of different hulls and installation platforms on vibration response. The results show that the vibration isolation ability can be significantly enhanced. Studying the conflict between vibration isolation and energy reflection on a single isolation interface can reduce the impact of vibration on sensitive structures [18]. Based on the employed active control mechanism and the experimental findings, it was demonstrated that even a soft and self-adapting isolation interface might produce the opposite outcome. This significantly lowers the seismic vibration propagation to susceptible structures. Through simulation and test-bed experiment [19], it is studied that the proposed adaptive nonlinear control method has strong disturbance rejection ability against sensor noise and extra power disturbance, high vibration suppression level, and fast convergence rate. Asymmetric base isolation systems have specific responses to earthquakes when neighboring structures collide [20]. When the collision occurs, the foundation raft's displacement will decrease. A design with vibration isolation will have superior vibration isolation than a structure without vibration isolation. One of the main challenges in isolating huge marine gear rafts is how to lessen the influence of excitation resonance. The vibration of marine constructions is a significant problem. A hybrid active/passive installation method is proposed to solve this problem [21]. It uses numerical control braking to adjust the modal response of rigid structures while ignoring local displacement to eliminate resonance. High ship vibration can lead to mechanical equipment failure or shape breakdown due to fatigue. The finite element idealized model is utilized to examine vibration characteristics [22], pinpoint its natural frequency and mode, and gauge the reaction of the nearby ship construction. Researchers created a numerical simulation dynamic model of a floating raft vibration isolation system that utilized the two-layer vibration isolation concept. Resonance is simple since the natural frequency is highly concentrated. As damping is raised, the resonance peak will be suppressed. Act synergistically in the broad frequency domain is attained when the dispersion of the floating raft vibration isolation system's natural frequency grows. The higher stiffness enhances the floating raft vibration isolation system's low-frequency performance [23].
The current standard for ship mechanical vibration isolation is passive vibration isolation devices, such as solitary, twofold, and floating raft vibration isolation systems. The resonance transmitted from the raft to the cylinder ship can be reduced by using vibration isolation springs to elastically support the raft construction, which can considerably impact ship vibration and noise reduction. The vibration isolator is reduced using this technique to a spring and damping unit with vertical rigidity. Nevertheless, it overlooks the impact of the transverse stiffness and damping of the vibration isolator. Hu et al. [24] addressed this issue by proposing several suiTable arrangement methods for the selection and arrangement principles of the vibration isolator and utilizing the vibration level drop as the vibration isolation impact of the vibration isolation evaluation. This offers vibration isolator arrangement design solutions. Li and Liu [25] varied the raft frame's geometric characteristics while assuming that the overall mass of the elastic raft frame would remain constant to examine the effect of the intrinsic frequency distribution on vibration isolation performance. According to some research, the middle and high-frequency bands are where geometric parameters on the vibration isolation effect are most focused. The raft frame's height, aspect ratio, and number of ribs are the most significant geometric characteristics. Researchers frequently use output current to represent the vibration isolation effect. Through theoretical analysis, numerical data, and experimental testing of the floating raft vibration isolation system [26,27,28,29,30], it is essential to analyze the vibration problems in practical engineering applications. The floating raft isolation system with isotropic beams has no resonance peak. Hence it cannot boost damping opening avoidance in the high-frequency region. Wen et al. [31] used ABAQUS finite element software to perform a modal analysis on a carbon fiber-reinforced plastics truss structure to enhance vibration isolation performance. The differences in acceleration vibration levels under various stimulation sources were investigated by constructing a floating raft isolation system experiment platform. Superior vibration isolation effects were attained. According to the literature, a brand-new active-passive analytical model for floating rafts was created [32]. Numerically calculating the control effectiveness obtained for various control types led to some promising computational results, which may also be used as a guide when designing floating raft systems. A floating raft frame was created [33], Using Abaqus software, modal analyses of several material frames were conducted, and the results were compared with modal tests based on vibration modal theory. According to the research, it is found that the steel floating raft frame has a lower frequency and damping ratio than the carbon fiber floating raft frame, which makes the vibration absorption effect better at low frequencies.
The research content of this paper is as follows: in Section 2, the mathematical model of the transfer function of the vibration isolation system is established, and the transfer function calculation formula of the vibration isolation system is derived by using the substructure conductivity synthesis method and the four-terminal parameter matrix method. The finite element model of the floating raft vibration isolation structure was established. The modal analysis of the supporting structure was carried out, and the finite element results were compared with the test results. A test platform for floating raft vibration isolation was established. The vibration motor was used as the vibration source equipment, and the vibration level reduction of acceleration was used as the evaluation index to study the vibration isolation effect of two stiffnesses of vibration isolators.
2. Transfer Function Theory
2.1. Mathematical Model of the Vibration Isolation System
The mathematical model of the floating raft vibration isolation device is shown in Figure 1. It is divided into three subsystems for analysis. The transfer functions of the sub-structures are calculated separately. Then the derivation of the transfer function of the overall structure using the integrated derivative method of the sub-structures is carried out, where the sub-system A includes a vibration motor and a raft structure, the vibration motor is rigidly mounted on the raft, and the system A is regarded as a rigid body. The system B is a vibration isolator, generally used as a spring-damping system described by complex stiffness. The base C is reduced to a supported elastic beam structure at both ends. For calculation purposes, the vertical excitation response of the vibration motor is mainly considered.
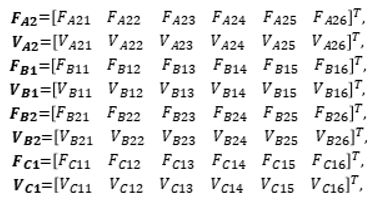
and represent the motor input system's full force and concentrated speed, respectively and represent the force and velocity vectors at the output end of rigid body A, respectively. and represent the force and velocity vectors at the input end of the isolator, respectively. and represent the force and velocity vectors at the output end of the isolator, respectively. and represent the force and velocity vectors at the output end of the foundation beam, respectively. Among them
 (1)
(1)
(1)
Considering the vibration response transmission of six isolators on one side of the vibration isolation device, the above six isolator vibration isolation system models are established. The substructure systems A, B, and C transfer functions are derived separately.
2.1.1. Transfer Function of Rigid Body A
In the formula, m represents the mass of the rigid body system, a represents the vertical acceleration of the rigid body excitation, ω represents the excitation frequency, J represents the rotational inertia of the device A around the x-axis, α represents the rotation angle of the device A, represents the six forces at the output end of A, and represents the distance from the six isolators to the center of gravity of the rigid body. The excitation of the vibrating motor is a simple harmonic excitation force, where .
From Equation (2), we can get
From Equation (3), it can be obtained that system A has the following dynamic characteristic transfer equation [13].
In the formula, ,,, are the elements of the admittance matrix of the rigid body system A.
2.1.2. Transfer Function of Isolator B
For the vibration isolator subsystem B, the mass can be ignored, usually expressed by complex stiffness, and its transfer matrix can be defined as
Where
In the formulas (2-7), is the complex stiffness of the group i isolator, and is the damping factor of the isolator.
2.1.3. Transfer Function of Base C
The foundation is simplified as an elastic damping beam simply supported at both ends, and its dynamic transfer equation is
Here, M is the velocity admittance matrix of the base beam.
The ratio of the velocity response complex vector of k points to the excitation complex vector of j points on the beam constitutes the frequency response function of the beam, is I the natural frequency of the free vibration of the undamped beam, δ is the material damping loss factor of the beam, the mass of the foundation beam , ρ is the density of the elastic foundation beam, S is the cross-sectional area of the elastic foundation beam, R is the length of the beam, and the origin of the local coordinate system of the foundation beam is taken on the left side of the beam. is the coordinate of the response point in the local coordinate system of the foundation beam, is the coordinate of the excitation force point in the local coordinate system of the foundation beam, and is the vibration mode function of the simply supported beam at both ends.
2.2. Transfer Function of the Overall Structure
By the conditions of displacement coordination and force balance, and the force at both ends of the isolator is equal, , the relationship between force and velocity is expressed as follows
From the definition of mechanical admittance, the mechanical admittance of the vibration isolation system can be obtained, that is, the transfer function is
According to the requirements of this paper, the above transfer function is a matrix of 6 rows and 1 column, and each row element corresponds to the transfer function of the measuring point at the contact position of the beam and the isolator relative to the excitation point of the machine.
3. Numerical Results and Discussion
The transfer function is analyzed numerically in this section, and a numerical example is given. The parameters of the rigid body system A, the intermediate vibration isolator system, and the foundation system C are shown in Table 1. Here, for the convenience of analysis and calculation, the bending vibration inherent frequency of the foundation beam can be obtained by assuming that the foundation is a beam supported at both ends.
To ensure the numerical results' reliability, the foundation beam's analytical solution is compared with the finite element method. The beam adopts a hexahedral mesh, and the first six natural frequencies of the beam vibration are given in Table 2. The accuracy of the finite element results is verified by comparison with the finite element results. In the numerical calculation, the leftmost end of the beam is taken as the origin of the local coordinate system, and the arrangement of the vibration isolator is six on one side. The position coordinates of the isolator on the foundation beam are 0.335m, 0.470m, 0.605,1.195m, 1.330m, and 1.465m, and the distance between the three isolators and the center of gravity of rigid body A is 0.565m, 0.430m, 0.295m, 0.295m, 0.430m, 0.565m.
Among them, is the interface moment of inertia of the foundation beam, b is the height of the foundation beam, and a is the width of the foundation beam [35].
3.1. The Influence of Vibration Isolator Parameters on the Transfer Function
In the above parameters, keep other structural parameters unchanged, change the stiffness coefficient of the vibration isolator, and compare the influence of the stiffness of the vibration isolator on the system transfer function. As shown in Figure 2, the eight peaks in the transfer function curve are 13Hz, 37Hz, 144Hz, 323Hz, 573Hz, 896Hz, 1291Hz, and 1757Hz, because the vibration isolator is symmetrically arranged on the beam foundation, only the odd mode of the beam foundation can be excited at this time. When the stiffness coefficient of the isolator is reduced from 970 N/mm to 290 N/mm, the first-order natural frequency of the vibration isolation system is significantly reduced, and the first resonance peak position of the transfer function is moved forward. In the middle and high-frequency region, the decrease of the stiffness of the isolator makes the transfer function curve move down as a whole, which indicates that the decrease of the stiffness of the isolator is beneficial to the vibration isolation effect of the system.
3.2. The Influence of Foundation Beam Thickness on the Transfer Function
Only the thickness of the foundation beam is changed, and the influence of the thickness on the vibration transmission of the vibration isolation system is analyzed, as shown in Figure 3. It can be concluded from Formula (15) that with the increase of the thickness of the foundation beam, the natural frequency of the beam will also increase, and the thickness change is proportional to the natural frequency. In Figure 3, when the thickness of the foundation beam increases from 0.05 m to 1.5 m, the natural frequency shifts to the high frequency, and the overall resonance peak position shifts backward. The results show that increasing the thickness of the foundation beam can effectively suppress the vibration transmission in the vibration isolation system. In practical engineering, increasing the thickness of the beam will not only increase the cost but also lead to the heavy load of the vibration isolation system.
3.3. Influence of the Modulus of Elasticity of Foundation Beams on the Transfer Function
The modulus of elasticity is used as a measure of the magnitude of an object's ability to resist elastic deformation. Changing only the modulus of elasticity of the foundation and analyzing the effect of the modulus of elasticity of the foundation beams on the vibration transfer function of the vibration isolation system, as shown in Figure 4 when the elasticity model of the foundation beams is increased by a factor of 10, it can be seen in the curves that the intrinsic frequency of the foundation is shifted, which makes the position of the resonance peak in the transfer function curves move backward. In the low-frequency band, such as the transfer function curve at the location of measurement point 1, which corresponds to a horizontal coordinate of 13 Hz, the transfer function in the vertical coordinate decreases from -100.7 dB to -122.8 dB, which only decreases the peak resonance value and does not change the resonance position. Because the measurement points are symmetrically distributed, analyzing the transfer function curves of measurement points 1, 2 and 3 individually, it is not difficult to see that, with the change in the distance between the measurement point location and the center of gravity of the foundation, the closer the distance, the faster the transfer function curve decreases, and the better the vibration isolation effect, which can be more obvious in the high-frequency band. Therefore, the increase of the modulus of elasticity E can effectively inhibit the transmission of vibration.
3.4. Simulation Calculation of Raft Frame Modalities
The raft is an essential component of a floating raft vibration isolation system. The construction of the main raft frame structural types and the selection and placement of vibration isolators should be prioritized. Second, think about how the cylinder shell and raft frame vibrate. The vibration motor and raft frame can be considered stiff bodies in the general floating raft construction to avoid the equipment's excitation frequency. This is also sensible in terms of design.
The structural form, stiffness, mass distribution and other factors affect the inherent characteristics of the raft. When the excitation frequency is the same as the natural frequency of the raft, the raft is prone to resonance, resulting in premature bending fatigue failure of the raft. Therefore, modal analysis is needed. In the vibration isolation system, the raft, the vibration motor and the base are assumed to be rigid bodies. Based on the following kinetic equation [4].
In equation (16), is the mass matrix of the vibration isolation system, is the damping matrix, is the stiffness matrix, and is the excitation force matrix.
According to the theory of free vibration, the natural frequency of the vibration isolation system can be calculated by the following formula.
The natural frequency of the raft frame can be calculated using the above equation (17), and it can be seen that the natural frequency of the raft frame is primarily determined by the raft frame's mass and stiffness. The natural frequency of the vibration isolation system in a sizable floating raft may be primarily impacted by changes in the mass and stiffness of the raft frame. This paper calculates the natural frequency of two masses of raft frames and analyzes the connection and difference between raft frames with and without counterweight.
3.4.1. Modal Simulation of Raft Without Counterweight
Before the modal calculation, it is necessary to establish the three-dimensional model of the floating raft vibration isolation system in the finite element software ABAQUS, as shown in Figure 5, and set the material characteristics and parameters. The raft is analyzed separately, and the grid is divided to obtain a total of 54948 cells for modal analysis.
The raft structure's natural frequency and modal shape are analyzed to avoid resonance with the frequency of the excitation force to judge the vibration characteristics of the whole system. The first six modes of the raft frame structure without counterweight are extracted, as shown in Figure 6.
3.4.2. Modal Simulation of Raft with Counterweight
To reduce the natural frequency of the raft frame and make the designed vibration isolation test platform obtain a better vibration isolation effect, 4 tons of counterweight blocks are evenly arranged on the raft frame, and the change of natural frequency and the modal shapes of the raft frame after adding counterweight blocks is compared and analyzed. The natural frequency and the modal forms of the first six orders are obtained, as shown in Figure 7.
The first six modes of the raft frame without counterweight and with counterweight are shown in Figure 6 and Figure 7 respectively. The first six free mode frequencies and modal vibrations of the raft frame without and with counterweight in Table 3 and Table 4 show that their first-order torsional mode frequencies are 105.5Hz and 32.9Hz, respectively. It is far away from the primary disturbance frequency of the vibration motor of 20Hz and 40Hz, and the second-order torsional mode frequency of 180.3Hz and 53.7Hz, which far exceeds the second-order disturbance frequency of the vibration motor of 40Hz. Therefore, the raft frame can always avoid resonance with the primary excitation frequency of the vibration motor when the vibration motor is working effectively, and the stiffness is reasonable.
From Table 3 and Table 4, it can be seen that the natural frequency of each order of the raft frame with counterweight has a significant reduction compared with the natural frequency of each order of the structure of the raft frame without counterweight, according to the theoretical equation (17), where the reason is that the increase of the overall mass of the raft frame after the mass block is applied the natural frequency decrease.
4. Experimental Tests
This part introduces the experiments, including the construction of the floating raft vibration isolation system test platform, the modal test of the cylindrical shell and the raft frame, and the vibration isolation effect test and result analysis of the vibration isolation system under different excitation and different stiffness vibration isolators.
4.1. Modal Testing of Cylindrical Shells
Four acceleration sensor rings are arranged on the inner wall of the cylindrical shell, and six sensors are arranged in each ring. Each sensor is spaced 600 apart. The arrangement of measuring points on the inner wall of the cylindrical shell and the simplified model are shown in Figure 8. The sensor adopts the three-way acceleration sensor of BK to hammer hard on the inner wall of the shell. The BK data acquisition system is adopted to obtain the first three modes and natural frequencies of the shell through Reflex software, as shown in Figure 9 and Table 5.
4.2. Modal Tests of Raft Frame Structure
The modal test of the raft structure is carried out. Since the boundary conditions of the finite element modal analysis of the raft are unconstrained, the modal test should also be unconstrained. It is usually difficult to accurately simulate the actual boundary conditions in modal tests, which can be achieved by hanging soft rubber ropes or supporting soft foam plastics [33]. This paper uses the rubber rope suspension raft and BK data acquisition system to collect and analyze the experimental modal data. The free modal test of raft structure is carried out by hammer excitation. In this test, 14 measuring points were arranged on the raft's surface. As shown in Figure 10, the acceleration sensor is placed at the corresponding position of the raft characteristic measuring point.
In the test, 14 measurement points on the upper surface of the raft frame were hammered and excited, and the frequency response curve of each sensor was imported into the Reflex analysis software, a post-processing module of the PULSE system. The data were processed using the Reflex software to obtain the raft frame's natural frequency and vibration mode.
4.2.1. Comparison of Finite Element Modes and Experimental Modes
Table 6 compares the first two orders of the finite element modal and experimental modal of the raft without counterweight. Table 7 compares the first two orders of the limited element mode of the raft with counterweight and the testing mode.
The test results of the modal tests for the raft without counterweight and with counterweight are shown in Table 6 and Table 7. Table 6 shows that the errors between the raft's first and second-order natural frequencies without counterweight and the finite element results are within 10%. As can be seen from Table 7, the error between the second-order natural frequency of the raft with counterweight and the finite element results is within 11%, which indicates that the established finite element model of the raft mass can accurately reflect its self-oscillation characteristics. By comparing the modal formations and natural frequencies of the first two orders of the raft frame, it was found that the experimentally measured data were consistent with the finite element simulation results within the error tolerance, and the accuracy of the finite element calculation model was initially verified.
4.2.2. Experimental Settings
The vibration isolation system constructed in this paper is shown in Figure 12. The vibration motor is rigidly connected to the raft through bolts, and the frequency converter adjusts the motor speed to obtain sine curves of different specific frequency signals. The speed can be adjusted in the range of 0~50Hz. The excitation frequency is set to 20 Hz and 40 Hz according to the requirements of this research. Twelve vibration isolators are placed between the raft and the foundation support. Vibration isolators usually use rubber springs, rubber block shock absorbers, damping spring shock absorbers, etc. The frequency of the rubber spring is low, and the damping of the rubber block shock absorber is significant. This paper selects a ZTE damping spring isolator with reasonable size and good repeatability, with a stiffness coefficient of 290N/mm and 970N /mm. And the use of rigid bolts fixed between the raft frame and the foundation support.
4.2.3. Vibration Isolation Test Under Specific Frequency Excitation
The vibration isolation effect is typically measured using force transfer rate, insertion loss, vibration level drop, and power flow. The acceleration vibration level difference is used in this paper to evaluate the vibration isolation effect of the floating raft vibration isolation system. As the fundamental quantity used to assess the vibration damping effect, acceleration vibration level drop is defined as 20 times the common logarithm of the ratio between the practical value of vibration response of vibration source equipment and the reasonable value of vibration response of the base. The formula for acceleration vibration level is as follows [34]:
The vibration acceleration level of the ith measuring point can be calculated from the above equation, where is the effective value of acceleration at a fixed frequency and is the reference value of acceleration, generally . The vibration isolation effect is calculated according to the vibration level drop difference of the acceleration level up and down the raft vibration isolation system device. The specific formula is as follows:
As type of for vibration level gap, is above the average vibration acceleration level vibration isolator, for vibration isolator below the average vibration acceleration level.
The vibration motor is the initial excitation source of the vibration input end, and the excitation frequency is set according to the actual working condition. Twelve vibration isolation springs with a stiffness coefficient of 290 N/mm are placed under the raft. Six measuring points near the side of the vibration motor are selected. The acceleration sensors No. 1, No. 3, and No. 5 are used to measure the acceleration above the vibration isolator. Sensors 2, 4 and 6 are set at the lower end of the vibration isolator, and the excitation frequencies are 20 Hz and 40 Hz. The response of each measuring point at a specific excitation frequency is measured. The 1/3 octave can better reflect the sound source characteristics of noise, describe the mechanical parts of vibration source equipment, and analyze the vibration characteristics of vibration isolation systems in engineering practice. The calculation method of 1/3 octave is as follows:
Where is the upper limit frequency, is the lower limit frequency, is the central frequency, and the frequency band selected in this paper is 10-1000Hz.
Figure 12 shows the vibration isolation experimental platform of the floating raft. The vibration isolator is installed as shown below, and the sensor is installed on the lower surface of the raft frame and the upper surface of the support and near the vibration isolator. According to the test method of vibration isolation performance, the acceleration level of excitation in the frequency range of 10-1000Hz is measured. The acceleration level of measurement points 1-6 under the excitation of a specific frequency of 20Hz is shown in Figure 13 while the acceleration level of the measurement point 1-6 under the specific frequency of 40Hz is shown in Figure 14.
Figure 13 and Figure 14 show that the vibration transfer through the vibration isolator to the vibration level acceleration on the base is significantly reduced, indicating that the vibration transfer process produces attenuation. Comparing Figure 13 and Figure 14, when the excitation frequency is 40Hz, the vibration level curve shows that the acceleration level rises significantly, and the vibration level response of the vibration isolation system is more prominent. Although there are fluctuations in the vibration level differences in different frequency bands, the overall vibration response is consistent with the actual situation. Various excitation frequencies can be used to compare and analyze the vibration isolation response.
4.2.4. Comparison of Vibration Level Difference Under Two Specific Frequency Excitations
Following Equation (19), the measured acceleration level data were used to obtain the vibration level difference. Then the vibration level difference of 1/3 octave in the 10-1000 Hz test frequency range was selected. When the vibration isolator stiffness coefficient remains unchanged, the vibration isolation effect is analyzed by changing the vibration motor excitation frequency. This section uses the vibration isolator with a stiffness coefficient of 290N/mm. The excitation frequency of the vibration motor is 20Hz and 40Hz, respectively, to explore the vibration isolation effect of the same vibration isolator under two excitation frequencies. Figure 15 shows the difference in vibration isolation performance of each measurement point with an excitation frequency of 20Hz and 40Hz.
Figure 15 shows that in the low-frequency band, reducing the excitation frequency can reduce the transmission of vibration, and in the middle and high-frequency bands. However, it is not apparent at individual frequencies; In general, reducing the excitation frequency can significantly reduce vibration transmission.
4.2.5. Comparison of Vibration Reduction Effect of Two Stiffness Isolators in Land Vibration Test
Generally speaking, the vibration isolation performance exhibited by vibration isolators with different stiffnesses has a vital reference role for vibration isolator selection. This section selects two vibration isolators with stiffness coefficients of 290 N/mm and 970 N/mm/ to compare and analyze their vibration isolation effects. The vibration isolation effect is studied by comparing the vibration level decrease of the two isolators at the same excitation frequency. The measurement points are selected as measurement points 1-6 for the above analysis.
In Figure 16 and Figure 17, the curves of the vibration level dropout indicate that in the low and medium frequency bands, reducing the stiffness coefficient of the vibration isolator reduces the vibration level dropout, that is, reduces the transmission of vibration. In contrast, regardless of the magnitude of the excitation frequency, the vibration level dropout has no apparent pattern in the higher frequency bands, which the resonance of the vibration isolation system may cause. Therefore, in practical engineering applications, measures should be taken as far as possible to avoid the inherent frequency of the system.
4.2.6. Comparison of Damping Effect of Two Stiffness Isolators for Underwater Vibration Test
In order to explore the vibration reduction effect of the designed floating valve vibration isolation system under more conditions of use, the existing vibration measurement point and data acquisition system arrangement remain unchanged, the device is sunk 10m underwater, and the above conditions of land vibration test are repeated to obtain vibration response data under underwater vibration conditions. The site conditions of the test pool and the layout of the data acquisition system are shown in Figure 18 below.
With the center of the device as the reference line, all the shock absorber sensors are divided into left and right sides. The sensor corresponding to the left shock absorber is No. 1-6, and the sensor corresponding to the right shock absorber is No. 7-12. The vibration level drop of the sensors on both sides under land and underwater vibration test is averaged. Then calculate the difference between the average vibration level drop on land and underwater to find the vibration reduction effect of the floating valve vibration isolation system under land and underwater working conditions as shown in Table 8 below.
Compared with the results of vibration drop on land and underwater under different working conditions, the difference of vibration level drop is not much, and the difference is less than 3dB in most cases.
4.3. Vibration Response of the Cylindrical Shell
In the vibration isolation experiment, the vibration level response of the cylindrical shell structure is also tested. When the excitation frequency applied by the vibration motor is 20 Hz, the vibration level acceleration of the inner wall of the cylindrical shell is measured, and the acceleration level values of two vibration isolators with stiffness coefficients of 290 N/mm and 970 N/mm are compared and analyzed. Measurement points 2, 3, and 5 are selected. The vibration response curves of the cylindrical housing are shown in Figure 19.
The results show that in the frequency band of 10-63 Hz, decreasing the stiffness factor can reduce the vibration stage acceleration and suppress the transmission of vibration, unlike the vibration isolator with a stiffness of 290 N/mm that shows a higher vibration stage response in the frequency band of 80-200 Hz. The vibration transfer to the cylindrical shell at the same excitation frequency shows an apparent overall downward shift of the vibration stage acceleration value, which indicates that the vibration transfer process produces attenuation.
4.4. Underwater Acoustic Radiation of the Cylindrical Shell
In order to explore the influence of the designed floating valve vibration isolation system on the performance of more devices under more operating conditions, the influence of the floating valve vibration isolation system on the underwater acoustic radiation performance of the device after excitation is preliminarily analyzed. The water entry scenario of the device and the corresponding hydrophone arrangement are shown in Figure 20.
Large stiffness vibration isolators and small stiffness vibration isolators were arranged in the floating valve vibration isolation system respectively, and the underwater noise radiation test of the device was carried out with the excitation turned on. The 8 hydrophone measuring points were uniformly arranged around the test device, and the total sound levels of each hydrophone in the 5-10kHz frequency band were calculated and attenuation comparisons were made as shown in Table 9 below.
With the use of vibration isolators with different stiffness, the underwater acoustic response is also significantly reduced. Under the same working condition, the total sound level of underwater acoustic radiation decreases by about 4-5dB.
5. Conclusions
In this paper, the mathematical model of the transfer function of the vibration isolation system is established. The vibration isolation system's vibration characteristics are studied by numerical simulation and experiment. The numerical calculation evaluates the vibration isolation effect of the vibration isolation system by the transfer function. At the same time, a vibration isolation test platform was built. The vibration level of the vibration isolator was decreased to evaluate the vibration isolation effect. The floating raft vibration isolation structure was tested with the vibration motor as the excitation source. This paper mainly draws the following conclusions:
- As shown in Figure 2 and Figure 3, the transfer functions of the vibration isolation system with different stiffnesses and thicknesses of the foundation beam are discussed. The results show that the reduction of the stiffness of the vibration isolator and the increase of the thickness of the foundation beam can effectively suppress the transmission of vibration.
- 4t counterweight to the raft can reduce the inherent frequency of the raft, reduce the vibration transmissibility and improve the vibration isolation effect, all of which are advantages of the vibration control effect test. However, the increase in mass can cause inconvenience to the equipment under actual working conditions. Table 5 and Table 6 show that the finite element simulation results and experimental measurements are within the allowed error range, indicating that the established finite element simulation calculation model is correct.
- Figure 13 shows that both exhibit good vibration transfer when the excitation frequency is 20Hz or 40Hz. The results of the vibration level drop are depicted in Figure 14. It should be noted that the excitation frequency must be carefully chosen in the actual working conditions to avoid the structure's resonant frequency.
- The vibration isolators with two stiffness coefficients are selected, and their vibration isolation performance at the same excitation frequency is analyzed. The results show that the performance of the isolator with minor stiffness is better than that of the isolator with more considerable stiffness at most frequency bands. In Figure 17, the vibration isolator with little stiffness has better vibration isolation performance in the low-frequency band. Comparing Figure 12 and Figure 17, the acceleration level of vibration transfer to the cylindrical shell is significantly reduced, indicating that the vibration is attenuated.
- In the vibration isolation experiment, the actual excitation load is affected by the vibration motor's mass and position, the eccentric block's tuning angle, and the different excitation frequencies. Some frequency bands in the test show a poor vibration isolation effect, consistent with the actual working conditions.
- Two stiffness isolators in the design of the floating valve vibration isolation system can reduce the vibration transmission in a specific frequency range in both land and underwater. In addition, it also has a damping effect on the underwater acoustic radiation of the device.
Author Contributions
Conceptualization, Q.X.; methodology, Y.W; software, Y.W.; validation, Q.H.; formal analysis, Q.H.; investigation, C.W. and Q.X.; resources, Q.X.; data curation, Y.W.; writing—original draft preparation, M.G.; writing—review and editing, M.C. and C.H.; visualization, G.Z.; supervision, G.Z.; project administration, Q.X.; funding acquisition, C.W. All authors have read and agreed to the published version of the manuscript.
Funding
This research was funded by the Natural Science Foundation of Heilongjiang Province (LH2020E070).
Data Availability Statement
In this study, all data are true and reliable. All data are obtained from experimental measurements. The original contributions presented in the study are included in the article.
Conflicts of Interest
The authors declare no conflicts of interest.
References
- Feng, X.; Yan, L.; Chun, W. Review on vibration isolation technology. J. Phys. Conf. Ser. 2021, 1820, 012009. [Google Scholar] [CrossRef]
- Wang, H.; Weng, Z.Y.; Xiang, G.; Lu, B.; Ding, H.G.; You, H.W. The vibration isolation effect research of the floating raft isolation system based on the adjusttable flexibility of foundation. Adv. Mat. Res. 2013, 819, 115–119. [Google Scholar] [CrossRef]
- Li, Y.L.; Xu, D.L.; Fu, Y.M.; Zhou, J.X. Stability and chaotification of vibration isolation floating raft systems with time-delayed feedback control. Chaos An. Interdiscip. J. Nat. Sci. 2011, 21, 033115. [Google Scholar] [CrossRef]
- Song, C.; Yu, C.; Xiao, Y.; Zhang, J. Fuzzy logic control based on genetic algorithm for a multi-source excitations floating raft active vibration isolation system. Adv. Mech. Eng. 2017, 9, 1687814017705843. [Google Scholar] [CrossRef]
- Wu, G.; Jiang, G.H. The finite element design of air compressors floating raft impact vibration isolation system on Ships. Appl. Mech. Mater. 2013, 271, 1234–1238. [Google Scholar] [CrossRef]
- Zhang, Y.; Xu, W.; Li, Z.; Yin, L. Design and dynamic analysis of low-frequency mounting system for marine thrust bearing. J. Braz. Soc. Mech. 2021, 43, 1–11. [Google Scholar] [CrossRef]
- Pérez-Aracil, J.; Pereira, E.; Díaz, I.M.; Reynolds, P. Passive and active vibration isolation under isolator-structure interaction: application to vertical excitations. Meccanica. 2021, 56, 1921–1935. [Google Scholar] [CrossRef]
- Nagaya, K.; Kurusu, A.; Ikai, S.; Shitani, Y. Vibration control of a structure by using a tunable absorber and an optimal vibration absorber under auto-tuning control. J. Sound. Vib. 1999, 228, 773–792. [Google Scholar] [CrossRef]
- Yang, B.; Hu, Y.; Vicario, F.; Zhang, J.; Song, C. Improvements of magnetic suspension active vibration isolation for floating raft system. Int. J. Appl. Electrom. 2017, 53, 193–209. [Google Scholar] [CrossRef]
- Daley, S.; Hätönen, J.; Owens, D.H. Active vibration isolation in a “smart spring” mount using a repetitive control approach. Control Eng. Pract. 2006, 14, 991–997. [Google Scholar] [CrossRef]
- Daley, S.; Zazas, I.; Hatonen, J. Harmonic control of a “smart spring” machinery vibration isolation system. P. I Mecheng. 2008, 222, 109–119. [Google Scholar] [CrossRef]
- Weng, Z.; Liu, S.; Xu, T.; Wu, X.; Wang, Z.; Tang, J. Switch semi-active control of the floating raft vibration isolation system. Strog Vestn-J. Mech. E. 2022, 68, 314–324. [Google Scholar] [CrossRef]
- Sun, H.L.; Zhang, K.; Zhang, P.Q.; Chen, H.B. Application of dynamic vibration absorbers in floating raft system. Appl. Acoust. 2010, 71, 250–257. [Google Scholar] [CrossRef]
- Song, Y.; Wen, J.; Yu, D.; Wen, X. Suppression of vibration and noise radiation in a flexible floating raft system using periodic structures. J. Sound. Vib. 2015, 21, 217–228. [Google Scholar] [CrossRef]
- Ma, Y.; Lin, K.; Yang, Y.; Lou, P. Effects and Analysis of Floating raft vibration isolator parameters on the performance of vibration isolation. MEIC-14. 2014. [Google Scholar]
- Yingli, L.; Daolin, X. Force transmissibility of floating raft systems with quasi-zero-stiffness isolators. J. Vib. Control. 2018, 24, 3608–3616. [Google Scholar] [CrossRef]
- Fang, Y.Y.; Zhang, G.H.; Li, Y.F.; Qi, P.Z. Design of vibration isolation device for ship power equipment and investigation on its dynamic properties. Appl. Mech. Mater. 2014, 496, 1129–1133. [Google Scholar] [CrossRef]
- Kletz, B.T.; Melcher, J. Simultaneous supply of infinite and infinitesimal stiffness of active isolation systems that are exposed to multiple vibration sources. Act. Passiv. Smart Struct. Integr. Syst. 2013. SPIE. 2013, 8688, 279–291. [Google Scholar]
- Orivuori, J.; Zazas, I.; Daley, S. Active control of frequency varying disturbances in a diesel engine. Control Eng. Pract. 2012, 20, 1206–1219. [Google Scholar] [CrossRef]
- Matsagar, V.A.; Jangid, R.S. Impact response of torsionally coupled base-isolated structures. J. Vib. Control. 2010, 16, 1623–1649. [Google Scholar] [CrossRef]
- Daley, S.; Johnson, F.A.; Pearson, J.B.; Dixon, R. Active vibration control for marine applications. Control Eng. Pract. 2004, 12, 465–474. [Google Scholar] [CrossRef]
- Yucel, A.; Arpaci, A. Free and forced vibration analyses of ship structures using the finite element method. J. Mar. Sci. Technol. 2013, 18, 324–338. [Google Scholar] [CrossRef]
- Wang, F.M.; Wang, C.G.; Guo, L.L.; Wen, B.C.; Li, Y. Study on floating raft vibration isolation system for pumping unit. Adv. Mat. Res. 2012, 383, 130–135. [Google Scholar] [CrossRef]
- Hu, Z.C.; He, L.; Li, Y. The influence of the isolator’s distribution on floating raft isolation system’s performance. Ship Technol. Res. 2016, 38, 48–52. [Google Scholar]
- Li, S.D. ; LIU; Y Effect analysis of geometric parameters of floating raft on isolation performance. CJSR. 2017, 12, 108–113. [Google Scholar] [CrossRef]
- Fu, J.; Wang, Y.S.; Wei, Y.S. Analysis of power flow of floating raft with multi-exciters by FEM. J. Ship Mech. 2012, 16, 684–691. [Google Scholar]
- Wang, Z.; Mak, C.M. Optimization of geometrical parameters for periodical structures applied to floating raft systems by genetic algorithms. Appl Acoust. 2018, 129, 108–115. [Google Scholar] [CrossRef]
- Sheng, M.; Wang, T.; Wang, M.; Wang, X.; Zhao, X. Effect of distributive mass of spring on power flow in engineering test. J. Sound. Vib. 2018, 424, 365–377. [Google Scholar] [CrossRef]
- Xu, Y.; Yang, T.; Fuller, C.R.; Sun, Y.; Liu, Z. A theoretical analysis on the active structural acoustical control of a vibration isolation system with a coupled plate-shell foundation. Int. J. Mech. Sci. 2020, 170, 105334. [Google Scholar] [CrossRef]
- Choi, W.J.; Xiong, Y.P.; Shenoi, R.A. Power flow analysis for a floating sandwich raft isolation system using a higher-order theory. J. Sound. Vib. 2009, 319, 228–246. [Google Scholar] [CrossRef]
- Wen, X.; Li, W.; Fang, Y.; Song, C.; Zhang, J. Design and vibration isolation performance of truss-type CFRP raft frame. Shock. Vib. 2019. [CrossRef]
- Niu, J.; Song, K.; Lim, C.W. On active vibration isolation of floating raft system. J. Sound Vib. 2005, 285, 391–406. [Google Scholar] [CrossRef]
- Zhang, J.G.; Yang, H.R.; Chen, G.Z.; Zhang, Z. Structure and modal analysis of carbon fiber reinforced polymer raft frame. J. Low. Freq. Noise V. A. 2018, 37, 577–589. [Google Scholar] [CrossRef]
- Geng, C.; Weng, Z.; Wang, H.; Tang, J. The Dynamic Characteristics of the Controllable Floating Raft System. Int Conf Electr, Electr Mech. Atlantis Press. 2015; 155–158. [Google Scholar]
- Cai, Y.; Zhang, K.; Ye, Z.; Liu, C.; Lu, K.; Wang, L. Influence of Temperature on the Natural Vibration Characteristics of Simply Supported Reinforced Concrete Beam. Sensors 2021, 21, 4242. [Google Scholar] [CrossRef]
Figure 1.
Mathematical model of vibration isolation system.
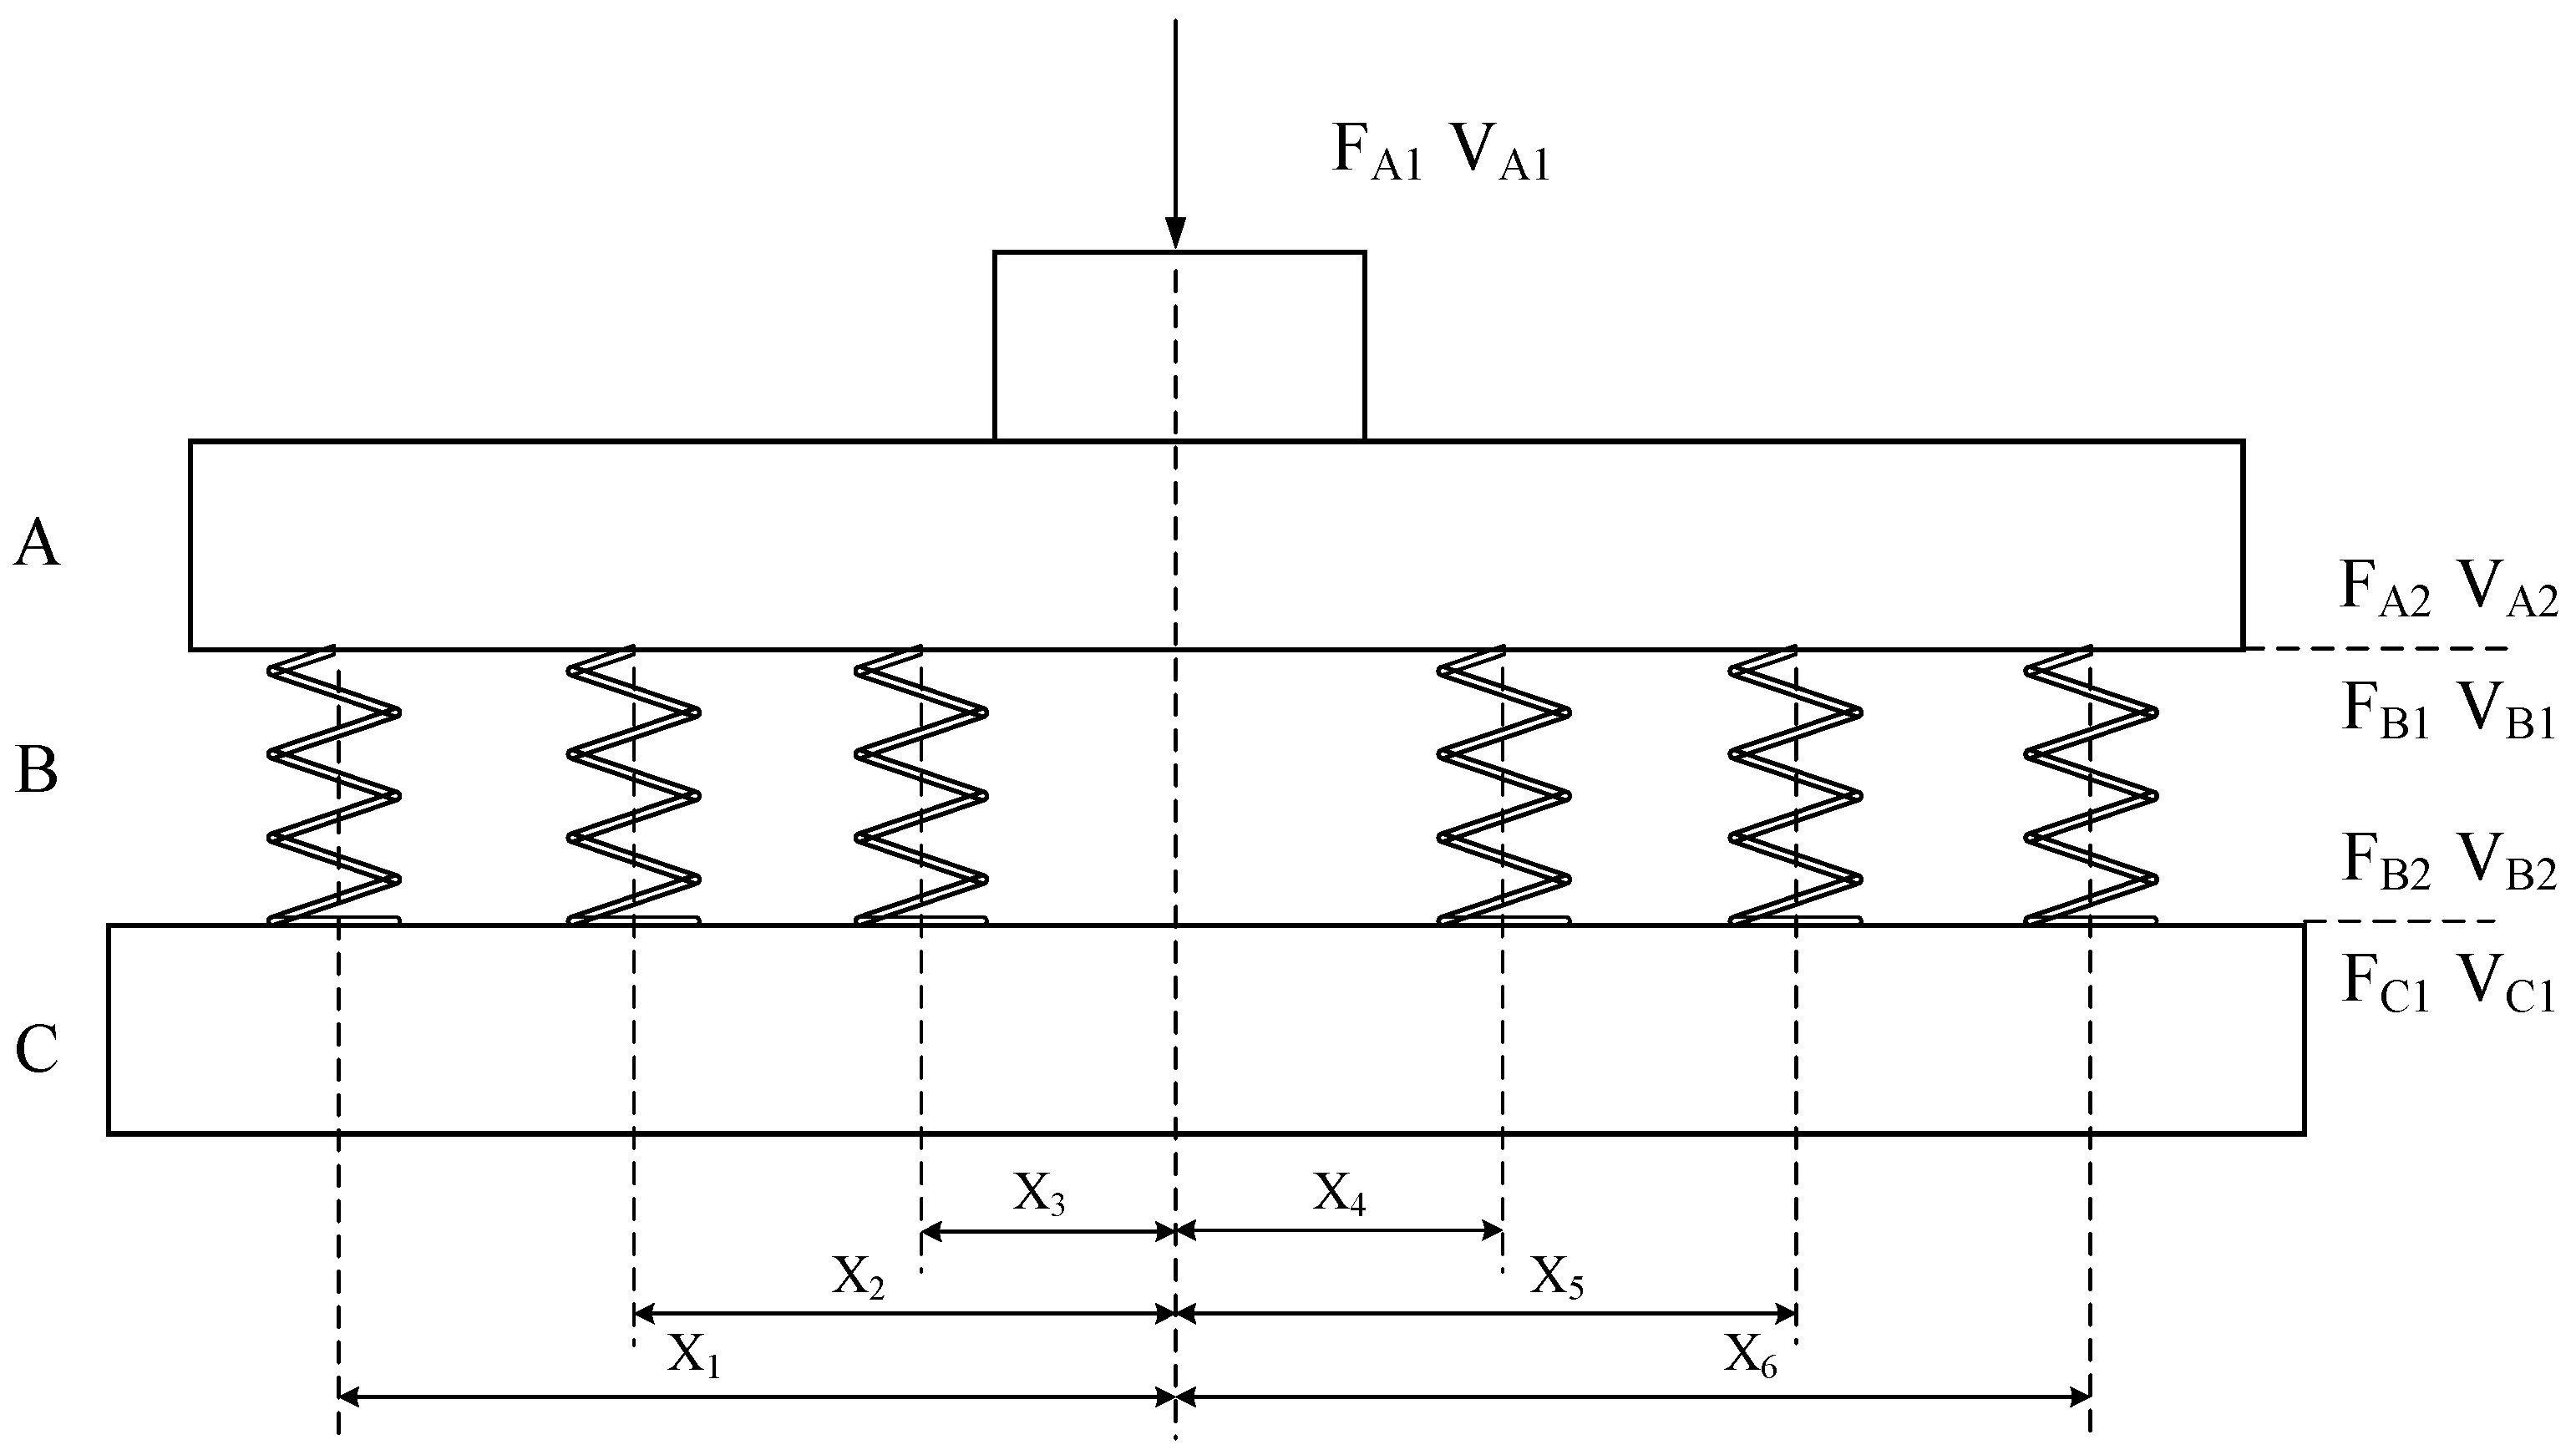
Figure 2.
The influence of vibration isolator stiffness on transfer function.
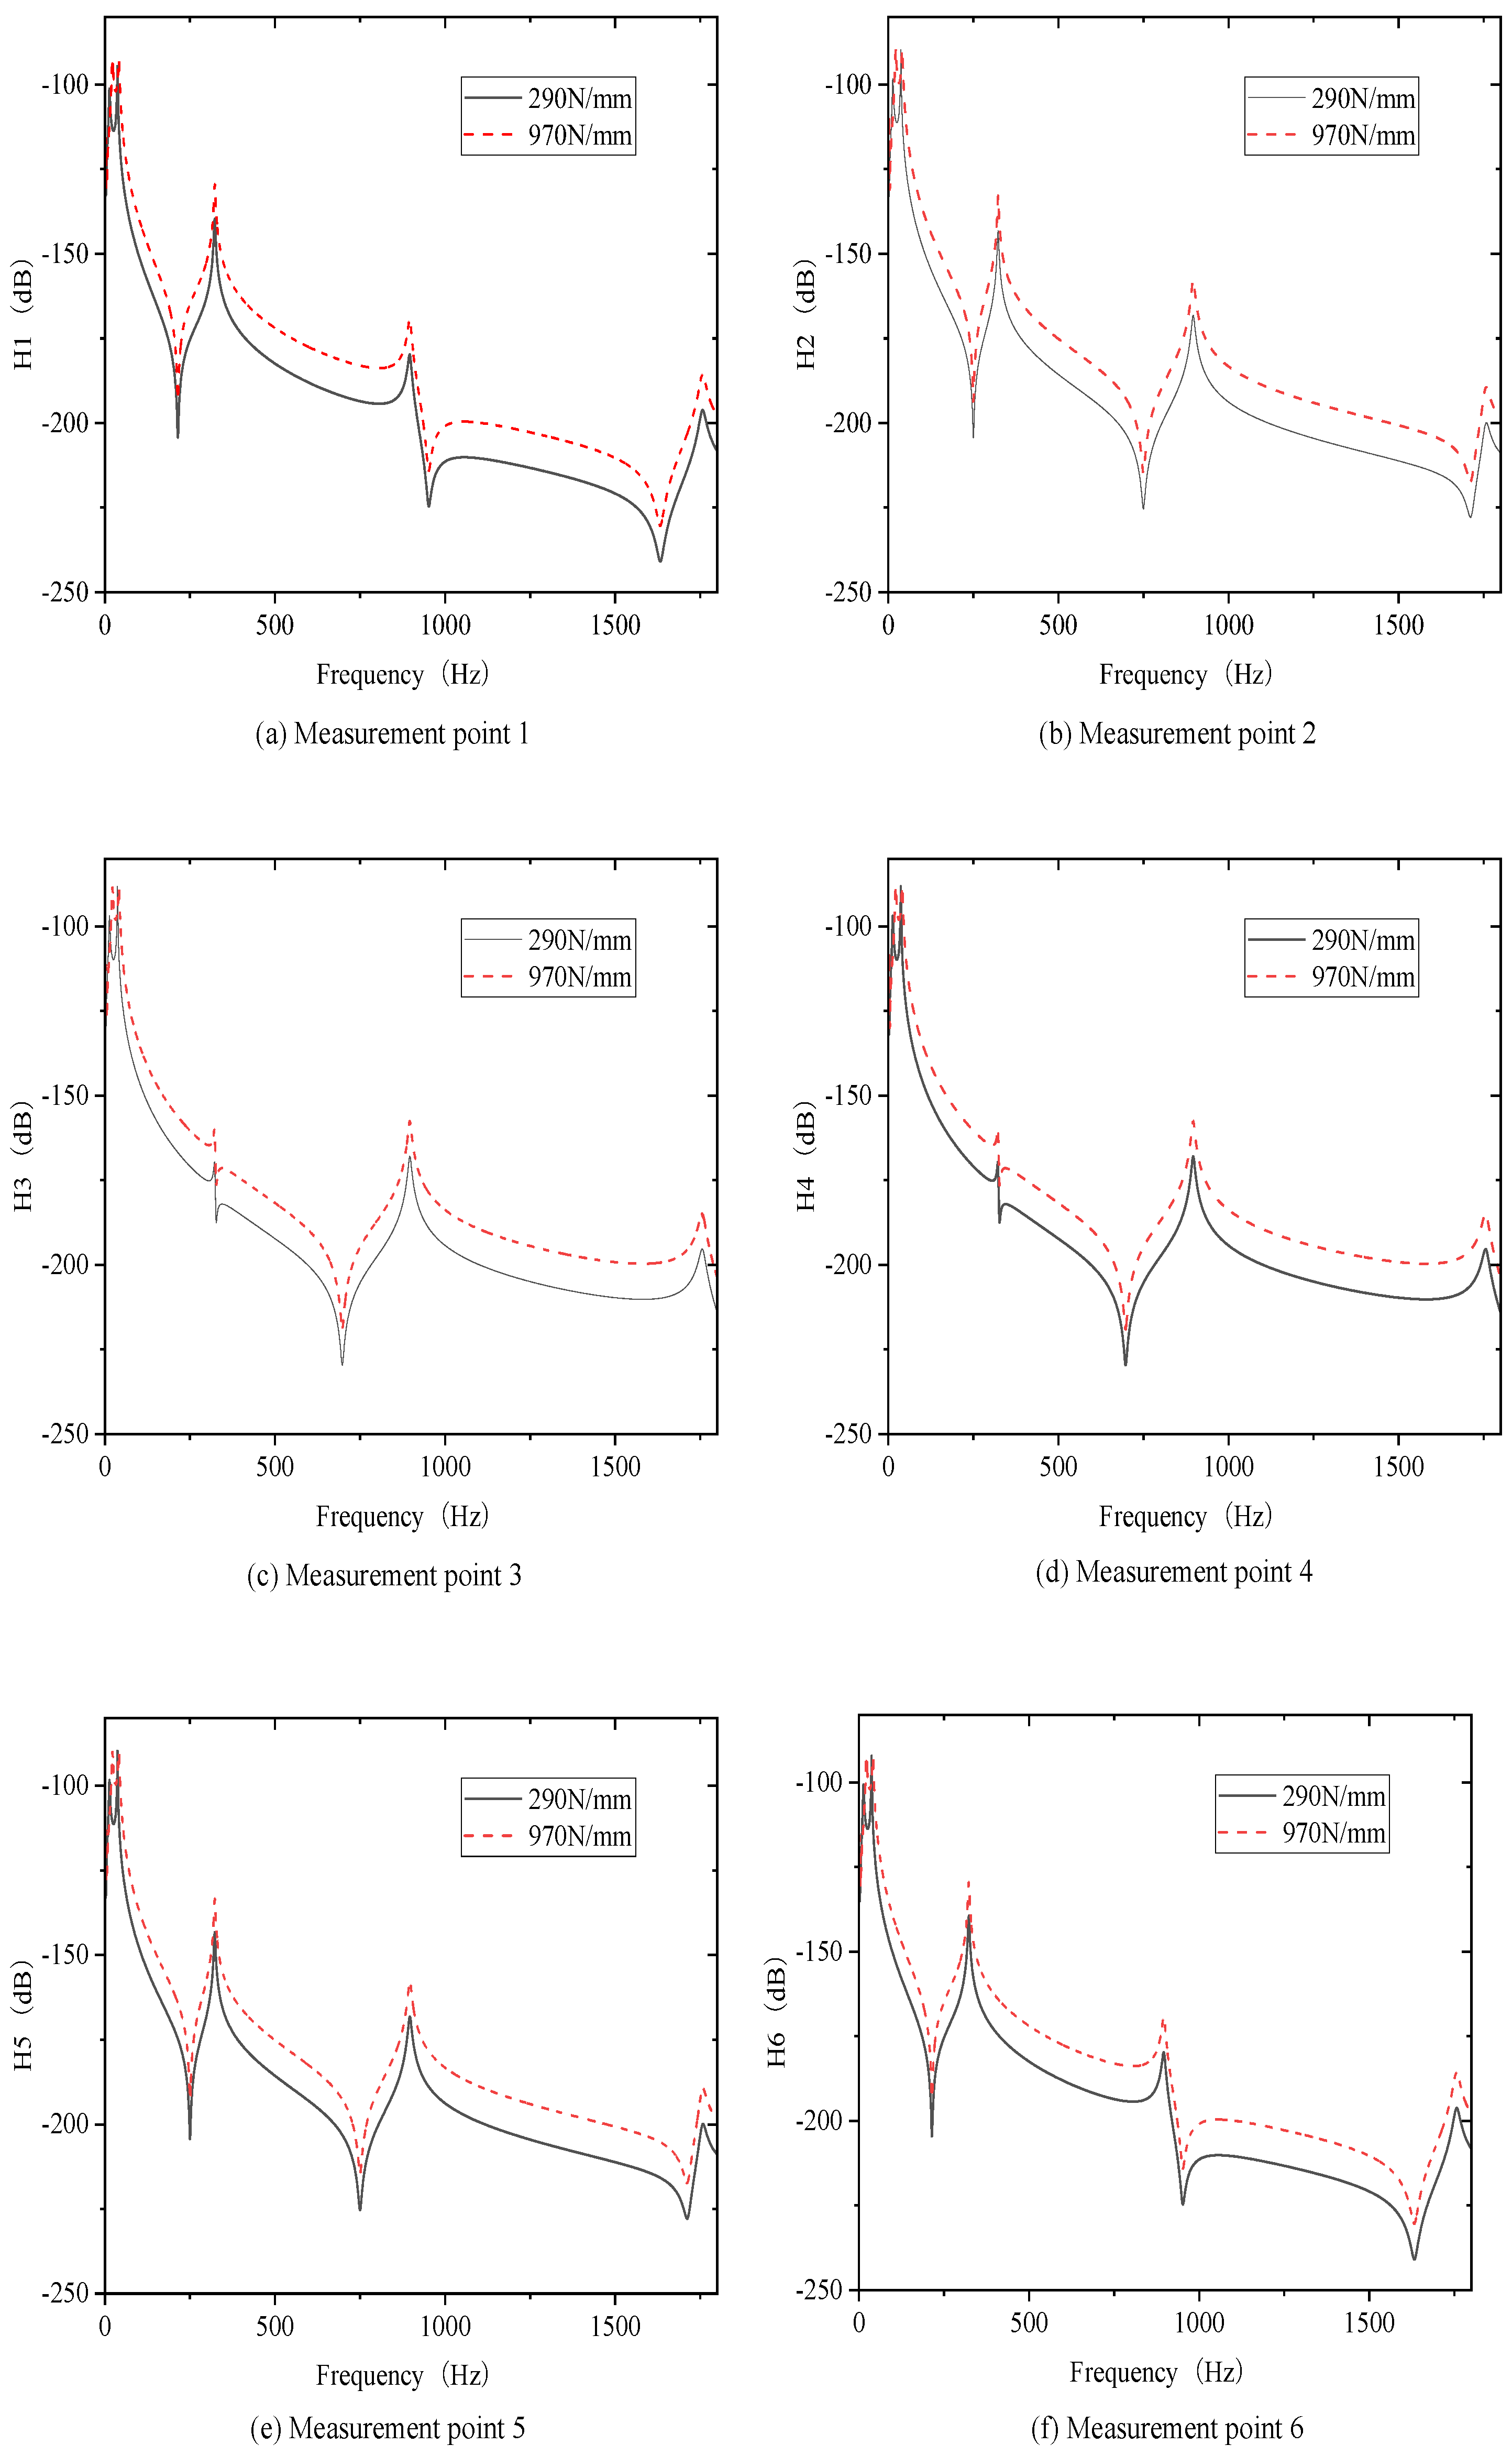
Figure 3.
The influence of vibration isolator stiffness on transfer function.
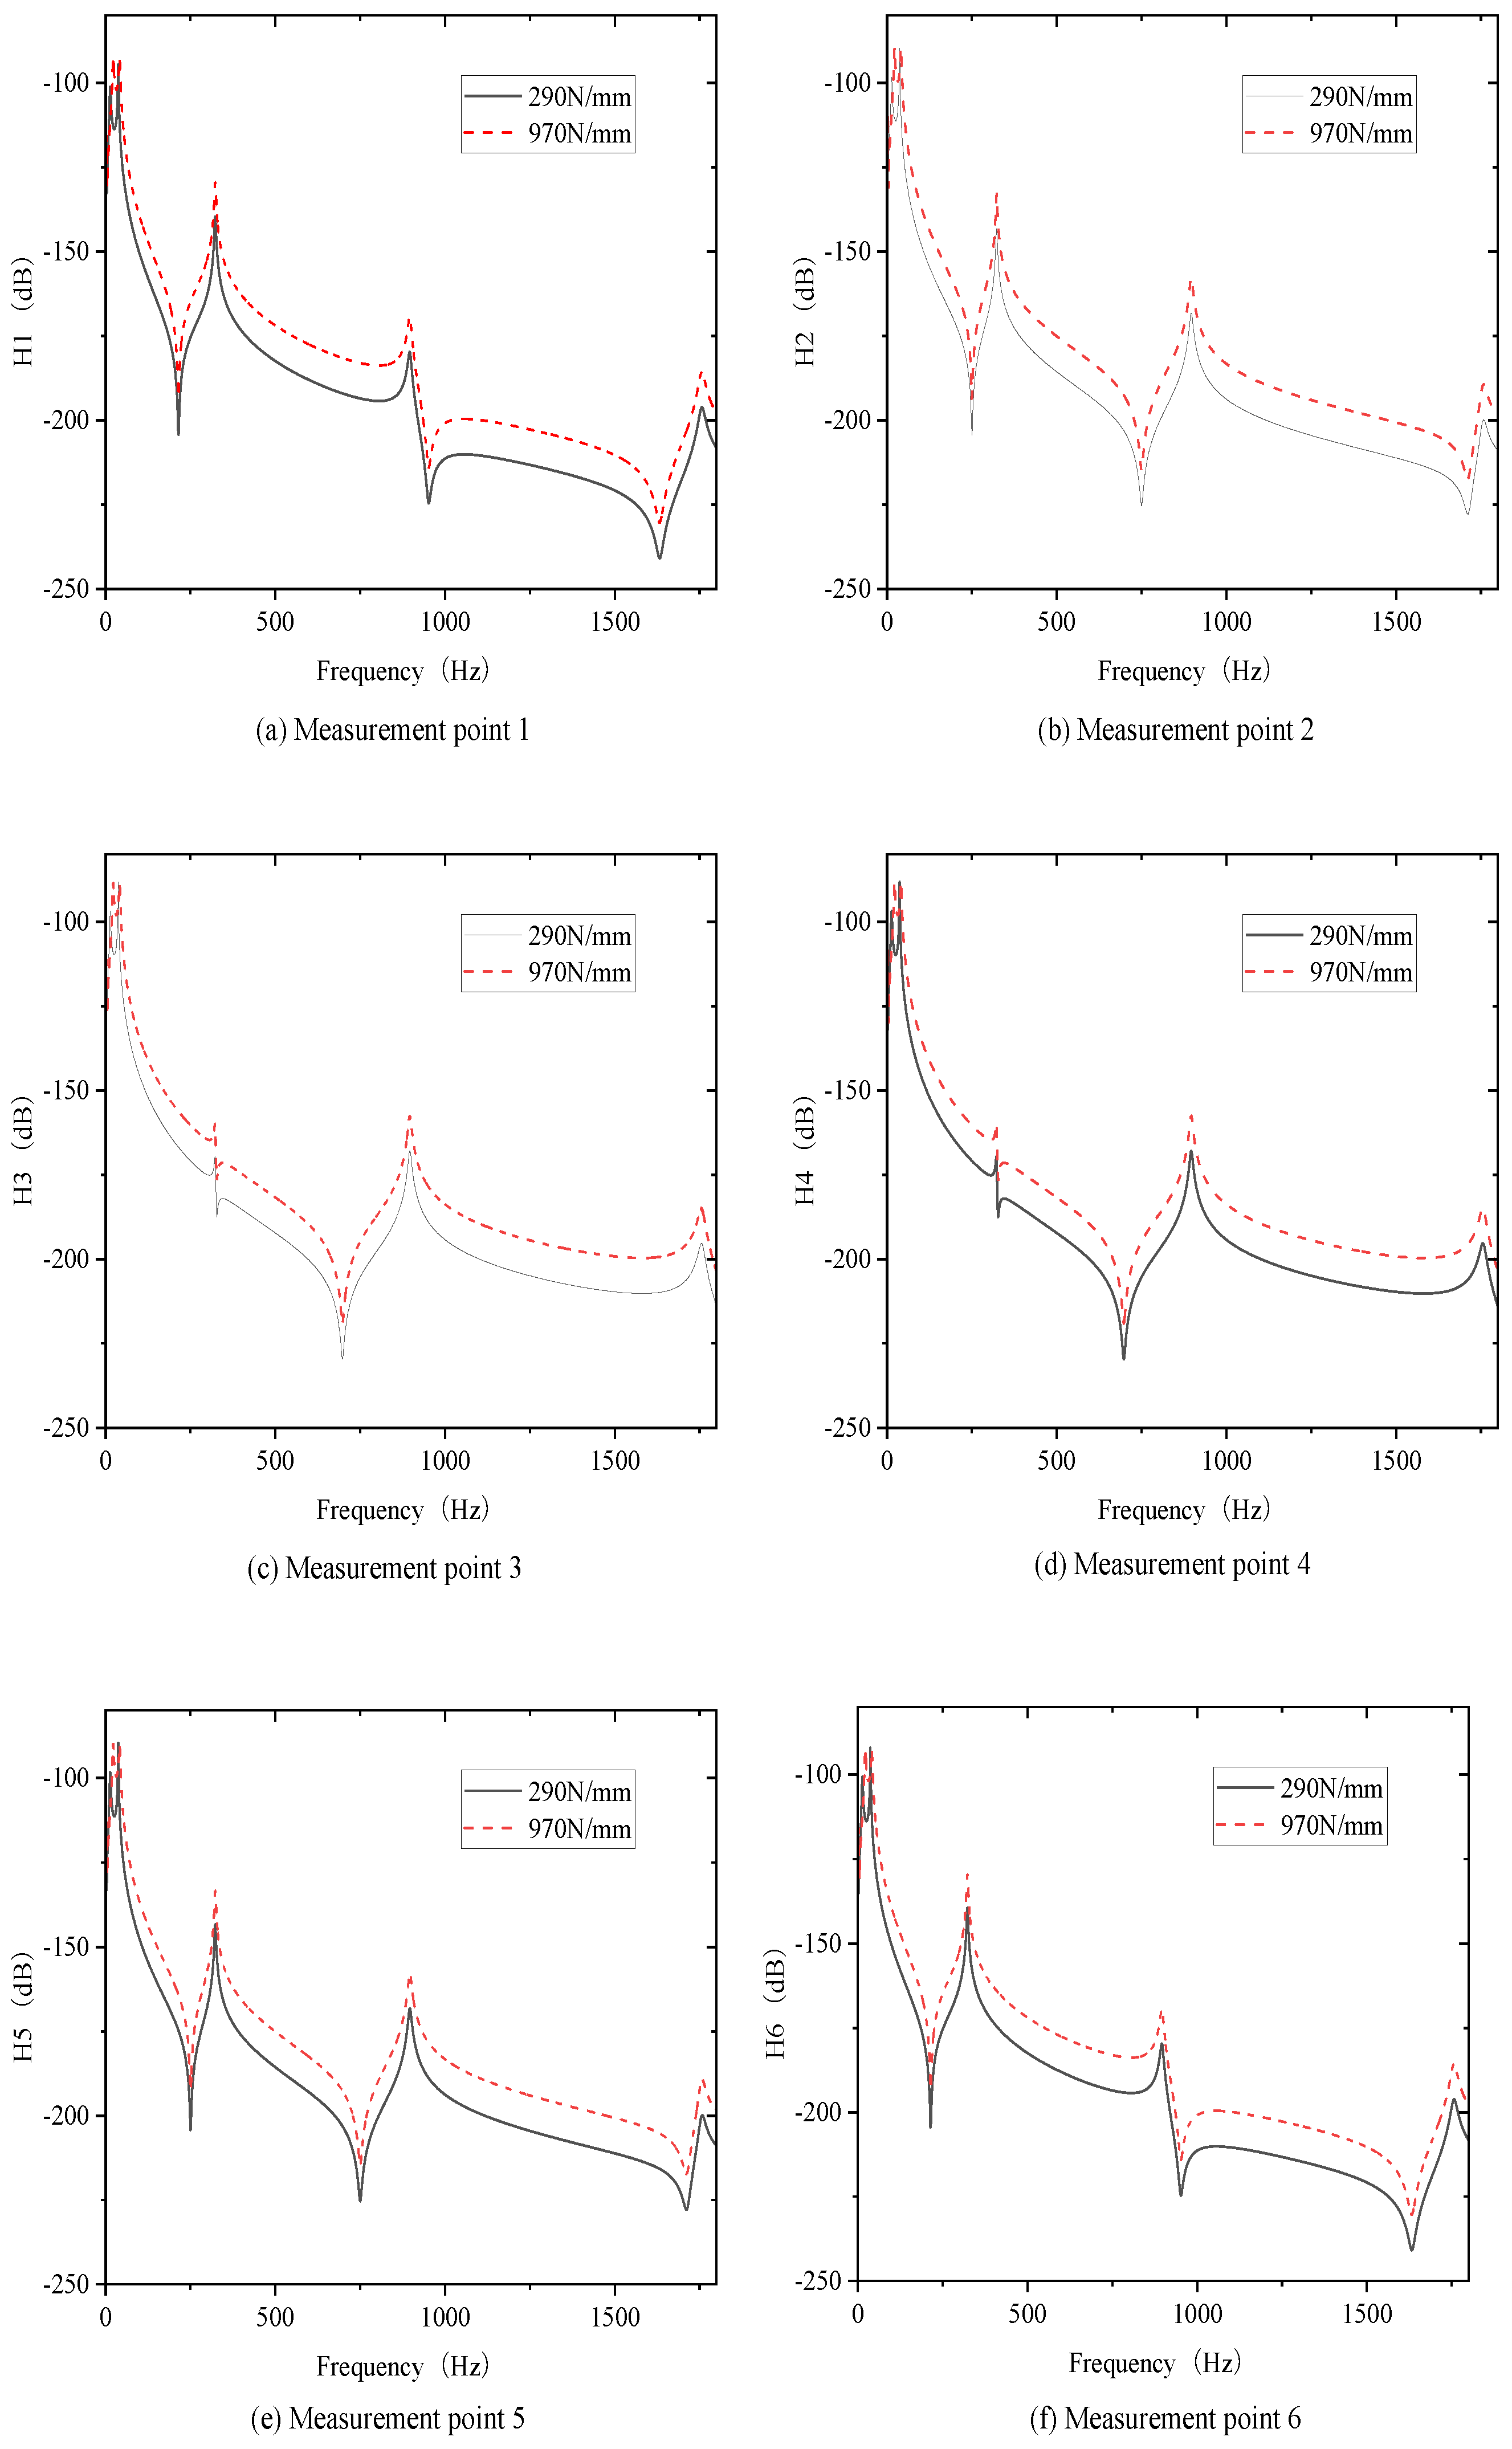
Figure 4.
Influence of the foundation beam on the transfer function.
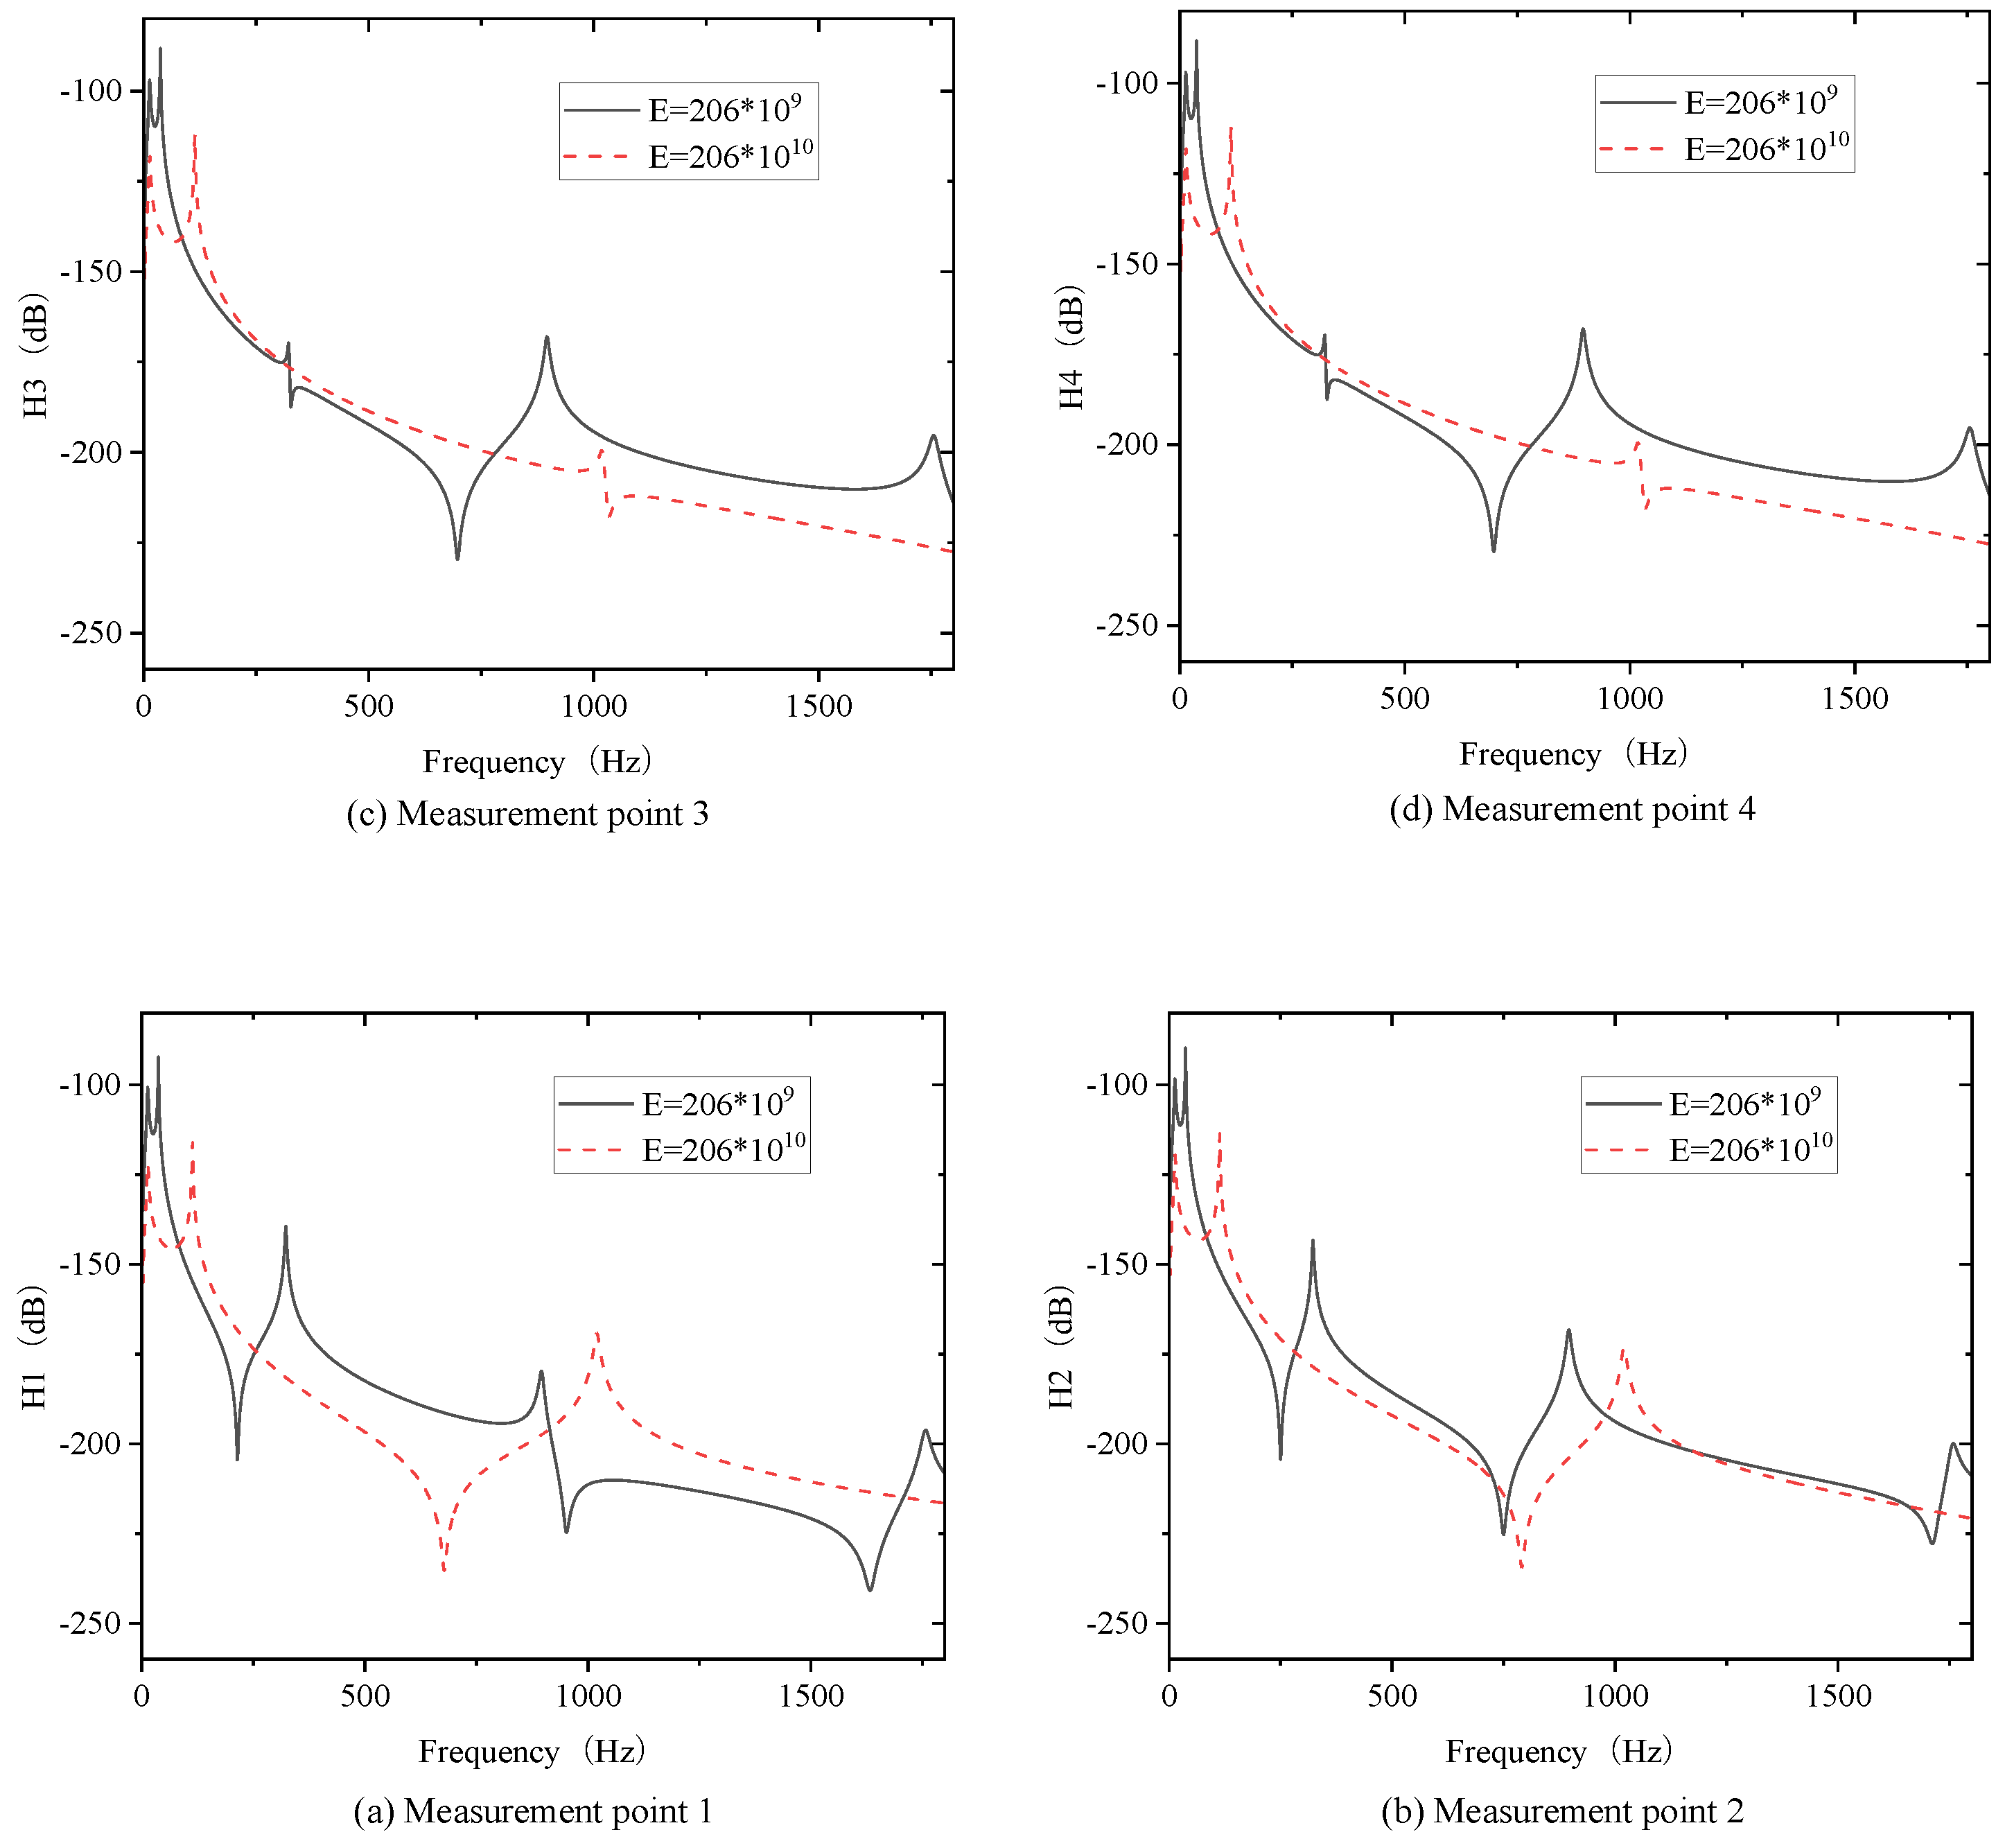
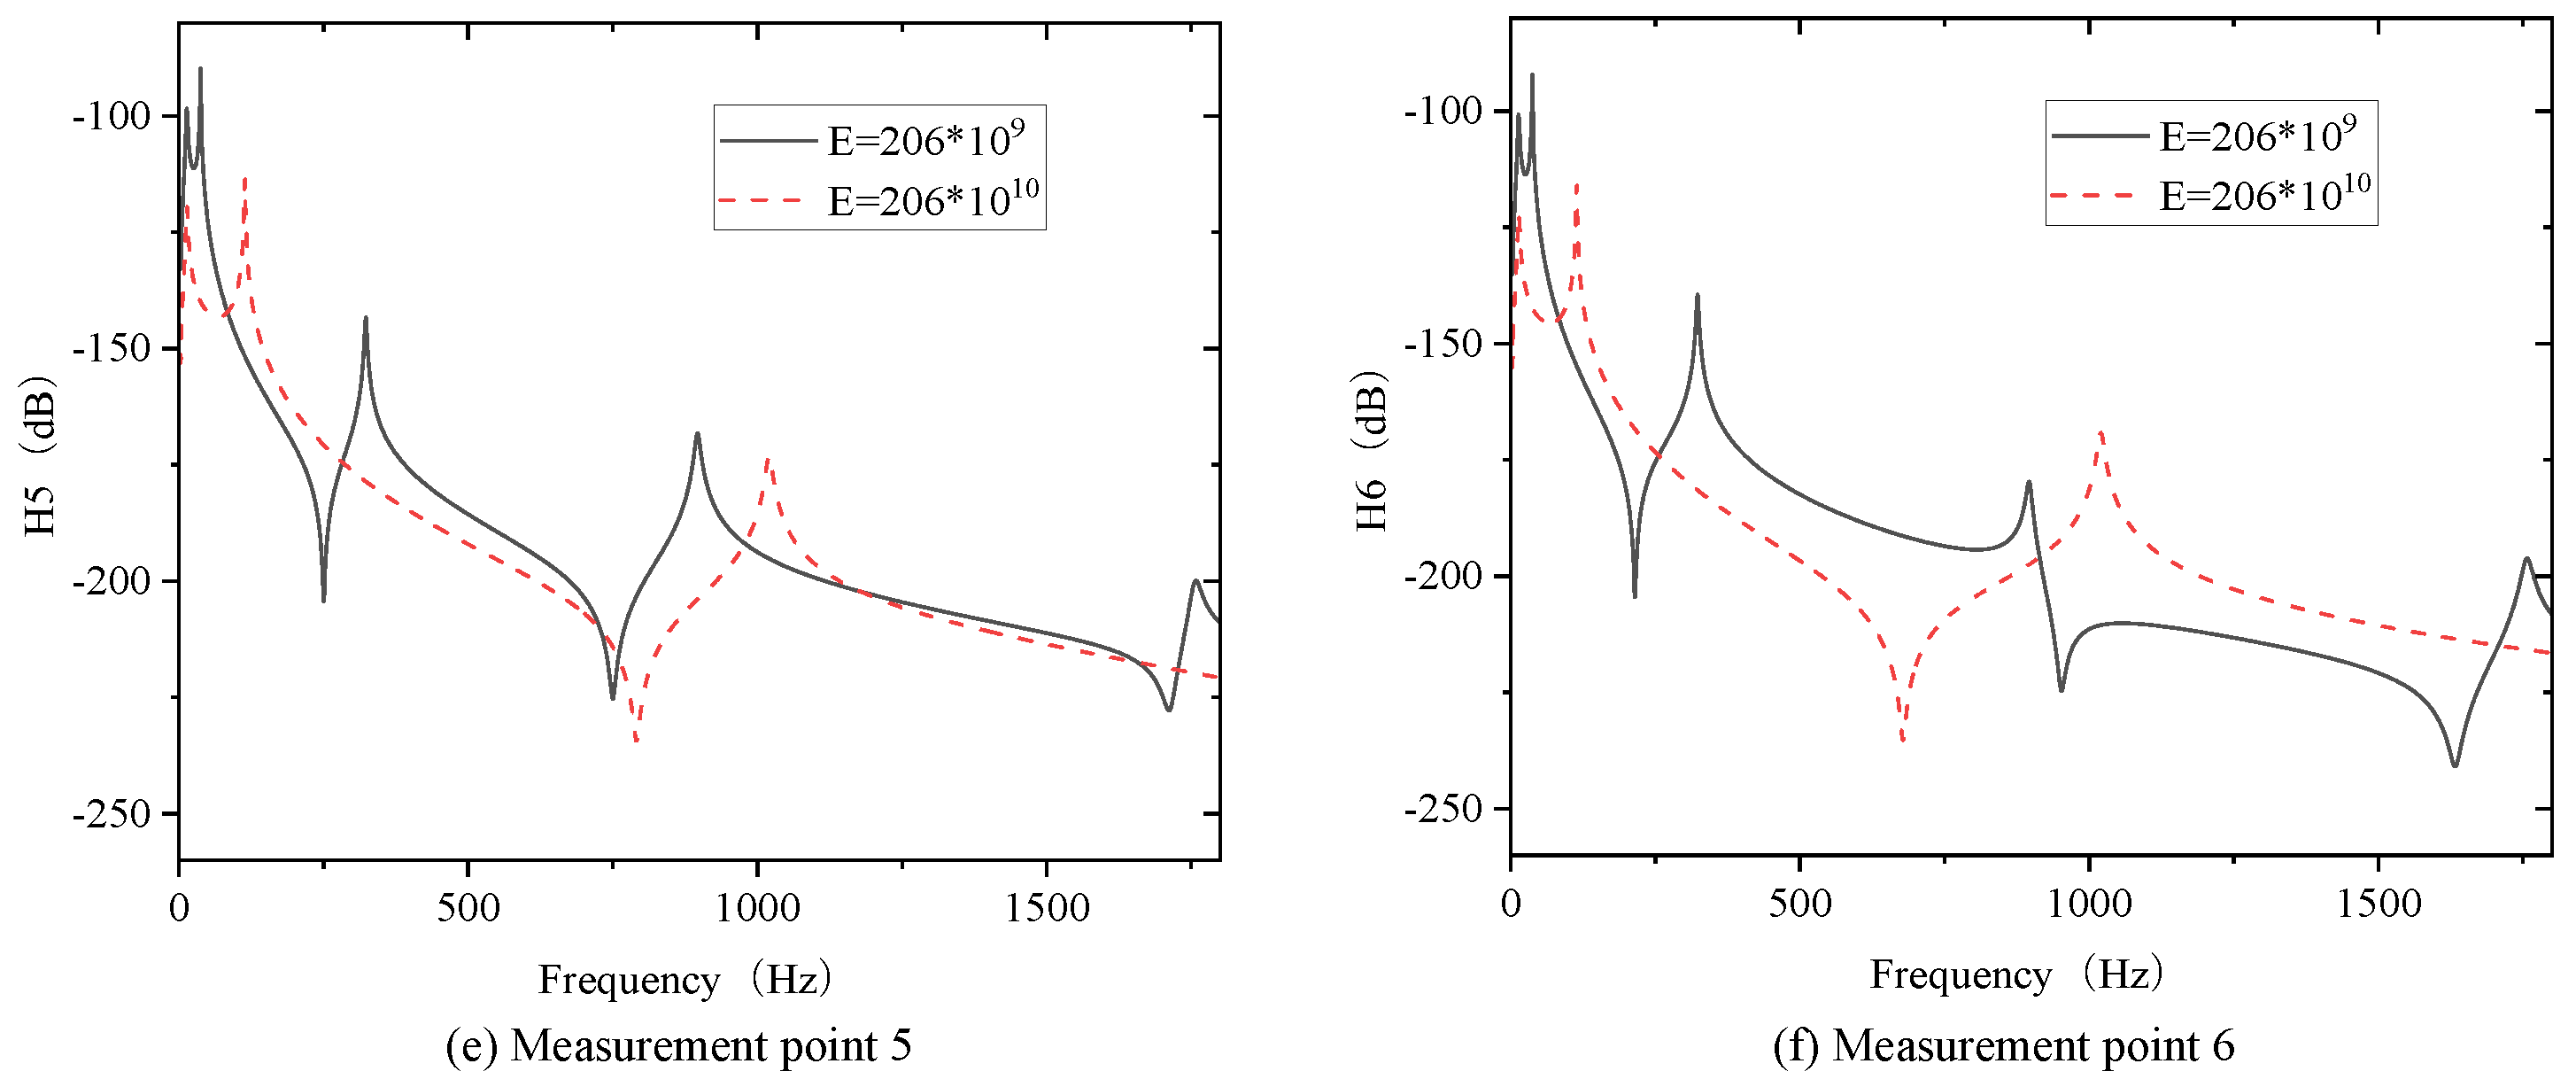
Figure 5.
Finite element model of the cylindrical shell.
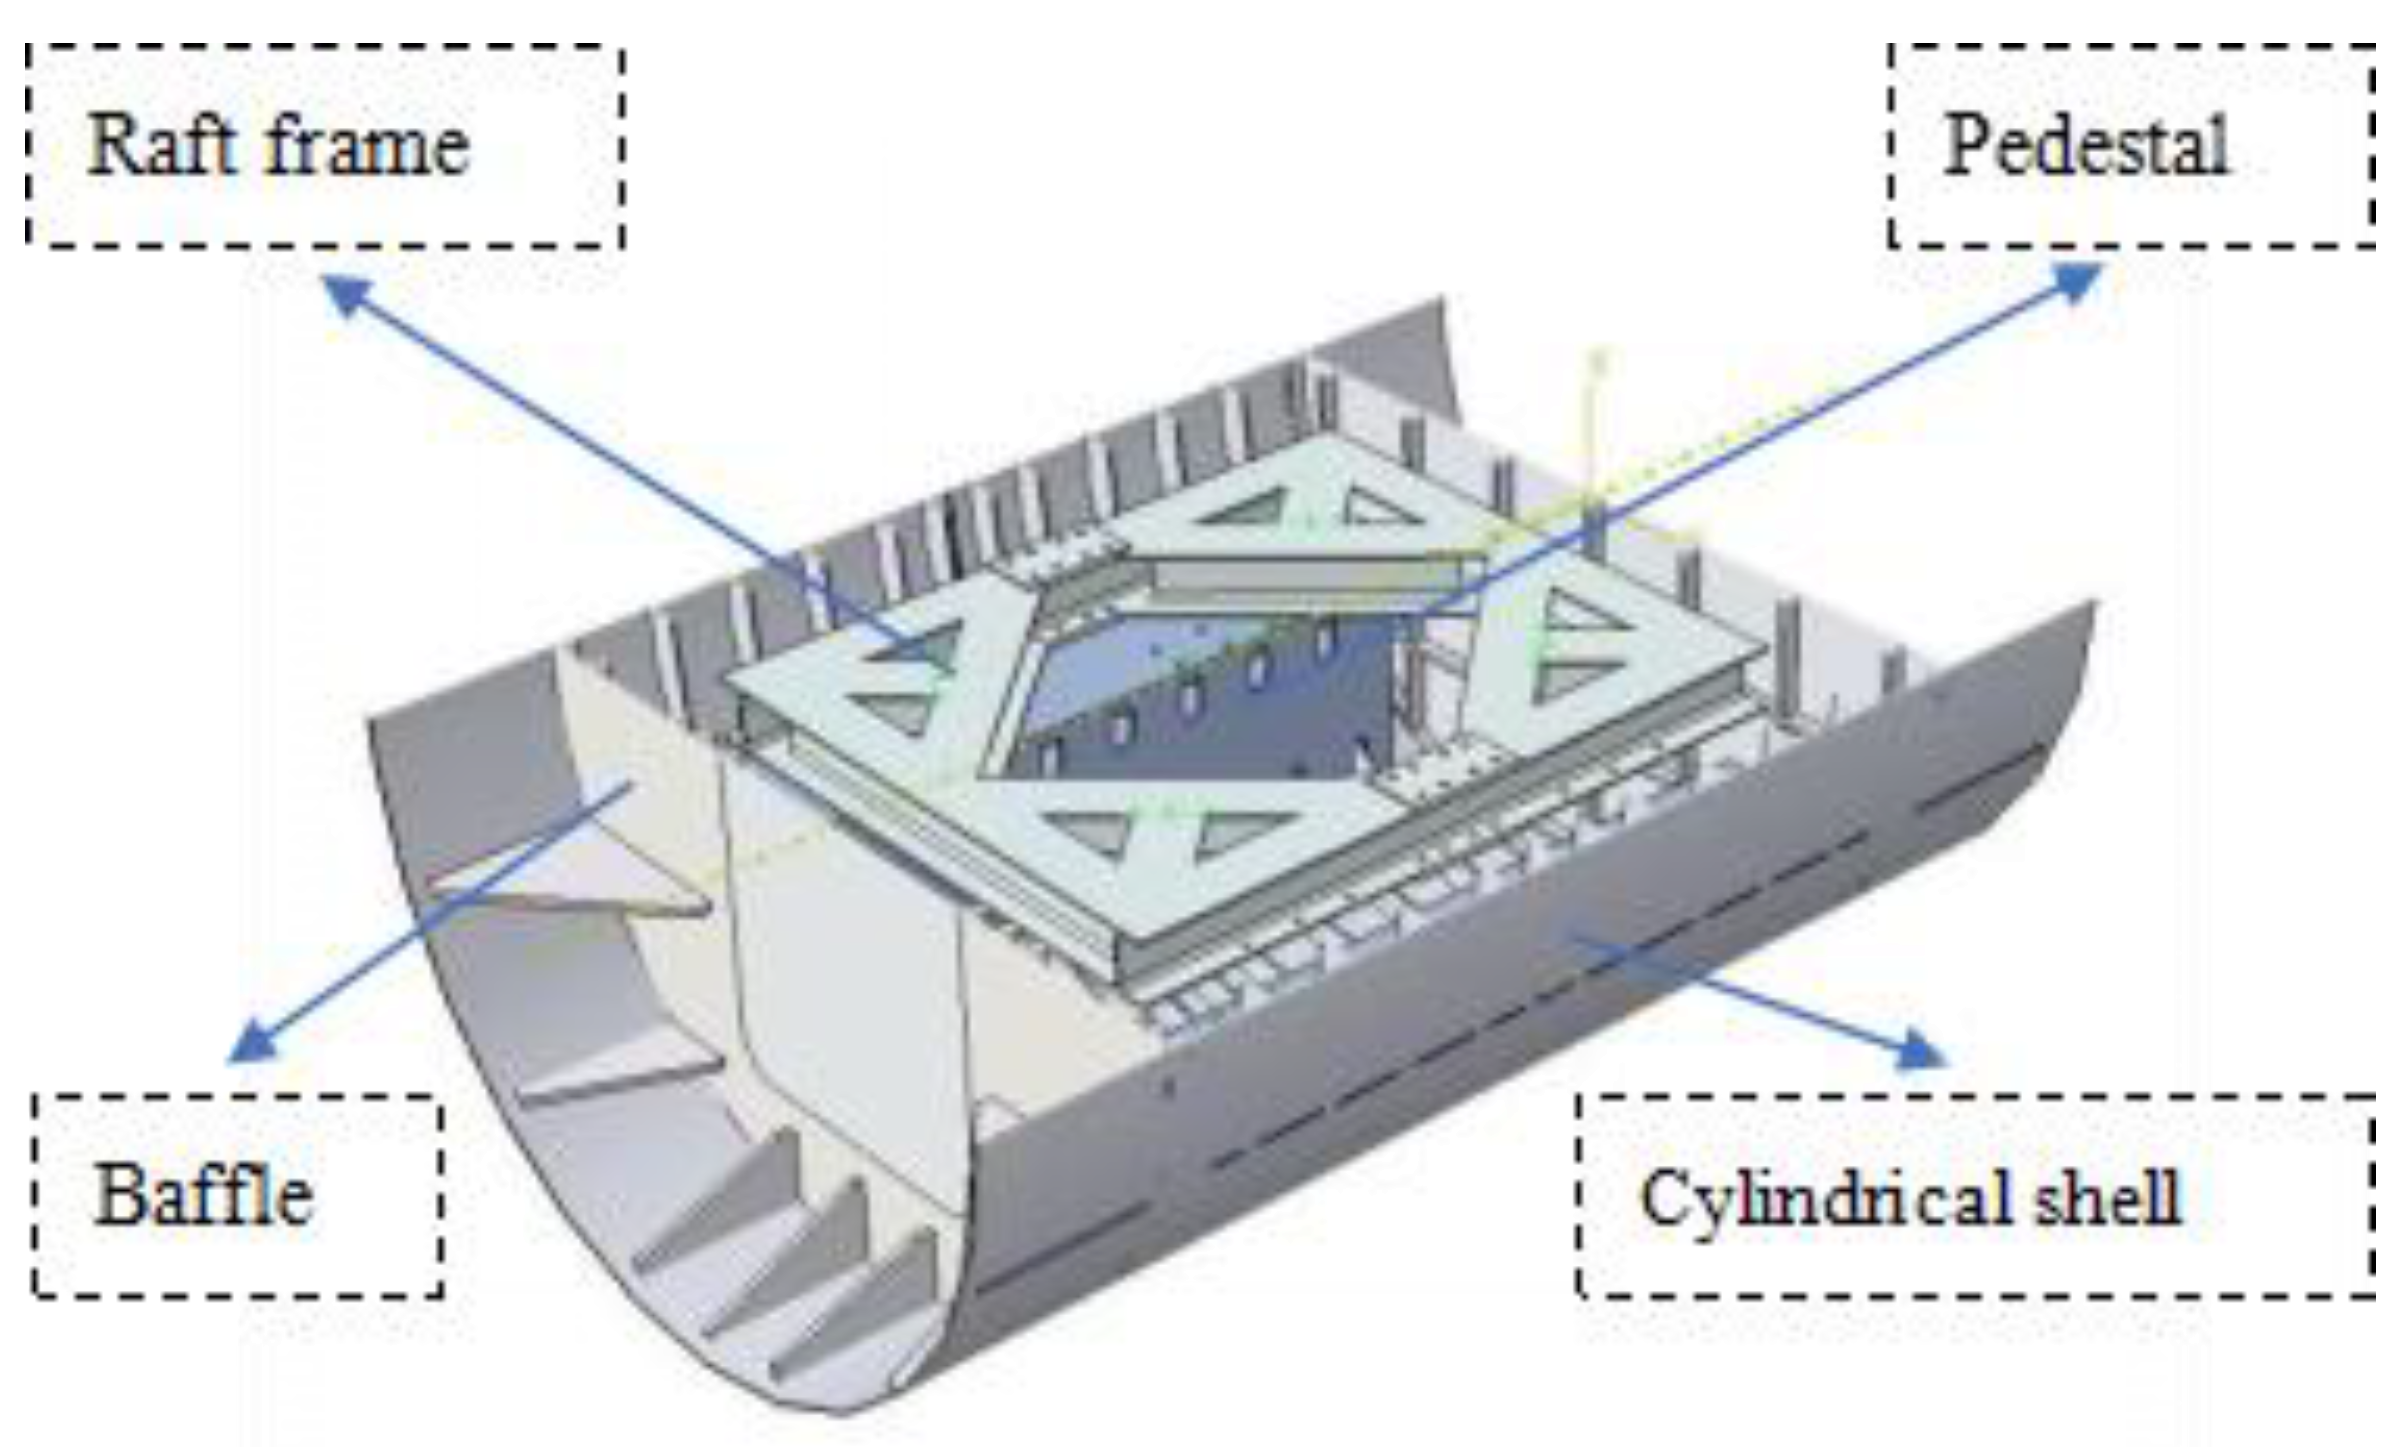
Figure 6.
Modal shapes of the (a) first order, (b) second order, (c) third order, (d) fourth order, (e) fifth order, and (f) sixth order of the unweighted raft frame.
Figure 6.
Modal shapes of the (a) first order, (b) second order, (c) third order, (d) fourth order, (e) fifth order, and (f) sixth order of the unweighted raft frame.
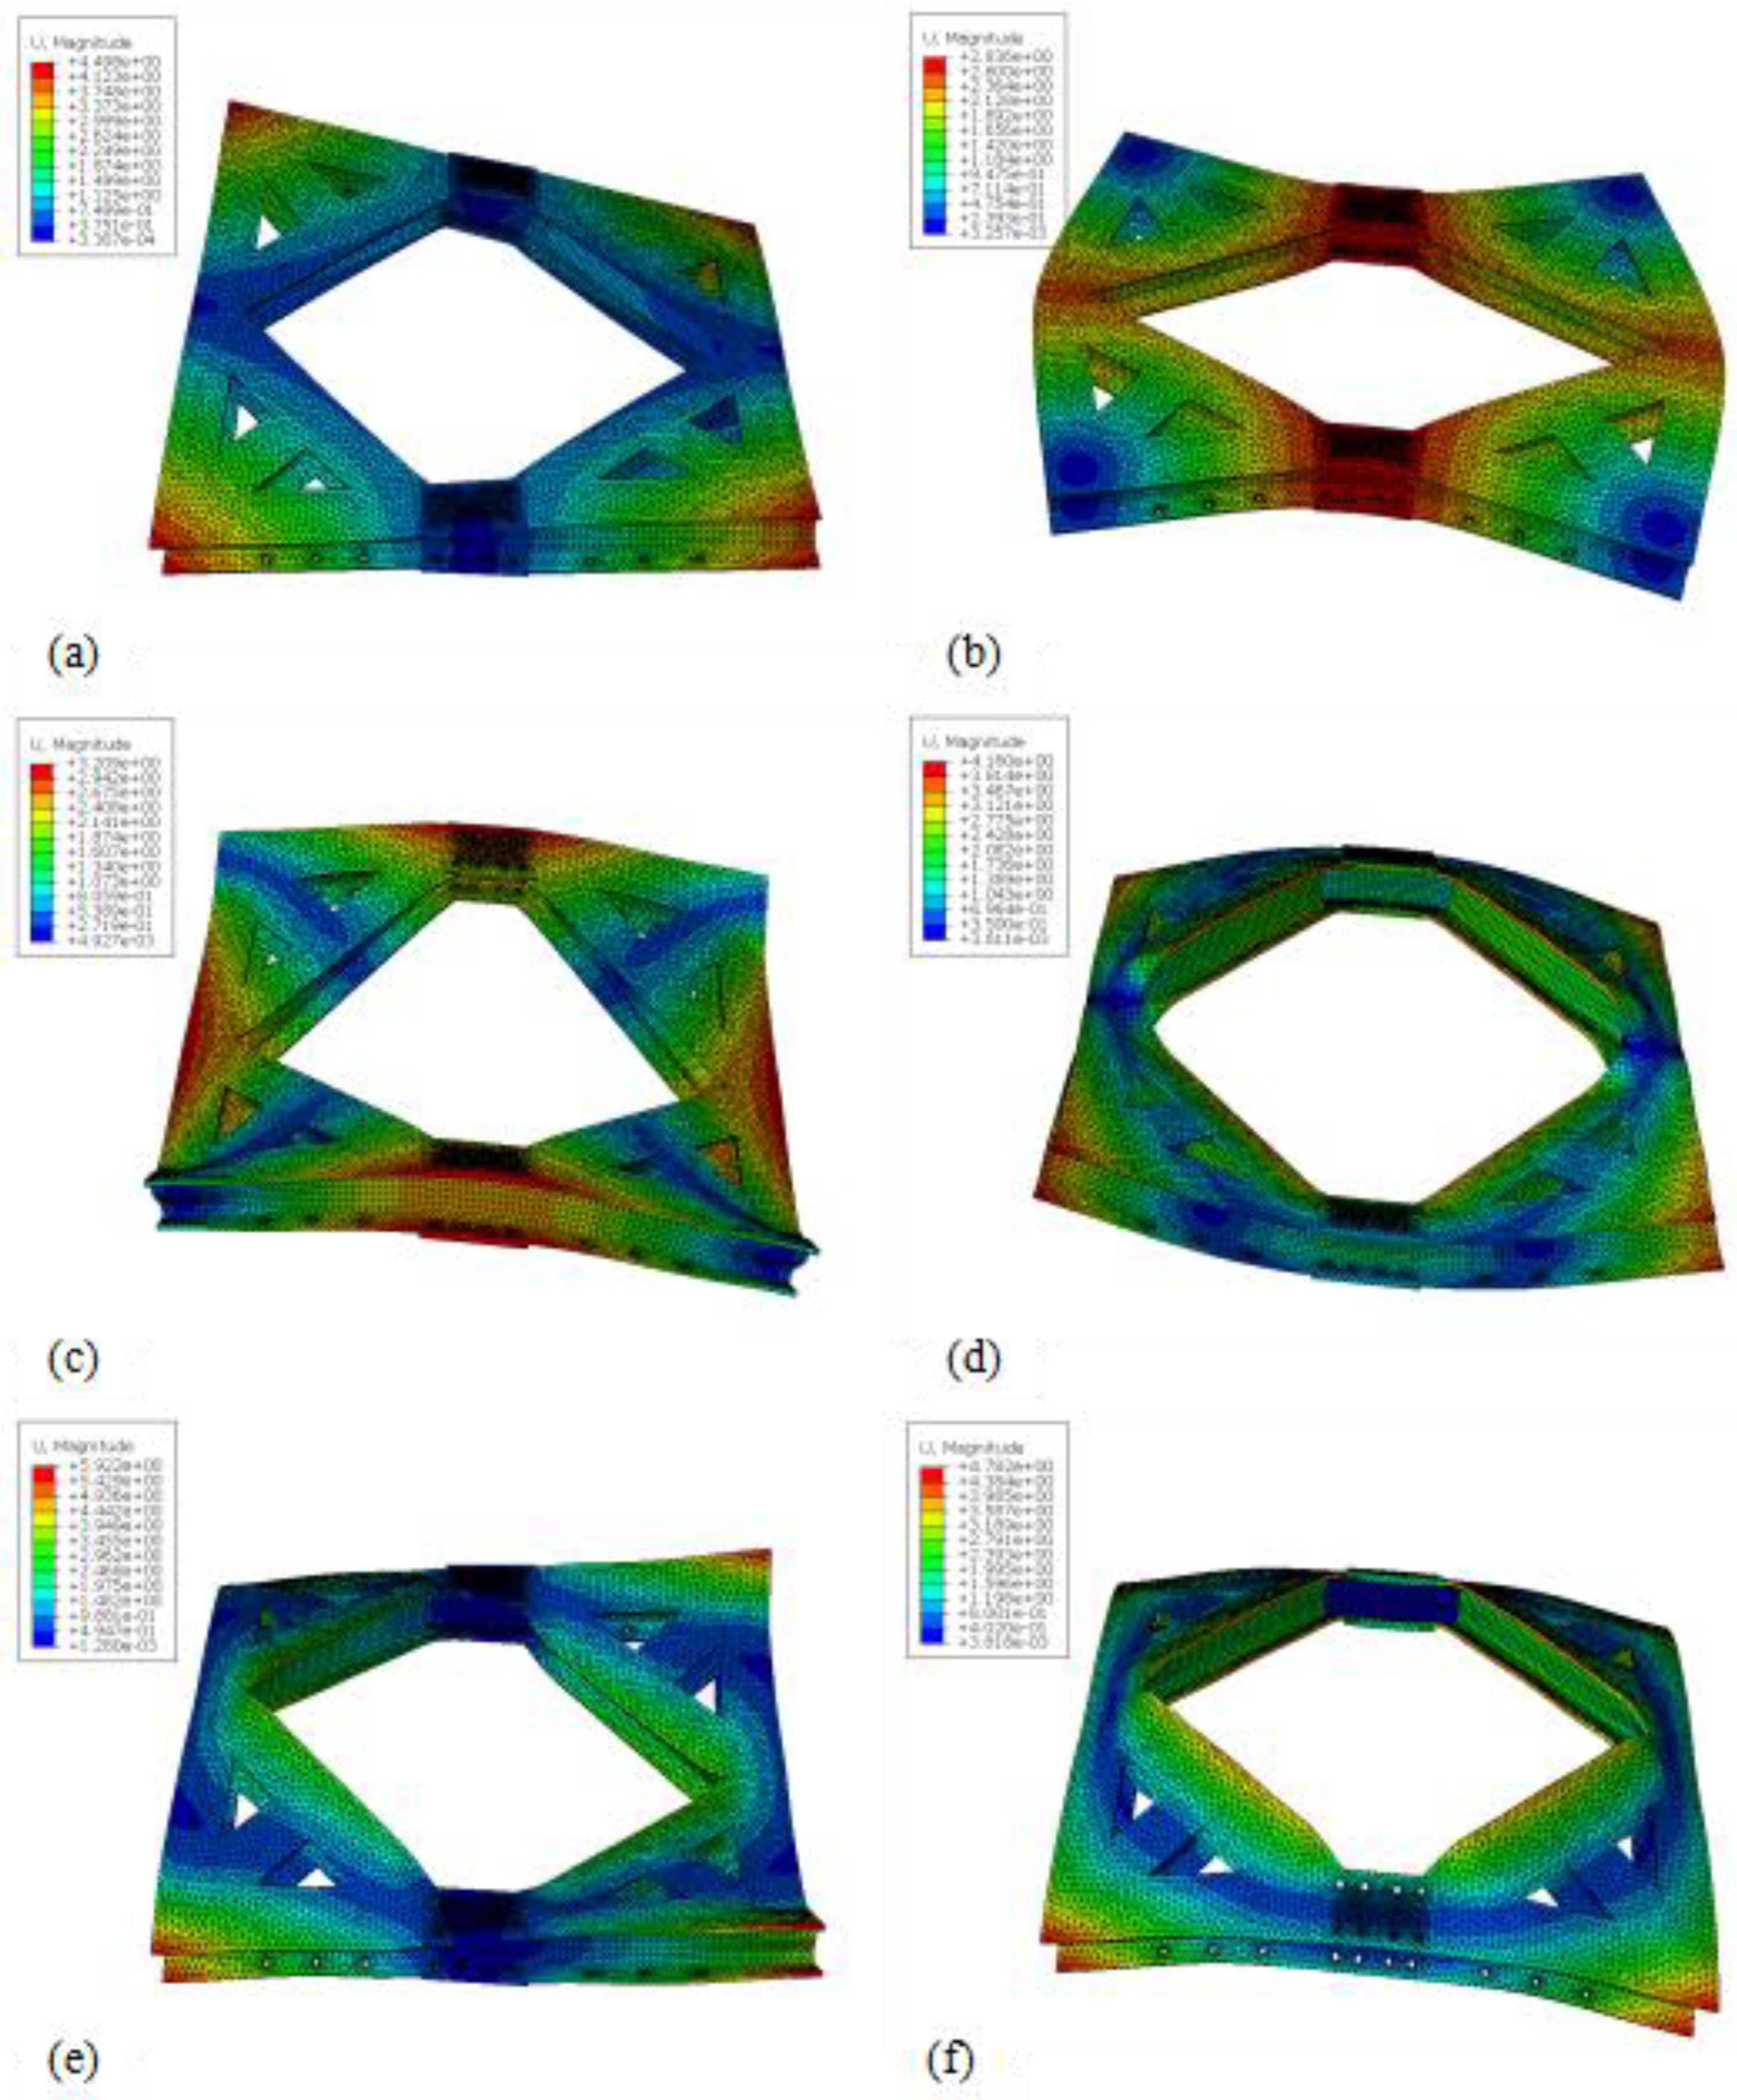
Figure 7.
Modal shapes (a) first order, (b) second order, (c) third order, (d) fourth order, (e) fifth order, and (f) sixth order of raft with counterweight.
Figure 7.
Modal shapes (a) first order, (b) second order, (c) third order, (d) fourth order, (e) fifth order, and (f) sixth order of raft with counterweight.
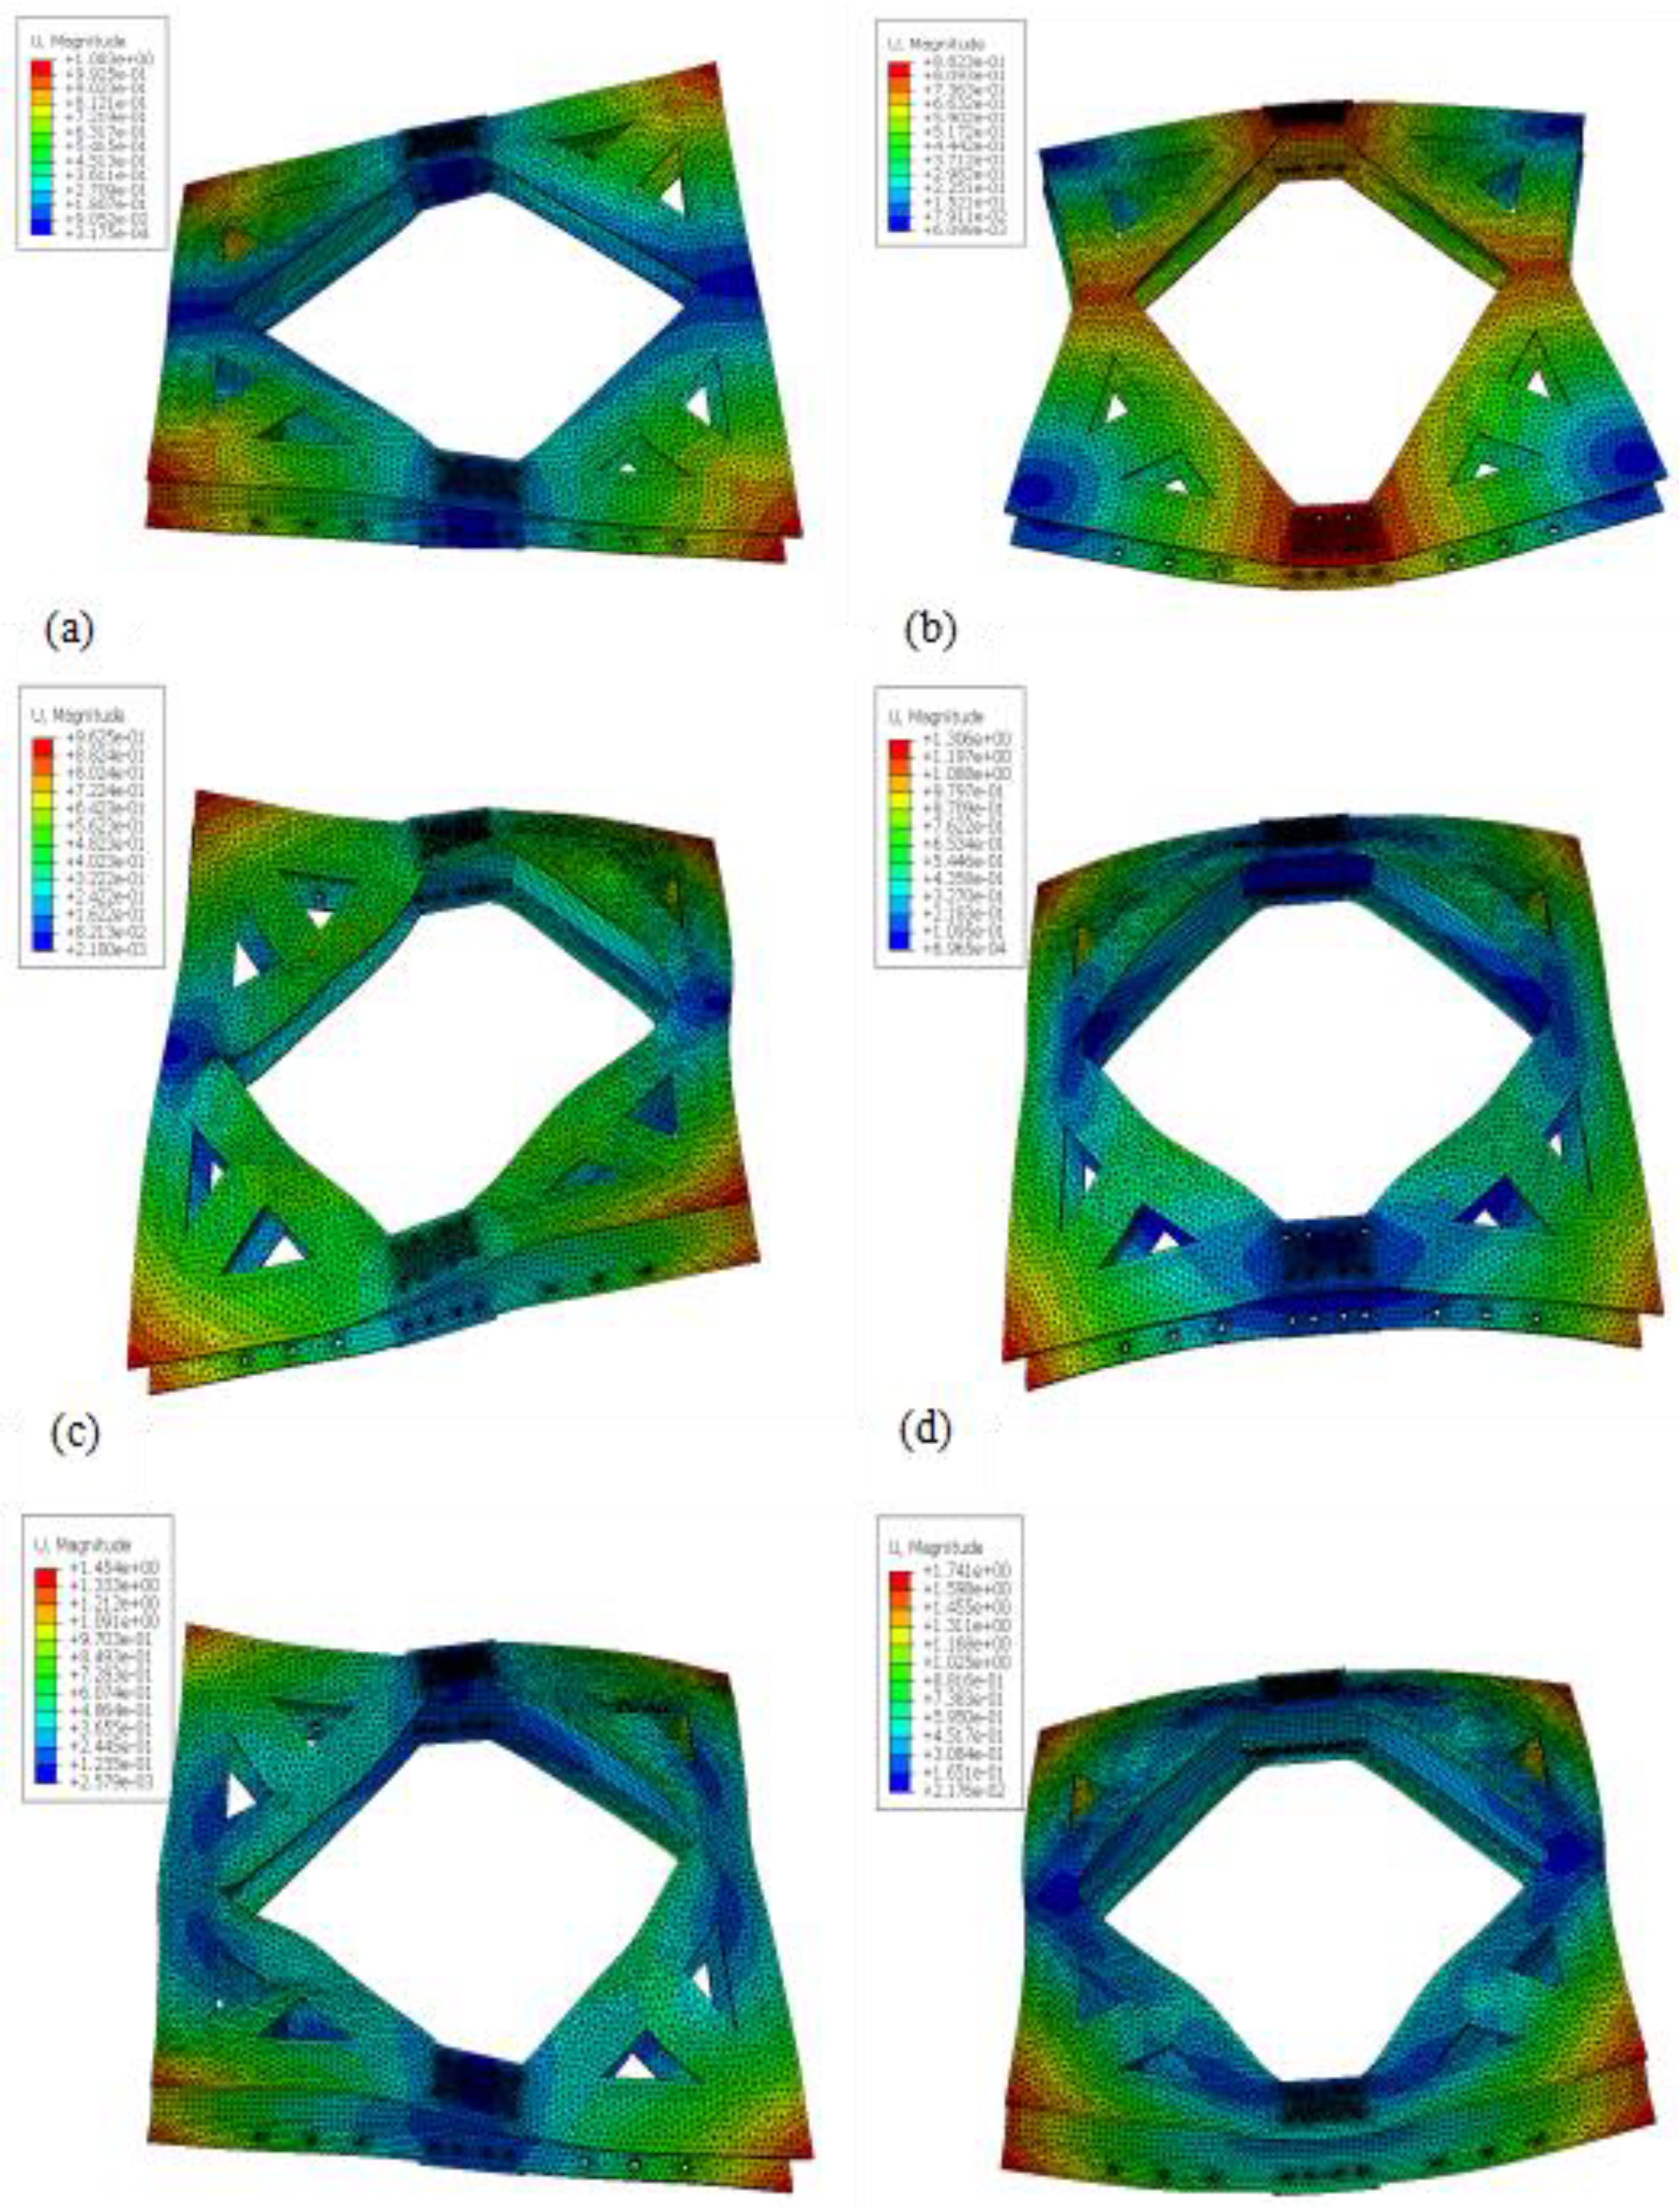
Figure 8.
Modal test of cylindrical shell (a) Local arrangement of measuring points, (b) simplified model.
Figure 8.
Modal test of cylindrical shell (a) Local arrangement of measuring points, (b) simplified model.
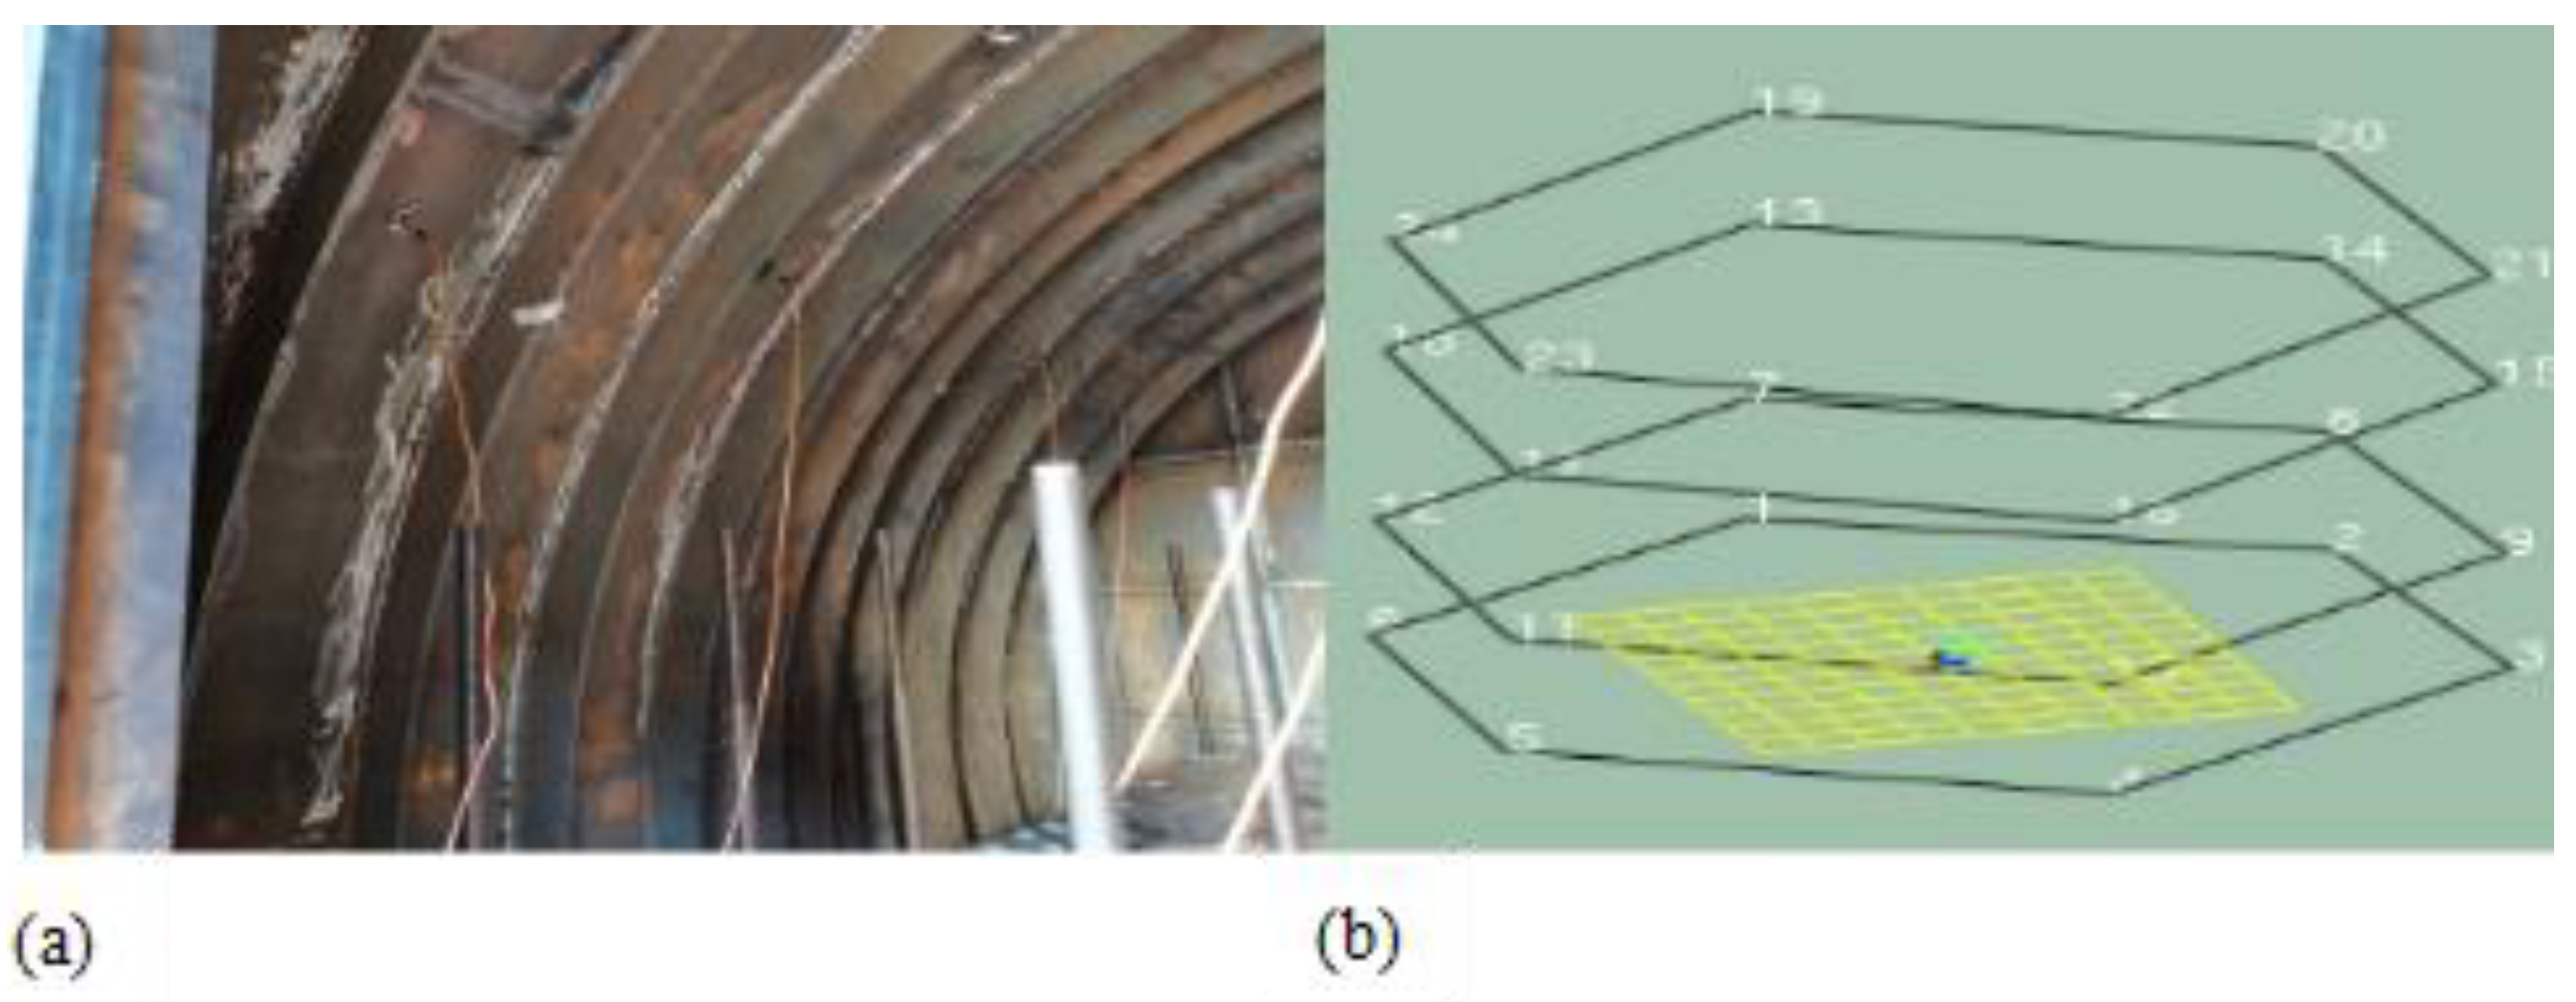
Figure 9.
Modal shapes of cylindrical shell (a) first order, (b) second order, (c) third order.
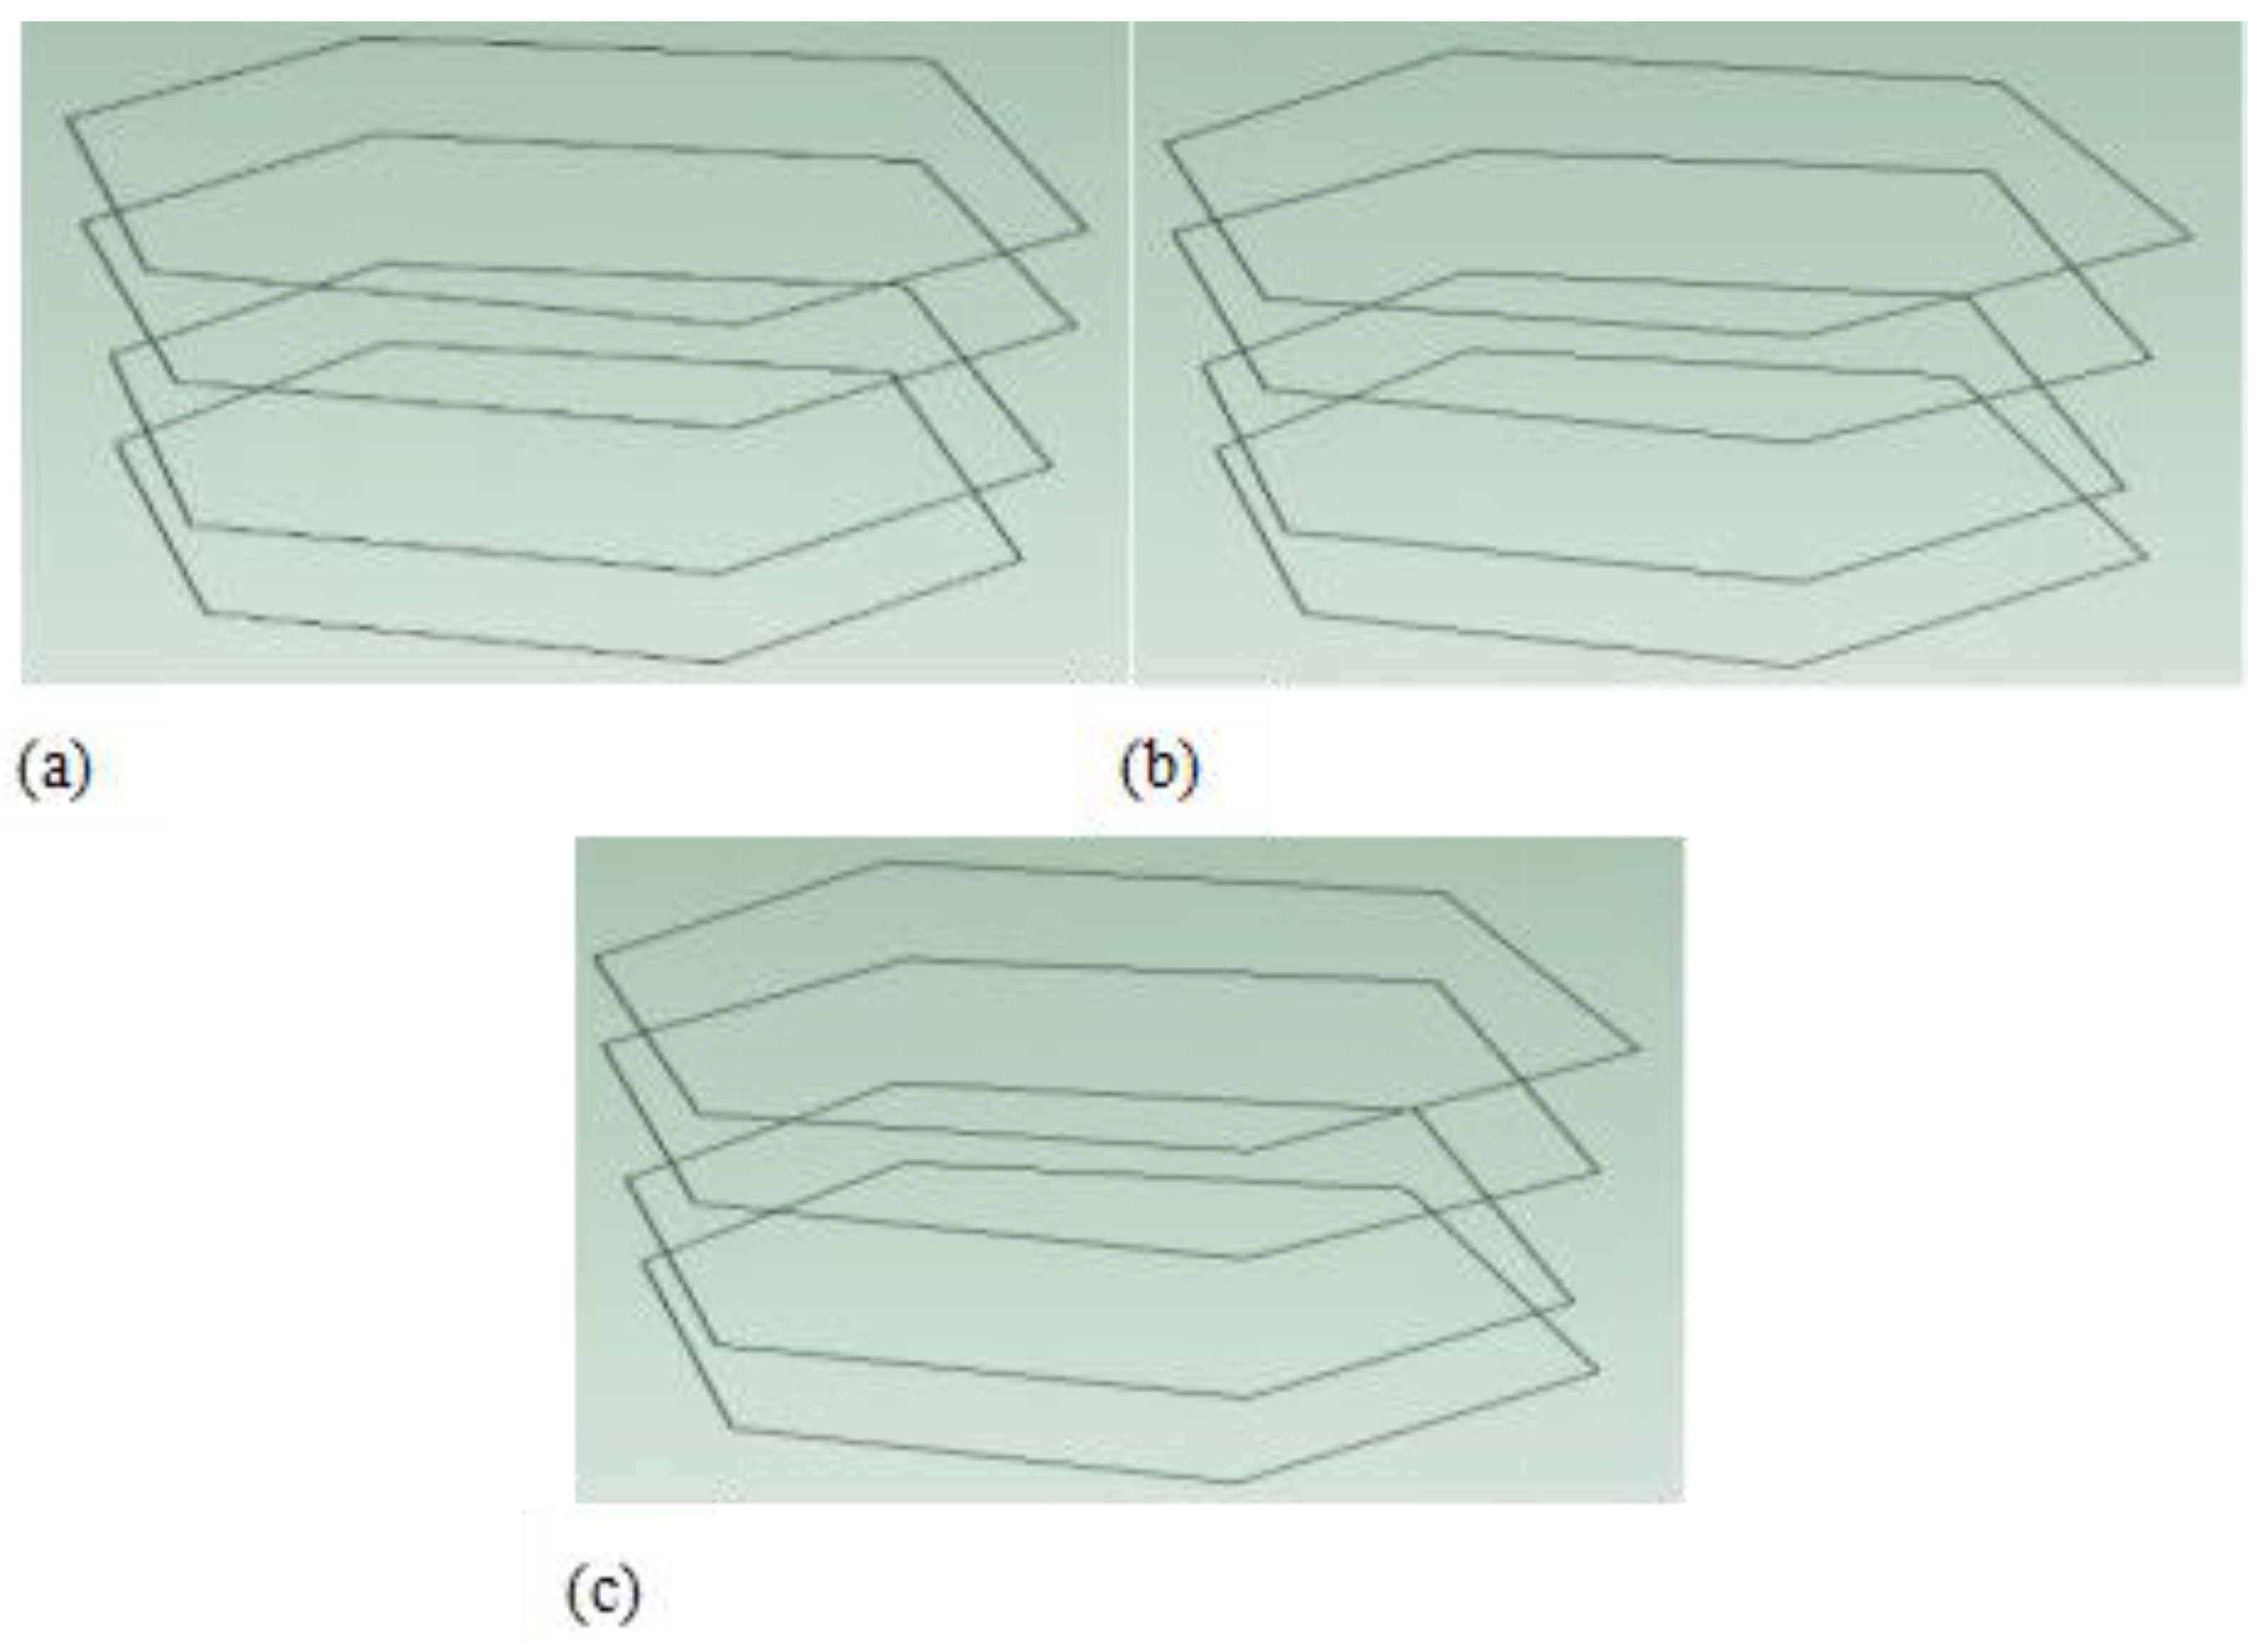
Figure 10.
Raft frame modal test measurement points.
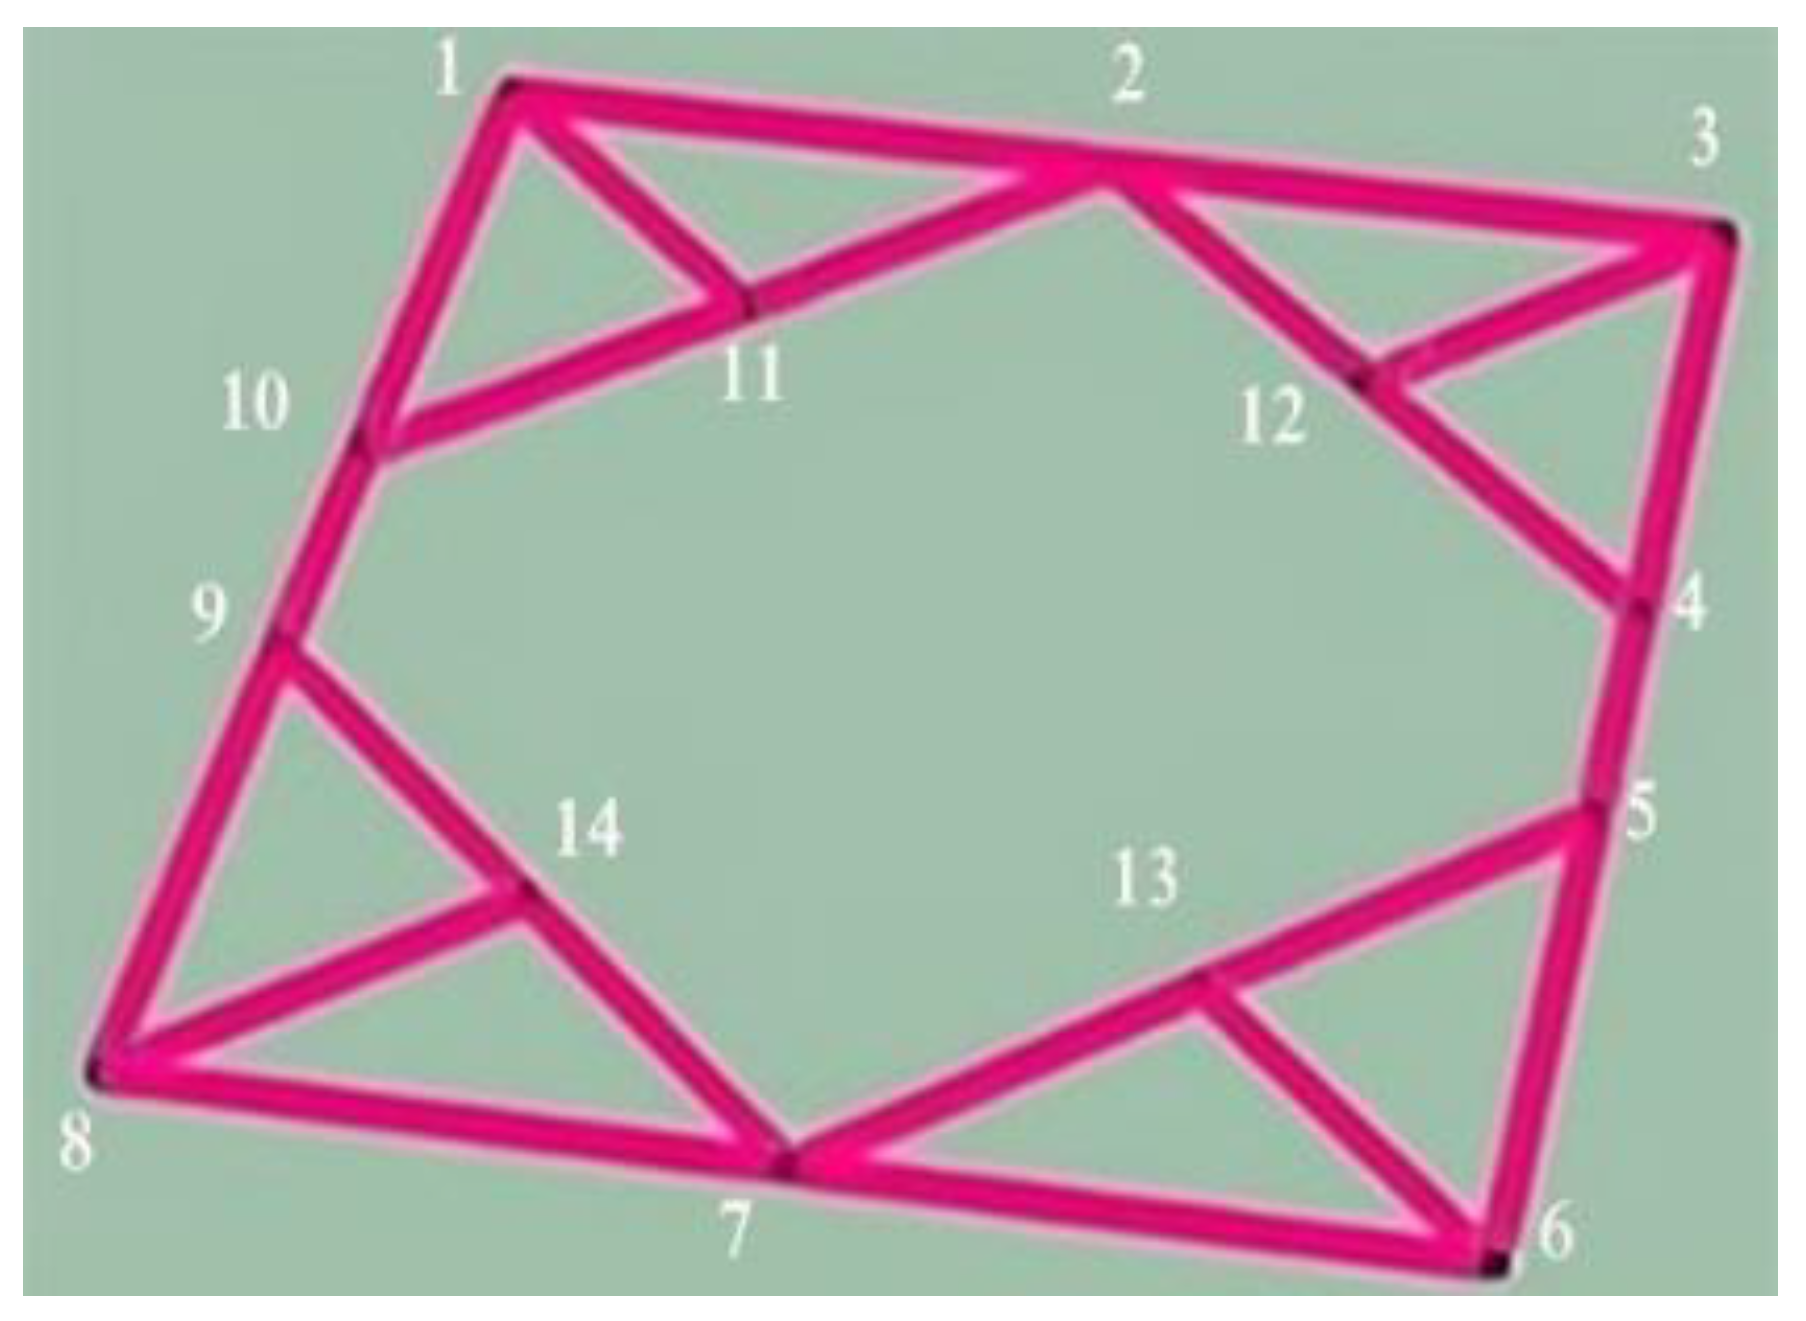
Figure 11.
Experimental modal shapes (a) first order, (b) second order of raft with counterweight, experimental model shapes of the (c) first order, (d) second order of raft with counterweight.
Figure 11.
Experimental modal shapes (a) first order, (b) second order of raft with counterweight, experimental model shapes of the (c) first order, (d) second order of raft with counterweight.
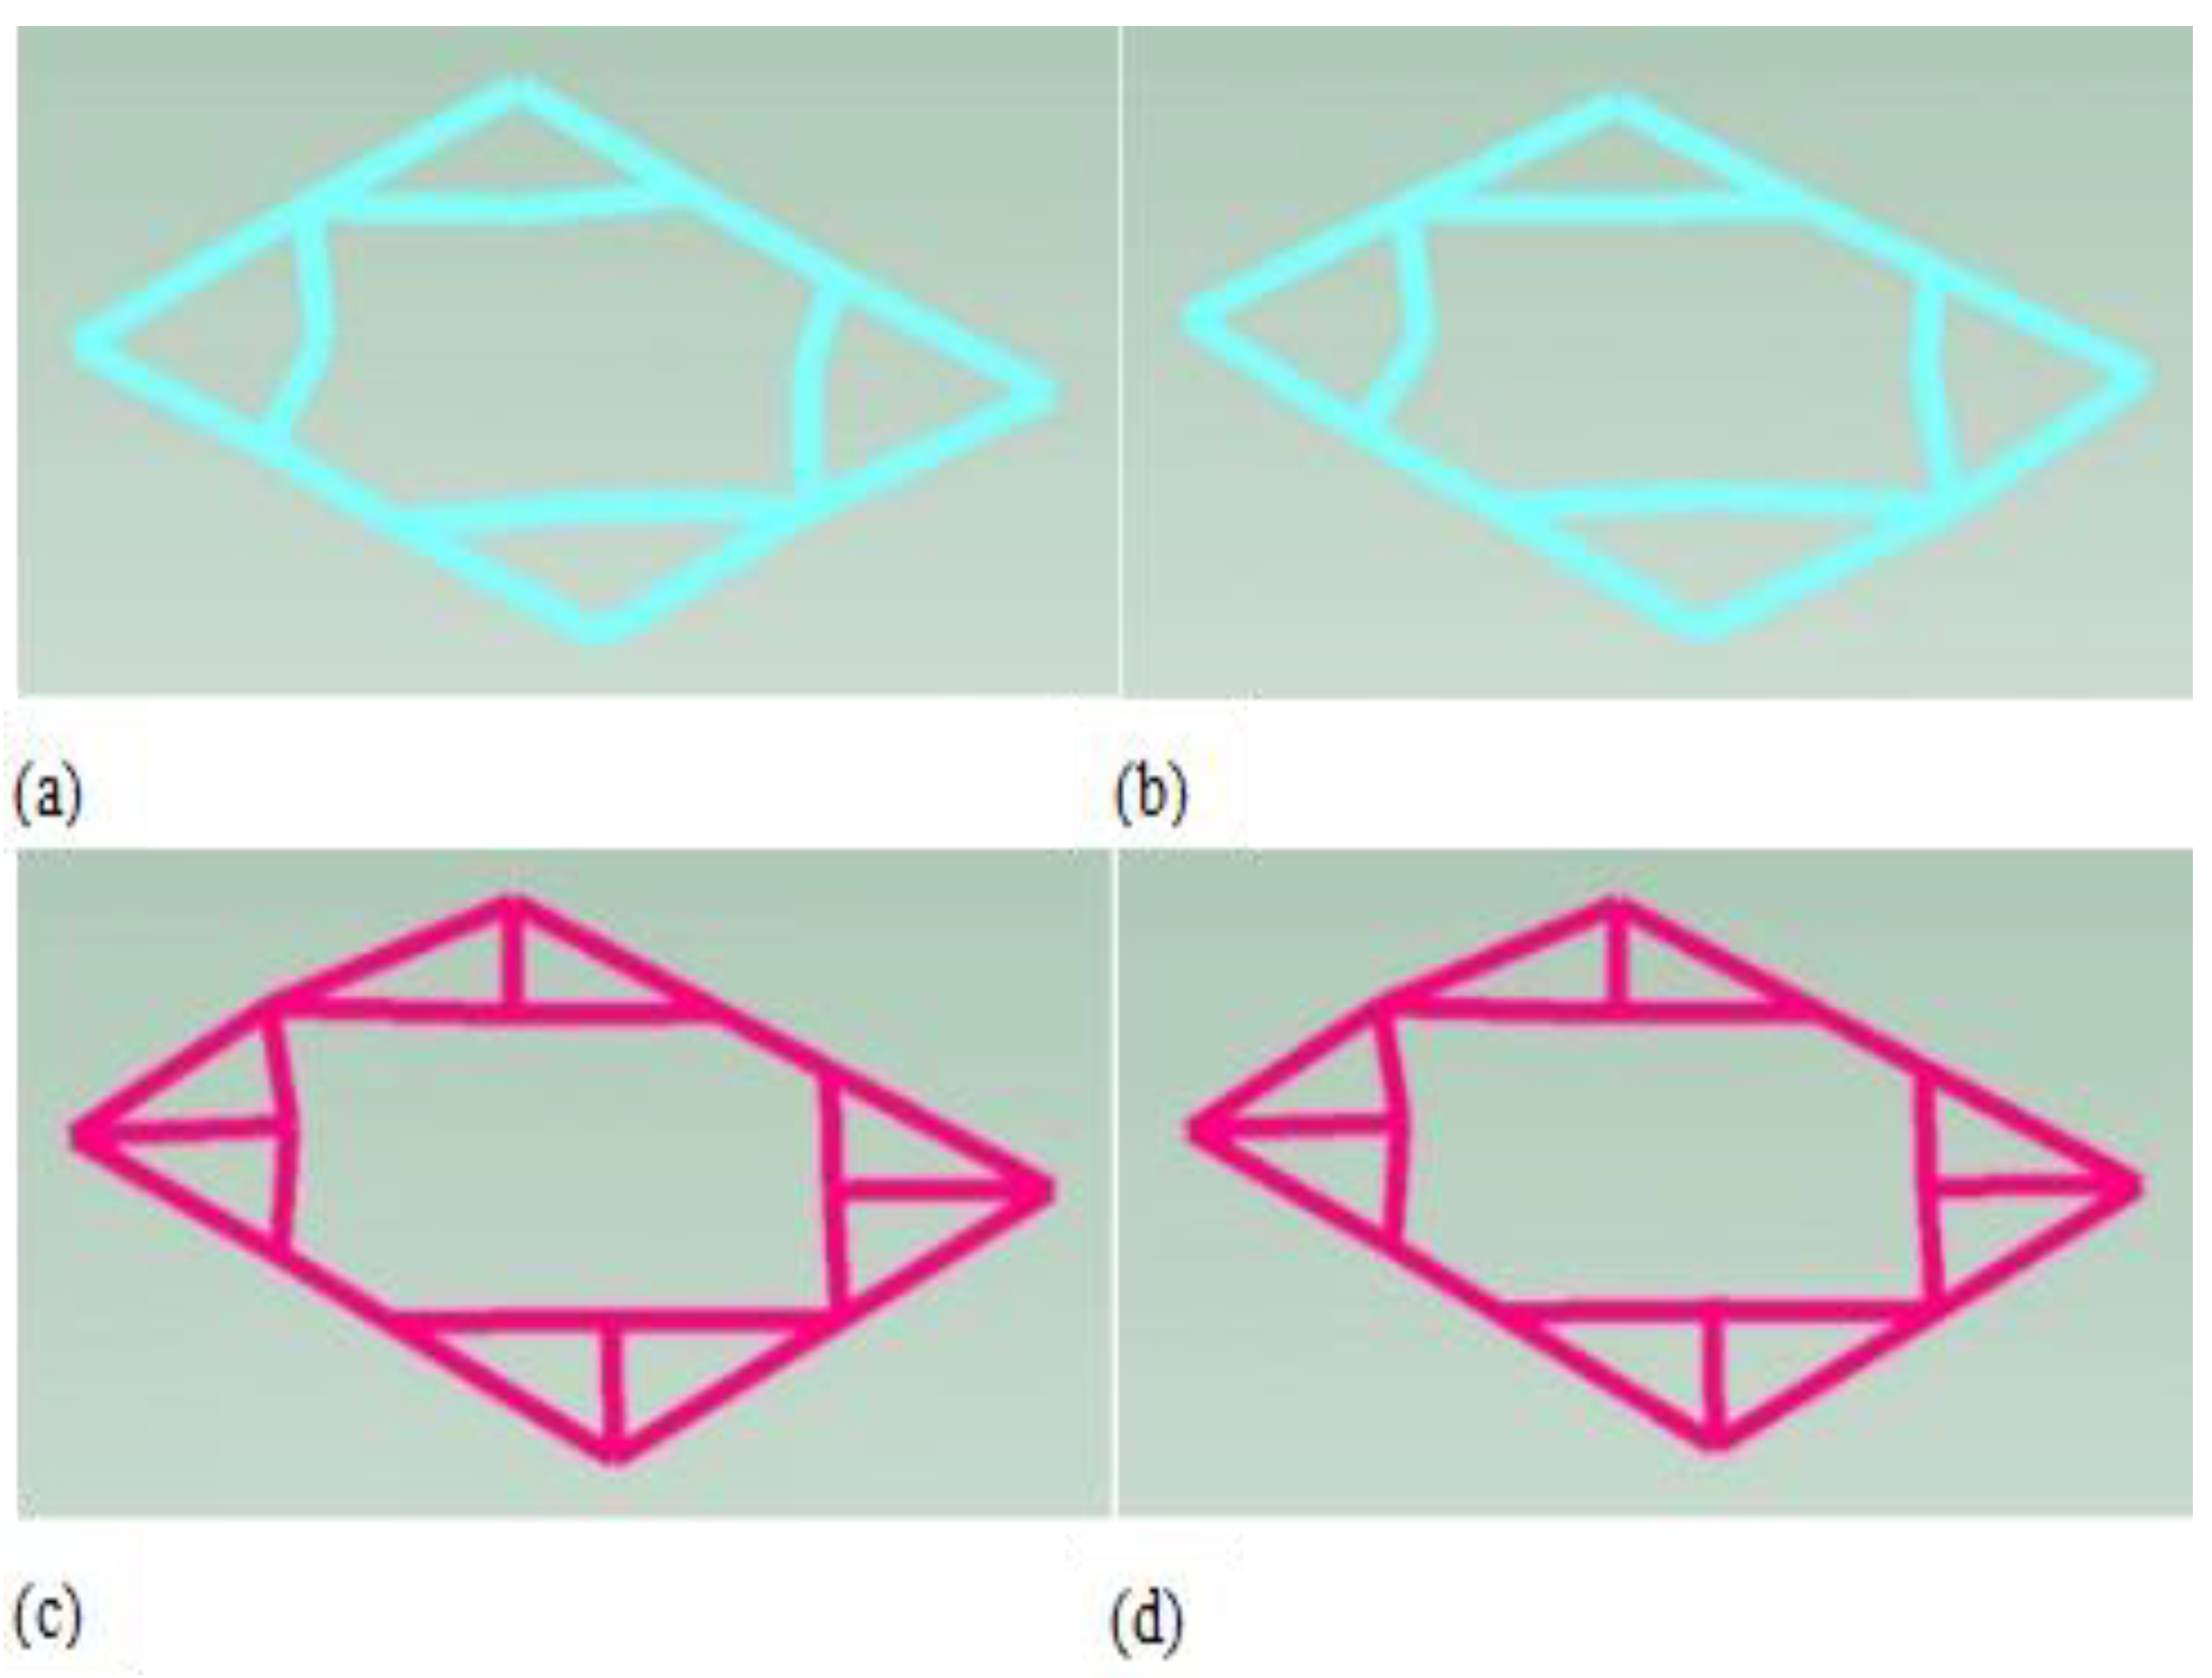
Figure 12.
Experimental testing platform.
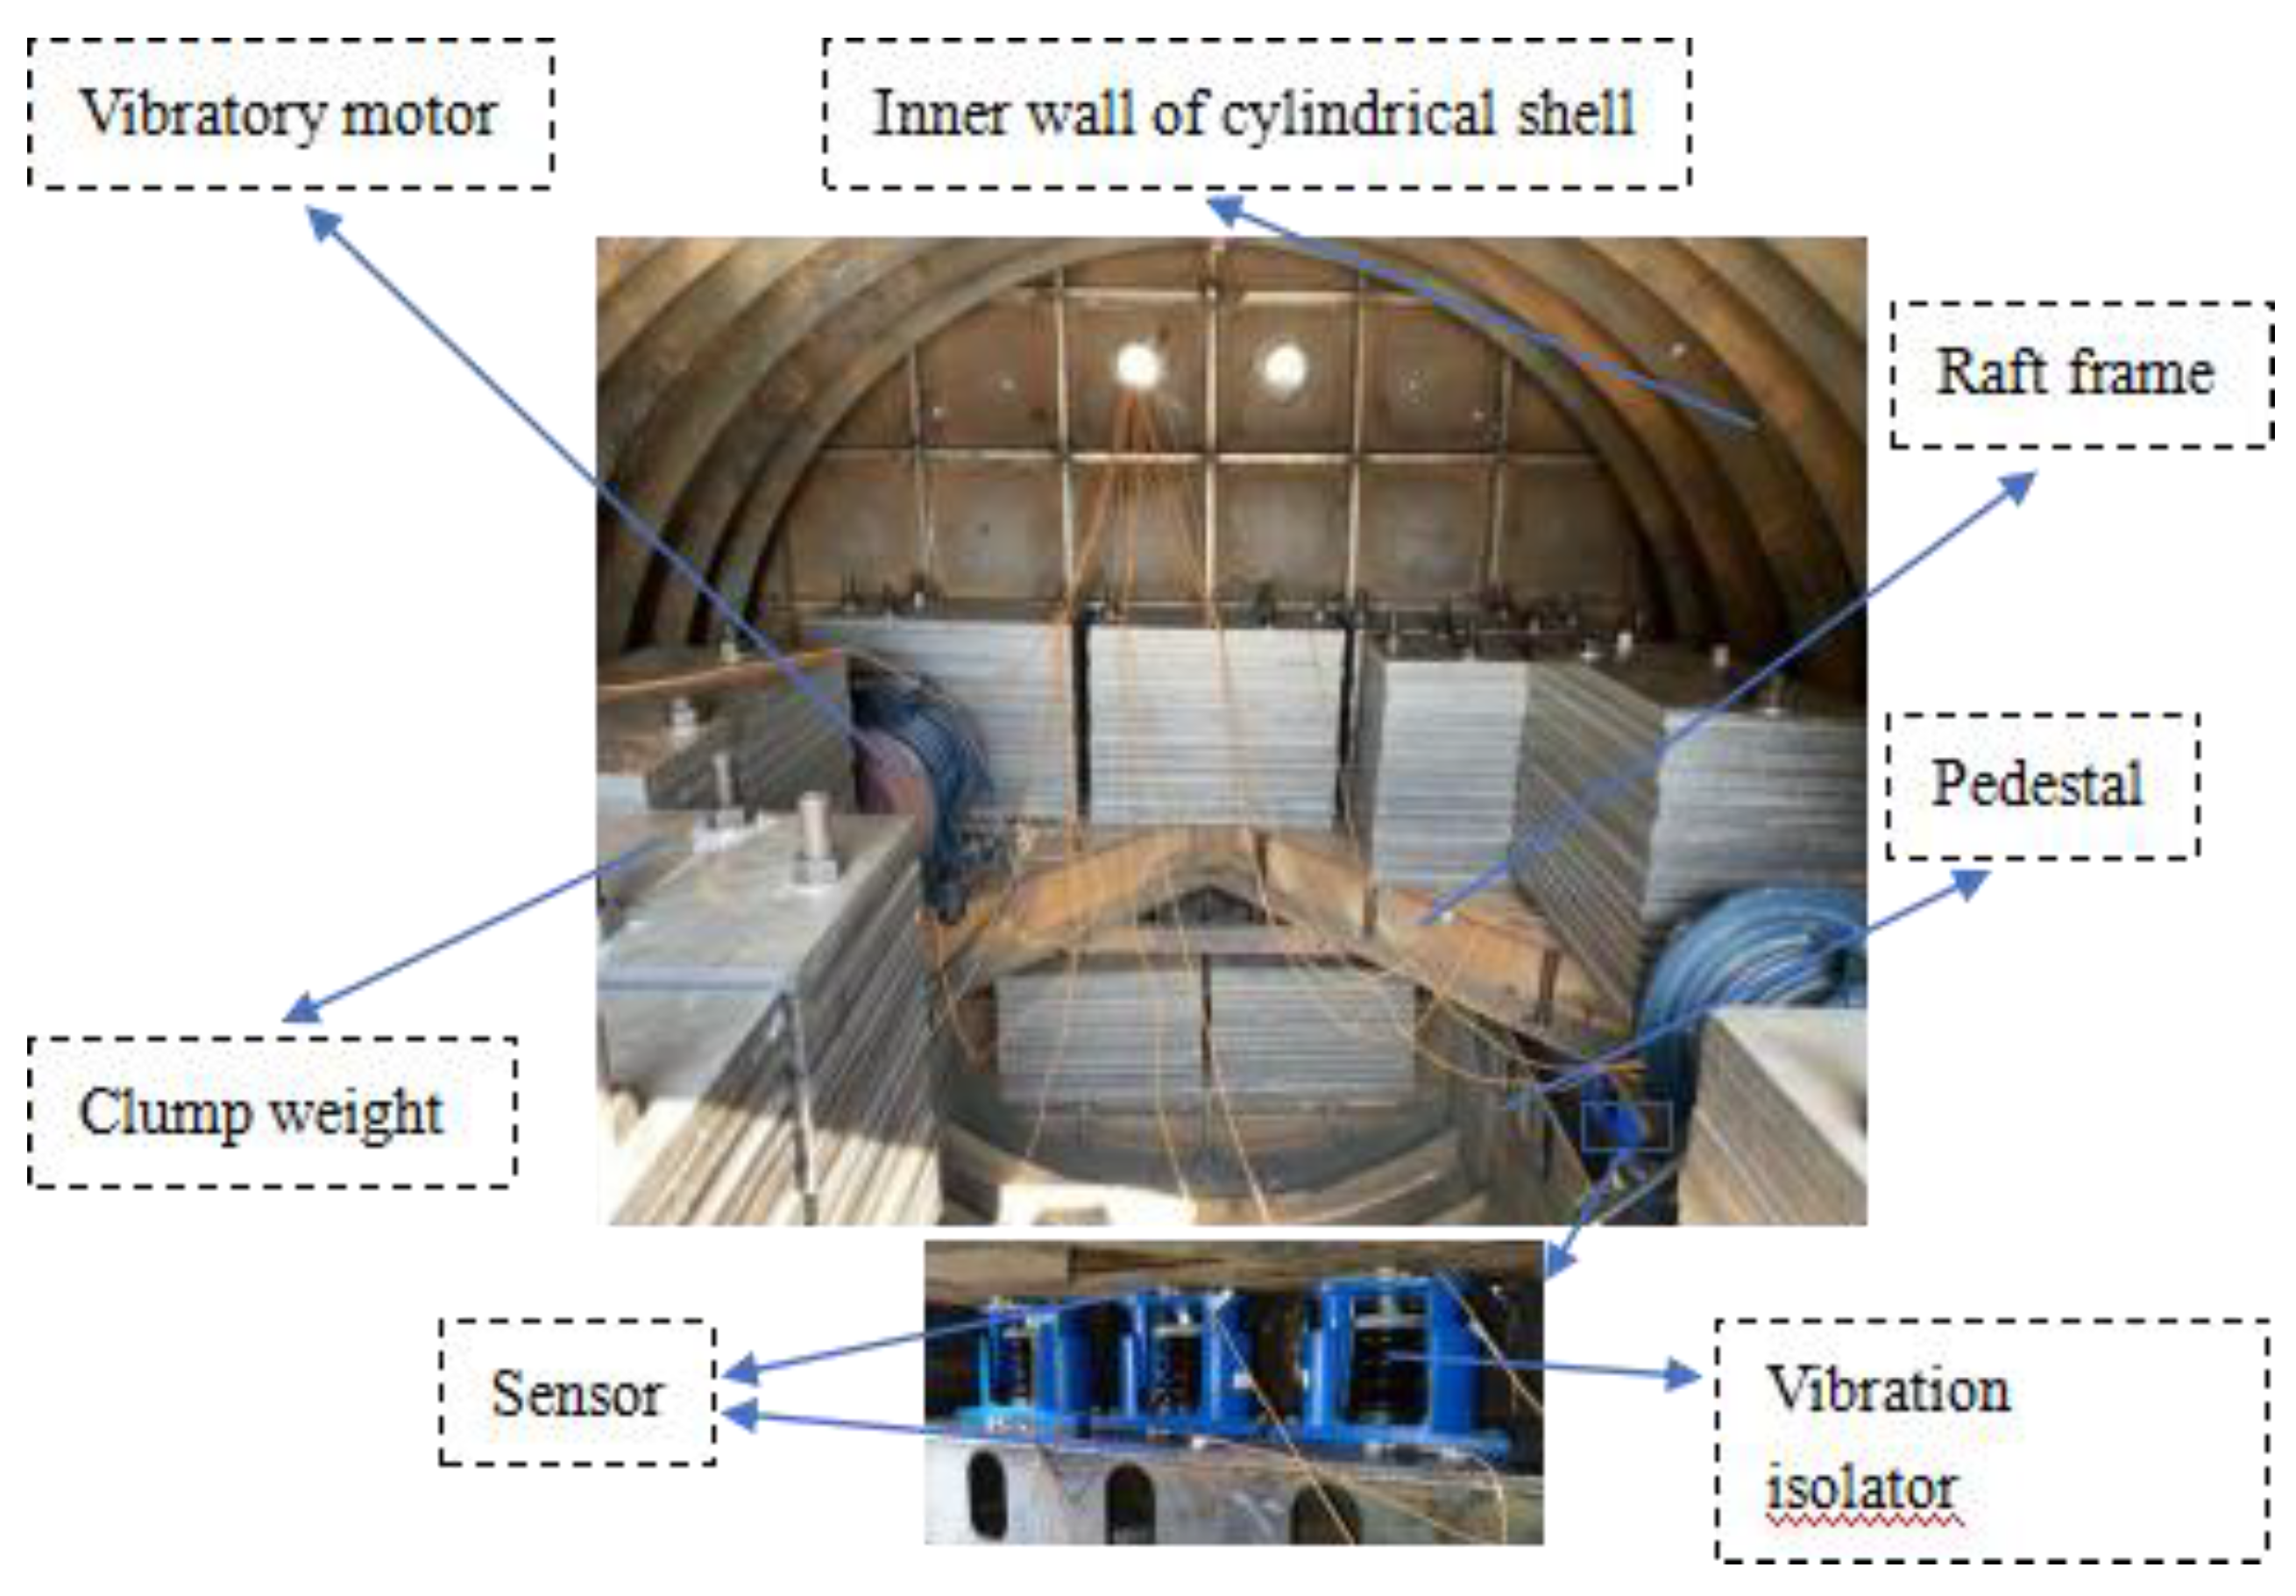
Figure 13.
Acceleration vibration level. Measuring points: (a) 1 and 2, (b) 3 and 4, and (c) 5 and 6.
Figure 13.
Acceleration vibration level. Measuring points: (a) 1 and 2, (b) 3 and 4, and (c) 5 and 6.
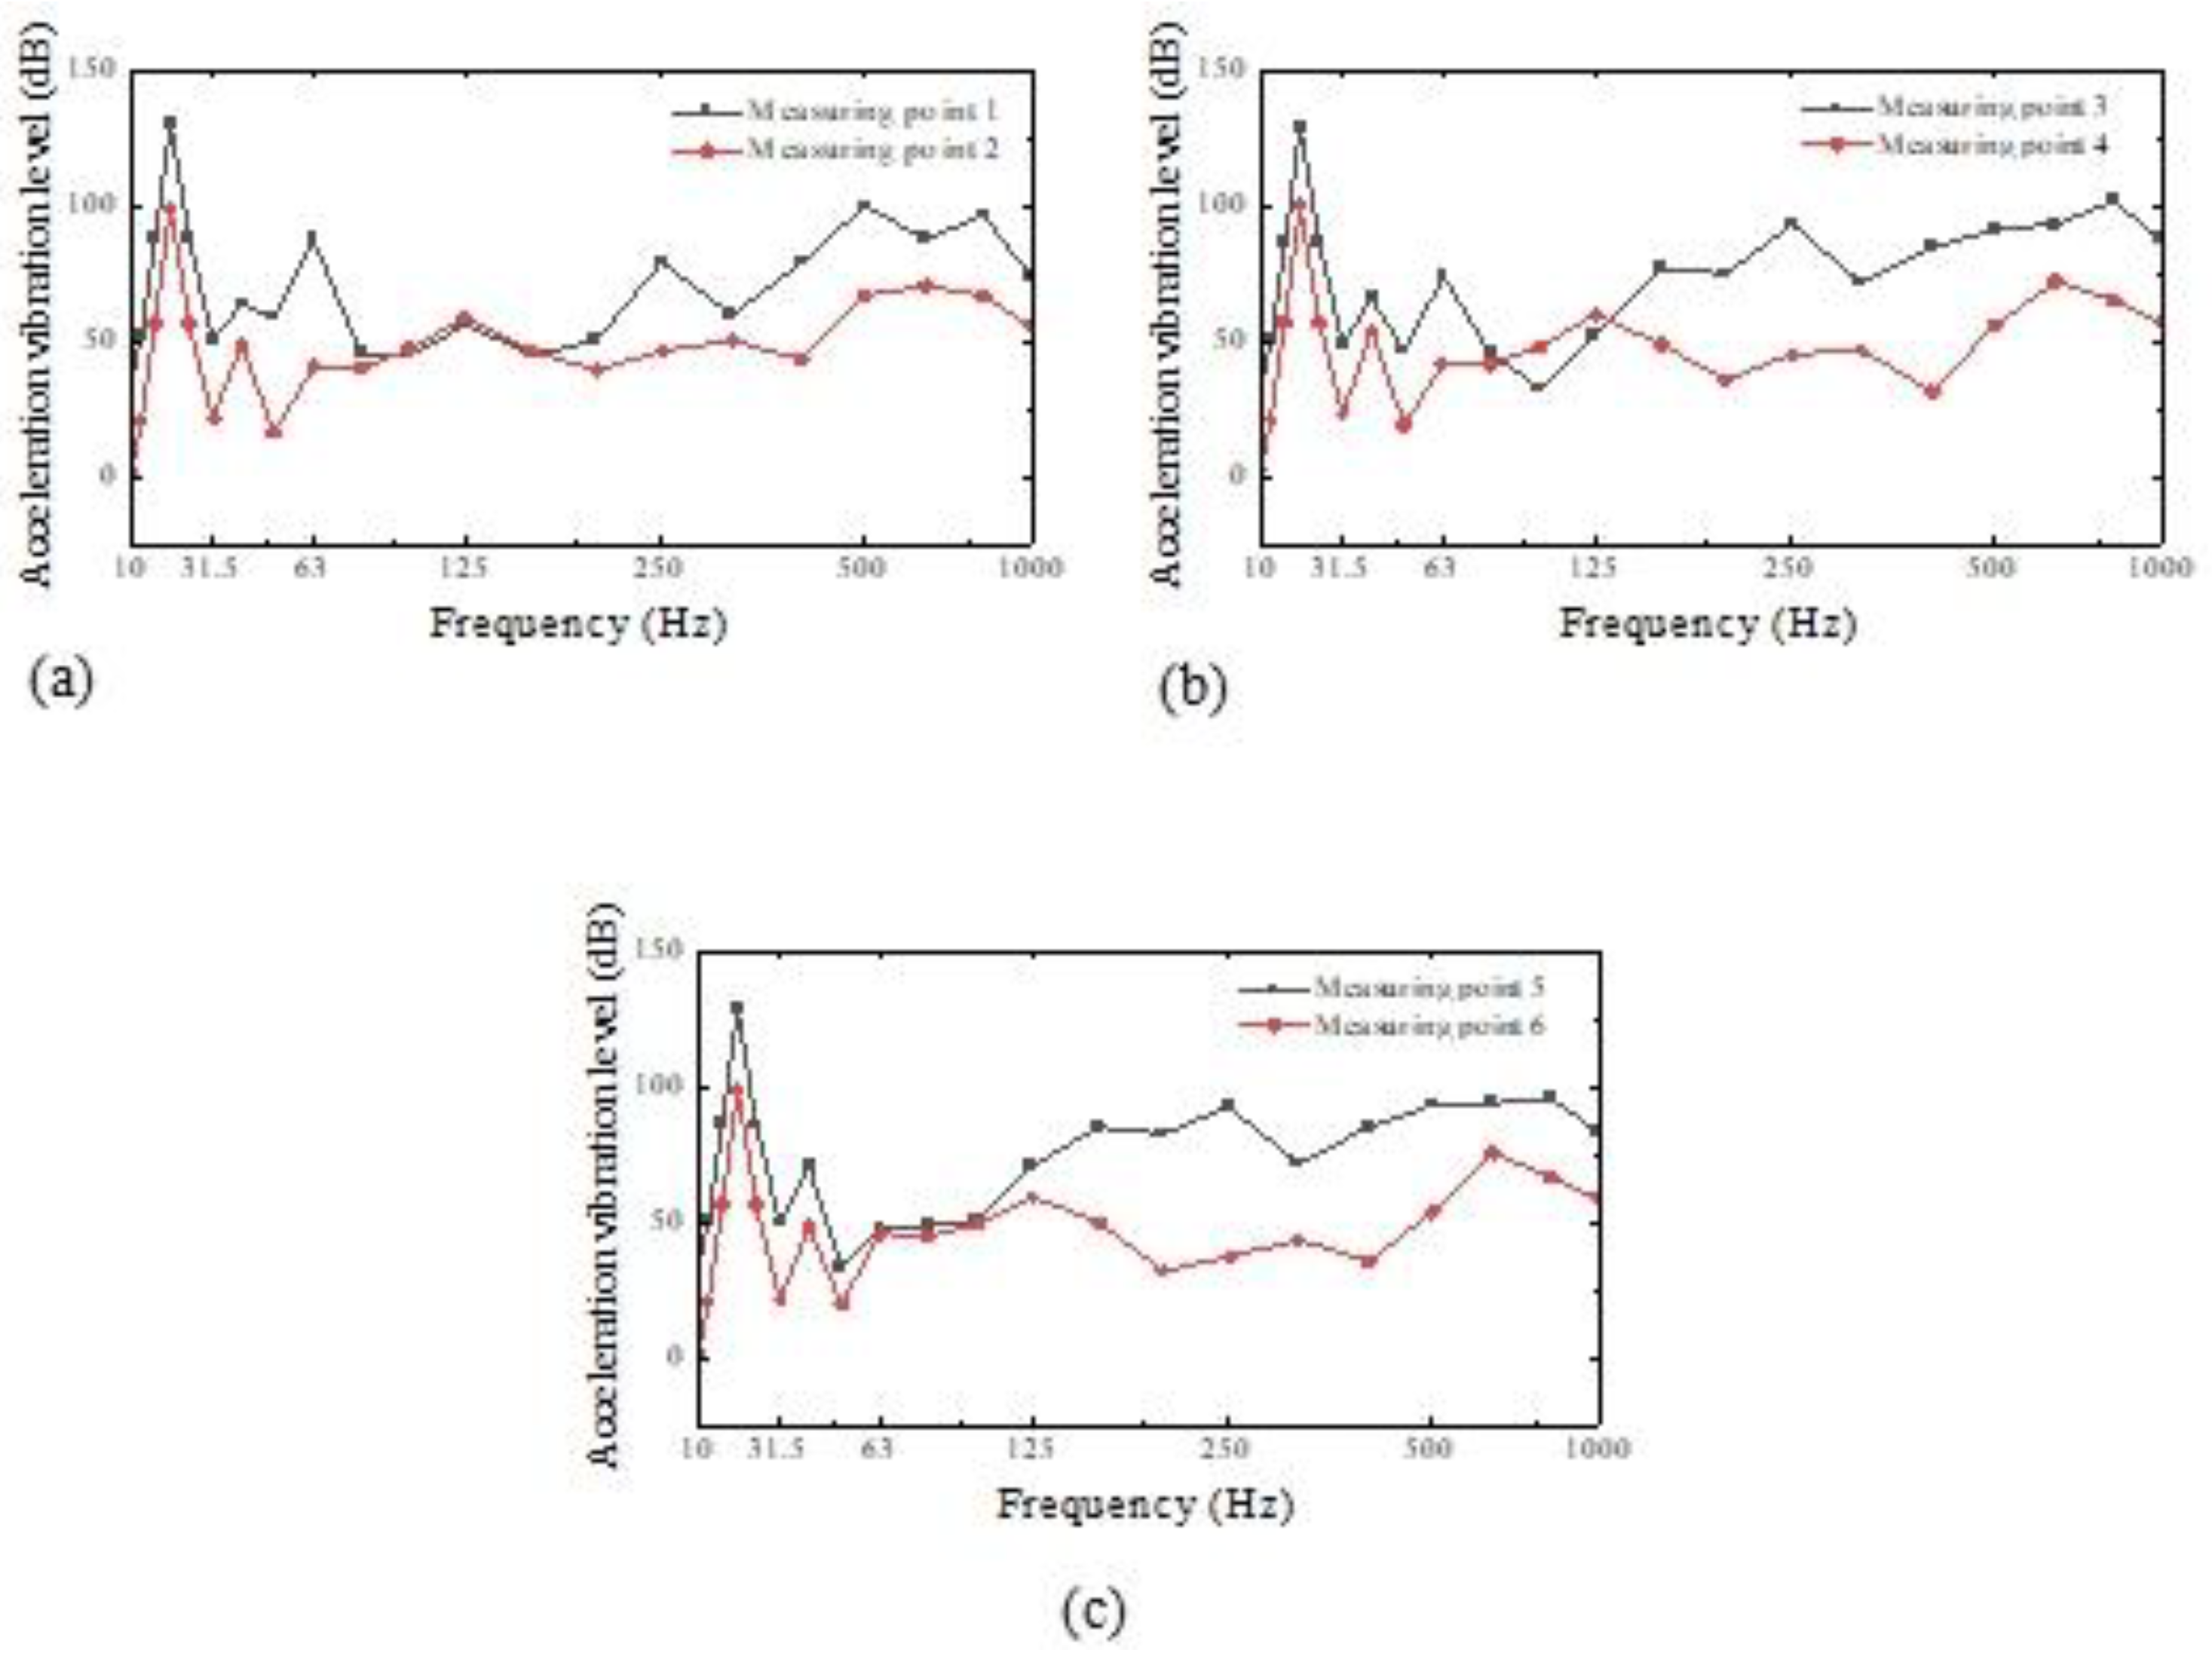
Figure 14.
Acceleration vibration level. Measuring points: (a) 1 and 2, (b) 3 and 4, and (c) 5 and 6.
Figure 14.
Acceleration vibration level. Measuring points: (a) 1 and 2, (b) 3 and 4, and (c) 5 and 6.
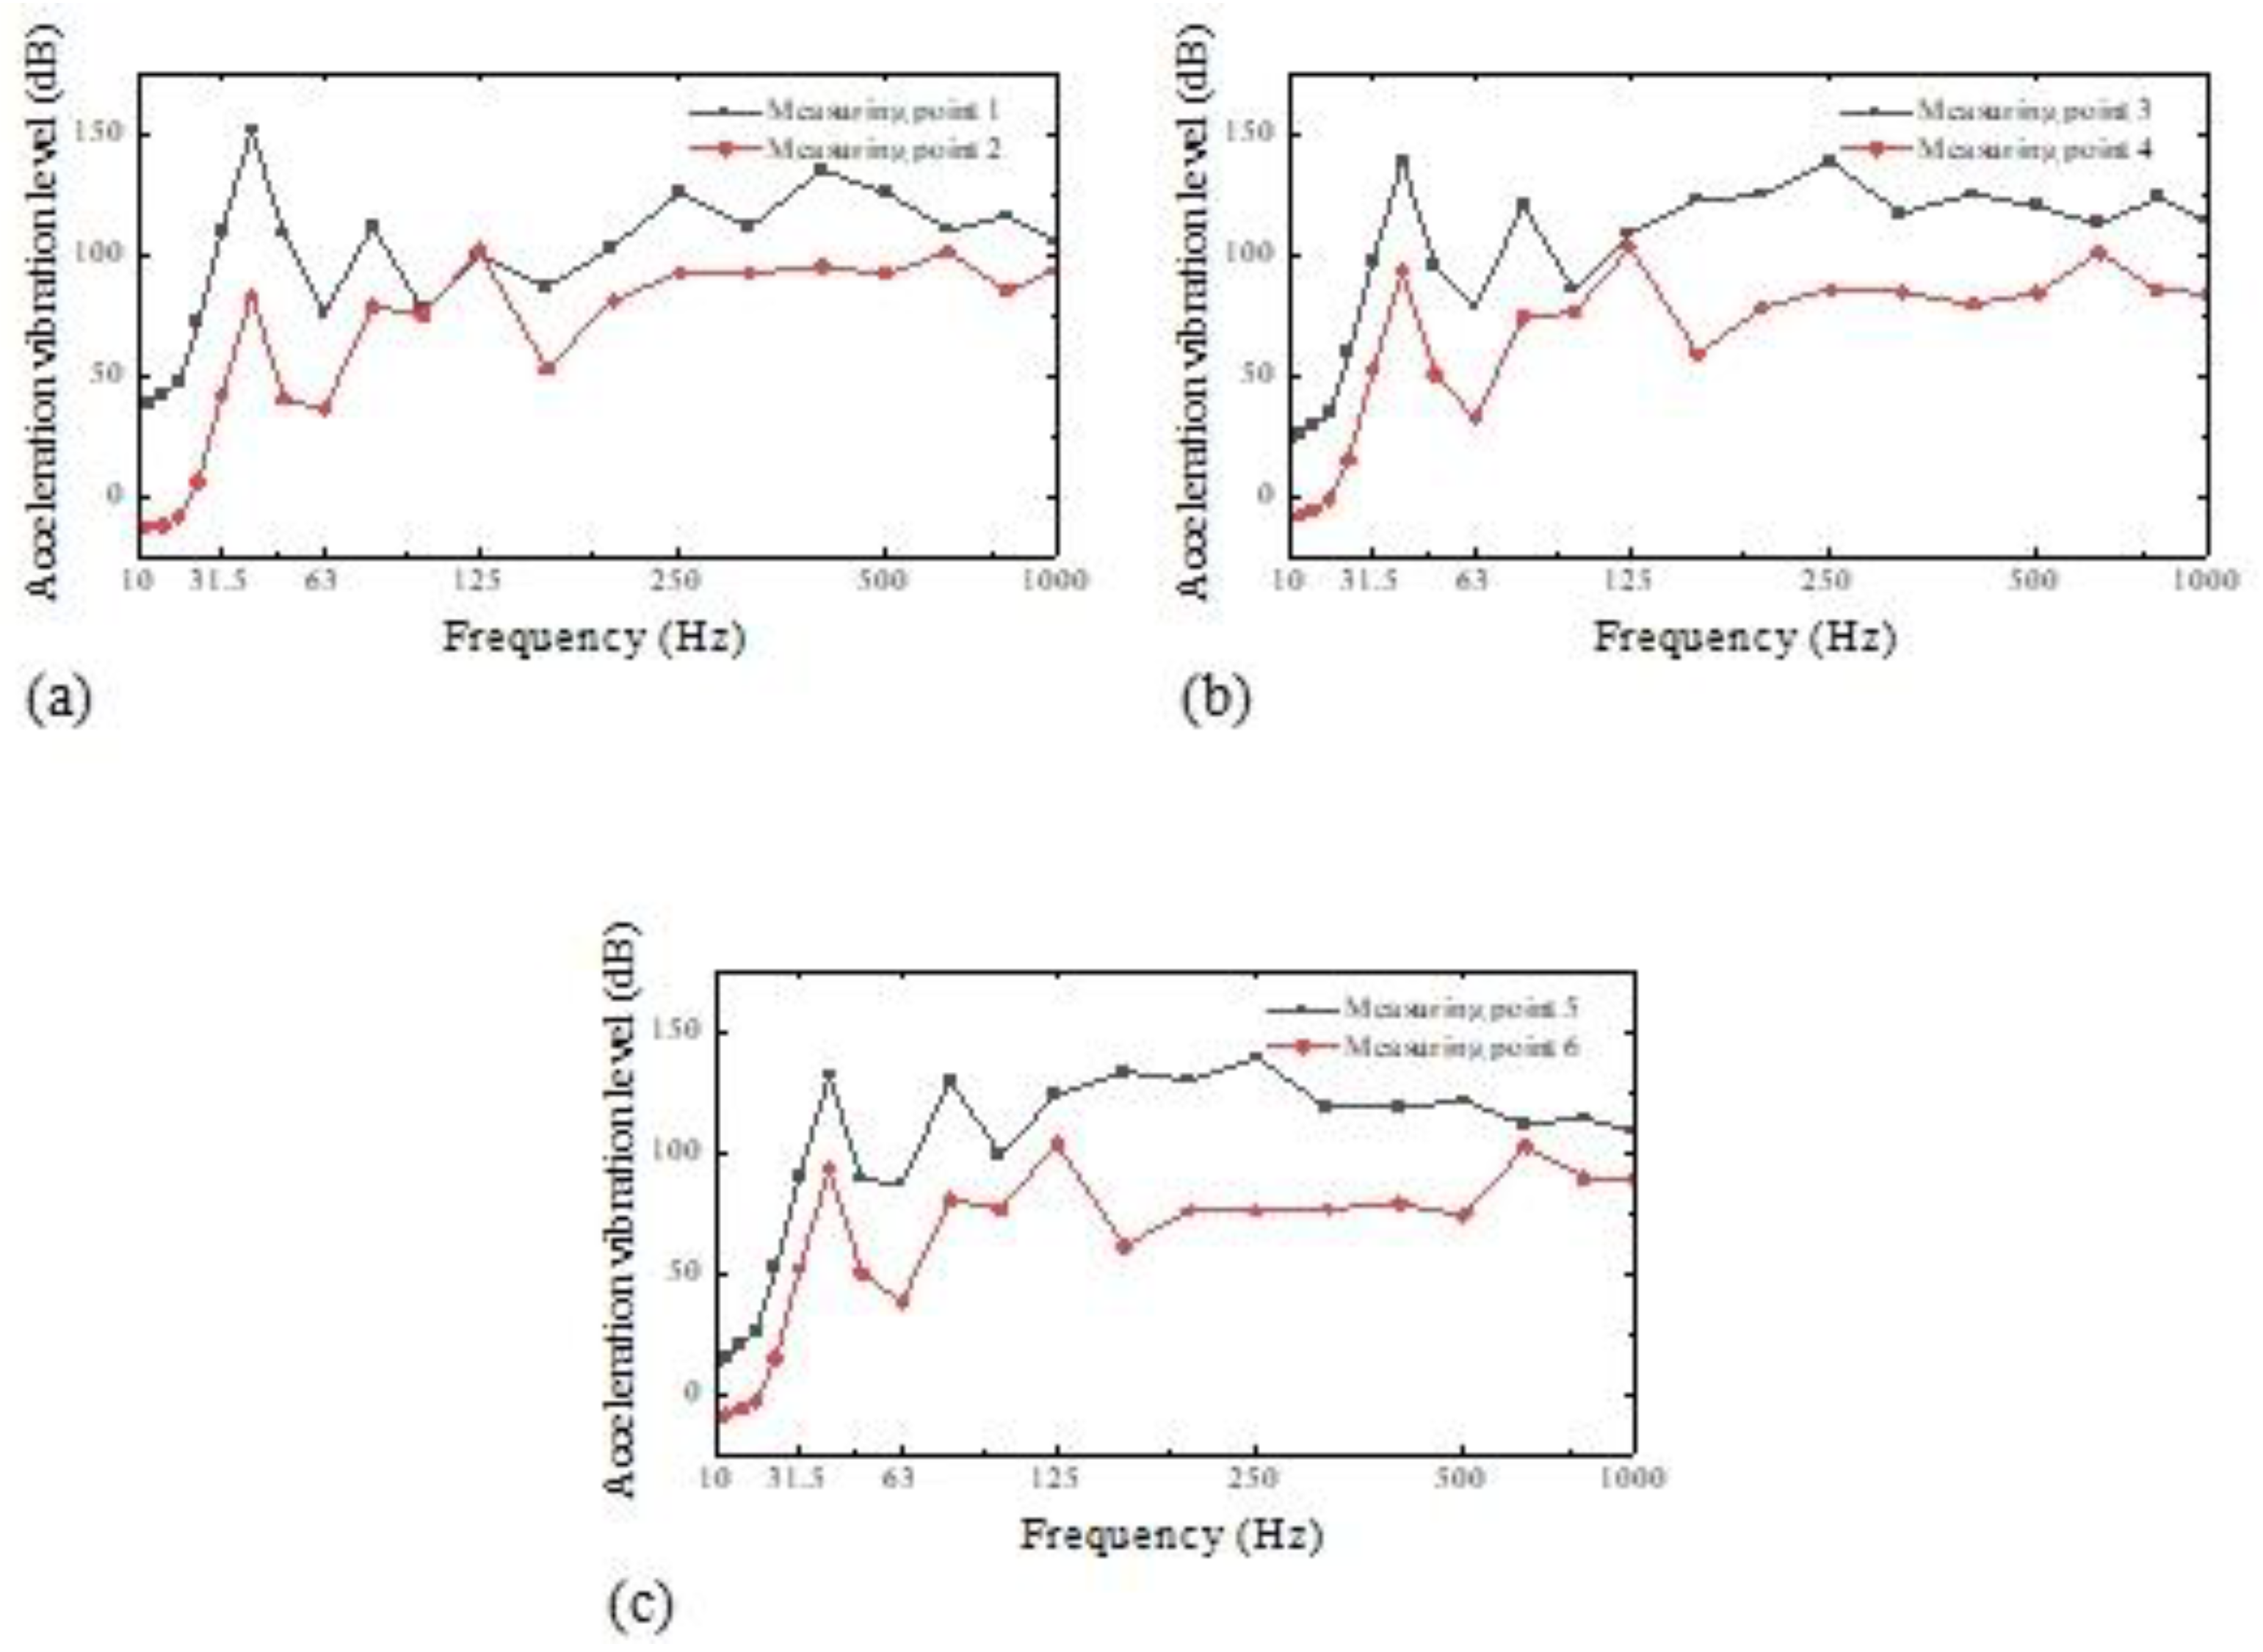
Figure 15.
Acceleration vibration level difference. Measuring points: (a) 1 and 2, (b) 3 and 4, and (c) 5 and 6.
Figure 15.
Acceleration vibration level difference. Measuring points: (a) 1 and 2, (b) 3 and 4, and (c) 5 and 6.
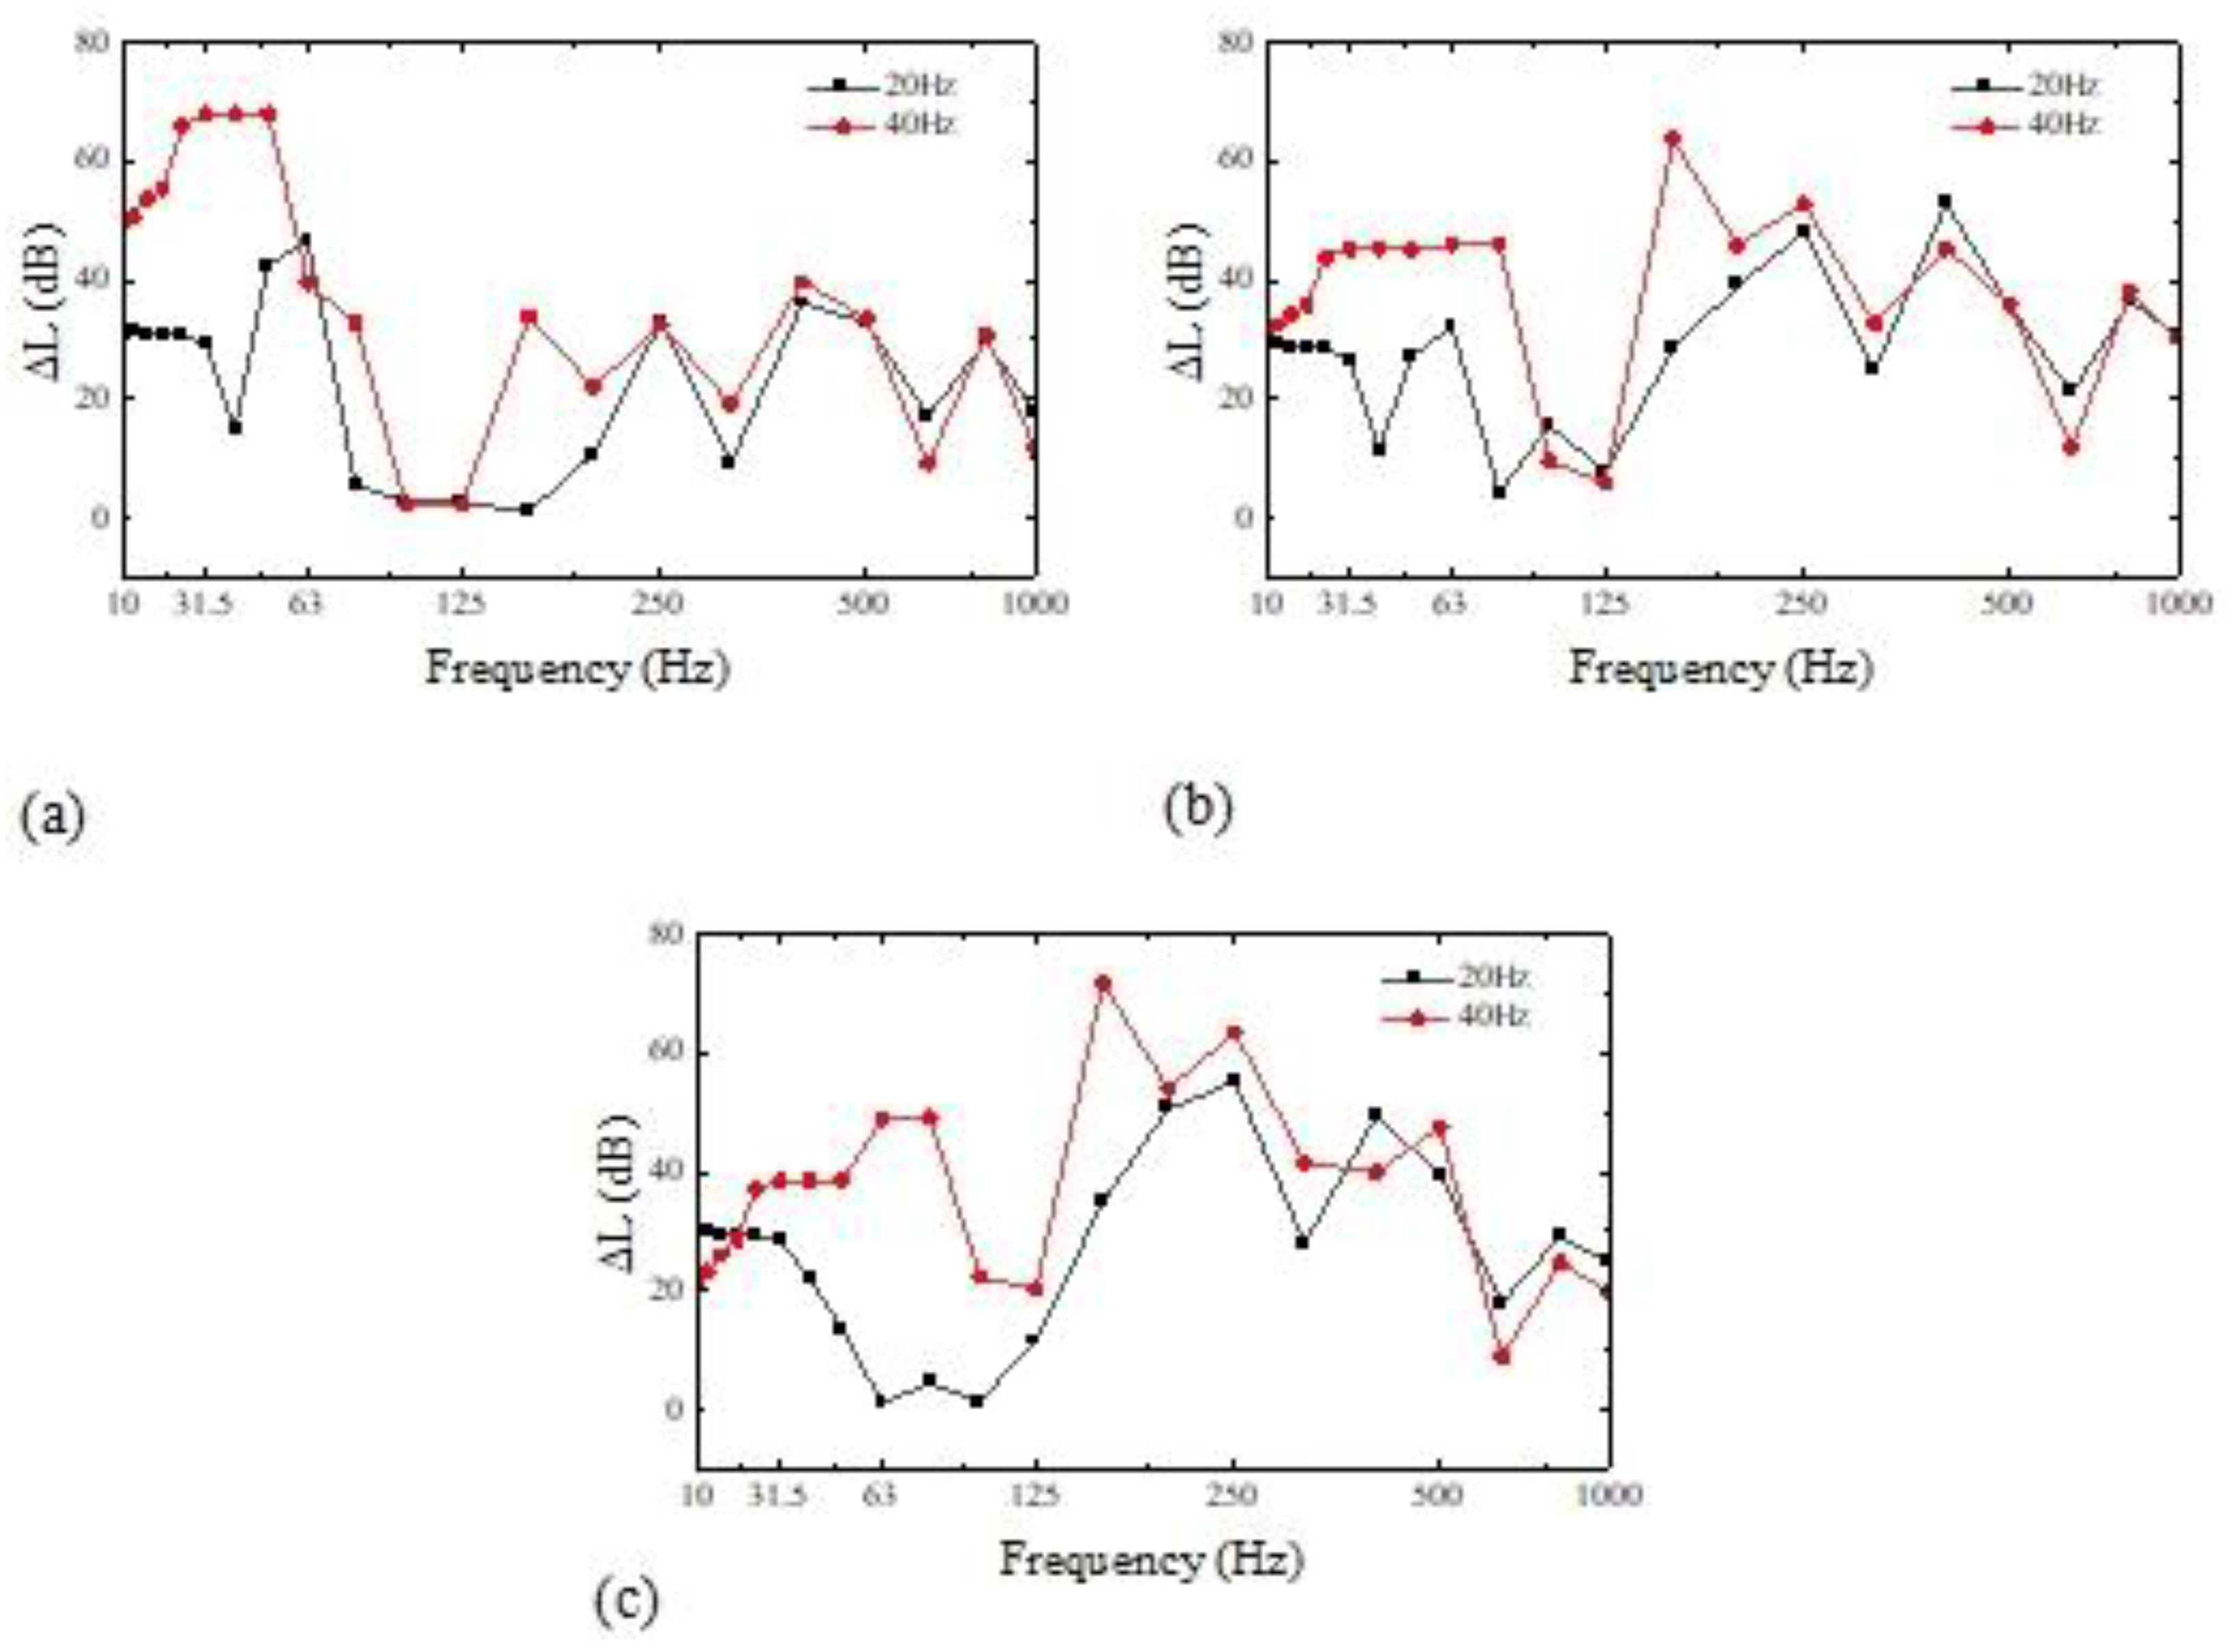
Figure 16.
Excitation frequency of 20Hz. Measuring points: (a) 1 and 2, (b) 3 and 4, and (c) 5 and 6.
Figure 16.
Excitation frequency of 20Hz. Measuring points: (a) 1 and 2, (b) 3 and 4, and (c) 5 and 6.
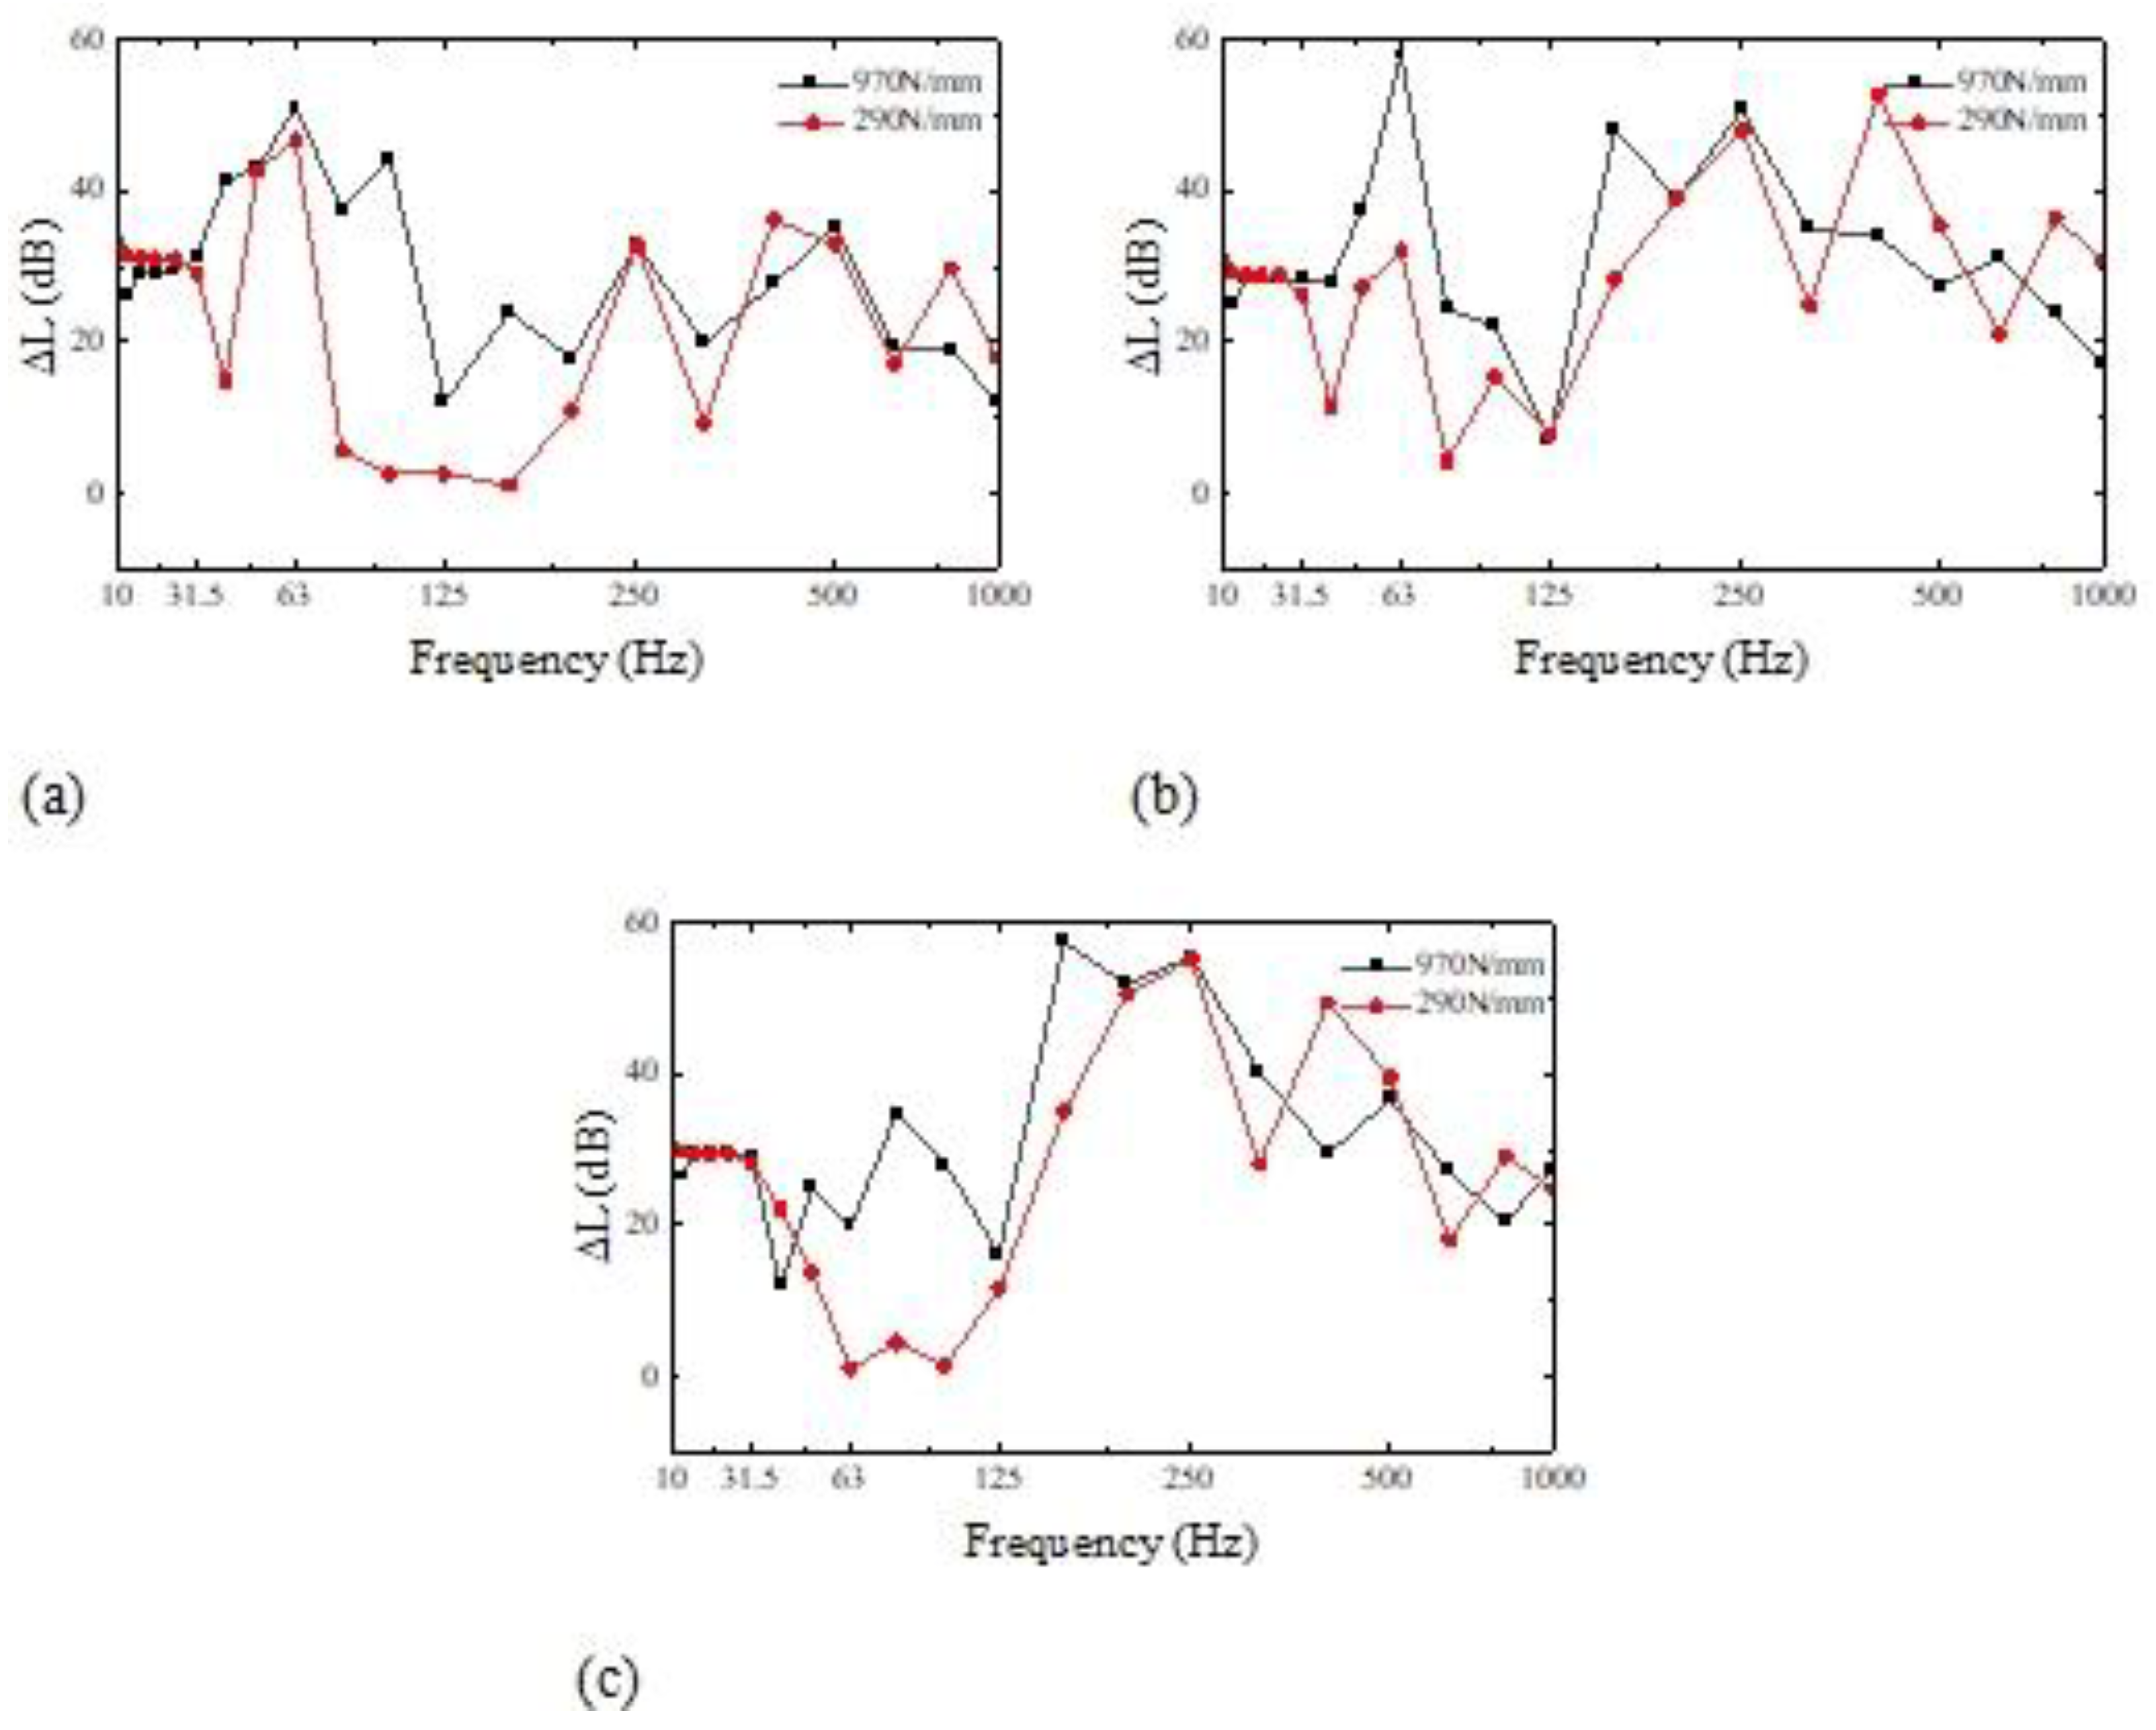
Figure 17.
Excitation frequency of 40Hz. Measuring points: (a) 1 and 2, (b) 3 and 4, and (c) 5 and 6.
Figure 17.
Excitation frequency of 40Hz. Measuring points: (a) 1 and 2, (b) 3 and 4, and (c) 5 and 6.
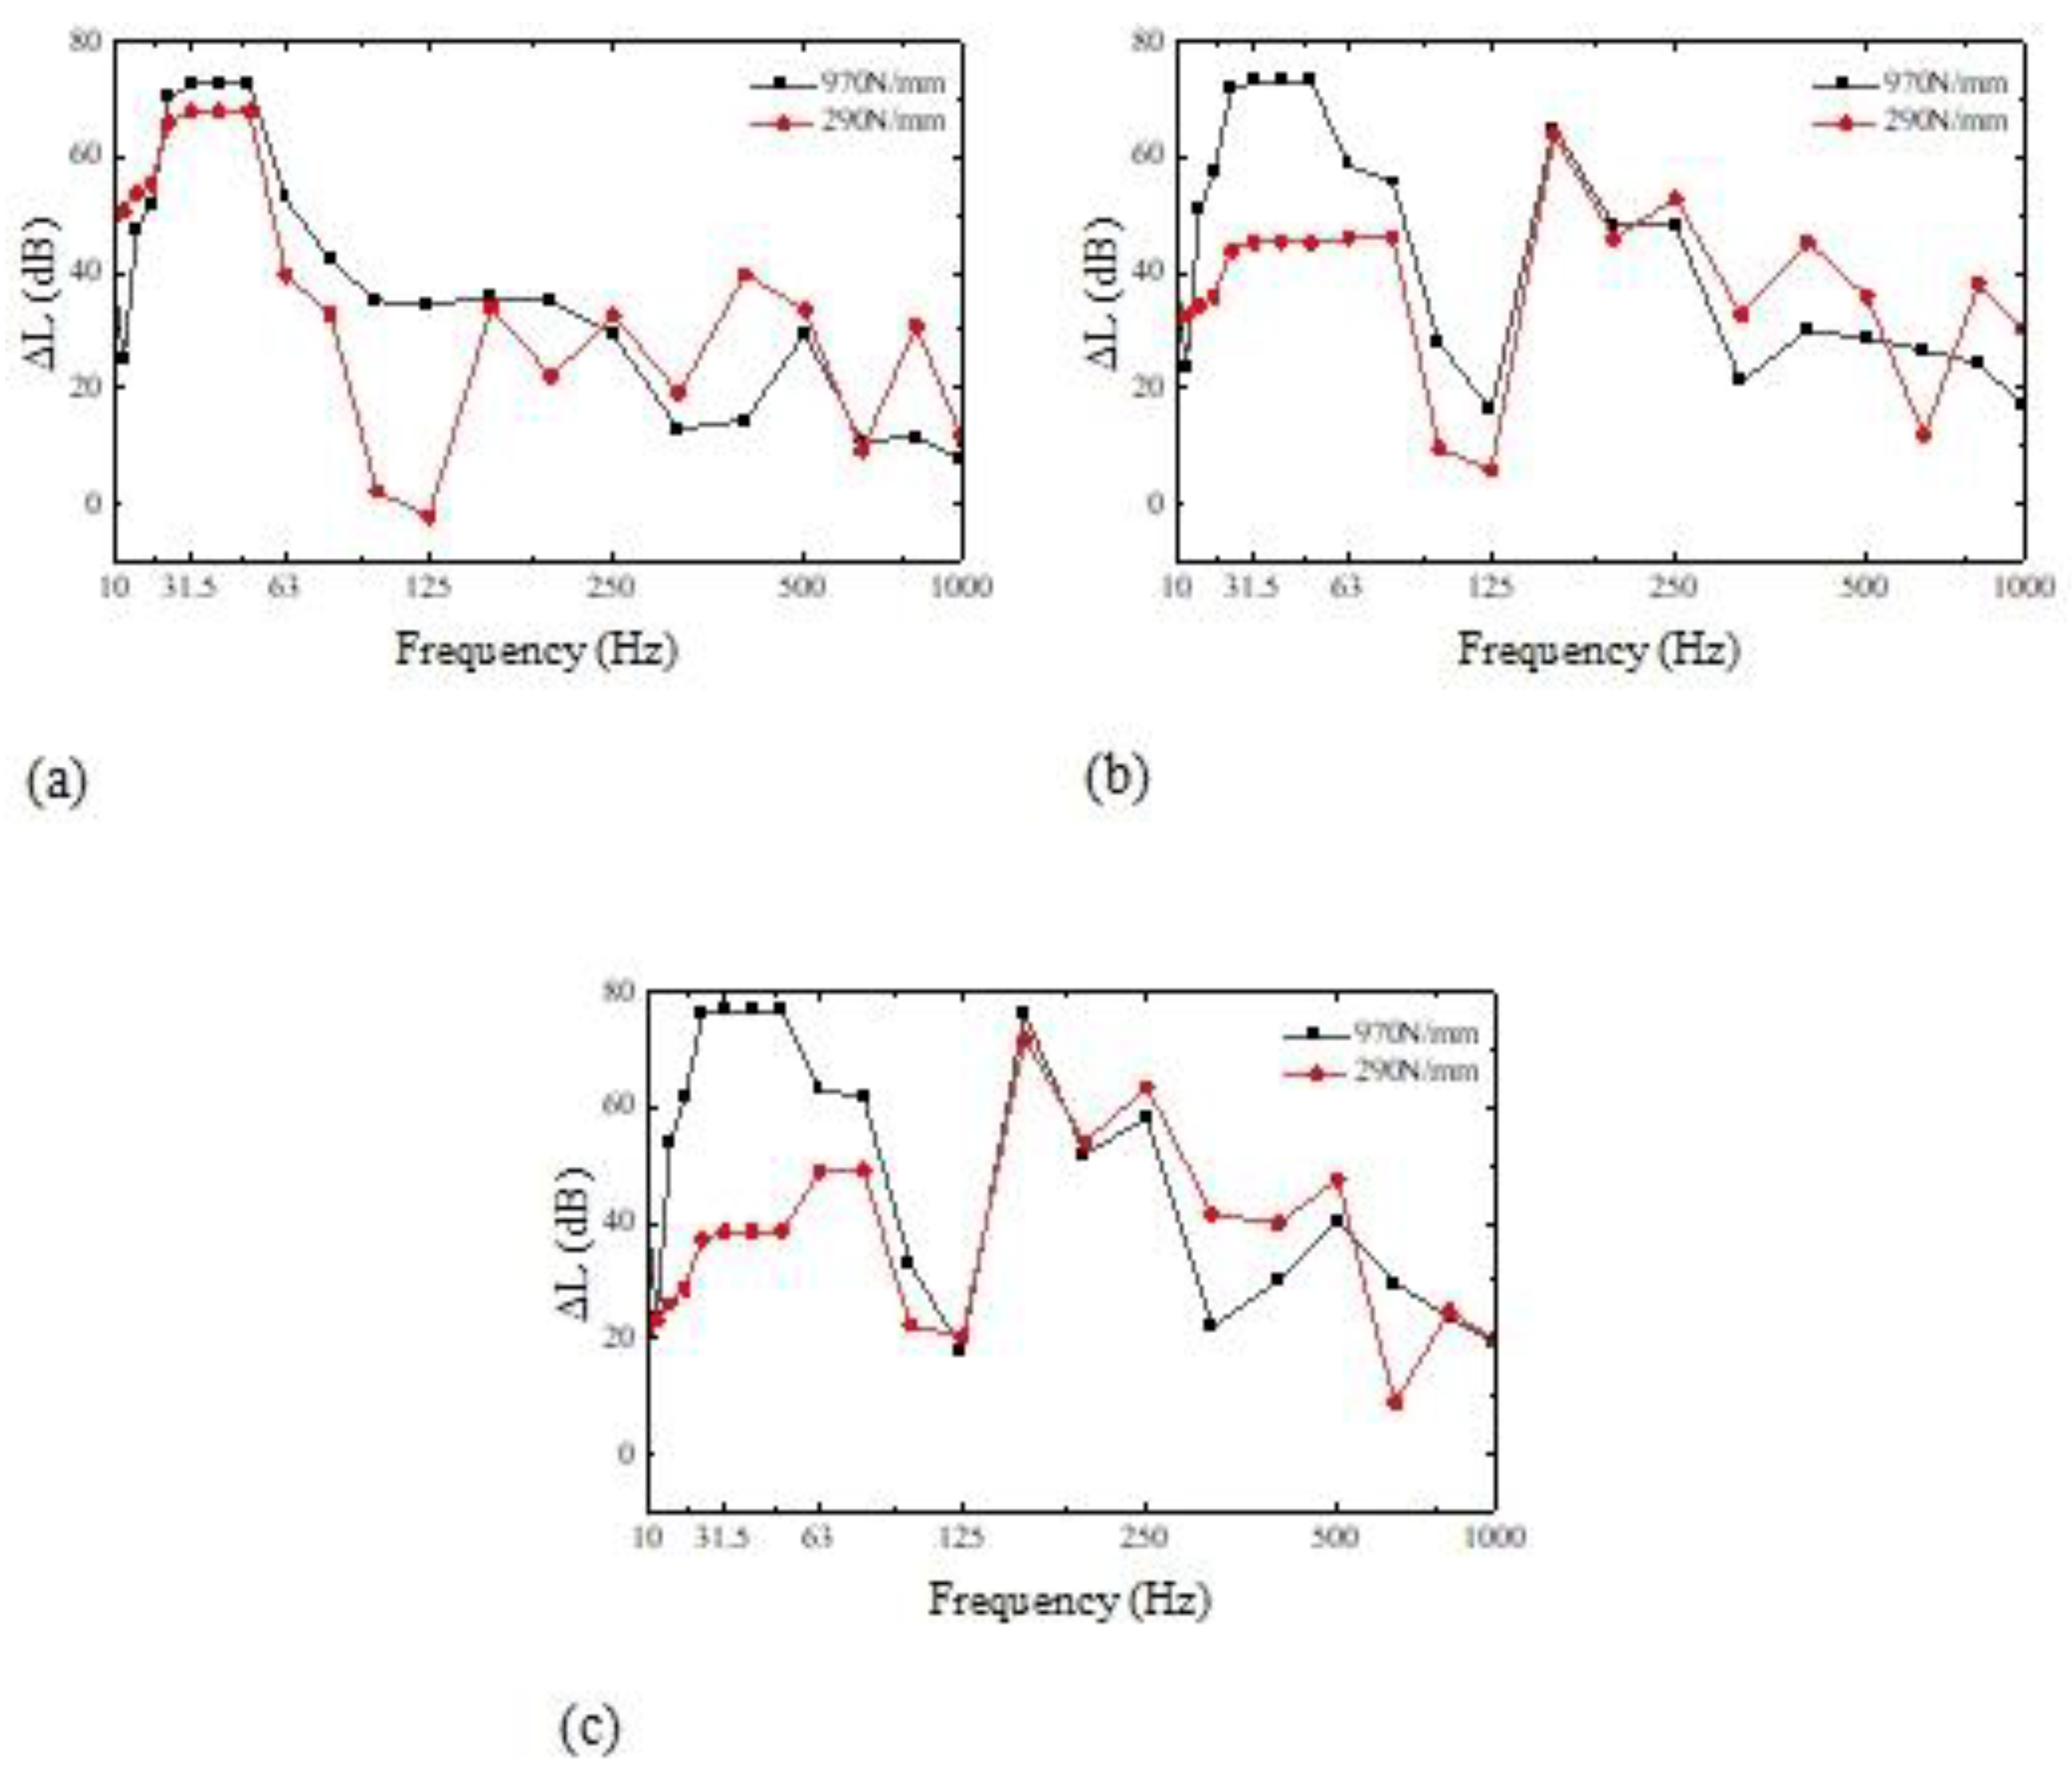
Figure 18.
The site conditions of the test pool and the layout of the data acquisition system.
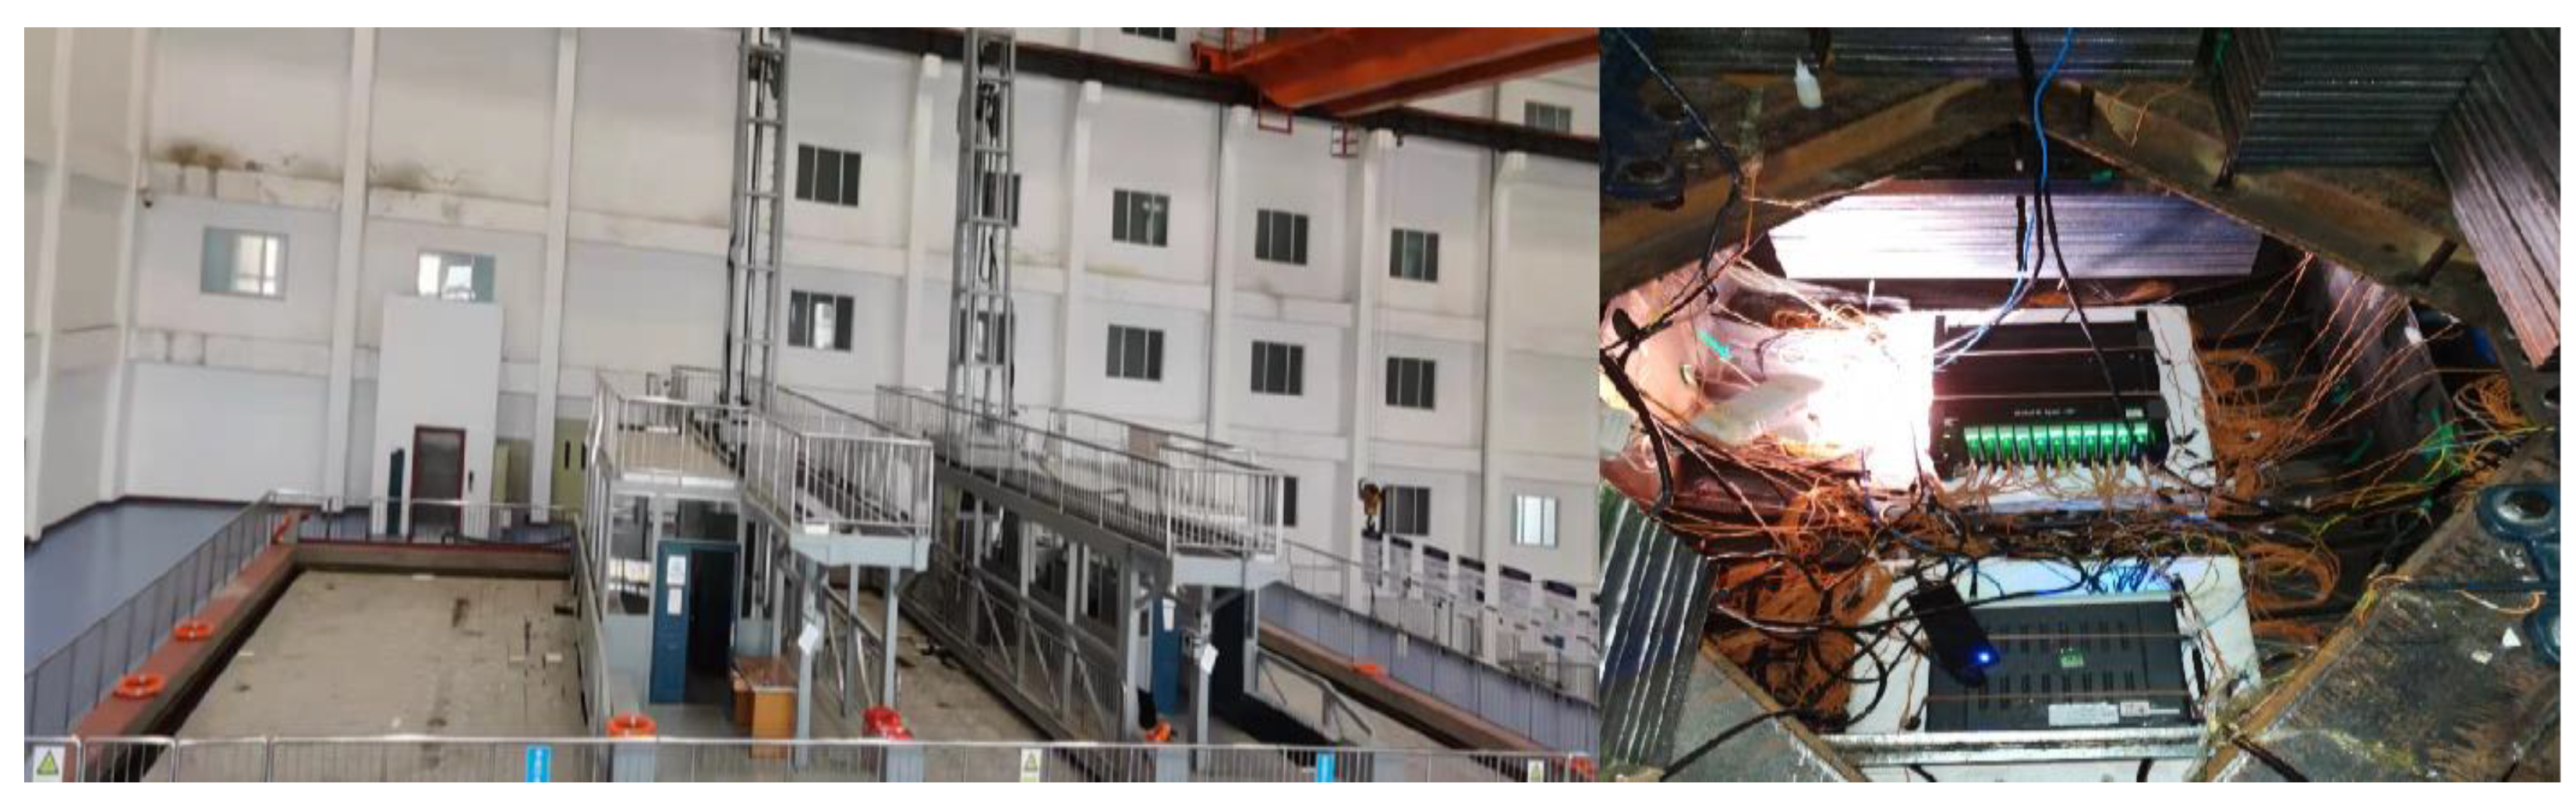
Figure 19.
Excitation frequency of 20Hz. Measuring points: (a) 2, (b) 3, and (c) 5.
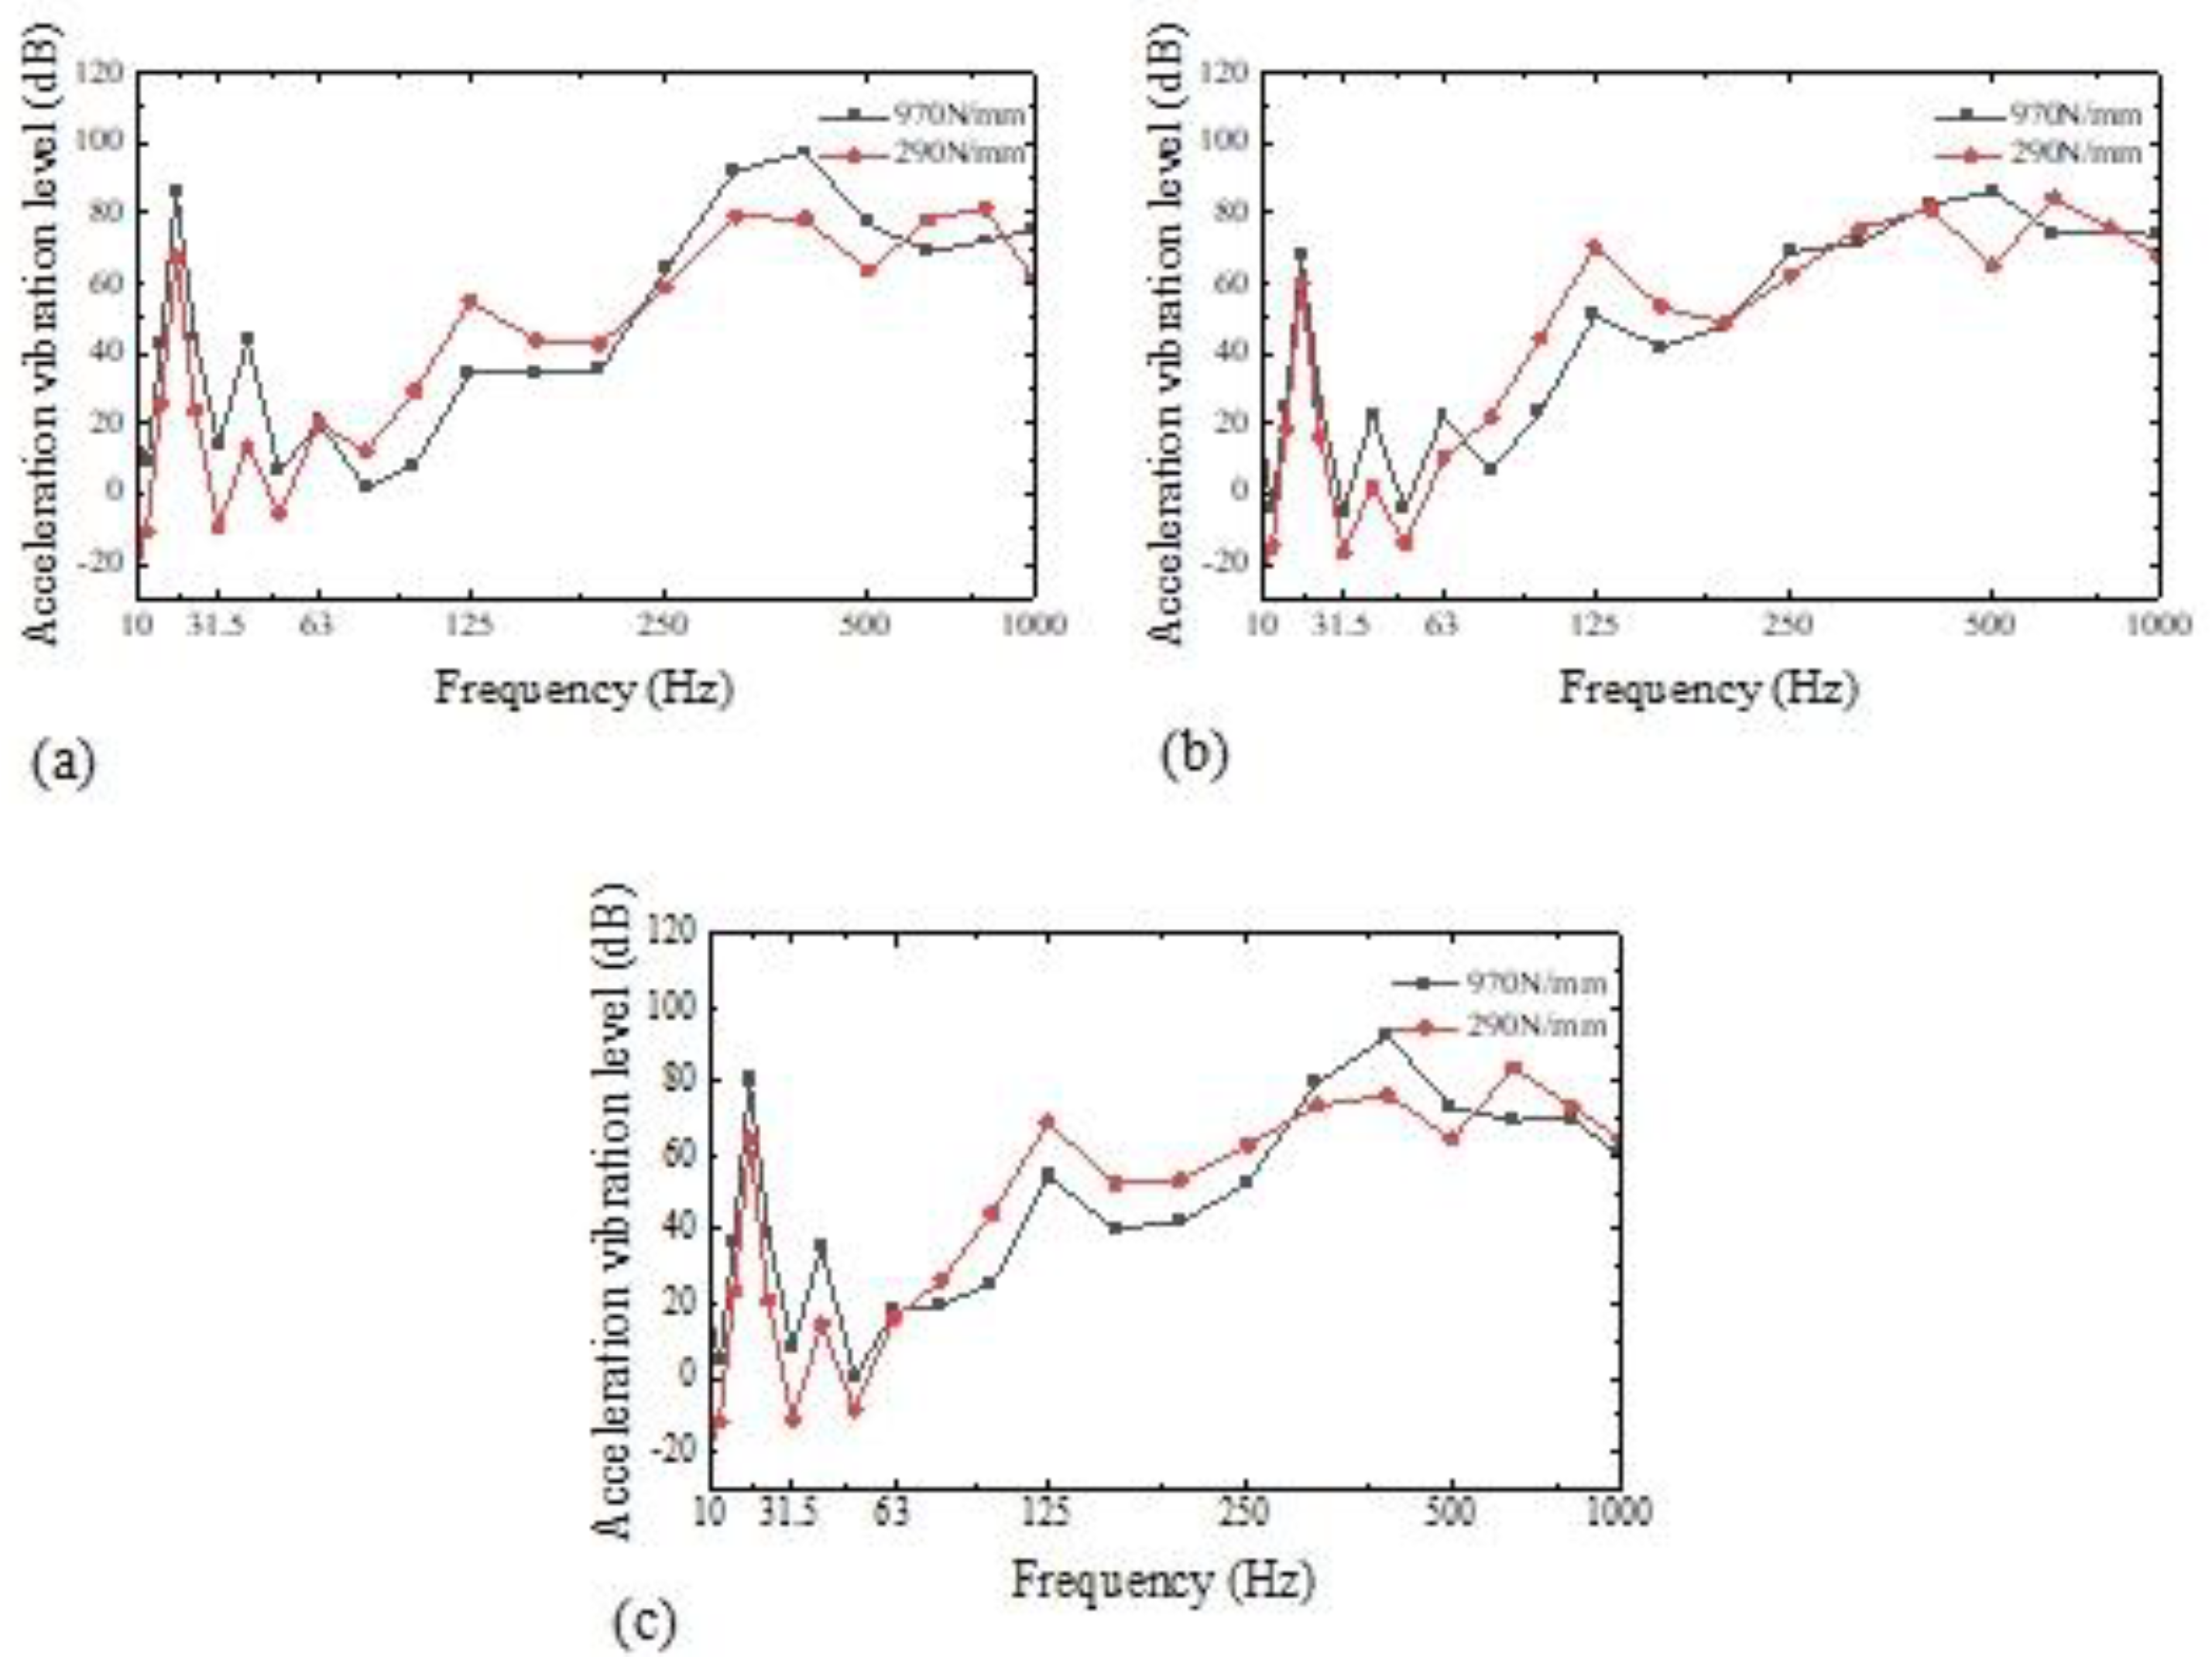
Figure 20.
The water entry scenario of the device and the corresponding hydrophone arrangement.
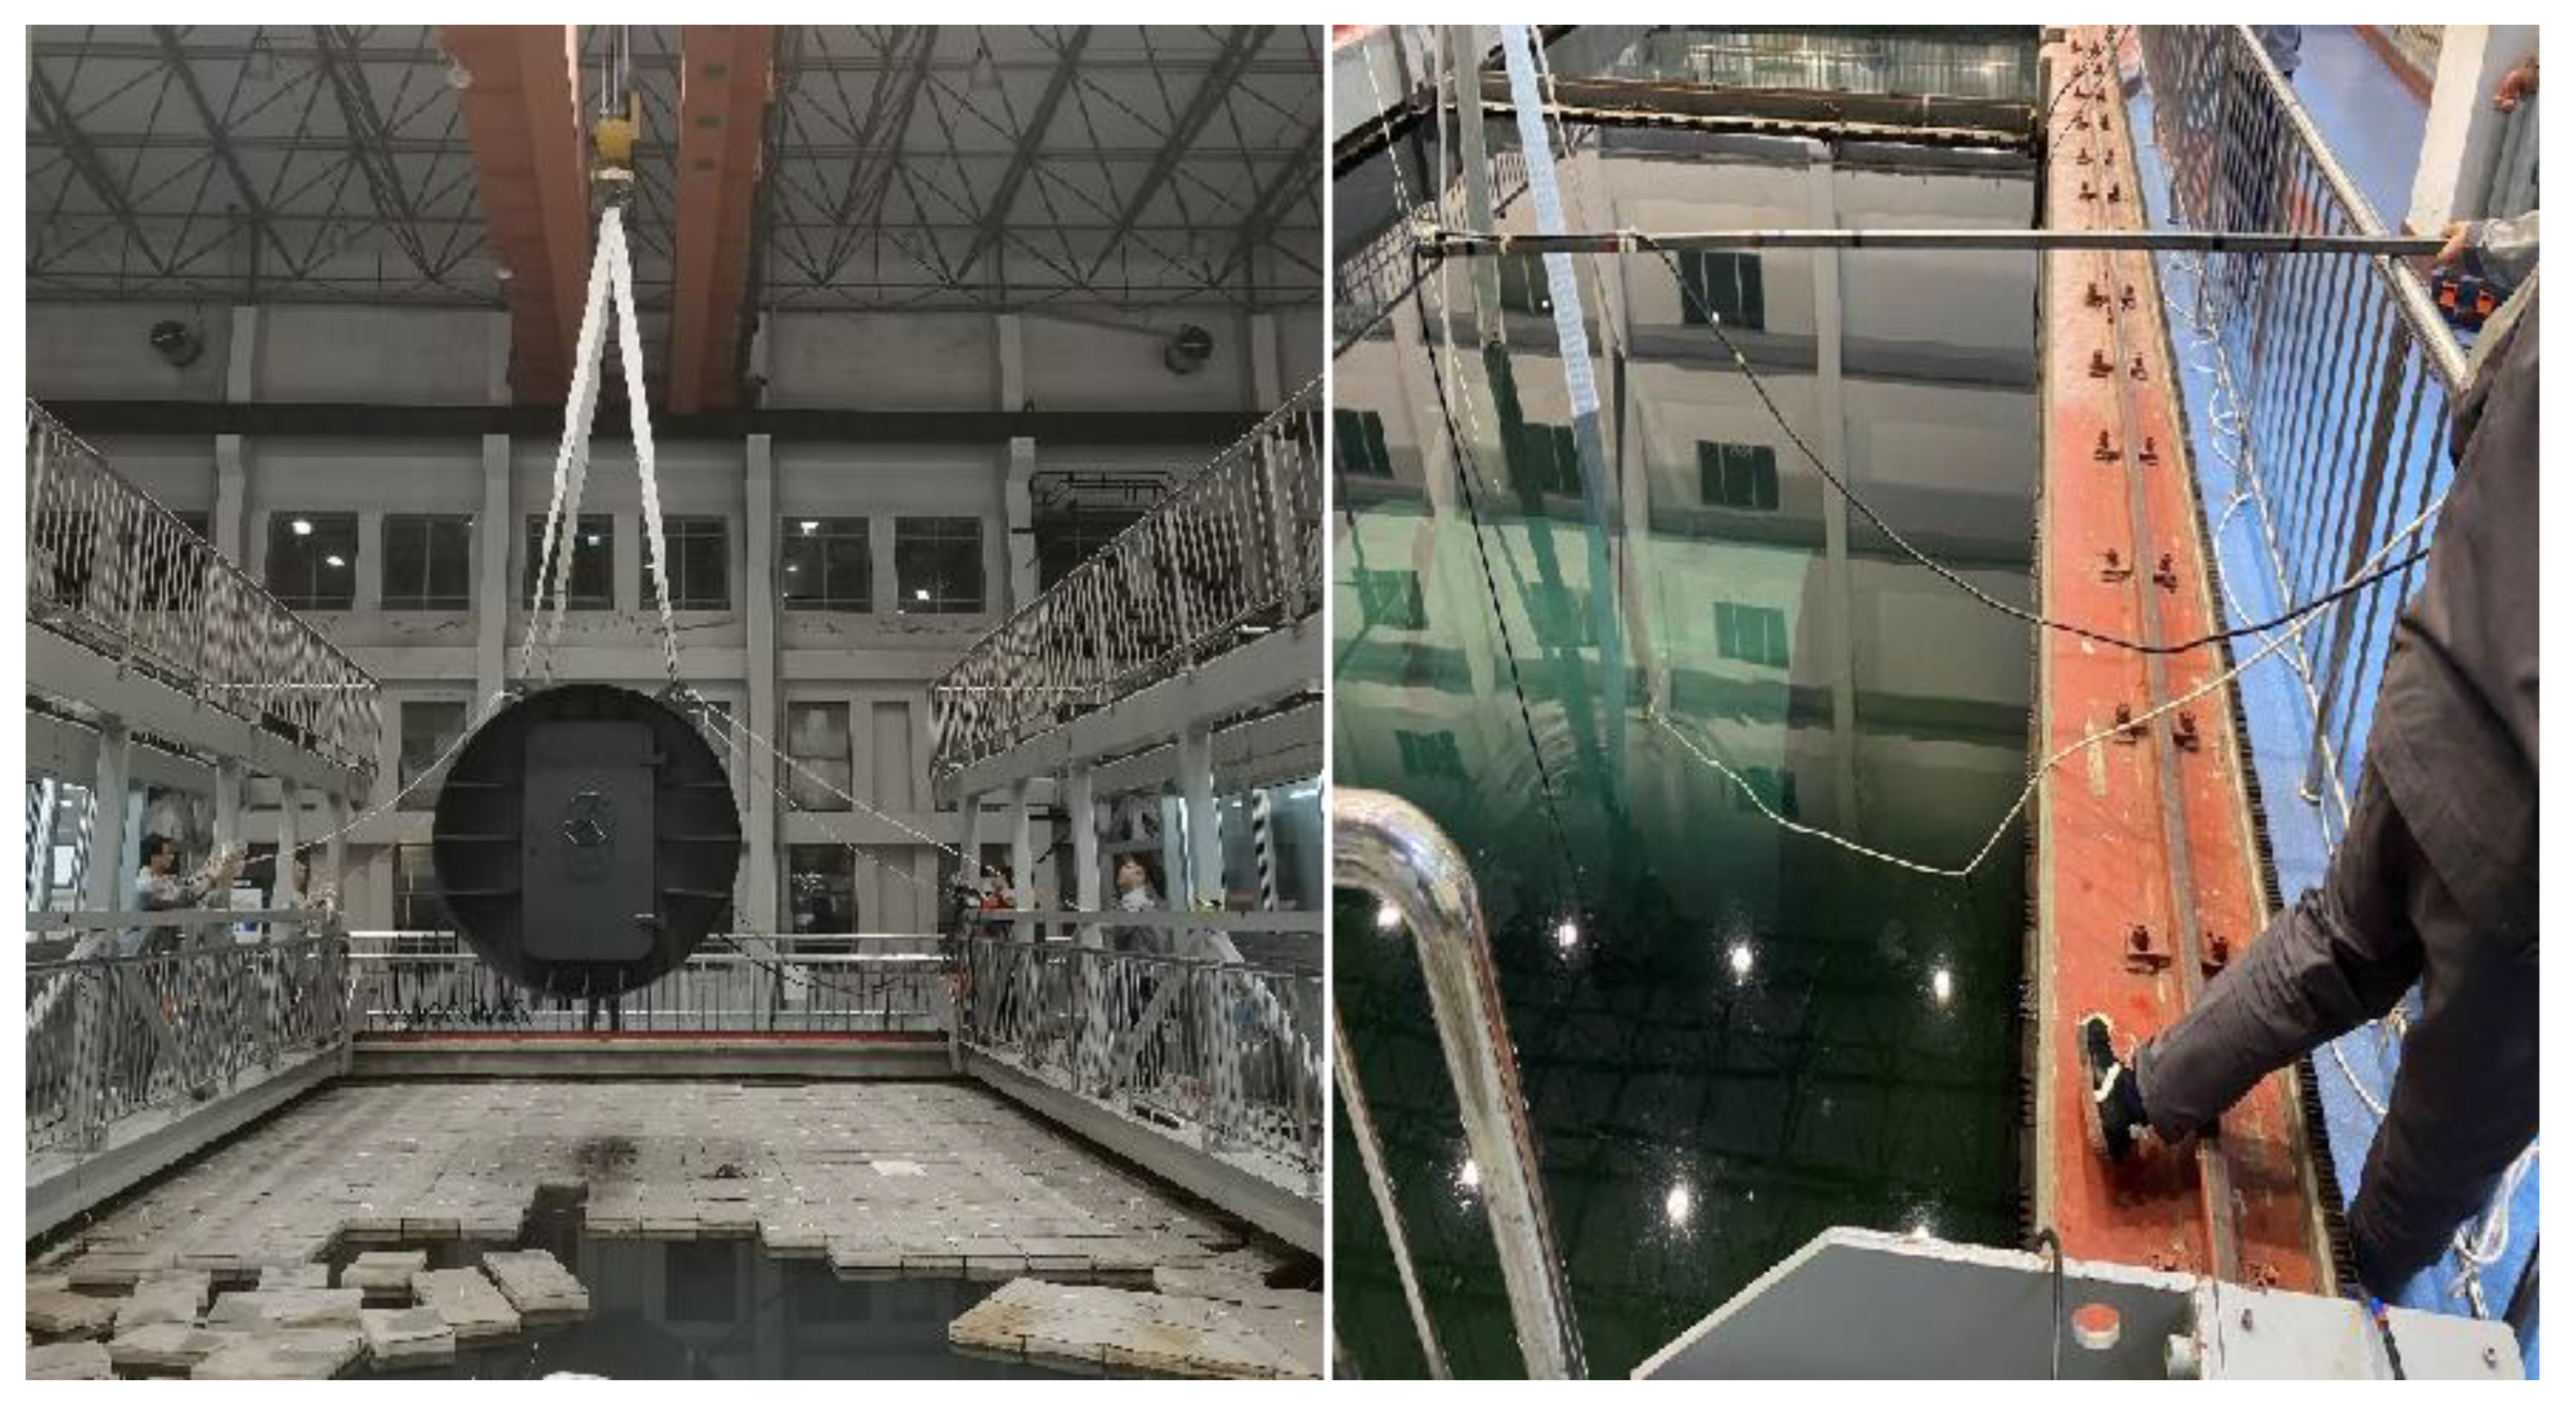

Table 1.
System parameters in the numerical simulations.
| Rigid body A system | Quality: 350 kg |
| Moment of inertia: 141.5kg*N2 | |
| Vibration isolator B system | Vibration isolator stiffness: 290 × 105 N/m |
| Damping loss factor: 0.2 | |
| Basic C system | Length × Width × Height: 1.8 m × 0.407 m× 0.05 m |
| Density: 7850 kg/m3 | |
| Elastic model: 210 Gpa | |
| Damping factor: 0.01 |
Table 2.
The natural frequencies of theoretical method and finite element method.
| Order | 1 | 2 | 3 | 4 | 5 | 6 |
| theoretical results(Hz) | 35.847 | 143.388 | 322.623 | 573.552 | 896.175 | 1290.50 |
| simulation result(Hz) | 35.899 | 144.600 | 325.520 | 575.960 | 892.400 | 1270.60 |
Table 3.
The first six natural frequencies of the unweighted raft frame.
| Modal orders | 1 | 2 | 3 | 4 | 5 | 6 |
| Frequency(Hz) | 105.5 | 180.3 | 186.3 | 305.4 | 309.3 | 311.6 |
Table 4.
The first six natural frequencies of raft with counterweight.
| Modal orders | 1 | 2 | 3 | 4 | 5 | 6 |
| Frequency(Hz) | 32.9 | 53.7 | 68.9 | 113.3 | 114.4 | 123.6 |
Table 5.
The first three natural frequencies of cylindrical shell.
| Modal orders | 1 | 2 | 3 |
| Frequency(Hz) | 47.0 | 119.2 | 186.0 |
Table 6.
Comparison of simulated and experimental natural frequencies of weightless rafts.
| Modal orders | Experimental frequency (Hz) | Finite element analysis frequency (Hz) | Error (%) |
| 1 | 97.9 | 105.5 | 7.2% |
| 2 | 166.8 | 180.3 | 7.5% |
Table 7.
Comparison of simulated and experimental natural frequencies of rafts with counterweights.
| Modal orders | Experimental frequency (Hz) | Finite element analysis frequency (Hz) | Error (%) |
| 1 | 23.6 | 32.9 | 28.3% |
| 2 | 59.3 | 53.7 | 10.4% |
Table 8.
Table 8. Comparison of simulated and experimental natural frequencies of rafts with counterweights.
Table 8.
Table 8. Comparison of simulated and experimental natural frequencies of rafts with counterweights.
| Number of the sensor to be averaged | The average difference of vibration level drop between onshore and underwater devices in the frequency band 5-315Hz | The average difference of vibration level drop between onshore and underwater devices in the frequency band 315-10kHz | The average difference of vibration level drop between onshore and underwater devices in the frequency band 5-10kHz |
| 1-6(Left) | -2.7 | -3.3 | -3.9 |
| 7-12(Right) | -2.7 | -3.2 | -3.7 |
| 1-12(All) | -2.9 | -3.6 | -4.2 |
Table 9.
Table 9. Attenuation comparison of measuring points under the operation of different stiffness isolators
Table 9.
Table 9. Attenuation comparison of measuring points under the operation of different stiffness isolators
| Number of the sensor | The total sound level value of underwater sound radiation in the frequency band of 5-10kHz under the working condition of large stiffness vibration isolator | The total sound level value of underwater sound radiation in the frequency band of 5-10kHz under the working condition of small stiffness vibration isolator | The total sound level attenuation of underwater acoustic radiation in the frequency band of 5-10kHz under the working condition of small and small stiffness isolator |
| 1 | 132.8 | 126.5 | 6.3 |
| 2 | 126.2 | 125.3 | 0.9 |
| 3 | 123.7 | 119.9 | 3.8 |
| 4 | 129.9 | 125.2 | 4.7 |
| 5 | 129.8 | 126.5 | 3.3 |
| 6 | 122.3 | 119.3 | 3.0 |
| 7 | 128.3 | 124.1 | 4.2 |
| 8 | 128.8 | 125.8 | 3.0 |
Disclaimer/Publisher’s Note: The statements, opinions and data contained in all publications are solely those of the individual author(s) and contributor(s) and not of MDPI and/or the editor(s). MDPI and/or the editor(s) disclaim responsibility for any injury to people or property resulting from any ideas, methods, instructions or products referred to in the content. |
© 2024 by the authors. Licensee MDPI, Basel, Switzerland. This article is an open access article distributed under the terms and conditions of the Creative Commons Attribution (CC BY) license (http://creativecommons.org/licenses/by/4.0/).
Copyright: This open access article is published under a Creative Commons CC BY 4.0 license, which permit the free download, distribution, and reuse, provided that the author and preprint are cited in any reuse.


