
Submitted:
05 December 2024
Posted:
06 December 2024
You are already at the latest version
Abstract
Detecting interactions is a critical aspect of medical research. When interactions are present, it is essential to calculate confidence intervals for both the main effect and the interaction effect. This requires determining the covariance between the two effects. In a two-stage individual patient data (IPD) meta-analysis, the coefficients, as well as their variances and covariances, can be calculated for each study. These coefficients can then be combined into an overall estimate using either a fixed-effect or random-effect meta-analysis model. The overall variance of the combined coefficient is typically derived using the inverse-variance method.However, to the best of our knowledge, no existing studies have addressed how to calculate the overall covariance between the main effect and the interaction effect in the context of meta-analysis. In this paper, we propose a straightforward and transparent method for calculating this covariance when interactions are considered in a meta-analysis. To facilitate implementation, we have developed an R package, covmeta, which is available at https://github.com/enwuliu/covmeta.
Keywords:
meta-analysis
; interactions
; covariance
; confidence intervals
; correlation coefficients
1. Introduction
When conducting an individual patient data (IPD) meta-analysis, researchers may need to examine interactions between two predictors. [1,2] In a one-stage meta-analysis,[3] all data are combined into a single dataset before analysis, allowing for the calculation of the covariance between predictors. However, this approach may not be feasible in situations where data cannot be consolidated into a single dataset, such as when data-sharing restrictions prevent data transfer. In such cases, a two-stage IPD meta-analysis is necessary.[4]
When interactions are present, it is crucial to calculate confidence intervals for both the combined main effect and the interaction effect.[5] Additionally, determining the overall covariance between the two coefficients is vital. To the best of our knowledge, no existing studies have addressed the calculation of confidence intervals for combined effects in two-stage IPD meta-analyses involving interactions.
To fill this gap, we propose a method for calculating the overall covariance in the presence of interactions between two effects. This method is applicable to both fixed-effect and random-effect meta-analysis models, providing a practical solution for researchers analyzing interactions within a meta-analytic framework.
2. Regression with Interaction
Suppose we aim to conduct a random-effects model meta-analysis to explore the interaction between falls and age and investigate whether the effect of falls on hip fractures varies across different age levels. (Note: This example is for illustrative purposes only and is not intended to provide any evidence on the topic.) A Poisson regression model can be utilized to examine these effects.
The Poisson model is specified as follows:
with the following log-linear relationship:
The effect of falls can be calculated as:
If exponentiatinge , yields the rate ratio (RR) for the effect.
The effect of falls depends on , and its confidence interval can be calculated as:[5]
In this model, n represents the sample size, p denotes the number of predictors, and for large samples, the t score can be approximated by the z score. The variable "age" serves as an effect modifier.
For a two-stage meta-analysis, the overall effects and variances of and can be calculated using the inverse-weighted average method.[6,7,8,9] Moreover, it is essential to combine these two regression coefficients to construct confidence intervals for the effect of falls at different age levels.
We present a method for combining coefficients and their covariance in a two-stage random-effects meta-analysis when interactions are present.
Suppose we have data from 10 cohort studies. For each cohort, we fit the specified Poisson regression model and obtain the following results:
In Table 1, represents the coefficient for falls (i.e., the main effect) in the cohort, while corresponds to the interaction effect of fall * age. and denote the variances of and , respectively, and is the covariance between these coefficients. Finally, represents the sample size for each cohort.
3. Meta Analysis for the Main Effect and Interaction Effect
Typically, the inverse-variance weighted method is employed for both fixed-effect and random-effect model meta-analyses.
3.1. Fixed effect meta-analysis
For the fixed-effect meta-analysis, the overall main effect, , can be calculated as:
where :
and k is the number of studies.
The overall variance of the main effect, , from the fixed-effect model can be calculated as:
For the interaction effect, , the calculations of the overall effect, , and the overall variance, , are analogous to those of the main effect.
3.2. Random-effect meta-analysis
For the random-effect meta-analysis, the overall main effect, , can be calculated as:
where:
The overall variance of the main effect, , from the random-effects model can be calculated as:
The between-study variance, , for the random-effects meta-analysis is calculated in the following steps:
Step 1: Calculate the Q-statistic
Step 2: Calculate c
Step 3: calculate
Here, represents the degrees of freedom, which is equal to the number of studies minus one, i.e. .
Similarly, for the interaction effect, , the overall effect, , and its variance, , can be calculated using the same approach as for the main effect.
After calculating the Q-statistic, the -statistic, which quantifies the percentage of variation across studies due to heterogeneity, can be determined using:
4. Covariance in Meta-Analysis
4.1. Relationship Between Covariance and Correlation Coefficient r
The overall main effect, , and the overall interaction effect, , can be calculated using popular R packages such as ’meta’ and ’metafor’, or SAS macros. Consequently, the overall effect at different ages can be determined. However, to the best of our knowledge, no existing papers provide guidance on how to combine covariance in the presence of interactions in meta-analysis to calculate an overall covariance, as required by Equation(2).
In this context, we propose a method for calculating the overall covariance in meta-analysis. This method leverages the relationship between the correlation coefficient, variance, and covariance, as expressed in the following equation:[10]
Here, represents the covariance between two random variables X and Y, while and are their standard deviations. Specifically, X and Y can be replaced with the estimated coefficients and , and the standard deviations with their corresponding standard errors. Based on this, the overall covariance can be calculated as:
In Equation (12), represents the overall covariance between and , and is the overall correlation coefficient. This overall covariance is derived from either a fixed-effect or random-effects meta-analysis. However, a key step involves calculating an overall correlation coefficient , which is not straightforward in meta-analysis.
To calculate the overall correlation coefficient, , the following steps can be followed:[6]
1. For each cohort, extract the standard errors of the two coefficients and their covariance from the regression model.
2.Calculate the correlation coefficient for each cohort using the Equation (11)
where represents the covariance between the two coefficients, and , are the standard errors of and , respectively.
3. Perform a random-effect meta-analysis (or fixed-effect meta-analysis) on values to estimate .
Once is determined, it can be substituted into Equation(12) to calculate the overall covariance
4.2. Fixed-Effect Meta-Analysis for Correlation Coefficient r
To conduct a meta-analysis for correlation coefficients, Fisher’s z-transformation is first applied, expressed as:
The variance of is calculated as:
where represents the valid sample size for each cohort.
The meta-analysis for follows the same procedure as for other statistics, such as, such as . Once the overall z value is obtained,it is transformed back to r using the equation:
For the fixed-effect meta-analysis of , the weight is given by:
where is variance of which is
The overall Fisher’Z is calculated as:
where k is the total number of studies included in the meta-analysis.
All above calculations are for fixed-effect meta-analysis. Then we can transform back to using Equation (16).
4.3. Random-Effect Meta-Analysis for Correlation Coefficient r
For a random-effect meta-analysis, the following additional steps are required:
1. Calculate the Q-statistic:
2. Calculate the between-study variance :
where:
and is the degrees of freedom, equal to
3. Recalculate variance and weight
The variance is updated as:
.
The new weight becomes:
4. Calculate the overall Fisher’s
5. Transform back to
Once is obtained, transform it back to overall using Equation (16)
6. Final steps
After determining using either fixed-effect or random-effect meta-analysis, the overall covariance can be calculated by Equation (12).
5. Example: Analyzing the 10 Cohort Studies in Table 1
5.1. Meta-Analysis for
We wrote custom R functions to perform meta-analysis on the data in Table 1. The following R functions conduct both fixed-effect and random-effect meta-analyses for .
studies <- read.csv(’https://raw.githubusercontent.com/enwuliu/
meta-analysis/main/random_effect_meta_sim.csv’, header = TRUE)
b1<-studies$b1 # beta1 from the 10 cohorts
var_b1 <- studies$var_b1 # variances of the coefficients
fixed_effect_meta <- function(B, V) {
W <- 1 / V
Beta <- sum(W * B) / sum(W)
Var <- 1 / sum(W)
resultlist <- list(’Overall beta’ = Beta, ’Overall variance’ = Var)
return(resultlist)
}
random_effect_meta <- function(B, V) {
W <- 1 / V
Q <- sum(W * B^2) - (sum(W * B))^2 / sum(W)
df <- length(B) - 1
c <- sum(W) - sum(W^2) / sum(W)
tau_square <- ifelse(Q > df, (Q - df) / c, 0)
V_star <- V + tau_square
W_star <- 1 / V_star
Beta_star <- sum(W_star * B) / sum(W_star)
Var_star <- 1 / sum(W_star)
resultlist <- list(
’Overall beta’ = Beta_star,
’Overall variance’ = Var_star)
return(resultlist)
}
fixed_b1 <- fixed_effect_meta(b1, var_b1)
fixed_b1
# $`Overall beta`
# [1] 1.040411
#
# $`Overall variance`
# [1] 0.6841809
random_b1 <- random_effect_meta(b1, var_b1)
random_b1
# $`Overall beta`
# [1] 1.014141
#
# $`Overall variance`
# [1] 0.7308388
From the results, the overall fixed-effect estimate for is 1.040411, with an overall variance of 0.6841809. The overall random-effect estimate is 1.014141, with an overall variance of 0.7308388.
5.2. Meta-Analysis for
We used the same R functions to perform meta-analysis for :
b2 <- studies$b2 # beta2 from the 10 cohorts
var_b2 <- studies$var_b2 # variances of the coefficients
fixed_b2<-fixed_effect_meta(b2, var_b2)
fixed_b2
# $`Overall beta`
# [1] -0.01140614
#
# $`Overall variance`
# [1] 0.0001403961
random_b2<-random_effect_meta(b2, var_b2)
random_b2
# $`Overall beta`
# [1] -0.01140614
#
# $`Overall variance`
# [1] 0.0001403961
Both fixed-effect and random-effect meta-analyses yield an overall interaction effect of =-0.01140614, with a variance of 0.0001403961.
5.3. Meta-Analysis for r
The following R functions were used to conduct a meta-analysis of the correlation coefficients
fixed_effect_meta_r<-function(v1,v2,cov12,sample_size){
r<-cov12/sqrt(v1*v2) #correlation coefficient
z<-0.5*log((1+r)/(1-r)) #Fisher z transformation
v<-1/(sample_size-3) #variance for z
W<-1/v #weight
z_overall<-sum(W*z)/sum(W) #overall random effect of z
r_overall<-(exp(2*z_overall)-1)/(exp(2*z_overall)+1) #transform back to r
return(r_overall)
}
random_effect_meta_r<-function(v1,v2,cov12,sample_size){
r<-cov12/sqrt(v1*v2) #correlation coefficient
z<-0.5*log((1+r)/(1-r)) #Fisher z transformation
v<-1/(sample_size-3) #variance for z
W<-1/v #weight
Q<-sum(W*z^2)-(sum(W*z))^2/sum(W) #total variance or Q statistics
c<-sum(W)-sum(W^2)/sum(W) #c is the scaling factor
df=length(v1)-1 #degree of freedom
tau_square<-ifelse(Q>df,(Q-df)/c,0) #between study variance
v_star=v+tau_square
W_star=1/v_star #new weight
z_star<-sum(W_star*z)/sum(W_star) #overall random effect of z
r_overall<-(exp(2*z_star)-1)/(exp(2*z_star)+1) #transform back to r
return(r_overall)
}
v1<-studies$var_b1
v2<-studies$var_b2
v12<-studies$cov_b1b2
sample_size<-studies$sample_size
r<-v12/sqrt(v1*v2)
fixed_meta_r<-fixed_effect_meta_r(v1,v2,v12,sample_size)
fixed_meta_r
#[1] -0.9600286
random_meta_r<-random_effect_meta_r(v1,v2,v12,sample_size)
random_meta_r
#[1] -0.9493409
The overall r for fixed-effect meta-analysis is -0.9600286, while the random-effect meta-analysis gives -0.9493409.
5.4. Overall Covaraince for and
Using Equation (12), the overall covariance is calculated as follows:
- Fixed-effect model:
- Random-effect model:
5.5. Calculating the Dffect of Falls on Hip Fracture at Different Ages and Its 95% Confidence Intervals
Using the information derived above, we can calculate the effect of falls on hip fracture at different ages and its corresponding 95% confidence intervals using Equation (2). Additionally, we generate a plot of the rate ratio (RR) for hip fracture, comparing fallers versus non-fallers at various ages, by exponentiating the estimated coefficients.
To illustrate, we calculate the effect of falls on hip fracture for ages 50 to 90. First, we conduct a fixed-effect meta-analysis, followed by a random-effect meta-analysis.
The following R code calculates the interaction effect of falls with age and the corresponding 95% confidence intervals, using Equation (2), based on the results of the fixed- and random-effect meta-analyses.
library(ggplot2)
library(ggpubr)
plot_with_interaction <- function(age, b1, v1, b2, v2, r) {
cov_b1b2 <- r * sqrt(v1 * v2)
RR <- exp(b1 + b2 * age)
RR_lower <- exp((b1+b2*age)-1.96 * sqrt(v1+age^2 * v2+2 * age*cov_b1b2))
RR_upper <- exp((b1+b2*age)+1.96*sqrt(v1+age^2 * v2+2*age*cov_b1b2))
ndata <- as.data.frame(cbind(RR, RR_lower, RR_upper, age))
ggplot(data = ndata, aes(x = age)) +
geom_line(aes(y = RR)) +
geom_line(aes(y = RR_lower), color = "steelblue", linetype = "dashed") +
geom_line(aes(y = RR_upper), color = "steelblue", linetype = "dashed") +
scale_y_continuous(name = "Rate Ratio (RR): Fallers vs. Non-Fallers",
limits = c(0, 4), expand = c(0, 0)) +
theme_bw() +
theme(axis.line = element_line(color = ’black’),
axis.title.y = element_text(size = 8),
axis.title.x = element_text(size = 8),
axis.text.y = element_text(size = 8),
axis.text.x = element_text(size = 8),
plot.background = element_blank(),
panel.grid.major = element_blank(),
panel.grid.minor = element_blank(),
panel.border = element_blank())
}
# Fixed-effect model
age <- seq(50, 90, 1)
b1 <- fixed_b1$`Overall beta`
v1 <- fixed_b1$`Overall variance`
b2 <- fixed_b2$`Overall beta`
v2 <- fixed_b2$`Overall variance`
r <- fixed_meta_r
p1 <- plot_with_interaction(age, b1, v1, b2, v2, r)
p1
# Random-effect model
b1_rand <- random_b1$`Overall beta`
v1_rand <- random_b1$`Overall variance`
b2_rand <- random_b2$`Overall beta`
v2_rand <- random_b2$`Overall variance`
r_rand <- random_meta_r
p2 <- plot_with_interaction(age, b1_rand, v1_rand, b2_rand, v2_rand, r_rand)
p2
p3 <- ggarrange(p1, p2,
labels = c("Fixed Effect", "Random Effect"),
ncol = 2, nrow = 1)
p3
6. An R Package for Calculating Overall Covariance in Meta-Analysis
To facilitate these calculations, we developed an R package called ’covmeta’, available on GitHub. This package can be installed and used within the R environment. Below is the R code to install the package and calculate the overall covariance using the data in Table 1:
#install the package
library(devtools)
install_github("enwuliu/covmeta")
library(covmeta)
# Load the dataset
studies <- read.csv(’https://raw.githubusercontent.com/enwuliu/
meta-analysis/main/random_effect_meta_sim.csv’, header = TRUE)
# Function arguments
b1 <- studies$b1 # Beta1 coefficients from the 10 cohorts
v1 <- studies$var_b1 # Variances of Beta1
b2 <- studies$b2 # Beta2 coefficients from the 10 cohorts
v2 <- studies$var_b2 # Variances of Beta2
cov_b1b2 <- studies$cov_b1b2 # Covariance between Beta1 and Beta2
sample_size <- studies$sample_size # Sample sizes
# Calculate the overall main effect, interaction effect, and covariance
# Fixed-effect meta-analysis
cov_meta(b1, v1, b2, v2, cov_b1b2, sample_size, ’fixed’)
# Random-effect meta-analysis
cov_meta(b1, v1, b2, v2, cov_b1b2, sample_size, ’random’)
7. Discussion
This paper proposes a method for calculating overall covariance for regression coefficients in the presence of interactions in a two-stage meta-analysis. The approach utilizes the statistical relationship between the correlation coefficient and variances to estimate the covariance. By conducting separate meta-analyses, the variances and correlation coefficient can be obtained. While statistical software packages provide built-in capabilities for analyzing the overall main effect, interaction effects, and their variances,[11,12] no studies have explicitly demonstrated how to merge covariances in meta-analysis in the presence of interactions. We present a transparent and straightforward method to synthesize covariance in meta-analysis.
Detecting interactions is crucial in medical research, as interaction analyses can help determine whether an intervention is more effective for certain individuals.[13,14,15] In a two-stage meta-analysis, interactions between an exposure and covariates can be explored using meta-regression. However, the meta-regression method cannot study patient-level factors[16] and often suffers from low statistical power.[17] An alternative is dividing participants into subgroups (e.g., by age) and performing separate meta-analyses for each subgroup. While this avoids synthesizing interactions, it also tends to have low power.[18]
Another method for investigating covariances in meta-analysis is multivariate meta-analysis, which synthesizes correlated effects. For instance, in hypertension trials, systolic and diastolic blood pressure outcomes can be pooled using this approach.[19,20,21] In multivariate meta-analysis, the first-stage analysis estimates the effects (e.g., coefficients) and their covariances, which serve as inputs for the second-stage analysis conducted using mixed-model regression.[22,23] However, in this framework, the two correlated variables are treated as outcome variables rather than predictors.
Our method has some limitations. It assumes a linear relationship between the two regression coefficients, which may not always hold.[24]Additionally, the estimation of the correlation coefficient may be less reliable when the number of included studies is small.[25]
In conclusion, we have introduced a simple and transparent method for calculating covariance and confidence intervals in meta-analysis when interactions are present.
Author Contributions
Conceptualization, EL; methodology, EL; software, EL, RL; validation, RL, EL ; writing—original draft preparation, EL; writing—review and editing, EL,RL ; All authors have read and agreed to the published version of the manuscript.
Funding
This research received no external funding
Institutional Review Board Statement
Not applicable
Informed Consent Statement
Not applicable
Data Availability Statement
data set and all code for this paper are available at https://github.com/enwuliu/meta-analysis
Conflicts of Interest
The authors declare no conflicts of interest.
References
- Liesbeth Vandenput, Helena Johansson, Eugene V. McCloskey. et al. A meta-analysis of previous falls and subsequent fracture risk in cohort studies. Osteoporos International 2024, 35, 469–494. [Google Scholar] [CrossRef]
- John A Kanis, Helena Johansson , Eugene V McCloskey, et al. Previous fracture and subsequent fracture risk: a meta-analysis to update FRAX. Osteoporos International 2023, 34, 2027–2045. [Google Scholar] [CrossRef]
- Danielle L. Burke, Joie Ensor, Richard D. Riley. Burke, Joie Ensor, Richard D. Riley. Meta-analysis using individual participant data: one-stage and two-stage approaches, and why they may differ. Statistics in Medicine 2017, 36, 855–87. [Google Scholar] [CrossRef]
- Richard D Riley, Joie Ensor, Miriam Hattle, et al. Two-stage or not two-stage? That is the question for IPD meta-analysis projects. Research Synthesis Methods 2023, 14, 903–910. [Google Scholar] [CrossRef]
- Adolfo Figueiras, Jose Maria Domenech-Massons, Carmen Cadarso. Regression models: calculating the confidence interval of effects in the presence of interactions. Statistics in medicine 1998, 17, 2099–2105. [Google Scholar] [CrossRef]
- Shahjahan Khan. Meta-Analysis Methods for Health and Experimental Studies; Springer, 2020.
- Michael Borenstein, Larry V.Hedges, Julian P.T.Higgins, HannahR.Rothstein. Introduction to meta-analysis; John Wiley & Sons, 2021.
- Guido Schwarzer, James R. Carpenter , Gerta Rucke, Meta-Analysis with R; Springer, 2015.
- Rebecca DerSimonian, Nan Laird. Meta-analysis in clinical trials. Controlled clinical trials 1986, 7, 177–188. [Google Scholar] [CrossRef] [PubMed]
- Agustin Garcia Asuero, Ana Sayago, Gustavo Gonzlez. The correlation coefficient: An overview. Critical reviews in analytical chemistry 2006, 36, 41–59. [Google Scholar] [CrossRef]
- Guido Schwarze. meta: An R package for meta-analysis. R news 2007, 7, 40–45. [Google Scholar]
- Wolfgang Viechtbauer. Conducting meta-analyses in R with the metafor package. Journal of statistical software 2010, 36, 1–48. [Google Scholar]
- Milos Brankovic, Isabella Kardys, Ewout W Steyerberg, et al. Understanding of interaction (subgroup) analysis in clinical trials. European journal of clinical investigation 2019, 49, e13145. [Google Scholar] [CrossRef] [PubMed]
- Rui Wang, Stephen W Lagakos, James H Ware, et al. Statistics in medicine—reporting of subgroup analyses in clinical trials. New England Journal of Medicine 2007, 357, 2189–2194. [Google Scholar] [CrossRef] [PubMed]
- Marty Richardson, Paul Garner, and Sarah Donegan. Interpretation of subgroup analyses in systematic reviews: a tutorial. Clinical Epidemiology and Global Health 2019, 7, 192–198. [Google Scholar] [CrossRef]
- Christopher H Schmid, Paul C Stark, Jesse A Berlin, et al. Meta-regression detected associations between heterogeneous treatment effects and study-level, but not patient-level, factors. Journal of clinical epidemiology 2004, 57, 683–697. [Google Scholar] [CrossRef] [PubMed]
- Loukia M. Spinelia, Nikolaos Pandis. Spinelia, Nikolaos Pandis. Problems and pitfalls in subgroup analysis and meta-regression. American journal of orthodontics and dentofacial orthopedics 2020, 158, 901–904. [Google Scholar] [CrossRef]
- Pim Cuijpers, Jason W Griffin, Toshi A Furukawa. The lack of statistical power of subgroup analyses in meta-analyses: a cautionary note. Epidemiology and Psychiatric Sciences 2021, 30, e78. [Google Scholar] [CrossRef] [PubMed]
- The Stata news, In the spotlight: Multivariate meta-analysis, Available online: https://www.stata.com/stata-news/news37-1/multivariate-meta-analysis/ (accessed on 28 November 2024).
- Sheng Luo, Yong Chen, Xiao Su, Haitao Chu. mmeta: an R package for multivariate meta-analysis. Journal of Statistical Software 2014, 56, 1–26. [Google Scholar]
- Richard D Riley, Malcolm J Price, Dan Jackson, et al. Multivariate meta-analysis using individual participant data. Research synthesis methods 2015, 6, 157–174. [Google Scholar] [CrossRef]
- Dimitris Mavridis, Georgia Salanti. A practical introduction to multivariate meta-analysis. Statistical methods in medical research 2013, 22, 133–158. [Google Scholar] [CrossRef] [PubMed]
- Dan Jackson, Richard Riley, Ian R. White. Multivariate meta-analysis: potential and promise. Statistics in medicine 2011, 30, 2481–2498. [Google Scholar] [CrossRef]
- Antonio Gasparrini, Benedict Armstrong, Michael G Kenward. Multivariate meta-analysis for non-linear and other multi-parameter associations. Statistics in Medicine 2012, 31, 3821–3839. [Google Scholar] [CrossRef]
- Andy P. Field. Field. Meta-analysis of correlation coefficients: a Monte Carlo comparison of fixed-and random-effects methods. Psychological methods 2001, 6, 161–180. [Google Scholar] [CrossRef] [PubMed]
Figure 1.
Effect of falls on hip fracture at different ages, comparing fallers vs. non-fallers.
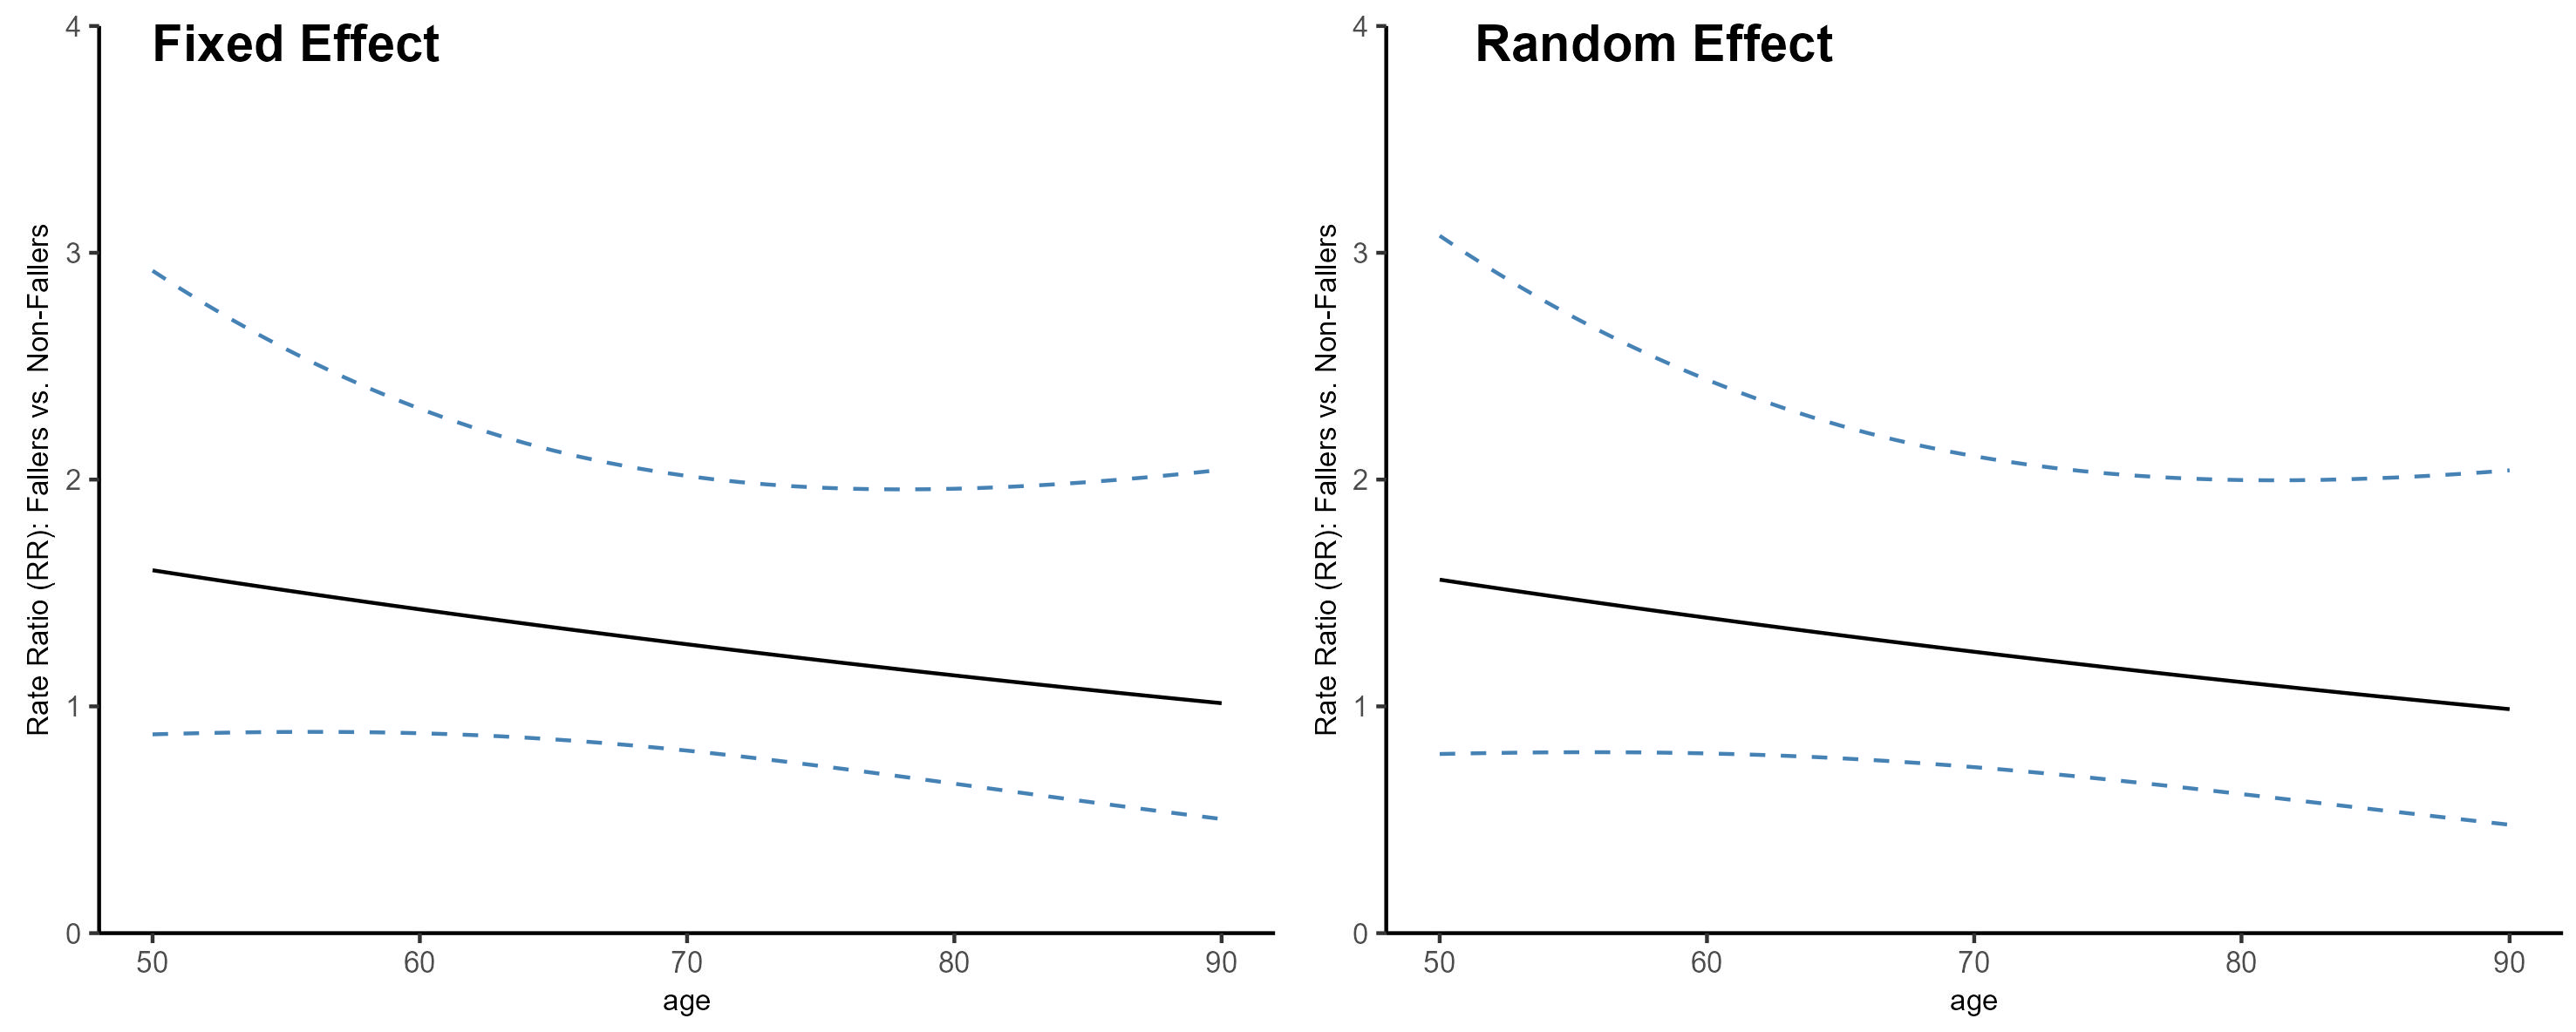

Table 1.
Simulated results for 10 cohort studies.
| Cohort | var() | var() | cov() | |||
|---|---|---|---|---|---|---|
| A | 3.0014 | -0.0240 | 2.9419 | 0.0005 | -0.0333 | 5000 |
| B | 1.1488 | -0.0677 | 14.6165 | 0.0029 | -0.2000 | 30000 |
| C | 1.5819 | -0.0936 | 15.8097 | 0.0022 | -0.1825 | 10000 |
| D | 2.0349 | -0.0139 | 3.6954 | 0.0318 | -0.3230 | 3000 |
| E | -4.1219 | 0.0225 | 5.2448 | 0.0009 | -0.0629 | 2000 |
| F | 1.2506 | -0.0020 | 11.2628 | 0.002 | -0.144 | 5000 |
| G | 2.3383 | -0.0173 | 5.2458 | 0.0009 | -0.0644 | 1000 |
| H | -3.1343 | 0.0483 | 9.0698 | 0.0013 | -0.103 | 2000 |
| I | 1.3066 | -0.0005 | 13.7763 | 0.0031 | -0.2000 | 800 |
| J | 3.7753 | -0.021 | 15.0422 | 0.0019 | -0.1635 | 3200 |
Disclaimer/Publisher’s Note: The statements, opinions and data contained in all publications are solely those of the individual author(s) and contributor(s) and not of MDPI and/or the editor(s). MDPI and/or the editor(s) disclaim responsibility for any injury to people or property resulting from any ideas, methods, instructions or products referred to in the content. |
© 2024 by the authors. Licensee MDPI, Basel, Switzerland. This article is an open access article distributed under the terms and conditions of the Creative Commons Attribution (CC BY) license (http://creativecommons.org/licenses/by/4.0/).
Copyright: This open access article is published under a Creative Commons CC BY 4.0 license, which permit the free download, distribution, and reuse, provided that the author and preprint are cited in any reuse.


