1. Introduction
The voles and lemmings (subfamily Arvicolinae) for years remained one of the most difficult groups for disentangling evolutionary history and phylogenetic relationships and consequently the taxonomic structure in many points remained poorly substantiated. The objective reason complicating these tasks is very fast explosive radiation of the subfamily during the last 7 Ma [
1,
2]. The first fossil record assigned to Arvicolinae is known from the Late Miocene closer to the Miocene-Pliocene boundary; already in the Pliocene a first explosive burst of arvicoline radiation is marked. Approximately soon after its origin in Eurasia the representatives of this radiation penetrated to North America and gave birth to several lineages there. Most representatives of Early Pliocene arvicoline fauna both in Eurasia and North America became extinct before the Pliocene-Pleistocene boundary and only few descendants of this first radiation survive till the Recent. In modern fauna these few survivors of the vole first radiation are represented in total by eight genera attributed to four tribes: Ondatrini, Dicrostonychini, Lemmini and monotypic Prometheomyini. Deciphering relationships between these groups is a very difficult task for two reasons. First, their ancestors appear and diversify almost simultaneously, producing very short inner branches at any trees built upon few loci, the so called bushy trees. Second, most taxa of the first radiation became extinct before Pleistocene, leaving only few descendants within each group or even the only one in Prometheomyini, thus the artifact of long branch attraction (very long external branches) also may falsify the phylogenetic signal [
3].
The so-called second radiation [
4,
5] unites the monophyletic tribe of forest and rock voles (Clethrionomyini) with five genera and more than thirty species in total and represents a quite successful group that mastered all forest and rocky mountain habitats mainly in Palearctic. Opposite to members of first radiation, the members of second radiation evolve rather eventually and the ratio of survived to extinct taxa within the group is in favor of survivors. This phenomenon facilitates the reconstruction of phylogenetic relationships within this group and as inner and outer branches are comparable in length and even the trees built upon few loci [
6,
7,
8] gave satisfactory resolution. The only point, which should be taken in account, is interspecies hybridization and incomplete lineage sorting that leads to mitonuclear discordance.
The third, most diverse and successful radiation, is most tangled and complicated for the phylogenetic and taxonomic studies. This radiation started approximately at the earliest in the mid-Pliocene with speciation peak at the Pliocene-Pleistocene boundary. The process of speciation continues till now [
9,
10], new species and cryptic species continuously describing. This third radiation includes three tribes (Arvicolini, Ellobiusini and Lagurini) and several genera of uncertain position (
Dinaromys Kretzoi, 1955
, Lemmiscus Thomas, 1912 and
Hyperacrius Miller, 1896) and constitutes almost two third of modern diversity of the subfamily encountering not less than 16 genera with a minimum 93 species in total. The untangling phylogenetic relationships and uncovering evolutionary histories of major groups within this radiation is a challenge not only due to fast diversification and short inner branches. The most difficult task for any researcher aimed at solving these problems is obtaining the comprehensive sample for the analysis. It should be mentioned here that representatives of just this radiation are distributed through all natural zones and landscapes of the northern Hemisphere and mastered all possible ecological niches including subterranean, high altitudes and arctic tundra
. Previous numerous attempts of phylogenetic reconstruction of the subfamily using few loci and incomplete sampling [
4,
7,
11,
12,
13] failed to achieve reliable resolution of supraspecies taxa within the first and third radiations showing the crucial role of both molecular characters involved and comprehensive sampling. In our previous research [
5] based upon analysis of mitochondrial genomes we managed to overcome one of the obstacles and collected a comprehensive sample including almost all genera and subgenera of the subfamily due to inclusion of museum samples collected in the previous century. However, analysis of 11,391 bp concatenated alignment of protein-coding mitochondrial genes failed to resolve the ordering of divergence and interrelationships of tribal level taxa within the first and the last, the largest radiation. On the other hand this analysis for the first time showed robust support of phylogenetic relationships between genus level taxa within the species-rich tribe Arvicolini and, particularly, allowed to set forward the hypothesis on phylogenetic placement of monotypic genus
Lemmiscus. At the same time, despite the fact that complete mitogenomes were widely used in the last decades for reconstruction of phylogenetic relations within many groups and provide a robust phylogeny with highly resolved trees having strong branch support [
14,
15,
16] and other, phylogenetic conclusions made only upon mitochondrial genes should be treated with great caution. The main reasons for this lie in multiple events of gene introgression [
17,
18,
19] and other, saturation and strong selective pressure [
20,
21,
22] and other.
Very appropriate in phylogenetics for problems where relatively small numbers of loci do not provide sufficient information to resolve relationships, but genomic data or resources are not available to develop genome-scale targeted marker sets appeared to be ddRADseq technique [
23,
24,
25]. This inspired us to apply this technique for further research of phylogenetic relationships above the species level within the subfamily Arvicolinae using a comprehensive collection of tissue samples. In addition we used the fresh collected tissues for transcriptome analysis (RNA-seq) at a very limited sample as for this analysis it is impossible to use material stored in collection. Applying this analysis we had a dual goal from one hand to test the relative role of taxa number versus gene number for robust phylogeny and from the other aimed further on using this transcriptomic data for search of selective signatures.
Thus, using two data sets, one from transcriptome data (but with limited taxa representation) and the other one based on single-nucleotide polymorphism (SNP) and comprehensive sample, we aimed to test: 1) whether the data from nuclear genome are consistent with the tree inferred from mitogenome both in topology and divergence dating 2) what is more important for robust phylogeny – sample representation or number of molecular markers 3) how serious is the challenge of rapid radiation for resolving branching at the bottom of the bush.
2. Materials and Methods
2.1. Sampling
Transcriptomic dataset contained data from 30 species – 29 Arvicolinae representatives belonging to eight tribes and 18 genera (
Table S1) and Chinese hamster
Cricetulus griseus Milne-Edwards, 1867 used as an outgroup. For 19 species, transcripts were either obtained from NCBI or sequenced and assembled previously [
26,
27]. Eleven species were newly sequenced in the current study.
Dataset for quaddRADseq (hereinafter ddRADseq) analysis contained 52 Arvicolinae species belonging to 26 genera (
Table S1). All ddRADseq data were obtained in the current study.
For DNA isolation muscle tissues were fixed in 96% ethanol and stored at -20° C. For the subsequent RNA isolation tissue mix (muscles, liver, heart, lungs, and testes for males) was fixed in an intactRNA buffer (Evrogen, Moscow, Russia) to avoid RNA degradation directly at the moment of catching the animal in the field. The study was conducted according to the guidelines of the Declaration of Helsinki, and approved by the Ethics Committee of Zoological Institute Russian Academy of Sciences (permission № 2-17/24-09-2024).
NCBI accessions for both RNA-seq and ddRADseq SRA data are given in the Supplementary (
Table S1).
2.2. DNA and RNA Isolation, Library Preparation, and Sequencing
The total RNA was isolated from the tissue mix using the RNeasy mini kit (Qiagen) following the animal cells/spin protocol. RNA quality was evaluated using a Bioanalyzer 2100 (Agilent Genomics), ensuring a minimum RNA Integrity Number score of 7.0. DNA libraries were prepared using a combined protocol of the NEBNext Poly(A) mRNA Magnetic Isolation Module and the NEBNext Ultra II Directional RNA Library Prep Kit for Illumina. DNA concentrations were quantified using a Qubit fluorometer (Invitrogen). Samples were sequenced on the Illumina HiSeq 4000 sequencing platform producing paired-end reads with average length of 75 bp per read.
The total DNA was isolated from muscle tissue samples using the QIAmp DNA Mini Kit (lot # 160049272) and eluted it with 50 µl of nuclease-free water. Then, the pure DNA concentration was measured on a Qubit 2.0 fluorometer. The ddRADseq library preparation was performed according to a standard protocol [
28] with modifications detailed in Dvoyashov et al. [
19]. Summing up the main points, for restriction digestion and ligation of adapters, a mixture (reagents of New England Biolabs) consisting of Cutsmart Buffer, PstI-HF, MspI, T4 ligase, ATP, quaddRAD-i5 and quaddRAD-i7 adapters, and nuclease-free water was added to 600 ng of purified DNA. The reaction mixture was incubated for 3 h at 30°C (on a T100 Thermal Cycler; Bio-Rad). The resulting fragments were purified and “sized” using magnetic particles (AmpureXP beads, Beckman Coulter), concentration was measured on the Qubit 2.0 fluorometer. Index PCR was carried out as follows: to 50 ng of DNA fragments, a mixture of HF Buffer, Phusion high-fidelity DNA polymerase, dNTPs, 4 µl each of 10 µM PCR primers (quaddRAD-i5n and quaddRAD-i7n), and nuclease-free water was added to a total volume of 100 µl. PCR was conducted under the following conditions: 98°C for 30 s, 15 cycles (98°C for 10 s, 65°C for 30 s, and 72°C for 30 s) followed by 72°C for 5 min. PCR products were purified on magnetic beads and eluted with nuclease-free water. The concentration of the obtained libraries was measured on the Qubit 2.0 fluorometer. The quality and length of the libraries were checked by means of an Agilent 2100 Bioanalyzer automated electrophoresis system. Samples were sequenced on the Illumina HiSeq 4000 sequencing platform producing paired-end reads with average length of 150 bp per read.
2.3. Phylogenetic Tree Reconstruction Using Transcriptomic Dataset
Quality control check on raw sequence data was performed using FastQC v.0.11.9 [
29] (
http://www.bioinformatics.babraham.ac.uk/projects/fastqc/). Reads were trimmed with Trimmomatic v.0.36 [
30]. Adaptors were removed with fastp [
31], and contaminated reads were filtered out with Bowtie 2.3.5.1 [
32]. Each sample was de-novo assembled with Trinity v.2.1.1 [
33], default parameters. The completeness of the assemblies was assessed by BUSCO v.5.4.2 and mammalia odb10 database [
34]. The assembly statistics are provided in Supplementary (
Table S2). TransDecoder v.5.5.0 (
https://github.com/TransDecoder/TransDecoder) was used to predict the corresponding set of coding nucleotide and amino acid sequences in the assembled transcriptomes. To reduce redundancy in predicted sequences, we used CD-HIT v.4.8.1 [
35] with an identity threshold of 0.99, aiming to prevent exclusion of paralogs. Single-copy protein orthologs were detected with Proteinortho v.6.2.3 [
36]. A total of 1104 orthologs, present in each of the studied species, were identified. Corresponding coding sequences were aligned with PRANK v.170427 [
37] and trimmed both automatically with bioutils (
https://github.com/mkviatkovskii/bioutils) and manually using Ugene v.48.1 [
38]. Trimmed gene alignments, 1069 in total, were concatenated into a supermatrix containing 792,000 loci using SeqKit v.2.3.1 [
39].
We performed multiple phylogenetic analyses using concatenation (Maximum Likelihood (ML) analysis with IQ-TREE2, Bayesian analysis with BEAST2 and fossil calibrations) and coalescent tree-building methods (StarBeast3, ASTRAL-III and wASTRAL). The visualization of phylogenetic trees was conducted using FigTree v.1.4.4 (
http://tree.bio.ed.ac.uk/software/figtree/).
The concatenated supermatrix, which underwent additional filtering with GBlocks v.0.91b [
40] (default parameters), comprised 786,579 aligned loci and served as input for concatenation-based methods. A maximum likelihood (ML) concatenated tree was inferred in IQ-TREE v.2.2.2.7 [
41] with 10,000 ultrafast bootstrap replicates [
42] and a best-fit nucleotide substitution model selected automatically using ModelFinder [
43].
We inferred 1069 individual gene trees from nucleotide alignments using ML implemented in ParGenes v.1.2.0 [
44] with 100 bootstrap replicates. ModelTest-NG (
https://github.com/ddarriba/modeltest) and RAxML-NG [
45] were employed to perform model selection and tree inference, respectively. To visualize gene trees together, we converted them into rooted ultrametric trees using the python ete3 package [
46] and plotted them in DensiTree v.3.0.2 [
47]. Gene tree topologies were used as input for ASTRAL-III v.5.7.8 [
48] and wASTRAL v.1.18.3.5 [
49] (hybrid weighting) to reconstruct the species tree.
Bayesian estimation of the species-level phylogeny was inferred using StarBeast3 [
50]. The analysis was repeated several times on different sets of orthologs. Firstly, we randomly split 1069 gene alignments into 11 groups, comprising 100 orthologs each (10 groups) and 69 orthologs in the remaining group. Each group was analyzed individually with StarBeast3 using a General Time Reversible (GTR) model, with base frequencies estimated from the data. Secondly, we performed the analysis on two sets of genes, randomly splitting the original 1069 alignments into sets of 534 and 535. Thirdly, we ran the analysis on all 1069 alignments together. For the latter two analyses, we used the Jukes-Cantor (JC69) substitution model. In all analyses, a Yule model and a species tree relaxed clock was employed. Model parameter values were unlinked, and each analysis ran for at least 20 million generations, repeated at least three times. Convergence of the runs and adequate effective sample sizes (ESS) were assessed using Tracer v.1.7 [
51]. Species trees were produced by combining the trees with a burn-in of 10-20% from the runs using LogCombiner before visualization with DensiTree. Consensus species trees were summarized in TreeAnnotator using the maximum clade credibility tree option and median heights as node heights.
2.4. Phylogenetic Tree Reconstruction Using ddRADseq Dataset
The sequence reads from the DNA samples were demultiplexed by means of outer indexes in bcl2fastq 2.20 (
https://support.illumina.com/downloads/bcl2fastq-conversion-software-v2-20.html).Subsequently, the reads were processed with Fastp [
31] with default settings to remove adapters and perform quality filtering. PCR duplicates were removed using the clone_filter program from the Stacks 2.6.0 software suite [
52]. The data from the DNA samples were demultiplexed by means of inner indexes using the process_radtags program from Stacks.
The raw reads quality was evaluated using FastQC v 0.11.9 [
29], and then they were aligned on the reference
Microtus ochrogaster Wagner, 1842 genome (GCF_902806735.1) using BWA v 0.7.17 [
53] with the default settings. The resulting SAM files were then sorted and converted to BAM format together with the exclusion of reads with a mapping quality (mapq) below 30, using the Samtools program v.1.18 [
54]. The identification of orthologous loci and single nucleotide polymorphisms (SNPs) within them was conducted using the ref_map.pl script of the Stacks program v 2.6.0 [
52] with the flag -R 1 (all individuals required to process a locus). The resulting VCF file was transformed into FASTA format using the vcf2phylip tool v. 2.0 [
55]. The descriptive statistics of ddRADseq dataset are provided in Supplementary (
Table S3).
The raw whole-genome sequencing (WGS) reads for the outgroup species,
Cricetulus griseus, were obtained from the National Center for Biotechnology Information (NCBI) database (accession numbers SRR329953 and SRR329954) and mapped onto the
M. ochrogaster genome. Subsequently, SNPs were identified in regions where they were present in our ddRAD sequencing data using Samtools v 1.18 [
54] mpileup and VarScan v 2.3.9 [
56] pileup2cns commands. These were converted to FASTA format using AWK v 4.2.1 and added to a FASTA file.
A maximum likelihood phylogenetic tree was constructed using the RAxML-NG v.1.2.2 [
45] with the GTR+G model of nucleotide evolution (-m flag) and 1000 bootstrap replicates.
2.5. Molecular Dating
Divergence times were estimated on concatenated transcriptomic dataset and on ddRADseq dataset using a Bayesian inference implemented in the program BEAST v2.7.5 [
57]. The XML file for BEAST was generated by BEAUti. Site model parameters were inferred during the MCMC analysis with bModelTest package v.1.3.3 [
58]. An optimized lognormal relaxed clock and a Yule branching model with a uniform prior were adopted. We used the same fossil calibrations as described in [
5], applying four calibrations for the transcriptomic dataset and six for the ddRADseq dataset (
Table S4). Each analysis was run for 20-40 million generations. Trace files were assessed in Tracer to ensure the convergence of independent runs. Trees from two independent runs were combined with LogCombiner discarding 10% as a burn-in and summarized with TreeAnnotator using the maximum clade credibility tree option and mean heights as node heights. To validate the result, we repeated analyses with each calibration alternately excluded (
Table S5) and ran the analyses without data to sample from prior.
3. Results
3.1. Transcriptome Sequencing and Assembly
Transcriptomic data from 11 Arvicolinae species were newly sequenced in this study. De novo transcriptome assembly yielded between 43,277 and 518,062 transcripts, with N50 values ranging from 1168 to 2963 and the percentage of complete BUSCOs from 39 to 75.1 (
Table S2), which was sufficient for further phylogenetic analysis. We compiled newly obtained transcriptomic datasets along with data from 18 Arvicolinae species and an outgroup,
Cricetulus griseus, available in NCBI (
Table S1). Proteinortho search for single-copy orthologs followed by an additional filtering resulted in 1069 orthologs present in all 30 species. The aligned CDS of the orthologs had an average length of 741 bp, with an average gap fraction of 0.2%. After concatenation and filtering with Gblocks, the total concatenated alignment length was 786,579 bp, with an average gap fraction of 0.07%.
3.2. Phylogenetic Inference From Transcriptomic Dataset
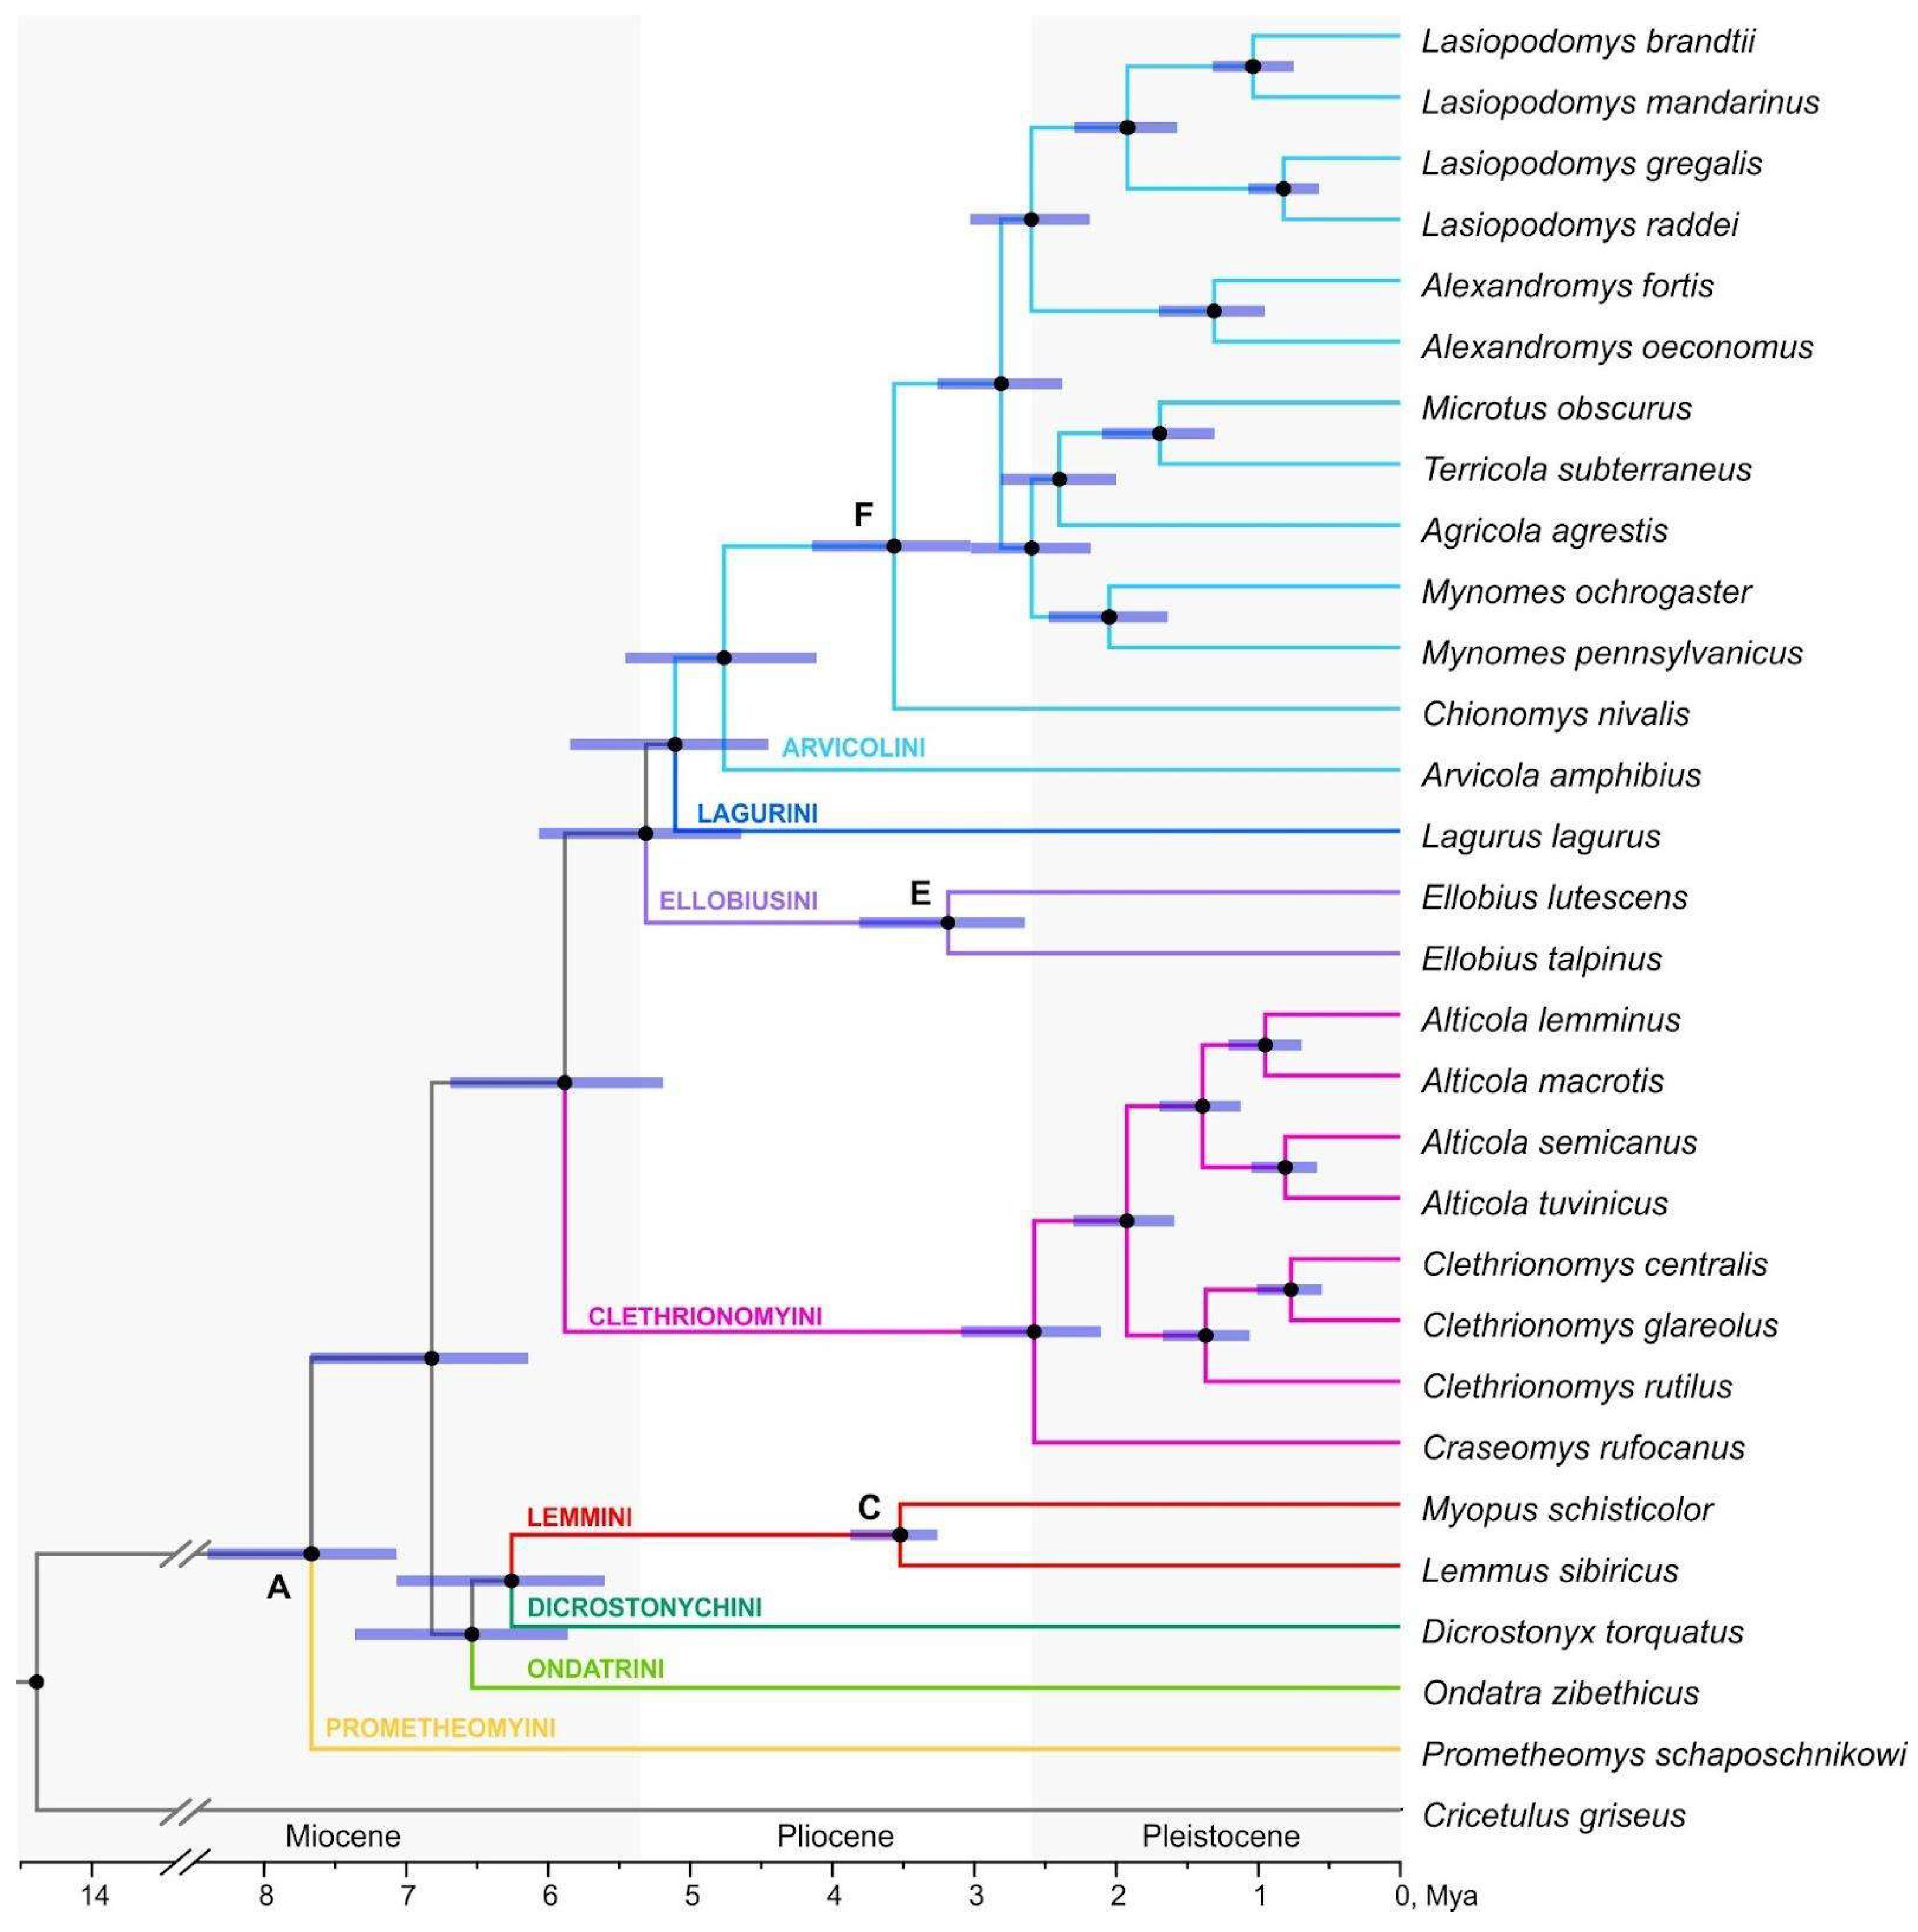
Maximum likelihood analysis (IQ-TREE) and summary coalescent-based methods (ASTRAL-III, wASTRAL) used for the transcriptomic data of Arvicolinae revealed the same, fully supported topology (
Figure 1,
Figures S1–S3). The resulting phylogeny shows the basal position of
Prometheomys Satunin, 1901 and the subsequent divergence of two clusters, first one including Ondatrini, Lemmini and Dicrostonychini tribes (two groups of lemmings turned out to be sister clusters), and the second cluster uniting representatives of second and third radiations. Within the third radiation Ellobiusini tribe appeared to be the earlier derivative, while Lagurini tribe sister to Arvicolini.
Arvicola Lacepede, 1799 turned out to be the basal genus within Arvicolini. Within the tribe Clethrionomyini the genera
Alticola Blanford, 1881 and
Clethrionomys Tilesius, 1850 are monophyletic.
Species tree reconstruction was performed using ASTRAL-III and wASTRAL, summary coalescent-based methods, as well as StarBeast3, a Bayesian multispecies coalescent method. As an input to summary methods, we used 1069 gene tree topologies. Both summary methods resulted in the same species tree topology and identical branch local posterior probabilities of 0.99-1.0, supporting the ML topology (
Figure 1,
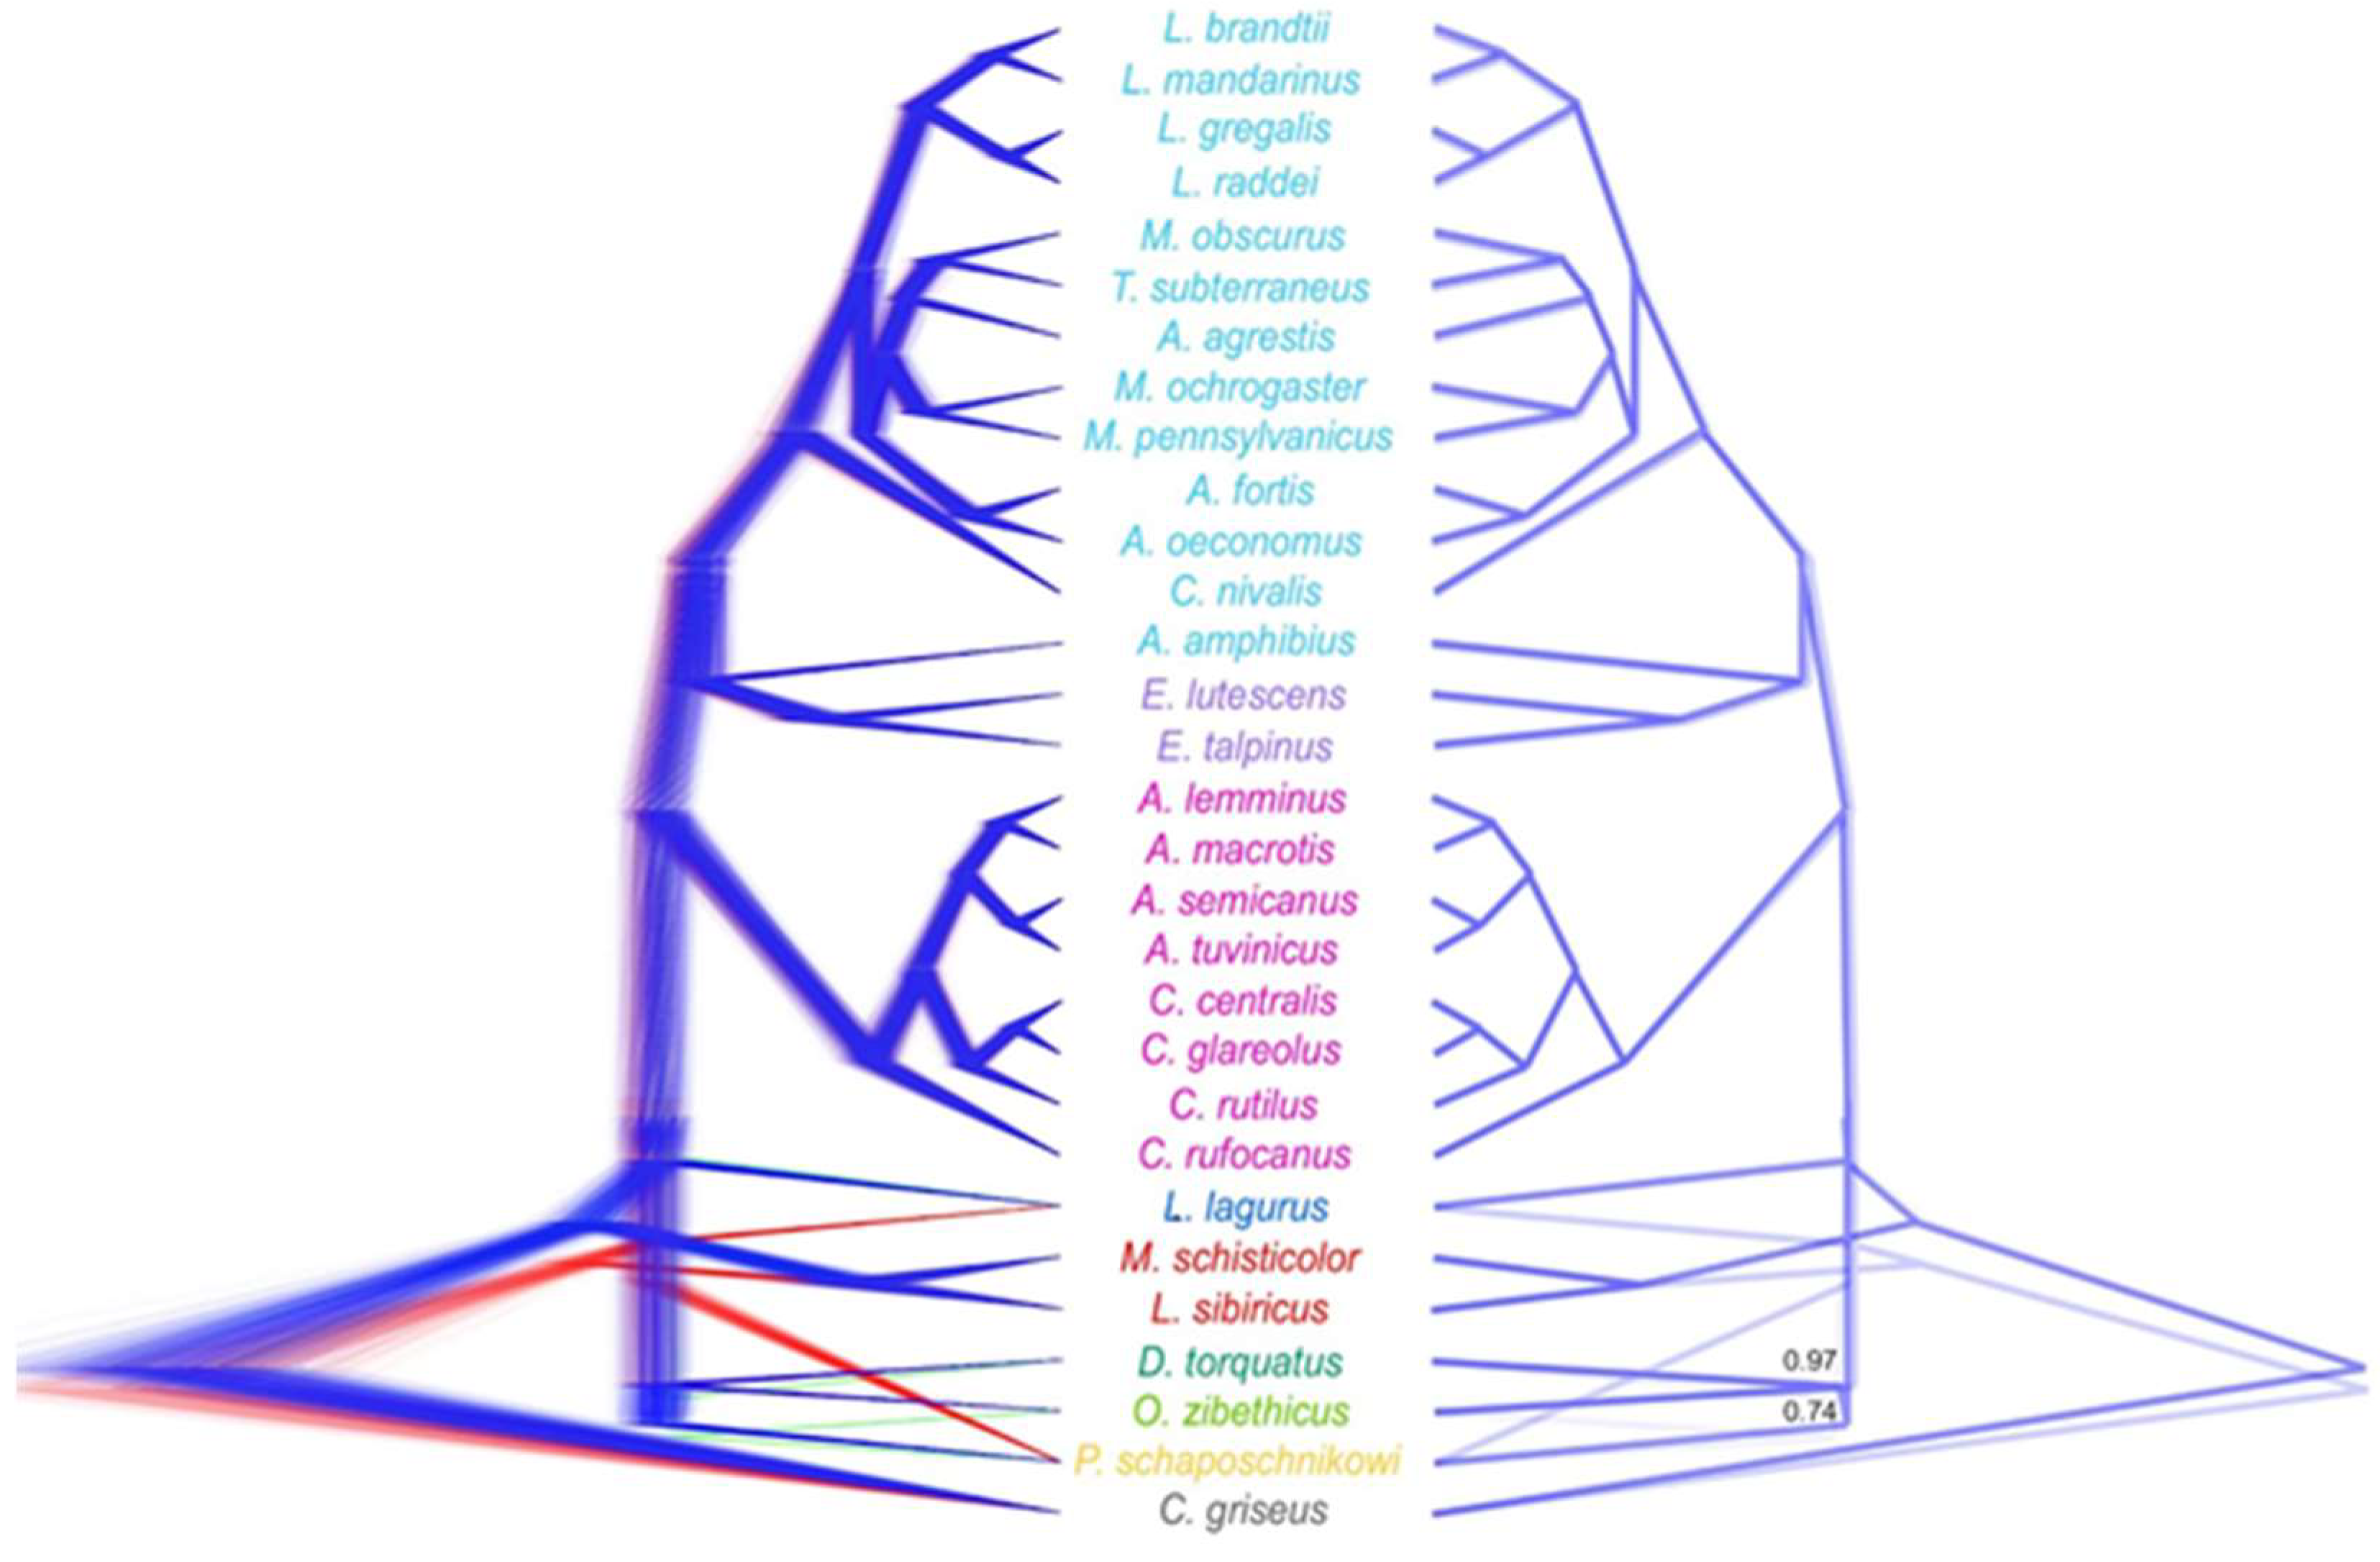
Figure S1–S3). Additionally, we visualized all 1069 gene trees together in DensiTree (
Figure S4). The resulting plot displayed the distribution over all possible topologies, highlighting the increase in uncertainty inside the clades going from the leaves to the root.
Bayesian species tree analysis was run multiple times on different datasets: the full analysis of 1069 gene alignments (
Figure 2), an analysis of the dataset randomly split in half (
Figure S5), and an analysis of eleven subsets with at most 100 genes each (
Figure S6). We observed variations in the species tree topologies and the statistical support of certain nodes inferred with StarBeast3 compared to the results from other tools. Differences depending on the set of genes used as input to StarBeast3 were also evident. The most notable inconsistency across all StarBeast3 runs was the unstable position of
Lagurus lagurus Pallas, 1773. It was inferred either as a sister taxon to second and third radiations (
Figure S5A, S6A, C-F, J) or as nested within first radiation (
Figure 2,
Figure S5B, S6B, G, H, I, K). The phylogenetic relationships within first radiation were also unstable and depend on the number of genes used. In some cases, we observed the earliest derivation of the true lemmings (
Myopus schisticolor Lilljeborg, 1844 and
Lemmus sibiricus Kerr, 1792) among Arvicolinae (
Figure 2,
Figure S5A, S6B, F, G, J), and
Ondatra Link, 1795 sister to
Dicrostonyx Gloger, 1841 (
Figure 2). Aside from the variations listed above, the monophyly of the radiations was maintained, and the topology at the genus level was consistent with the ML topology. Notable in all analyses, the relationships within the tribe Clethrionomyini remain stable.
3.3. ddRADseq- Based Phylogenetic Reconstruction
The resulting dataset comprised 15,899 variant sites (SNPs), with no missing sites for any individuals except the outgroup. The outgroup sample (C. griseus) contained only 9,832 of these variant sites.
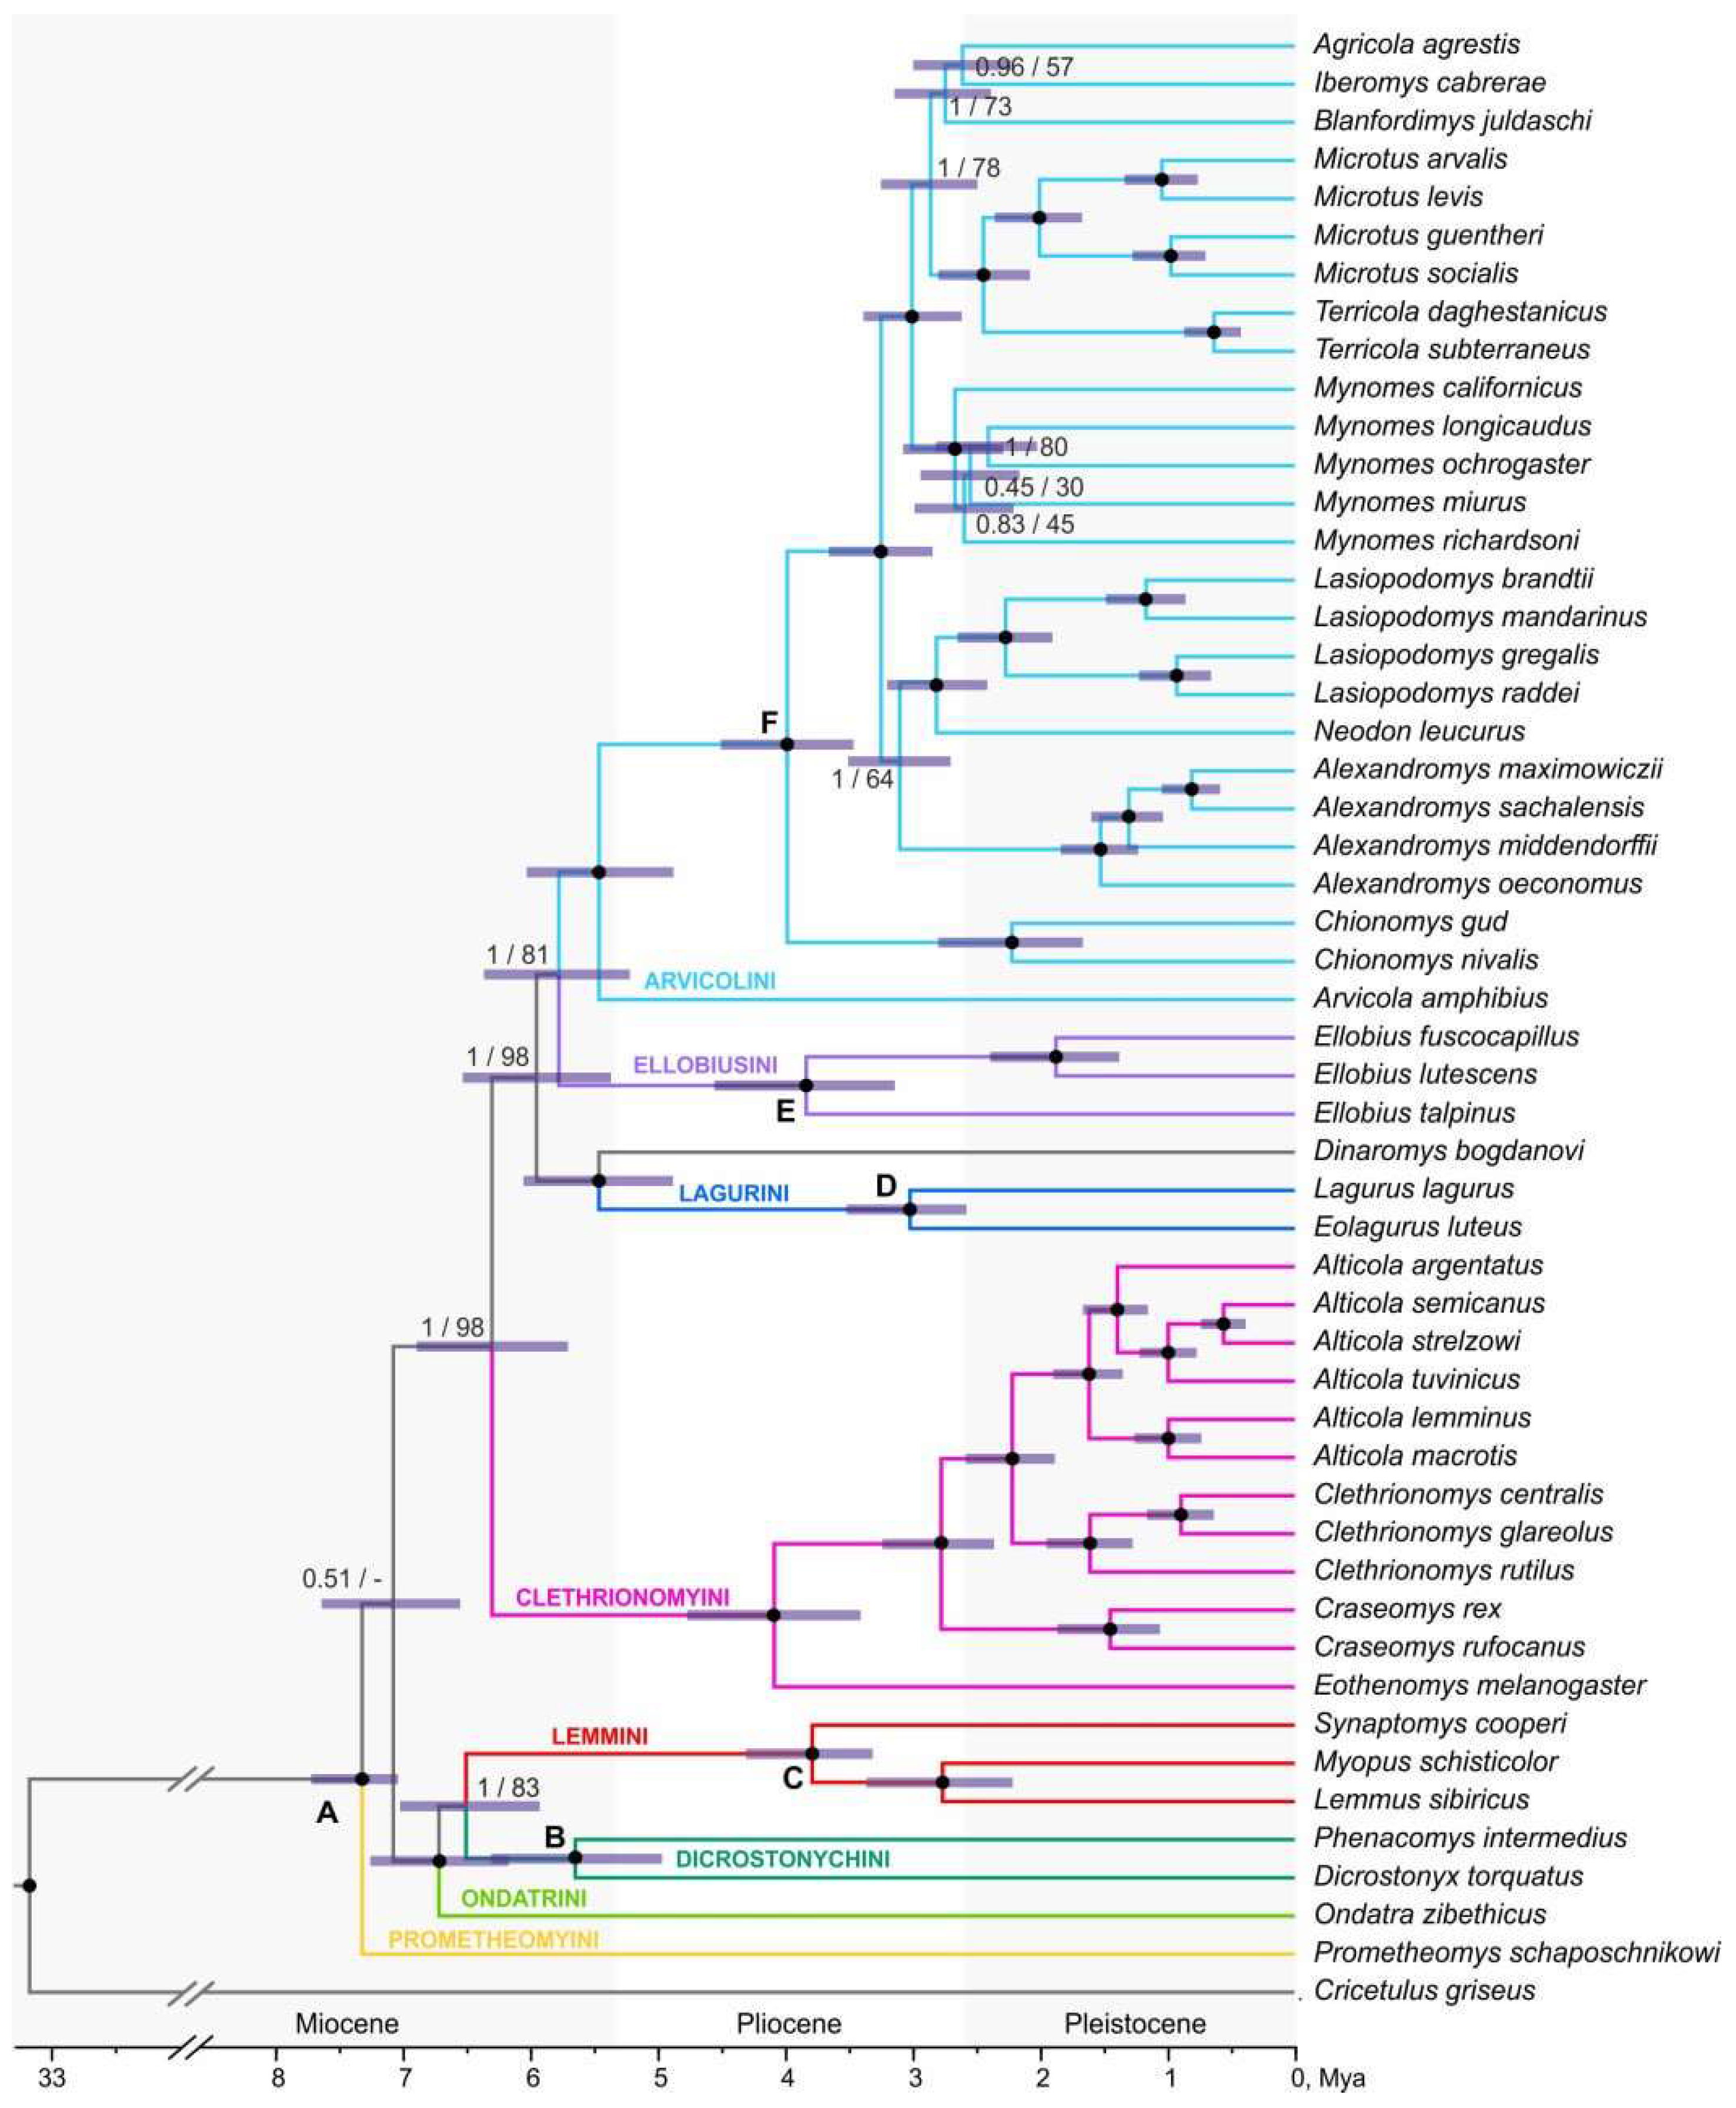
The topology based on the results of the ddRADseq analysis (
Figure 3,
Figure S7) shows a trichotomy at the base of the tree – the basal position of Prometheomys is not supported. For the rest nodes, BI support is quite high (most of the main nodes are supported with 1.0), while ML is slightly lower. The muskrat turns out to be external to the cluster that unites true and collared lemmings. Within the third radiation, the cluster uniting Dinaromys and Larugini (with maximum support) turns out to derive earlier, then the Ellobiusini branches off. Arvicola is the early derivative within the Arvicolini tribe.
3.4. Divergence Dating
Fossil-constrained molecular dating based on RNA-seq data yielded a fully resolved tree with all branches supported by maximum posterior probabilities (
Figure 1). When each calibration was excluded one at a time, the resulting divergence times remained stable (
Table S5). According to this analysis, Arvicolinae branched off from Cricetidae in the Middle Miocene ~14.4 Ma (95% HPD: 10.39–18.54). Four survived tribes of the first rapid radiation, Prometheomyini, Ondatrini, Dicrostonychini and Lemmini, were estimated to originate within the Late Miocene (~ 6.3 Ma (95% HPD: 5.6-7.07) – 7.7 Ma (95% HPD: 7.07-8.53)). The species belonging to the second radiation (tribe Clethrionomyini) gradually evolved starting from the Pliocene-Pleistocene border ~2.6 Ma (95% HPD: 2.11-3.09). The most diverse third radiation was estimated to start on the Miocene-Pliocene border ~5.3 Ma (95% HPD: 4.64-6.07) when Ellobiusini branched off from Lagurini and Arvicolini. The MRCA of Lagurini and Arvicolini is dated as ~5.11 (95% HPD: 4.45-5.85). The diversification of species within Arvicolini began in the Pliocene ~4.8 (95% HPD: 4.11-5.46), within Arvicolini sensu stricto (the node designated here as “F”), all the representatives of the Arvicolini tribe with the exception of the basal Arvicola) ~3.56 Ma (95% HPD: 3.03-4.14), and continued into the Pleistocene. The most recent clade among those analyzed corresponding to the genus
Alexandromys Ognev, 1914 diversified ~1.3 Ma (95% HPD: 0.95-1.7).
The calibrated tree, built according to ddRADseq data (
Figure 3), turned out to be slightly less supported than the transcriptomic one. With the alternate exclusion of each of six calibrations, the dating values slightly differed only in the absence of the deepest of them, the MRCA of Arvicolinae, node “A” (
Table S6). With the exclusion of this calibration point, node age estimates, especially those close to the root of the tree, appeared to be younger. That is related in the first turn to the origin of the subfamily and split of Dicrostonychini/Lemmini and Ondatrini / (Dicrostonychini + Lemmini) and also to the split of Clethrionomyini. According to SNPs analysis, Arvicolinae branched off from Cricetidae 33 Ma. The first rapid radiation occurred ~6.51 Ma (95% HPD 5.94-7.03) – 7.33 Ma (7.05-7.73). The second radiation began around ~4.09 Ma (3.41-4.78). According to the results of the ddRADseq analysis, the last one, third radiation, began ~5.96 (5.37-6.54); Lagurini and
Dinaromys cluster separated first, while the MRCA of this group is accessed ~5.47 Ma (95% HPD: 4.89-6.06). The MRCA of Ellobiusini and Arvicolini is dated as ~5.78 Ma (95% HPD: 5.22-6.38). The divergence within Arvicolini began ~5.47 Ma (95% HPD: 4.88-6.04), while within Arvicolini sensu stricto ~3.99 Ma (3.47-4.51).
4. Discussion
4.1. Features of Different Radiation Waves Within Arvicolinae
The difficulties in untangling phylogenetic relationships within the first and the third radiations are caused by various reasons. Despite the fact that both underwent very rapid diversification, within the first radiation in addition to complexities caused by a relatively small amount of time that separates ancestral lineages and further complicated by large amounts of divergence time separating the extant taxa. Moreover, this radiation contains a high number of extinct forms, thus the final sample of recent forms represents a small portion of diversity of this radiation. These facts taken together lead to an artifact of the so-called long-branch attraction [
59]. In this situation a short internode time span that causes lineage sorting issues is further superimposed on lineage-specific changes that follow the divergence. The third, last radiation is also characterized by very rapid diversification of lineages, however differs from the first one by the depth of radiation that is almost twice less. Thus these radiations principally differ by the shape of the bush like tree [
60]. The external branches leading to extant taxa within last radiation are thus much shorter and the ratio of recent to extinct genera is in favor of the recent. As it was not once underlined [
59,
60] both cases of rapid radiations producing bushes of various forms are difficult to resolve with a straightforward approach based on analysis of individual loci as the separate gene trees do not necessarily reflect the species tree [
61].
No surprise that all previous attempts using single loci [
4,
7,
11,
12,
13] resulted in lack of resolution of the subfamily tree. Reasonably the great hope in resolving the bush-like tree caused by rapid radiations was placed on the significant increase of the used molecular characters. With the advent and rapid development of new sequencing technologies and bioinformatics this hope became a completely feasible reality. As compared to previous technologies the number of molecular markers assessed increased by hundreds of thousands. Impressive results were achieved in resolving the cases of ancient and recent rapid radiations [
62,
63]. However, increasing the number of analyzed markers by itself cannot solve the problem of unresolved trees caused by rapid diversification. To achieve success it is equally important to have as complete a sample as possible. The latter circumstance explains why our first step in attempting to resolve the complex issues of arvicoline phylogenetic relations involved analysis of mitochondrial genomes [
5] as this allowed using rare museum samples and we included practically all extant genera and major species groups. The analyzed sample was most comprehensive, however despite good resolution the phylogenetic hypothesis inferred from mitogenomes should be treated with great caution due to high saturation, distortion related to hybridization and introgression and strong influence of selection on mitochondrial genes. So in this study we continue to test phylogenetic relations of supraspecies taxa within the subfamily Arvicolinae using two data sets derived from nuclear data: RNA-seq (29 Arvicolinae species and 1069 genes with total length 786,579 bp) and ddRADseq data (15,899 SNPs for 52 species). Thus, we first tested how the taxonomic sample (maximal in ddRADseq analysis) and the number of features (which was higher for RNA-seq) affect the result. Secondly, we checked whether the data from the nuclear genome are consistent with the tree inferred from the mitogenome data both in topology and divergence dating, and finally, how serious is the challenge of rapid radiation for resolving branching at the bottom of the bush.
4.2. Phylogenetic Relations of Supraspecies Taxa Within Arvicolinae. Сcomparison of Results Inferred From Various Data Sets
Phylogenies build based on RNA-seq data (
Figure 1,
Figure S1–S3) – the ML topology (IQ-TREE2), Bayesian approach (BEAST2) and summary methods for species tree estimation (ASTRAL and wASTRAL) – in general showed similar topologies with the previous transcriptomic analysis using 19 Arvicolinae species [
27] and limited number of genes (112). Compared with the tree derived from mitochondrial genomes [
5] the main discrepancies relate to the first radiation, namely, the basal placement of
Prometheomys and sister position of
Ondatra to the cluster of Lemmini and Dicrostonychini tribes. Noteworthy, the genus
Arvicola also takes its logical position being the earliest derivative within the Arvicolini tribe (not sister to Lagurini as it was shown by mt data analysis). However in species trees computed using Bayesian inference in the StarBeast3 (
Figure 2,
Figures S5, Figure S6) with random subset of genes from the general sample the topology of the resulting trees deviates from the described above. The topology within the first radiation (
Figure S5, Figure S6) with the decrease in gene number and resampling became the most unstable. Quite often we observed the basal position of true lemmings (
M. schisticolor and
L. sibiricus) among Arvicolinae, similar to mitogenomic topology [
5]. In some trees the earliest derivative was collared lemming (
Dicrostonyx) and its clustering with
Ondatra was broken, but these topologies were not supported.
We suggest that the number of genes used in the StarBeast3 analysis directly influenced the resulting trees. When few genes (in our case, 100 or 69) were included in the analysis, the resulting tree showed a significantly high number of different evolutionary trajectories, since the input of each individual gene was more valuable and stochastic processes affecting each individual gene were less controlled [
64]. When a larger number of genes was used for the calculations (in our case, either half of the identified orthologs (535 or 534) or a full dataset (1069 genes), the results became more stable, with only one dominant trajectory observed, resembling the outcome of “concatenation” and “summary” methods. This agrees with multiple studies showing that sampling more genes greatly improves the accuracy of species trees [
64,
65,
66,
67]. However, the basal position of
L. lagurus inconsistent with the topology obtained by other phylogeny reconstruction methods was preserved in all StarBeast3 runs, possibly due to the limited sampling (one individual per species), since the number of individuals per species is known to affect the accuracy of species tree topology [
64,
65]. Our experience with tree construction using RNA-seq data shows that, beyond the number of genes, the number of samples in a cluster is no less important in obtaining a reliable, stable and consistently true topology. Thus the erroneous and unstable position of
Lagurus lagurus at the base of the Arvicolinae tree may be related to the absence of a close sister taxon (
Eolagurus) and artifact of the long branch attraction.
Applying the method of ddRADseq we attempt checking the hypothesis on the relative influence of the sample on the topology of the obtained tree. Due to the availability of previously fixed tissues for the analysis, the ddRADseq based phylogeny turned out to be more taxonomically complete; particularly it included
Dinaromys and several genera absent in RNA-seq analysis:
Eolagurus, Phenacomys, Synaptomys, and more representatives of the largest Arvicolini tribe. The topology is generally very similar to that obtained from transcriptomes (in particular, the same branching order within the first radiation was revealed), although the basal position of
Prometheomys was not supported here, and in general, supports, especially ML, are lower, comparing to RNA-seq analysis. There is a difference in the branching order within the third radiation (Lagurini tribe split earlier than Ellobiusini), although ML support is lower here than in RNA-seq, where Ellobiusini tribe was the first splitting (while BI was maximal in both datasets). The effect of adding
Dinaromys to the sample could not be excluded. The fundamental difference of tree topology inferred from ddRADseq data from mt tree is in the position of the Balkan vole –
Dinaromys. At mitogenome data [
5,
68]
Dinaromys was sister to Ellobiusini, though with no support. Phylogeny derived from the ddRADseq data show its sister position to Lagurini with a strict support. Another important difference from mitogenome phylogeny is that both RNA-seq and ddRADseq data convincingly place
Arvicola basal within the Arvicolini tribe consistent with fossil record [
69,
70].
Summing up comparison of phylogenetic inference of supraspecies taxa in the subfamily Arvicolinae derived from three datasets: mitogenome, transcriptome and SNP it is easy to spot that main discrepancies and uncertainty exist within the first and third radiations, whereas relations within the second one (represented only by tribe Clethrionomyini) show good resolution and are consistent across all analyses and data. The only discordance between mitochondrial and nuclear datasets here is the case of
Clethrionomys paraphyly at mitochondrial trees. The latter is evidently caused by ancient introgression [
19] or incomplete lineage sorting. Compared to other radiations the inner and outer branches within this tribe are almost of equal length evidencing for relatively uniform tempo of evolution. Overall, both sets of data from the nuclear genome show good agreement but the only discordance was observed in the position of nodes where samples were incomplete (ex.gr. Lagurini, Ellobiusini), thus the importance of comprehensive sampling was underlined
. 4.3. Divergence Dating
The ages of most major nodes estimated in this study based on both, RNA-seq and ddRADseq data (
Table 1), fall within the range of variation recovered in the previously time-calibrated mitochondrial phylogeny [
5]. The only major discrepancy is that our estimate for the divergence time between Arvicolinae and Cricetinae is ca. 14.4 Ma (10.39-18.54 Ma) based on RNA-seq, and 33.17 (23.25-43.66 Ma) based on ddRADseq data, the latter is an implausibly old date, presumably caused by more than 30% of missing data in the outgroup
C. griseus (
Tables S5 and S6 respectively). Noteworthy that time to MRCA of Arvicolinae is almost consistent across all datasets (with mean values around 7.33-7.67 and 95% HPDs 7.05-8.53 Ma). The estimated ages derived from the RNA-seq data are slightly younger, while ddRADseq results are more similar to mitogenome ones [
5,
13,
68]. That is especially noticeable for the second radiation (tribe Clethrionomyini) (
Table 1), where the age of this radiation inferred from RNA-seq is significantly younger. We assume that this discordance in the age estimates is undoubtedly related to the incomplete sample in RNA-seq data, while the inclusion of
Eothenomys which is the earliest derivative within Clethrionomyini, gives a more ancient date.
The slightly younger node estimates received in the RNA-seq dataset may be explained by the fact that in transcriptome data we have more conservative sites than both in ddRADseq and mitogenome data. Moreover both ddRADseq and mitogenome datasets contain much more taxa due to this direct comparison not entirely true. The calibrated mitochondrial phylogeny of Arvicolinae in the recent paper of Alfaro-Ibáñez et al. [
68] presents almost the same divergence dates for all main nodes as in our previous study [
5] but adding the mitogenome for extinct
Pliomys lenki Heller, 1930 they receive the dating for the new node, representing tribe Pliomyini and divergence time of two genera
Dinaromys and
Pliomys within it in 3.8 Ma, (95% HPD = 2.6-4.9 Ma). It should be remembered that the position of
Dinaromys is one of the few principal discordances in mitochondrial and nuclear data phylogenies. At the trees derived from mt data
Dinaromys, and correspondingly
Pliomys [
68] cluster with Ellobiusini whereas nuclear ddRADseq data support its close relation with Lagurini. According to our estimates from ddRADseq the most recent date of Ellobiusini split is ca. 3.25 (2.68-3.85) (
Table S6) which does not contradict the age estimate of
Dinaromys-
Pliomys reported above.
With an attempt of random exclusion of one of the calibration points in RNA-seq data (
Table S5) the results remain quite stable. Meanwhile in the ddRADseq dataset with the exclusion of calibration point “A” (Arvicolinae) (
Table S6) the obtained dates appear to be significantly younger both compared with the analysis when all points included and when each one of the rest points are randomly excluded. It is even more young as compared to one obtained in [
13] where authors consciously avoid using a calibration at the root of Arvicolinae due to the uncertain phylogenetic placement of putative early arvicoline fossils.
This effect is more pronounced for the nodes that are closer to the base of the tree. This observation confirms the recent findings [
72] that molecular clock estimates are sensitive to the positions of the calibration(s) at the phylogenetic tree.
Due to the fact that calibration point “A” is close to the root of the tree it has a greater influence on the resulting estimates as evidenced by its exclusion. The rest of the calibration points do not have such an effect as despite the fact that they constrain the tree in different nodes; all of them are close in time and represent internal calibrations. In many studies the role of calibrations at the root of the tree or at deeper nodes was underlined and generally they are preferable to shallower calibrations [
73,
74,
75,
76]. Herewith noteworthy that the age estimate for the MRCA of Arvicolinae with all calibration points included was identical to one that was obtained in analysis of RY coded mitogenomes (
Table S6).
The consistency in divergence date estimates may be explained by a rather large number of same for all datasets calibration points, among which five are located close to 2.5 Ma and only one at 7 Ma. Thus, the exclusion of one of the points near the date in 2.5 Ma will not have a noticeable effect as four similar calibrations remain whereas when we exclude the point in 7 Ma we thus withdraw the constraint for the node of Arvicolinae and its estimate becomes younger.
5. Conclusions
Our work using genome-wide sequencing has shown that most plausible and reliable phylogeny of Arvicolinae at the supraspecific level is obtained from nuclear data. Therewith the topology of the trees recovered from nuclear datasets indicate several important points. The main principal inconsistency with mitochondrial data are in the topologies near the root of the first and third radiations. Therewith within the third radiation in nuclear datasets we see highly resolved relations of tribes Arvicolini, Lagurini and Ellobiusini that formed polytomy at the mitochondrial trees. Importantly, the genus Arvicola occupies the correct position at the base of the nominal tribe. The latter phylogenetic placement is consistent with morphological data and paleontological data and taking together evidence in favor of more confidence in genome-wide nuclear datasets. The divergence dates inferred from nuclear sets in a whole show good coincidence derived from mitochondrial data, however a bit younger and thus more plausible (for the review of fossil evidence for Arvicolinae see [5,13,67 and references therein]). At the same time as was shown here the divergence dating is highly dependent on the number and placement of calibration points and the number of taxa, therefore should be treated with caution.
In our study we questioned the relative influence of the number of molecular characters versus the number of taxa for the robust resolution. Both parameters play an important role. The importance of gene number was clearly shown in the StarBeast3 analysis of RNA-seq data with the sequential exclusion/inclusion of genes. However the study shows that the best results may be achieved only by accounting both. The transcriptome data where we have limited taxa samples showed that most vulnerable appeared to be the position of nodes with insufficient number of taxa (Lagurini is the case). The study showed that the challenge of rapid radiation is easier to overcome in the case when the radiation is young and the number of recent taxa is not less or exceeds the number of extinct ones. In our case it is the third radiation. However for obtaining robust resolution within the third radiation the number of molecular markers together with the number of taxa played a decisive role.
Supplementary Materials
The following supporting information can be downloaded at the website of this paper posted on Preprints.org, Figure S1: Maximum likelihood phylogenetic tree computed using IQ-TREE2 on RNA-seq dataset (1069 concatenated genes); Figure S2: ASTRAL-III species tree estimation (1069 individual genes, RNA-seq dataset); Figure S3: wASTRAL species tree estimation (1069 individual genes, RNA-seq dataset); Figure S4: 1069 gene trees plotted together using DensiTree (RNA-seq dataset); Figure S5: Species trees estimated on RNA-seq dataset using two sets of genes (the original 1069 alignments randomly splitted into sets of 534 (A) and 535 (B)); Figure S6: Species trees estimated on RNA-seq dataset using eleven sets of genes (the original 1069 alignments randomly splitted into ten sets of 100 genes and one set of 69 genes); Figure S7: ML tree computed in RaXML-NG on ddRADseq dataset; Table S1: Species used in the study; Table S2: Transcriptome assembly statistics; Table S3: ddRADseq dataset descriptive statistics; Table S4: Fossil calibrations used in molecular dating; Table S5: Divergence time estimates for the major lineages within the subfamily Arvicolinae according to the transcriptomic analysis; Table S6: Divergence time estimates for the major lineages within the subfamily Arvicolinae according to the ddRADseq analysis.
Author Contributions
Conceptualization, N.A. and E.S.; methodology, E.S., O.B., S.B.; software, E.S., O.B.; validation, N.A., E.S. and S.B.; formal analysis, E.S., O.B., T.P., I.D.; resources, N.A.; data curation, N.A., E.S., I.D.; T.P., S.B.; writing—original draft preparation, N.A., E.S., I.D.; T.P., S.B.;- writing—review and editing; - visualization, T.P., E.S.; supervision, N.A.;, project administration, N.A.; funding acquisition, N.A. All authors have read and agreed to the published version of the manuscript.
Funding
This research was funded by the Russian Science Foundation grant N19-74-20110-P for all authors.
Institutional Review Board Statement
The animal study protocol was approved by the Institutional Ethics Committee of Zoological Institute protocol code № 2-17/24-09-2024 and date of approval 24.09.2024 for studies involving animals.
Data Availability Statement
The ddRADseq and RNA-seq SRA data presented in the study are openly available in NCBI SRA, NCBI accessions are given in the
Supplementary Table S1.
Acknowledgments
The authors thank all colleagues who helped in numerous field research trips to collect material necessary for the study and all those who contribute to tissue collection of the laboratory of Evolutionary genomics and paleogenomics: Abramov A.V., Golenishchev F.N., Stekolnikov A.A., (ZIN RAS, St.Petersburg), Bannikova A.A. (MSU, Moscow), Chabovskiy, A.V., Kowalskaya Yu.M. (IPEE, Moscow), Smorkatcheva A.V., (SPbU, St.Petersburg), Dokuchaev N.E., (Magadan), Grafodatsky A.S. (IMCB, Novosibirsk), Buzan E. (Ljubljana, Slovenia). We are grateful to Vinogradov V.V., Zaika V.V. and Grachev A. for help in the organization of the field research. We would like to thank the Genomics Core Facility of Skolkovo Institute of Science and Technology for NGS library preparation. Also we would like to thank our former colleagues Genelt-Yanovskiy E.A. and Tursunova L.S. for for maintaining a creative and friendly atmosphere in the laboratory, assistance and support in field and laboratory research.
Conflicts of Interest
The authors declare no conflicts of interest. The funders had no role in the design of the study; in the collection, analyses, or interpretation of data; in the writing of the manuscript; or in the decision to publish the results.
References
- Fejfar, O.; Heinrich, W.-D.; Kordos, L.; Maul, L. C. Microtoid Cricetids and the Early History of Arvicolids (Mammalia, Rodentia). Palaeontol Electron 2011, 14. [Google Scholar]
- Martin, R. A. Arvicolidae. In Evolution of Tertiary Mammals of North America; Janis, C. M., Gunnell, G. F., Uhen, M. D., Eds.; Cambridge University Press, 2007; Vol. 2, pp 480–497.
- Susko, E.; Roger, A. J. Long Branch Attraction Biases in Phylogenetics. Syst. Biol. 2021, 70, 838–843. [Google Scholar] [CrossRef] [PubMed]
- Abramson, N. I.; Lebedev, V. S.; Tesakov, A. S.; Bannikova, A. A. Supraspecies Relationships in the Subfamily Arvicolinae (Rodentia, Cricetidae): An Unexpected Result of Nuclear Gene Analysis. Mol. Biol. 2009, 43, 834–846. [Google Scholar] [CrossRef]
- Abramson, N. I.; Bodrov, S. Yu.; Bondareva, O. V.; Genelt-Yanovskiy, E. A.; Petrova, T. V. A Mitochondrial Genome Phylogeny of Voles and Lemmings (Rodentia: Arvicolinae): Evolutionary and Taxonomic Implications. PLOS ONE 2021, 16, e0248198. [Google Scholar] [CrossRef]
- Kohli, B. A.; Speer, K. A.; Kilpatrick, C. W.; Batsaikhan, N.; Damdinbaza, D.; Cook, J. A. Multilocus Systematics and Non-Punctuated Evolution of Holarctic Myodini (Rodentia: Arvicolinae). Mol. Phylogenet. Evol. 2014, 76, 18–29. [Google Scholar] [CrossRef] [PubMed]
- Buzan, E. V.; Krystufek, B.; Hänfling, B.; Hutchinson, W. F. Mitochondrial Phylogeny of Arvicolinae Using Comprehensive Taxonomic Sampling Yields New Insights: PHYLOGENY OF ARVICOLINAE. Biol. J. Linn. Soc. 2008, 94, 825–835. [Google Scholar] [CrossRef]
- Bodrov, S. Yu.; Kostygov, A. Yu.; Rudneva, L. V.; Abramson, N. I. Revision of the Taxonomic Position of the Olkhon Mountain Vole (Rodentia, Cricetidae). Biol. Bull. 2016, 43, 136–145. [Google Scholar] [CrossRef]
- Tryfonopoulos, G.; Thanou, E.; Chondropoulos, B.; Fraguedakis-Tsolis, S. mtDNA Analysis Reveals the Ongoing Speciation on Greek Populations of Microtus (Terricola) Thomasi (Arvicolidae, Rodentia): ONGOING SPECIATION IN GREEK VOLES. Biol. J. Linn. Soc. 2008, 95, 117–130. [Google Scholar] [CrossRef]
- Paupério, J.; Herman, J. S.; Melo-Ferreira, J.; Jaarola, M.; Alves, P. C.; Searle, J. B. Cryptic Speciation in the Field Vole: A Multilocus Approach Confirms Three Highly Divergent Lineages in E Urasia. Mol. Ecol. 2012, 21, 6015–6032. [Google Scholar] [CrossRef]
- Galewski, T.; Tilak, M.; Sanchez, S.; Chevret, P.; Paradis, E.; Douzery, E. J. The Evolutionary Radiation of Arvicolinae Rodents (Voles and Lemmings): Relative Contribution of Nuclear and Mitochondrial DNA Phylogenies. BMC Evol. Biol. 2006, 6, 80. [Google Scholar] [CrossRef] [PubMed]
- Steppan, S. J.; Schenk, J. J. Muroid Rodent Phylogenetics: 900-Species Tree Reveals Increasing Diversification Rates. PLOS ONE 2017, 12, e0183070. [Google Scholar] [CrossRef]
- Withnell, C. B.; Scarpetta, S. G. A New Perspective on the Taxonomy and Systematics of Arvicolinae (Gray, 1821) and a New Time-Calibrated Phylogeny for the Clade. PeerJ 2024, 12, e16693. [Google Scholar] [CrossRef] [PubMed]
- Hassanin, A.; Bonillo, C.; Tshikung, D.; Pongombo Shongo, C.; Pourrut, X.; Kadjo, B.; Nakouné, E.; Tu, V. T.; Prié, V.; Goodman, S. M. Phylogeny of African Fruit Bats (Chiroptera, Pteropodidae) Based on Complete Mitochondrial Genomes. J. Zool. Syst. Evol. Res. 2020, 58, 1395–1410. [Google Scholar] [CrossRef]
- Hassanin, A.; Veron, G.; Ropiquet, A.; Jansen Van Vuuren, B.; Lécu, A.; Goodman, S. M.; Haider, J.; Nguyen, T. T. Evolutionary History of Carnivora (Mammalia, Laurasiatheria) Inferred from Mitochondrial Genomes. PLOS ONE 2021, 16, e0240770. [Google Scholar] [CrossRef]
- Kundu, S.; Kumar, V.; Tyagi, K.; Chandra, K. The Complete Mitochondrial Genome of the Endangered Assam Roofed Turtle, Pangshura Sylhetensis (Testudines: Geoemydidae): Genomic Features and Phylogeny. PLOS ONE 2020, 15, e0225233. [Google Scholar] [CrossRef] [PubMed]
- Barlow, A.; Paijmans, J. L. A.; Alberti, F.; Gasparyan, B.; Bar-Oz, G.; Pinhasi, R.; Foronova, I.; Puzachenko, A. Y.; Pacher, M.; Dalén, L.; Baryshnikov, G.; Hofreiter, M. Middle Pleistocene Genome Calibrates a Revised Evolutionary History of Extinct Cave Bears. Curr. Biol. 2021, 31, 1771–1779.e7. [Google Scholar] [CrossRef]
- Wallis, G. P.; Cameron-Christie, S. R.; Kennedy, H. L.; Palmer, G.; Sanders, T. R.; Winter, D. J. Interspecific Hybridization Causes Long-term Phylogenetic Discordance between Nuclear and Mitochondrial Genomes in Freshwater Fishes. Mol. Ecol. 2017, 26, 3116–3127. [Google Scholar] [CrossRef] [PubMed]
- Dvoyashov, I. A.; Bodrov, S. Yu.; Mamaev, N. V.; Glagoleva, E. S.; Abramson, N. I. Inferring Phylogenetic Structure, Taxa Hybridization, and Divergence Times within Rock Voles of Subgenus Aschizomys (Cricetidae: Alticola) Using quaddRAD Sequencing and a Cytb Dataset. Ecol. Evol. 2023, 13, e10742. [Google Scholar] [CrossRef]
- Da Fonseca, R. R.; Johnson, W. E.; O’Brien, S. J.; Ramos, M. J.; Antunes, A. The Adaptive Evolution of the Mammalian Mitochondrial Genome. BMC Genomics 2008, 9, 119. [Google Scholar] [CrossRef] [PubMed]
- Romero, P. E.; Weigand, A. M.; Pfenninger, M. Positive Selection on Panpulmonate Mitogenomes Provide New Clues on Adaptations to Terrestrial Life. BMC Evol. Biol. 2016, 16, 164. [Google Scholar] [CrossRef]
- Strohm, J. H. T.; Gwiazdowski, R. A.; Hanner, R. Fast Fish Face Fewer Mitochondrial Mutations: Patterns of dN/dS across Fish Mitogenomes. Gene 2015, 572, 27–34. [Google Scholar] [CrossRef] [PubMed]
- Lemmon, A. R.; Emme, S. A.; Lemmon, E. M. Anchored Hybrid Enrichment for Massively High-Throughput Phylogenomics. Syst. Biol. 2012, 61, 727–744. [Google Scholar] [CrossRef] [PubMed]
- Lemmon, E. M.; Lemmon, A. R. High-Throughput Genomic Data in Systematics and Phylogenetics. Annu. Rev. Ecol. Evol. Syst. 2013, 44, 99–121. [Google Scholar] [CrossRef]
- Weitemier, K.; Straub, S. C. K.; Cronn, R. C.; Fishbein, M.; Schmickl, R.; McDonnell, A.; Liston, A. Hyb-Seq: Combining Target Enrichment and Genome Skimming for Plant Phylogenomics. Appl. Plant Sci. 2014, 2, 1400042. [Google Scholar] [CrossRef] [PubMed]
- Petrova, T.; Skazina, M.; Kuksin, A.; Bondareva, O.; Abramson, N. Narrow-Headed Voles Species Complex (Cricetidae, Rodentia): Evidence for Species Differentiation Inferred from Transcriptome Data. Diversity 2022, 14, 512. [Google Scholar] [CrossRef]
- Bondareva, O.; Petrova, T.; Bodrov, S.; Gavrilo, M.; Smorkatcheva, A.; Abramson, N. How Voles Adapt to Subterranean Lifestyle: Insights from RNA-Seq. Front. Ecol. Evol. 2023, 11, 1085993. [Google Scholar] [CrossRef]
- Franchini, P.; Monné Parera, D.; Kautt, A. F.; Meyer, A. quaddRAD: A New High-multiplexing and PCR Duplicate Removal ddRAD Protocol Produces Novel Evolutionary Insights in a Nonradiating Cichlid Lineage. Mol. Ecol. 2017, 26, 2783–2795. [Google Scholar] [CrossRef]
- Andrews, S. FastQC: A Quality Control Tool for High Throughput Sequence Data, 2010. https://www.bioinformatics.babraham.ac.uk/projects/fastqc/ (accessed 2019-09-01).
- Bolger, A. M.; Lohse, M.; Usadel, B. Trimmomatic: A Flexible Trimmer for Illumina Sequence Data. Bioinformatics 2014, 30, 2114–2120. [Google Scholar] [CrossRef]
- Chen, S.; Zhou, Y.; Chen, Y.; Gu, J. Fastp: An Ultra-Fast All-in-One FASTQ Preprocessor. Bioinformatics 2018, 34, i884–i890. [Google Scholar] [CrossRef] [PubMed]
- Langmead, B.; Trapnell, C.; Pop, M.; Salzberg, S. L. Ultrafast and Memory-Efficient Alignment of Short DNA Sequences to the Human Genome. Genome Biol. 2009, 10, R25. [Google Scholar] [CrossRef]
- Haas, B. J.; Papanicolaou, A.; Yassour, M.; Grabherr, M.; Blood, P. D.; Bowden, J.; Couger, M. B.; Eccles, D.; Li, B.; Lieber, M. De Novo Transcript Sequence Reconstruction from RNA-Seq Using the Trinity Platform for Reference Generation and Analysis. Nat. Protoc. 2013, 8, 1494–1512. [Google Scholar] [CrossRef] [PubMed]
- Manni, M.; Berkeley, M. R.; Seppey, M.; Simão, F. A.; Zdobnov, E. M. BUSCO Update: Novel and Streamlined Workflows along with Broader and Deeper Phylogenetic Coverage for Scoring of Eukaryotic, Prokaryotic, and Viral Genomes. Mol. Biol. Evol. 2021, 38, 4647–4654. [Google Scholar] [CrossRef]
- Fu, L.; Niu, B.; Zhu, Z.; Wu, S.; Li, W. CD-HIT: Accelerated for Clustering the next-Generation Sequencing Data. Bioinformatics 2012, 28, 3150–3152. [Google Scholar] [CrossRef] [PubMed]
- Lechner, M.; Findeiß, S.; Steiner, L.; Marz, M.; Stadler, P. F.; Prohaska, S. J. Proteinortho: Detection of (Co-)Orthologs in Large-Scale Analysis. BMC Bioinformatics 2011, 12, 124. [Google Scholar] [CrossRef]
- Löytynoja, A. Phylogeny-Aware Alignment with PRANK. In Multiple Sequence Alignment Methods; Russell, D. J., Ed.; Methods in Molecular Biology; Humana Press: Totowa, NJ, 2014; Vol. 1079, pp. 155–170. [Google Scholar] [CrossRef]
- Okonechnikov, K.; Golosova, O.; Fursov, M.; the UGENE team. Unipro UGENE: A Unified Bioinformatics Toolkit. Bioinformatics 2012, 28, 1166–1167. [Google Scholar] [CrossRef] [PubMed]
- Shen, W.; Sipos, B.; Zhao, L. SeqKit2: A Swiss Army Knife for Sequence and Alignment Processing. iMeta 2024, 3, e191. [Google Scholar] [CrossRef]
- Castresana, J. Selection of Conserved Blocks from Multiple Alignments for Their Use in Phylogenetic Analysis. Mol. Biol. Evol. 2000, 17, 540–552. [Google Scholar] [CrossRef]
- Minh, B. Q.; Schmidt, H. A.; Chernomor, O.; Schrempf, D.; Woodhams, M. D.; Von Haeseler, A.; Lanfear, R. IQ-TREE 2: New Models and Efficient Methods for Phylogenetic Inference in the Genomic Era. Mol. Biol. Evol. 2020, 37, 1530–1534. [Google Scholar] [CrossRef]
- Hoang, D. T.; Chernomor, O.; Von Haeseler, A.; Minh, B. Q.; Vinh, L. S. UFBoot2: Improving the Ultrafast Bootstrap Approximation. Mol. Biol. Evol. 2018, 35, 518–522. [Google Scholar] [CrossRef] [PubMed]
- Kalyaanamoorthy, S.; Minh, B. Q.; Wong, T. K. F.; Von Haeseler, A.; Jermiin, L. S. ModelFinder: Fast Model Selection for Accurate Phylogenetic Estimates. Nat. Methods 2017, 14, 587–589. [Google Scholar] [CrossRef]
- Morel, B.; Kozlov, A. M.; Stamatakis, A. ParGenes: A Tool for Massively Parallel Model Selection and Phylogenetic Tree Inference on Thousands of Genes. Bioinformatics 2019, 35, 1771–1773. [Google Scholar] [CrossRef] [PubMed]
- Kozlov, A. M.; Darriba, D.; Flouri, T.; Morel, B.; Stamatakis, A. RAxML-NG: A Fast, Scalable and User-Friendly Tool for Maximum Likelihood Phylogenetic Inference. Bioinformatics 2019, 35, 4453–4455. [Google Scholar] [CrossRef]
- Huerta-Cepas, J.; Serra, F.; Bork, P. ETE 3: Reconstruction, Analysis, and Visualization of Phylogenomic Data. Mol. Biol. Evol. 2016, 33, 1635–1638. [Google Scholar] [CrossRef] [PubMed]
- Bouckaert, R. R. DensiTree: Making Sense of Sets of Phylogenetic Trees. Bioinformatics 2010, 26, 1372–1373. [Google Scholar] [CrossRef] [PubMed]
- Zhang, C.; Rabiee, M.; Sayyari, E.; Mirarab, S. ASTRAL-III: Polynomial Time Species Tree Reconstruction from Partially Resolved Gene Trees. BMC Bioinformatics 2018, 19, 153. [Google Scholar] [CrossRef] [PubMed]
- Zhang, C.; Mirarab, S. Weighting by Gene Tree Uncertainty Improves Accuracy of Quartet-Based Species Trees. Mol. Biol. Evol. 2022, 39, msac215. [Google Scholar] [CrossRef] [PubMed]
- Douglas, J.; Jiménez-Silva, C. L.; Bouckaert, R. StarBeast3: Adaptive Parallelized Bayesian Inference under the Multispecies Coalescent. Syst. Biol. 2022, 71, 901–916. [Google Scholar] [CrossRef] [PubMed]
- Rambaut, A.; Drummond, A. J.; Xie, D.; Baele, G.; Suchard, M. A. Posterior Summarization in Bayesian Phylogenetics Using Tracer 1.7. Syst. Biol. 2018, 67, 901–904. [Google Scholar] [CrossRef]
- Catchen, J.; Hohenlohe, P. A.; Bassham, S.; Amores, A.; Cresko, W. A. Stacks: An Analysis Tool Set for Population Genomics. Mol. Ecol. 2013, 22, 3124–3140. [Google Scholar] [CrossRef]
- Li, H.; Durbin, R. Fast and Accurate Long-Read Alignment with Burrows–Wheeler Transform. Bioinformatics 2010, 26, 589–595. [Google Scholar] [CrossRef]
- Danecek, P.; Bonfield, J. K.; Liddle, J.; Marshall, J.; Ohan, V.; Pollard, M. O.; Whitwham, A.; Keane, T.; McCarthy, S. A.; Davies, R. M.; Li, H. Twelve Years of SAMtools and BCFtools. GigaScience 2021, 10, giab008. [Google Scholar] [CrossRef]
- Ortiz, E. M. Vcf2phylip v2.0: Convert a VCF Matrix into Several Matrix Formats for Phylogenetic Analysis., 2019. [CrossRef]
- Koboldt, D. C.; Zhang, Q.; Larson, D. E.; Shen, D.; McLellan, M. D.; Lin, L.; Miller, C. A.; Mardis, E. R.; Ding, L.; Wilson, R. K. VarScan 2: Somatic Mutation and Copy Number Alteration Discovery in Cancer by Exome Sequencing. Genome Res. 2012, 22, 568–576. [Google Scholar] [CrossRef] [PubMed]
- Bouckaert, R.; Vaughan, T. G.; Barido-Sottani, J.; Duchêne, S.; Fourment, M.; Gavryushkina, A.; Heled, J.; Jones, G.; Kühnert, D.; De Maio, N.; Matschiner, M.; Mendes, F. K.; Müller, N. F.; Ogilvie, H. A.; Du Plessis, L.; Popinga, A.; Rambaut, A.; Rasmussen, D.; Siveroni, I.; Suchard, M. A.; Wu, C.-H.; Xie, D.; Zhang, C.; Stadler, T.; Drummond, A. J. BEAST 2.5: An Advanced Software Platform for Bayesian Evolutionary Analysis. PLOS Comput. Biol. 2019, 15, e1006650. [Google Scholar] [CrossRef]
- Bouckaert, R. R.; Drummond, A. J. bModelTest: Bayesian Phylogenetic Site Model Averaging and Model Comparison. BMC Evol. Biol. 2017, 17, 42. [Google Scholar] [CrossRef]
- Whitfield, J. B.; Lockhart, P. J. Deciphering Ancient Rapid Radiations. Trends Ecol. Evol. 2007, 22, 258–265. [Google Scholar] [CrossRef] [PubMed]
- Patel, S. Error in Phylogenetic Estimation for Bushes in the Tree of Life. J. Phylogenetics Evol. Biol. 2013, 01. [Google Scholar] [CrossRef]
- Nichols, R. Gene Trees and Species Trees Are Not the Same. Trends Ecol. Evol. 2001, 16, 358–364. [Google Scholar] [CrossRef] [PubMed]
- Nesi, N.; Tsagkogeorga, G.; Tsang, S. M.; Nicolas, V.; Lalis, A.; Scanlon, A. T.; Riesle-Sbarbaro, S. A.; Wiantoro, S.; Hitch, A. T.; Juste, J.; Pinzari, C. A.; Bonaccorso, F. J.; Todd, C. M.; Lim, B. K.; Simmons, N. B.; McGowen, M. R.; Rossiter, S. J. Interrogating Phylogenetic Discordance Resolves Deep Splits in the Rapid Radiation of Old World Fruit Bats (Chiroptera: Pteropodidae). Syst. Biol. 2021, 70, 1077–1089. [Google Scholar] [CrossRef] [PubMed]
- Olave, M.; Meyer, A. Implementing Large Genomic Single Nucleotide Polymorphism Data Sets in Phylogenetic Network Reconstructions: A Case Study of Particularly Rapid Radiations of Cichlid Fish. Syst. Biol. 2020, 69, 848–862. [Google Scholar] [CrossRef]
- Maddison, W. P.; Knowles, L. L. Inferring Phylogeny Despite Incomplete Lineage Sorting. Syst. Biol. 2006, 55, 21–30. [Google Scholar] [CrossRef]
- McCormack, J. E.; Huang, H.; Knowles, L. L. Maximum Likelihood Estimates of Species Trees: How Accuracy of Phylogenetic Inference Depends upon the Divergence History and Sampling Design. Syst. Biol. 2009, 58, 501–508. [Google Scholar] [CrossRef] [PubMed]
- Heled, J.; Drummond, A. J. Bayesian Inference of Species Trees from Multilocus Data. Mol. Biol. Evol. 2010, 27, 570–580. [Google Scholar] [CrossRef] [PubMed]
- Corl, A.; Ellegren, H. Sampling Strategies for Species Trees: The Effects on Phylogenetic Inference of the Number of Genes, Number of Individuals, and Whether Loci Are Mitochondrial, Sex-Linked, or Autosomal. Mol. Phylogenet. Evol. 2013, 67, 358–366. [Google Scholar] [CrossRef] [PubMed]
- Alfaro-Ibáñez, M.; Lira-Garrido, J.; Cuenca-Bescós, G.; Pons, J.; Bover, P. Insights on the Evolution of the Tribe Pliomyini (Arvicolinae, Rodentia): Ancient DNA from the Extinct Pliomys Lenki. Palaeontol. Electron. 2024. [Google Scholar] [CrossRef] [PubMed]
- Heinrich, W.-D. Some Aspectsof Evolution and Biostratigraphy of Arvicola(Mammalia, Rodentia) in the Central European Pleistocene. In Evolution, Phylogeny and Biostratigraphy of Arvicolids (Rodentia.Mammalia); Fejfar, O., Heinrich, W.-D., Eds.; Geological Survey: Prague, 1990; pp. 165–182. [Google Scholar]
- Koenigswald, W.; van Kolfschoten, T. The Mimomys-Arvicola Boundary and the Enamel Thickness Quotient (SDQ) of Arvicola as Stratigraphic Markers in the Middle Pleistocene. In The Early Middle Pleistocene in Europe; Nurner, E., Ed.; Balkema: Rotterdam, 1996; pp. 211–226. [Google Scholar]
- Pardiñas, U. F. J.; Myers, P.; León-Paniagua, L.; Ordóñez Garza, N.; Cook, J. A.; Kryštufek, B. Family Cricetidae (True Hamsters, Voles, Lemmings and New World Rats and Mice). Handb Mamm World. In Handbook of the Mammals of the World; Lynx Edicions: Barcelona, 2017; Vol. 7, pp. 204–279. [Google Scholar]
- Villaverde, T.; Maguilla, E.; Luceño, M.; Hipp, A. L. Assessing the Sensitivity of Divergence Time Estimates to Locus Sampling, Calibration Points, and Model Priors in a RAD-seq Phylogeny of Carex Section Schoenoxiphium. J. Syst. Evol. 2021, 59, 687–697. [Google Scholar] [CrossRef]
- Near, T. J.; Sanderson, M. J. Assessing the Quality of Molecular Divergence Time Estimates by Fossil Calibrations and Fossil–Based Model Selection. Philos. Trans. R. Soc. Lond. B. Biol. Sci. 2004, 359, 1477–1483. [Google Scholar] [CrossRef]
- Hug, L. A.; Roger, A. J. The Impact of Fossils and Taxon Sampling on Ancient Molecular Dating Analyses. Mol. Biol. Evol. 2007, 24, 1889–1897. [Google Scholar] [CrossRef]
- Sauquet, H.; Ho, S. Y. W.; Gandolfo, M. A.; Jordan, G. J.; Wilf, P.; Cantrill, D. J.; Bayly, M. J.; Bromham, L.; Brown, G. K.; Carpenter, R. J.; Lee, D. M.; Murphy, D. J.; Sniderman, J. M. K.; Udovicic, F. Testing the Impact of Calibration on Molecular Divergence Times Using a Fossil-Rich Group: The Case of Nothofagus (Fagales). Syst. Biol. 2012, 61, 289–313. [Google Scholar] [CrossRef] [PubMed]
- Duchêne, S.; Holmes, E. C.; Ho, S. Y. W. Analyses of Evolutionary Dynamics in Viruses Are Hindered by a Time-Dependent Bias in Rate Estimates. Proc. R. Soc. B Biol. Sci. 2014, 281, 20140732. [Google Scholar] [CrossRef]
|
Disclaimer/Publisher’s Note: The statements, opinions and data contained in all publications are solely those of the individual author(s) and contributor(s) and not of MDPI and/or the editor(s). MDPI and/or the editor(s) disclaim responsibility for any injury to people or property resulting from any ideas, methods, instructions or products referred to in the content. |
© 2024 by the authors. Licensee MDPI, Basel, Switzerland. This article is an open access article distributed under the terms and conditions of the Creative Commons Attribution (CC BY) license (http://creativecommons.org/licenses/by/4.0/).