Preprint
Article

This version is not peer-reviewed.

The Neural Basis of Salt Perception: A Focus on Potassium Chloride as a Sodium Alternative

A peer-reviewed article of this preprint also exists.

Submitted:

04 December 2024

Posted:

05 December 2024

You are already at the latest version

Abstract

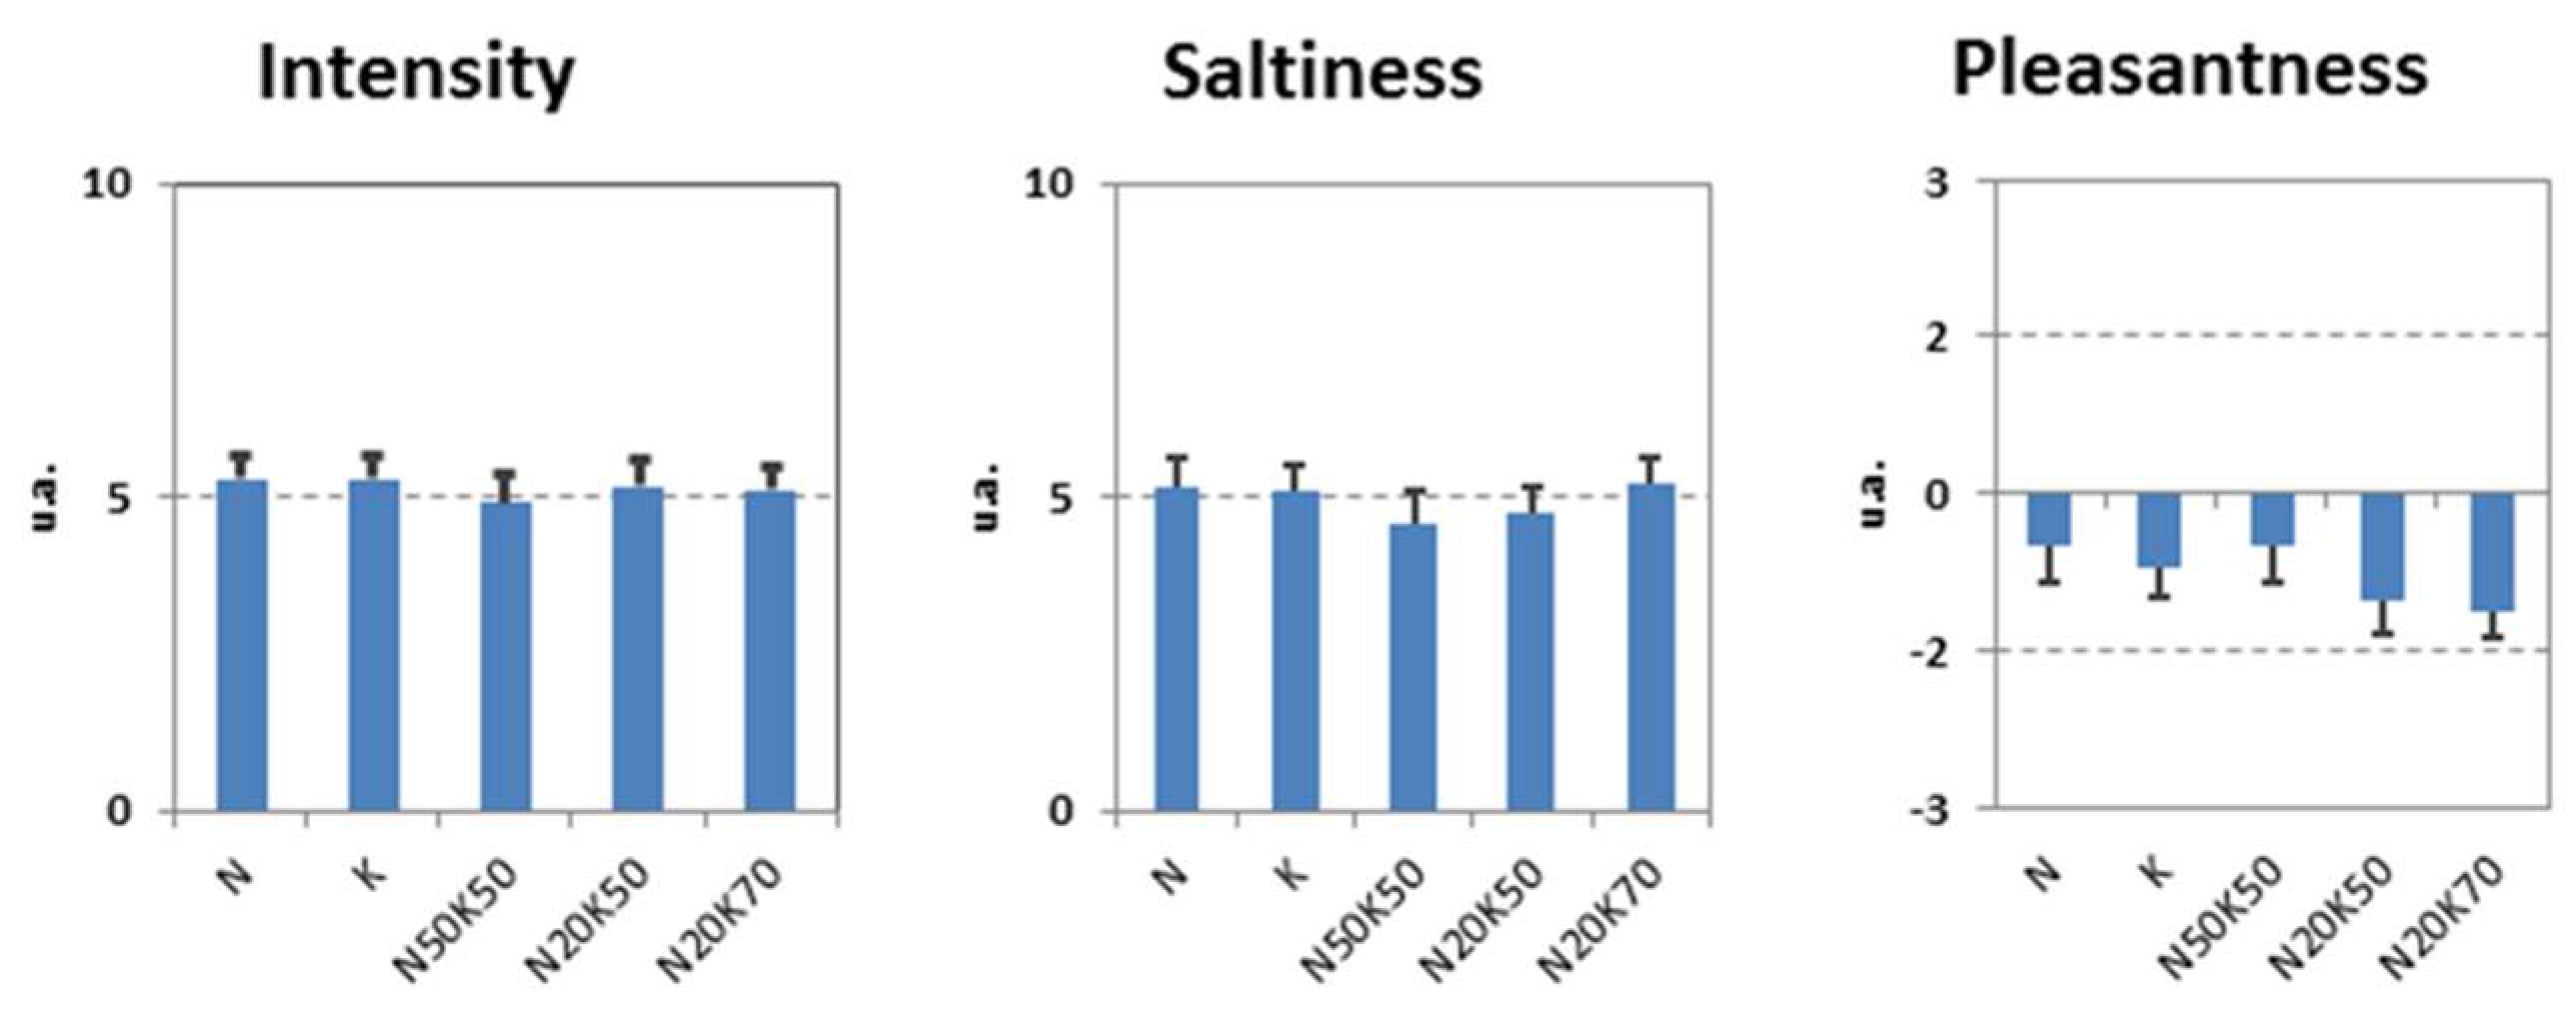
Excessive dietary sodium intake is a major risk factor for hypertension, prompting interest in potassium chloride (KCl) as a sodium chloride (NaCl) alternative. While KCl preserves saltiness, its neural processing compared to NaCl remains underexplored. This study investigates the neural correlates of taste perception for NaCl, KCl, and their mixture using gustatory event-related potentials (ERPs) in a sample of Twenty-eight healthy young adults. Participants rated the intensity, saltiness, and pleasantness of the stimuli, which were matched for iso-intensity and iso-pleasantness. High-density EEG data revealed distinct microstate patterns associated with each condition, particularly in the later stages of processing, which align with the endogenous phases of taste perception. Source localization identified the insula and opercular regions as primary sites for gustatory processing, with specific differences in activation patterns between NaCl and KCl. These findings suggest that while KCl elicits comparable behavioral responses to NaCl, its neural representation involves unique processes that may reflect its distinct chemical properties. This study advances our understanding of the neural dynamics of salt taste perception, providing insights into the potential use of KCl as a potentially healthier alternative in dietary interventions.

Keywords: 
;  ;  ;  ;  

1. Introduction

Hypertension, a leading global health concern, is rapidly on the rise, with an estimated 1.5 billion people projected to be affected by 2025 (Kearney et al., 2005). This condition is a significant risk factor for cardiovascular diseases and strokes, leading to substantial healthcare costs and societal burden (Ezzati et al., 2002). Among the factors contributing to the development of hypertension, dietary sodium chloride (NaCl) intake has been closely linked. Excessive consumption of NaCl, commonly referred to as table salt, has been associated with elevated blood pressure and the subsequent risk of cardiovascular events (Sacks et al., 2001; Aburto et al., 2013). The World Health Organization (WHO) recommends reducing sodium intake to less than 5 grams per day, a significant reduction from the global average consumption of 9-12 grams (WHO, 2013). These recommendations have led to various public health initiatives aimed at reducing NaCl intake.
As part of these interventions, the substitution of NaCl with potassium chloride (KCl) has been proposed, as KCl provides a similar salty taste without the detrimental effects of sodium on cardiovascular health. Several studies suggest that increasing dietary potassium intake may help lower blood pressure in both hypertensive and normotensive individuals (Whelton et al., 1997). Moreover, psychophysical studies, such as those by Li et al. (2009), demonstrate that partial substitution of NaCl with KCl in food preparations can maintain palatability. Despite these promising findings, there remains a crucial gap in our understanding of how these salt substitutes are processed in the central nervous system (CNS).
Current research on salt perception has primarily focused on behavioral and psychophysical outcomes, often driven by the food industry. However, little is known about the neural mechanisms underlying the perception of salty taste, particularly when comparing NaCl and KCl. This gap is significant, as understanding the brain's processing of these stimuli could provide deeper insights into taste perception, hedonics, and potential differences in how NaCl and KCl are perceived and evaluated by the gustatory system.
Event-related potentials (ERPs), a non-invasive method for recording brain activity in response to specific sensory stimuli, offer a powerful tool to investigate the neural correlates of taste perception. ERPs have been widely used to study sensory processing in the auditory and visual domains, and their application in gustatory research is emerging as a promising approach to explore how the brain processes different taste stimuli. ERPs can provide precise temporal information about neural activity, enabling researchers to examine the early and late stages of gustatory processing and the involvement of various brain regions.
In the present study, we aim to bridge this knowledge gap by investigating the neural activation elicited by different savory conditions using high-density gustatory event-related potentials (ERPs). Specifically, we aimed to compare the neural responses to KCl and NaCl and a mixture of them, all of which elicit a salty taste, with the intent to study the neural correlate and palatability as function of the sodium component, the element associated with adverse cardiovascular outcomes. Our goal was to characterize how these different salts are processed in the brain and to explore any potential differences in their gustatory neural representation.
This study addresses an important gap in the literature by characterizing the neural dynamics of KCl and NaCl perception, contributing to the broader discussion on salt substitutes and their implications for public health. Ultimately, we conclude that while KCl may evoke similar gustatory responses as NaCl, its distinct neural processing may have implications for its use as a widespread NaCl substitute.

2. Materials and Methods

2.1. Participants

Twenty-eight healthy, right-handed volunteers were included in the study: 15 women and 13 men aged between 20 and 34 years, with mean age ± sd = 25±2.8 years. The health status was ascertained with a detailed medical history. Exclusion criteria included metabolic disorders (like diabetes and renal diseases), smokers, and pregnant and breastfeeding women. The gustatory and olfactory functions were tested respectively with regional gustatory testing using taste strips (group score: mean +/- standard deviation = 14.5 +/- 1.2) as well as taste sprays (score 4/4) (Schuster et al. 2009), and the Sniffin' Sticks Screening Odor Identification test (group score: mean +/- standard deviation = 14.6 +/- 1.1) (Oleszkiewicz et al. 2019). All subjects included in this study had test scores within the normal range. Participants were informed about the experiment and gave written consent for anonymous personal data processing.

2.2. Procedure and Study Design

The data were collected in two sessions on separate days. During the first visit, the participants underwent psychophysical testing to ascertain normal gustatory functions and a mock test of the gustatory EEG acquisition, where they got acquainted with the procedures during the investigation. The first visit lasted ca. 30 minutes. During the second session, we recorded the EEG data synchronously with a gustatory stimulation where a constant liquid flow irrigated the subject's protruded tongue. For each savory condition, the volunteer had to rate the intensity on a visual analog scale from zero (not perceived) to 10 (extremely intense). A white acoustic noise delivered through headphones shielded the subject from surrounding possible noises. The second session lasted about 2 hours.

2.3. Stimuli

In the first session of the study, five stimulus conditions were used. They were based on two different liquid stimuli of sodium chloride (NaCl) and potassium chloride (KCl), and their combination was done in different percentages. The concentration for NaCl (295mM) and KCl (352mM) was set using a psychophysical pilot study to match their intensities at an iso-value. Other conditions were a mixture of both with three relative percentages: 50% NaCl and 50% KCl, 20%NaCl and 50% KCl, and 20%NaCl and 70%KCl (volume percentage). The solutions were prepared in physiological water. The participants were thoroughly acquainted with the experimental setup. The tastants were delivered using a computer-controlled pump system (gustometer, Burghart GU002 – variant GM04; Burghart Messtechnik, Holm, Germany) in a pulse design within a continuous flow of neutral liquid (Aqua ad injectabilia, Braun, Germany). With this device, the tongue was constantly stimulated and at a constant body temperature to mask somatosensory and temperature effects. The gustometer has been positively tested to induce gustatory ERPs (Iannilli, 2023). The taste-pulse duration was 250 ms with a volume of 100 µl per pulse. The interstimulus interval (ISI) was jittered from 18 to 22 s (mean ISI 20 s) to reduce expectation effects.
In the first session, the participants had to rate the intensity (0 to 10), saltiness (0 to 10), and pleasantness (-5=very unpleasant, +5=very pleasant) on a continuous visual analogical scale presented on a screen and perform a simple tracking task to assure alertness.
In the second session, the EEG acquisition took place. As final stimuli, we used three different conditions: NaCl (295 mM), KCl (352 mM), and the 50% mixture of the two in volume percentage. The choice was made based on the rating results obtained by the first session, where the group of the subjects evaluated the solutions as iso-intense(F[2,28]=.735; p=.488), iso-pleasant (F[2,28]=.278; p=.759) and with the same saltiness level (F[2,28]=.988; p=.385).
The study was performed in accordance with the Helsinki Declaration, and the local ethical committee approved it (EK 286112008).

2.4. EEG Acquisition and Data Analysis

The EEG data was recorded using a 128-channel EEG system (Biosemi; electrodes: Ag-AgCl active electrodes, BioSemi; 10/20 BioSemi–CAP; Amsterdam, Netherlands). Eight additional external electrodes recorded four vertical and horizontal electro-oculographic signals to control for eye artifacts. Each channel was amplified (BioSemi ActiveTwo AD-box) and sent via a single optical fiber to a USB2 receiver (BioSemi) connected to a PC. Data were registered and stored using (BioSemi ActiveView (v.605) acquisition software. We used electrode gel (Signa gel; Parker Laboratories, Inc., Fairfield, NJ, USA) to maximize the conductivity and reduce electrode impedance. The taste event trigger was synchronized in parallel with the EEG signal.
A white noise source was applied via headphones to minimize the surrounding sounds. Blinking or sleeping/vigilance issues were controlled through a tracking task that the subject performed with the help of a computer mouse. The subjects were asked not to eat, smoke, or drink anything but water for 1 hour before the EEG sessions.
We used Cartool software 4.11 (ref.) for EEG data analysis. Signal pre-processing included baseline correction (500 ms before stimulus onset), a 15 Hz low pass filter, a 0.1 Hz high pass filter, and a 50 Hz notch filter. For each subject in each condition, data were epoched after manual artifact rejection and interpolation of bad electrodes. The EEG-referenced was set to the signal average. Before analysis, each subject’s data was anonymized and assigned to the relative group. A grand average for each condition was computed.

2.5. Topographical Analysis and Source Localization

Topographic analysis was performed using microstate segmentation (Lehmann et al., 1987). The optimal number of functional microstates was defined on the grand average for each taste condition using k-means spatial cluster analysis followed by a cross-validation criterion (Pascual-Marqui et al., 1995). Cluster maps that correlated more than 85 % were merged, and segments less than or equal to 12 TF (24 ms) were rejected. The defined stable maps’ topography was then fitted back to each subject to validate the segmentation procedure (Michel et al., 1999). The localization of the EEG sources in high-spatial-resolution brain structure was achieved by co-registering the EEG electrodes placed on the skin with an MNI template (Montreal Neurological Institute) with predefined translation parameters to match the two spaces. As a head model, we used a local spherical model with anatomical constraints (LSMAC) with space solution constrained to the gray matter for a total of 5000 solution points. A local autoregressive average (LAURA) (Grave de Peralta Menendez, Murray, Michel, Martuzzi, & Gonzalez Andino, 2004) algorithm was applied to estimate the inverse solutions.

2.6. Demographics and Behavioral Data Analysis

The demographic and psychophysical data were analyzed by means of IBM SPSS v21 (IBM, Ehningen, Germany).

3. Results

3.1. First Lab Session – Stimuli Ratings

By means of one-way repeated measures ANOVA it was ascertained that the volunteers evaluated the stimuli (N, K and 50/50NK) as iso-intense (Intensity N[mean± s.d.] = 5,3±2,0; Intensity K [mean± s.d.]=5,3 ± 2,1; Intensity N50K50 [mean± s.d.]=4,9± 2,5; Wilk’s Lambda = .950; F[2,28]=.735; p=.488), iso-pleasant (Pleasantness NaCl[mean± s.d.] = -.5±1.9; PeasantnessKCl [mean± s.d.] =-.7± 1.4 ; Peasantness 50/50NK[mean± s.d.] =-.5± 1.8; Wilk’s Lambda = .980; F[2,28]=.278; p=.759) and with the same saltiness level (Saltiness N[mean± s.d.]=5.2±2,3 ; SaltinessK[mean± s.d.]= 5.1±1.9; Saltiness-50/50NK [mean± s.d.]=4.6±2.6; Wilk’s Lambda = .934; F[2,28]=.988; p=.385).

3.2. Gustatory ERPs

The ERPs were averaged after discarding muscular or blinking artifacts. Butterfly plots showing the grand mean using as reference the average among the electrodes after artifact rejection and electrode interpolation on the group of subjects for each condition, K on the top, 50/50NK in the center, and N at the bottom are reported in the supplementary materials (SM Figure1).
Figure 1. Intensity, saltiness, and pleasantness ratings for the 5 solutions in the first session. The group evaluated NaCl (N), KCl/K) and the mixture (N50K5), a 50% mixture of N and K, iso-intense, iso-pleasant and with an indistinguishable level of saltiness. N: 295 mM NaCl; K: 352 mM KCl; N50K50: 50% of total volume constituted by N and 50% by K.
Preprints 141814 g001

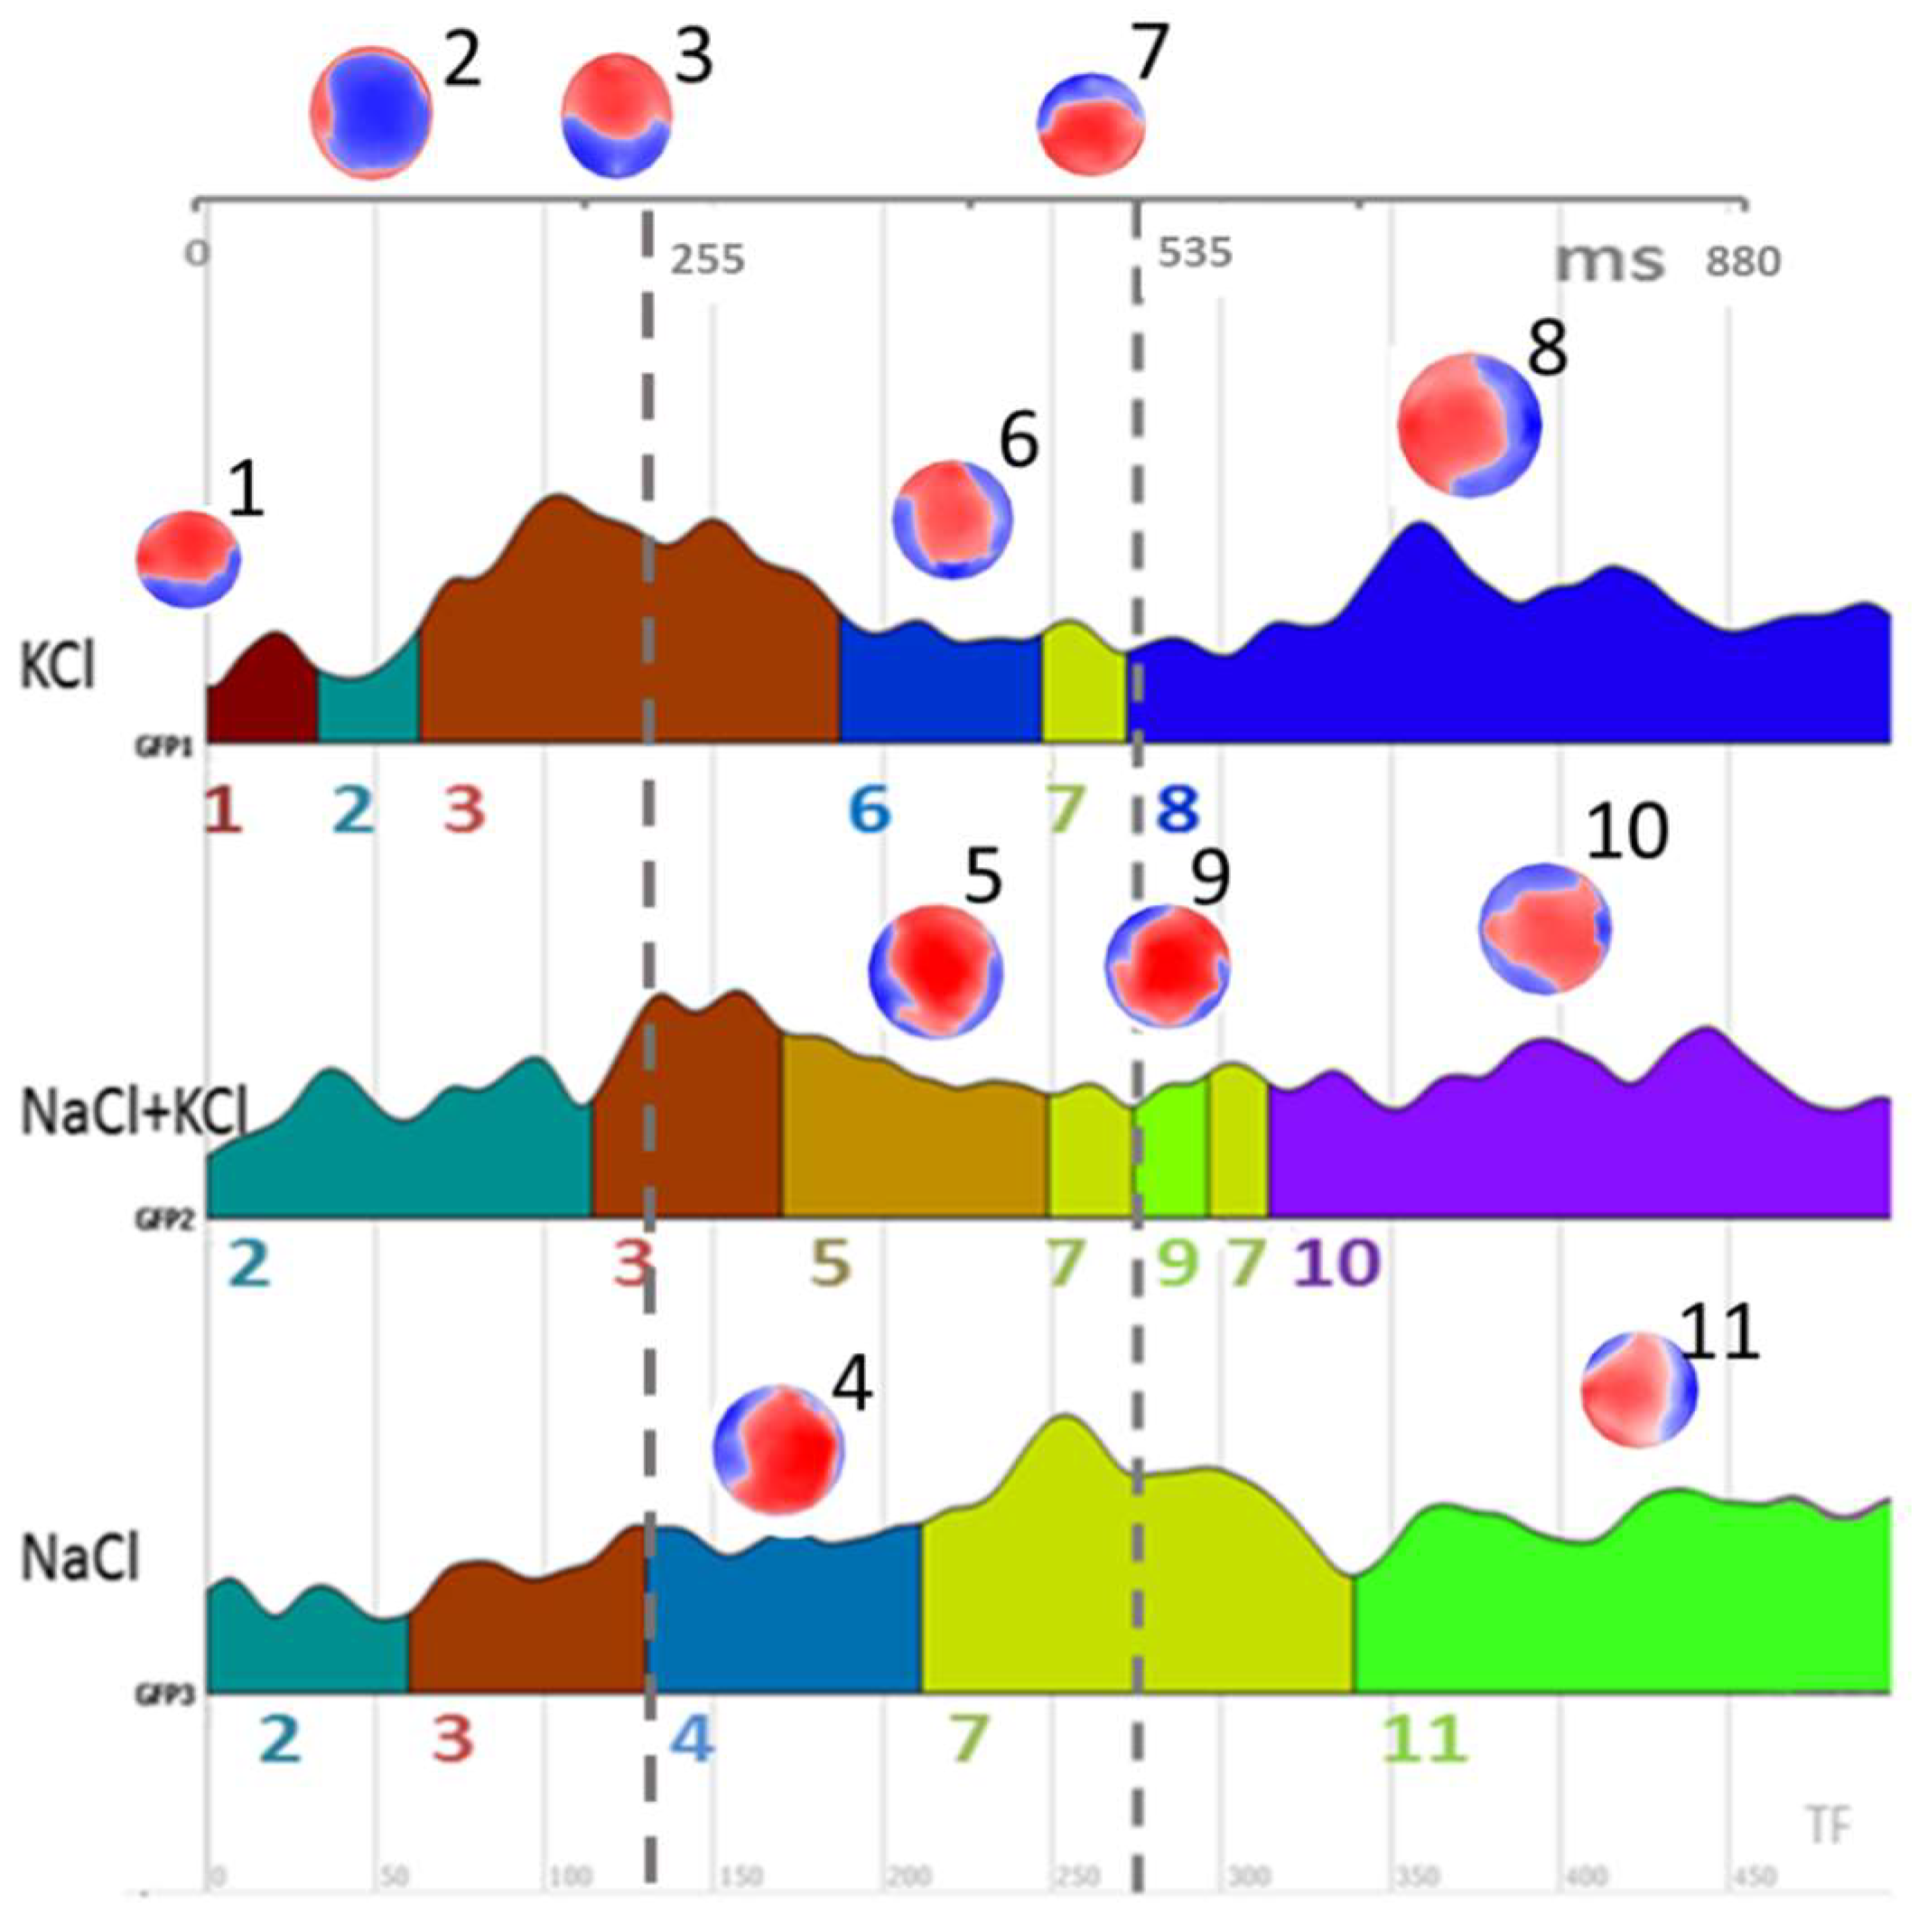
3.3. Microstates Segmentation

Our segmentation results show eleven stable topographic maps for the three conditions (Figure 4). The initial time course of the segmentation, including Map2 and Map3, is similar for the three conditions up to ca.300 ms. At this point, a differentiation of maps is detected: NaCl condition is represented by Map4, the mixture condition is represented by Map3 followed by Map5, and the KCl condition is represented by Map3 followed by Map6. The unique maps per condition are as follows: Map 9 and Map 10 for the mixture condition, Map 11 for NaCl, and Map 1 and Map 8 for KCl.
Figure 2. Microstate segmentation. The segmentation for the three conditions individuated 11 stable maps (topographies, red: positive voltage, blue: negative voltage) coded by numbers. The duration of each microstate is colors-coded with the relative map number on the global field power (GFP) of the ERPs-grand average for each condition.
Preprints 141814 g002
We fitted the identified maps to each epoch at the single-subject level to validate the segmentation obtained at the group level. For the purpose of fitting back, and because we observed a high correlation between Map 5 and Map 6 (r = 0.62), as well as between Map 5 and Map 4 (r = 0.75), suggesting a strong dependence among those maps not captured by the segmentation process, we used Map 5 as a substitute for both Map 4 and Map 6. Finally, we extracted each map's general explained variance (GEV). The average GEV obtained from fitting back to each ERP-EEG subject is reported in Figure 3.
Based on the validation at the single-subject level, we identified five stable microstates that were uniquely present for the three conditions. For KCL, Map 1 occurred at the beginning, while Map 8 appeared in the last time frame of the epoch. For the mixture condition, Map 9 started after 534 ms and lasted approximately 32 ms, followed by Map 10, which occurred in the final epoch. Finally, for NaCl, Map 11 was present in the last time frame of the epoch. We will further estimate the brain sources associated with these specific microstates.

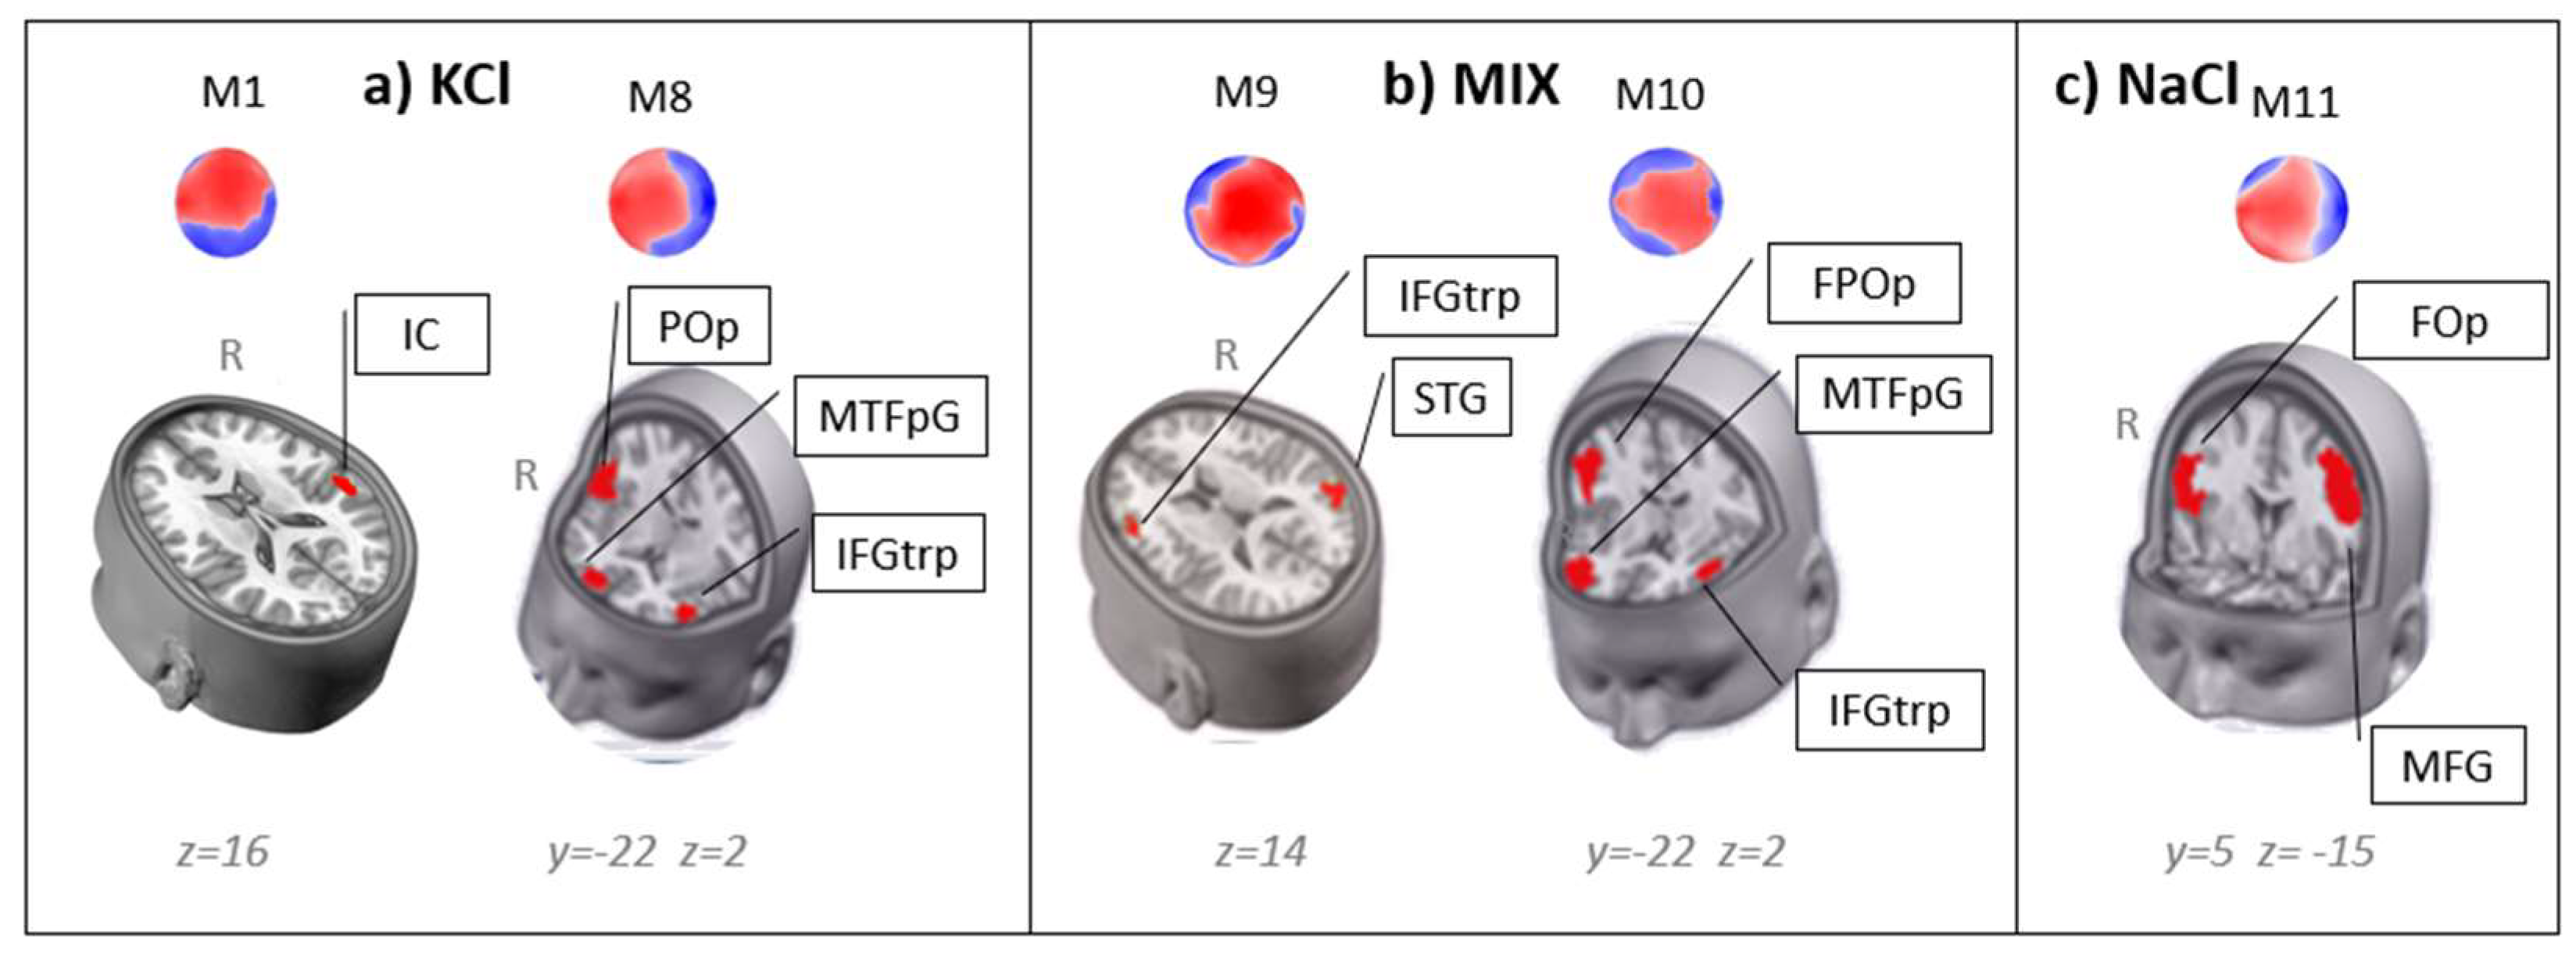
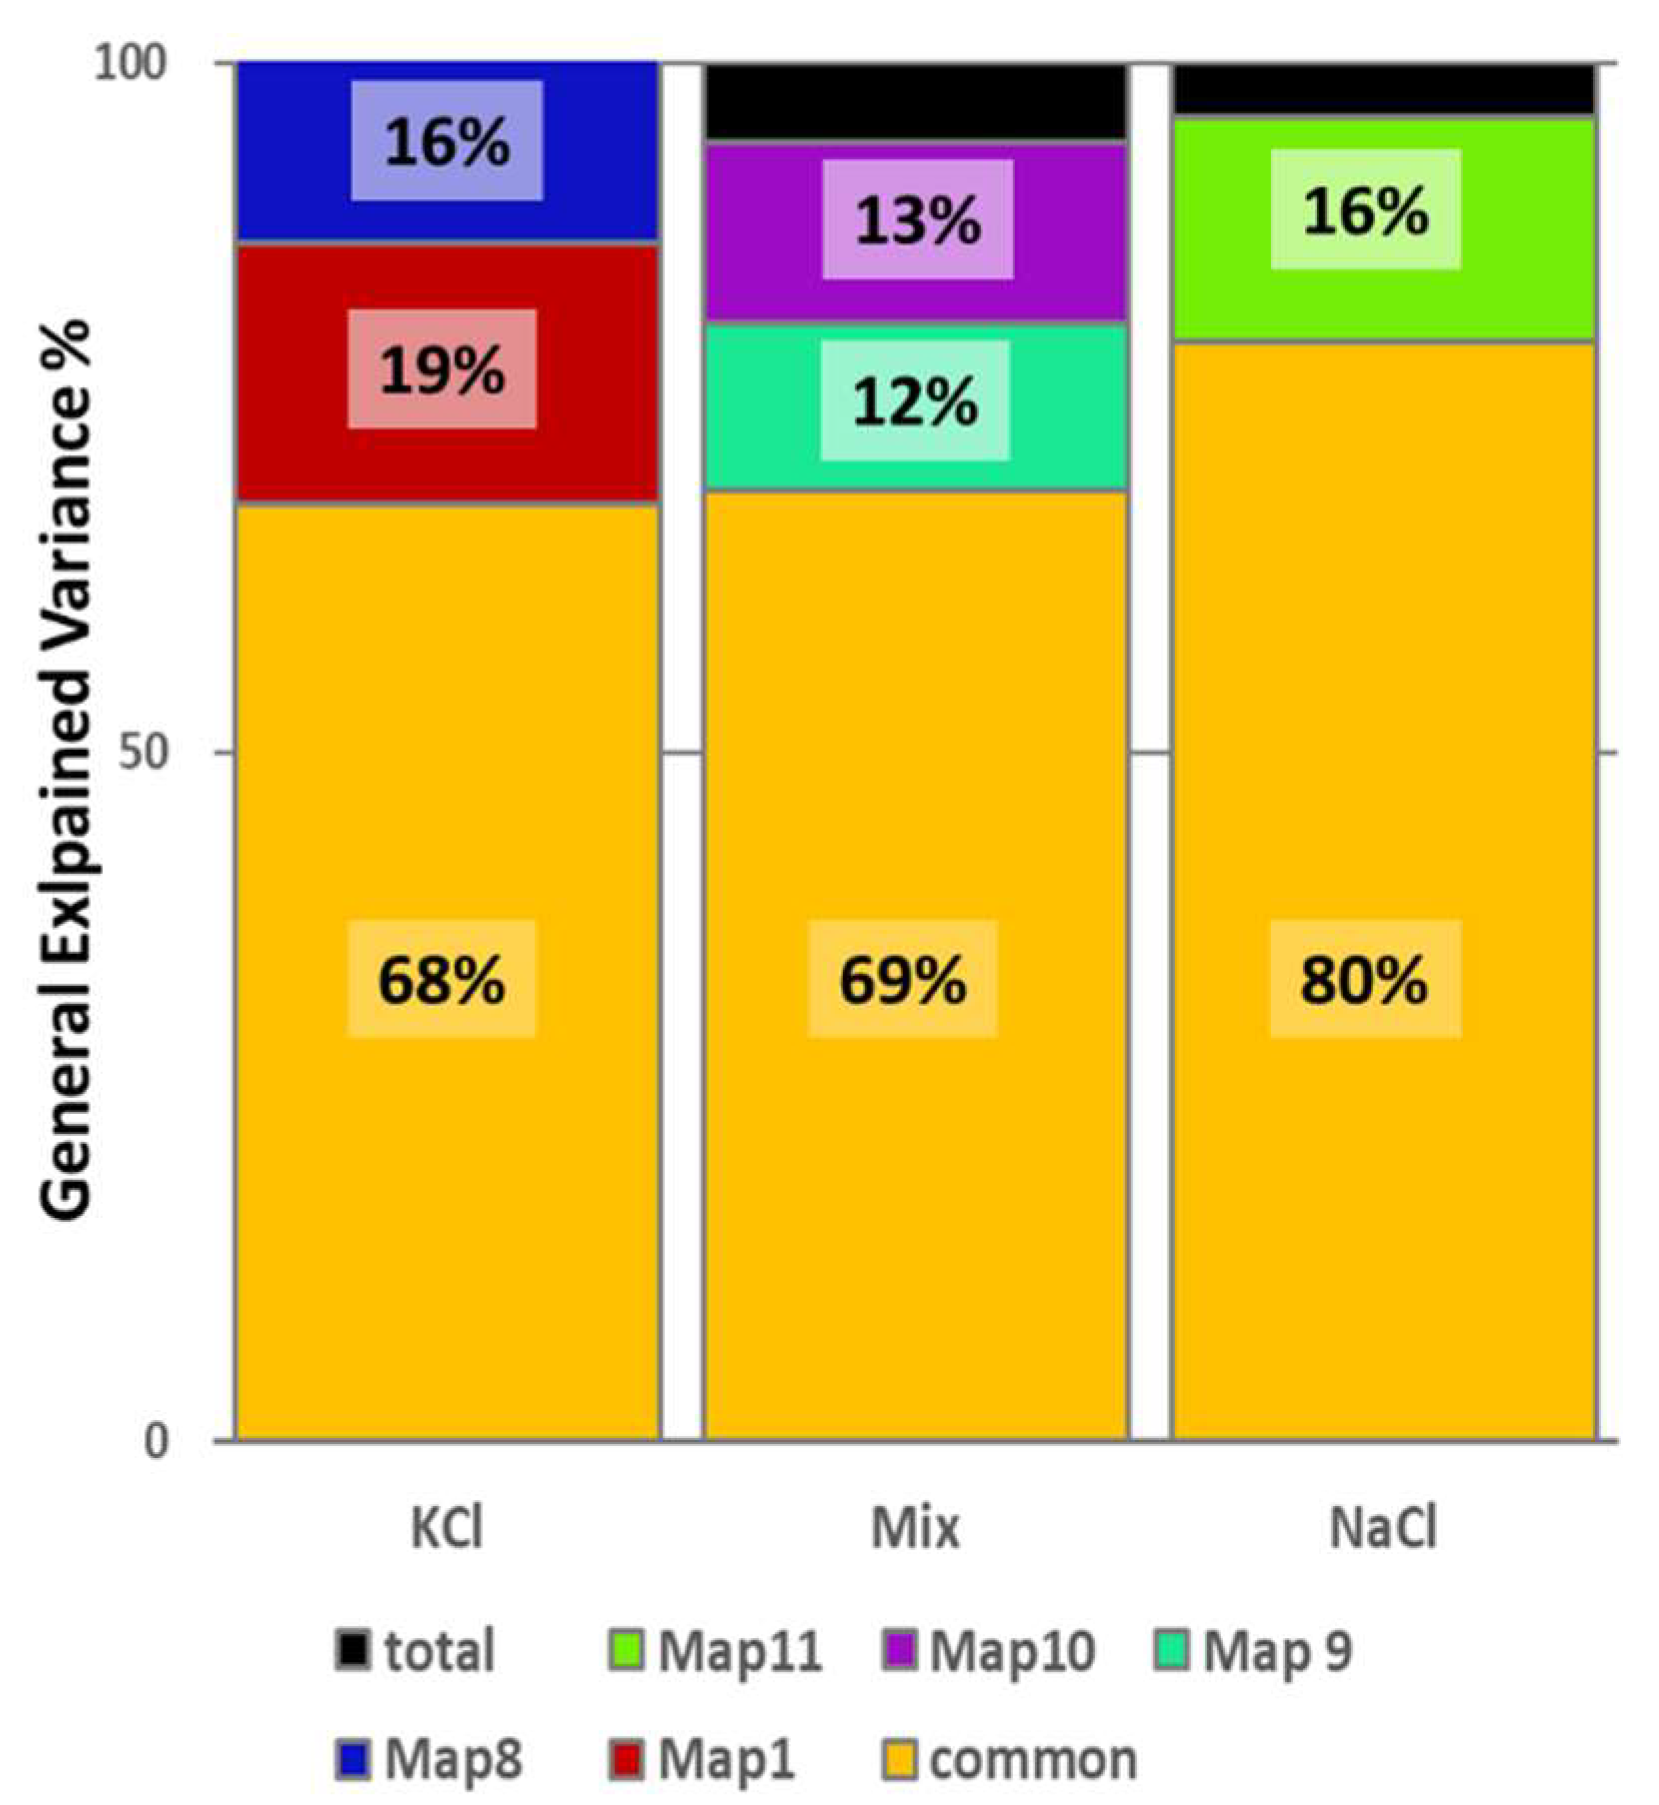
3.4. Sources Localization on the Microstates Specific for Each Condition

We computed the brain source responsible for the microstates Map 1, Map 8, Map 9, Map 10, and Map 11. We adopted the assumption of the spatio-temporal dipole model that dipole positions are unknown but fixed through time (Scherg & Cramon, 1985). The estimated current density of the solution space was thresholded at the maximum activity for each topography, and we extracted the coordinate associated with the solution point identified by the maximal current density.
Table 1 presents the estimated brain sources from specific microstates for each condition, along with their Talairach coordinates of maximum activity and the definition of the solution point in the cubic matrix constituting the solution point. The sources are visualized in Figure 4..
Figure 4. Source localization of the specific Microstates for each condition a) KCl, b) Mix and c) NaCl. IC: insular cortex; POp: parietal operculum; MTFpG: medial transverse frontopolar gyrus; IFGtrp: inferior frontal gyrus triangular part; STG: superior temporal gyrus; FPOp: frontoparietal operculum; Fop: frontal operculum; MFG: medial frontal gyrus.
Preprints 141814 g004

4. Discussion

In this work, we have studied the neural correlates in a group of young, healthy volunteers derived by the gustatory ERPs in response to sodium chloride, potassium chloride, and a 50% mixture of the two and their perceptual properties. No other similar works of this typology are available. The main results of the study can be summarized in the following concepts.
Although chemically different, the perceptual ratings of the three stimuli were indistinguishable for intensity, saltiness, and pleasantness.
The time course of the three gustatory processes, from the initial 63rd ms to 534 ms, shared similarities in terms of scalp topographies, although the chemicals were different. Main topographical differences among the three conditions appeared in the late part of the epoch, a time range classically associated with the endogenous phase of perception, i.e., the personal valence of the stimulus condition.
The sources of these microstates shared brain activities located in close areas of the right frontal gyrus pars opercularis.

4.1. Palatability of the Potassium Chloride

The participant group rated the solution with potassium chloride as having the same valence as the mixture solution and the pure NaCl solution. Although some studies have reported that a significant number of people find KCl extremely unpleasant, often describing a bitter aftertaste (Jacobson, 2005; Kilcast & Angus, 2007) and metallic flavor (Hooge & Chambers, 2010), our psychophysics results indicated that the mixture condition was rated at the same hedonic level as the pure potassium chloride and pure sodium chloride solutions.
These findings suggest that in terms of pleasantness, KCl, NaCl, and their mixture can be used interchangeably without significantly impacting the palatability of taste products, at least within a sample population of young, healthy individuals.

4.2. Scalp Topography and Brain Sources of Salty-taste

The neurophysiological approach allowed us to see if stimulation of the oral cavity with different salt conditions also corresponded to different/similar brain networks.
We found eleven (11) microstate topographies that described the process of perception of sodium chloride, potassium chloride, and the mixture of them, nine of them independent. Six of the eleven, M2, M3, and M5, which also includes M4 and M6 and M7, were common to the three conditions and also aligned in time, indicating that the three conditions shared a basic spatiotemporal neuronal path of the gustatory process.
Moreover, five maps were unique for each condition.
Interestingly, for pure KCl, the first initial milliseconds (ca. 63ms) of the time curse were occupied by a unique map, M1, which is also confirmed by the GEV of M1 at the single subject, that averaged to 19% of the GEV on the group, validating the importance of this map. The classical theory of ERPs explains this early stage of the signal as influenced by exogenous characteristics of the stimulus, or in other words, the ERP signal is determined by the physical properties of the stimulus, such as temperature, intensity, or, as in this case, chemical characteristics (Pause et al., 1996). The presence of M1 in KCl, then, is likely related to the entirely different characteristics that KCl has compared to the NaCl and the Mixture.
Maps are best interpreted in terms of underlying sources that generate the maps. The estimated source of M1 is located in the right centro-posterior insula/Rolandic operculum, which has often been identified as the gustatory cortex (Small, 2010; Iannilli & Gudziol, 2019; Iannilli et al., 2012). However, due to the heterogeneity of the insular cortex, these areas are also viewed as hubs for integrating information related to sensory perception and the novelty of experiences (Pritchard et al., 1999; Craig et al., 2000; Bushara et al., 2003; Ibanez et al., 2010) and more interesting in encoding the familiarization of novel tastants, as well as in the acquisition, retention, and extinction of aversive taste memories (Bermudez-Rattoni, 2004, 2014; Gal-Ben-Ari & Rosenblum, 2012).
We can speculate that the response to KCl in the insula may also apply to this situation. Our study included healthy young adults with no history of issues related to salt intake, indicating that they were unfamiliar with KCl. Therefore, it is reasonable to suggest, based on the evidence reviewed, that the initial microstate observed in the KCl condition could be related to the process of encoding and familiarizing oneself with this new taste.
Apart from M1 for KCl, they were all situated at the end of the epoch in a time frame that is classically interpreted as linked to the subjective stimulus significance (Bradley, 2009; Hayckák et al., 2006; Pause et al., 1996), increasing appetitive or aversive motivational systems. From this perspective, late maps can be considered as encoding the significance content of the three taste conditions, with the brain able to fine-distance across the chemicals, although the differences in pleasantness and saltiness are imperceptible. The late epoch seems different in each condition and is represented by three distinct topographies. Interestingly, all three maps, M8, M10, and M11, have one source in a common brain region, the operculum (Op), specifically M8 in POp, M10 in FPOp, and M11 in FOp. Studies have demonstrated that Op plays a crucial role in gustatory function, serving as a critical component in the brain's processing of taste (Iannilli-neuroimaging and other papers). According to Chikazoe et al. (2019), the operculum and the mid-insula exhibit distinct patterns of neural activity in response to basic taste stimuli such as sweet, salty, bitter, and sour, making the rolandic operculum, a central region inside the operculum, the most likely candidate for the primary gustatory cortex, but also auditory, pain, and vestibular primary areas (Gil-da-Costa et al., 2006)​. Mazzola et al. (2017) provided further evidence through direct electrical stimulation studies. They reported that gustatory sensations could be evoked reliably in the posterior operculum, overlapping with areas responsible for oral somatosensory inputs. This overlap underscores the integrative role of the posterior operculum in creating a unified perception of flavor, combining taste with oral somatosensory inputs.
Additionally, Mălîia et al. (2018) emphasized the functional connectivity between the operculum and insula. Their findings highlight the posterior operculum's involvement in a broader network that integrates sensory inputs from multiple modalities, reinforcing its role in the complex sensory experience of taste​.
These findings collectively suggest that the operculum is a multimodal cortex with widespread connectivity. Its multiple-site cortex devoted to gustatory functions is clear, but this doesn't exclude that this structure can act as a high-level hedonic function colocalized with low-level sensory representation, similar to what Anderson et Al. (2018) have theorized.
Finally, other frontal areas, such as the MTFpG, IFGtrp are explained by the functionality of high-order association cortical areas, consistent with other evidence that locates their affective and hedonic properties of taste and flavors (Rolls et al., 2003, 2003a; O'Doherty et al., 2001b).

4.3. Study Limitations

This study was conducted on a healthy, young population, which means that the conclusions are limited to this age group. Given the well-documented decline in taste function with age, we cannot generalize our findings to older populations, nor can we infer how age-related changes might affect the underlying neural processes observed at the brain level.
Additionally, our analysis relied on a physical model to estimate the dipoles, incorporating spatio-temporal constraints to enhance the stability and reliability of the results. While this approach has been widely and successfully applied, determining the exact number of dipoles remains a challenge, which may introduce variability in the fitted solutions.
Lastly, we did not assess participants' familiarity with the stimuli or their personal significance, which may limit some of the deductions we have reported. Future studies should consider incorporating these factors to better understand their potential impact on neural and behavioral outcomes.

5. Conclusions

In conclusion, our study contributes to a more comprehensive understanding of the neural mechanisms involved in salt taste perception and offers new insights into the potential for KCl as a healthier alternative to NaCl. By focusing on brain activity, we have tried to clarify the role of specific neural circuits in the perception of salty taste, which may ultimately inform strategies for dietary interventions aimed at reducing sodium intake and improving public health outcomes.

Author Contributions

For research articles with several authors, a short paragraph specifying their individual contributions must be provided. The following statements should be used “Conceptualization, E.I., A.W-L, T.H.; methodology, E.I. and TH; formal analysis, E.I. and R.F.; data acquisition and subject recruitment R.F.; writing—original draft preparation, E.I.; writing—review and editing, T.H. and A.W.; visualization, E.I. All authors have read and agreed to the published version of the manuscript..

Funding

This research is supported by a grant from the Volkswagenstiftung within the project "Perceptronis"

Institutional Review Board Statement

The study was conducted in accordance with the Declaration of Helsinki, and approved by the Institutional Review Board (or Ethics Committee) of TU Dresden, Medizinische Fakultät (EK 286112008, 18.11.2008)

Informed Consent Statement

Informed consent was obtained from all subjects involved in the study.

Data Availability Statement

The data supporting the findings of this study are available from the corresponding author upon reasonable request. Access to the data may be subject to restrictions, such as the need for institutional approval or confidentiality agreements.

Acknowledgments

The study is supported a grant from the Volkswagenstiftung within the project "Perceptronis"

Conflicts of Interest

The authors declare no conflicts of interest.

References

  1. Aburto, N.J.; Ziolkovska, A.; et al. Effect of lower sodium intake on health: Systematic review and meta-analyses. BMJ 2013, 346, f1326. [Google Scholar] [CrossRef] [PubMed]
  2. Bermudez-Rattoni, F. Molecular mechanisms of taste-recognition memory. Nat. Rev. Neurosci. 2004, 5, 209–217. [Google Scholar] [CrossRef]
  3. Bermudez-Rattoni, F. The forgotten insular cortex: Its role on recognition memory formation. Neurobiol. Learn. Mem. 2014, 109, 207–216, (2001). "Mouse taste cells with glialike membrane properties." J Neurophysiol 85(4): 1552-1560.. [Google Scholar] [CrossRef] [PubMed]
  4. Bushara, K.; Hanakawa, T.; Immisch, I.; Toma, K.; Kansaku, K.; Hallett, M. Neural correlates of cross-modal binding. Nat. Neurosci. 2003, 6, 190–195. [Google Scholar] [CrossRef]
  5. Chikazoe, J.; Lee, D.H.; Kriegeskorte, N.; Anderson, A.K. Distinct representations of basic taste qualities in human gustatory cortex. Nature communications 2019, 10, 1048. [Google Scholar] [CrossRef] [PubMed]
  6. Craig, A.; Chen, K.; Bandy, D.; Reiman, E. Thermosensory activation of insular cortex. Nat. Neurosci. 2000, 3, 184–190. [Google Scholar] [CrossRef]
  7. Ezzati, M.; Lopez, A.D.; et al. Selected major risk factors and global and regional burden of disease. Lancet 2002, 360, 1347–1360. [Google Scholar] [CrossRef] [PubMed]
  8. Gal-Ben-Ari, S.; Rosenblum, K. Molecular mechanisms underlying memory consolidation of taste information in the cortex. Front. Behav. Neurosci. 2012, 5, 87. [Google Scholar] [CrossRef]
  9. Hooge, S.; Chambers, D. A comparison of basic taste modalities, using a descriptive analysis technique, for varying levels of sodium and KCl in two model soup systems. J Sens Stud 2010, 25, 521–35. [Google Scholar] [CrossRef]
  10. Ibanez, A.; Gleichgerrcht, E.; Manes, F. Clinical effects of insular damage in humans. Brain Struct. Funct. 2010, 214, 397–410. [Google Scholar] [CrossRef] [PubMed]
  11. Iannilli, E.; Gudziol, V. Gustatory pathway in humans: A review of models of taste perception and their potential lateralization. Journal of neuroscience research 2019, 97, 230–240. [Google Scholar] [CrossRef]
  12. Iannilli, E.; Singh, P.B.; Schuster, B.; Gerber, J.; Hummel, T. Taste laterality studied by means of umami and salt stimuli: An fMRI study. Neuroimage, 2012, 60, 426–435. [Google Scholar] [CrossRef] [PubMed]
  13. Iannilli, E. (2023). Electroencephalography and Gustatory Event-Related Potentials Measures to Oral Stimuli. In Basic Protocols on Emotions, Senses, and Foods (pp. 247-262). New York, NY: Springer US.
  14. Jacobson, M.F. 2005. Salt the forgotten killer. Washington, DC: Center for Science in the Public Interest, 27 p.
  15. Kearney, P.M.; Whelton, M.; et al. Global burden of hypertension: Analysis of worldwide data. Lancet 2005, 365, 217–223. [Google Scholar] [CrossRef] [PubMed]
  16. Kilcast, D.; Angus, F. 2007. Reducing salt in foods: Practical strategies. Woodhead Publishing in Food science, Technology and Nutrition, pp. 130–210.
  17. Li, N.; Prescott, J.; et al. The effects of a reduced-sodium, high-potassium salt substitute on food taste and acceptability in rural northern China. Br J Nutr 2009, 101, 1088–1093. [Google Scholar] [CrossRef] [PubMed]
  18. Mălîia, M.D.; Donos, C.; Barborica, A.; Popa, I.; Ciurea, J.; Cinatti, S.; Mîndruţă, I. Functional mapping and effective connectivity of the human operculum. Cortex 2018, 109, 303–321. [Google Scholar]
  19. Mazzola, L.; Royet, J.P.; Catenoix, H.; Montavont, A.; Isnard, J.; Mauguière, F. Gustatory and olfactory responses to stimulation of the human insula. Annals of neurology, 2017, 82, 360–370. [Google Scholar] [CrossRef] [PubMed]
  20. Oleszkiewicz, A.; Schriever, V.A.; Croy, I.; Haehner, A.; Hummel, T. Updated Sniffin’Sticks normative data based on an extended sample of 9139 subjects. European Archives of Oto-rhino-laryngology, 2019, 276, 719–728. [Google Scholar] [CrossRef]
  21. Pause, B.M.; Sojka, B.; Krauel, K.; Ferstl, R. The nature of the late positive complex within the olfactory event-related potential (OERP). Psychophysiology, 1996, 33, 376–384. [Google Scholar] [CrossRef]
  22. Pritchard, T.; Macaluso, D.; Eslinger, P. Taste perception in patients with insular cortex lesions. Behav. Neurosci. 1999, 113, 663–671. [Google Scholar] [CrossRef] [PubMed]
  23. Sacks, F.M.; Svetkey, L.P.; et al. Effects on blood pressure of reduced dietary sodium and the Dietary Approaches to Stop Hypertension (DASH) diet. DASH-Sodium Collaborative Research Group. N Engl J Med 2001, 344, 3–10. [Google Scholar] [CrossRef]
  24. Scherg, M.; Von Cramon, D. A new interpretation of the generators of BAEP waves I–V: Results of a spatio-temporal dipole model. Electroencephalography and Clinical Neurophysiology/Evoked Potentials Section, 1985, 62, 290–299. [Google Scholar] [CrossRef] [PubMed]
  25. Schuster, B.; Iannilli, E.; et al. Gustatory testing for clinicians. B-ENT 2009, 5 (Suppl 13), 109–113. [Google Scholar]
  26. Small, D.M. Taste representation in the human insula. Brain Structure and Function 2010, 214, 551–561. [Google Scholar] [CrossRef] [PubMed]
  27. Whelton, P.K.; He, J.; et al. Effects of oral potassium on blood pressure. Meta-analysis of randomized controlled clinical trials. JAMA 1997, 277, 1624–1632. [Google Scholar] [CrossRef]
Figure 3. Mean General Explained Variance (GEV) calculated by averaging the GEV for each map derived from fitting data at the single-subject level for each condition. The 11 topographies identified through microstate segmentation were fitted back to the single-subject ERP-EEG conditions and averaged for each map in each condition. The maps that were common across conditions—Maps 2, 3, and 5—accounted for the majority of the explained variance, with values of 68%, 69%, and 80% for KCl, the mixture (Mix), and NaCl (indicated in orange), respectively. When incorporating the maps unique to each condition, the mean GEV exceeded 90% of the total GEV. For KCl, Map 1 contributed 19%, while Map 8 contributed 16%. For the Mix condition, Map 9 contributed 12%, and Map 10 contributed 13%. Finally, for NaCl, Map 11 contributed 16%.
Preprints 141814 g003
Table 1.
Condition Map Talairach Microscopic Atlas
KCl M1 40 -20 16 Insula / Rolandic Operculum RPS38
M8 -48 38 2 Inferior Frontal Gyrus triangular part LAI371
4 58 -2 Medial Transverse Frontopolar Gyrus RAI 431
43 -27 22 Parietal Operculum RPS 171
Mixture M9 50 -60 19 Superior Temporal Gyrus RPS144
-48 31 14 Inferior Frontal Gyrus triangular part/ Medial Frontal Gyrus LAS624
M10 57 -16 22 Frontoparietal Operculum RAS52
24 57 3 Medial Transverse Frontopolar Gyrus RAI265
-48 38 2 Inferior Frontal Gyrus triangular part LAI 371
NaCl M11 51 5 16 Frontal Operculum RAS33
-45 2 42 Medial Frontal Gyrus LAS637
Disclaimer/Publisher’s Note: The statements, opinions and data contained in all publications are solely those of the individual author(s) and contributor(s) and not of MDPI and/or the editor(s). MDPI and/or the editor(s) disclaim responsibility for any injury to people or property resulting from any ideas, methods, instructions or products referred to in the content.
Copyright: This open access article is published under a Creative Commons CC BY 4.0 license, which permit the free download, distribution, and reuse, provided that the author and preprint are cited in any reuse.
Prerpints.org logo

Preprints.org is a free preprint server supported by MDPI in Basel, Switzerland.

Subscribe

Disclaimer

Terms of Use

Privacy Policy

Privacy Settings

© 2025 MDPI (Basel, Switzerland) unless otherwise stated