
Submitted:
03 December 2024
Posted:
04 December 2024
You are already at the latest version
Abstract
Silicon tetrafluoride (SiF4), being a toxic gas, contains abundant fluorine and silicon resources. However, at present, the extraction of these resources from SiF4 remains a significant challenge for current technologies. Microwave plasma emerges as a promising technology with considerable potential in this area. Nevertheless, the majority of research endeavors concentrate on the silicon production through microwave plasma treatment of SiF4, while the resultant tail gas, rich in fluorine resources, is neglected and subsequently wasted. In this paper, a low-pressure microwave plasma is employed to process SiF4 and H2 for the synthesis of hydrogen fluoride (HF). The microwave power reflection ratio, electron density, and produced HF concentration in varying microwave power levels and gas flow rates are obtained. The results demonstrate that all the processing parameters have a direct impact on the HF concentration. The maximum HF concentration of 11200 ppm is achieved under the specific condition: an H2 flow rate of 2.5 sccm, a SiF4 flow rate of 2 sccm, and a microwave power level of 1100 W. Notably, this condition also results in the lowest energy cost. This work presents fundamental process guidance for the production of HF using microwave plasma, facilitating the scalability of this technology in industry.
Keywords:
microwave plasma
; hydrogen fluoride production
; silicon tetrafluoride treatment
; low pressure
1. Introduction
The traditional process to prepare anhydrous hydrogen fluoride (AHF) is to react fluorite ore with sulfuric acid, and then to purify the gaseous hydrogen fluoride by multiple distillation and recrystallization [1]. This method is not only time-consuming and energy-intensive but also emits harmful gases, necessitating rigorous process management. Moreover, the raw material fluorite ore is a kind of scare and nonrenewable mineral resources [2]. Hence, this traditional method of producing AHF from fluorite ore bears the problems of unsustainability and environmental concerns [3]. In the phosphate fertilizer industry, fluorosilicic acid is produced as a byproduct during the preparation of phosphoric acid from phosphorus ore [4]. This acid, abundant in fluorine and silicon resources, is often regarded as industrial waste from the phosphate fertilizer industry [5]. However, it can also serve as a crucial raw material for the production of AHF [6]. The methods of producing AHF from fluorosilicic acid can be divided into direct methods and indirect methods. The direct methods include the direct pyrolysis of fluorosilicic acid and the decomposition of fluorosilicic acid by concentrated sulfuric acid [7,8]. These methods face the challenges of high energy consumption, limited AHF purity and emissions of the toxic gas silicon tetrafluoride. The indirect methods involve utilizing fluorosilicic acid to react with a metal or metal oxide to yield fluorosilicate, followed by the application of the direct method to produce AHF from the resultant fluorosilicate [9-11]. The indirect methods can improve the purity of AHF, but the handling process is complicated and they still bear the drawbacks of the direct methods.
During the process of preparing AHF from fluorosilicic acid, the toxic gaseous silicon tetrafluoride (SiF4) is generated as a byproduct. Noteworthily, this gas contains valuable fluorine and silicon resources that possess potential for recycling. This realization motivates us to explore the direct conversion of SiF4 into HF. As the fourth state of matter, the plasma is widely used in gas conversion applications, such as nitrogen fixation [12-14], CO2 conversion [15-17] and methane reforming [18-20]. The electron impact reactions within the plasma have the ability to transform gas molecules into atoms, ions, and radicals under gentle conditions (without the need for high temperatures or high pressures), thereby achieving the desired gas conversion. Due to this advantage, many scholars investigate the plasma treatment on SiF4. For example, Vodopyanov A. V. and colleagues studied for the first time the decomposition of SiF4 in electron cyclotron resonance (ECR) microwave plasma for the purpose of depositing silicon [21]. They utilized the mass-spectrometry method to measure the composition of the decomposition products of SiF4 as a function of various process parameters. Notably, they successfully obtained silicon films with excellent adhesion on both silicon and molybdenum wafers. Sennikov P. G. et al. used a radiofrequency (RF) discharge to convert SiF4 [22]. They achieved silicon deposition in an H2/SiF4 plasma, with a maximum silicon yield of 60% operated at a pressure of 0.2 Torr. Dornstetter J-C et al. also used RF plasma to grow silicon films from the dissociation of SiF4/H2/Ar gas mixtures [23]. By control the gas molar ratio, gas flow rate and RF power, the amorphous silicon could transfer into microcrystalline silicon. Gaiaschi S. et al. conducted research on the deposition of hydrogenated microcrystalline silicon–carbon alloy within a SiF4/CH4 plasma that was generated by RF power [24]. Their findings revealed that the RF power density, CH4 flow rate and the amount of SiF4 significantly influenced the microstructure of the resultant film. Kornev R. A. et al. developed a highly efficient inductively coupled plasma (ICP) method for obtaining silicon from SiF4 in the presence of argon [25]. This method achieved a silicon production rate of 0.9 g/h with an energy cost of 0.56 kWh/g.
All the aforementioned investigations have exhibited that SiF4 can be dissociated within the plasma, ultimately yielding the valuable product silicon under appropriate process parameters. However, most of these investigations primarily focus on obtaining the solid silicon from SiF4 using RF plasma, with a lack of reports detailing the conversion of SiF4 into HF. Therefore, this paper presents an experimental investigation on producing HF from SiF4 using microwave plasma. On the one hand, microwave plasma has the advantages of being electrodeless, possessing high electron density and electron energy, and having long lifespan compared to RF plasma. On the other hand, the HF product is valuable for industrial applications due to its expanding utilities across diverse sectors such as fluororubbers [26], pharmaceuticals [27], aerospace [28], semiconductors [29], fuels [30], and fluorocarbons [31].
2. Materials and Methods
2.1. Experimental Setup
A 2.45 GHz microwave plasma system based on the WR-430 waveguide was built for the HF production from SiF4 in this paper. The experimental system comprised four components: microwave transmission, gas intake, vacuum pumping, and gas composition measurement. Figure 1 shows the schematic and photograph of the system. The microwave was generated by a microwave power supply based on a magnetron (2M265, MUEGGE, Reichelsheim, Germany) cooled by water. The center frequency and maximum output power of the magnetron were 2.45 GHz and 3 kW, respectively. The circulator (MPWG22CIA01, Mapingtec, Chengdu, China) acted as the magnetron protection device, ensuring that the reflected power was absorbed by the water load (MPWG22WLA01, Mapingtec, Chengdu, China). The bi-directional coupler (MPWG22CPA01, Mapingtec, Chengdu, China) coupled the incident and reflected microwave power which was then measured by the microwave power meter (KC9532, Measall Technology, Chengdu, China). The three-stub tuner (MPWG22THTA01P10KW, Mapingtec, Chengdu, China) was used to adjust the impedance match between the plasma and the WR-430 waveguide system. The electric field was concentrated within the tapered waveguide where the plasma was generated. The specific dimensions of this tapered waveguide have been detailed in our previous research [32].
The working gas used in this paper consisted of SiF4 and H2, both of which were stored in the gas cylinder and introduced into the discharge area of the tapered waveguide in a swirling motion. The gas flow rate was controlled by the mass flow controller (MFC, KT-C4Z, Ketanyiqi, Zhengzhou, China) with a range from 0 to 5 standard cubic centimeter per minute (sccm). Since the entire experiment needed to be conducted under a low pressure at about 0.7 atmospheres, a vacuum pump (FUJ-V3, Fujiwara, Taizhou, China) capable of achieving a vacuum up to 0.3 atmospheres was used and connected to the vacuum pipeline. The output gas was measured by the gas analyzer capable of detecting HF concentrations within a range of 0 to 10,000 parts per million (ppm). This device necessitated that the gas being measured be maintained at room temperature; hence, a vacuum pipeline equipped with water cooling was utilized to chill the output gas.
2.2. Electron Density Measurement
The electron density can influence the electron-neutral particle impact reaction rate in the plasma, thereby affecting the gas conversion rate. This parameter depends on both the gas flow rate and gas composition. Therefore, this paper measured the electron density of the microwave plasma under different gas flow rates and gas compositions to analyze its effect on the production of HF. The measurement method in [32] was adopted to determine the electron density of the microwave plasma in this paper. The microwave power reflection ratio in the experiment was obtained initially, which was defined by the following formula:
where Pre and Pin represent the reflected and incident microwave power, respectively; |S11| refers to the S parameter calculated by the simulation of microwave-plasma interaction. The governing equation of this simulation is written as the Helmholtz equation,
where μr indicates the permeability; E denotes the electric field vector; ω is the angular frequency of microwave; c0 is the light speed; εp refers to the relative complex permittivity of the plasma which can be derived as the Appleton formula [33],
where ωp is the plasma angular frequency with ωp = [ne∙e2/(ε0∙me)]1/2, here ne denotes the electron density and me refers to the electron mass; υm refers to the electron-neutral particle collision frequency; ωco represents the combination frequency which can be derived as follows:
From the above equations, the electron density ne determines the relative complex permittivity of the plasma. Here, a Gaussian model is assumed to describe the electron density distribution which is written as
where Ne indicates the maximum electron density number; ar and a(z) are radial and axial fitting parameters, respectively, for adjusting the spatial electron density profile; r0 and h0 are the radial and axial coordinates of the plasma core in cylindrical coordinates, respectively; Rp is the radius of plasma and Lp is the plasma length; The fitting parameter a(z) is a function of z-axis written as
where az1 and az2 are used to adjust the lower and upper axial electron density profile, respectively; ∆h is the small step size in the z-axis direction with ∆h = 0.01 mm.
Figure 2 shows the calculation domain of the microwave-plasma interaction. In Figure 2(a), microwaves were incident from the left port of the waveguide (labeling as boundary AB in Figure 2(c)) and transmitted through the tapered waveguide into the quartz tube for the purpose of generating discharges. Two metal sleeves EFLM and GHNO were surrounding the quartz tube to prevent the microwave power leakage. Figure 2(b) shows a normalized electron density distribution derived from the above Gaussian model. The boundary conditions for both the waveguide wall and metal sleeve wall were designated as perfect electric conductors (PECs), as specified by
where n is the unit normal vector perpendicular to the boundary. The top and bottom boundaries of the quartz tube IK and JP were assigned as the scattering boundary conditions (SBCs), as expressed in
where k0 is the wave number in vacuum. The materials and boundary conditions for the pertinent domain are listed in Table 1.
The commercial software COMSOL Multiphysics was utilized to perform the microwave-plasma interaction simulation. Free tetrahedral meshes were generated for the calculation domain, resulting in a total of 683,846 meshes and 10,820,613 unknowns in the simulation. The computing platform was a workstation with the CPU of Intel (R) Core (TM) CPU i5-12400 @ 2.5 GHz and RAM of 128 GHz based on the 64-bit Windows 10 operating system.
3. Results and Discussion
During the experimental process, the pressure in the discharge area was initially fixed at approximately 0.68 atmospheres using a vacuum pump, prior to plasma ignition. Subsequently, the H2 was introduced into the quartz tube, and the microwave power supply was activated to excite the plasma. Once the plasma was ignited, the SiF4 was introduced into the quartz tube for conversion. The incident and reflected power values were recorded to calculate the power reflection ratio, which was then used to obtain the plasma electron density based on the method described in Section 2.2. Therewith, the output HF was measured at the outlet of the vacuum pump. In this work, the microwave power range varied from 400 W to 1100 W, and the flow rate of SiF4 ranged from 0.2 sccm to 2 sccm. The H2 flow rate varied at four levels: 1 sccm, 1.5 sccm, 2.0 sccm, and 2.5 sccm.
3.1. Power Reflection Ratio and Electron Density
Figure 3 illustrates the microwave power refection ratio and the corresponding electron density as they vary with the flow rates of SiF4 and H2. At the microwave power of 400 W, the H2 flow rate must not exceed 1.5 sccm in order to guarantee the ignition of plasma. At other microwave power levels, the H2 flow rate can be set up to 2.5 sccm. There exists a notable negative correlation between the power reflection ratio and electron density when they are compared. That means a high power reflection ratio corresponds to a low electron density. The flow rates of SiF4 and H2 induce merely minor fluctuations in the power reflection ratio and electron density, and as the microwave power increases, these fluctuations progressively diminish. This is attributable to the fact that the plasma morphology and electron density remain relatively unaffected by the low gas flow rate in low-pressure environments [33]. At the microwave power level of 400 W, the power reflection ratio reaches its maximum value at about 0.6. The corresponding electron density is as low as about 1.5×10¹⁸ m-3. As the microwave power increases gradually to 1100 W, the power reflection ratio will decrease to around 0.2, and the electron density reaches up to 11.5×10¹⁸ m-3. These results indicate that increasing the microwave power can enhance the absorption of microwave power by the plasma, because the volume of the plasma is directly proportional to the microwave power it absorbs, meaning that a larger plasma volume results in higher microwave power absorption [32]. As the microwave power is increased from 400 W to 670 W, the power reflection ratio undergoes a notable decrement, dropping from 0.6 to approximately 0.2. Subsequently, further augmentation of the microwave power results in the power reflection ratio remaining virtually stable. This result demonstrates that as the microwave power rises to 670W or higher, the dielectric properties of the plasma will become stabilized.
3.2. HF Production
The measured HF concentrations of the output gases under different microwave power levels are shown in Figure 4. It is known that the concentration of the produced HF depends on the feeding gas flow rates and the microwave power. At 400 W, the HF concentration decreases with the SiF4 flow rate but increases with the H2 flow rate. Moreover, the decrement rate of HF concentration with the SiF4 flow rate is larger when the H2 flow rate is set to 1 sccm compared to when it is set to 1.5 sccm. Increasing the microwave power to either 510 W or 670 W does not change this trend; however, it results in a higher HF concentration and a smaller decrement rate. Additionally, the decrement rate of HF concentration remains nearly consistent across various H2 flow rates. At a microwave power level of 820 W, the HF concentrations under different H2 flow rates remain relatively stable with varying SiF4 flow rates. As the microwave power increases to 1100 W, the HF concentrations across varying H2 flow rates gradually increase with the SiF4 flow rate, achieving a maximum concentration of approximately 11200 ppm at an H2 flow rate of 2.5 sccm and a SiF4 flow rate of 2 sccm.
It is reasonable that the increment in microwave power leads to an increment in HF concentration, because at a constant gas volume, an increment in the energy obtained per unit volume of the input gas leads to a more vigorous plasma impact reaction and a higher probability of SiF4 and H2 conversion to HF. This can be quantified by the specific energy input (SEI) written as
where P is the input microwave power.
The key reaction pathway of the conversion process of SiF4 and H2 into HF is analyzed herein to facilitate a deeper understanding of the HF concentration curves presented in Figure 4. The dissociation of H2 into H atoms within the plasma can be summarized in one reaction formula as:
where the dissociation energy is 4.5 eV. In low-pressure plasma, this reaction can occur with a reduced energy of 3 eV [25]. The dissociation process of SiF4 in the plasma is more complex than that of H2, its reaction formulas are shown as follows [34]:
Obviously, the dissociation of SiF4 needs more energy compared to that of H2. The generated H atom and F atom can be combined to form HF molecules as [35]:
In the gas conversion process, H2 is firstly dissociated in the plasma following by the dissociation of SiF4 because H2 is initially introduced in the discharge area to form plasma. From Equation (10) to (15) we can deduce that, upon ignition of the H2 plasma, almost all the H2 molecules involved in the reaction can be dissociated into H atoms due to the low dissociation energy. Consequently, this results in the production of a greater number of H atoms compared to F atoms. In this case, if the microwave power remains at a low level and keeps constant, an increment in the SiF4 flow rate will lead to a reduction in the SEI, which will impede the dissociation of a significant portion of SiF4 into F atoms. Therefore, the produced HF concentration drops with the SiF4 gas flow rate as illustrated in Figure 4(a) through 4(c). When the microwave is at a high level, such as 820 W or 1100 W, the SEI is high enough to guarantee the dissociation of SiF4 in high gas flow rates. As a result, increasing the SiF4 flow rates can increase slightly the produced HF concentrations as evidenced by the trends depicted in Figure 4(d) and 4(e).
3.3. Energy Cost
The energy cost (EC) for producing HF by microwave plasma can be calculated by the following formula [36]
where SEI is derived from Equation (9), Vmol represents the molar volume of ideal gas at room temperature and the pressure of 0.68 atmospheres with Vmol = 35.37 L/mol [14]. Based on the measured results in Figure 4 and Equation (16), the EC under different microwave power and gas flow rates are calculated as presented in Figure 5. Comparing Figure 5(a) through 5(e), it is observed that the EC decreases with the H2 flow rate. With the exception of the specific condition where the microwave power is set to 400 W and the H2 flow rate is maintained at 1 sccm, the EC will also drop down with the SiF4 flow rate. This is attributed to the low HF production in this condition. However, it is worth noting that the rate of decrement in EC with the SiF4 flow rate slows down when the H2 flow rate increases in different microwave power levels. Furthermore, when the H2 flow rate exceeds 1.5 sccm, an increment in microwave power can result in a decrement in EC, regardless of the SiF4 flow rate.
The EC value for producing HF in this paper is three orders of magnitude (in units of GJ/mol) greater than that reported in other gas conversion applications utilizing plasma (in units of MJ/mol) [12-20]. This discrepancy arises because the gas flow rate employed here (in units of sccm) is three orders of magnitude lower than in those applications (in units of slm). Our future endeavor will be to enhance the gas processing capacity using low-pressure microwave plasmas. The lowest EC of 46.3 GJ/mol is attained with a microwave power setting of 1100 W and flow rates of 2.5 sccm for H2 and 2 sccm for SiF4, respectively. This is also the condition of achieving the maximum HF concentration as depicted in Figure 4(e).
4. Conclusions
In this paper, a low-pressure microwave plasma was utilized to produce HF from SiF4 and H2 mixtures. An experimental system was built up to study the process parameters influencing the HF production. In the experiments, the microwave power reflection ratio and electron density under different microwave power levels and SiF4 and H2 flow rates were acquired. The results revealed that as the microwave power level increased, the power reflection ratio decreased, whereas the electron density increased. The flow rates of SiF4 and H2 had merely minimal impact on both the power reflection ratio and electron density. The HF production was also measured in different process conditions. The results demonstrated that, on the one hand, the increment of the microwave power or H2 flow rate could improve the produced HF concentration. On the other hand, at low microwave power levels ranging from 400 W to 700 W, the HF concentration decreased with the SiF4 flow rate. Conversely, when the microwave power was above 800 W, the HF concentration slowly increased with the SiF4 flow rate. The highest HF concentration achieved in this paper was 11200 ppm, which was obtained at the microwave power of 1100 W and flow rates of 2.5 sccm for H2 and 2 sccm for SiF4, respectively. Notably, the energy cost at this condition was also the lowest among all the process conditions, which was 46.3 GJ/mol. This work proposes an experimental investigation on the HF production by microwave plasma processing. However, the experimental parameters, particularly the SiF4 and H2 flow rates, are still at the laboratory scale. Further research is needed to enhance the gas processing capacity for the potential application of this method at an industrial scale.
Author Contributions
Conceptualization, S.L. and W.X.; methodology, G.L. and W.X.; software, H.Z.; validation, L.S. and W.X.; formal analysis, S.L.; investigation, G.L. and W.X.; resources, L.S; data curation, H.Z.; writing—original draft preparation, W.X.; writing—review and editing, S.L.; visualization, G.L.; supervision, S.L.; project administration, L.S.; funding acquisition, W.X. All authors have read and agreed to the published version of the manuscript.
Funding
This research was funded by the Postdoctoral project of the State Key Laboratory of Efficient Utilization for Low Grade Phosphate Rock and Its Associated Resources of Wengfu Group with grant number of YF(2023)018 .
Data Availability Statement
The original contributions presented in the study are included in the article, further inquiries can be directed to the corresponding author.
Conflicts of Interest
The authors declare no conflicts of interest.
References
- Patel, C.; André-Joyaux, E. ; Leitch, J. A.; De Irujo-Labalde, X. M.; Ibba, F.; Struijs, J.; et al. Fluorochemicals from fluorspar via a phosphate-enabled mechanochemical process that bypasses HF. Science. 2023, 381, 302–306. [Google Scholar] [CrossRef] [PubMed]
- Gao, Z. Y.; Wang, C.; Sun, W.; Gao, Y. S.; Kowalczuk, P. B. Froth flotation of fluorite: a review. Adv. Colloid Interface Sci. 2021, 290, 102382. [Google Scholar] [CrossRef]
- Huang, J. W.; Zhang, Q. W.; Li, H. C.; Wang, C. Difficulties and recent achievements in flotation separation of fluorite from calcite-an overview. Minerals. 2022, 12, 957. [Google Scholar] [CrossRef]
- Dahlke, T.; Ruffiner, O.; Cant, R. Production of HF from H2SiF6. Procedia Eng. 2016, 138, 231–239. [Google Scholar] [CrossRef]
- Joshi, A. N. A review of processes for separation and utilization of fluorine from phosphoric acid and phosphate fertilizers. Chem. Pap. 2022, 76, 6033–6045. [Google Scholar] [CrossRef]
- Yang, H.; Li, S.; Yu, H.; Liu, H.; Sun, K.; Chen, X. Production of anhydrous hydrogen fluoride from fluorosilicic acid: a review. Front. Chem. 2022, 12, 1372981. [Google Scholar] [CrossRef] [PubMed]
- Reed, R. S. Production of high purity hydrogen fluoride from silicon tetrafluoride. U. S. Pat. Appl. 1997, US4036938. [Google Scholar]
- AMani, K.; and Chland, A. F. Process for the recovery of anhydrous hydrogen fluoride from aqueous solutions of fluo-silicic acid and hydrogen fluoride. U. S. Pat. Appl. 1983, US4389293. [Google Scholar]
- Hao, J. Study on producing anhydrous hydrogen fluoride by fluorosilicic acid and magnesium oxide and combined production of high quality magnesium sulfate. Inorg. Chem. Ind. 2019, 51, 40–43. [Google Scholar]
- Zhao, C.; Xiao, F.; Wang, Z. Research progress in the preparation of hydrofluoric acid from fluorosilicic acid. Organo- Fluor. Ind. 2020, 3, 32–38. [Google Scholar]
- Zhang, Y. Process technology and research progress of hydrofluoric acid production from by- product fluosilicic acid in phosphate rock processing. Henan Chem. Ind. 2023, 40, 12–15. [Google Scholar]
- Patil B., S.; Cherkasov, N.; Lang, J.; Ibhadon A., L.; Hessel, V.; Wang, Q. Low temperature plasma-catalytic NOx synthesis in a packed DBD reactor: Effect of support materials and supported active metal oxides. Appl. Catal. B-Environ. 2016, 194, 123–133. [Google Scholar] [CrossRef]
- Pei X., K.; Gidon, D.; Yang, Y.-J.; Xiong Z., L. Graves D. B.; Reducing energy cost of NOx production in air plasmas. Chem. Eng. J. 2019, 362, 217–228. [Google Scholar] [CrossRef]
- Kelly, S.; and Bogaerts, A. Nitrogen fixation in an electrode-free microwave plasma. Joule 2021, 5, 3006–3030. [Google Scholar] [CrossRef]
- Snoeckx, R.; and Bogaerts, A. Plasma technology–a novel solution for CO2 conversion? Chem. Soc. Rev. 2017, 46, 5805–5863. [Google Scholar] [CrossRef] [PubMed]
- Hecimovic, A.; D’Isa F., A.; Carbone, E.; Fantz, U. Enhancement of CO2 conversion in microwave plasmas using a nozzle in the effluent. J. CO2 Util. 2022, 57, 101870. [Google Scholar] [CrossRef]
- Wu, Y.; Li S., Z.; Niu Y., L.; Yan H., J.; Yang D., Z.; Zhang J., L. Experimental investigation of CO2 conversion in Boudouard reaction driven by an atmospheric-pressure microwave plasma torch. J. Phys. D: Appl. Phys. 2023, 56, 065201. [Google Scholar] [CrossRef]
- Liu J., L.; Snoeckx, R.; Cha M., S. ; Steam reforming of methane in a temperature-controlled dielectric barrier discharge reactor: the role of electron-induced chemistry versus thermochemistry. J. Phys. D: Appl. Phys. 2018, 51, 385201. [Google Scholar] [CrossRef]
- Tao X., M.; Yang, C.; Huang, L.; et al. , DBD plasma combined with catalysts derived from NiMgAlCe hydrotalcite for CO2 reforming of CH4. Mater. Chem. Phys. 2020, 250, 123118. [Google Scholar] [CrossRef]
- Akande, O.; Lee, B. Plasma steam methane reforming (PSMR) using a microwave torch for commercial-scale distributed hydrogen production. Int. J. Hydrogen Energ. 2022, 47, 2874–2884. [Google Scholar] [CrossRef]
- Vodopyanov A., V.; Golubev S., V.; Mansfeld D., A.; Sennikov P., G.; Drozdov Y., N. Experimental investigations of silicon tetrafluoride decomposition in ECR discharge plasma. Rev. Sci. Instrum. 2011, 82, 063503. [Google Scholar] [CrossRef] [PubMed]
- Sennikov P., G.; Golubev S., V.; Kornev R., A.; Mochalov L., A.; Shilaev A., A. A Study of Silicon Tetrafluoride Reduction with Hydrogen in Radiofrequency Discharge. High Energ. Chem. 2014, 48, 49–53. [Google Scholar] [CrossRef]
- Dornstetter J-C. ; Bruneau B.; Bulkin P.; Johnson E. V.; Cabarrocas P. R. Understanding the amorphous-to-microcrystalline silicon transition in SiF4/H2/Ar gas mixtures. J. Chem. Phys. 2014, 140, 234706. [Google Scholar] [CrossRef] [PubMed]
- Gaiaschi, J.; Ruggeri, R.; Gueunier-Farret, M.-E.; Johnson E., V. Use of radio frequency power, silicon tetrafluoride and methane as parameters to tune structural properties of hydrogenated microcrystalline silicon carbon alloys. J. Phys. D: Appl. Phys. 2014, 47, 455102. [Google Scholar] [CrossRef]
- Kornev R., A.; Gornushkin I., B.; Nazarov V., V.; Shkrunin V., E.; Ermakov A., A. Features of hydrogen reduction of SiF4 in ICP plasma. Spectrochim. Acta B. 2022, 195, 106502. [Google Scholar] [CrossRef]
- Manteau, B.; Pazenok, S.; Vors, J.-P.; Leroux, F. R. New trends in the chemistry of α-fluorinated ethers, thioethers, amines and phosphines. J. Fluor. Chem. 2010, 131, 140–158. [Google Scholar] [CrossRef]
- Gardiner, J. Fluoropolymers: origin, production, and industrial and commercial applications. Aust. J. Chem. 2015, 68, 13–22. [Google Scholar] [CrossRef]
- Uhlenhake K., E.; Yehia O., R.; Noel, A.; Terry B., C.; Örnek, M.; Belal H., M.; et al. On the use of fluorine-containing nano-aluminum composite particles to tailor composite solid rocket propellants. Propellants, Explos. Pyrotech. 2022, 47, e202100370. [Google Scholar] [CrossRef]
- Steinert, M.; Acker, J.; Henbge, A.; Wetzig, K. Experimental studies on the mechanism of wet chemical etching of silicon in HF/HNO3 mixtures. J. Electrochem. Soc. 2005, 152, C843. [Google Scholar] [CrossRef]
- De Klerk, A.; and De Vaal P., L. Alkylate technology selection for Fischer-Tropsch syncrude refining. Industrial Eng. Chem. Res. 2008, 47, 6870–6877. [Google Scholar] [CrossRef]
- Sicard A., J.; and Baker R., T. Fluorocarbon refrigerants and their syntheses: past to present. Chem. Rev. 2020, 120, 9164–9303. [Google Scholar] [CrossRef]
- Xiao, W.; Liao Y., H.; Wang F., X.; Zhang Z., P.; Zhu H., C.; Yang, Y.; Huang K., M. Determining Electron Density of Atmospheric Microwave Air Plasma Torch by Microwave Power Measurement. IEEE Trans. Plasma. Sci. 2022, 50, 1781–1789. [Google Scholar] [CrossRef]
- Kim J., H.; Kim Y., C.; Chung C., W. Experimental investigation on plasma parameter profiles on a wafer level with reactor gap lengths in an inductively coupled plasma. Phys. Plasmas. 2015, 22, 073502. [Google Scholar] [CrossRef]
- Mutsukura, N.; Ohuchi, M.; Satoh, S.; Machi, Y. ; The analyses of an SiF4 plasma in an RF glow discharge for preparing fluorinated amorphous silicon thin films. Thin solid films. 1983, 109, 47–57. [Google Scholar] [CrossRef]
- Okada, Y.; Chen, J.; Campbell I., H.; Fauchet P., M.; Wagner, S. ; Mechanism of the growth of amorphous and microcrystalline silicon from silicon tetrafluoride and hydrogen. J. Appl. Phys. 1990, 67, 1757–1760. [Google Scholar] [CrossRef]
- Wu S., K.; Liao Y., H.; Feng, K.; Zheng, F.; Xiao, W. ; Nitrogen fixation by atmospheric microwave plasma with local electric field enhancement. J. Phys. D: Appl. Phys. 2025, 58, 015205. [Google Scholar] [CrossRef]
Figure 1.
Microwave plasma experimental system for HF generation. (a) Schematic. (b) Photograph.
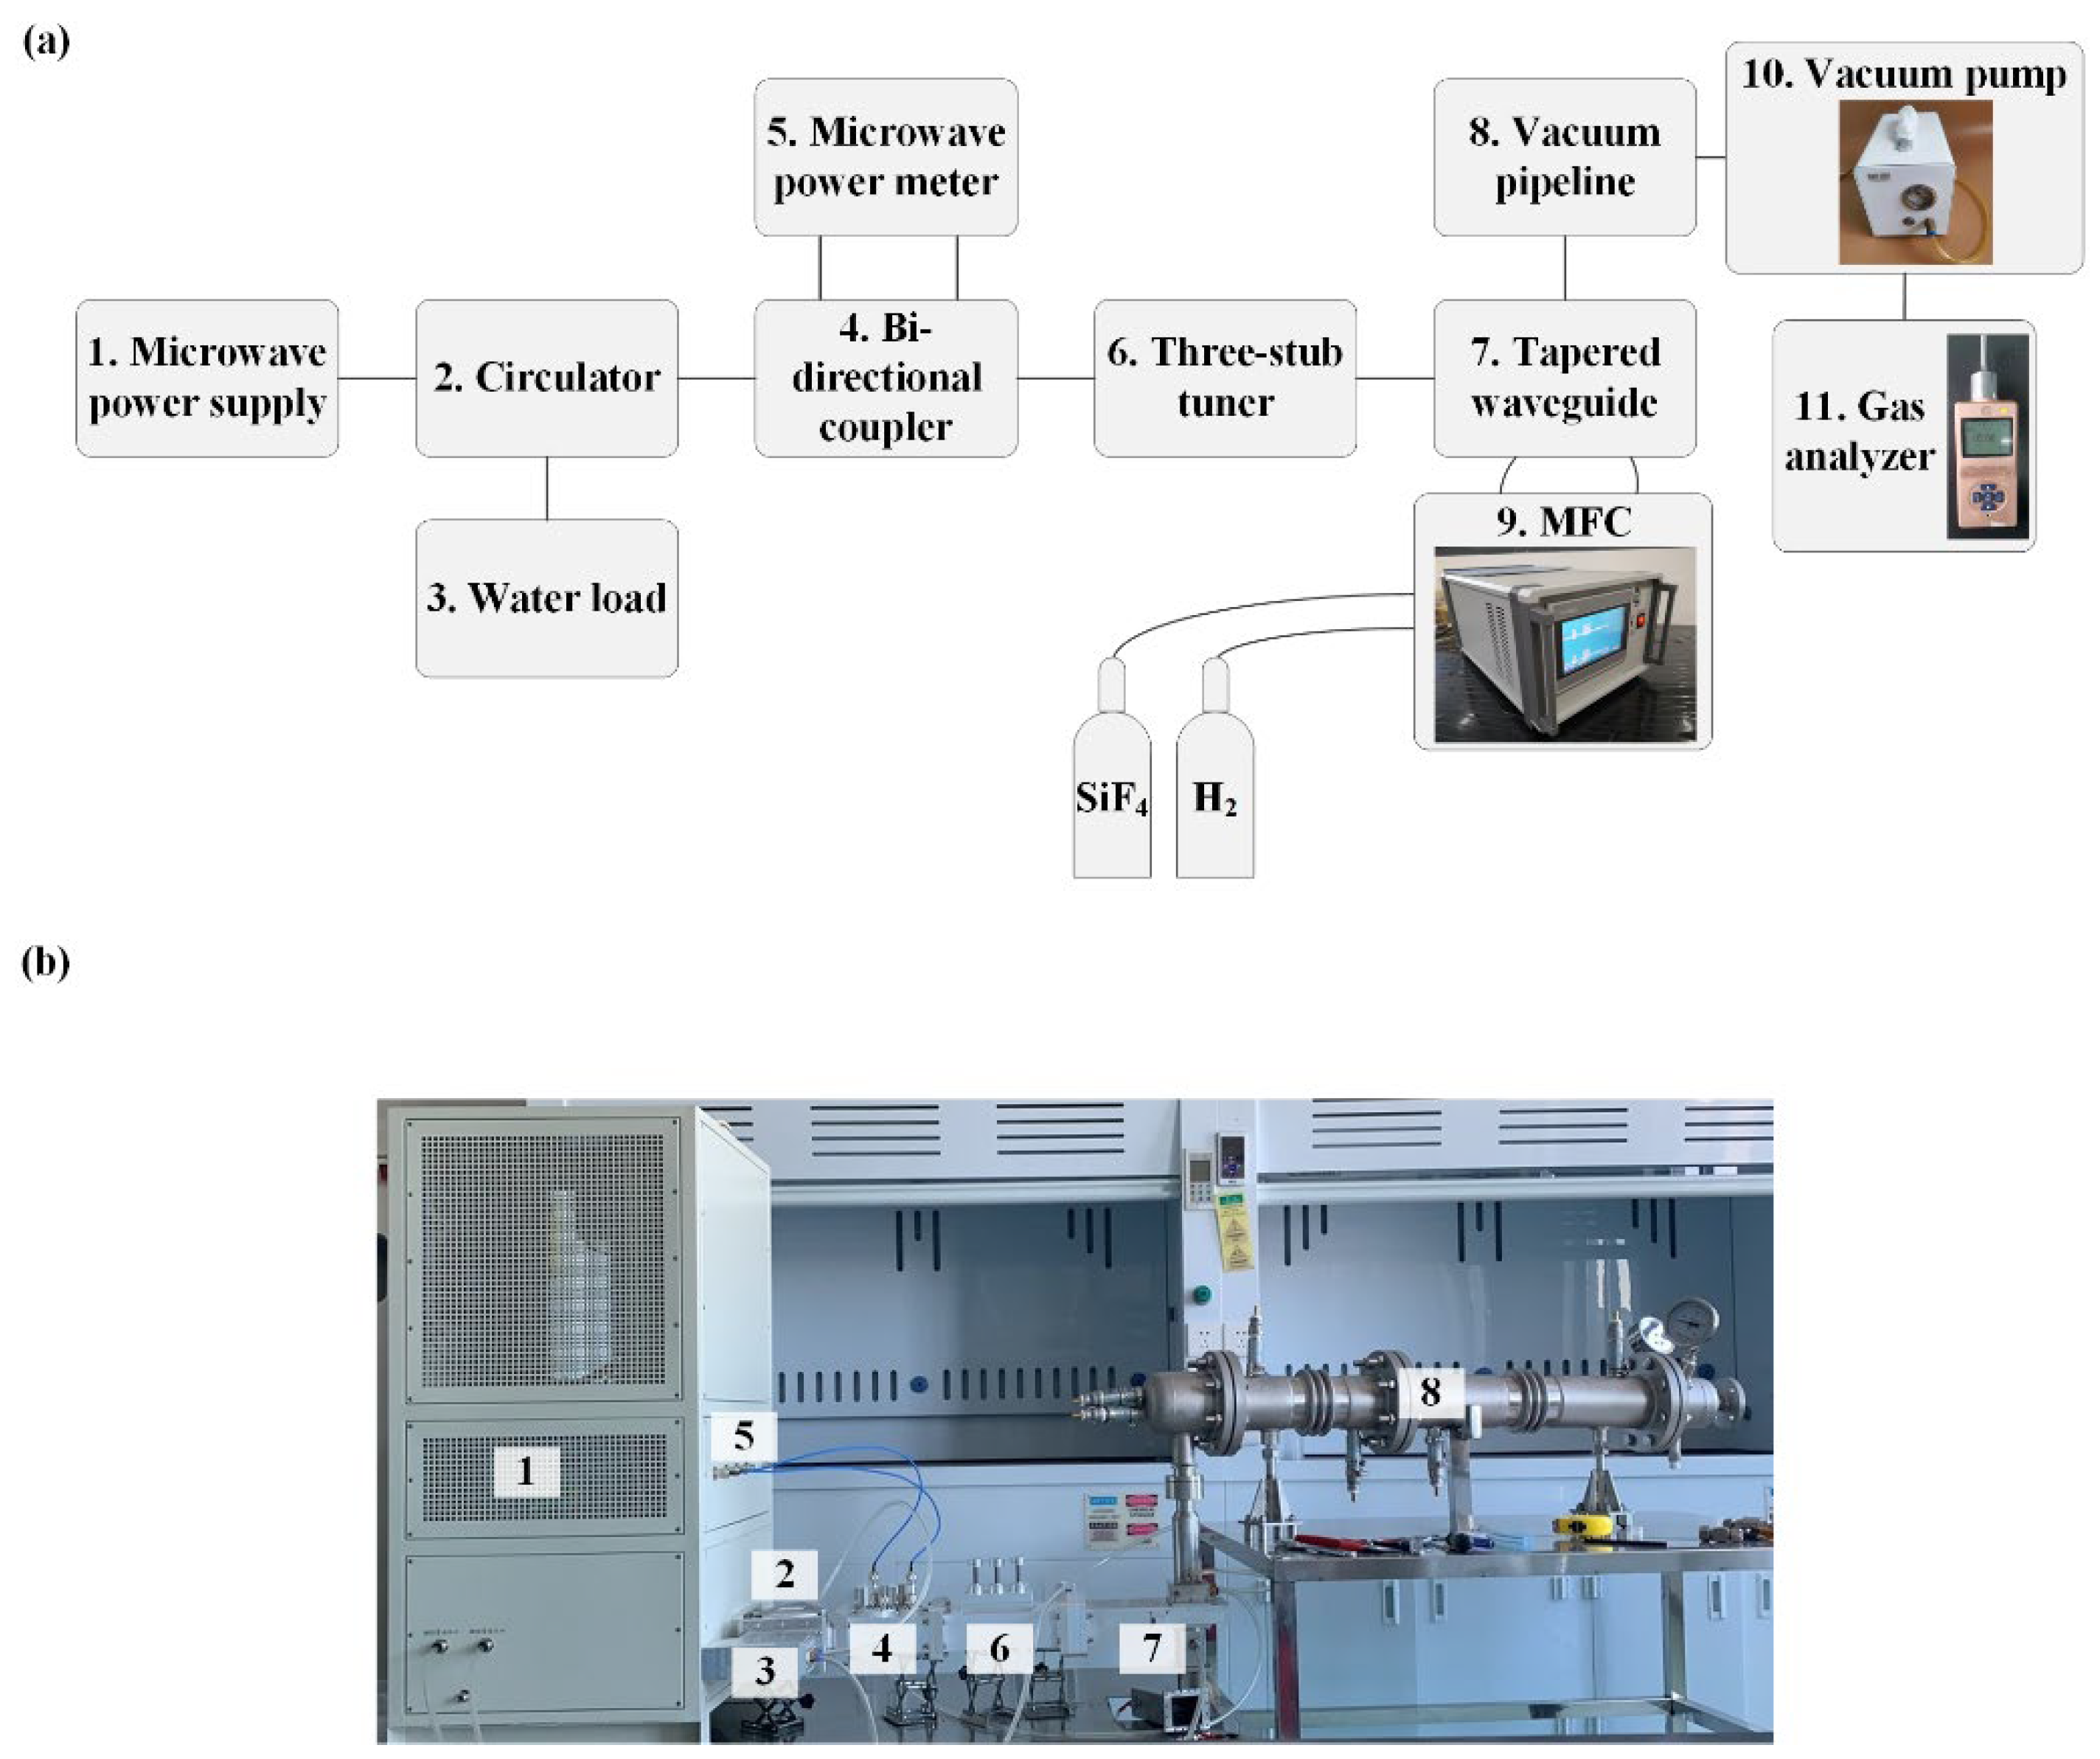
Figure 2.
Schematic of (a) 3D domain of the microwave-plasma interaction, (b) electron density distribution model, and (c) boundaries.
Figure 2.
Schematic of (a) 3D domain of the microwave-plasma interaction, (b) electron density distribution model, and (c) boundaries.
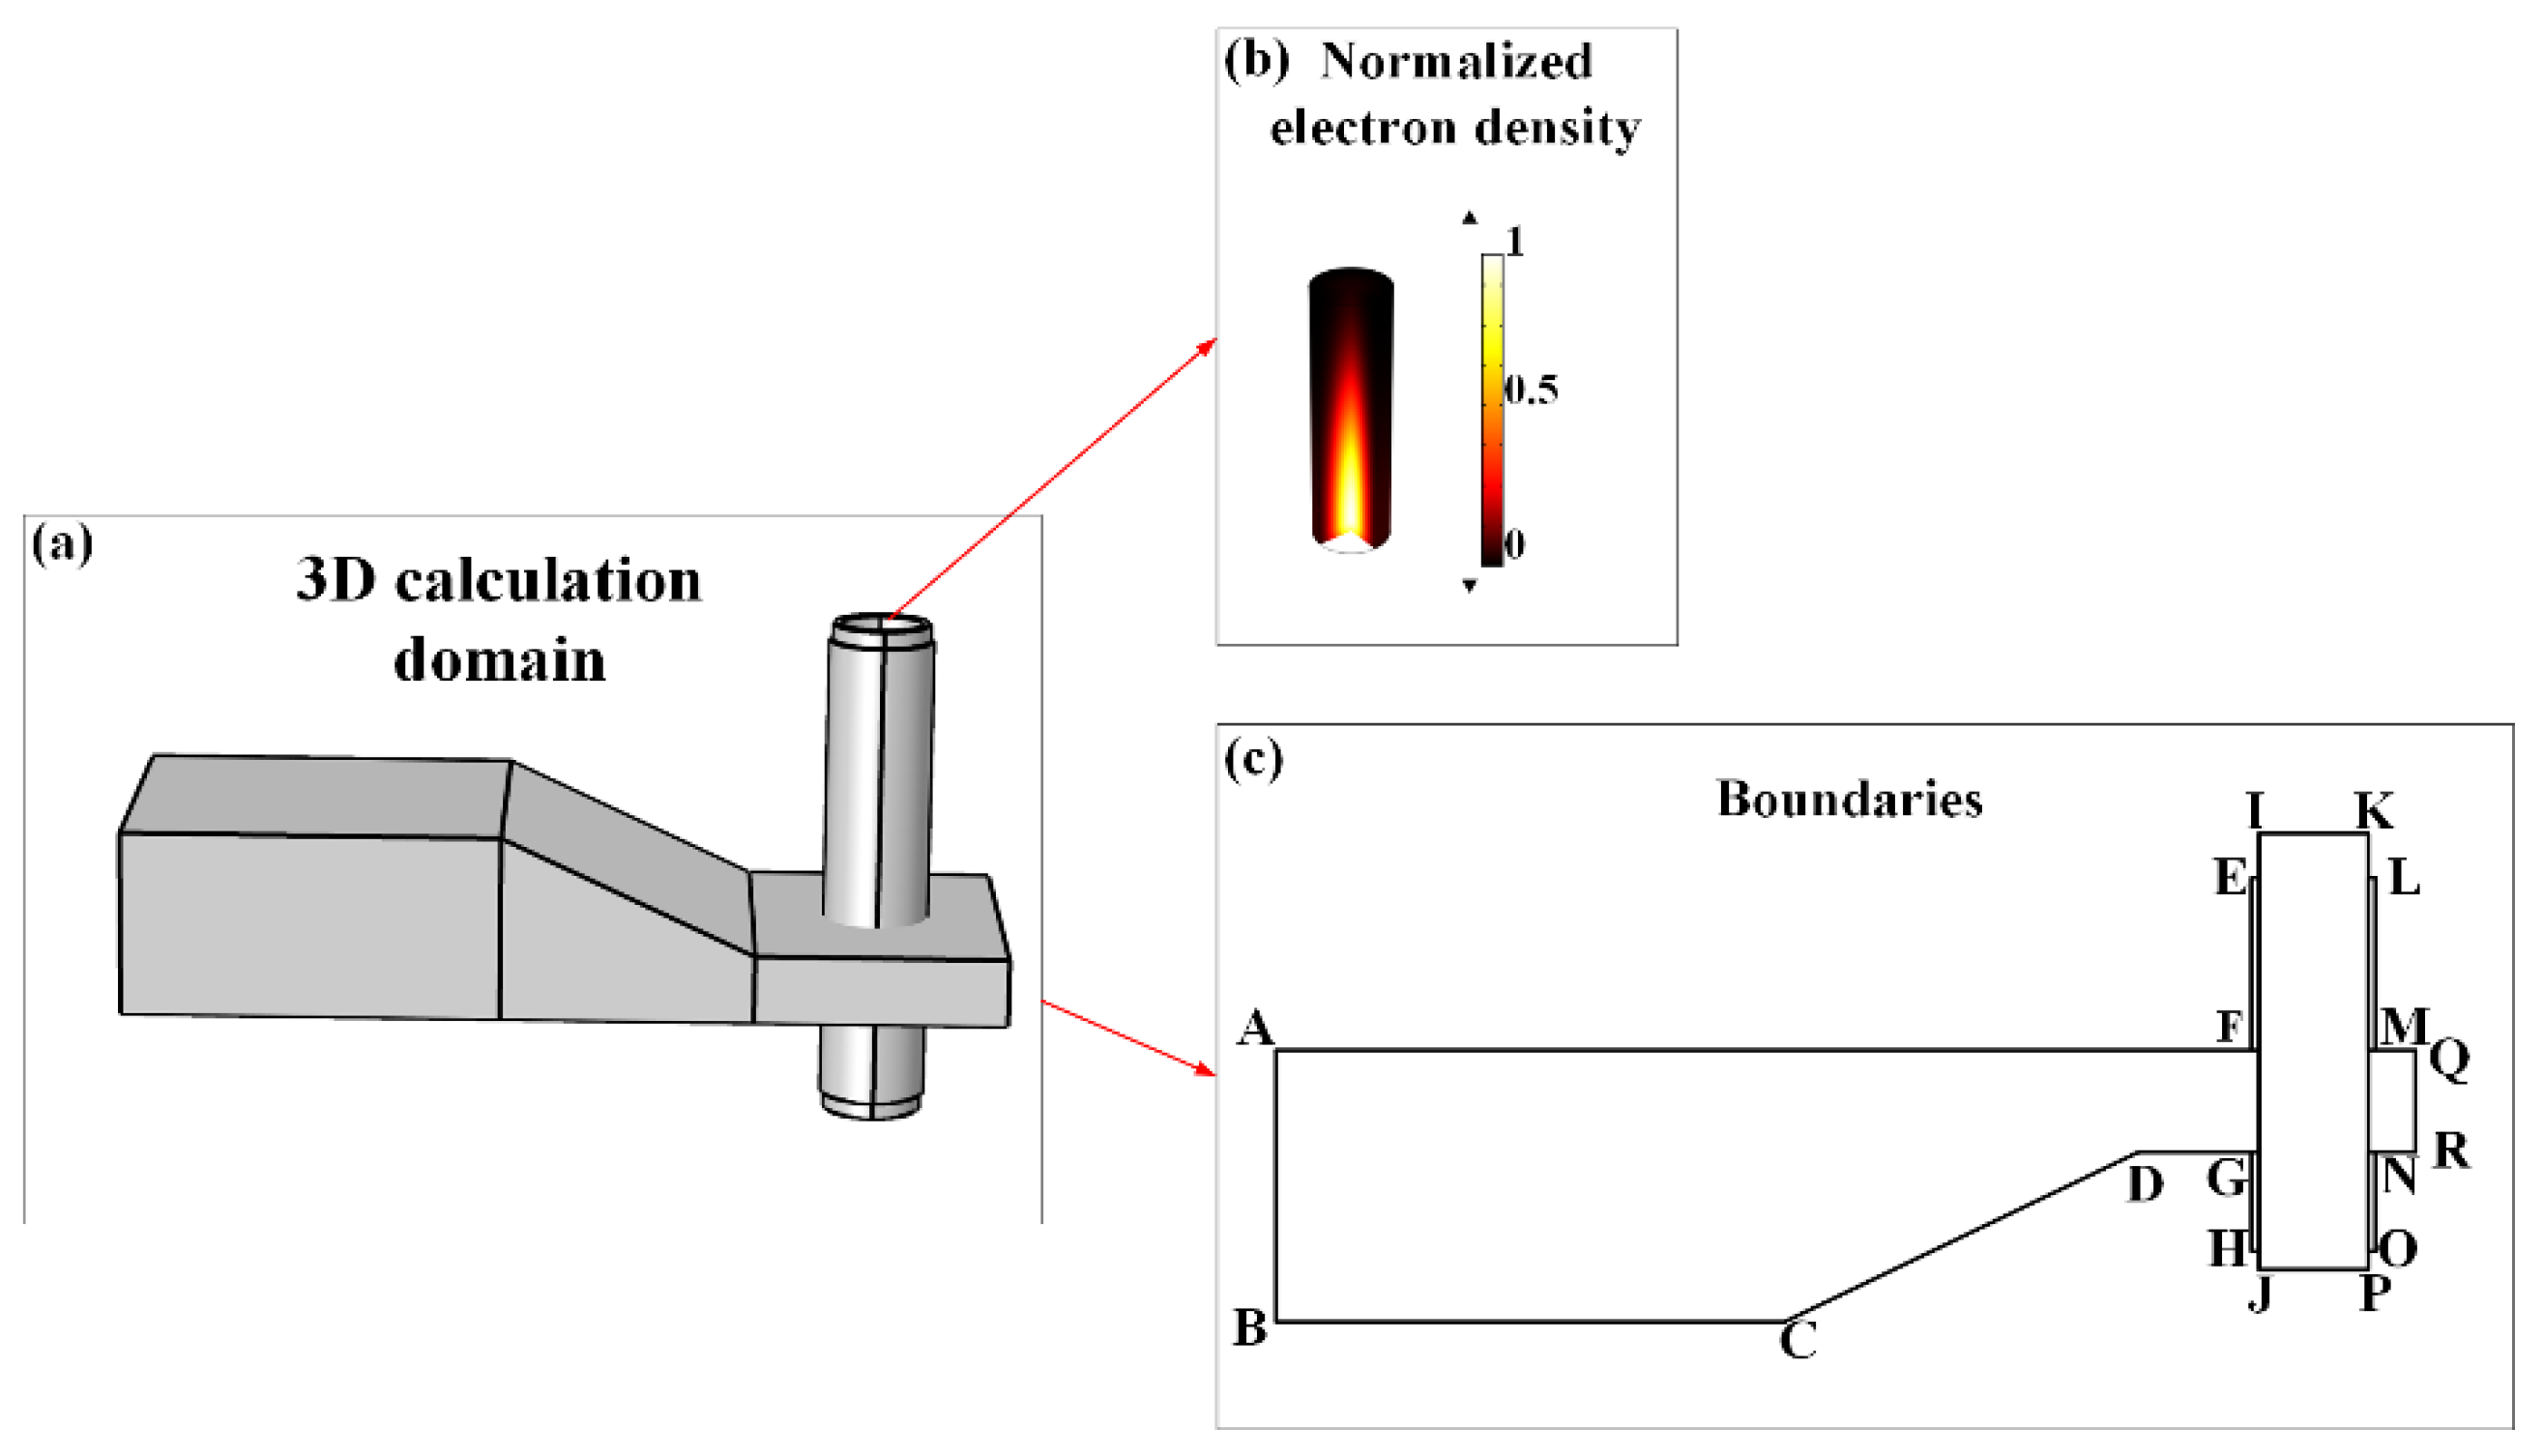
Figure 3.
Microwave power reflection ratio and electron density under different microwave power levels. (a, b) 400 W; (c, d) 510 W; (e, f) 670 W; (g, h) 820 W; (i, j) 1100 W.
Figure 3.
Microwave power reflection ratio and electron density under different microwave power levels. (a, b) 400 W; (c, d) 510 W; (e, f) 670 W; (g, h) 820 W; (i, j) 1100 W.
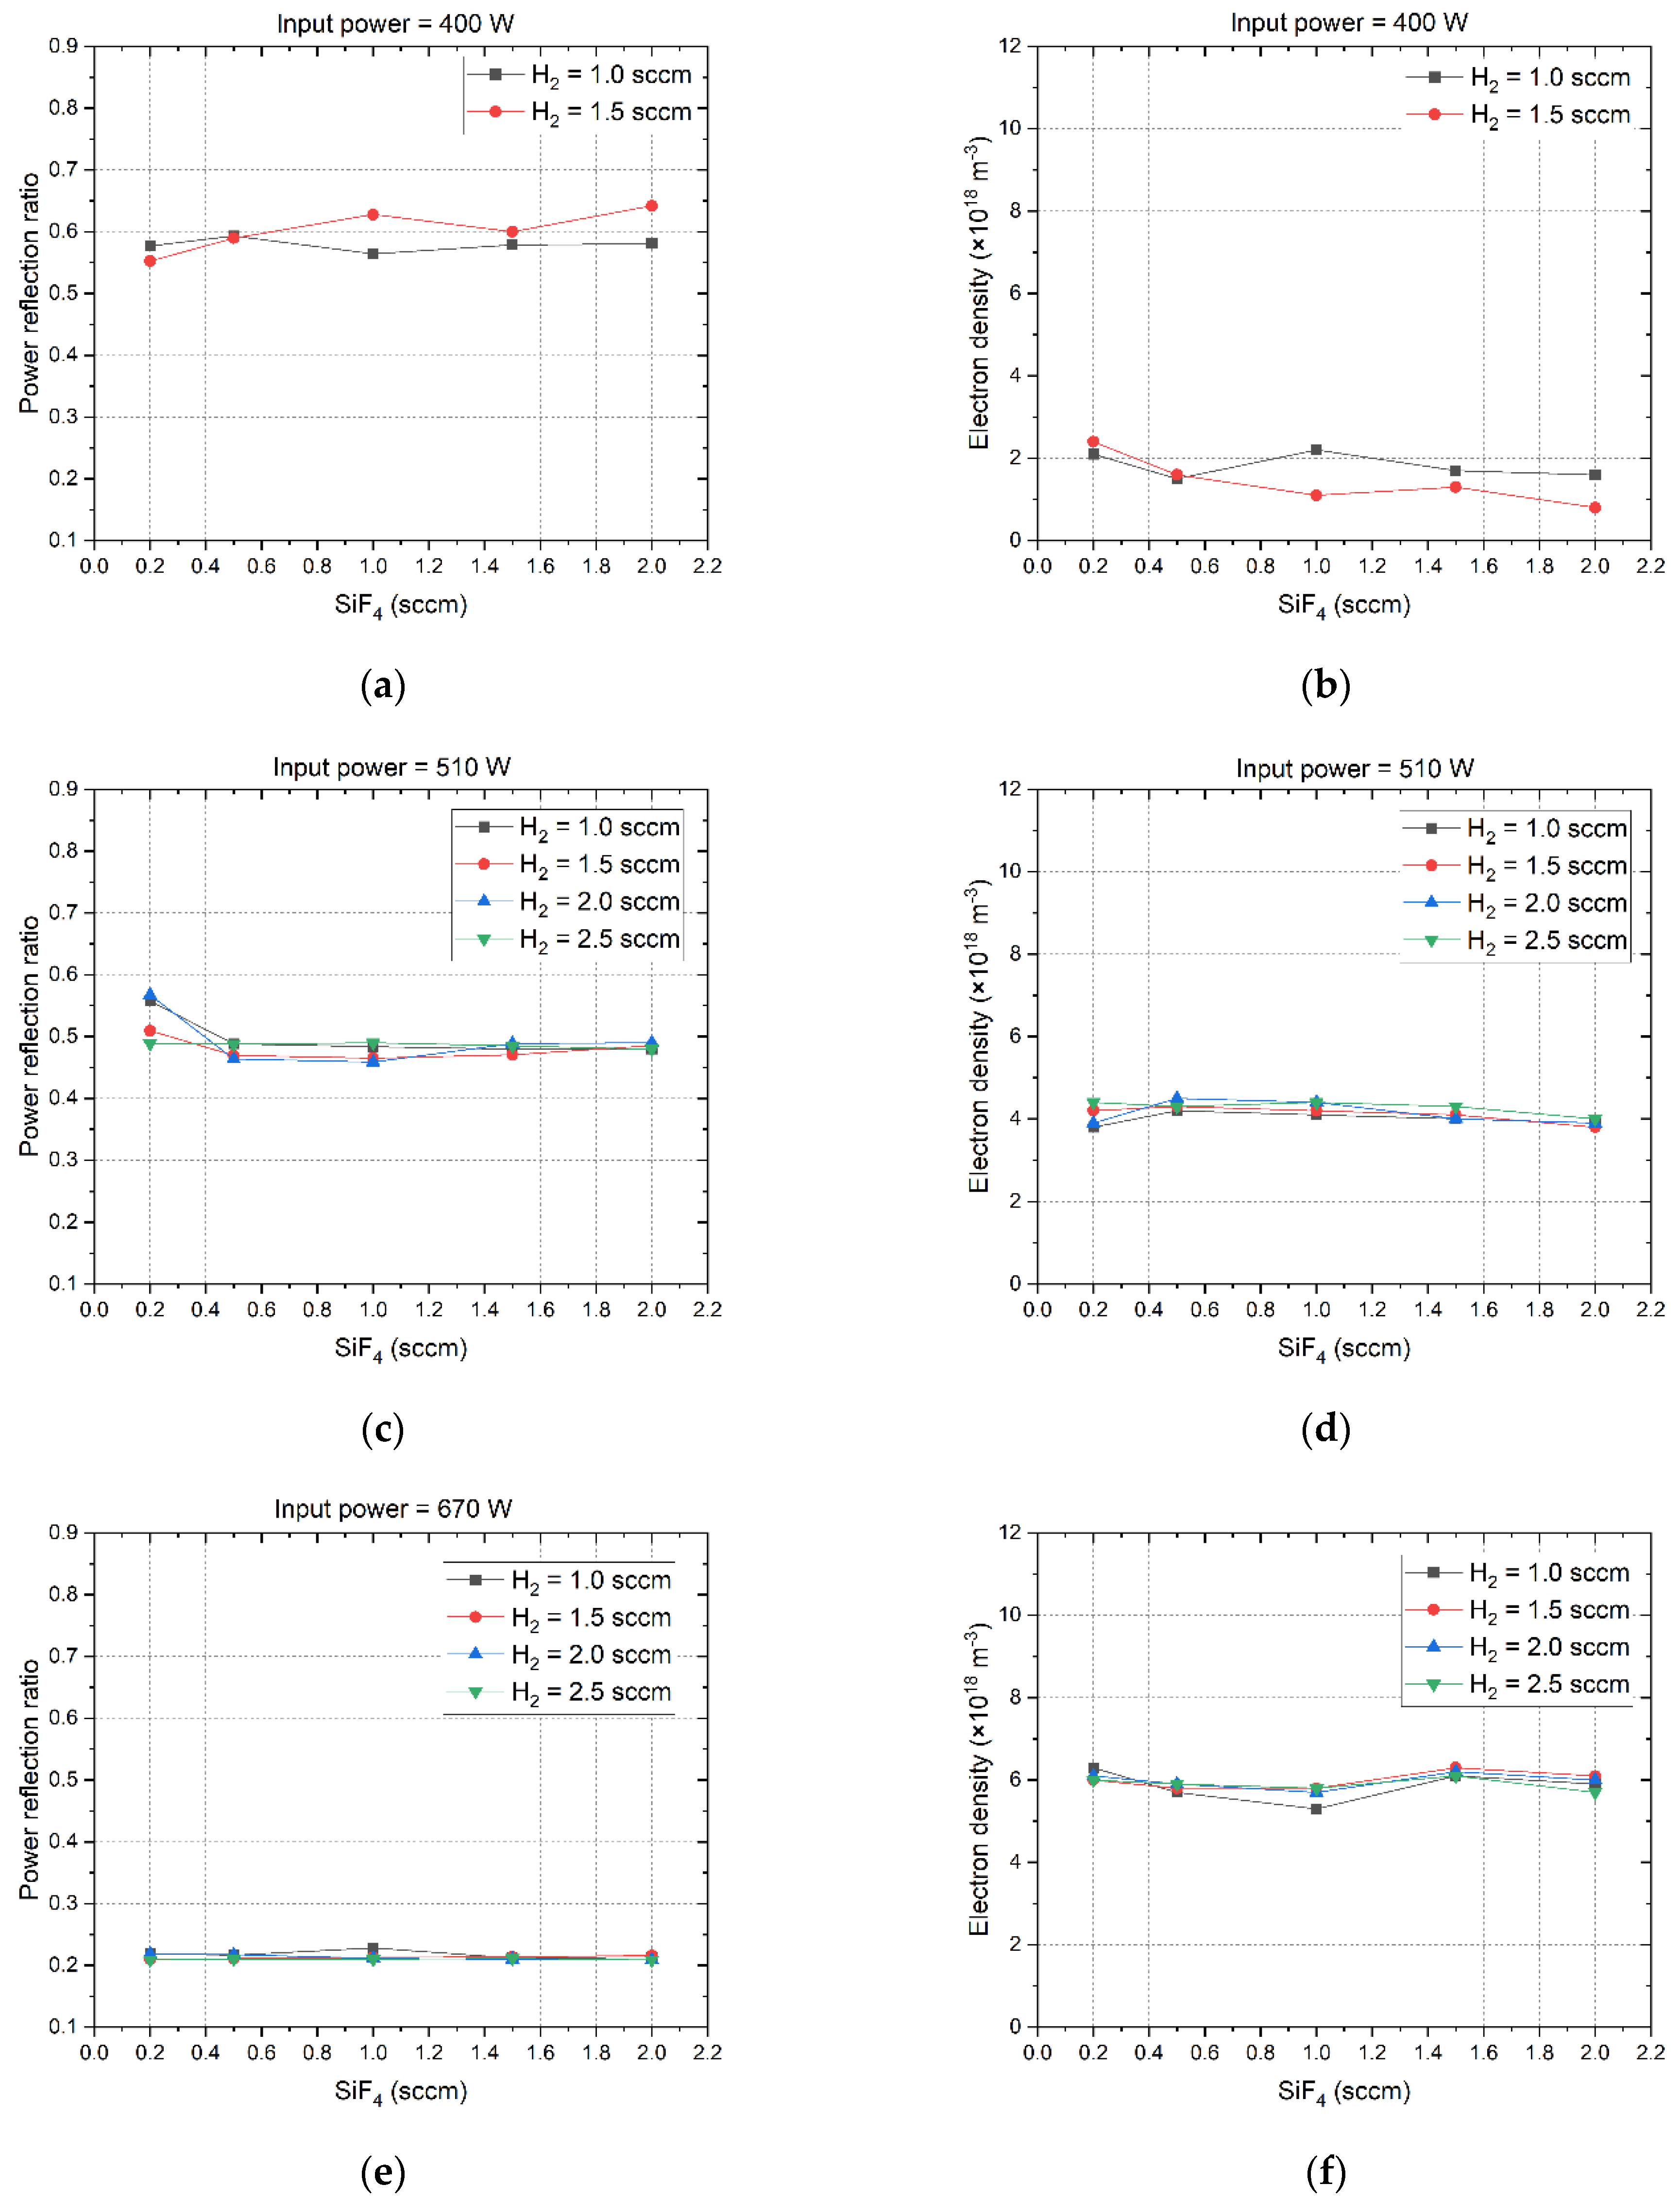
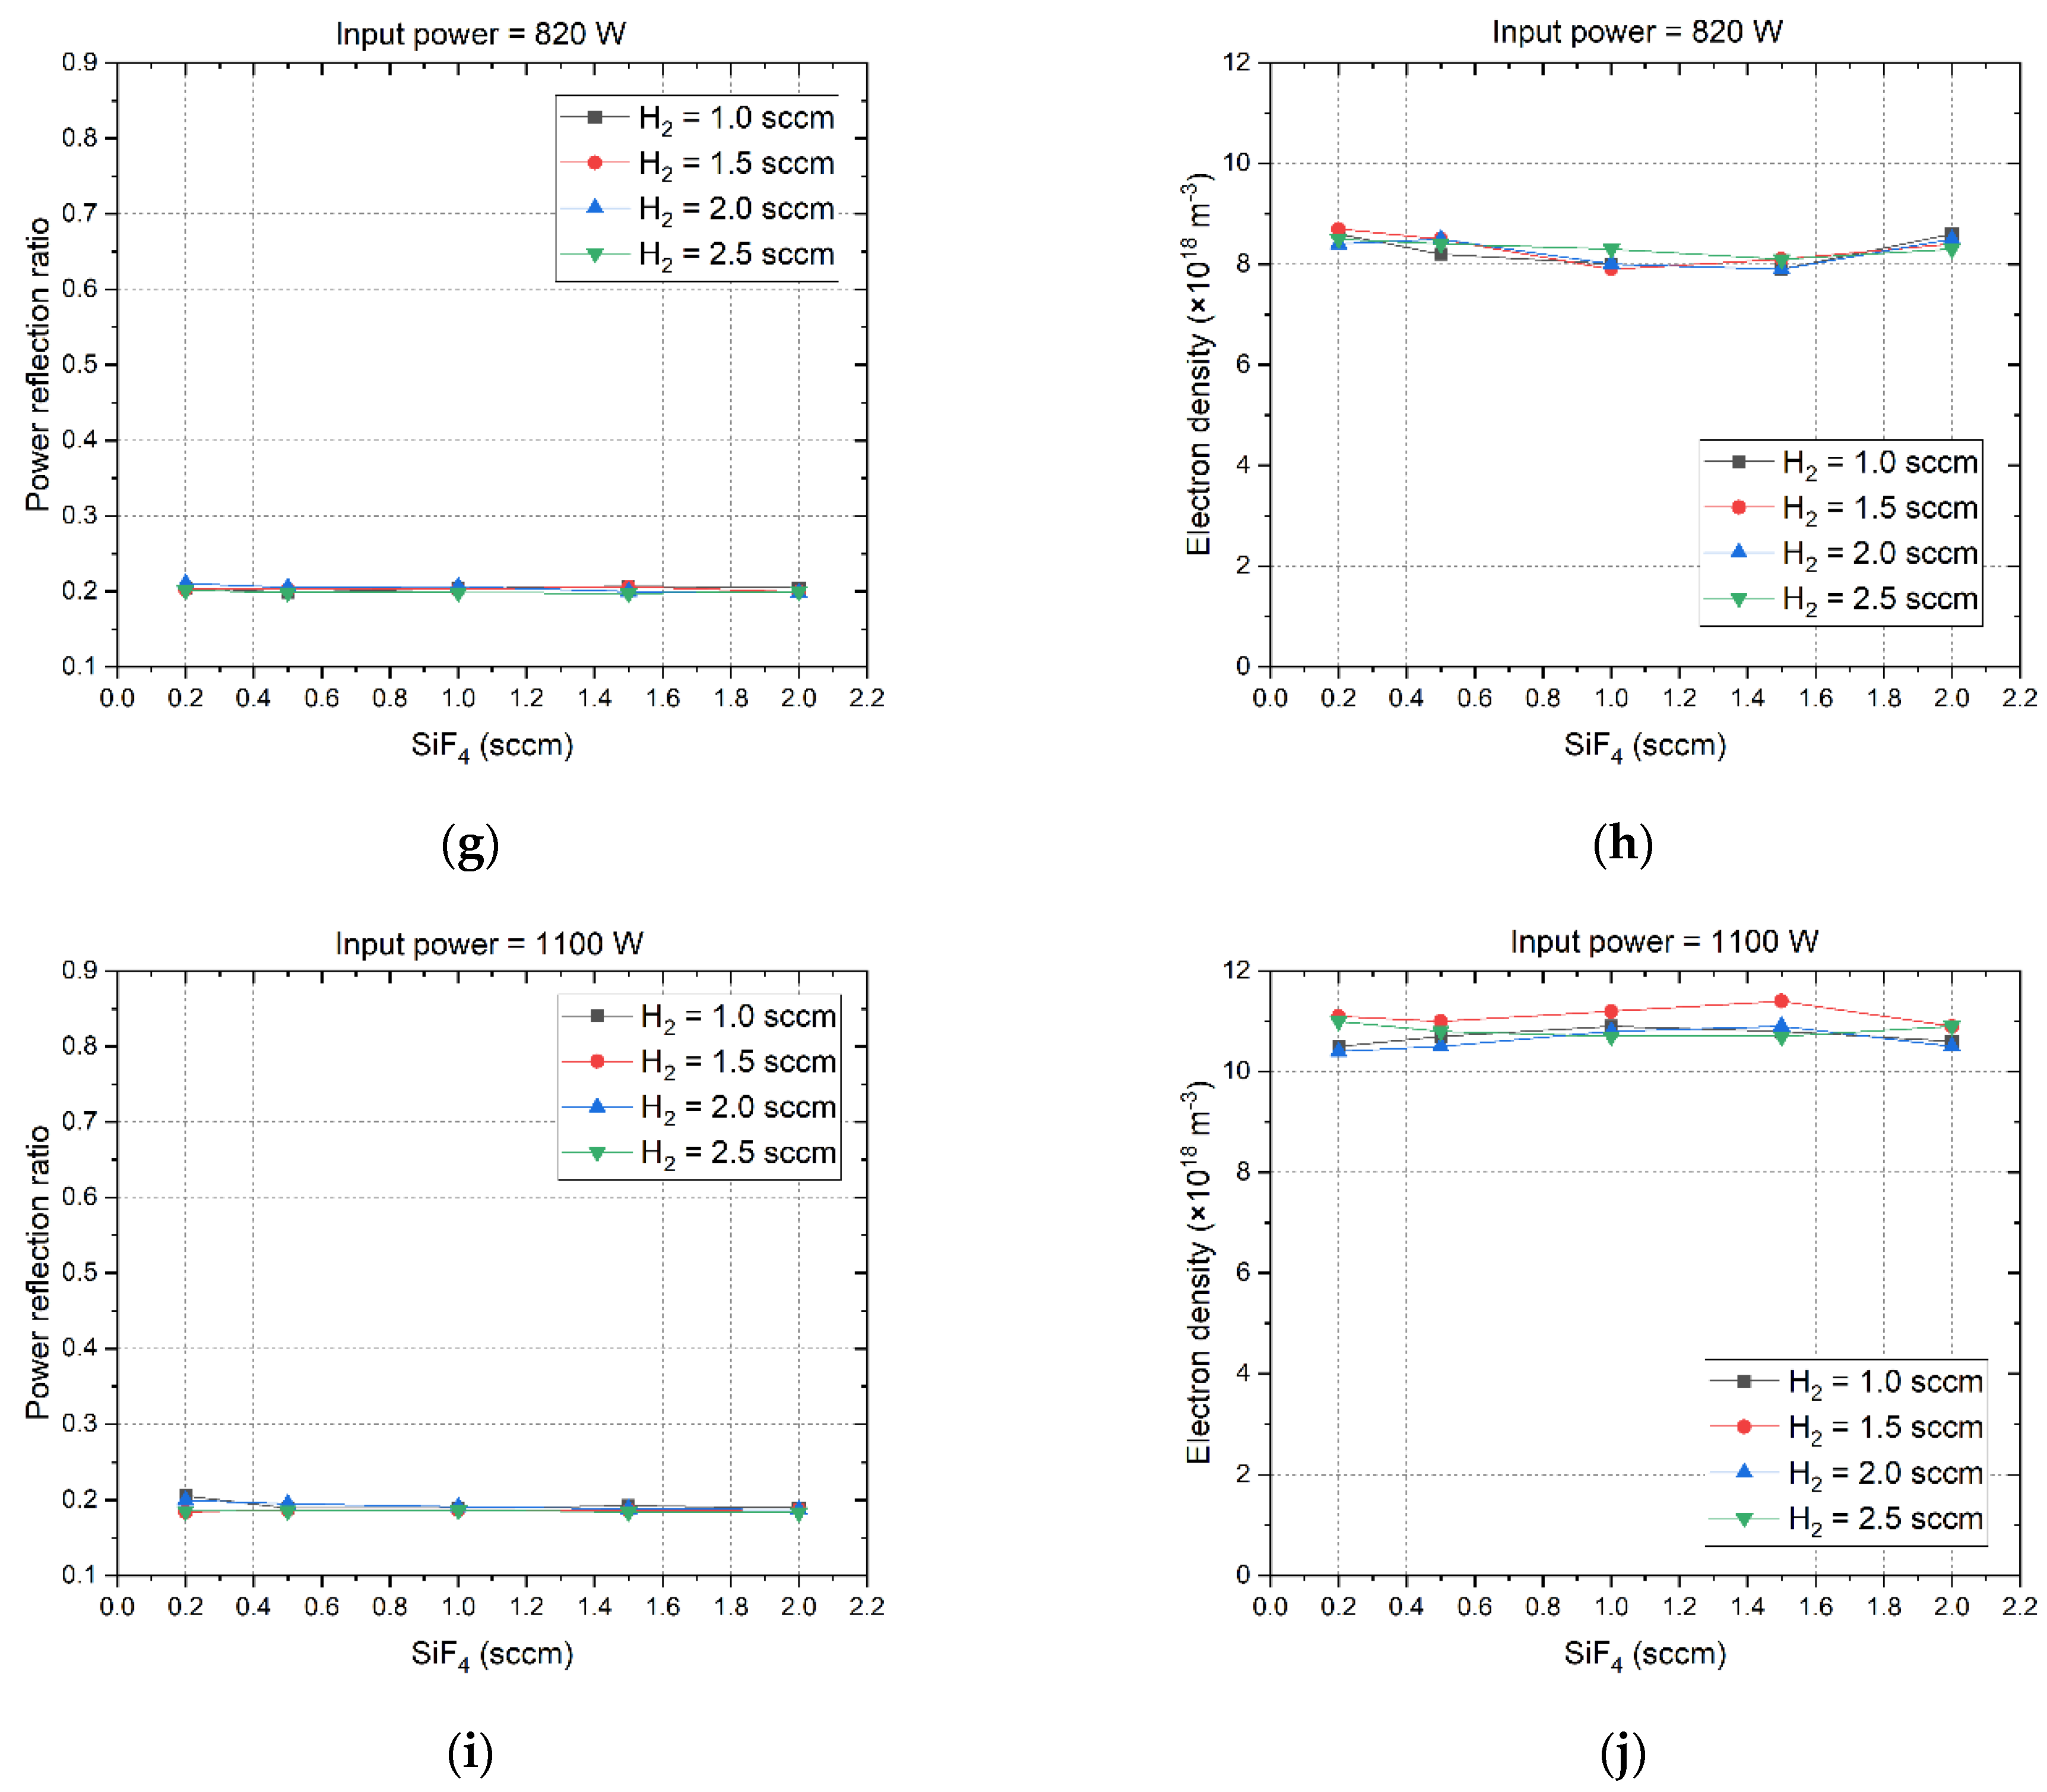
Figure 4.
HF production under different microwave power. (a) 400 W; (b) 510 W; (c) 670 W; (d) 820 W; (e) 1100 W.
Figure 4.
HF production under different microwave power. (a) 400 W; (b) 510 W; (c) 670 W; (d) 820 W; (e) 1100 W.
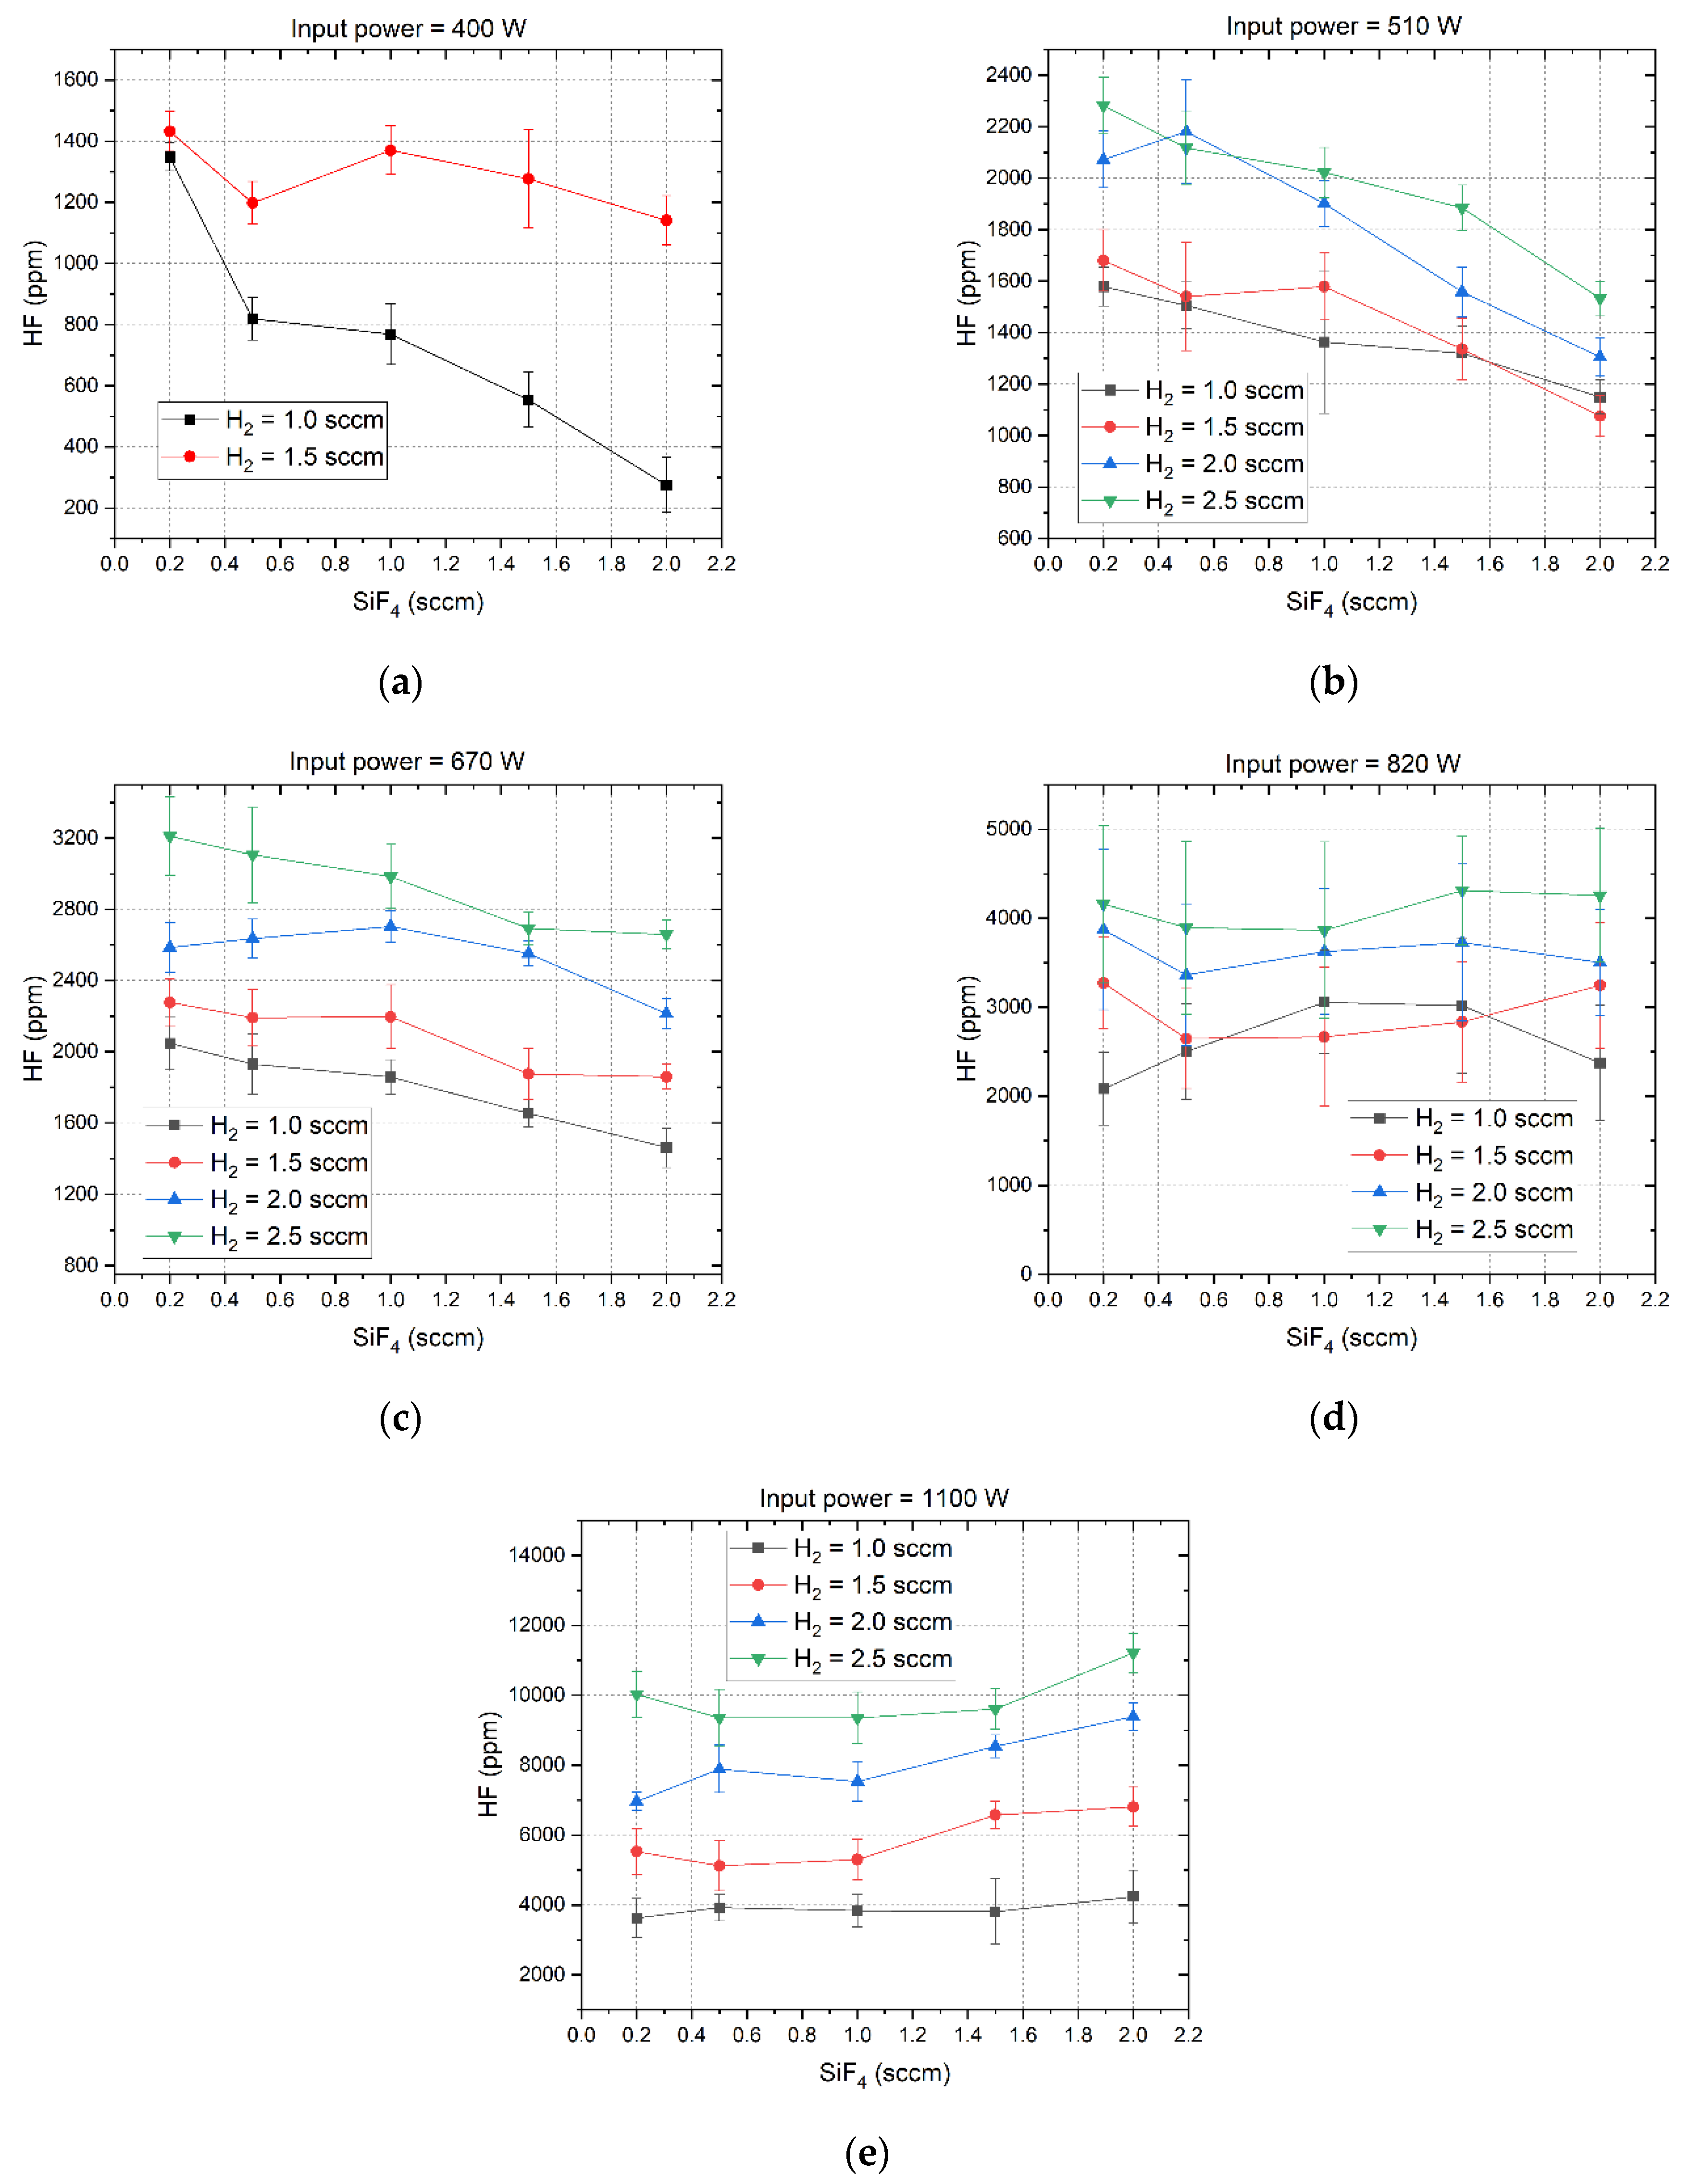
Figure 5.
Energy cost for producing HF under different microwave power. (a) 400 W; (b) 510 W; (c) 670 W; (d) 820 W; (e) 1100 W.
Figure 5.
Energy cost for producing HF under different microwave power. (a) 400 W; (b) 510 W; (c) 670 W; (d) 820 W; (e) 1100 W.
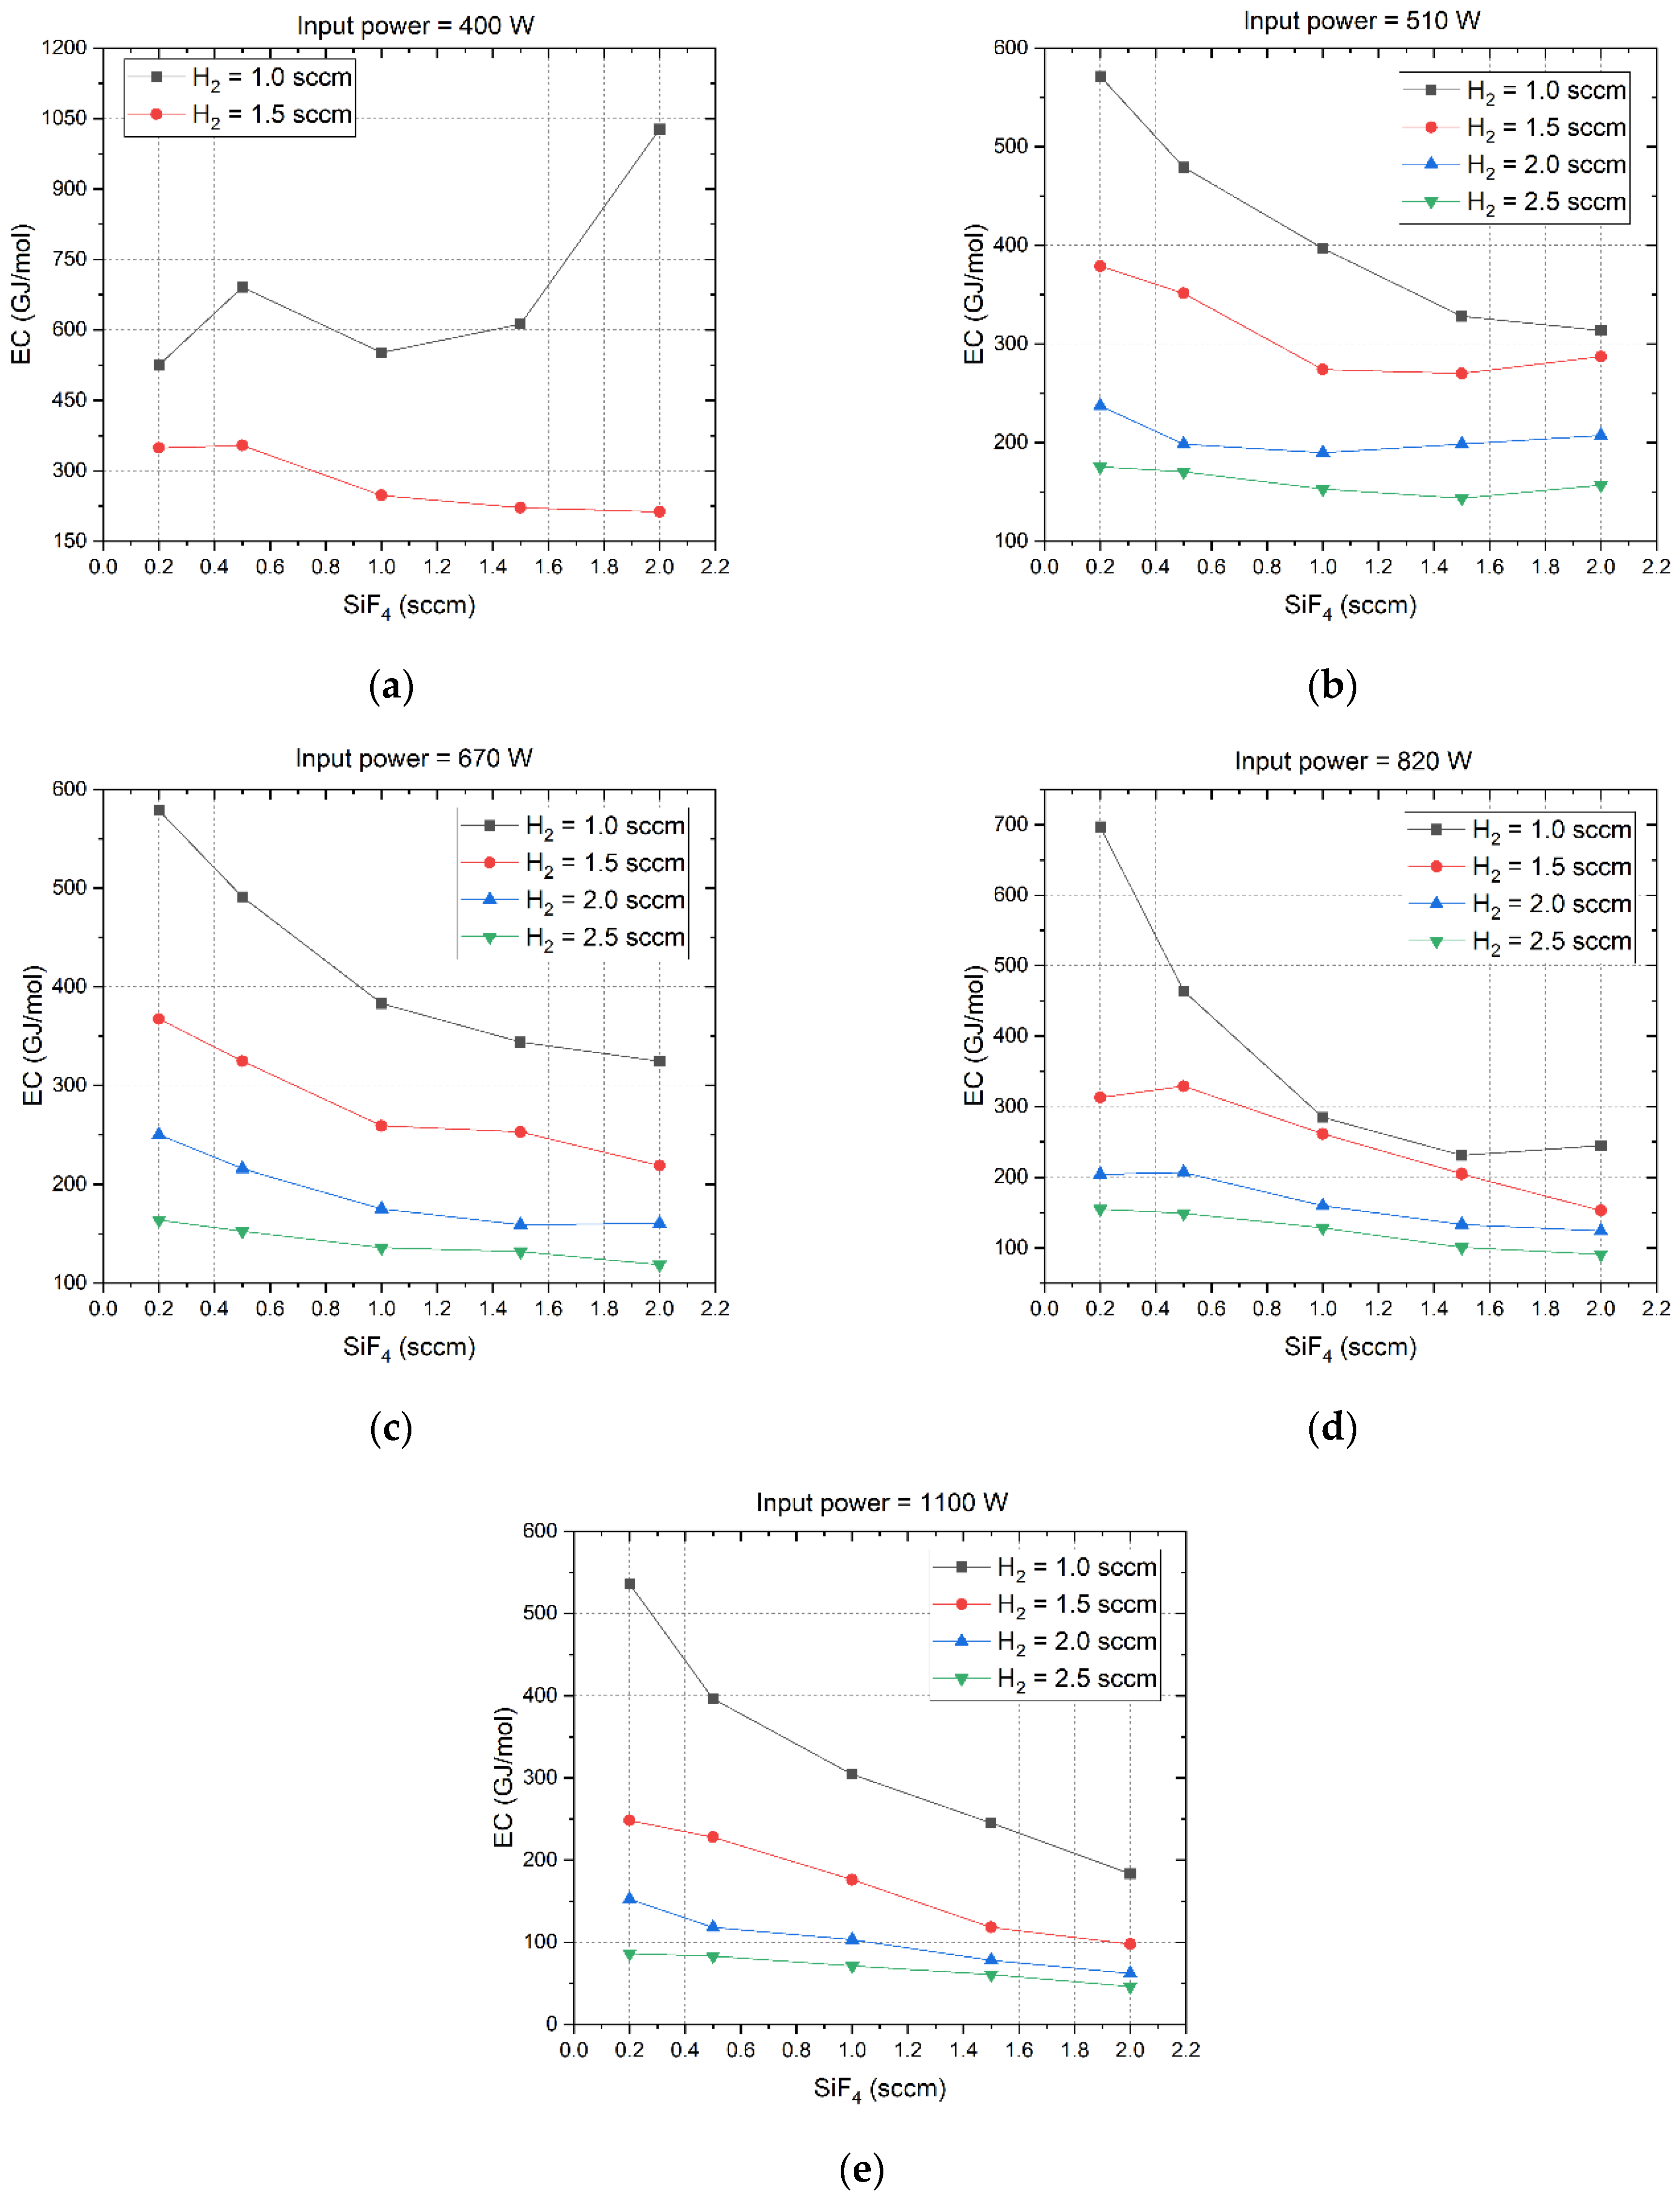

Table 1.
Properties of the calculation domain.
| Object | Material | Boundary condition |
| Waveguide | Aluminum | PEC: AF; BC; CD; DG; MQ; NR; QR. |
| Metal sleeve | Aluminum | PEC: EF; GH; LM; NO. |
| Quartz tube | Quartz | SBC: IK; JP |
Disclaimer/Publisher’s Note: The statements, opinions and data contained in all publications are solely those of the individual author(s) and contributor(s) and not of MDPI and/or the editor(s). MDPI and/or the editor(s) disclaim responsibility for any injury to people or property resulting from any ideas, methods, instructions or products referred to in the content. |
© 2024 by the authors. Licensee MDPI, Basel, Switzerland. This article is an open access article distributed under the terms and conditions of the Creative Commons Attribution (CC BY) license (http://creativecommons.org/licenses/by/4.0/).
Copyright: This open access article is published under a Creative Commons CC BY 4.0 license, which permit the free download, distribution, and reuse, provided that the author and preprint are cited in any reuse.


