Submitted:
04 December 2024
Posted:
04 December 2024
You are already at the latest version
Abstract
The sand conglomerate has strong heterogeneity, great difference in rock mechanical properties, and serious filtration loss of fracturing fluid. In order to describe the effect of heterogeneous gravel distribution on the filtration loss of conglomerate reservoir, a dual media filtration model was established based on the equivalent flow principle, and the heterogeneous distribution relationship was characterized by Fuller gradation and solved by numerical method. The degree of non-uniformity, formation gravel characteristics and pressure process parameters were taken into account for simulation analysis and calculation. The results show that the average filtration rate of 60% gravel content is 54.2% lower than that of 20% gravel content. When the degree of non-uniformity is 6, the average filtration rate is 73% higher than that of uniformity. Injection rate and injection pressure have a great influence on the filtration loss of fracturing fluid. The research results can provide theoretical support for fracturing optimization design.
Keywords:
conglomerate
; heterogeneous distribution
; fluid loss model
; gravel content
; hydraulic fracturing
1. Introduction
Sandstone reservoirs play a pivotal role in the development of unconventional oil and gas resources, as they often feature low permeability, high heterogeneity, and complex pore structures [1,2]. Hydraulic fracturing is a critical technology for enhancing the productivity of these reservoirs by creating high-conductivity fracture networks that improve fluid flow pathways. However, the unique geological characteristics of sandstone reservoirs, such as weak mechanical strength and strong stress sensitivity, pose significant challenges to achieving effective stimulation [3,4,5,6]. Research into hydraulic fracturing in sandstone reservoirs is essential for addressing these challenges, optimizing fracturing designs, and ensuring efficient and sustainable resource development.
Fluid loss directly impacts the distribution of proppants within fractures, the conductivity of the created fractures, and the effectiveness of stimulated reservoir volume. Excessive fluid loss can lead to reservoir damage, such as pore blockage, reduced relative permeability, and altered fluid flow characteristics, ultimately affecting the production performance of oil and gas wells. Research on post-fracturing fluid loss in sandstone reservoirs aims to identify the controlling factors, clarify the underlying mechanisms, and assess its impact on reservoir and fracture performance, providing theoretical support for improving stimulation outcomes. Studying fluid loss behavior serves as a foundation for optimizing fracturing fluid formulations, refining operational parameters, and developing efficient fluid loss control measures, thereby minimizing reservoir damage, enhancing stimulation efficiency, and extending well production lifespan. Furthermore, such research drives innovation in low-fluid-loss fracturing fluids, temporary plugging agents, and other fluid loss control technologies, enabling efficient exploitation of complex sandstone reservoirs.
Research on fracture propagation in sandstone and conglomerate reservoirs focuses on understanding the mechanisms and patterns of fracture formation and extension, which are primarily controlled by in-situ stress distribution, rock mechanical properties, and fracturing parameters. Studies have shown that fractures typically propagate along the direction of maximum principal stress, driven by fracturing fluid pressure exceeding the tensile strength of the rock. Their development is significantly influenced by the heterogeneity of the sandstone and conglomerate, including grain size distribution, cementation quality, and pore structure [7,8]. Additionally, factors such as fracturing fluid viscosity, injection rate, and proppant transport capacity play crucial roles in determining fracture width, length, and morphology [9,10]. Recent advancements in numerical simulations (e.g., finite element and discrete element methods) and experimental techniques (e.g., acoustic emission monitoring and CT scanning) have provided deeper insights into the dynamic characteristics of fracture propagation, offering a theoretical basis for optimizing fracturing parameters and enhancing reservoir stimulation efficiency [11,12,13].
Fluid loss is a critical phenomenon during hydraulic fracturing that significantly impacts fracture propagation and reservoir stimulation performance. It is generally categorized into surface fluid loss (permeation along the fracture surface) and wall fluid loss (leakage through the fracture walls into the matrix). Surface fluid loss is primarily influenced by the permeability of the fracture surface, affecting the fracture’s conductivity, while wall fluid loss depends on the porosity and permeability of the rock matrix, determining the depth and extent of fluid penetration into the reservoir [14,15]. The rate of fluid loss not only influences the dynamics of fracture propagation but can also lead to the formation of a “fluid loss zone” near the fracture, altering the fluid flow pathways and affecting the stimulated reservoir volume [16].
The main factors influencing fluid loss include the pore structure and permeability of reservoir rocks, the viscosity and performance of fracturing fluids, the properties of fluid loss control agents, fracture width, and closure stress. High-permeability reservoirs tend to experience rapid fluid loss, causing quicker pressure decay, shorter fracture lengths, and potentially significant fluid loss zones in the deep reservoir, which can impair fracture conductivity [17,18]. Conversely, low-permeability reservoirs may exhibit lower fluid loss rates but risk uneven proppant distribution on fracture surfaces, reducing the effective flow area. Recent advancements in fluid loss mitigation focus on optimizing fracturing fluid viscosity, incorporating particulate fluid loss agents, or employing hybrid fracturing fluid systems to reduce fluid loss rates and improve treatment outcomes [19,20].
To study fluid loss behavior and its impact on fracture pressure and reservoir stimulation, researchers have increasingly adopted a combination of numerical simulations and experimental investigations. By constructing fracture-matrix coupled models (e.g., Coupled CFD-FEM models), dynamic simulations of fluid loss under varying reservoir conditions have revealed the complex relationships among fluid loss rates, fracture geometry, and reservoir permeability [21,22,23]. Experimental techniques such as nuclear magnetic resonance imaging (NMR) and micro-CT scanning provide direct evidence for understanding the formation mechanisms of fluid loss zones and their effects on reservoir pore structures. These studies offer valuable theoretical foundations for optimizing fluid loss control techniques, enhancing fracturing effectiveness, and improving the uniformity and efficiency of reservoir stimulation [24].
This study develops a new model for calculating fracturing fluid filtration in sandstone-conglomerate reservoirs. The model incorporates the dual-medium characteristics of sandstone-conglomerate formations and considers key factors such as gravel particle size, gravel content, fracture width, injection rate, and pressure. The results demonstrate that the model accurately describes filtration behavior under various conditions, providing essential theoretical support for optimizing fracturing designs in sandstone-conglomerate reservoirs.
2. Methodology
2.1. Flow Mechanism
Sandstone-conglomerate formations are characterized by their complex lithological features, heterogeneity, and multi-porosity-fracture media properties. In these formations, the permeability of gravel is typically extremely low, and both permeability and porosity can be approximated as zero in analytical calculations. When filtrate encounters gravel, it flows around the gravel particles under the influence of pressure gradients, creating significant flow resistance. Consequently, under the same matrix permeability conditions, formations containing gravel exhibit significantly higher filtration resistance compared to those without gravel. On a macroscopic scale, this increased resistance results in further deterioration of overall formation permeability. Additionally, the distribution of gravel particles and their contact state with the matrix also play a crucial role in influencing filtration behavior.
The presence of natural and artificial fractures further modifies the filtration characteristics of sandstone-conglomerate formations. Figure 1 illustrates the filtration pathways and flow characteristics in a gravel-bearing sandstone formation with natural and artificial fractures. The blue regions represent gravel particles with low permeability and porosity, while the red area denotes the matrix. The yellow line indicates the artificial fractures created during hydraulic fracturing operations, and the white line represents natural fractures in the formation. The yellow arrows show the filtrate flow paths under the influence of pressure gradients, where the filtrate navigates around the gravel particles in the matrix, encountering high flow resistance. In contrast, natural and artificial fractures, with their higher permeability, guide a significant amount of fracturing fluid to leak off, exhibiting the characteristics of dual-medium seepage.
Natural fractures exhibit much higher permeability than the matrix, causing substantial fracturing fluid leakage along these fractures. Artificial fractures, formed during hydraulic fracturing operations, typically have higher conductivity but are also significantly affected by filtration. When the proppant distribution is uneven or the fracture width is small, rapid filtrate loss can occur, resulting in faster pressure decay and negatively impacting fracture propagation and reservoir stimulation efficiency. Therefore, the degree of natural fracture development, the geometry of artificial fractures, and their interactions with the matrix and gravel are critical factors influencing filtration behavior in sandstone-conglomerate formations. These characteristics collectively underscore the complexity of filtration management and the need for tailored technical solutions in such reservoirs.
Figure 2 illustrates the flow dynamics within a dual-medium system, focusing on the interaction between hydraulic fractures, natural fractures, and gravel particles in a sandstone-conglomerate formation. The horizontal yellow sections represent the hydraulic fracture, divided into two parts: the initial section (Q1) and the second half (Q12). In the initial section, fracturing fluid enters and begins propagating the fracture, with filtration losses occurring as fluid leaks into the surrounding matrix or interacts with gravel particles, which have very low permeability and porosity. The second half of the hydraulic fracture continues the fluid flow, but the filtration characteristics may vary due to changes in pressure distribution and fracture geometry.
The vertical yellow section represents a natural fracture (Q13), which has significantly higher permeability than the matrix. This natural fracture becomes a major pathway for fluid loss, contributing to a dual-medium seepage effect as fracturing fluid leaks from both sections of the hydraulic fracture into the natural fracture. Surrounding the fractures are orange circles representing gravel particles, which create additional resistance to fluid flow. These particles force the filtrate to navigate around them, further complicating the fluid pathways and altering the overall filtration process.
Total Flow Relationship (Q1 = Q12 + Q13 + Q14): This diagram decomposes the total fluid loss in natural fractures (Q1) into multiple source flows, including fluid loss from natural fractures (Q14) and hydraulic fractures (Q12 and Q13), establishing a complete fluid dynamics equilibrium relationship.
Figure 3 illustrates the flow distribution across multiple fracture branches (horizontal axis) and its variation over different time stages (vertical axis) within a complex fracture system. The horizontal axis represents the flow rate of each fracture branch, where wider rectangles indicate higher flow rates and narrower rectangles indicate lower flow rates. The vertical axis reflects the progression of time, with the bottom representing the early stage and the top representing the later stage. Over time, the flow distribution transitions from being concentrated in the main fracture to being more evenly distributed across secondary fractures, demonstrating the dynamic fluid allocation characteristics of the fracture network as influenced by pressure depletion, fracture geometry changes, and adjustments in fluid flow pathways.
In the early stage, flow is predominantly concentrated in the main fracture, while secondary fractures carry relatively little flow. During the intermediate stage, secondary fractures begin to take on more flow, and the distribution becomes more balanced. By the later stage, the overall flow in the fractures decreases, likely due to pressure depletion or filtration effects. This dynamic change in flow distribution highlights the varying contributions of the fracture network at different stages and provides valuable insights into optimizing fracture design and reservoir stimulation strategies.
2.2. Flow Model
To establish a filtration mechanism model for sandstone-conglomerate formations, the following assumptions are typically made to simplify the complex flow characteristics and accurately describe the filtration behavior:
1)Homogeneity and Isotropy of the Formation
It is assumed that the sandstone-conglomerate formation has uniform porosity and permeability within a localized area, with isotropic characteristics. This assumption simplifies the description of flow properties by using consistent parameters and disregards the heterogeneity and anisotropy that may exist in the formation.
2)Dual-Medium Characteristics of Fractures and Matrix
The formation is assumed to consist of a dual-medium system comprising fractures and a matrix. Fractures are considered to have high permeability and fluid conductivity, while the matrix has extremely low permeability. Fluid exchange between the fractures and the matrix follows Darcy’s law.
3)Stability of Fracture Geometry
It is assumed that the width, length, and shape of the fractures remain stable during the filtration process and are not significantly altered by changes in filtration pressure. This simplifies the model by excluding the dynamic behavior of fracture closure or propagation.
4)Fluid Properties
The fracturing fluid is assumed to be incompressible, with constant viscosity and density throughout the filtration process. Fluid flow within the fractures and matrix is assumed to follow the continuity equation.
5)Initial Pressure and Boundary Conditions
It is assumed that the initial formation pressure is uniformly distributed, and the pressure gradient between fractures and the matrix serves as the driving force for filtration. Boundary conditions are typically set as constant far-field pressure or zero-flow boundaries.
These assumptions form the theoretical foundation for constructing a mathematical model of filtration mechanisms in sandstone-conglomerate formations, describing the fluid exchange between fractures and the matrix. While these assumptions simplify the system for analysis, they may need to be adjusted based on specific reservoir conditions in practical applications.
For the conglomerate fracture, the following equation can be obtained by referring to the filtration loss model of dual media:
The filtration rate of crack and matrix can be expressed as
Where
, represents the permeability and porosity with the change of gravel properties.
C represents the compression coefficient.
p represents the pressure.
The subscript f and m represent the fracture and matrix, respectively.
α is the fluid exchange coefficient.
For fractures, the fluid flow inside the fractures follows Poiseuille flow. This means that the flow is governed by the principles of laminar flow in a confined space, where the flow rate is proportional to the pressure gradient along the fracture and the cube of the fracture aperture. In this context, the fracture is treated as a smooth, parallel-walled channel, and the fluid flow obeys the equation:
Where:
is the volumetric flow rate per unit width of the fracture.
is the fracture aperture (or width).
is the fluid viscosity.
is the pressure gradient along the fracture.
This assumption simplifies the modeling of fluid movement within fractures and is critical for coupling fracture flow with matrix flow in dual-medium systems.
The governing equations for fluid flow are typically described
For a fracture system, the total injection rate equals the sum of the flow rates of all fractures, satisfying the following equation
Where:
represents the total injection rate;
represents the flow rate of the k-th fracture;
n is the total number of fractures.
If the 2mm, 5mm, 10mm, 15mm, and 20mm gradations are set as the key sieve sizes for gravel, then the distribution proportion of each size fraction can be calculated using the Fuller gradation formula
Where:
P(D): The cumulative passing percentage for particle size D;
D: The particle size being analyzed;
Dmax: The maximum particle size (in this case, 20mm);
m: The gradation exponent, typically between 0.45 and 0.5 for Fuller distribution.
The proportion of each part is shown in Table 1.The proportions are calculated based on the Fuller gradation formula, indicating the cumulative distribution of gravel sizes within the specified intervals. This distribution provides an optimized particle size blend for improved packing and mechanical properties.
3. Discussion
Table 2 summarizes the key mechanical and physical properties of the material, along with their respective data sources, all derived from experimental measurements.
Figure 4 illustrates the variation of filtration rates over time under different gravel contents (20%, 40%, and 60%). With increasing gravel content, the filtration rate decreases rapidly in the early stage but stabilizes later. This is due to the significant resistance caused by gravel particles, which increase the complexity of fluid pathways as the fluid must flow around the particles, leading to higher initial filtration rates. However, higher gravel content also reduces the conductivity of fractures and weakens fluid exchange between the matrix and fractures, resulting in a smaller reduction in filtration rates during the later stages. Quantitatively, as gravel content increases from 20% to 60%, the maximum filtration rate decreases from 100.3×10⁻⁶ m/s to 38.6×10⁻⁶ m/s, and the minimum filtration rate decreases from 15.4×10⁻⁶ m/s to 8.7×10⁻⁶ m/s.
Figure 5 summarizes the effects of different gravel contents on the maximum and minimum filtration rates. As gravel content increases from 20% to 60%, the overall filtration rate significantly decreases, indicating that higher gravel content effectively reduces fluid pathways and increases flow resistance. The maximum filtration rate decreases by approximately 61.5%, while the minimum filtration rate decreases by about 43.5%, showing that higher gravel content has a more pronounced inhibitory effect on fluid flow during the initial stages. This trend reveals the nonlinear control effect of gravel content on filtration behavior, providing valuable data for optimizing filtration management in sandstone-conglomerate formations
Figure 6 illustrates the effect of different gravel particle sizes (6cm, 4cm, 2cm) on the filtration rate over time. The overall trend shows that the filtration rate decreases rapidly in the initial stage and gradually stabilizes over time. The impact of gravel particle size on the filtration rate is minimal, with larger particle sizes (6cm) showing a slightly higher initial filtration rate compared to smaller particle sizes (2cm). This suggests that the change in particle size has a limited effect on the filtration rate over time, as the increase in particle size primarily influences local flow resistance without significantly altering the overall fluid flow resistance.
Figure 7 summarizes the maximum and minimum filtration rates for different gravel particle sizes. As the gravel particle size decreases from 6cm to 2cm, the maximum filtration rate decreases slightly from 100.3×10⁻⁶ m/s to 95.9×10⁻⁶ m/s, and the minimum filtration rate decreases from 15.4×10⁻⁶ m/s to 15.0×10⁻⁶ m/s. This indicates that larger gravel particles have a more pronounced effect on increasing the initial filtration rate, while smaller particles cause only a slight reduction in filtration rates. This phenomenon may result from larger particles creating more complex flow paths within fractures or the matrix, thereby slightly increasing flow resistance during the initial stage
Figure 8 shows the effect of different crack densities on filtration rate over time. The results indicate that the filtration rate decreases rapidly in the initial stage and gradually stabilizes over time. As crack density increases, the overall filtration rate rises. For higher crack density (10/m), the initial filtration rate is the highest, and the rate of decline is faster. Conversely, for lower crack density (4/m), the filtration rate is lower, and the decline is slower. Higher crack density provides more fluid pathways within the fractures, significantly enhancing the filtration capability.
Figure 9 summarizes the maximum and minimum filtration rates for different crack densities. As crack density decreases from 10/m to 4/m, the maximum filtration rate decreases sequentially from approximately 100, 80, to 60×10−6 m/s, while the minimum filtration rate exhibits a similar decreasing trend. This indicates that higher crack density significantly enhances the filtration process, especially during the initial stage, as it provides more fluid pathways and accelerates fluid loss.
Figure 10 shows the effect of different crack widths (1mm, 3mm, 5mm) on filtration rate over time. The filtration rate decreases rapidly during the initial stage and gradually stabilizes. Larger crack widths result in higher filtration rates, particularly in the initial stage, where wider cracks (5mm) exhibit significantly higher filtration rates compared to narrower cracks (1mm). This is because wider cracks provide larger fluid pathways, reducing flow resistance and enhancing fluid filtration capacity. Over time, the pressure gradient within the cracks diminishes, and the filtration rates converge.
Figure 11 summarizes the maximum and minimum filtration rates for different crack widths. As crack width increases from 1mm to 5mm, the maximum filtration rate rises from 82.7×10⁻⁶ m/s to 120.1×10⁻⁶ m/s, while the minimum filtration rate increases from 7.5×10⁻⁶ m/s to 25.3×10⁻⁶ m/s. This indicates that wider cracks significantly enhance both the fracture conductivity and the filtration rate. Larger crack widths not only boost the fluid filtration capacity during the initial stage but also have a notable impact on the stabilized filtration rate over time
4. Conclusions
1) As gravel content increases from 20% to 60%, the filtration rate in both fractures and the matrix significantly decreases, with overall filtration loss reduced by 54.2%. This indicates that gravel plays a critical role in reducing filtration, with higher gravel content exhibiting a more pronounced flow resistance effect.
2)Within the particle size range of 2mm to 6mm, the impact of gravel size on filtration rate is relatively minor. Filtration rate variations are more prominent during the initial stage but stabilize in the later stage. This suggests that gravel particle size primarily affects fluid pathways in the early stage of filtration.
3) Fracture density has a significant influence on filtration rate. Higher fracture densities (e.g., 10/m) markedly increase the filtration rate, especially during the initial stage, enhancing filtration capacity. Lower fracture densities (e.g., 4/m) allow for better control of fluid loss.
4) Simulation results indicate that natural fractures are the primary factor controlling filtration behavior in sandstone-conglomerate formations. Their high conductivity significantly increases filtration volume, influencing the diffusion pathways of fracturing fluid and the extent of reservoir stimulation..
References
- Wang, J.; Ge, H.; Liu, J.; Shen, Y.; Zhang, Z.; Luo, S.; Liu, D. Effects of gravel size and content on the mechanical properties of conglomerate. Rock Mech Rock Eng 2022, 55, 2493–2502. [Google Scholar] [CrossRef]
- Duan, G.; Tian, G.; Guo, D.; Zhang, J.; He, C.; Yu, H.; Chen, J. In Study on the law of artificial crack propagation and fracturing technology in strong heterogeneous conglomerate strata: a case study of the Mahu glutenite in Xinjiang Oilfield, 2020/1/1, 2020; IOP Publishing: 2020; p. 052021.
- Pan, Y.; Ma, X.; Li, J.; Xie, B.; Xiong, D. Numerical Simulation of Hydraulic Fracture Propagation in Conglomerate Reservoirs: A Case Study of Mahu Oilfield. Processes 2023, 11, 2073. [Google Scholar] [CrossRef]
- Chen, J. The influence of tensile strength difference with variable gravel sizes on the hydraulic fracture propagation in the conglomerate reservoir. Geofluids 2022, 5290189. [Google Scholar] [CrossRef]
- Li, J.; Du, B.; Ma, J.; Liu, R.; Shi, C.; Lin, B. Stress Interferences between Fractures and Fracturing Stages of a Horizontal Well in a Sandy Conglomerate Reservoir in Junggar Basin, Northwest China. Geofluids 2023, 4758872. [Google Scholar] [CrossRef]
- Sun, J.; You, X.; Zhang, Q.; Xue, J.; Chang, Q. Development characteristics and genesis of deep tight conglomerate reservoirs of Mahu area in Junggar Basin, China. Journal of Natural Gas Geoscience 2023, 8, 201–212. [Google Scholar] [CrossRef]
- Liu, P.; Shen, Y.; Meng, M.; Luo, S.; Zhong, Y.; Cen, Q. Experimental study of mechanical properties and fracture characteristics of conglomerates based on Mohr–Coulomb criteria. J Mar Sci Eng 2023, 11, 1219. [Google Scholar] [CrossRef]
- Xu, Z.; Zhao, H.; Liu, X.; Liang, L.; Luo, P. Three-Dimensional Numerical Simulation of Fracture Extension in Conglomerate Fracturing Considering Pore-Fracture Seepage and Study of Influencing Factors. Geofluids 2024, 7883958. [Google Scholar] [CrossRef]
- Li, L.; Meng, Q.; Wang, S.; Li, G.; Tang, C. A numerical investigation of the hydraulic fracturing behaviour of conglomerate in Glutenite formation. Acta Geotech 2013, 8, 597–618. [Google Scholar] [CrossRef]
- Xu, Z.; Liu, X.; Liang, L. Numerical investigation of hydraulic fracture propagation morphology in the conglomerate reservoir. Geofluids 2022, 6811300. [Google Scholar] [CrossRef]
- Zhu, Y.; Deng, Y.; Qin, J.; Zhang, J.; Zou, Y.; Zhang, S.; Liu, S. Fracture propagation mechanism of tight conglomerate reservoirs in Mahu Sag. Processes 2023, 11, 1958. [Google Scholar] [CrossRef]
- Luo, S.; Zhao, Y.; Zhang, L.; Chen, Z.; Zhang, X. Integrated simulation for hydraulic fracturing, productivity prediction, and optimization in tight conglomerate reservoirs. Energ Fuel 2021, 35, 14658–14670. [Google Scholar] [CrossRef]
- Liu, S.K.; Zou, Y.S.; Zhang, S.C.; Ma, X.F.; Liu, L.; Zhang, X.H.; Zhao, Z.W.; Zhang, Z.P. In Study on rock mechanics microscopic heterogeneity characterization, fracture propagation simulation and Frac-ability prediction of complex mode conglomerate in Mahu Block, 2024/1/1, 2024; ARMA: 2024; pp. D022S024R005.
- Yi, T.; Peden, J.M. A comprehensive model of fluid loss in hydraulic fracturing. Spe Production Facilities 1994, 9, 267–272. [Google Scholar] [CrossRef]
- Penny, G.S.; Conway, M.W.; Lee, W. Control and modeling of fluid leakoff during hydraulic fracturing. Journal of Petroleum Technology 1985, 37, 1071–1081. [Google Scholar] [CrossRef]
- Wang, M.; Leung, J.Y. Numerical investigation of fluid-loss mechanisms during hydraulic fracturing flow-back operations in tight reservoirs. J Petrol Sci Eng 2015, 133, 85–102. [Google Scholar] [CrossRef]
- Yarushina, V.M.; Bercovici, D.; Oristaglio, M.L. Rock deformation models and fluid leak-off in hydraulic fracturing. Geophys J Int 2013, 194, 1514–1526. [Google Scholar] [CrossRef]
- Javadpour, F.; McClure, M.; Naraghi, M.E. Slip-corrected liquid permeability and its effect on hydraulic fracturing and fluid loss in shale. Fuel 2015, 160, 549–559. [Google Scholar] [CrossRef]
- Al-Ameri, A.; Gamadi, T.; Ispas, I.; Watson, M. In Hydraulic fracturing design in shale formations based on the impact of fracturing additives on the fluid loss and flowback, 2018/1/1, 2018; SPE: 2018; pp. D043S007R006.
- Yan, C.; Zheng, H. FDEM-flow3D: A 3D hydro-mechanical coupled model considering the pore seepage of rock matrix for simulating three-dimensional hydraulic fracturing. Comput Geotech 2017, 81, 212–228. [Google Scholar] [CrossRef]
- Santillán, D.; Juanes, R.; Cueto Felgueroso, L. Phase field model of fluid-driven fracture in elastic media: Immersed-fracture formulation and validation with analytical solutions. Journal of Geophysical Research Solid Earth 2017, 122, 2565–2589. [Google Scholar] [CrossRef]
- Wang, H. Numerical modeling of non-planar hydraulic fracture propagation in brittle and ductile rocks using XFEM with cohesive zone method. J Petrol Sci Eng 2015, 135, 127–140. [Google Scholar] [CrossRef]
- Yan, C.; Jiao, Y. A 2D fully coupled hydro-mechanical finite-discrete element model with real pore seepage for simulating the deformation and fracture of porous medium driven by fluid. Comput Struct 2018, 196, 311–326. [Google Scholar] [CrossRef]
- Chen, B.; Barboza, B.R.; Sun, Y.; Bai, J.; Thomas, H.R.; Dutko, M.; Cottrell, M.; Li, C. A review of hydraulic fracturing simulation. Arch Comput Method E 2021, 1–58. [Google Scholar] [CrossRef]
Figure 1.
Filtration Pathways in Gravel-Bearing Sandstone Formation with Natural and Artificial Fractures.
Figure 1.
Filtration Pathways in Gravel-Bearing Sandstone Formation with Natural and Artificial Fractures.
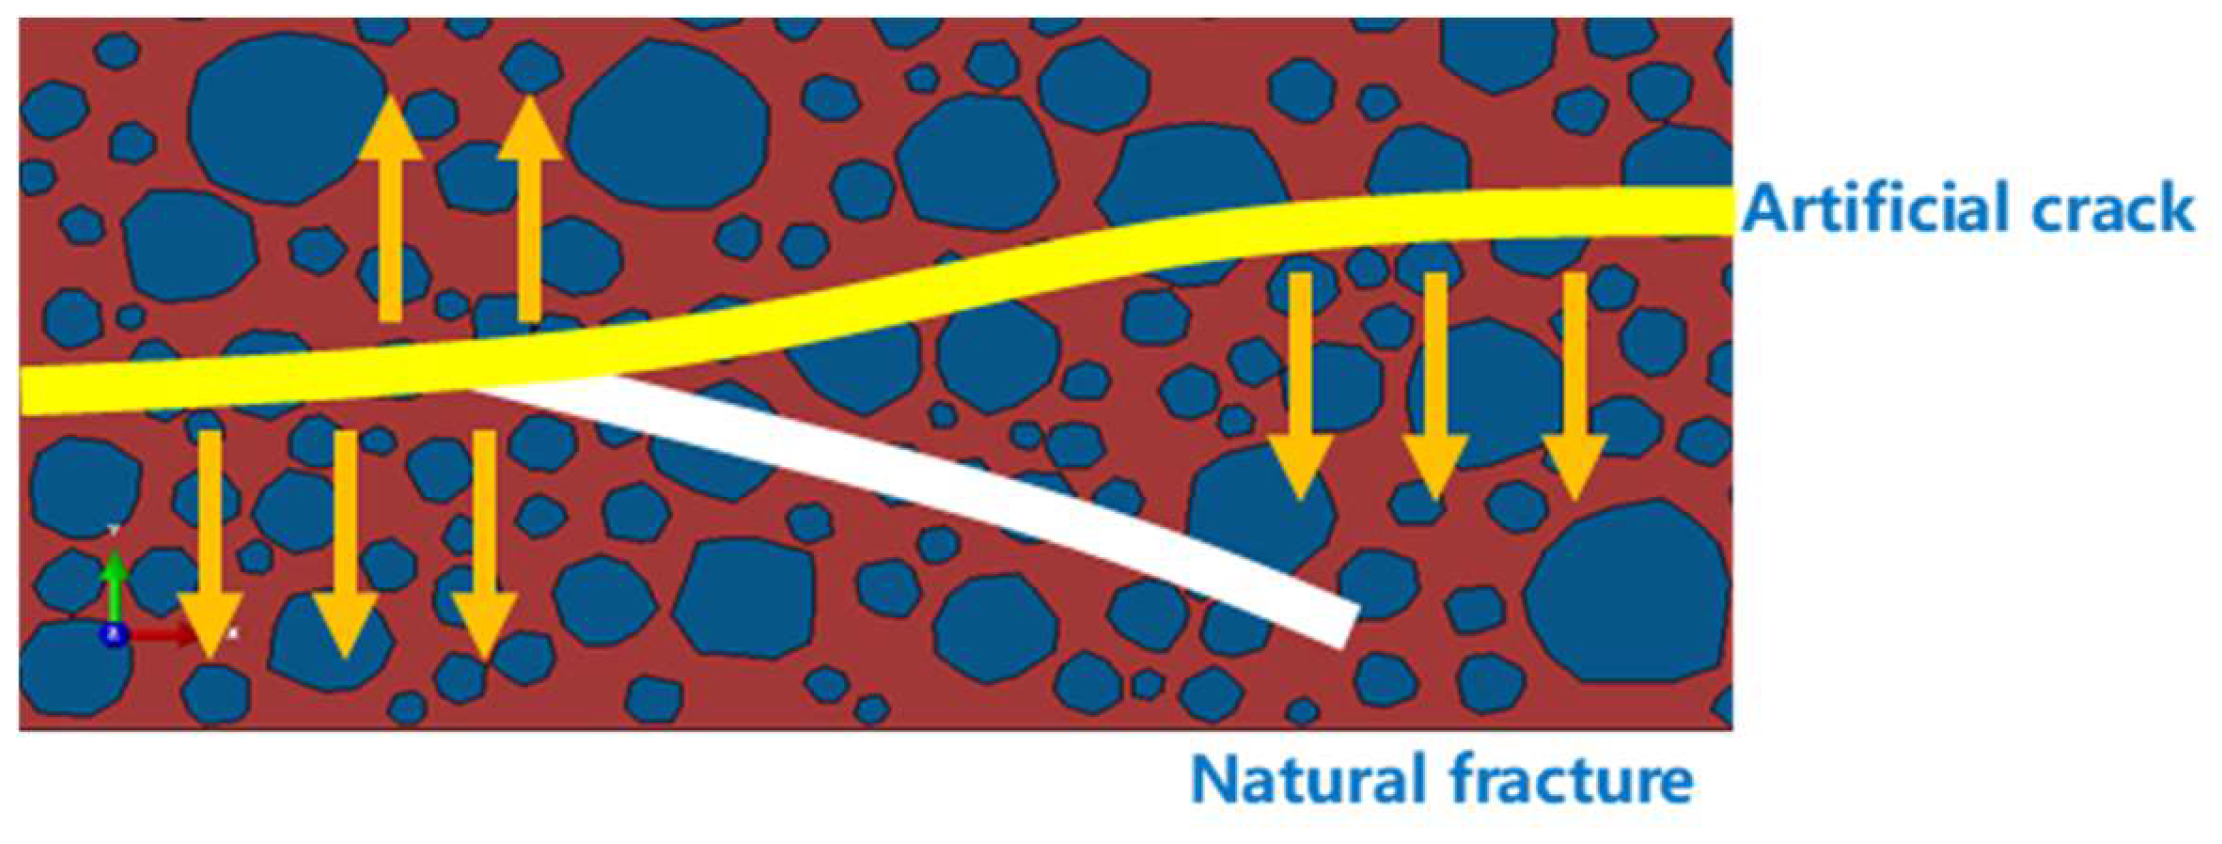
Figure 2.
Schematic diagram of fluid loss decomposition of conglomerate.
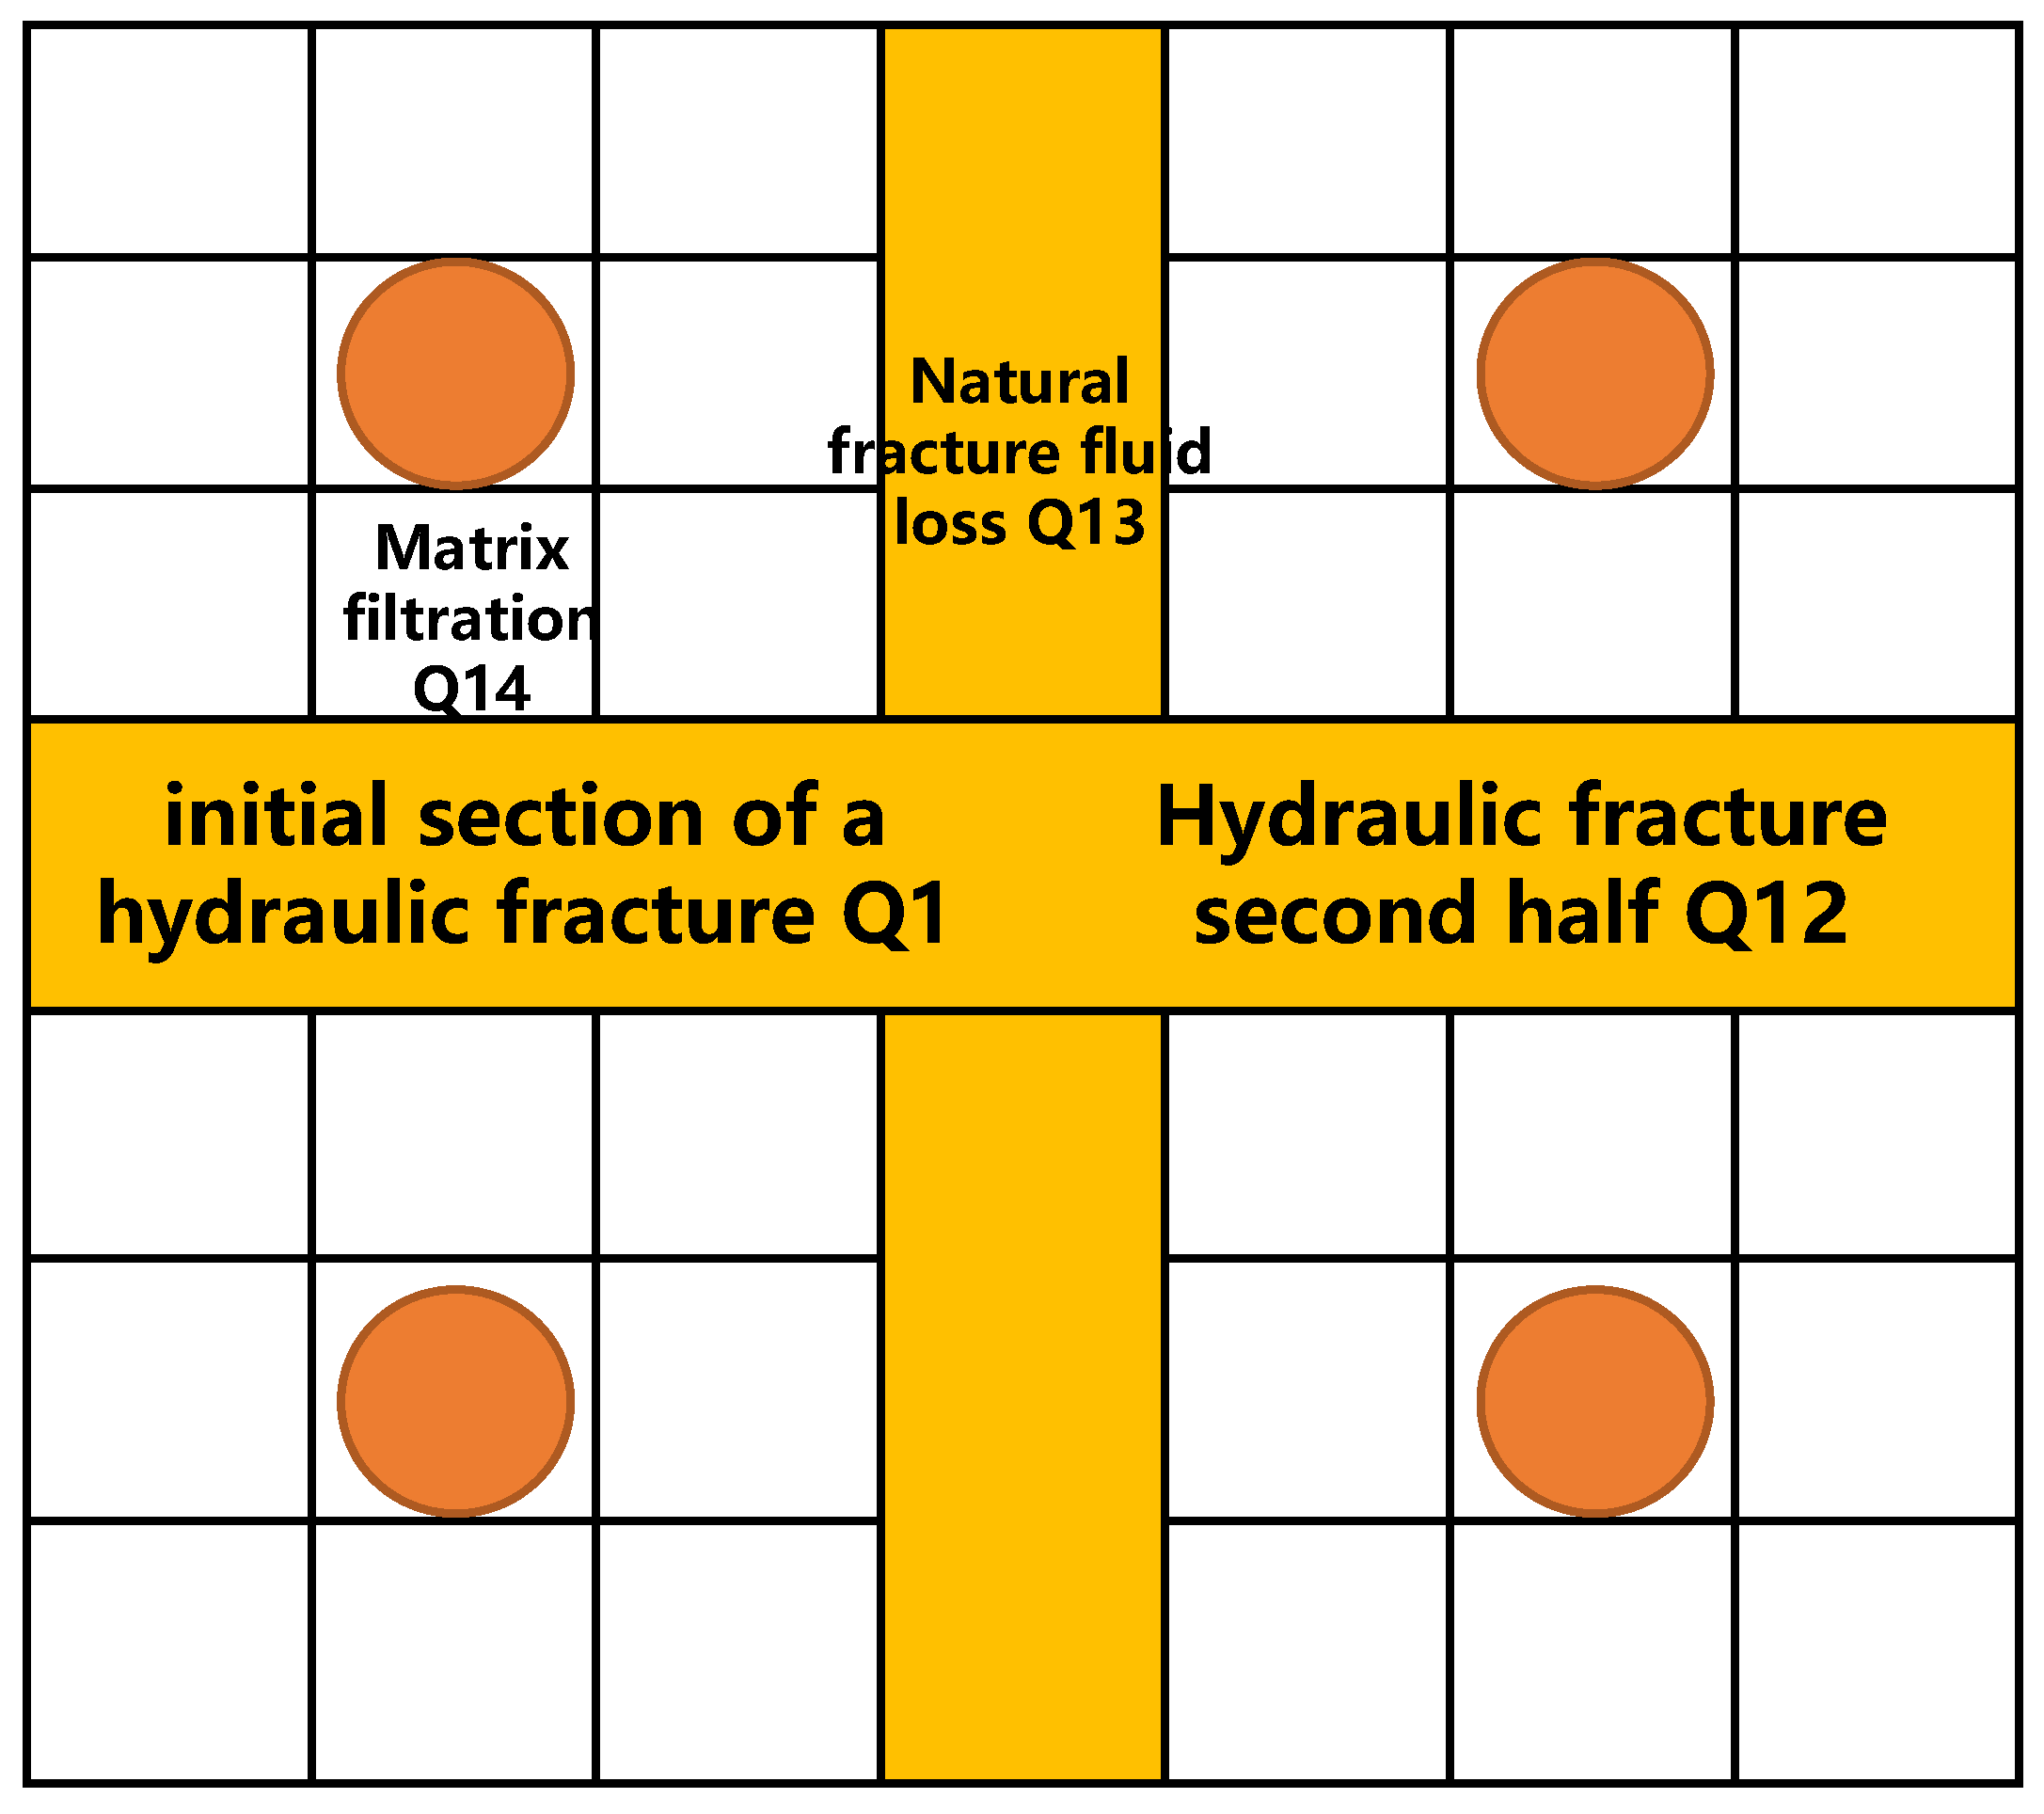
Figure 3.
Schematic diagram of filtration loss decomposition of sand conglomerate.
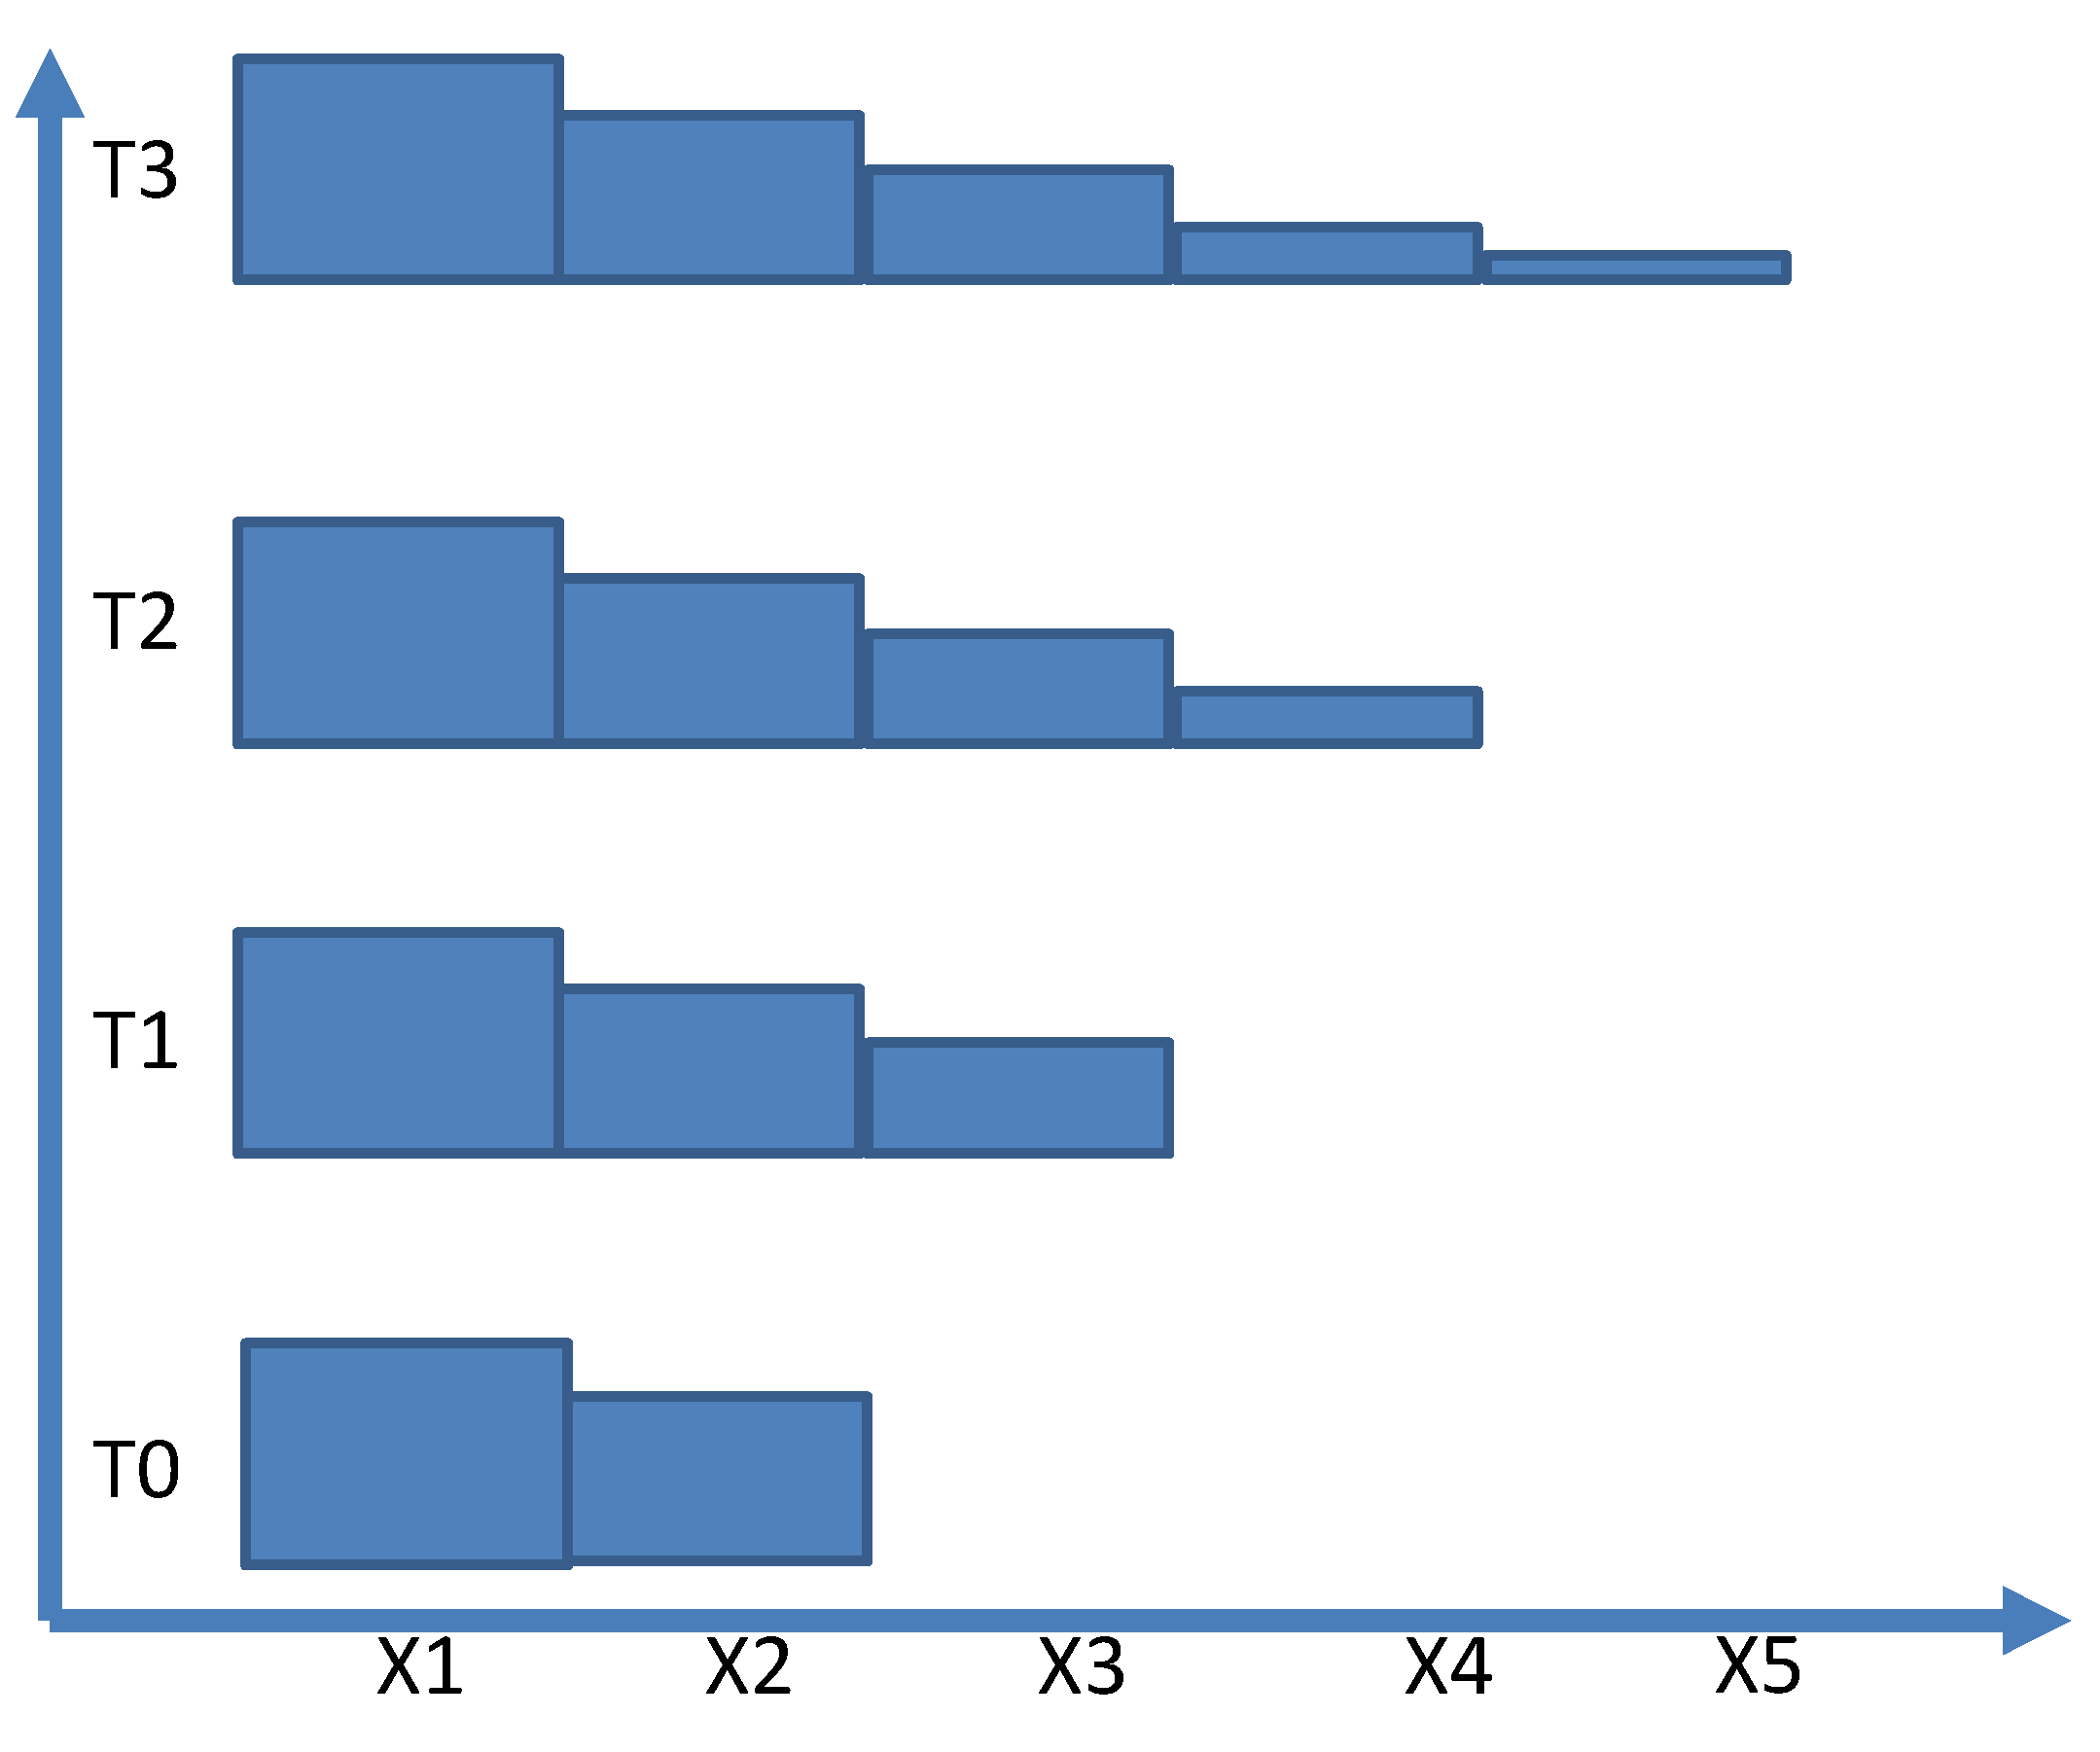
Figure 4.
Relation of filtration rate with time under different gravel content.
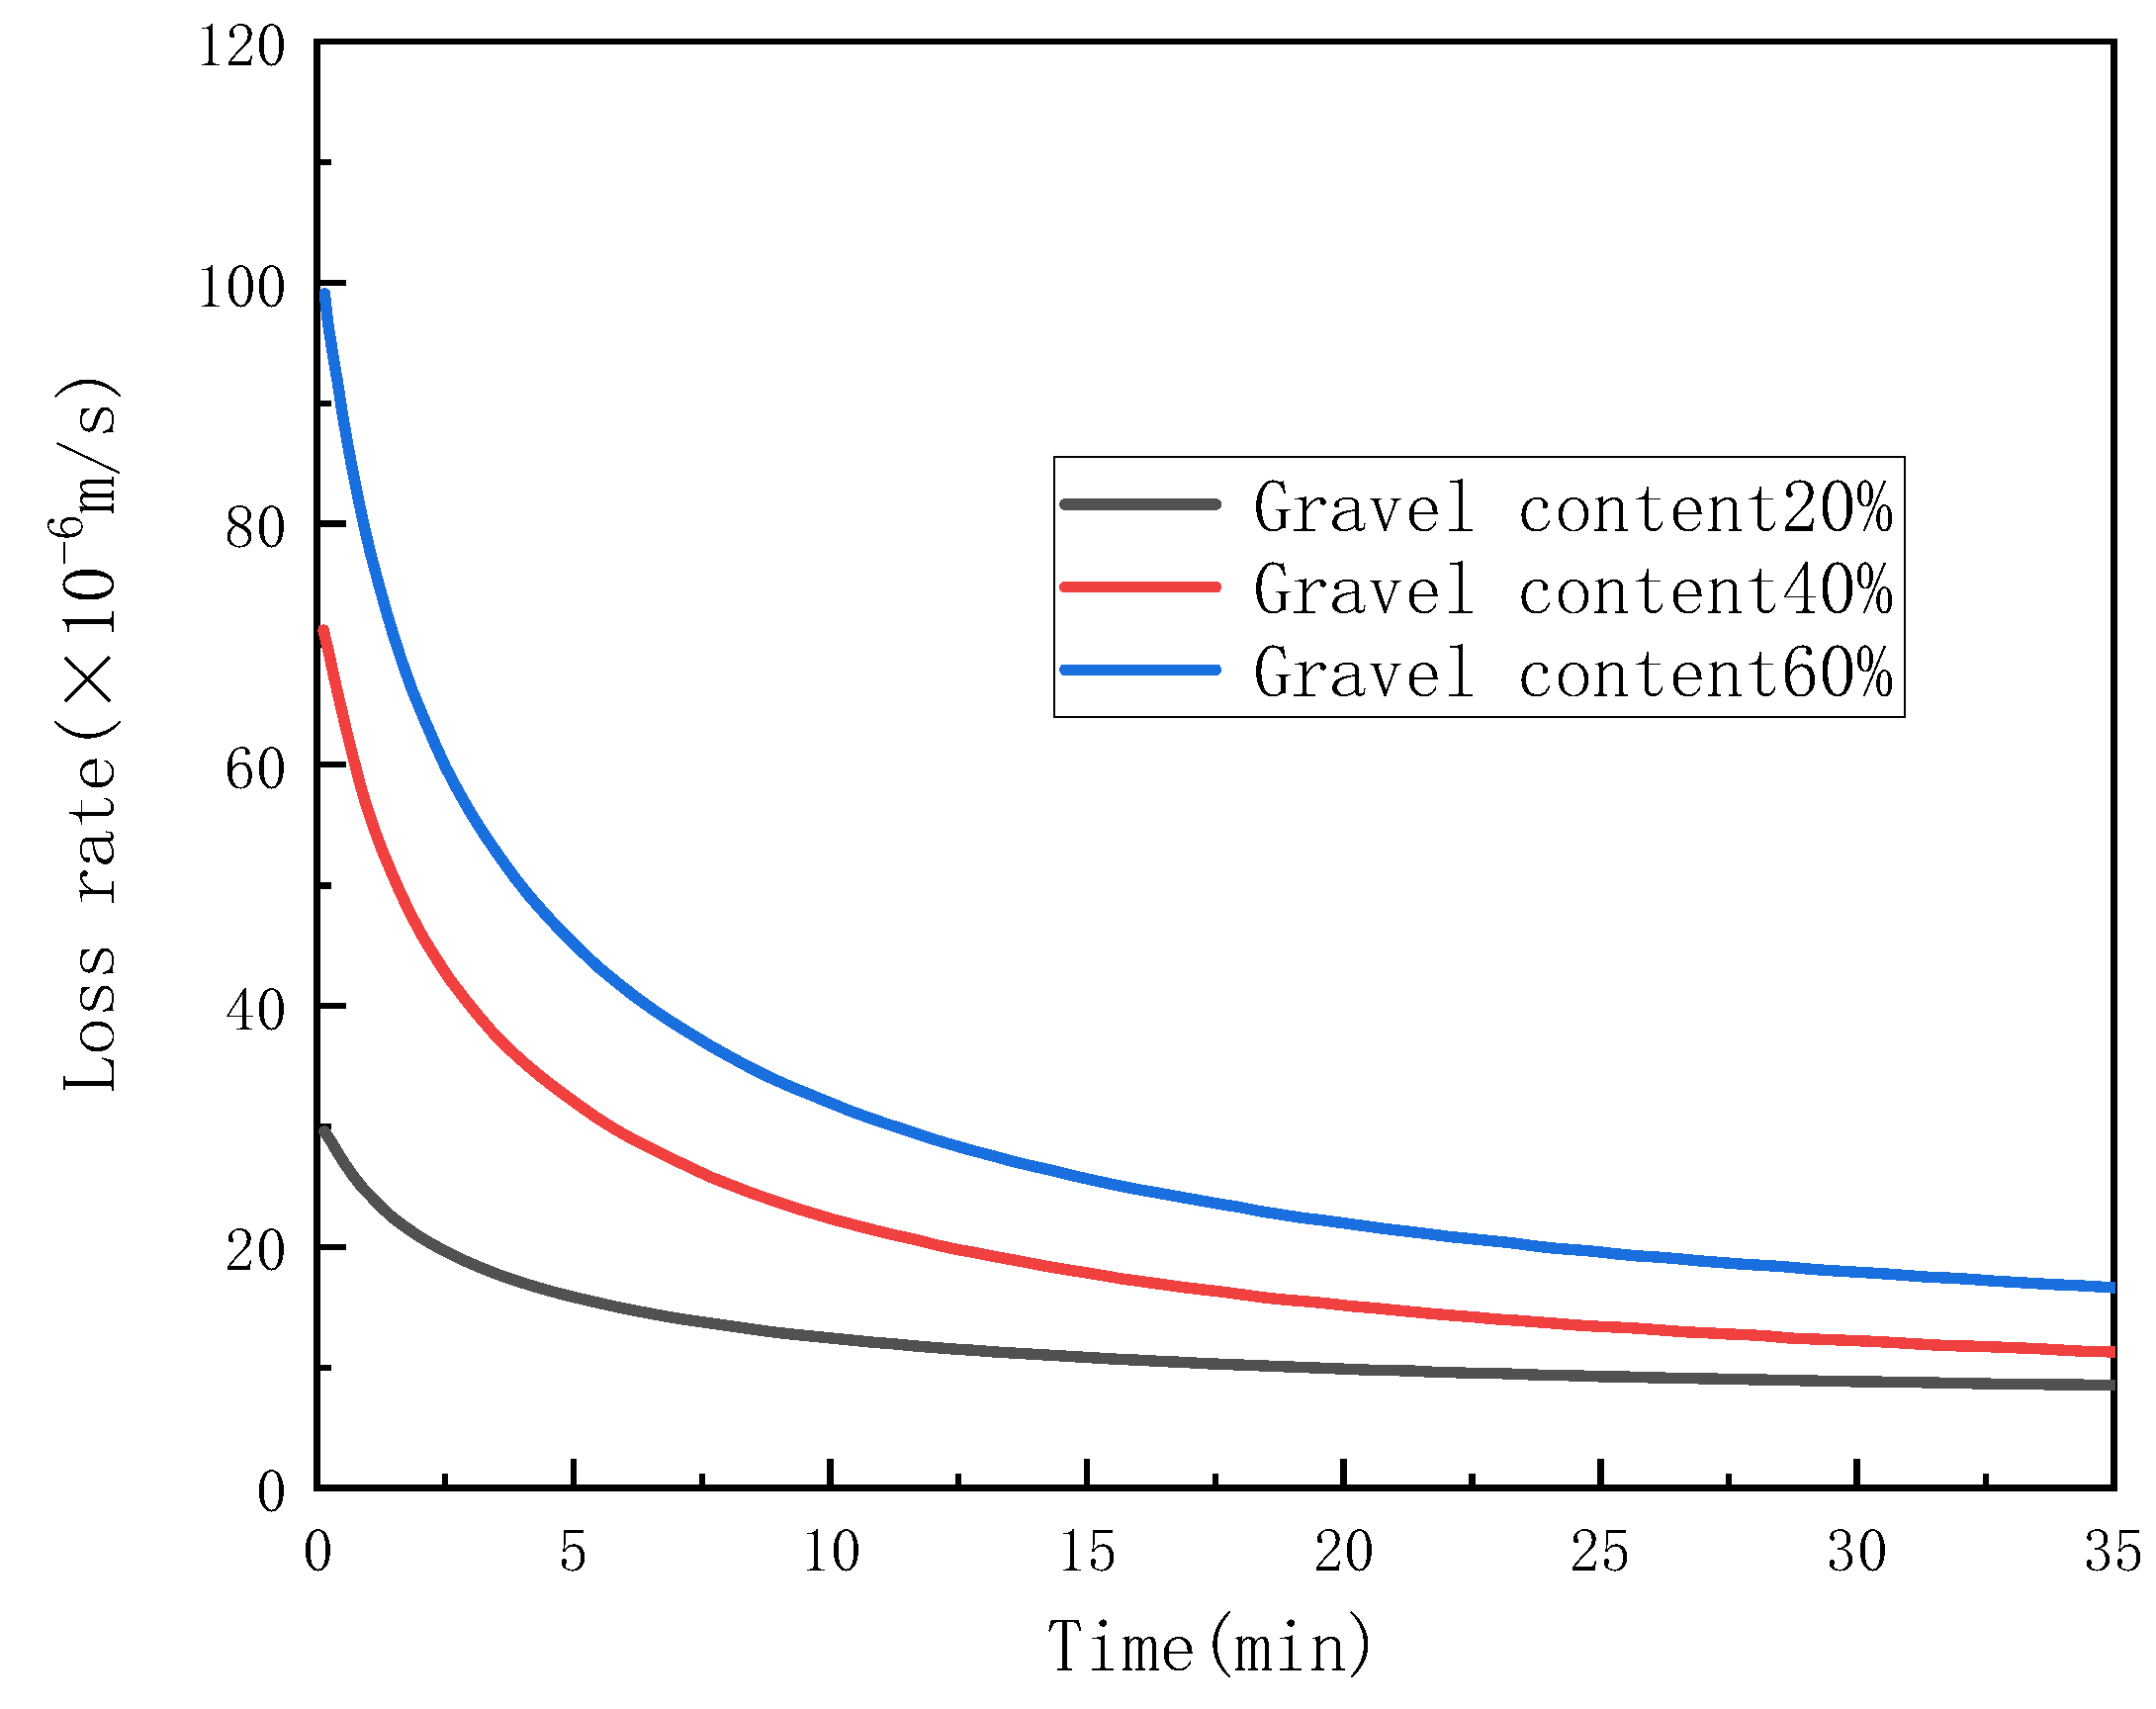
Figure 5.
Filtration rate under different gravel content.
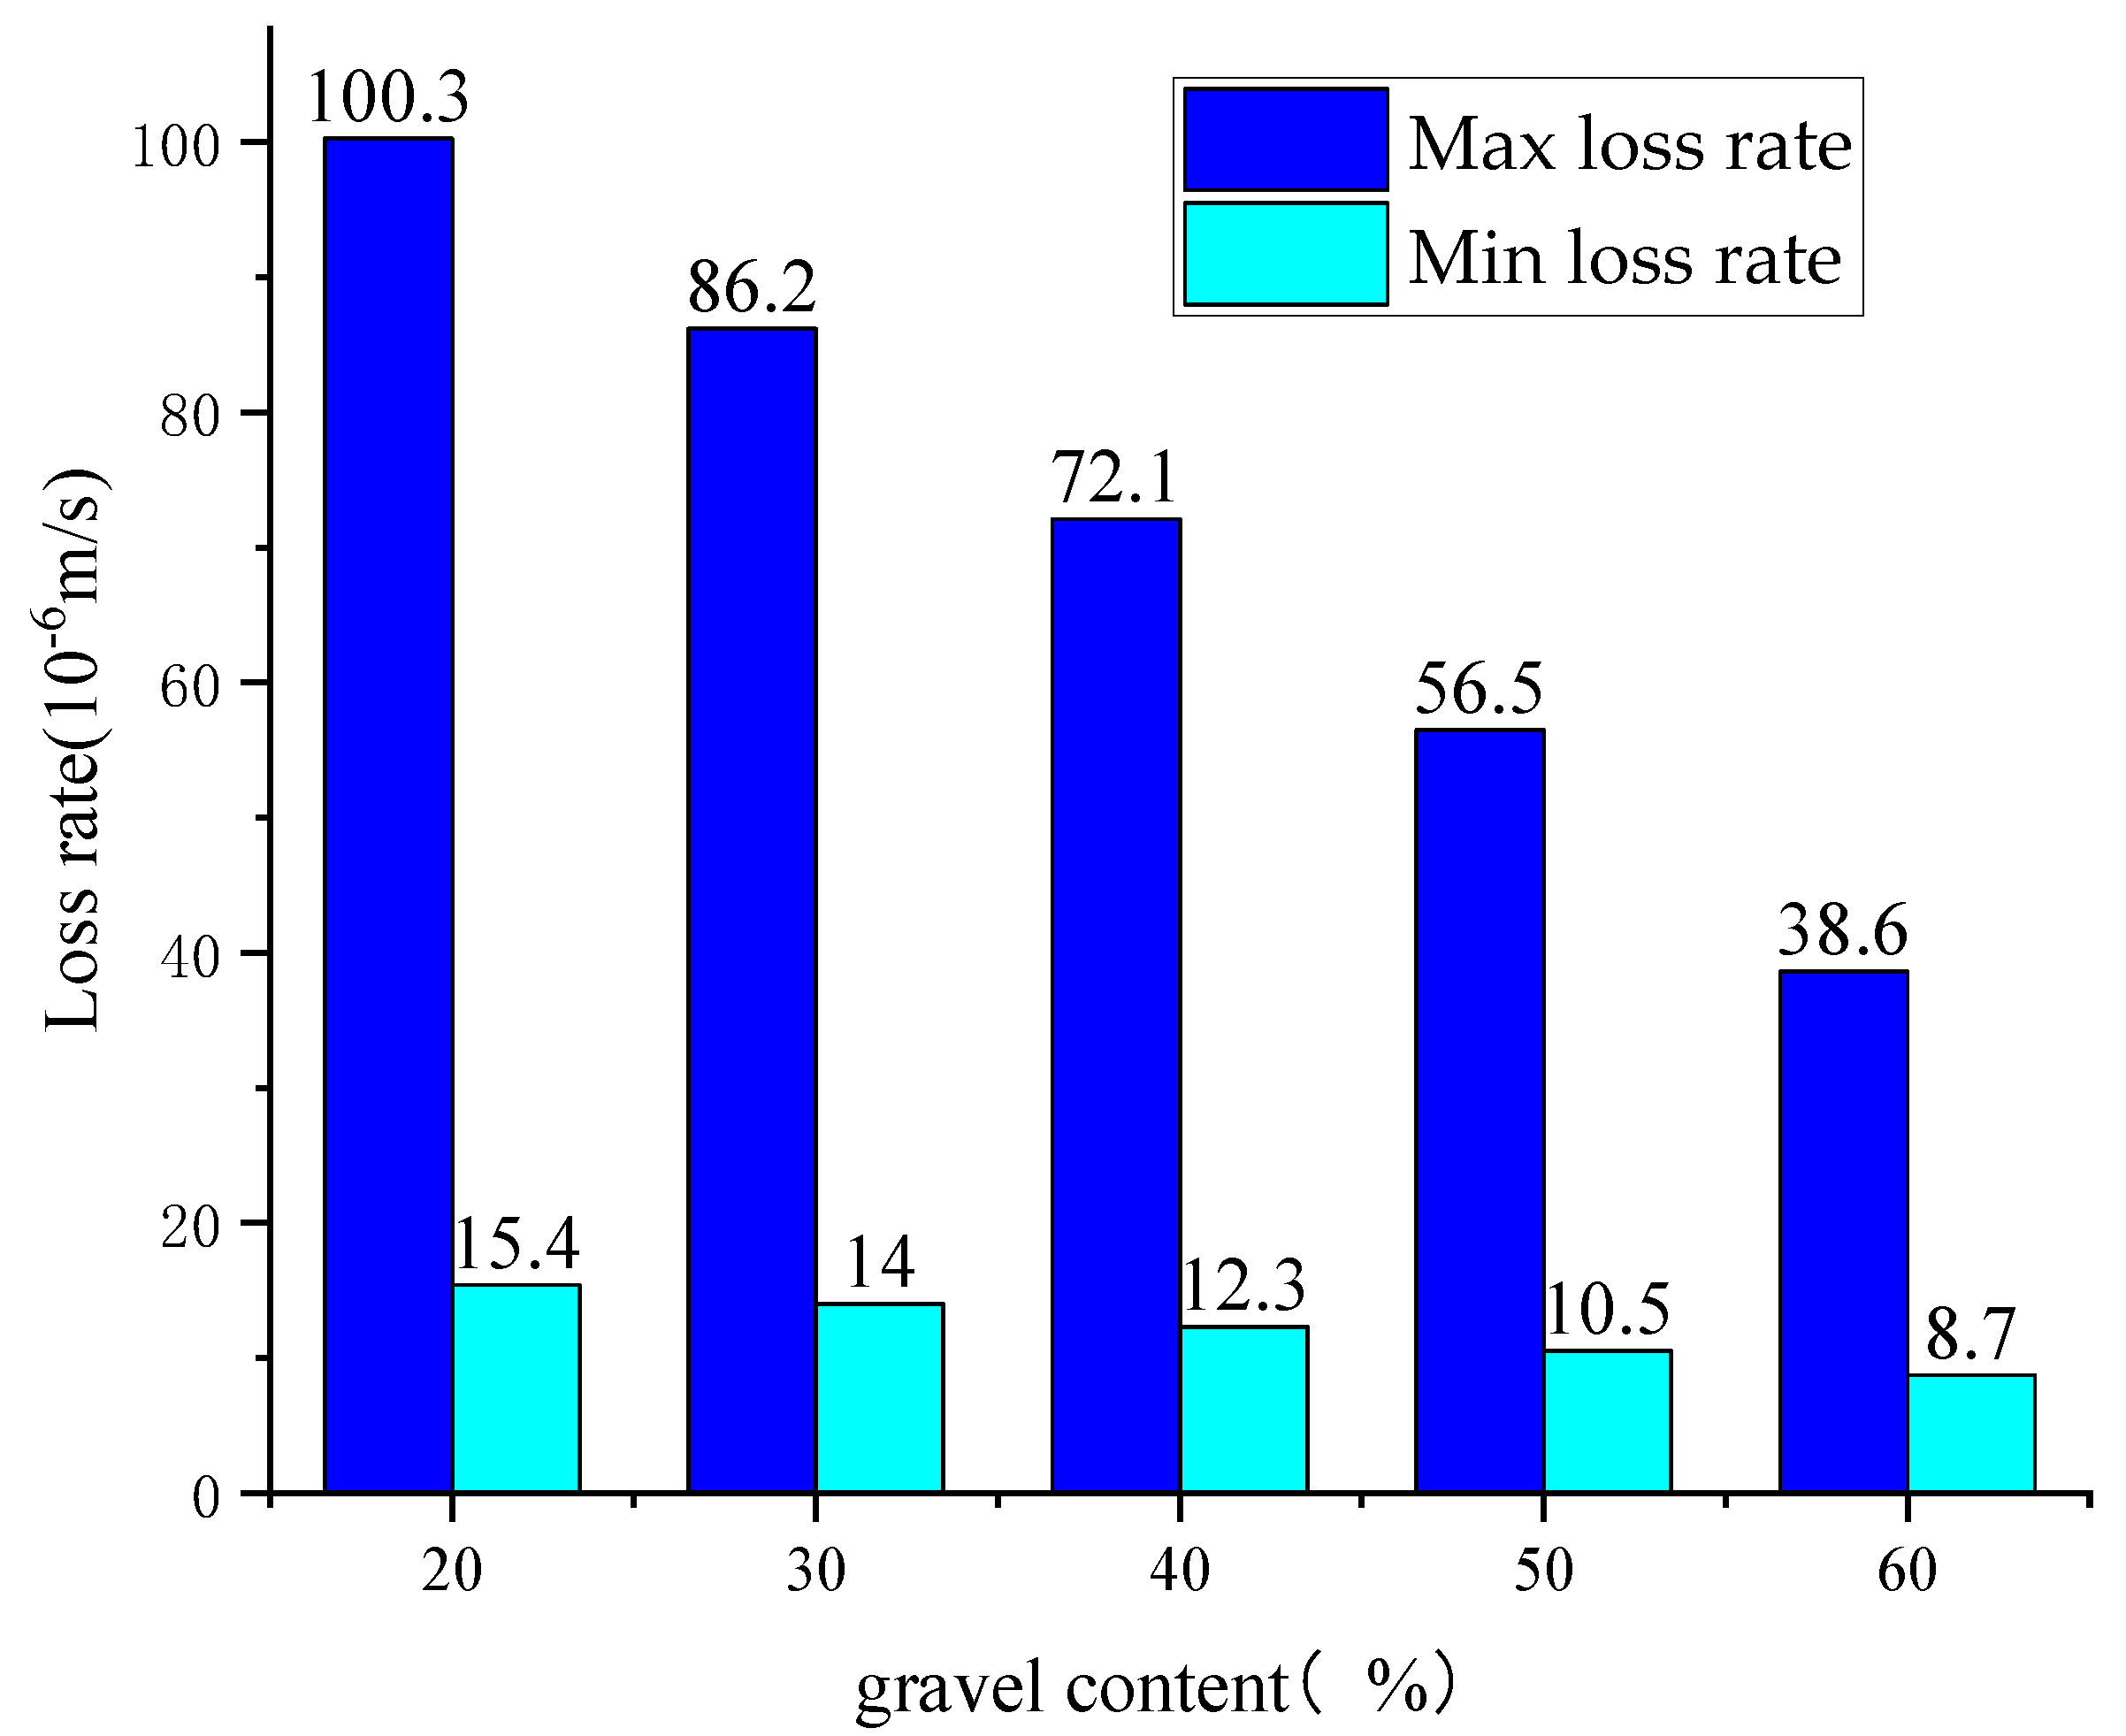
Figure 6.
Relation of filtration rate with time under different gravel diameter.
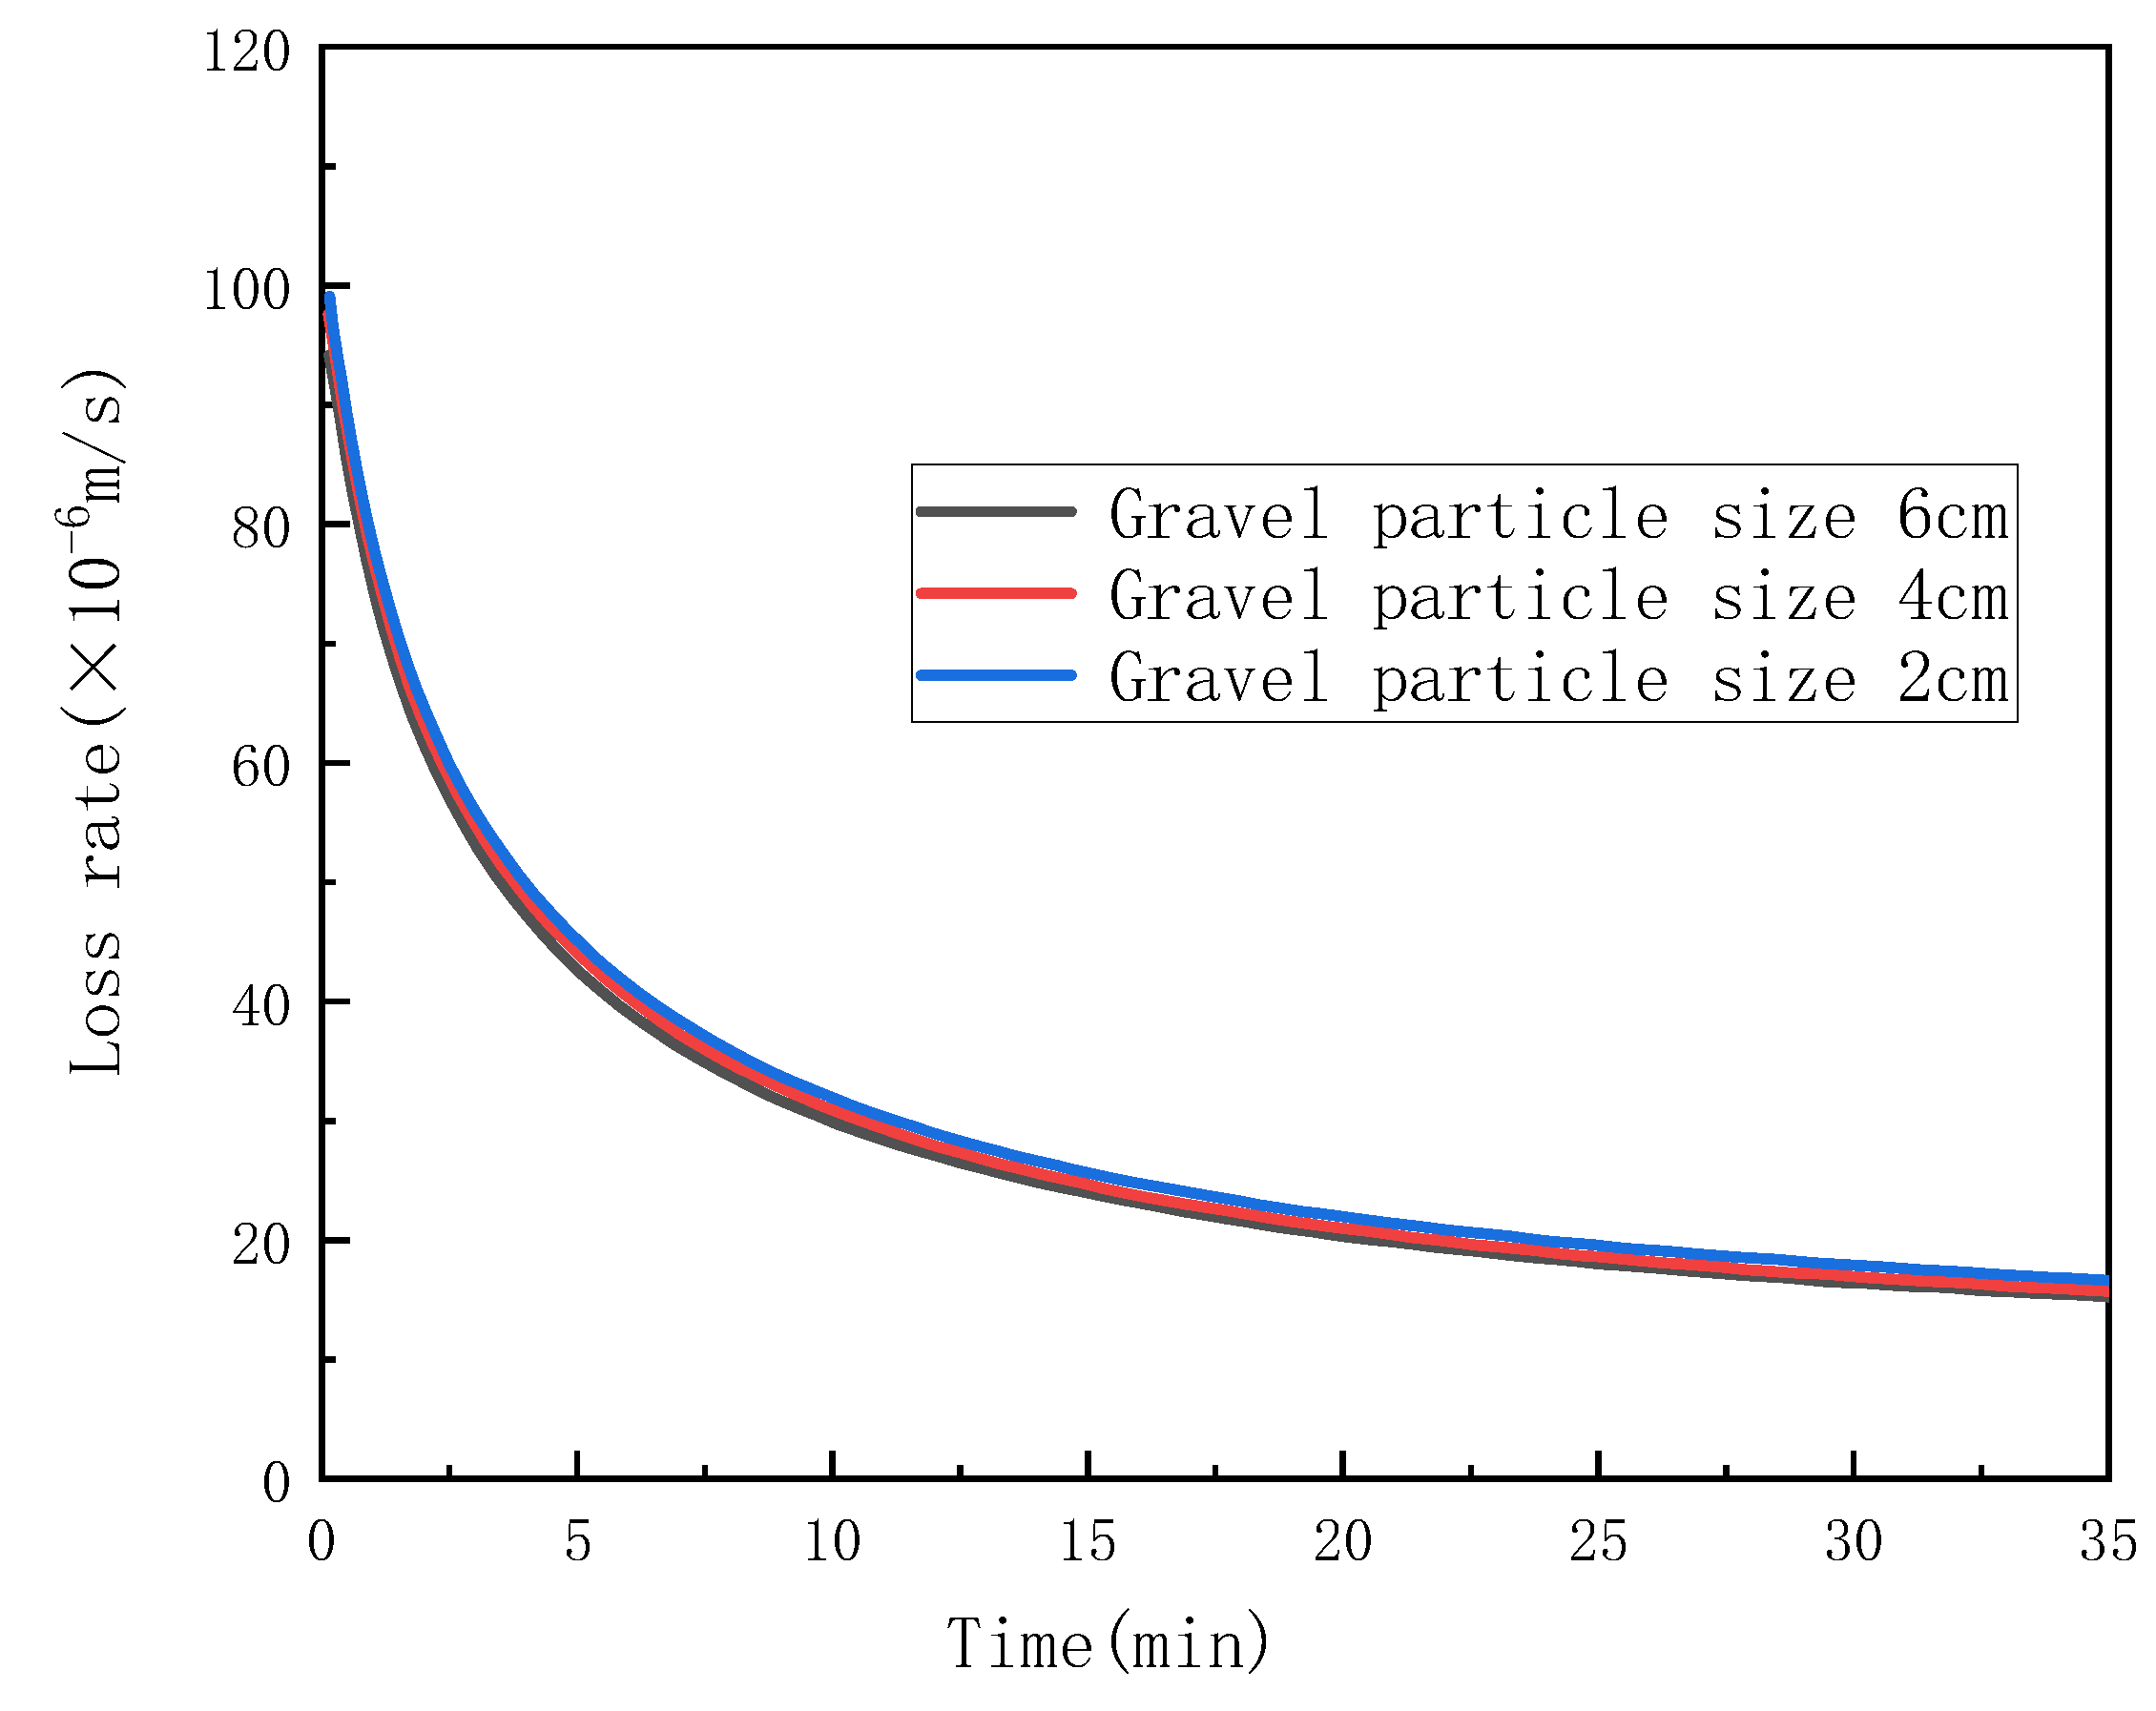
Figure 7.
Filtration rate under different gravel sizes.
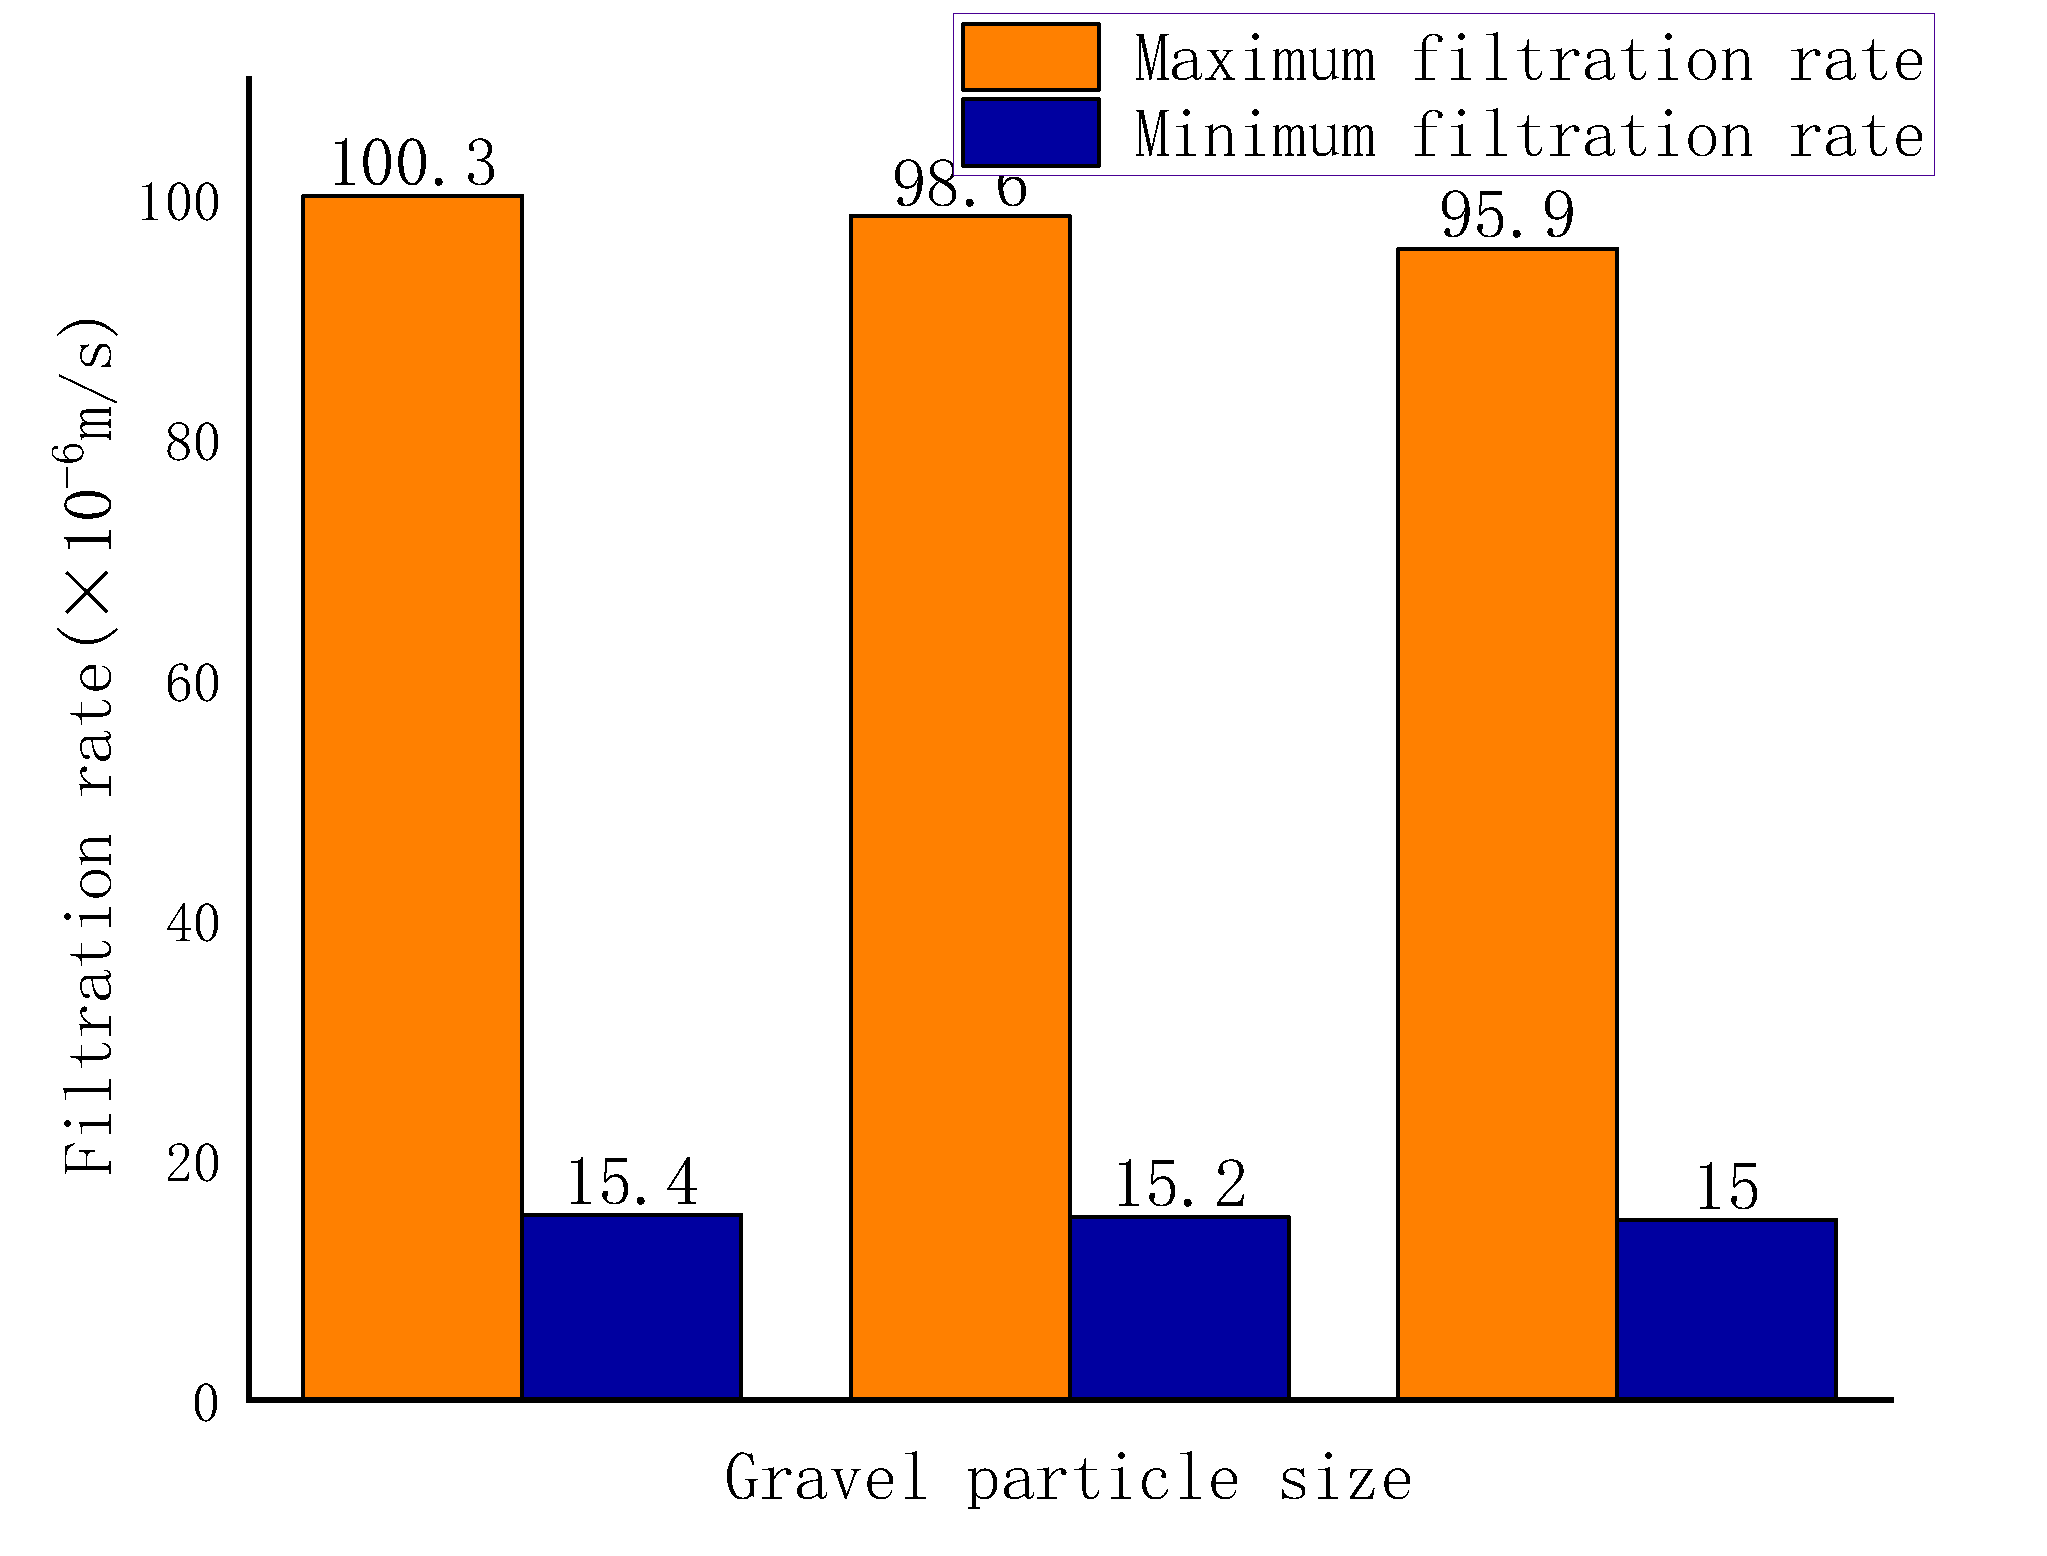
Figure 8.
Relation of filtration rate of different fracture densities with time.
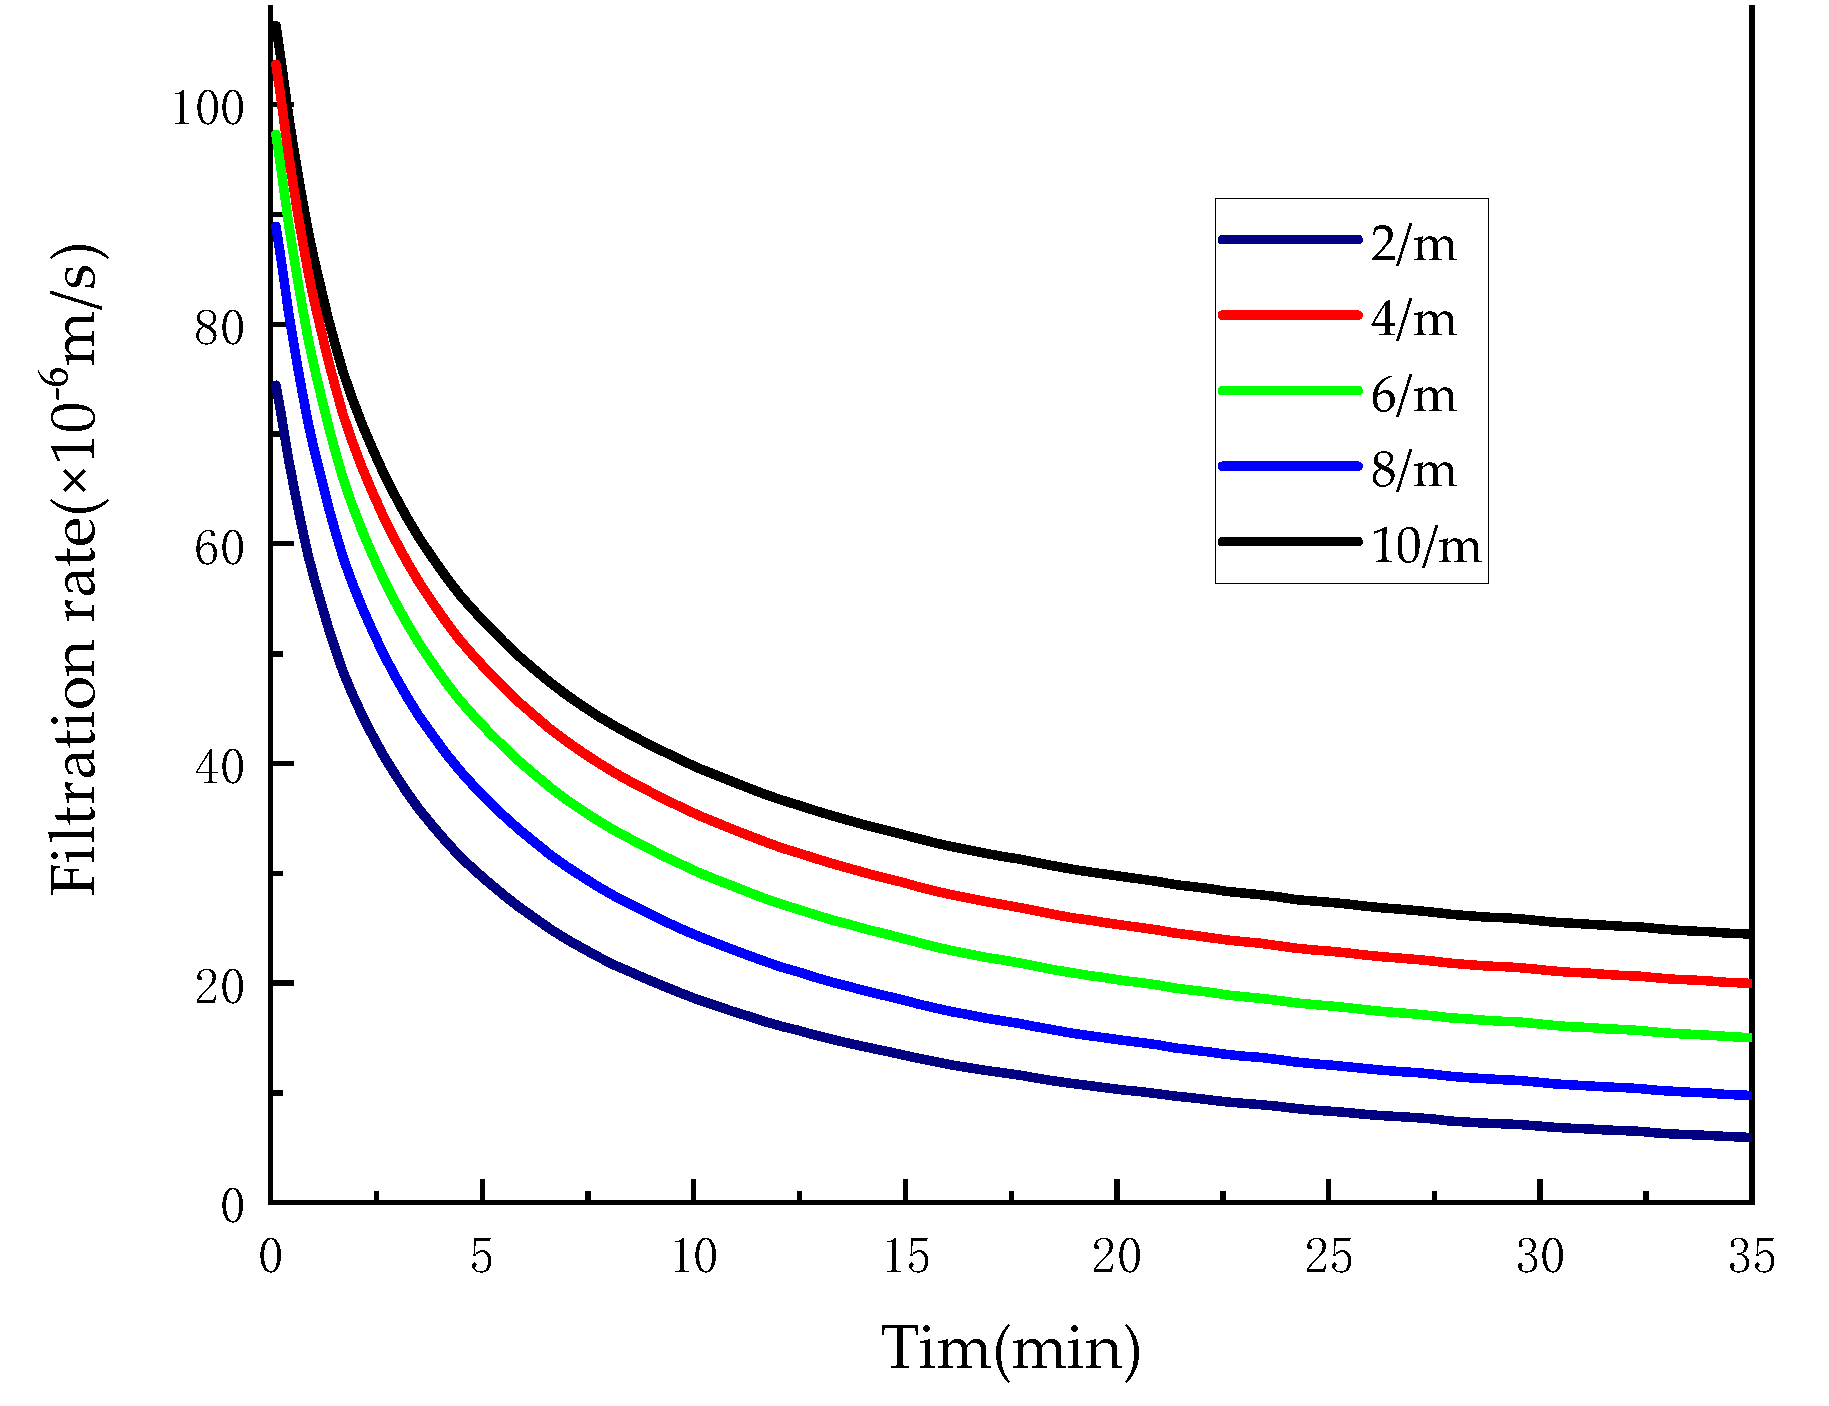
Figure 9.
Filtration rate of different fracture densities.
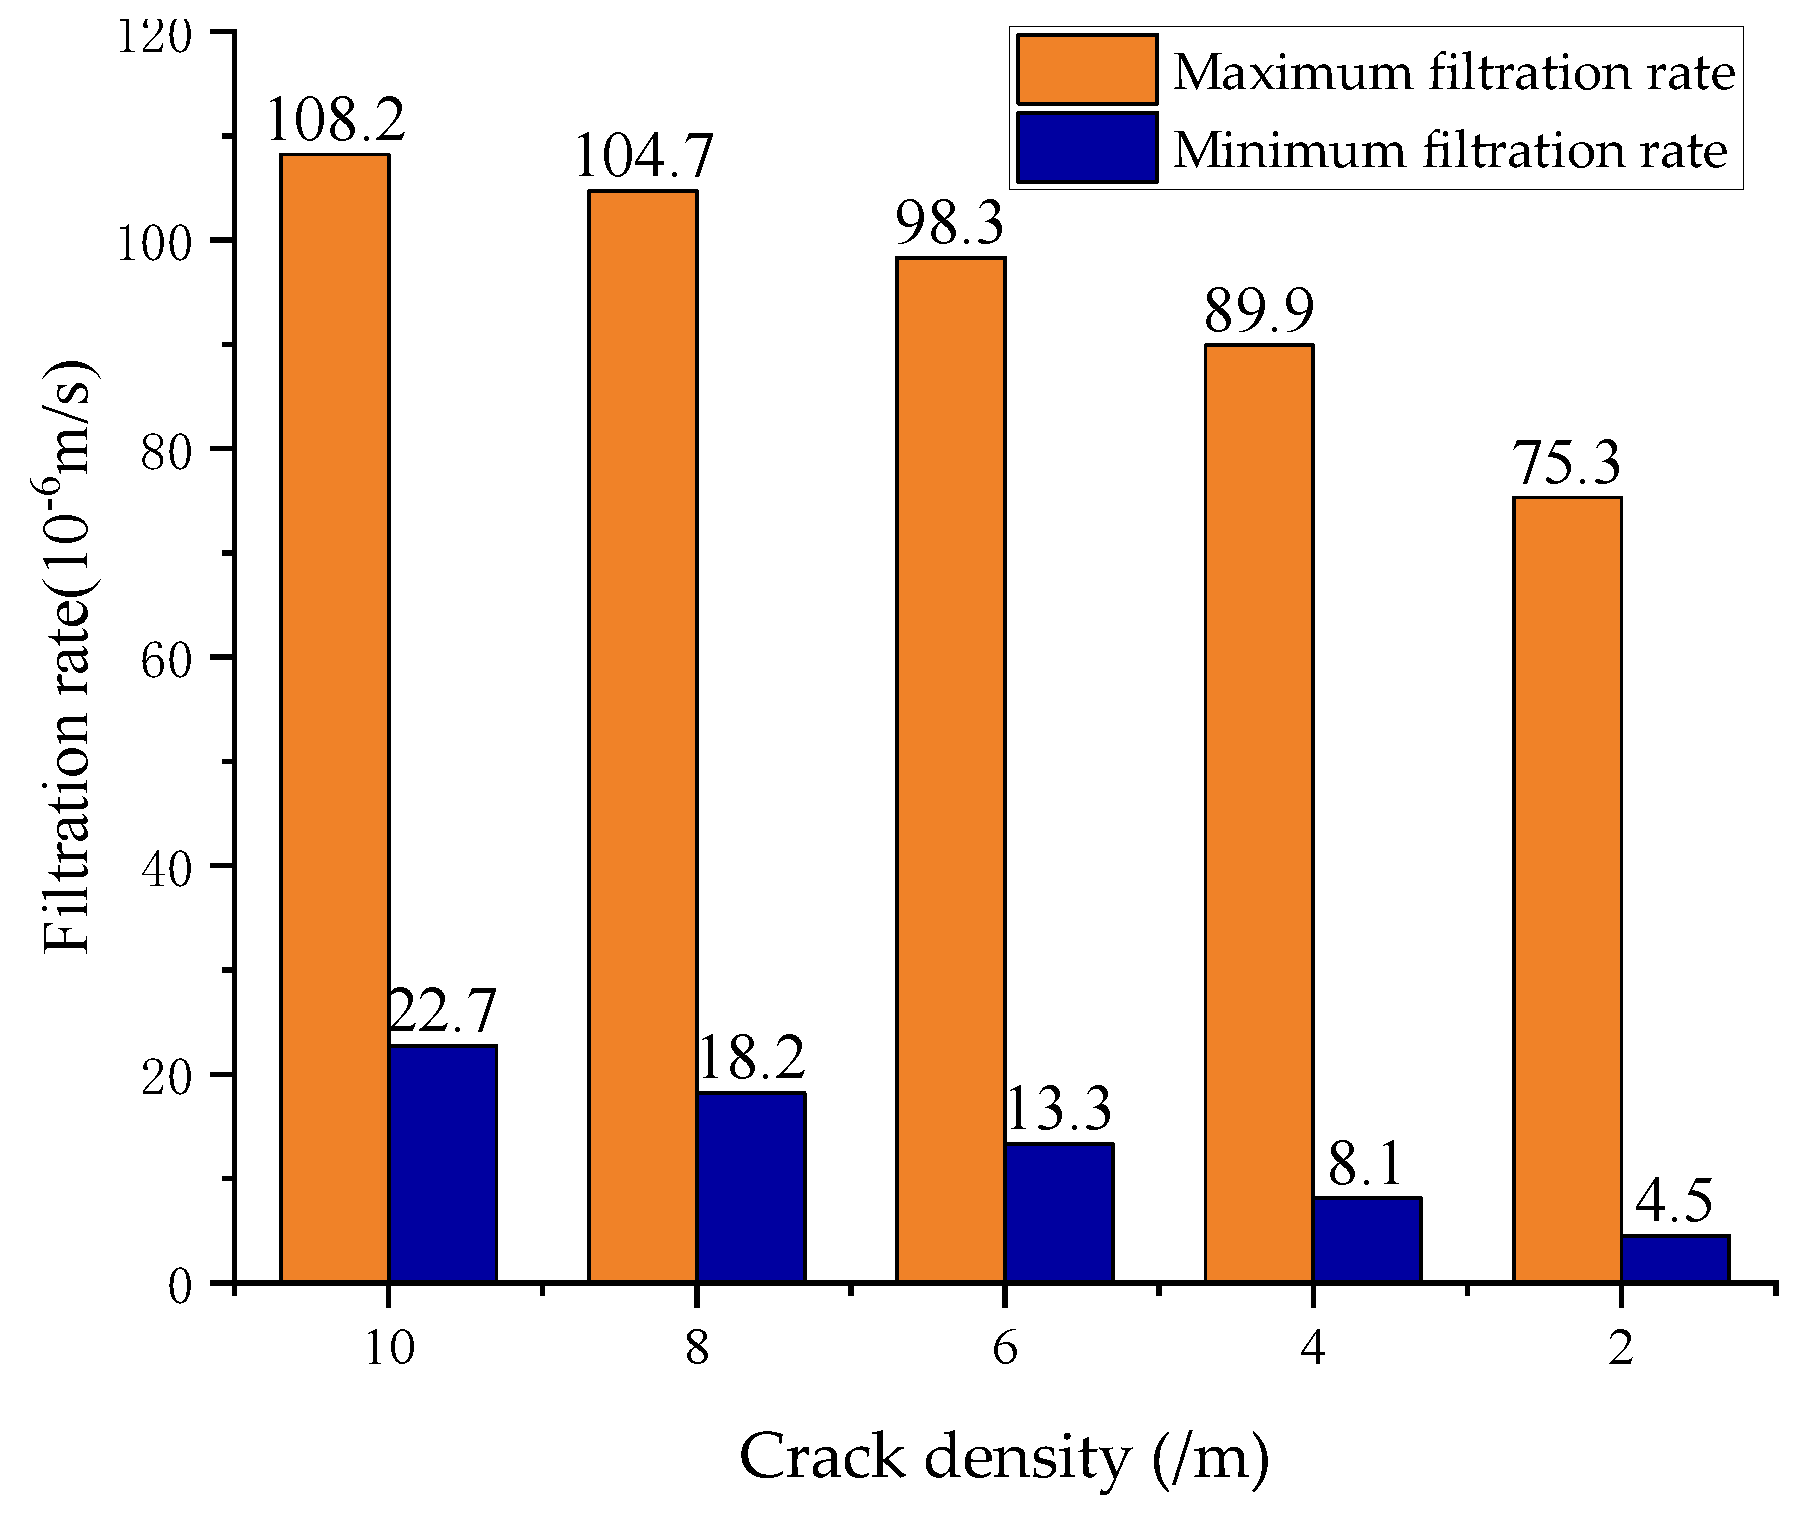
Figure 10.
Relation of filtration rate of different crack widths with time.
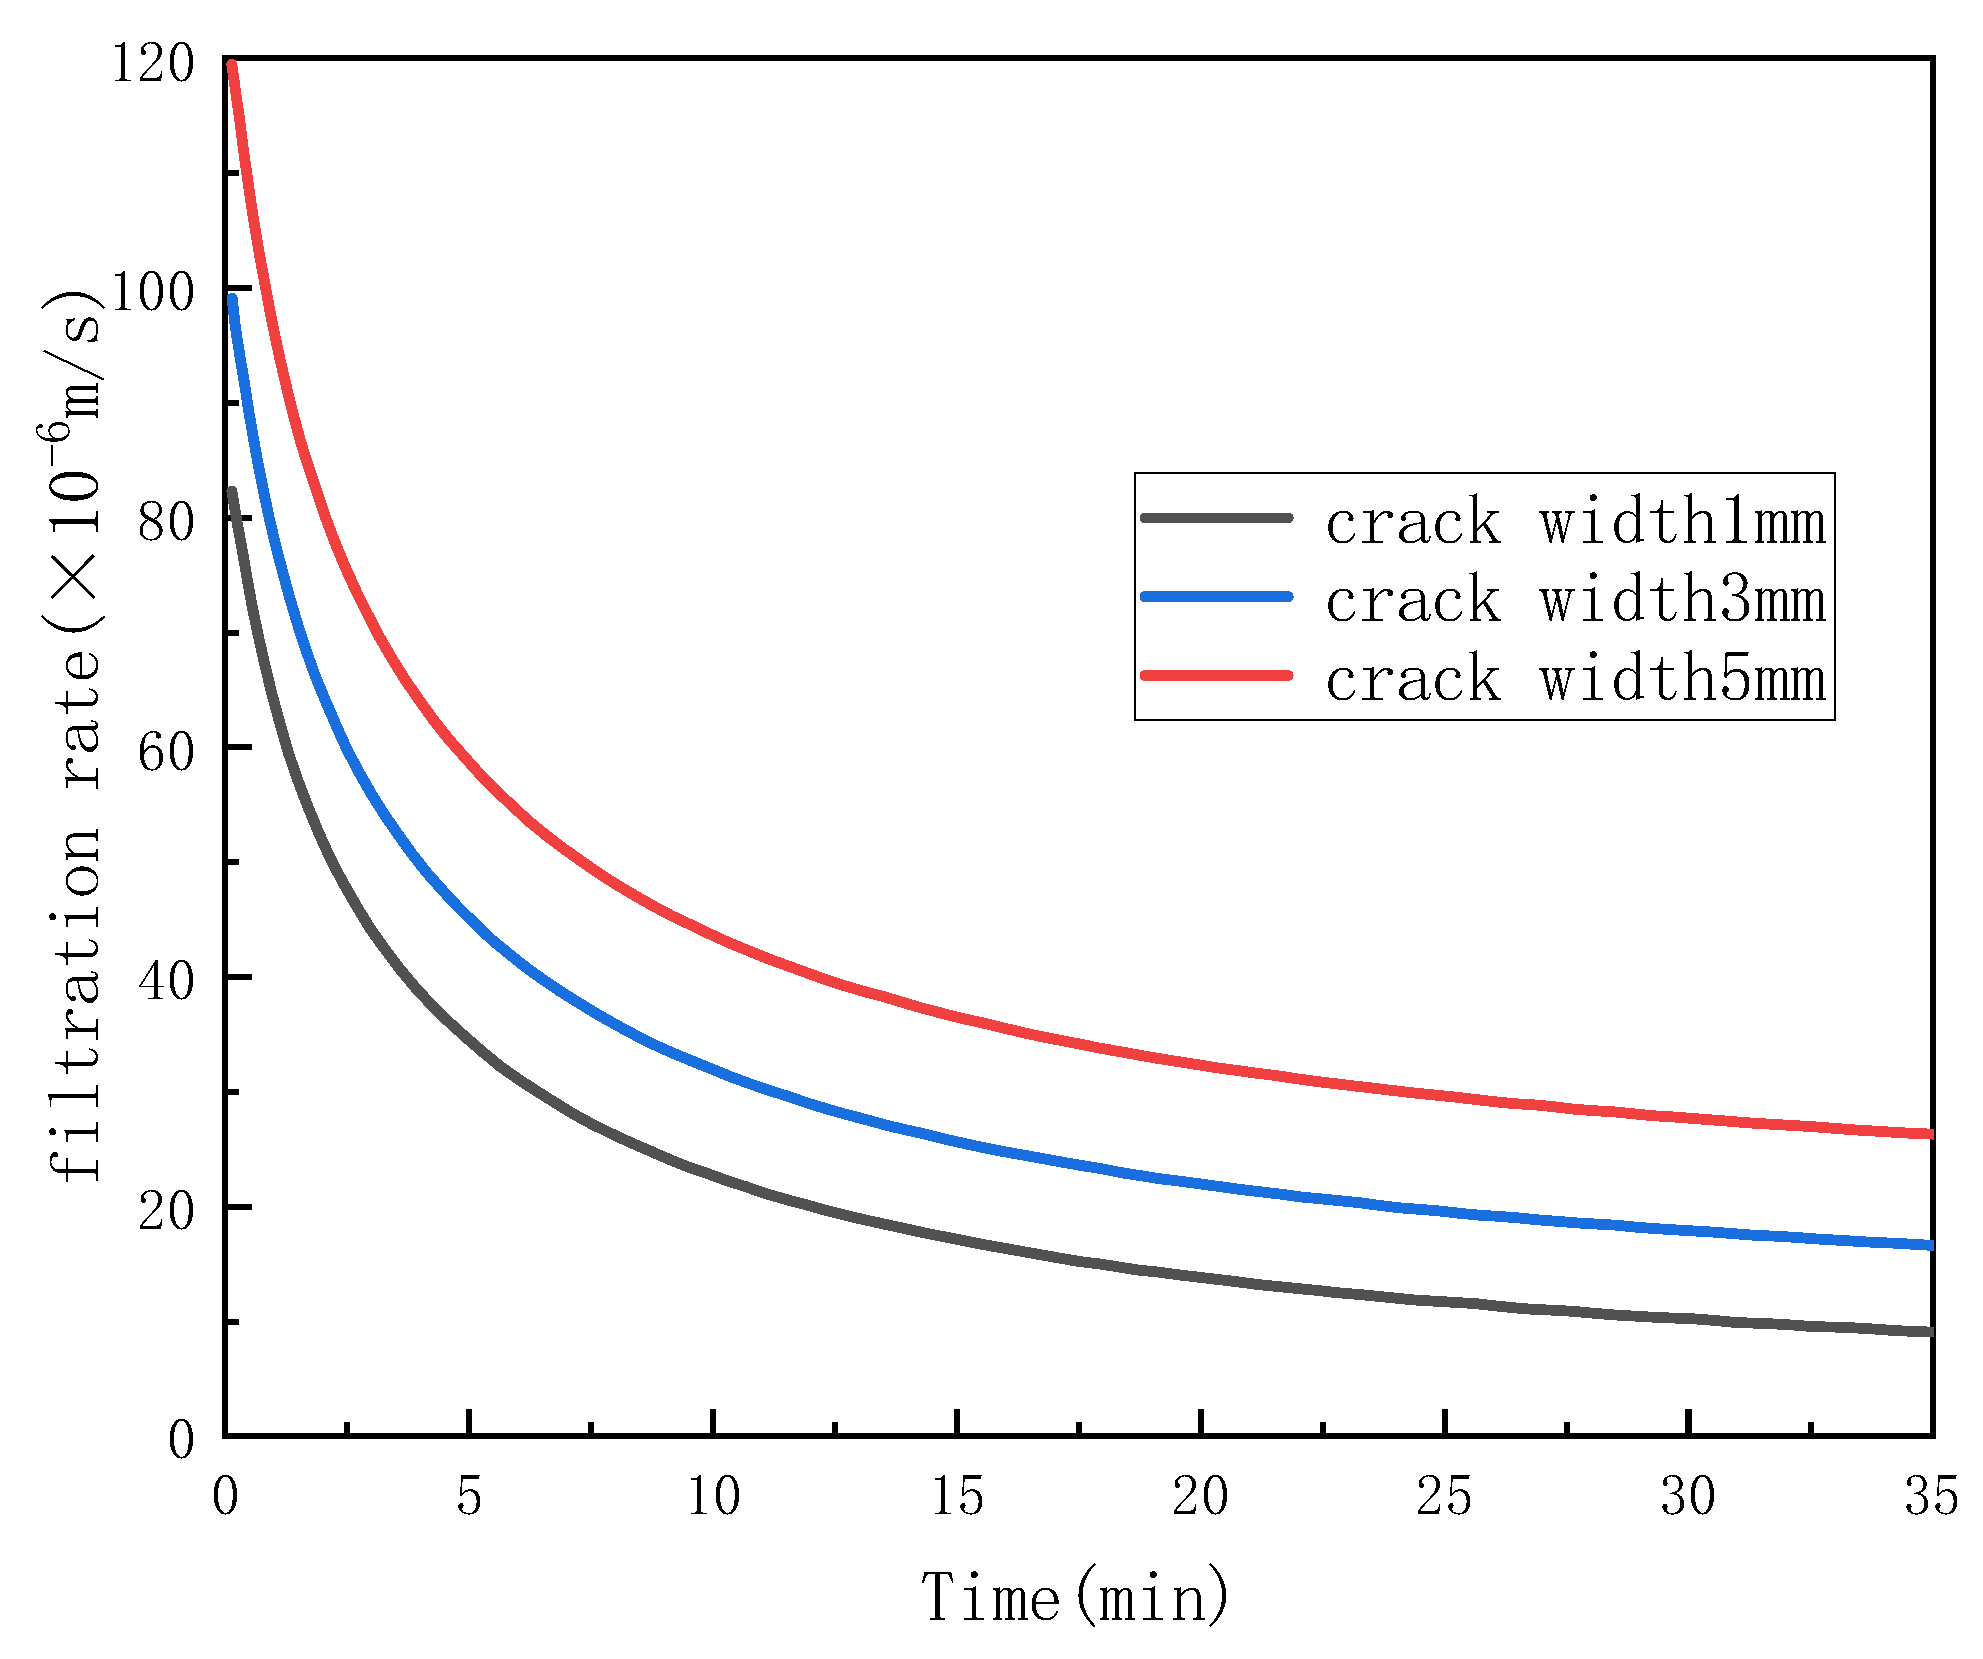
Figure 11.
Filtration rate of different crack widths.
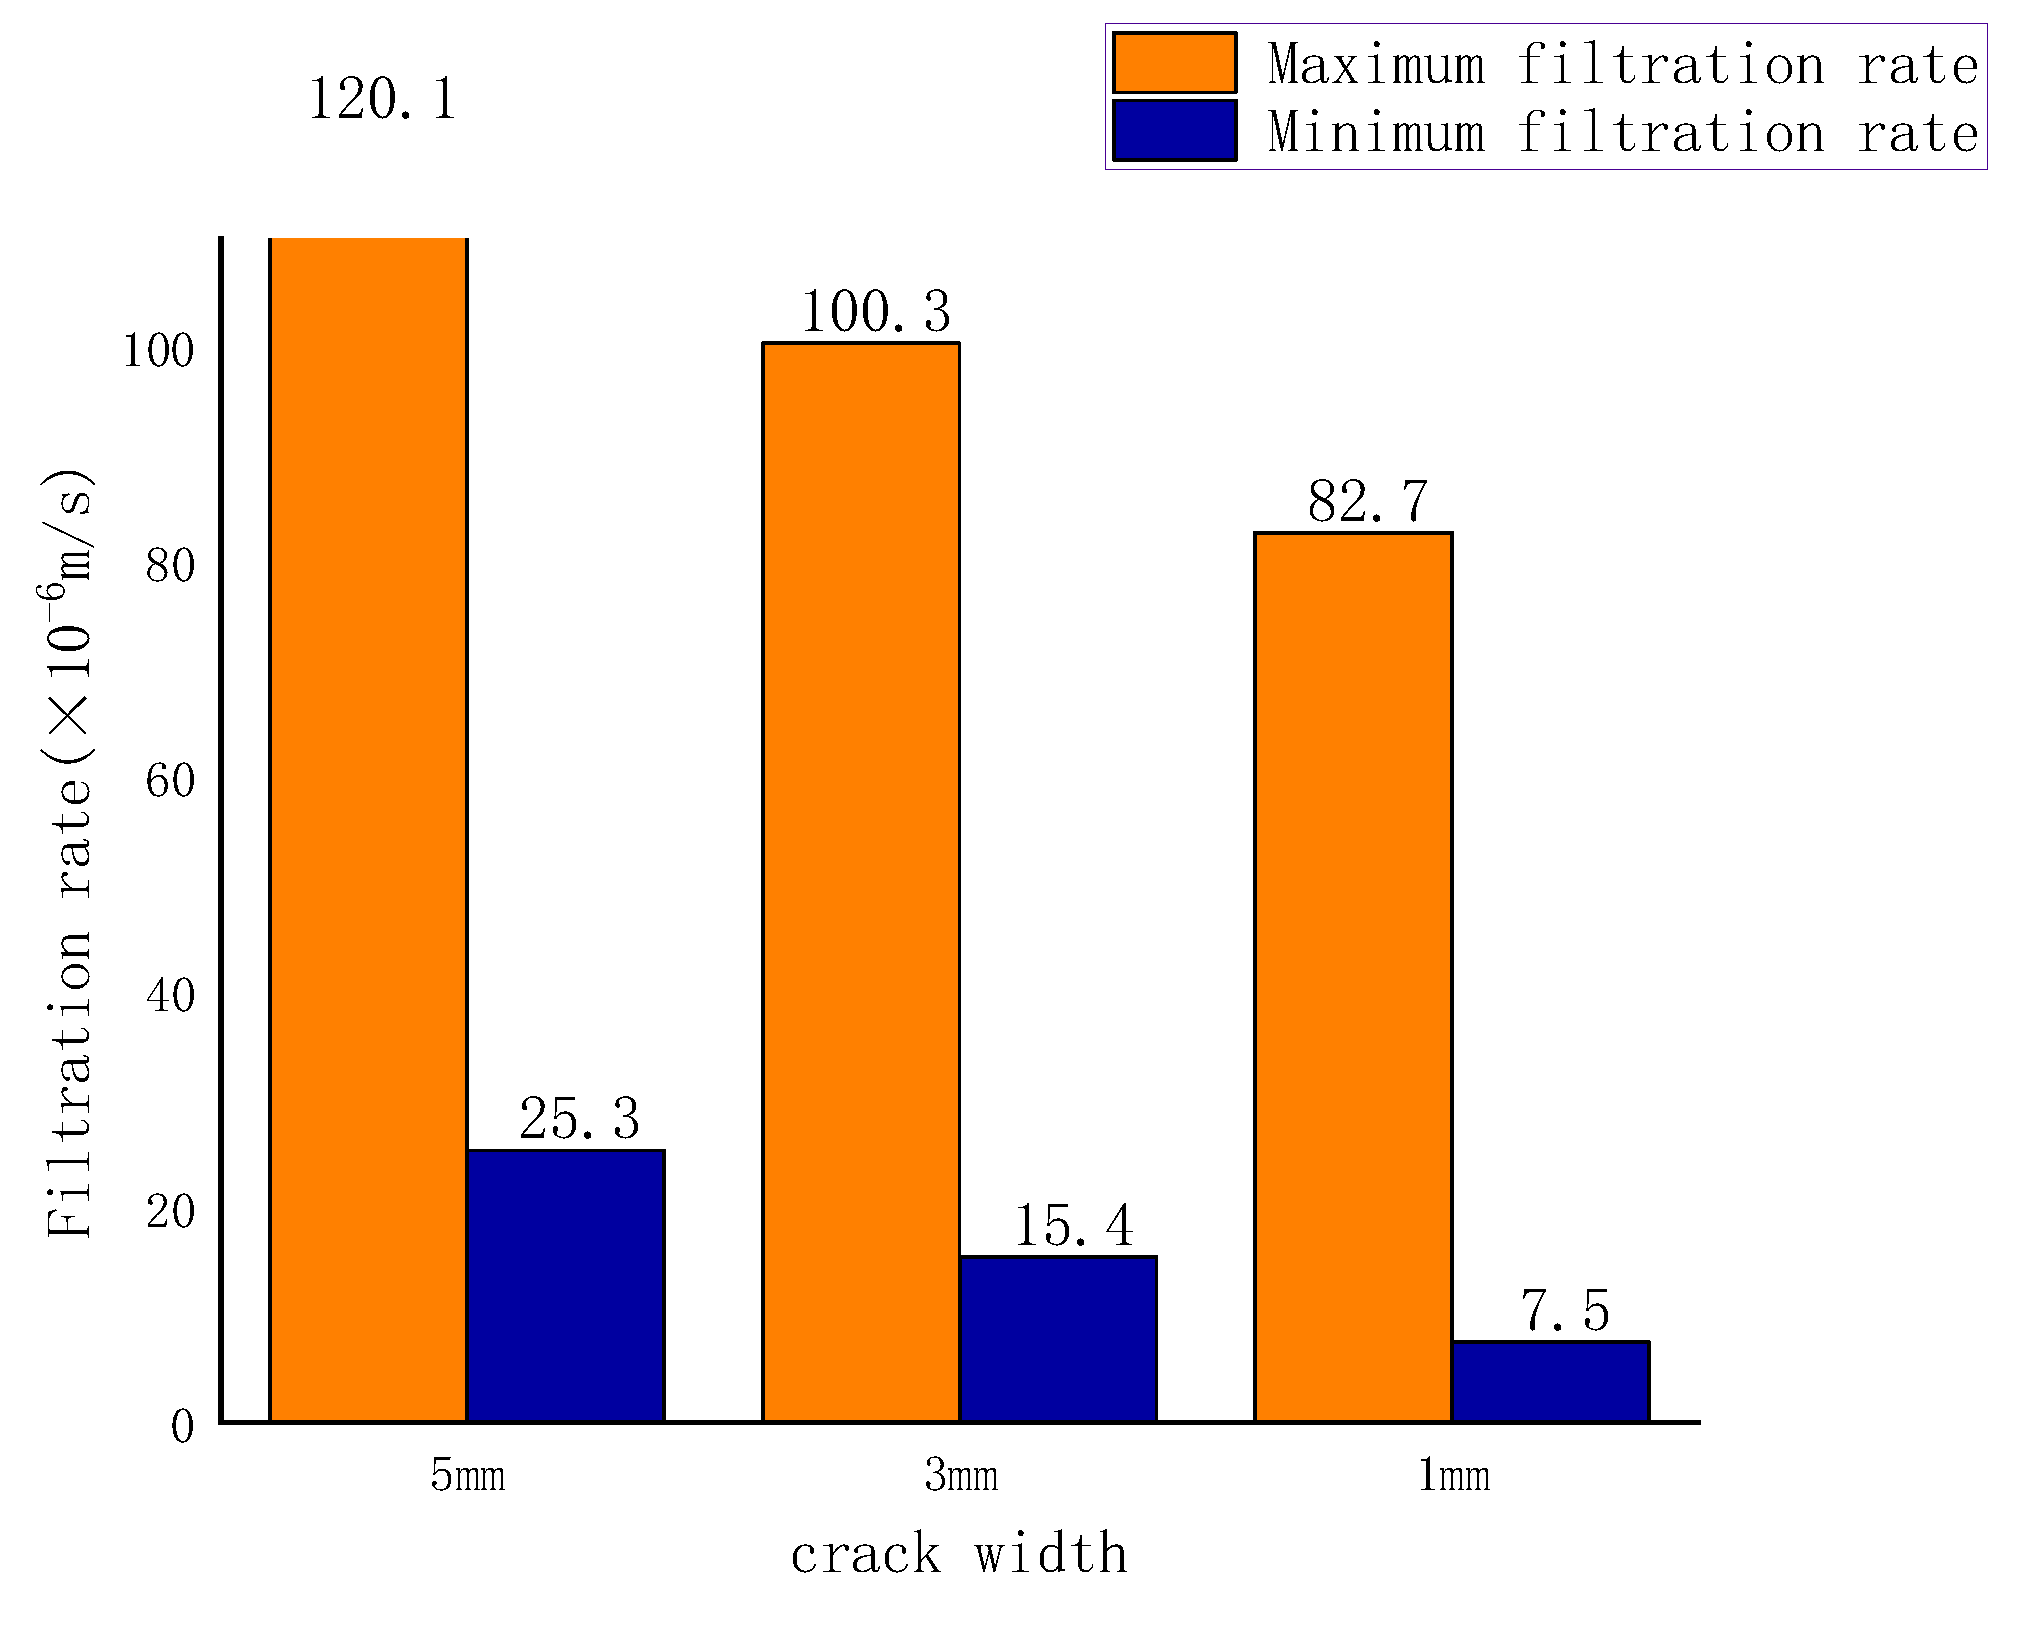

Table 1.
Fuller gradation gravel distribution proportion.
| Maximum value | Minimum | Take up |
| 20 | 15 | 0.0669873 |
| 15 | 10 | 0.0794593 |
| 10 | 5 | 0.103553 |
| 5 | 2 | 0.25 |
Table 2.
Data sources.
| Maximum value | Minimum | Data sources |
| Elastic modulus (GPa) | 25 | experimental data |
| Poisson’s ratio | 0.23 | experimental data |
| Permeability (mD) | 0.01 | experimental data |
| Brittleness index | 0.50 | experimental data |
| Compressive strength (MPa) | 100 | experimental data |
| Permeability coefficient (m/s) | 1e-7 | experimental data |
| Elastic modulus (GPa) | 25 | experimental data |
Disclaimer/Publisher’s Note: The statements, opinions and data contained in all publications are solely those of the individual author(s) and contributor(s) and not of MDPI and/or the editor(s). MDPI and/or the editor(s) disclaim responsibility for any injury to people or property resulting from any ideas, methods, instructions or products referred to in the content. |
© 2024 by the authors. Licensee MDPI, Basel, Switzerland. This article is an open access article distributed under the terms and conditions of the Creative Commons Attribution (CC BY) license (http://creativecommons.org/licenses/by/4.0/).
Copyright: This open access article is published under a Creative Commons CC BY 4.0 license, which permit the free download, distribution, and reuse, provided that the author and preprint are cited in any reuse.


