1. Introduction
Gravel sandstone reservoirs in China are characterized by low porosity, low permeability, strong heterogeneity, and complex microscopic structures. Despite these challenges, their abundant oil and gas reserves have made them a key focus of oilfield development. However, significant challenges arise during development due to the presence of complex natural microfractures and substantial lithological differences within the reservoir. Hydraulic fracturing is the primary method for reservoir stimulation, but fracture propagation in gravel sandstone reservoirs exhibits diverse behaviors, such as penetrating through gravel, bypassing gravel, or terminating at gravel. The presence of gravel alters the local stress distribution, resulting in irregular and tortuous fracture propagation patterns. These complex fracture geometries, especially the formation of bypass fractures, hinder the effective transport and distribution of proppant, thereby reducing the overall efficiency of fracturing operations [
1,
2].
Understanding the behavior of fractures under complex stress conditions and their interactions with gravel can provide theoretical support for optimizing hydraulic fracturing designs. Additionally, the tortuosity and bypass phenomena significantly limit proppant transport efficiency, impacting the long-term conductivity of fractures. Research into proppant transport dynamics and fracture stability can help improve the effectiveness of fracturing treatments. Furthermore, analyzing the distribution of natural microfractures and their influence on artificial fracture propagation can enhance predictions of fracture network morphology and optimization of fracturing parameters.
China's gravel sandstone reservoirs are mainly distributed in key oil and gas basins such as the Bohai Bay Basin, Ordos Basin, Tarim Basin, Junggar Basin, Songliao Basin, Sichuan Basin, and Qaidam Basin. These reservoirs are commonly found in sedimentary environments such as alluvial fans, fan deltas, and fluvial deposits, characterized by low porosity, low permeability, strong heterogeneity, and complex fracture development [
3,
4]. Notable regions include the Jizhong Depression in the Bohai Bay Basin, the Tabei area in the Tarim Basin, the Mahu area in the Junggar Basin, and the Yanchang Formation in the Ordos Basin. These reservoirs often feature significant thickness but poor physical properties, making them abundant yet challenging targets for oil and gas exploration and development in China.
The study of fundamental theories on fracture propagation is a core aspect of developing gravel sandstone reservoirs, integrating concepts from fracture mechanics and rock mechanics. Fracture mechanics provides the theoretical framework for understanding fracture behavior by analyzing stress distribution at the fracture tip and propagation criteria, such as stress intensity factors and energy release rates, which reveal the initiation, propagation, and closure of fractures under complex stress conditions [
5,
6]. Meanwhile, the mechanical properties of rocks, including tensile strength, elastic modulus, and fracture toughness, significantly influence fracture formation and morphology. In gravel sandstone reservoirs, the inherent heterogeneity and the presence of gravel particles further complicate fracture propagation. Local stress disturbances caused by gravel size, shape, and distribution often lead to phenomena such as fracture deflection, branching, or termination [
7,
8,
9,
10].
The mechanisms of fracture propagation in gravel sandstone reservoirs are inherently complex due to the interplay between artificial fractures and the reservoir's heterogeneous characteristics. In these reservoirs, fractures often exhibit diverse propagation behaviors, such as penetrating through gravel, bypassing gravel, or terminating at gravel interfaces [
11,
12]. These behaviors are governed by the mechanical properties of the gravel particles, including their size, shape, and spatial distribution, as well as the interactions between gravel and the surrounding matrix. The presence of gravel significantly disturbs the local stress field, leading to irregular and tortuous fracture geometries [
13,
14,
15]. Additionally, the interaction between natural microfractures and artificially induced fractures introduces further complexity, as natural fractures can either enhance or obstruct fracture growth depending on their orientation, aperture, and connectivity. These phenomena not only influence fracture morphology but also affect the distribution and transport efficiency of proppant within the fractures. Proppant may become trapped in narrow or bypassed pathways, reducing the overall conductivity of the fracture network [
16].
Numerical simulation plays a crucial role in understanding and optimizing fracture propagation in gravel sandstone reservoirs. Advanced simulation methods, such as finite element analysis (FEA), discrete element modeling (DEM), and extended finite element modeling (XFEM), enable detailed analysis of fracture behavior under complex stress conditions and heterogeneous reservoir characteristics. These methods are used to simulate fracture paths, widths, and propagation dynamics, accounting for factors such as gravel-induced stress disturbances, natural fracture networks, and fluid-solid interactions [
17,
18,
19,
20]. Coupled reservoir-fracture models further enhance the understanding of the interplay between reservoir pressure, fluid flow, and fracture propagation, allowing for accurate predictions of fracture network morphology and conductivity evolution. These models can incorporate dynamic factors such as proppant transport, stress shadowing effects, and the impact of varying injection rates and fluid properties [
21,
22,
23]. By simulating real-field conditions, numerical models provide valuable insights for optimizing hydraulic fracturing designs, improving fracture connectivity, and minimizing risks such as fracture closure or proppant trapping.
The presence of gravel and strong heterogeneity in gravel sandstone reservoirs significantly affects fracture propagation, but the coupling mechanisms remain unclear. Gravel properties, such as size, shape, distribution, and mechanical characteristics, disturb the local stress field, leading to fracture deflection, branching, or termination. However, most existing studies focus on qualitative analysis, lacking systematic quantitative characterization and model validation. Additionally, natural microfractures, mudstone interlayers, and bedding structures in gravel sandstone reservoirs further complicate fracture propagation patterns. The interaction mechanisms between natural fractures and artificially induced fractures are still not fully understood. The combined effects of these factors not only influence fracture network connectivity but also have profound impacts on fracture morphology and conductivity, necessitating deeper theoretical and experimental investigations.
This study focuses on the complexity of fracture propagation in gravel sandstone reservoirs and includes rock mechanics experiments, laboratory analyses, model development, and numerical simulations. Rock mechanics experiments were conducted to analyze the mechanical properties of reservoir rocks, while laboratory analyses investigated fracture propagation paths and influencing factors. Based on these findings, a fracture propagation model was developed, taking into account the heterogeneity of the reservoir and the distribution of gravel. Finally, numerical simulations were performed to analyze the dynamic processes of fracture propagation. The results of this study provide important theoretical support and technical guidance for the efficient development of gravel sandstone reservoirs.
2. Models
2.1. Mechanical Properties
Unlike most studies that focus on the gravel sandstone reservoirs of the Mahu Oilfield, this study primarily utilizes core samples from the Bohai Basin, specifically from deep gravel sandstone reservoirs in offshore oilfields. These reservoirs differ significantly from their onshore counterparts due to unique depositional environments, greater burial depths, and higher reservoir pressures. The geological characteristics of Bohai Basin reservoirs, including their complex sedimentary structures, pronounced heterogeneity, and challenging development conditions, present distinct challenges for fracture propagation and reservoir stimulation. By focusing on offshore deep gravel sandstone reservoirs, this study addresses an underexplored area, aiming to provide insights into fracture behavior under high-stress and high-pressure conditions, which are crucial for optimizing development strategies in such environments.
Table 1.
Mechanical Properties of Gravel Sandstone Samples from Well BZ19-X.
Table 1.
Mechanical Properties of Gravel Sandstone Samples from Well BZ19-X.
| ID |
Lithology |
Well |
Depth
(m) |
Core
Orientation |
Confining Pressure (MPa) |
Elastic Modulus
(Gpa) |
Poisson's Ratio |
Compressive Strength
(MPa) |
| 1 |
Gravel Sandstone |
BZ19-X |
4432.19 |
Horizontal |
0 |
11.0641 |
0.224 |
56.583 |
| 2 |
4432.35 |
Horizontal |
10 |
21.4211 |
0.247 |
101.647 |
| 3 |
4432.86 |
Horizontal |
20 |
28.0938 |
0.258 |
169.249 |
2.2. Laboratory Experiment
The laboratory fracture propagation experiment is a key experimental method for studying the fracture formation and propagation mechanisms of rocks during the fracturing process. These experiments typically simulate the fracture propagation behavior of rocks under reservoir conditions, helping to understand the impact of various factors (such as lithology, stress, fluid, etc.) on fracture propagation, and providing data support for optimizing fracturing design.
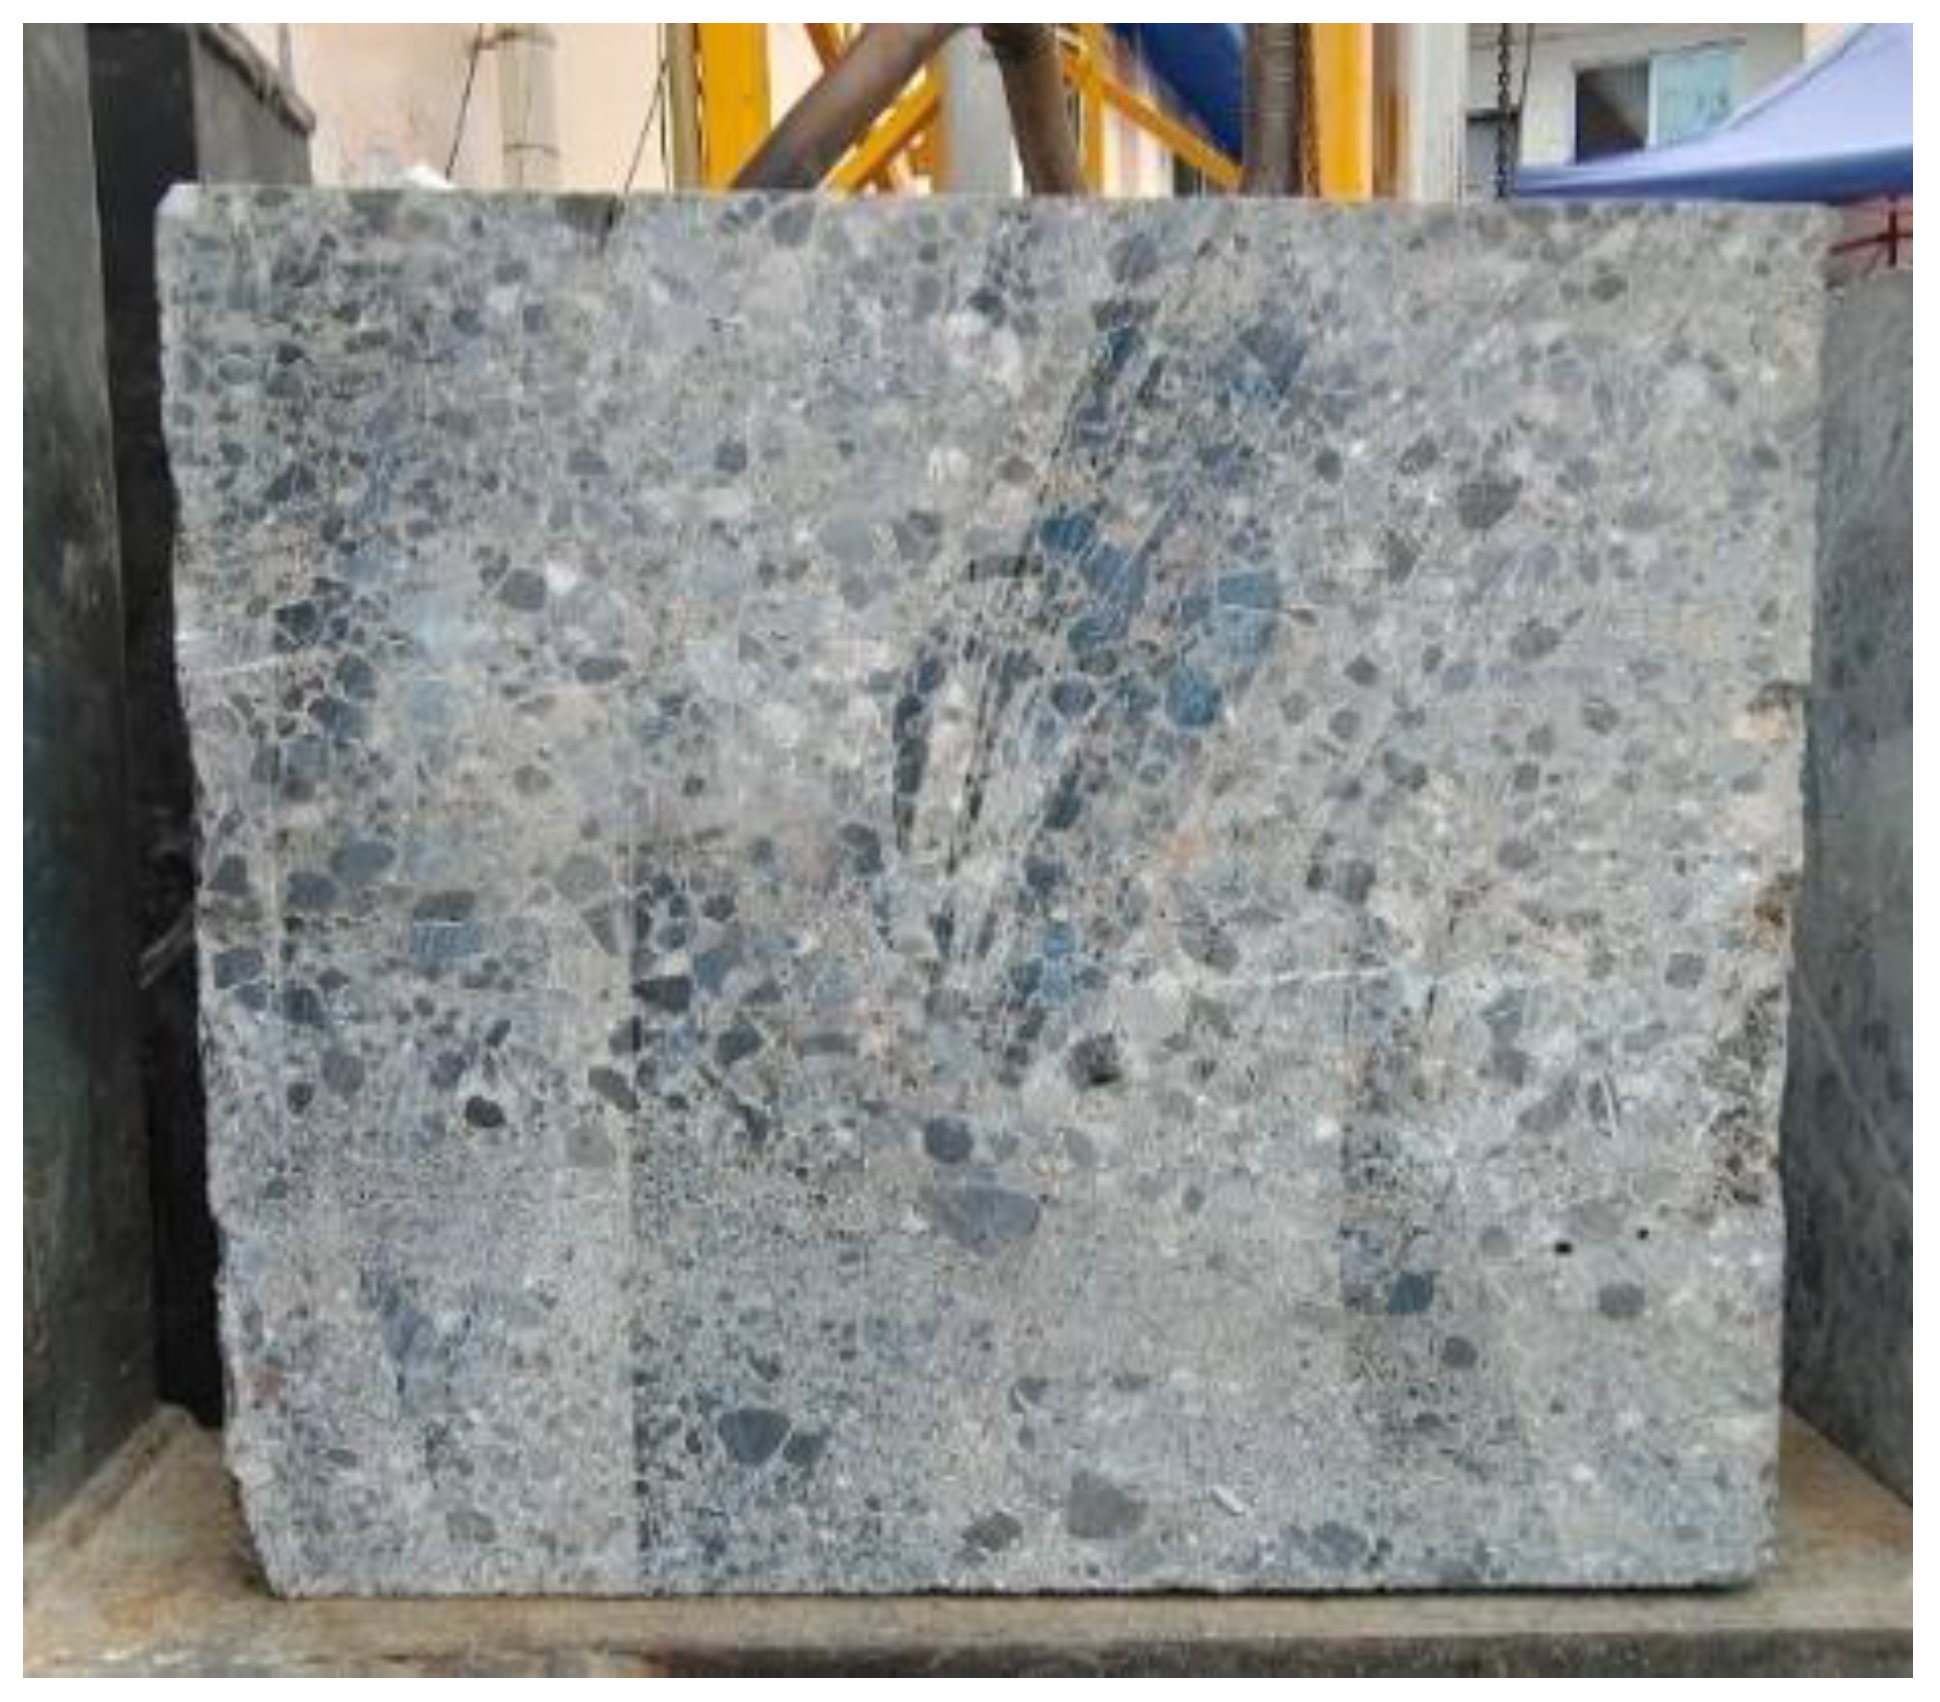
The fracture propagation experiment samples are sourced from a surface outcrop and are positioned at the same stratigraphic level as the conglomerate in the subsurface. The sample dimensions are 300×300×300 mm, which is a typical size for rock mechanics experiments, suitable for simulating and analyzing fracture propagation processes. By selecting samples from surface outcrops, the experiment can realistically replicate the mechanical properties and fracture propagation behaviors of conglomerate in natural subsurface conditions, ensuring that the experimental results closely resemble the actual reservoir environment.During the experiment, different stress fields are applied, and fluids are injected as external stimuli to observe the fracture propagation process.
Figure 1.
Fracture Propagation Experiment Sample.
Figure 1.
Fracture Propagation Experiment Sample.
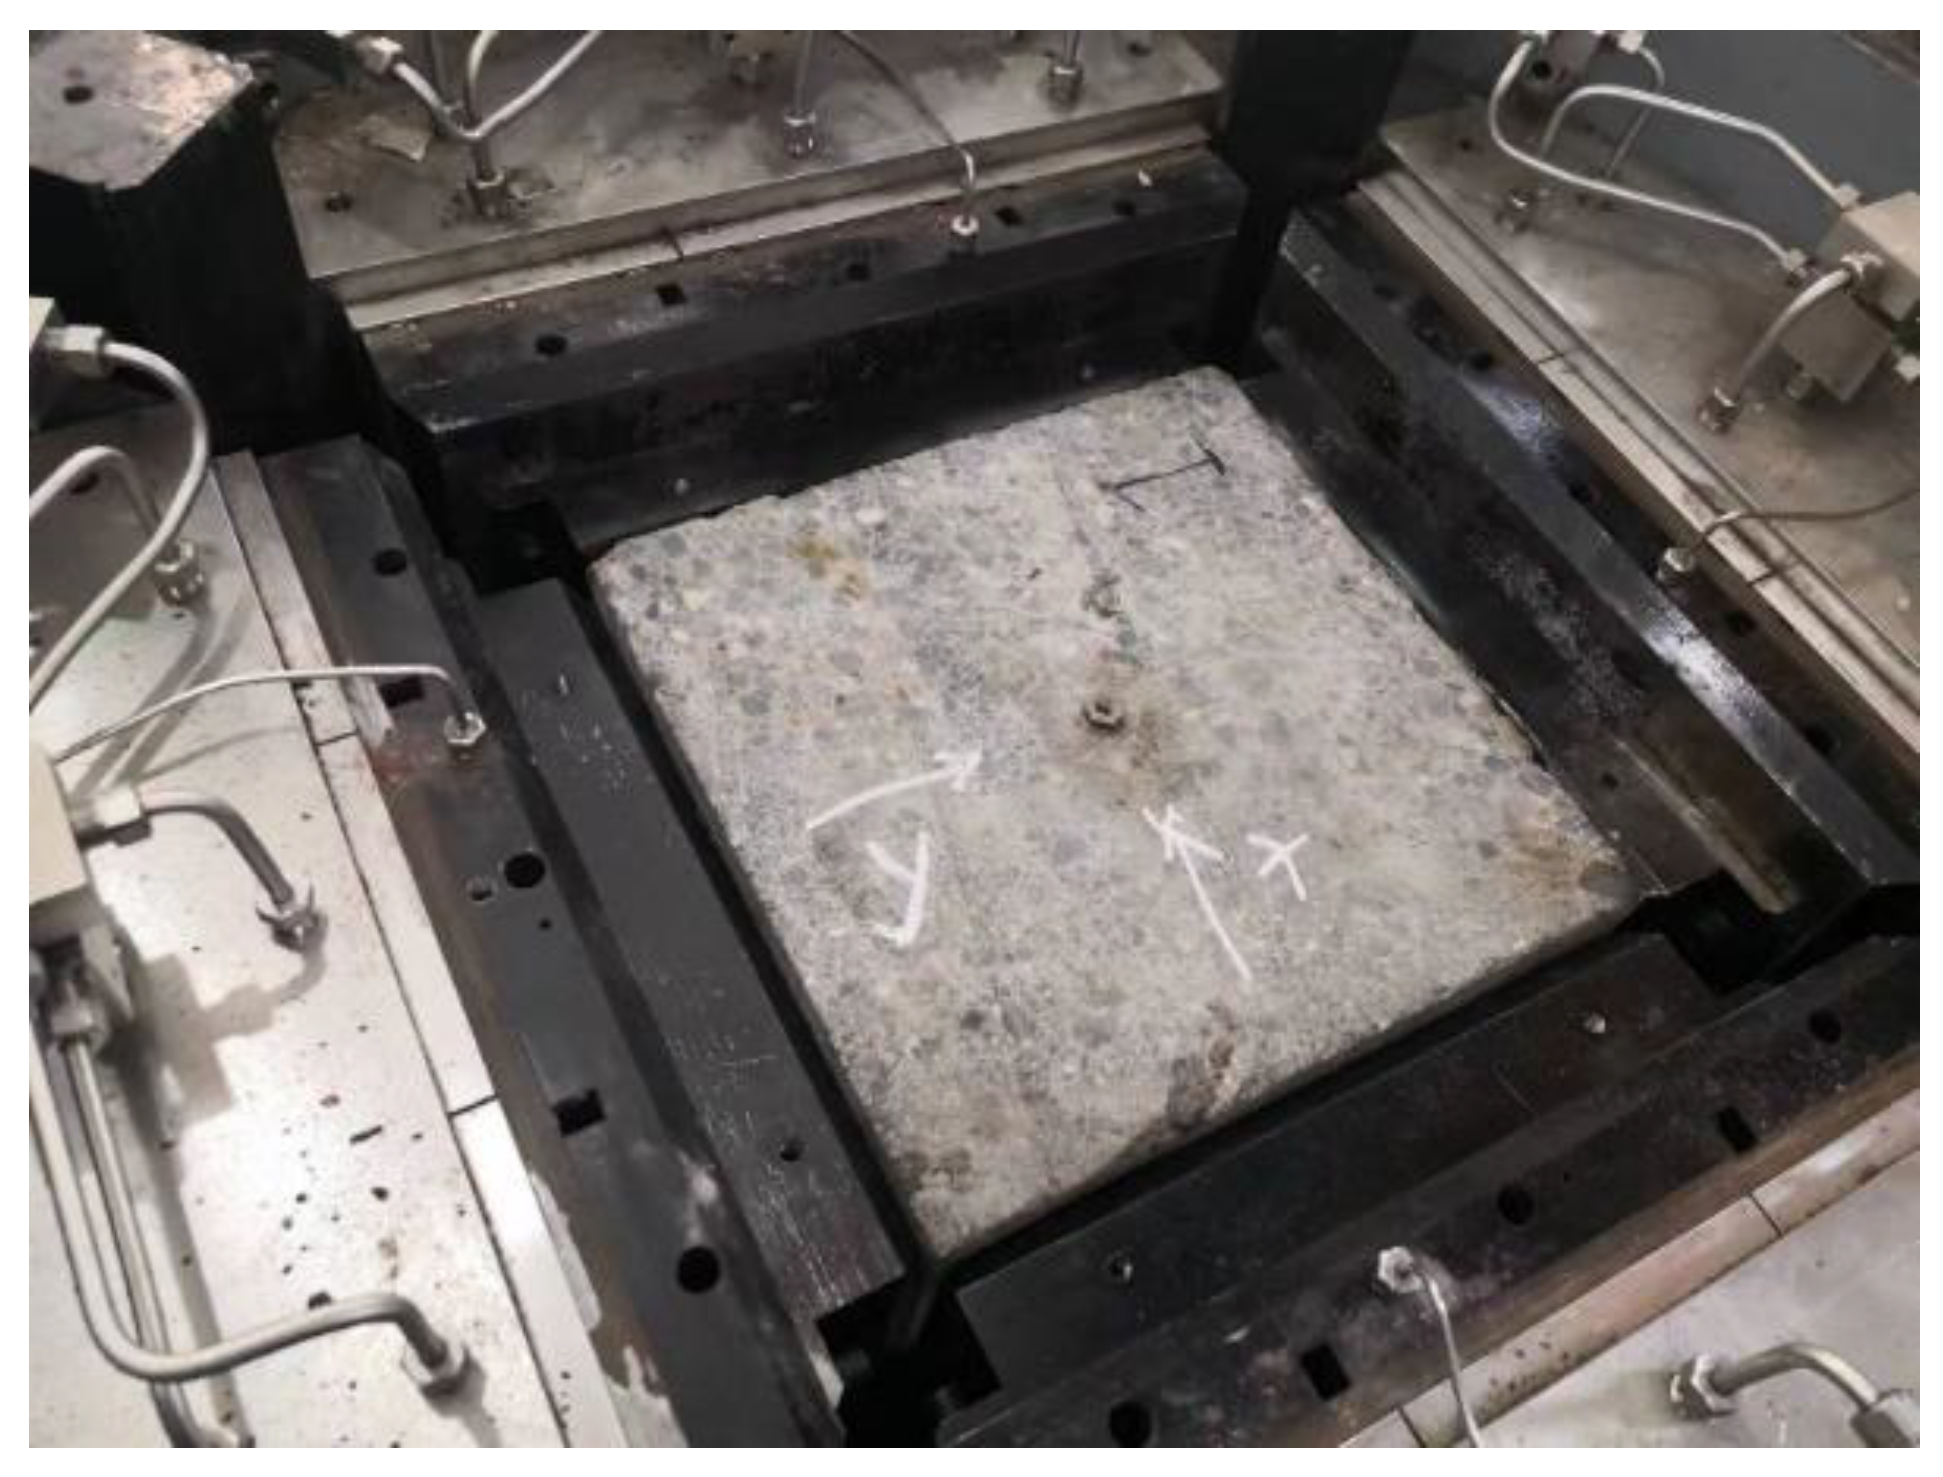
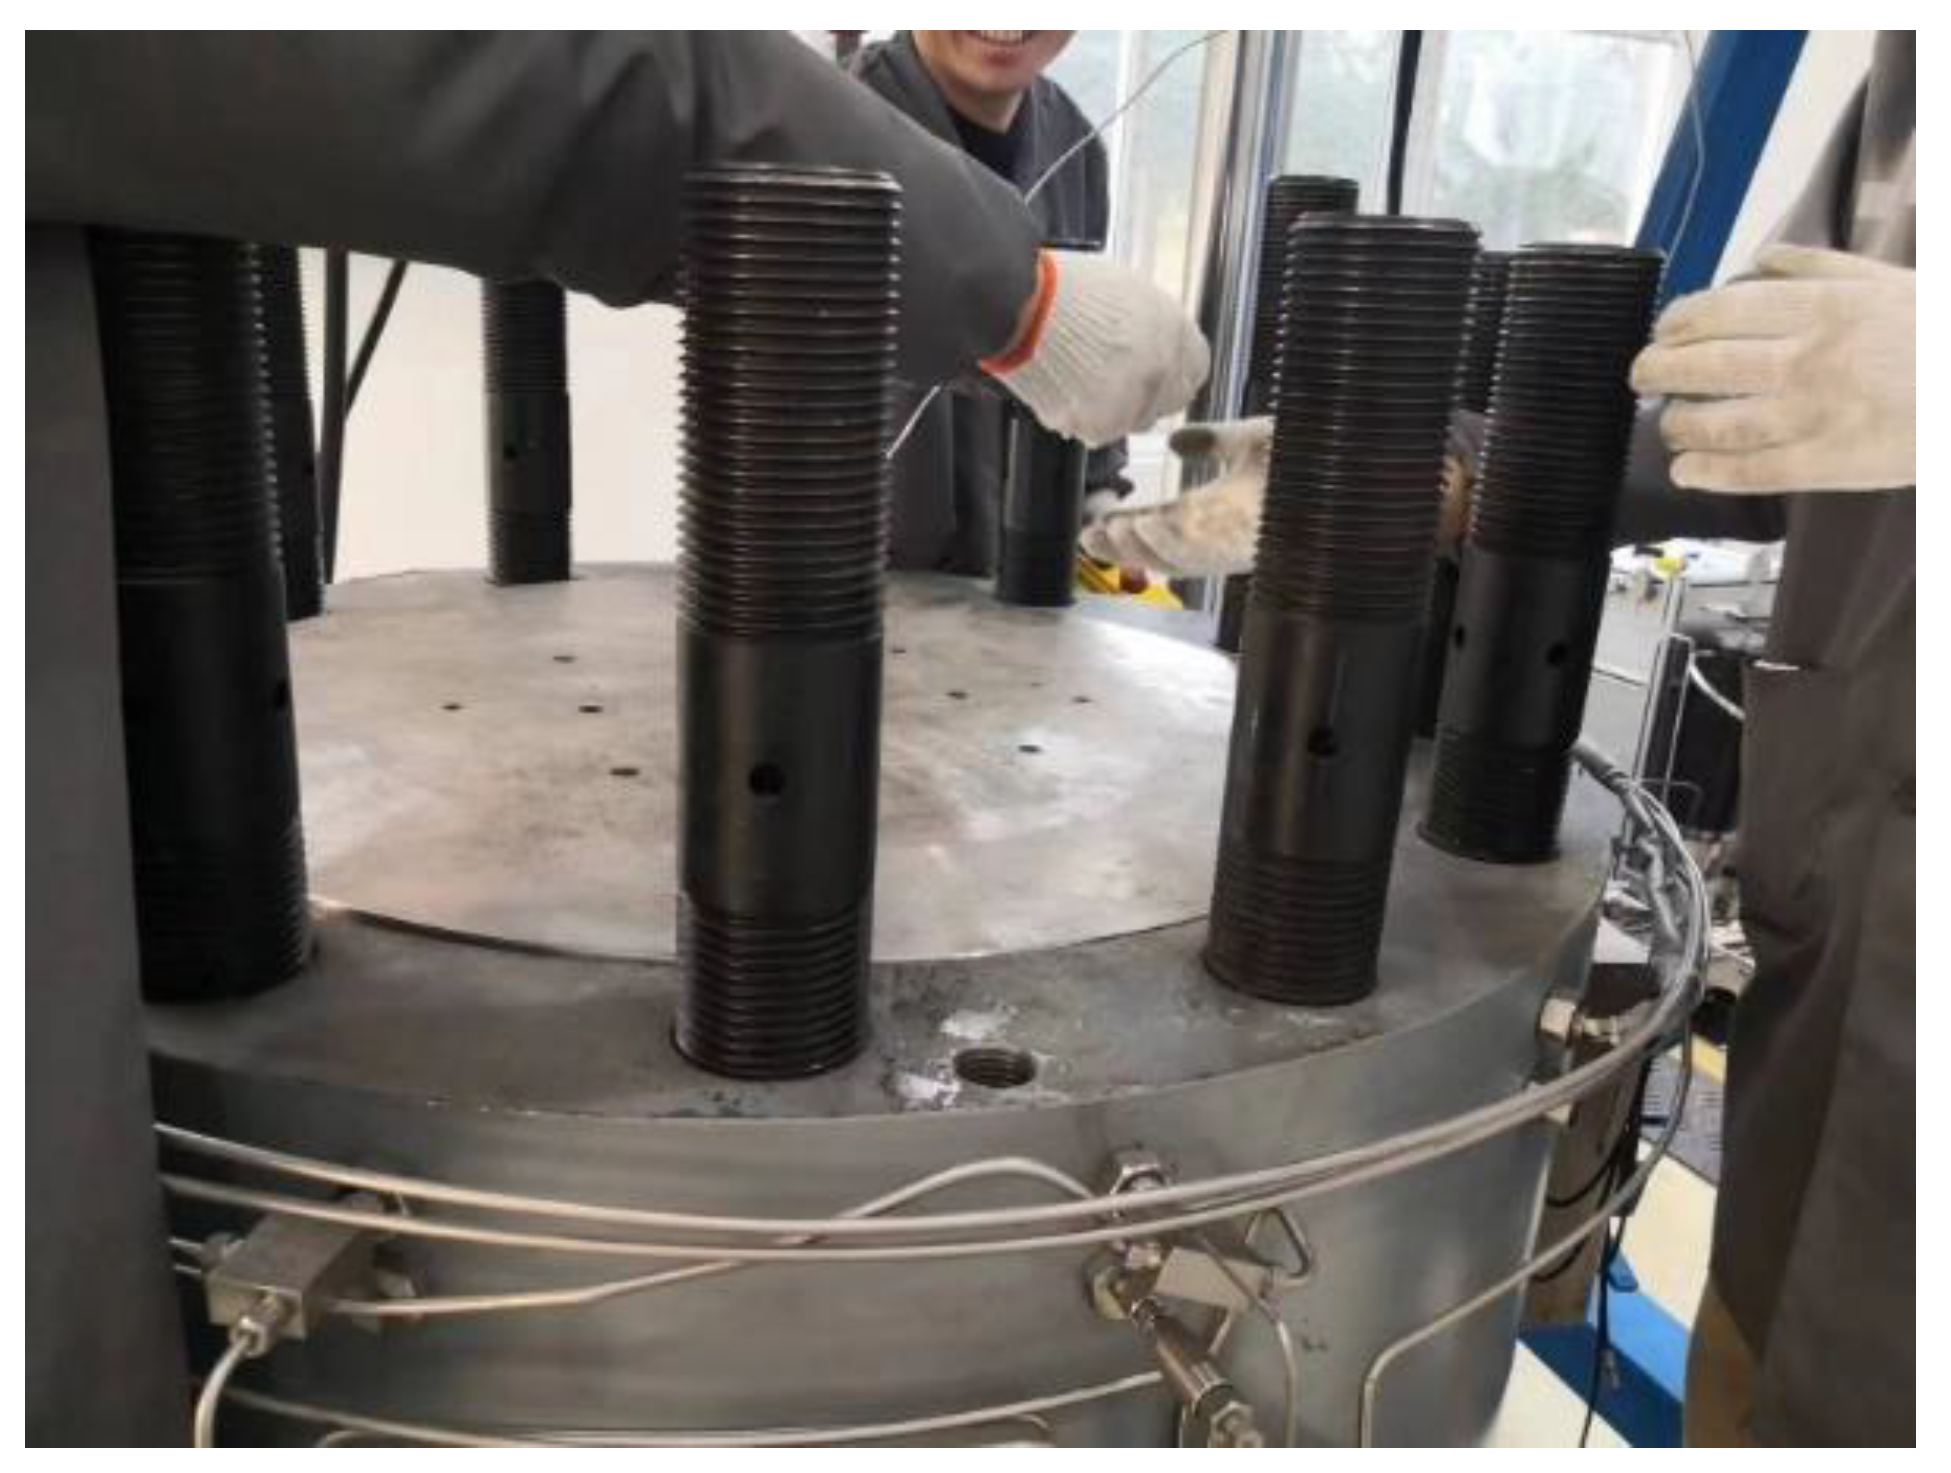
The experiment begins with the preparation of the model. Materials similar to those of the actual reservoir are selected to create a physical model with dimensions of 300×300×300 mm. The model design incorporates proportional scaling of parameters such as rock sample properties, perforation hole size, perforation spacing, and injection rate to ensure that the experimental results accurately simulate the mechanical behavior and fluid flow characteristics of the prototype structure.Proportional loads are applied to simulate the in-situ pressure conditions. These loads are evenly applied to the model via loading devices, mimicking the stress conditions during the fracturing process. Meanwhile, fracturing fluid or other experimental fluids are injected into the model, with the injection rate and pressure adjusted to simulate the fluid injection process in an actual well. As the load and fluid are applied, fractures begin to propagate in the model.
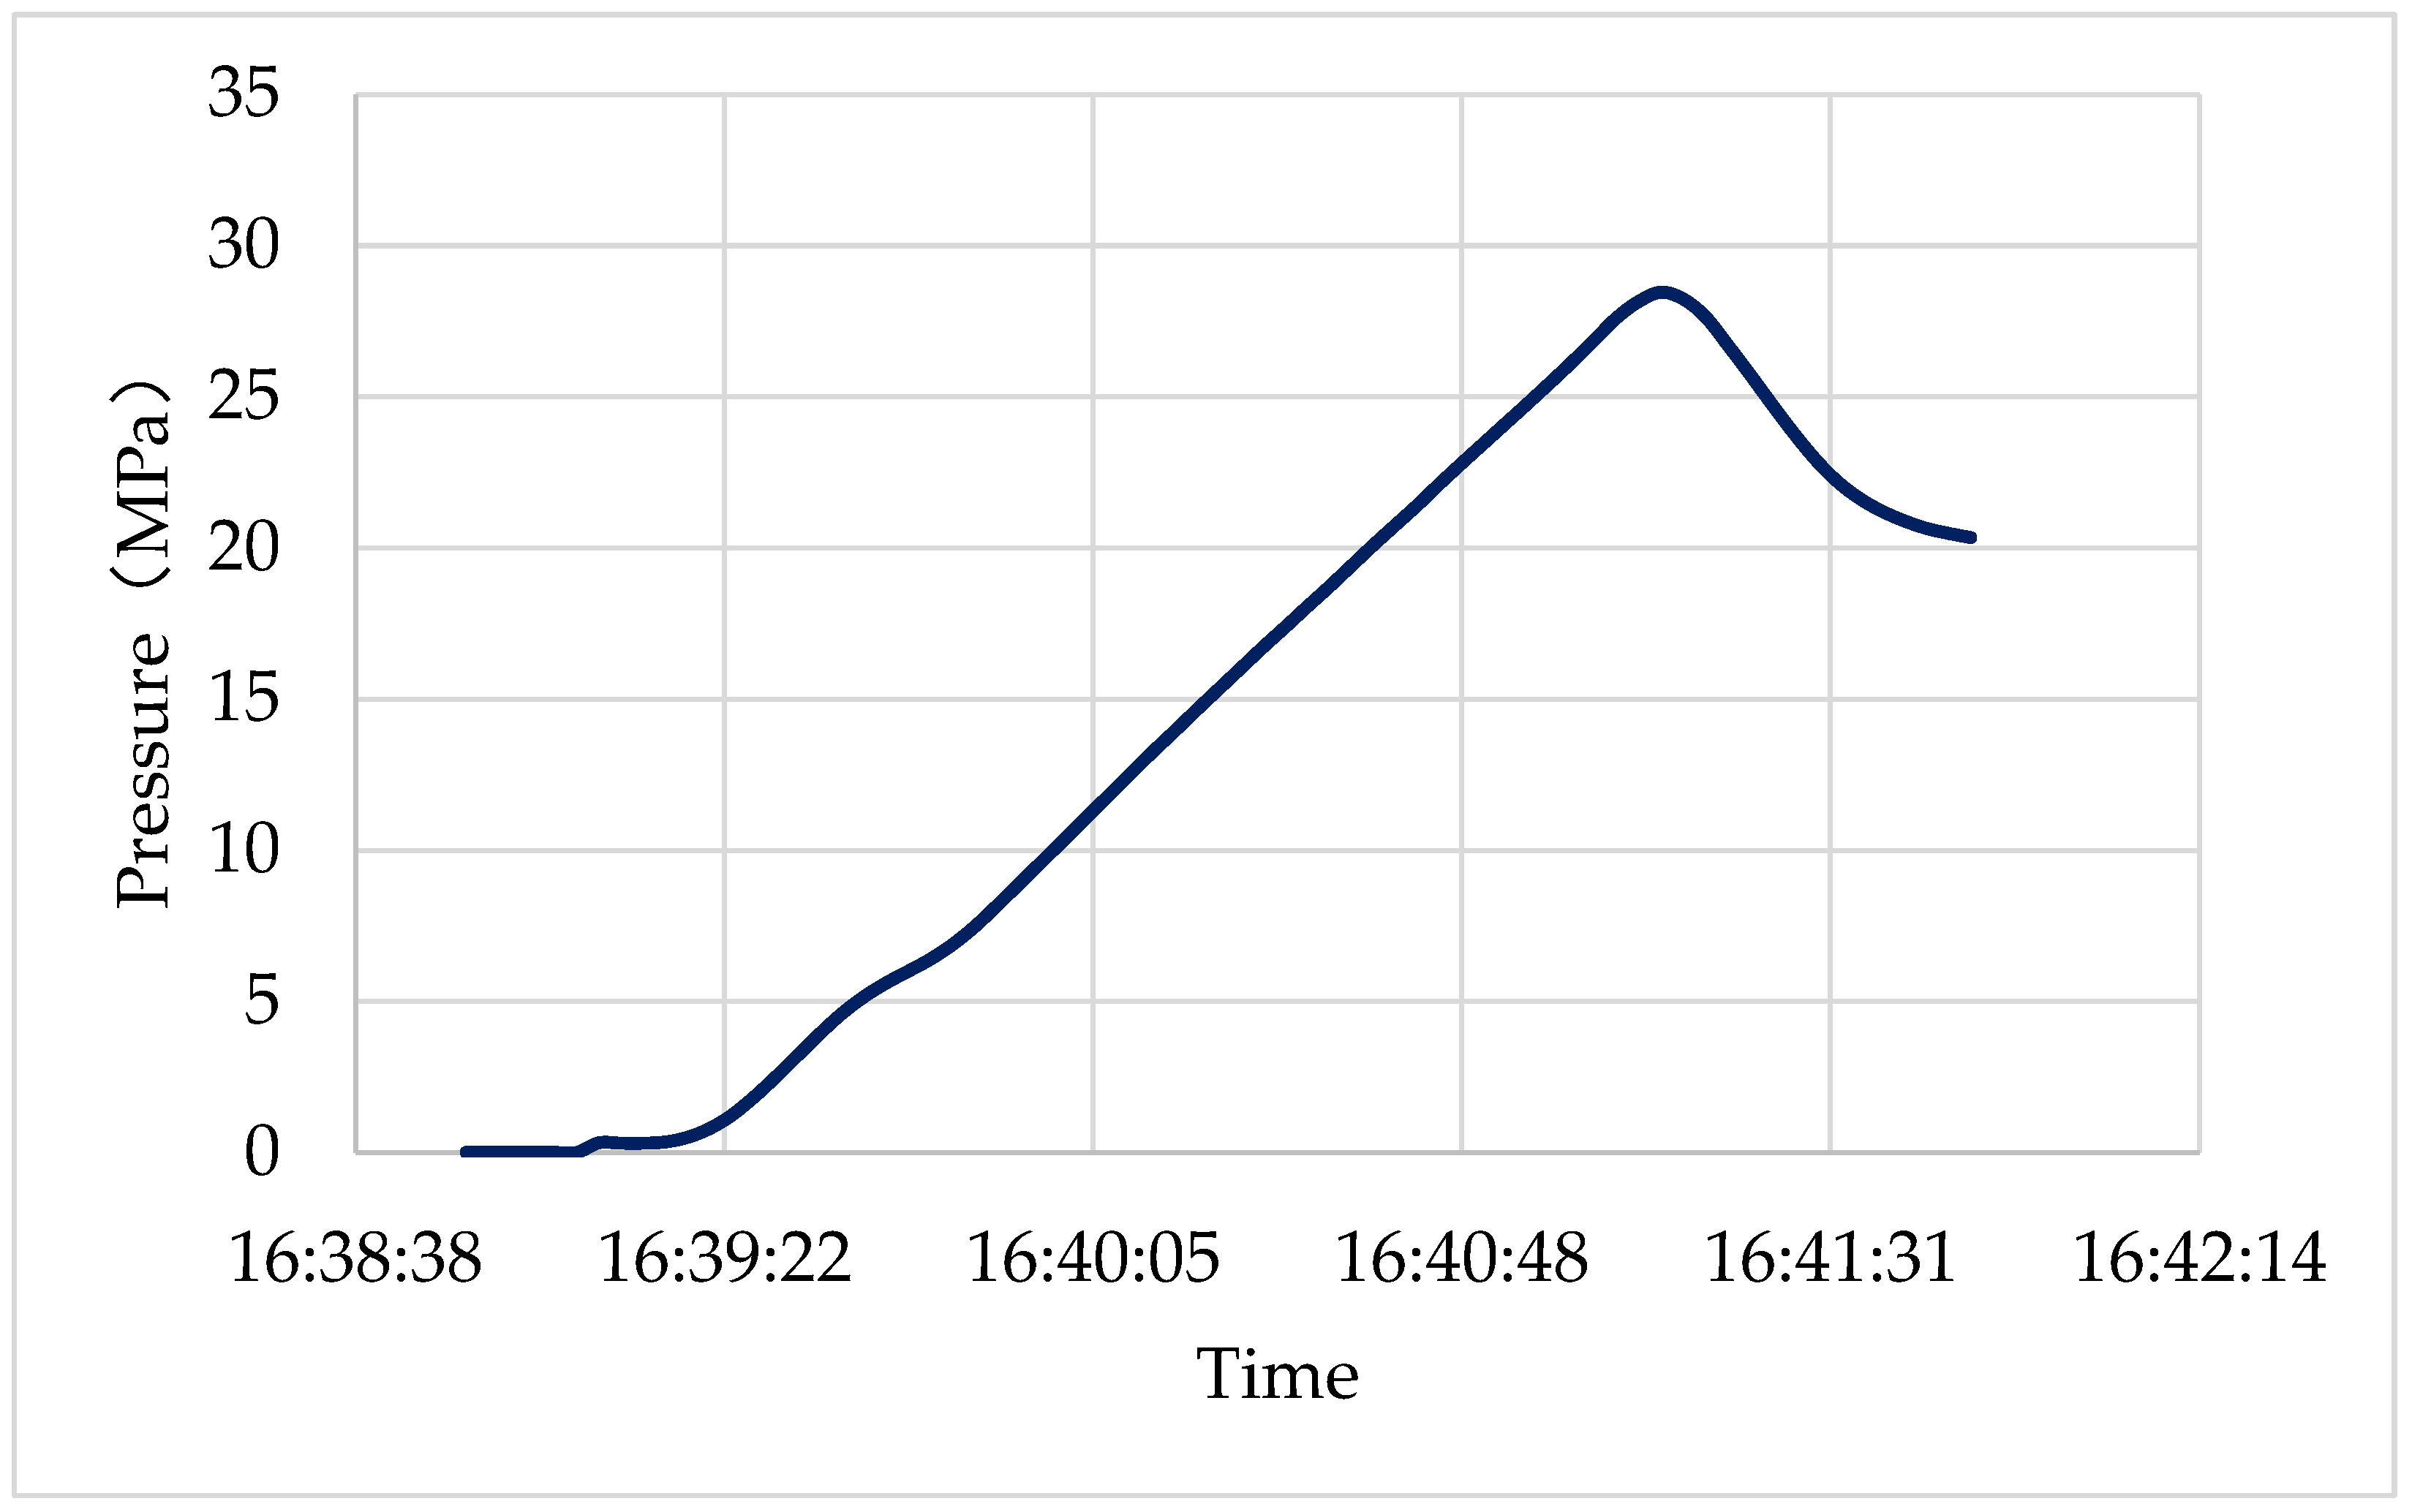
During the fracture propagation, techniques such as acoustic emission monitoring and CT scanning are used to track the formation, expansion, and interaction of fractures with the rock matrix in real-time. These technologies allow precise monitoring of fracture shape changes, propagation paths, and fracture width, while key data such as breakdown pressure, fluid infiltration, and fracture expansion rate are recorded for further analysis. by comparing the laboratory data with field data, it was concluded that the breakdown pressure measured in the experiment is approximately one-third of the predicted bottomhole pressure.
Figure 2.
rock sample loading.
Figure 2.
rock sample loading.
Figure 3.
Laboratory Experiment.
Figure 3.
Laboratory Experiment.
The initial breakdown pressure of the core was 28.87 MPa, measured at the lower perforation. The fracture did not penetrate the entire core, and the equivalent bottomhole breakdown pressure is 86.61 MPa.
2.3. Theoretical Model
The principle of hydraulic fracturing for ground stress prediction relies on understanding the borehole stress state and the formation failure mechanism. When the liquid column pressure in the wellbore exceeds the tensile strength of the formation rock, it leads to fracturing. The formation rock fracture condition can be described mathematically as follows:
Where:
: Fracturing pressure (the minimum pressure required to induce a fracture in the formation)
: Minimum principal stress in the formation
: Tensile strength of the formation rock
: Pore pressure of the formation
As can be seen from the above formula, if the rock stress state (ground stress and pore pressure) and tensile strength are known, the formation rock rupture pressure can be obtained. Conversely, the ground stress can be inversely calculated according to the fracture pressure. Based on the principle of predicting ground stress by hydraulic fracturing and combining with logging data, the overall longitudinal distribution of ground stress can be obtained. However, there are many ways to analyze and calculate geostress through logging data.
Where:
-- Biots coefficient;
-- the structural strain coefficient along the direction of maximum principal stress and the direction of minimum principal stress.
In hydraulic fracturing, due to the effects of tension and shear, fracture propagation often results in complex hydraulic fractures. In such cases, the fracture initiation criterion of cohesive elements typically combines tensile and shear failure modes.
1. Energy Criterion (Based on Fracture Mechanics)
The energy criterion assumes that fractures begin to propagate when the energy release rate within an element reaches or exceeds a critical value. The expression is:
Where:
: Energy release rate in the tensile direction
: Energy release rate in the shear direction
: Critical energy release rate in the tensile direction
: Critical energy release rate in the shear direction
When this criterion is satisfied, the cohesive element transitions into the fracture propagation phase.
2. Stress Criterion (Based on the Cohesive Zone Model)
The stress criterion directly combines tensile and shear stresses to determine fracture initiation. It is expressed as:
Where:
: Normal tensile stress
: Critical value of normal tensile stress
: Shear stress
: Critical value of shear stress
After fracture initiation, the cohesive element undergoes damage. Assuming a linear damage evolution relationship between stress and displacement after damage, the stress calculation formula is as follows:
Stress Calculation Formula for Damage Evolution
The stress σ\sigma after damage is expressed as:
Where:
Stress after damage
D: Damage variable , representing the degree of material damage
: Stress in the undamaged state (determined by the cohesive model or material properties)
Linear Damage Evolution Displacement Relationship
The damage variable
D is typically related to displacement u. Assuming a linear damage evolution relationship, the damage variable is defined as:
Where:
: Current displacement
: Damage initiation displacement (displacement at the onset of fracture propagation)
: Final failure displacement (displacement at which the element completely loses load-bearing capacity)
3. Simulation Analysis Results
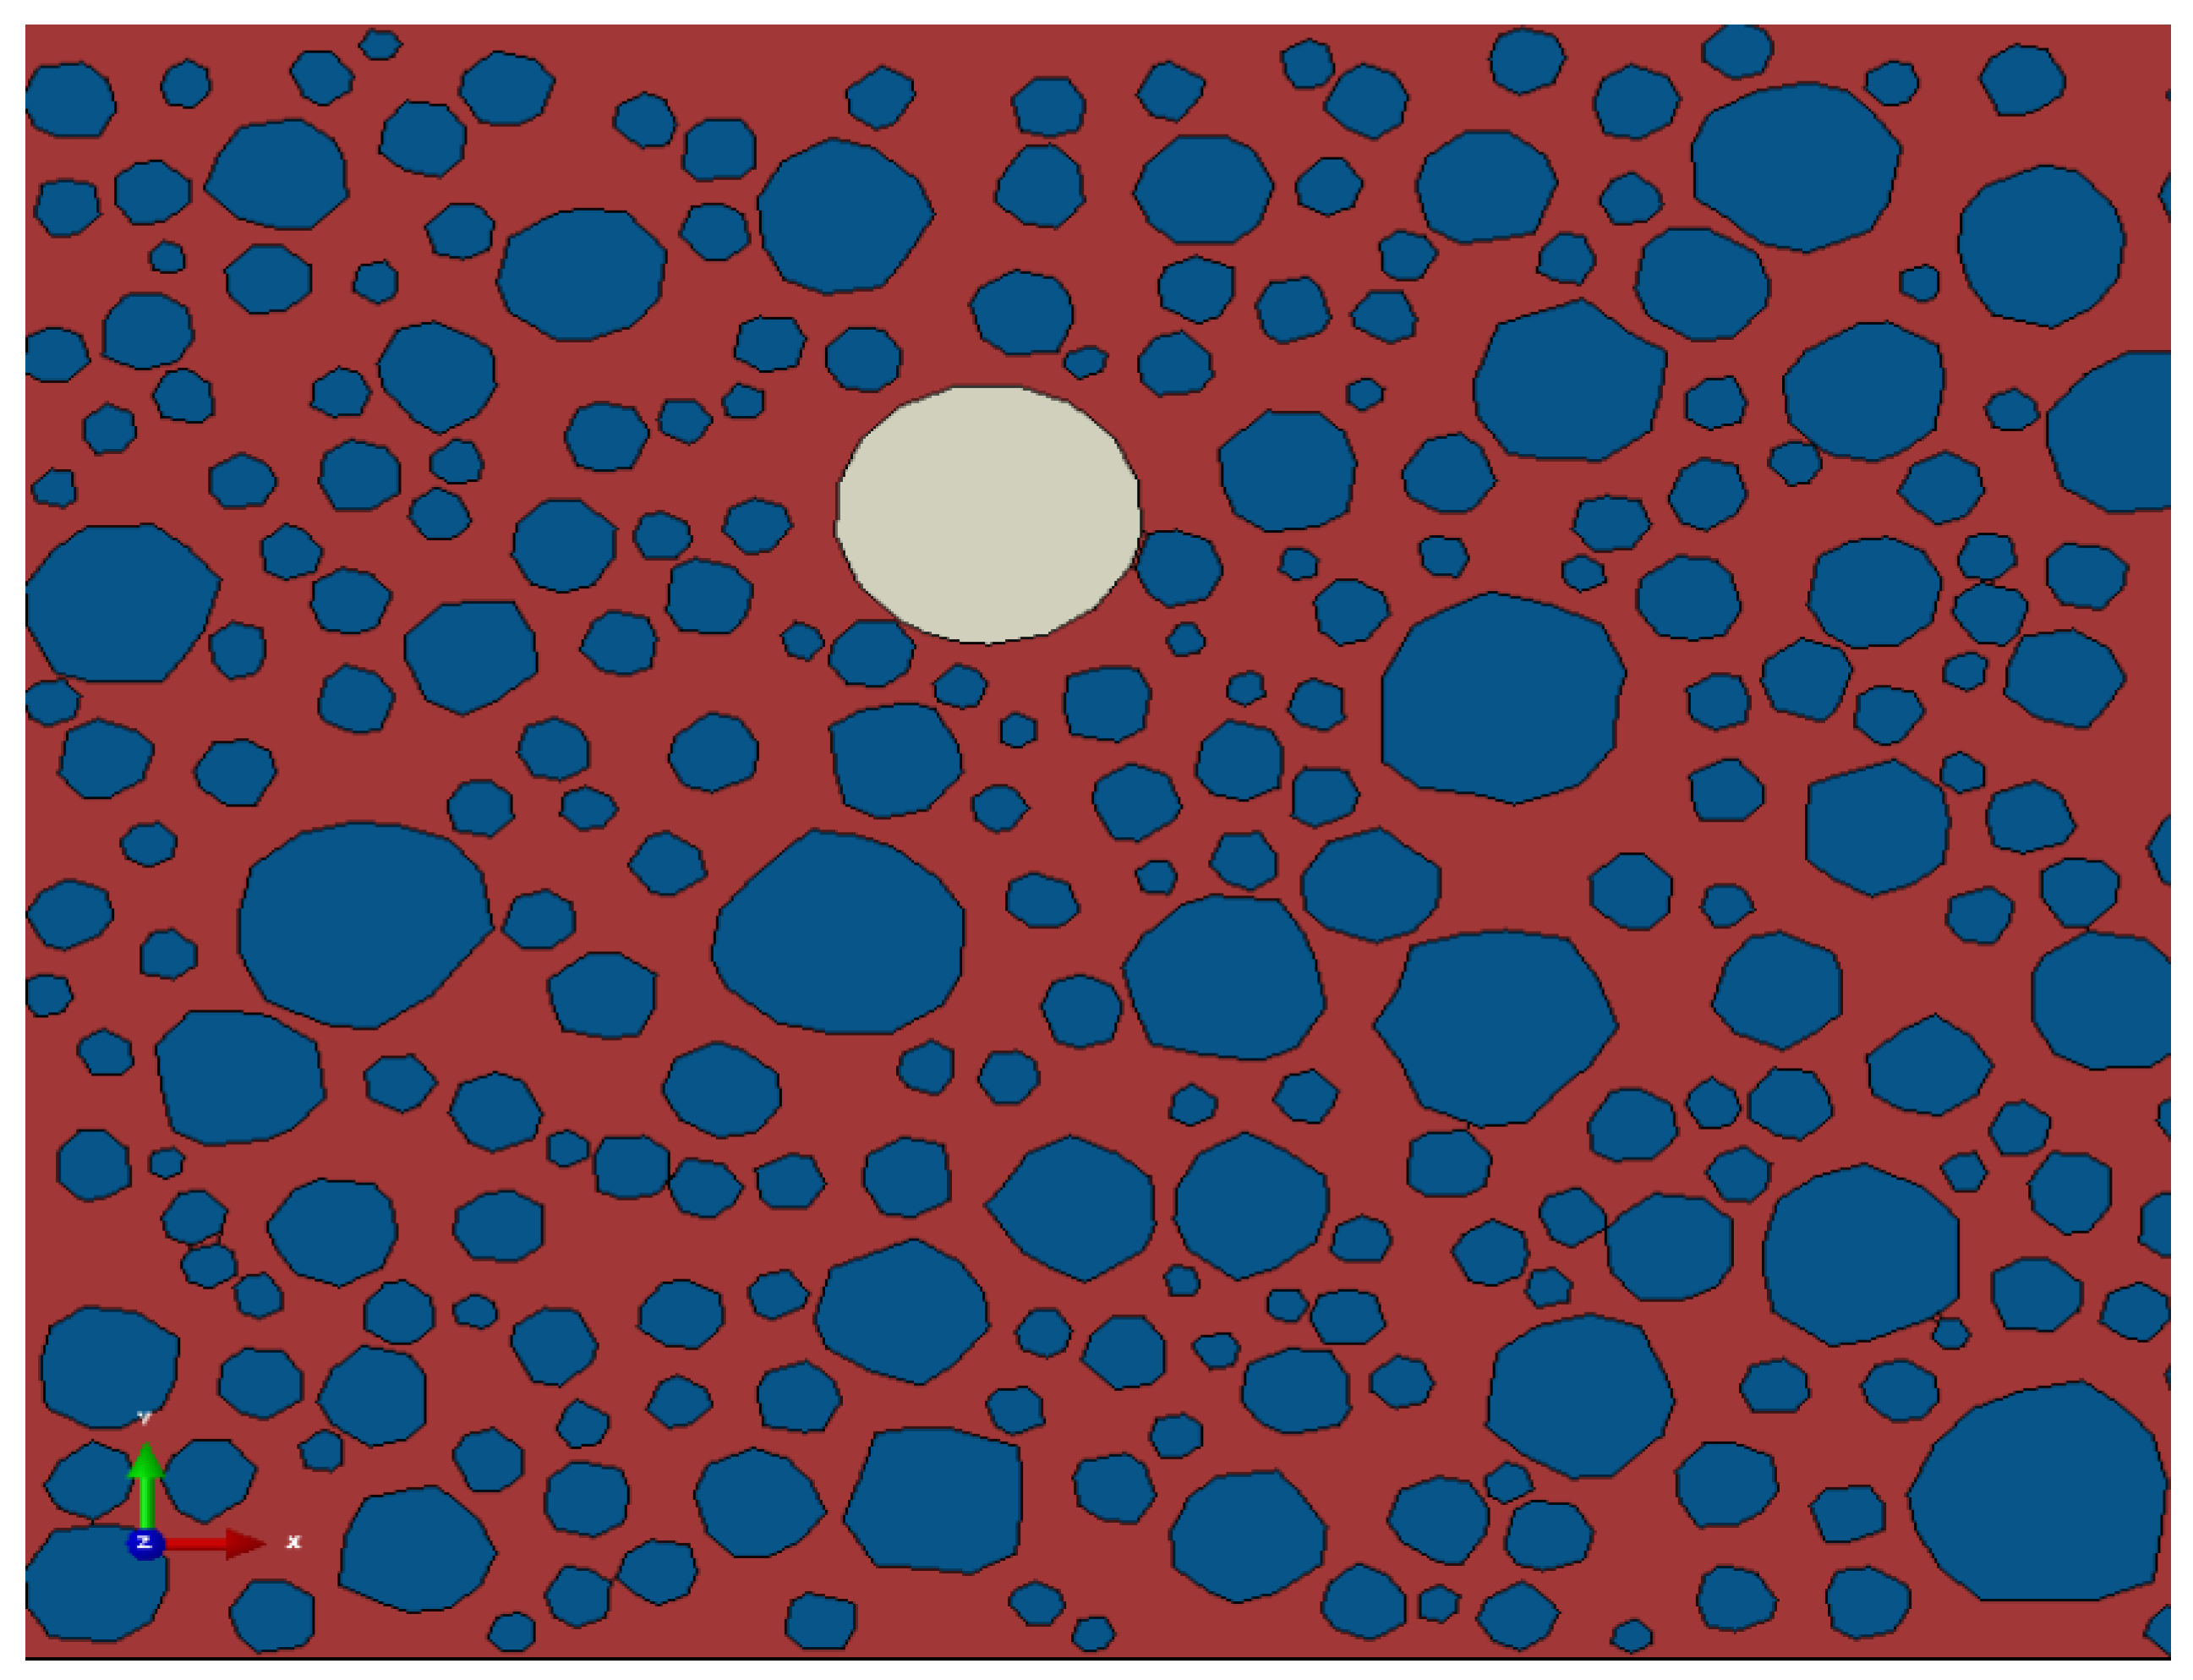
The process of crack simulation using XFEM (Extended Finite Element Method) involves several key steps. First, a geometric model is established, defining the 2D or 3D structure of the rock body or cracks, with the initial crack location, such as the perforation tip, specified as the starting point. Material properties are then set, including the elastic modulus, Poisson’s ratio, and tensile strength of the rock. A cohesive zone model (CZM) is also defined for the crack region to describe tensile and shear failure behavior.
During the meshing phase, XFEM allows cracks to propagate freely within the mesh, so it is unnecessary to refine the mesh along the crack path. However, it is advisable to refine the mesh in areas where cracks are expected to grow. Boundary conditions are then applied, including in-situ stress boundaries (such as maximum and minimum principal stresses) and fracturing fluid pressure in the wellbore to simulate realistic geological conditions.
The crack propagation criteria are central to the simulation. These typically include the maximum principal stress criterion or the energy release rate criterion, combined with damage evolution models (such as linear or nonlinear models) to define the crack propagation path. The initial crack definition enables cracks to grow freely without depending on mesh constraints. A static or dynamic solver is then chosen to perform nonlinear analysis, yielding results such as the crack propagation path, stress distribution, and fracture network formation.
Finally, the results are analyzed, including the crack propagation path, stress concentration regions, and the energy release rate at the crack tip, to further evaluate the complexity and growth pattern of the fracture network. Based on the simulation results, model parameters such as material properties, meshing, and crack propagation criteria can be optimized. The accuracy of the model can be verified by comparing it with experimental data. This process effectively simulates the dynamic evolution of primary and secondary fractures in hydraulic fracturing.
Table 2.
Formation Rock and Fracturing Parameters Table.
Table 2.
Formation Rock and Fracturing Parameters Table.
| Parameter Name |
Elastic Modulus (GPa) |
Poisson's Ratio |
Permeability (md) |
Compressive Strength (MPa) |
Permeability Coefficient (m/s) |
Filtration Coefficient (m/Pas) |
Fracturing Fluid Viscosity (Pas) |
Flow Rate (m³/min) |
| Value |
25 |
0.23 |
0.01 |
100 |
1e-7 |
1e-14 |
0.03 |
3.5 |
Figure 5.
Geometric Model for Simulation.
Figure 5.
Geometric Model for Simulation.
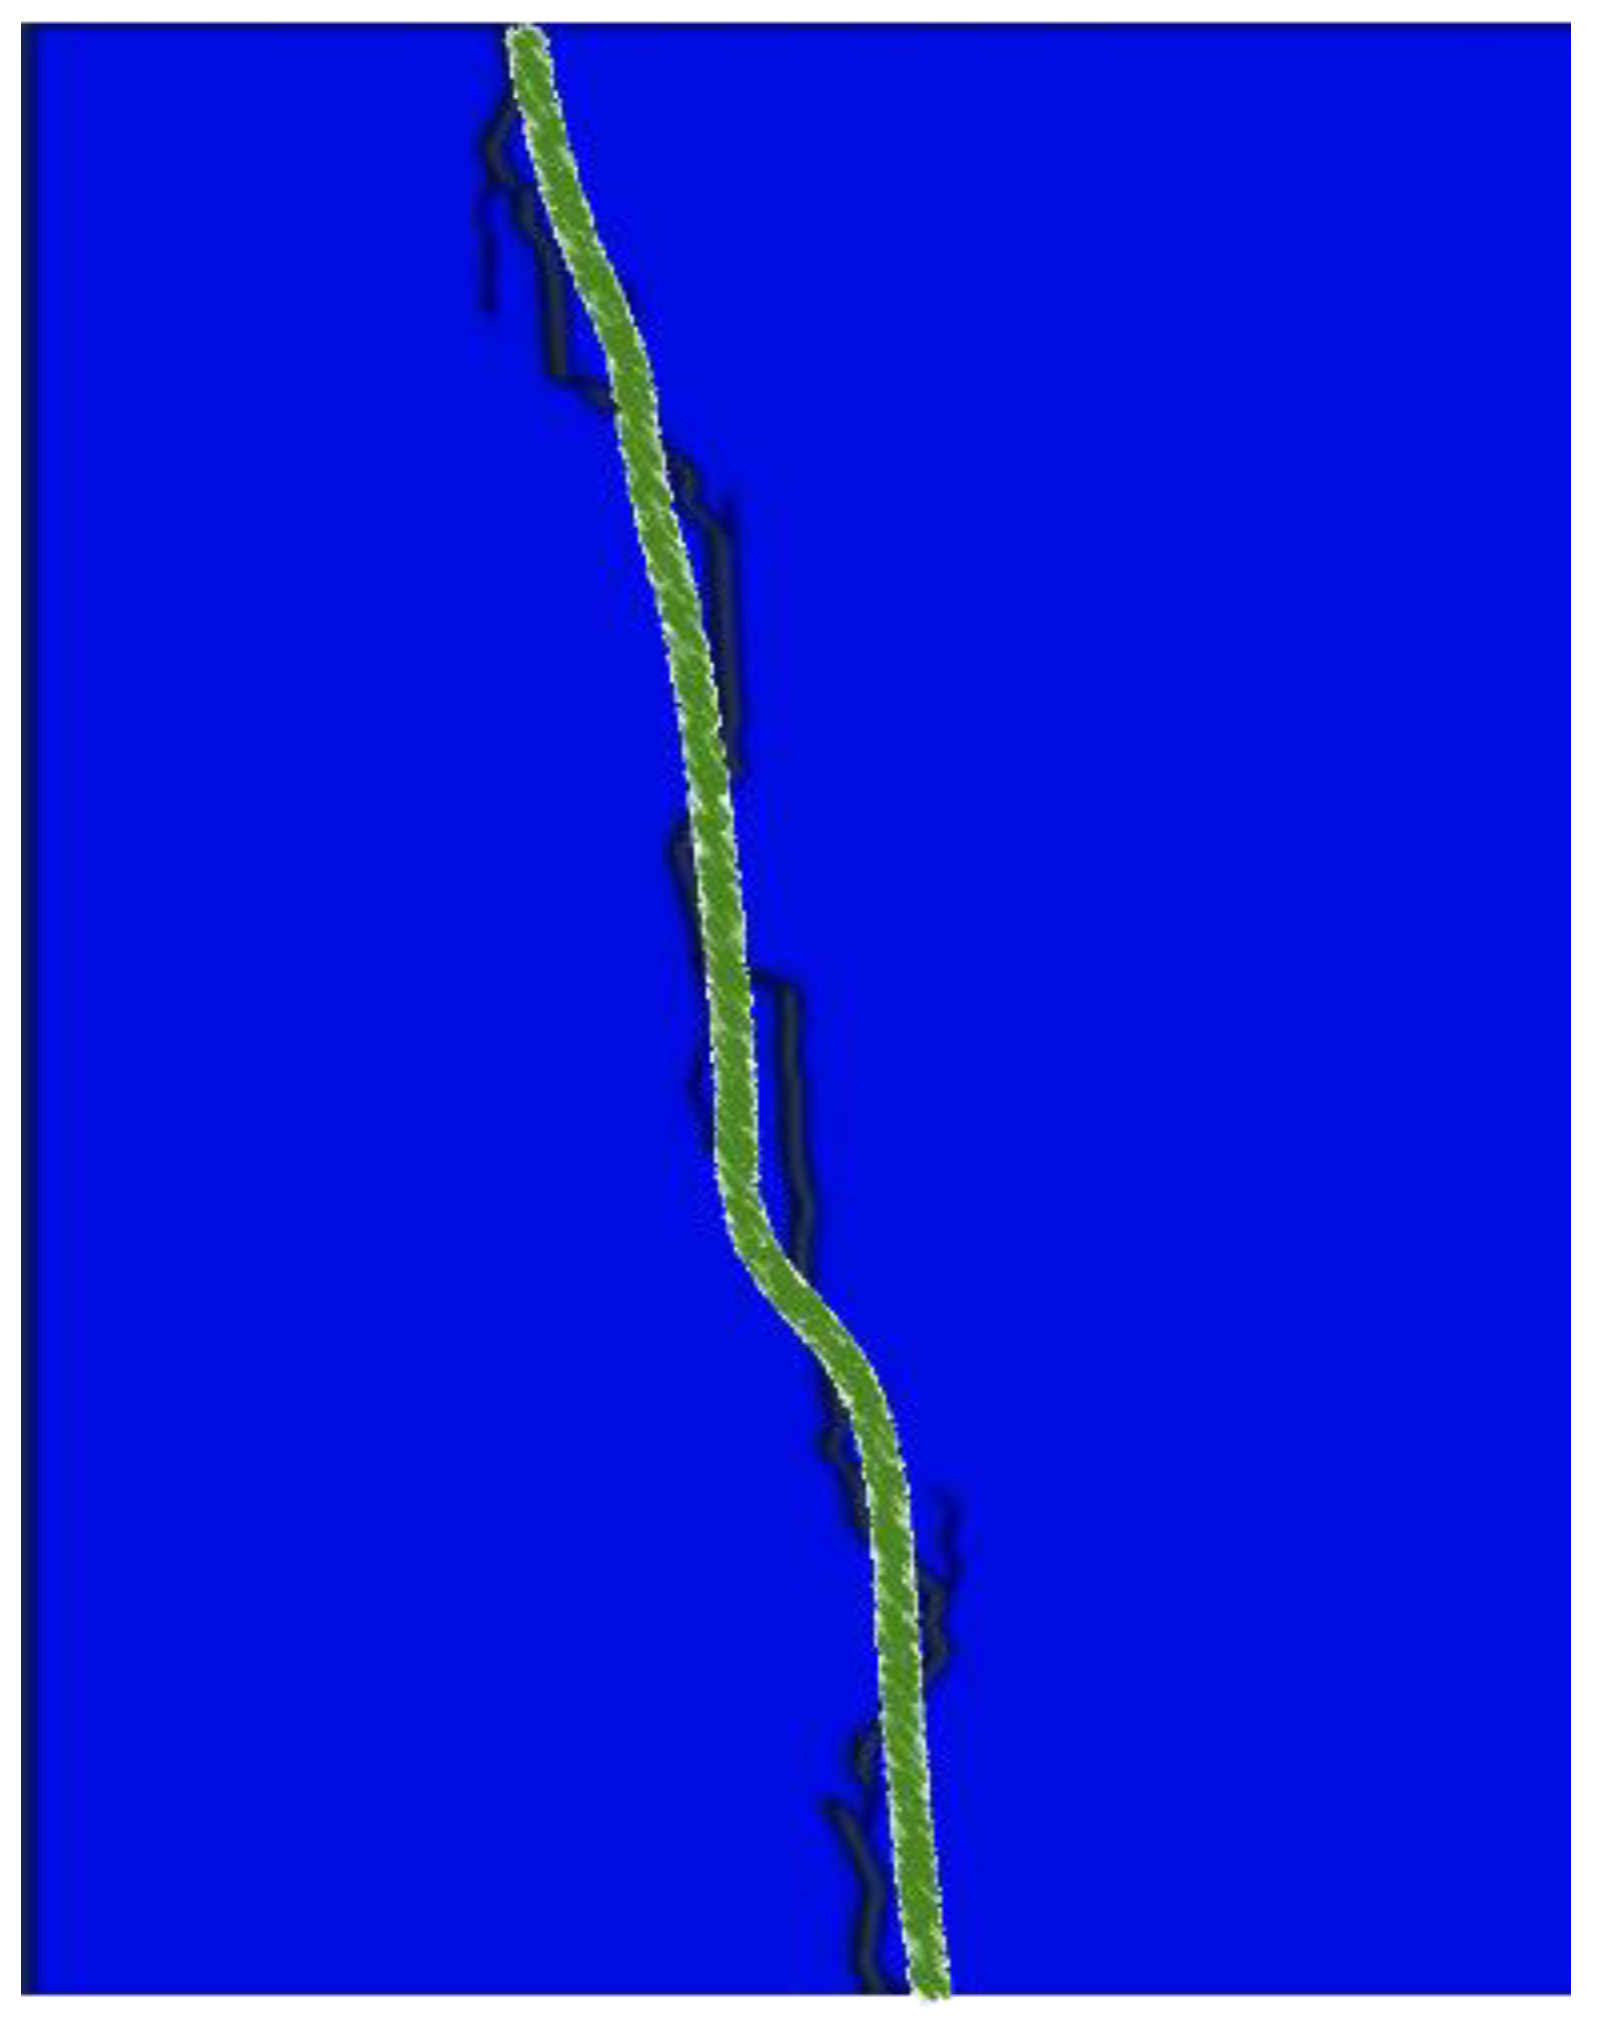
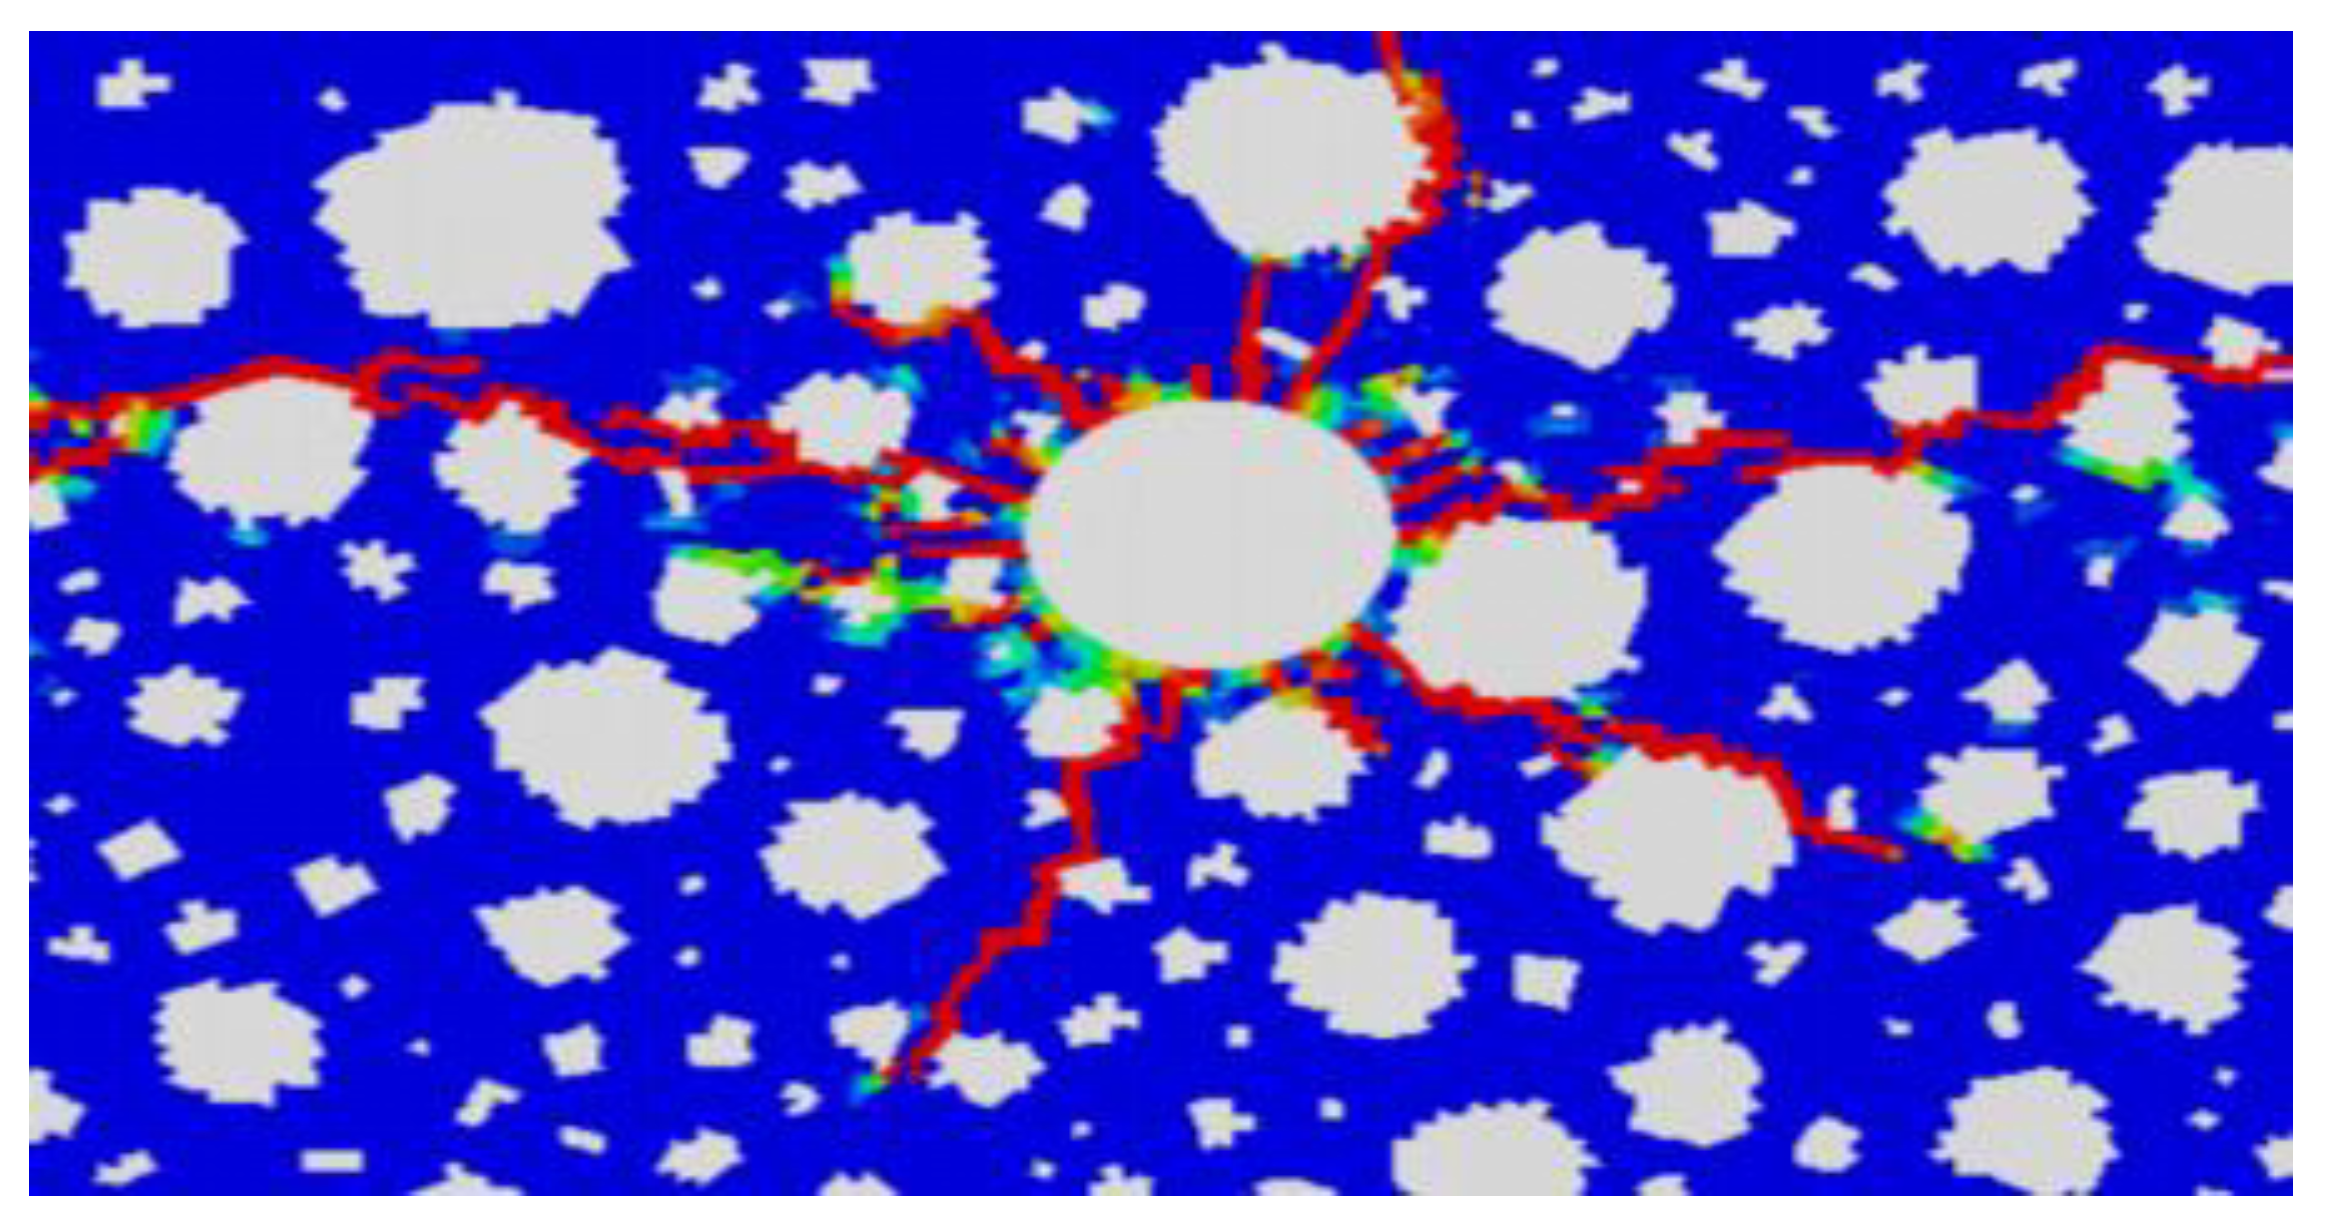
The simulated fracture directions are generally consistent with the actual tested fracture directions, though some deviations are observed in certain locations. The simulation results show a greater number of microfractures, which are difficult to observe in experiments.
Figure 6.
Comparison Between Simulation Results and Actual Hydraulic Fracturing.
Figure 6.
Comparison Between Simulation Results and Actual Hydraulic Fracturing.
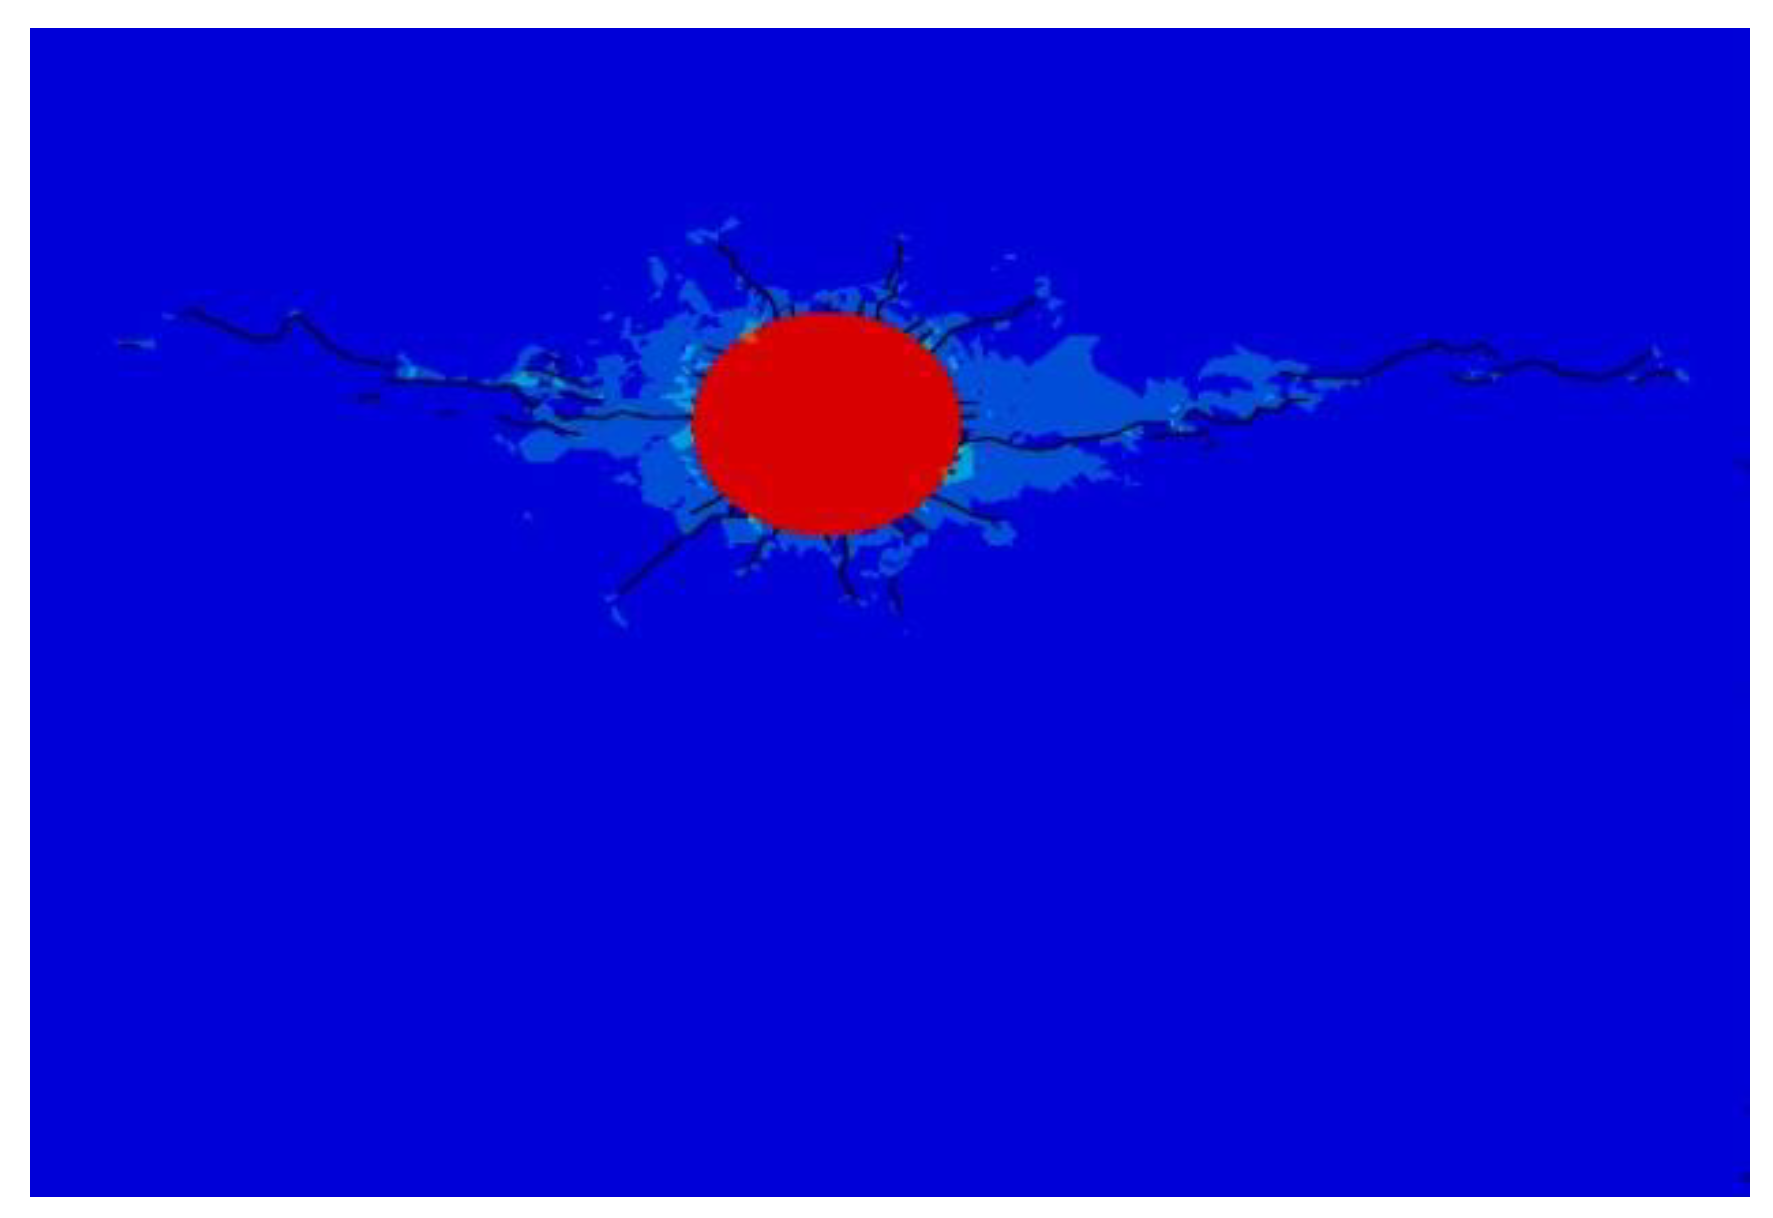
As pressure gradually increases, stress progressively accumulates at the perforation tip, forming a region where the minimum principal stress intensifies. Crack initiation occurs at the perforation tip and subsequently propagates outward as the pressure continues to rise. During this process, the crack growth remains stable, and scattered micro-cracks begin to form at the tip of the main crack.
In the high-stress regions, part of the accumulated stress is released and transferred to the crack tip, allowing the crack to further propagate even without additional pressure. Ultimately, the main crack connects with secondary cracks, forming a more complex fracture network.
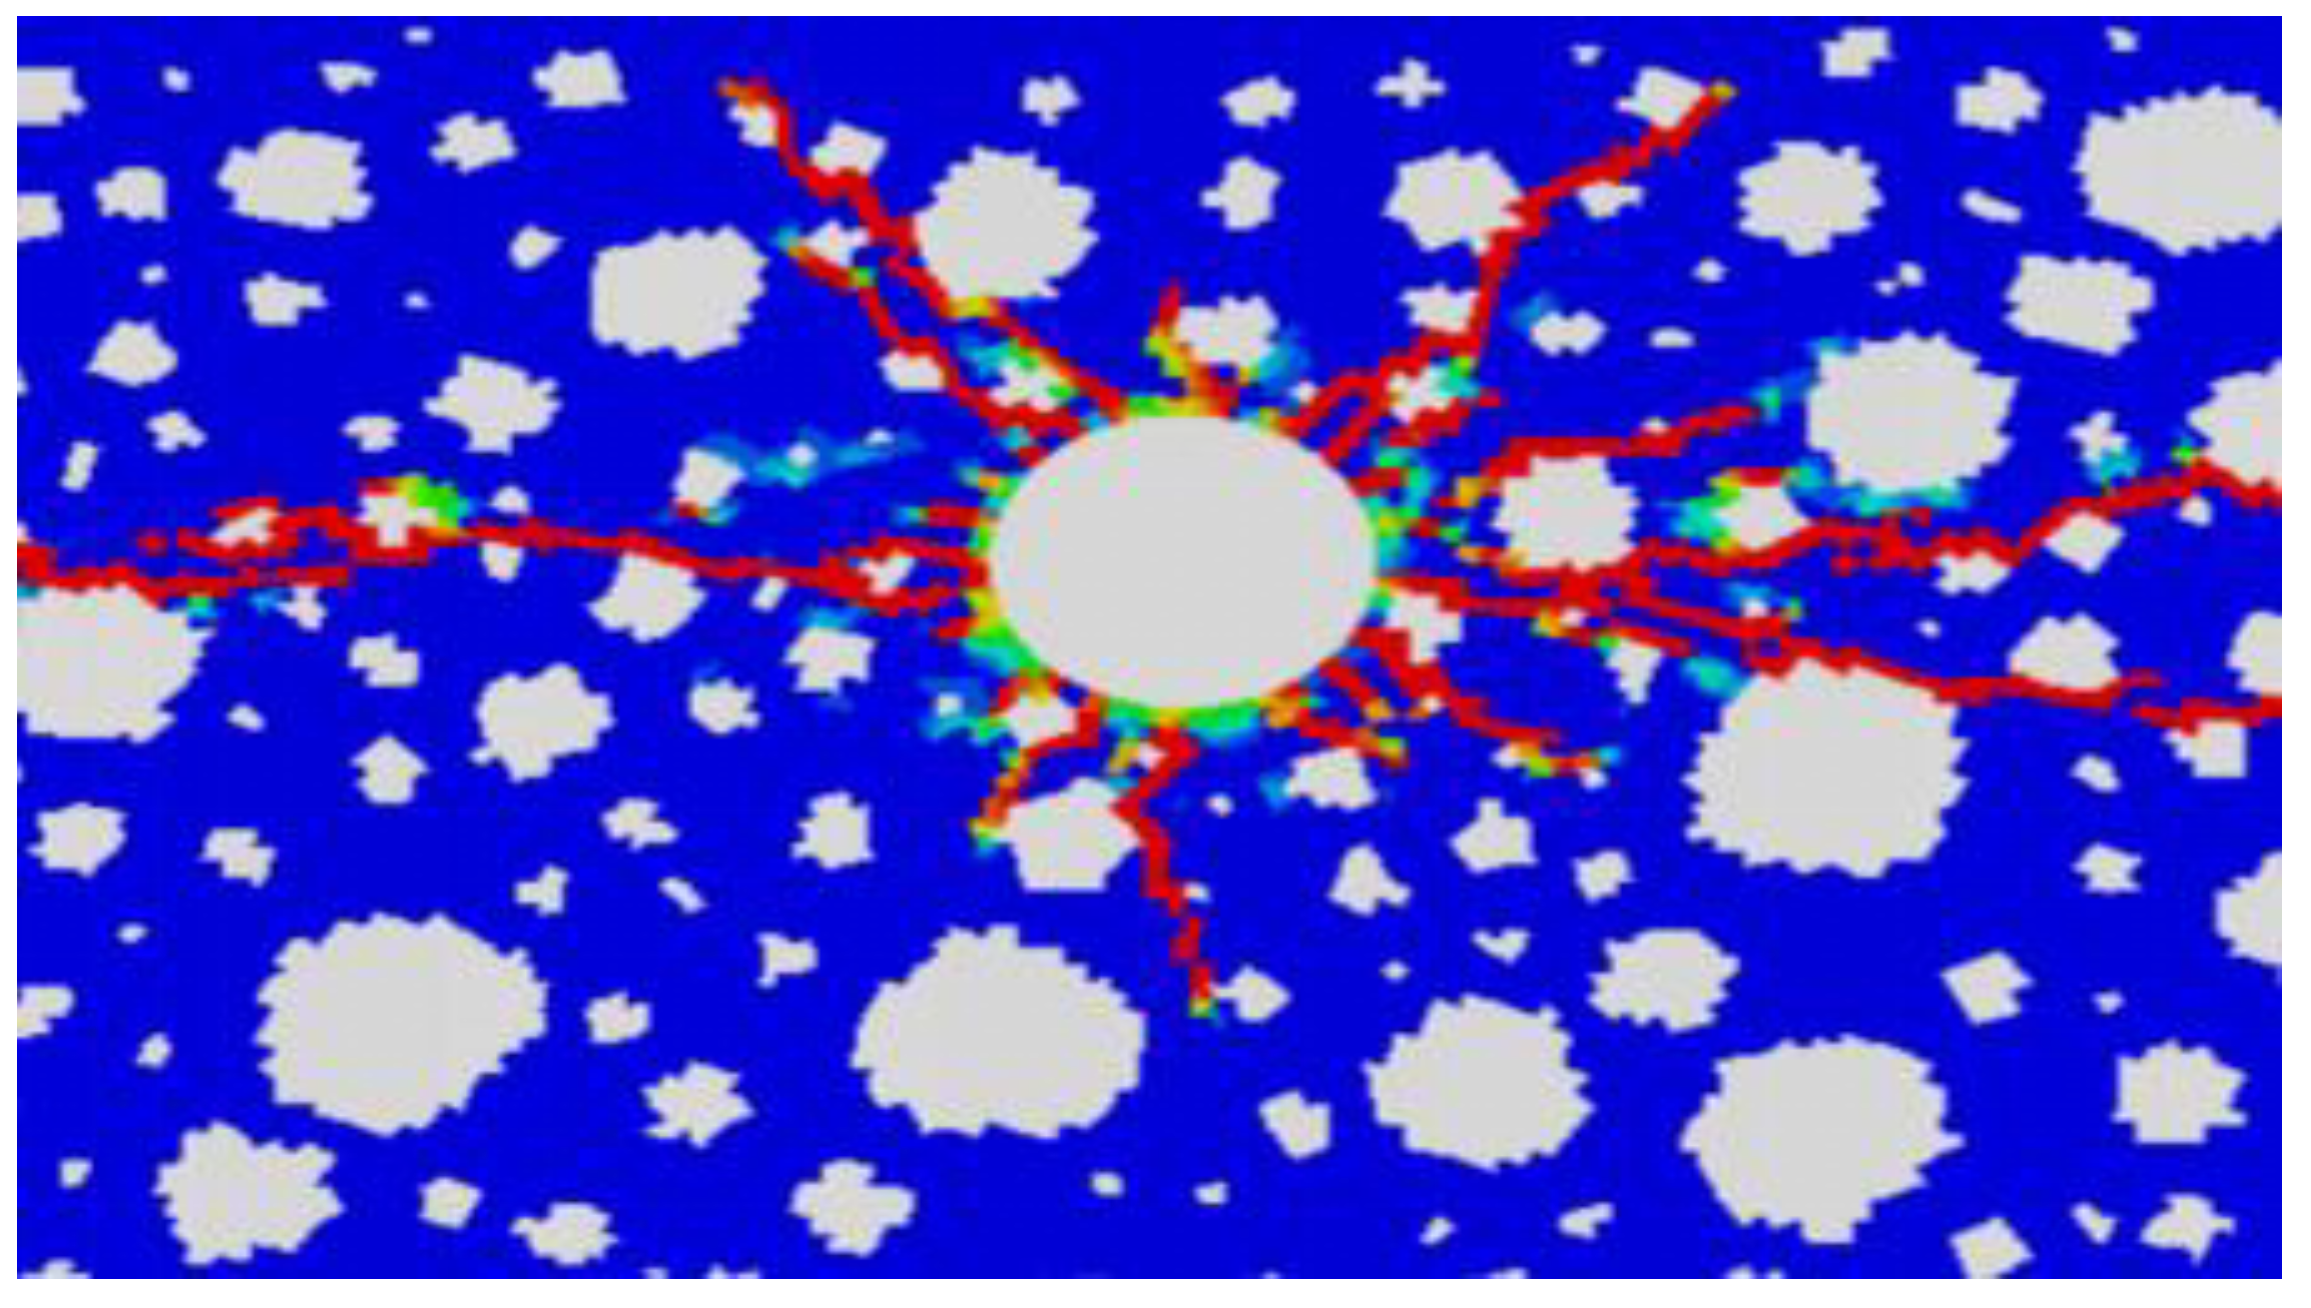
Figure 7.
simulation results1.
Figure 7.
simulation results1.
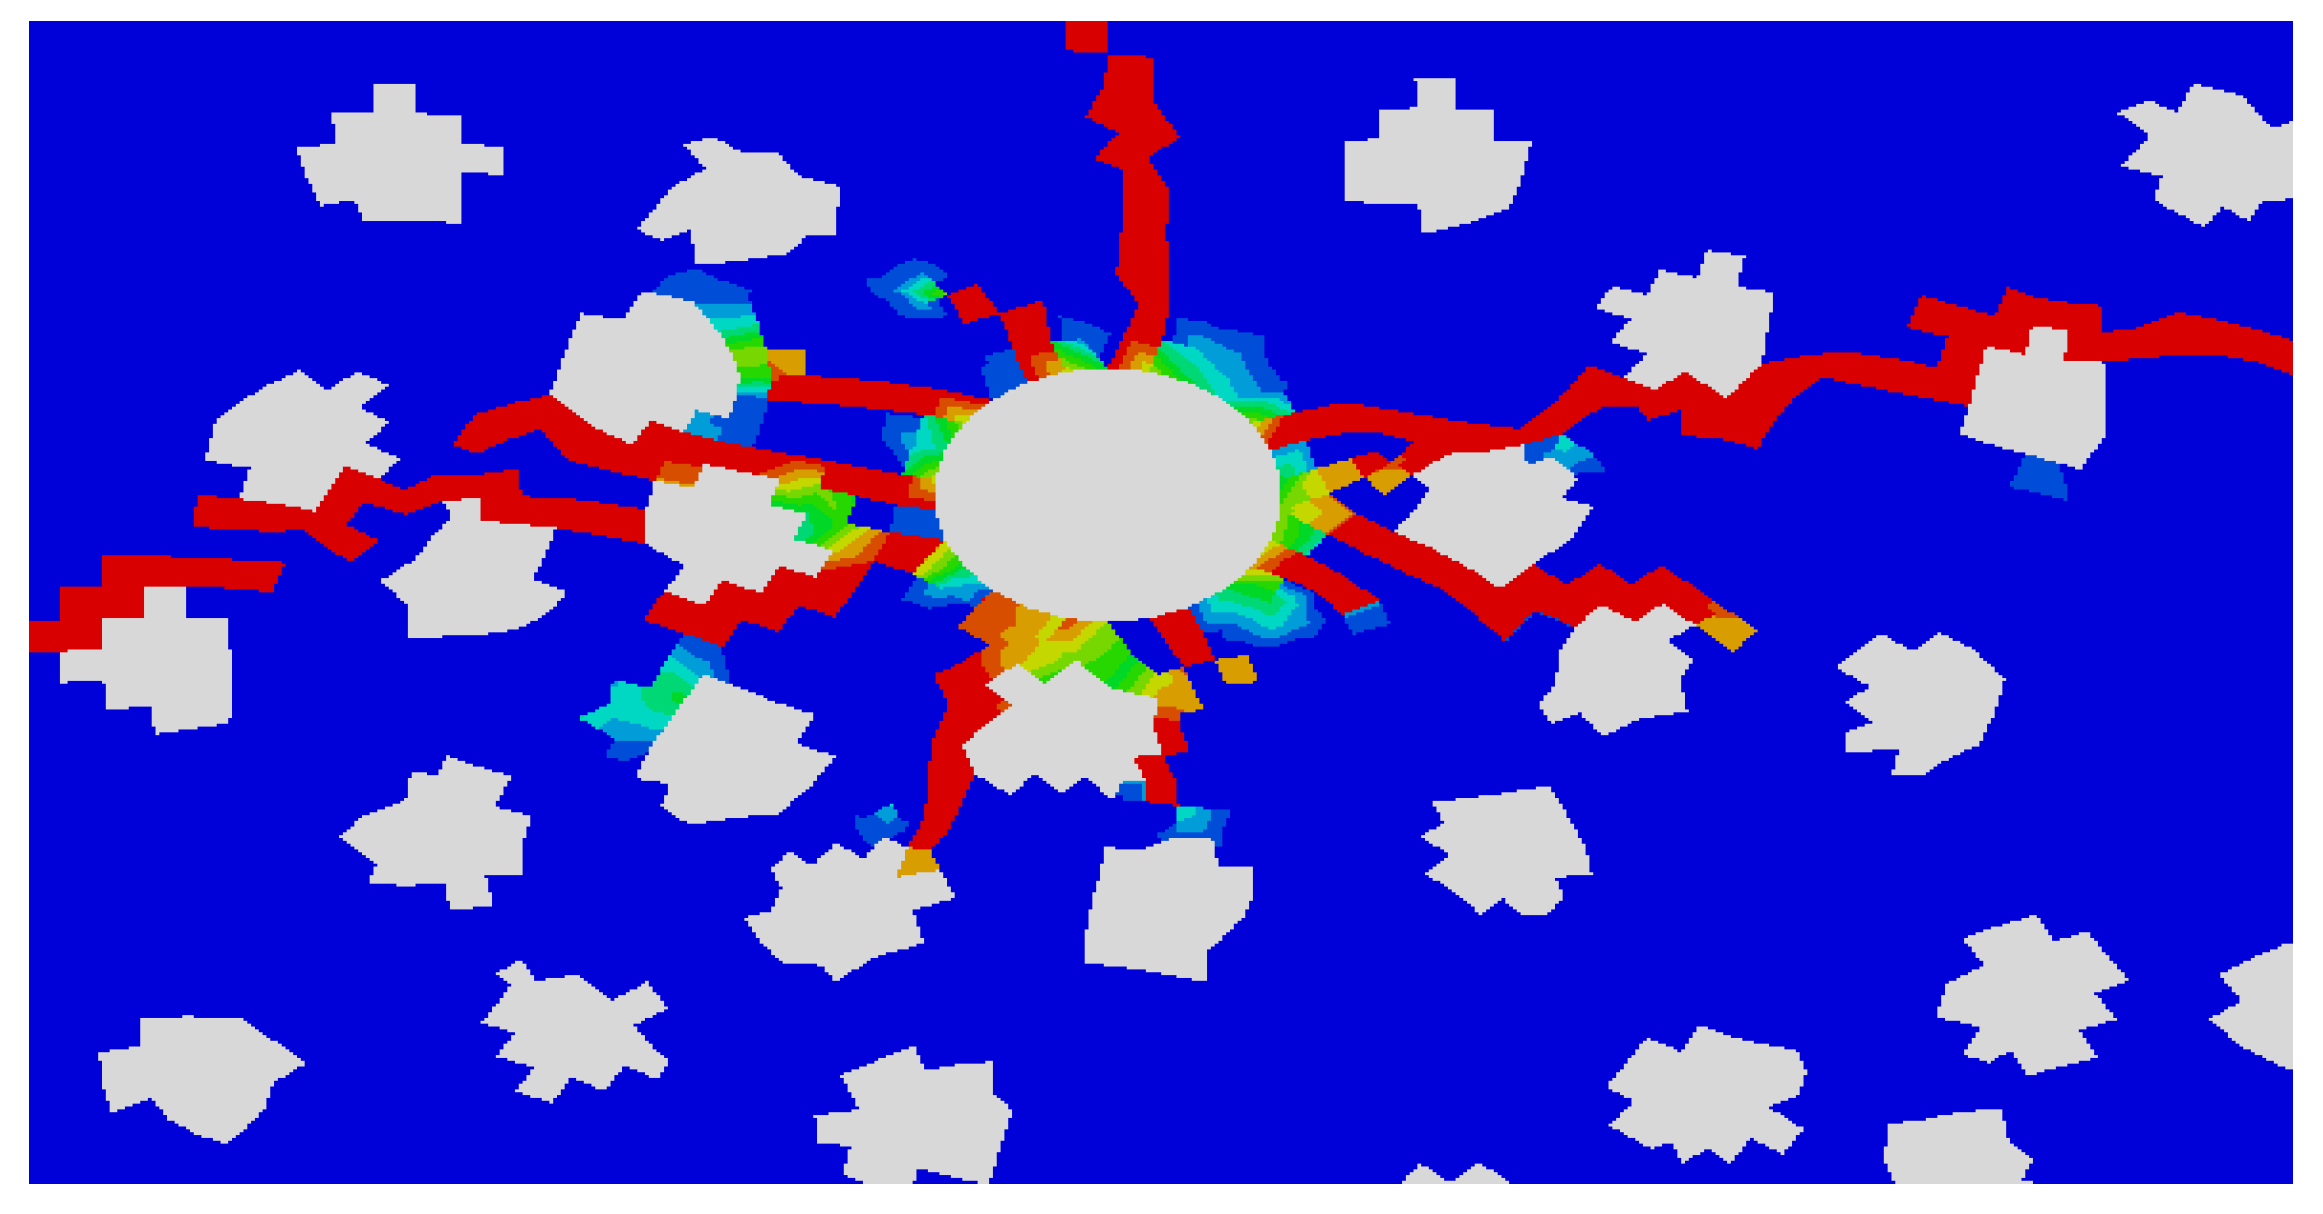
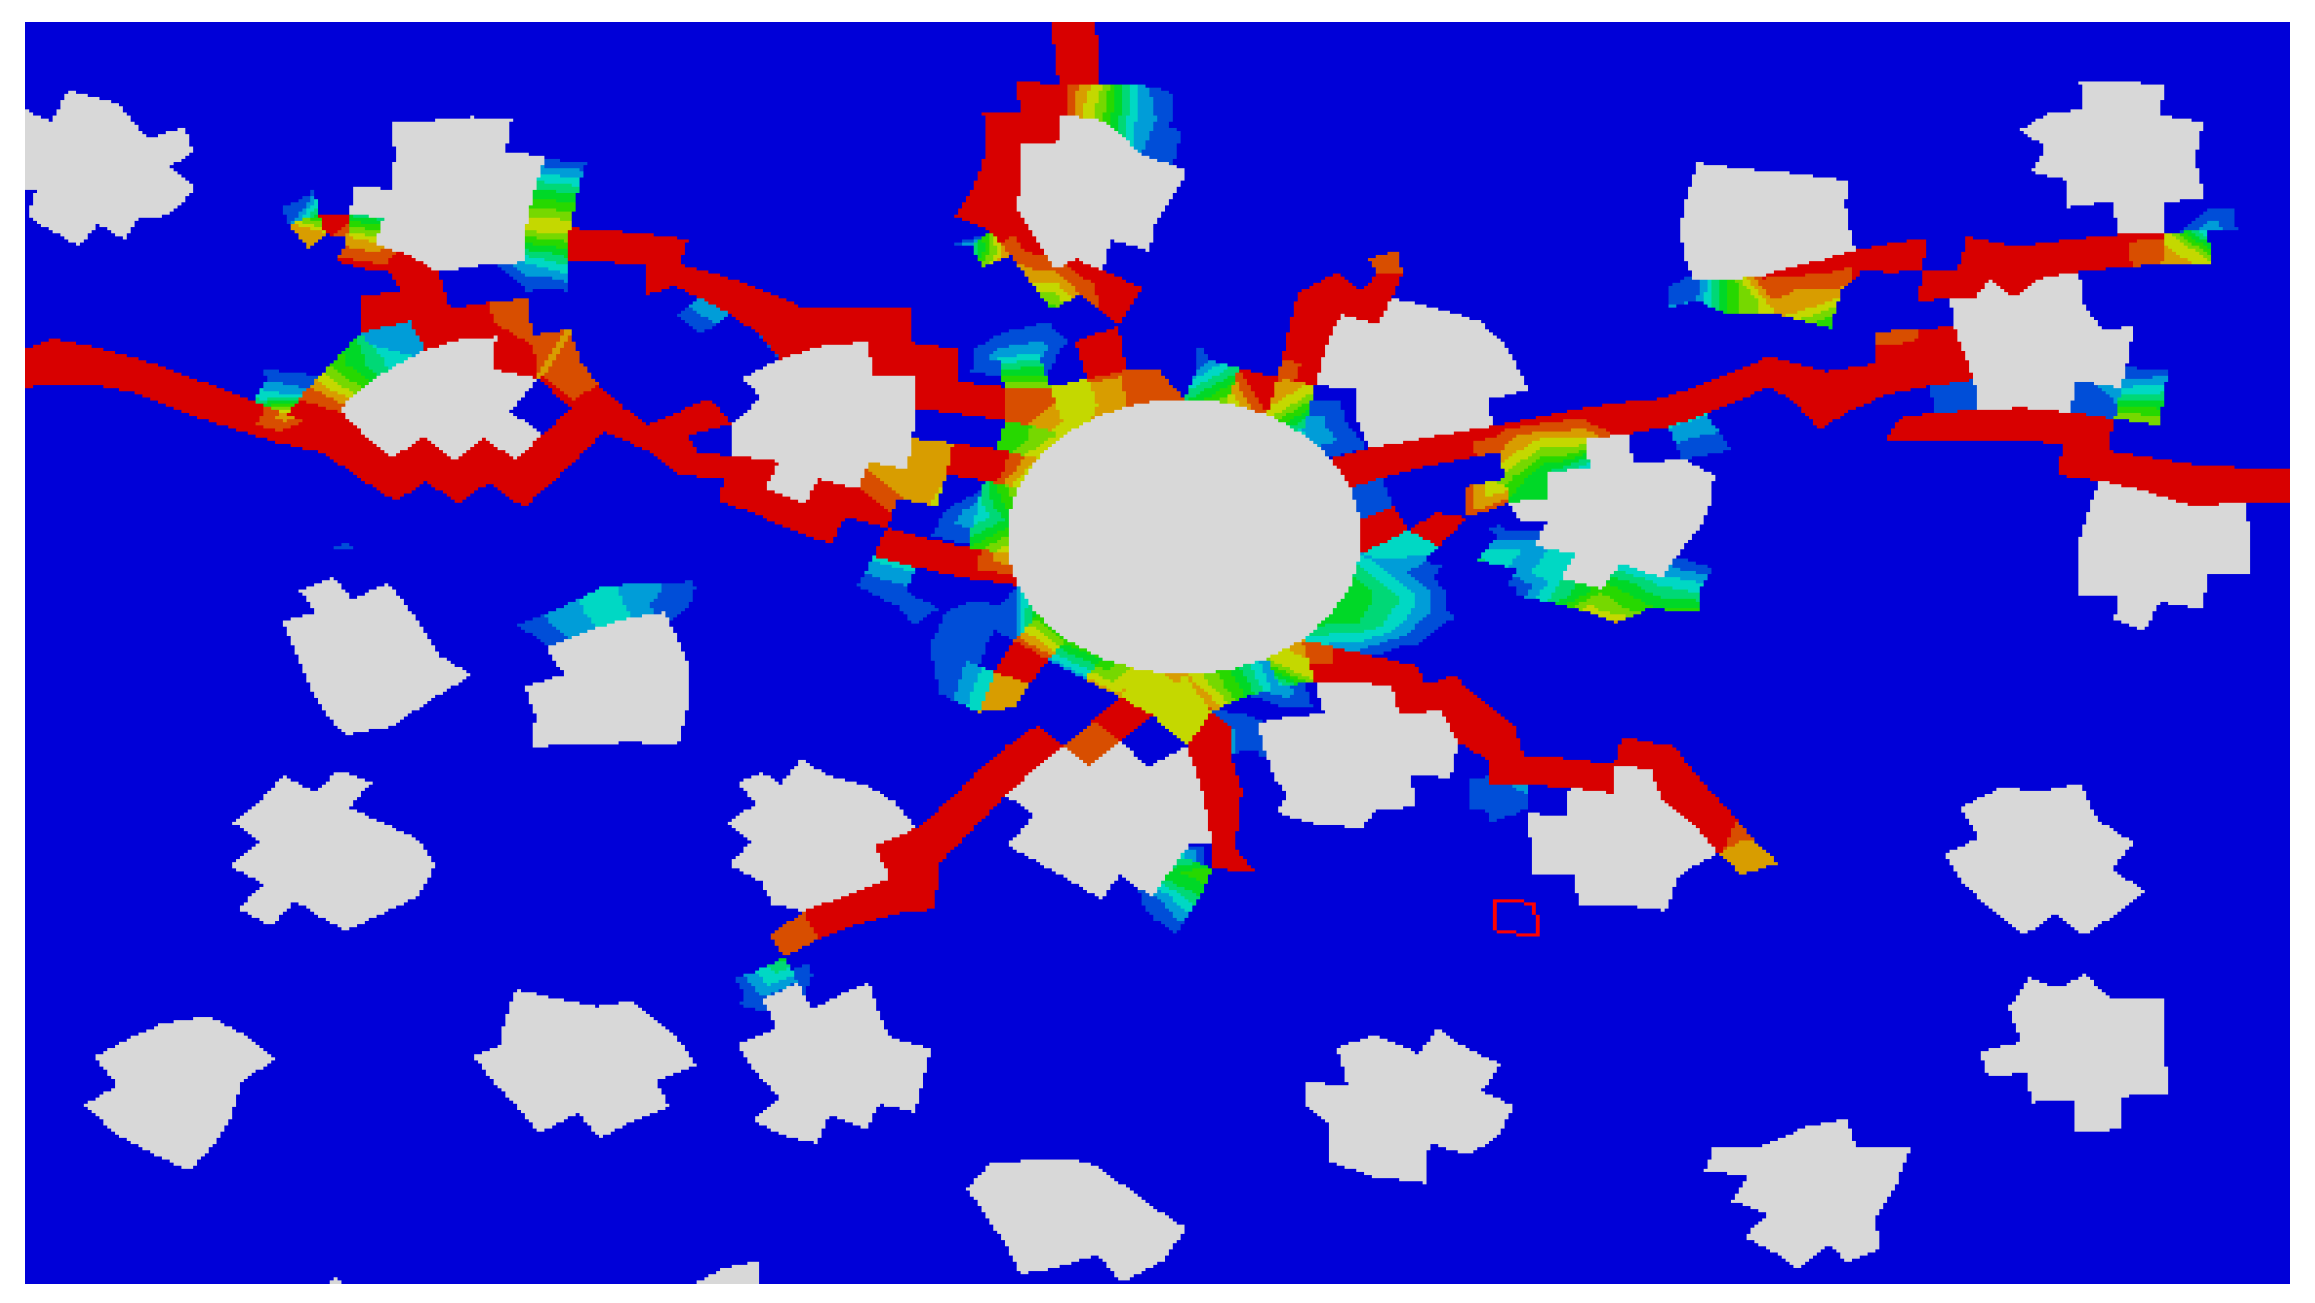
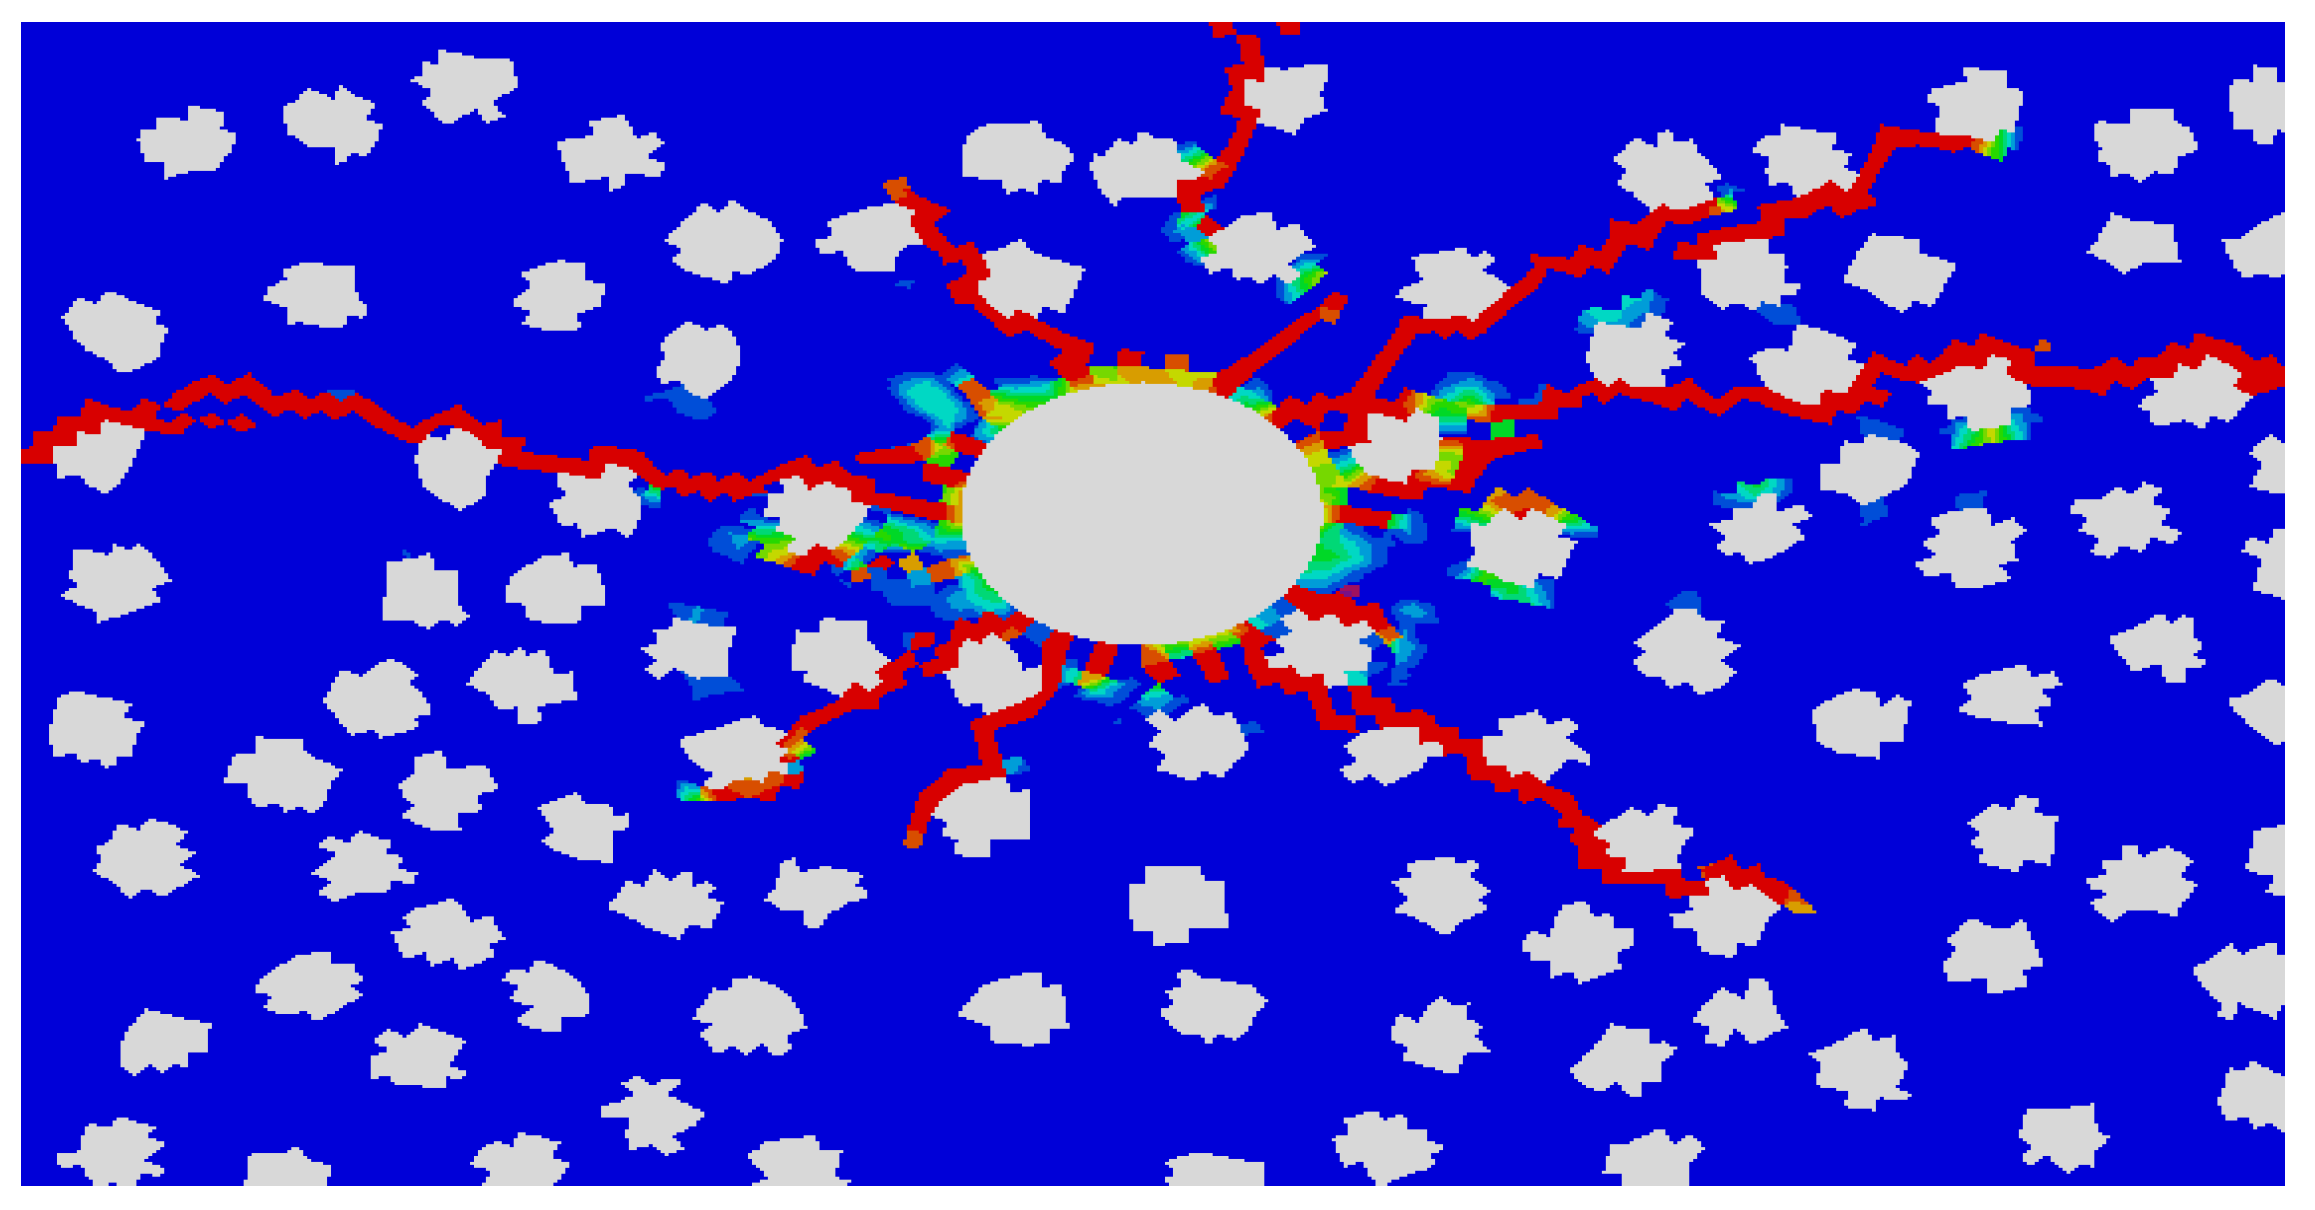
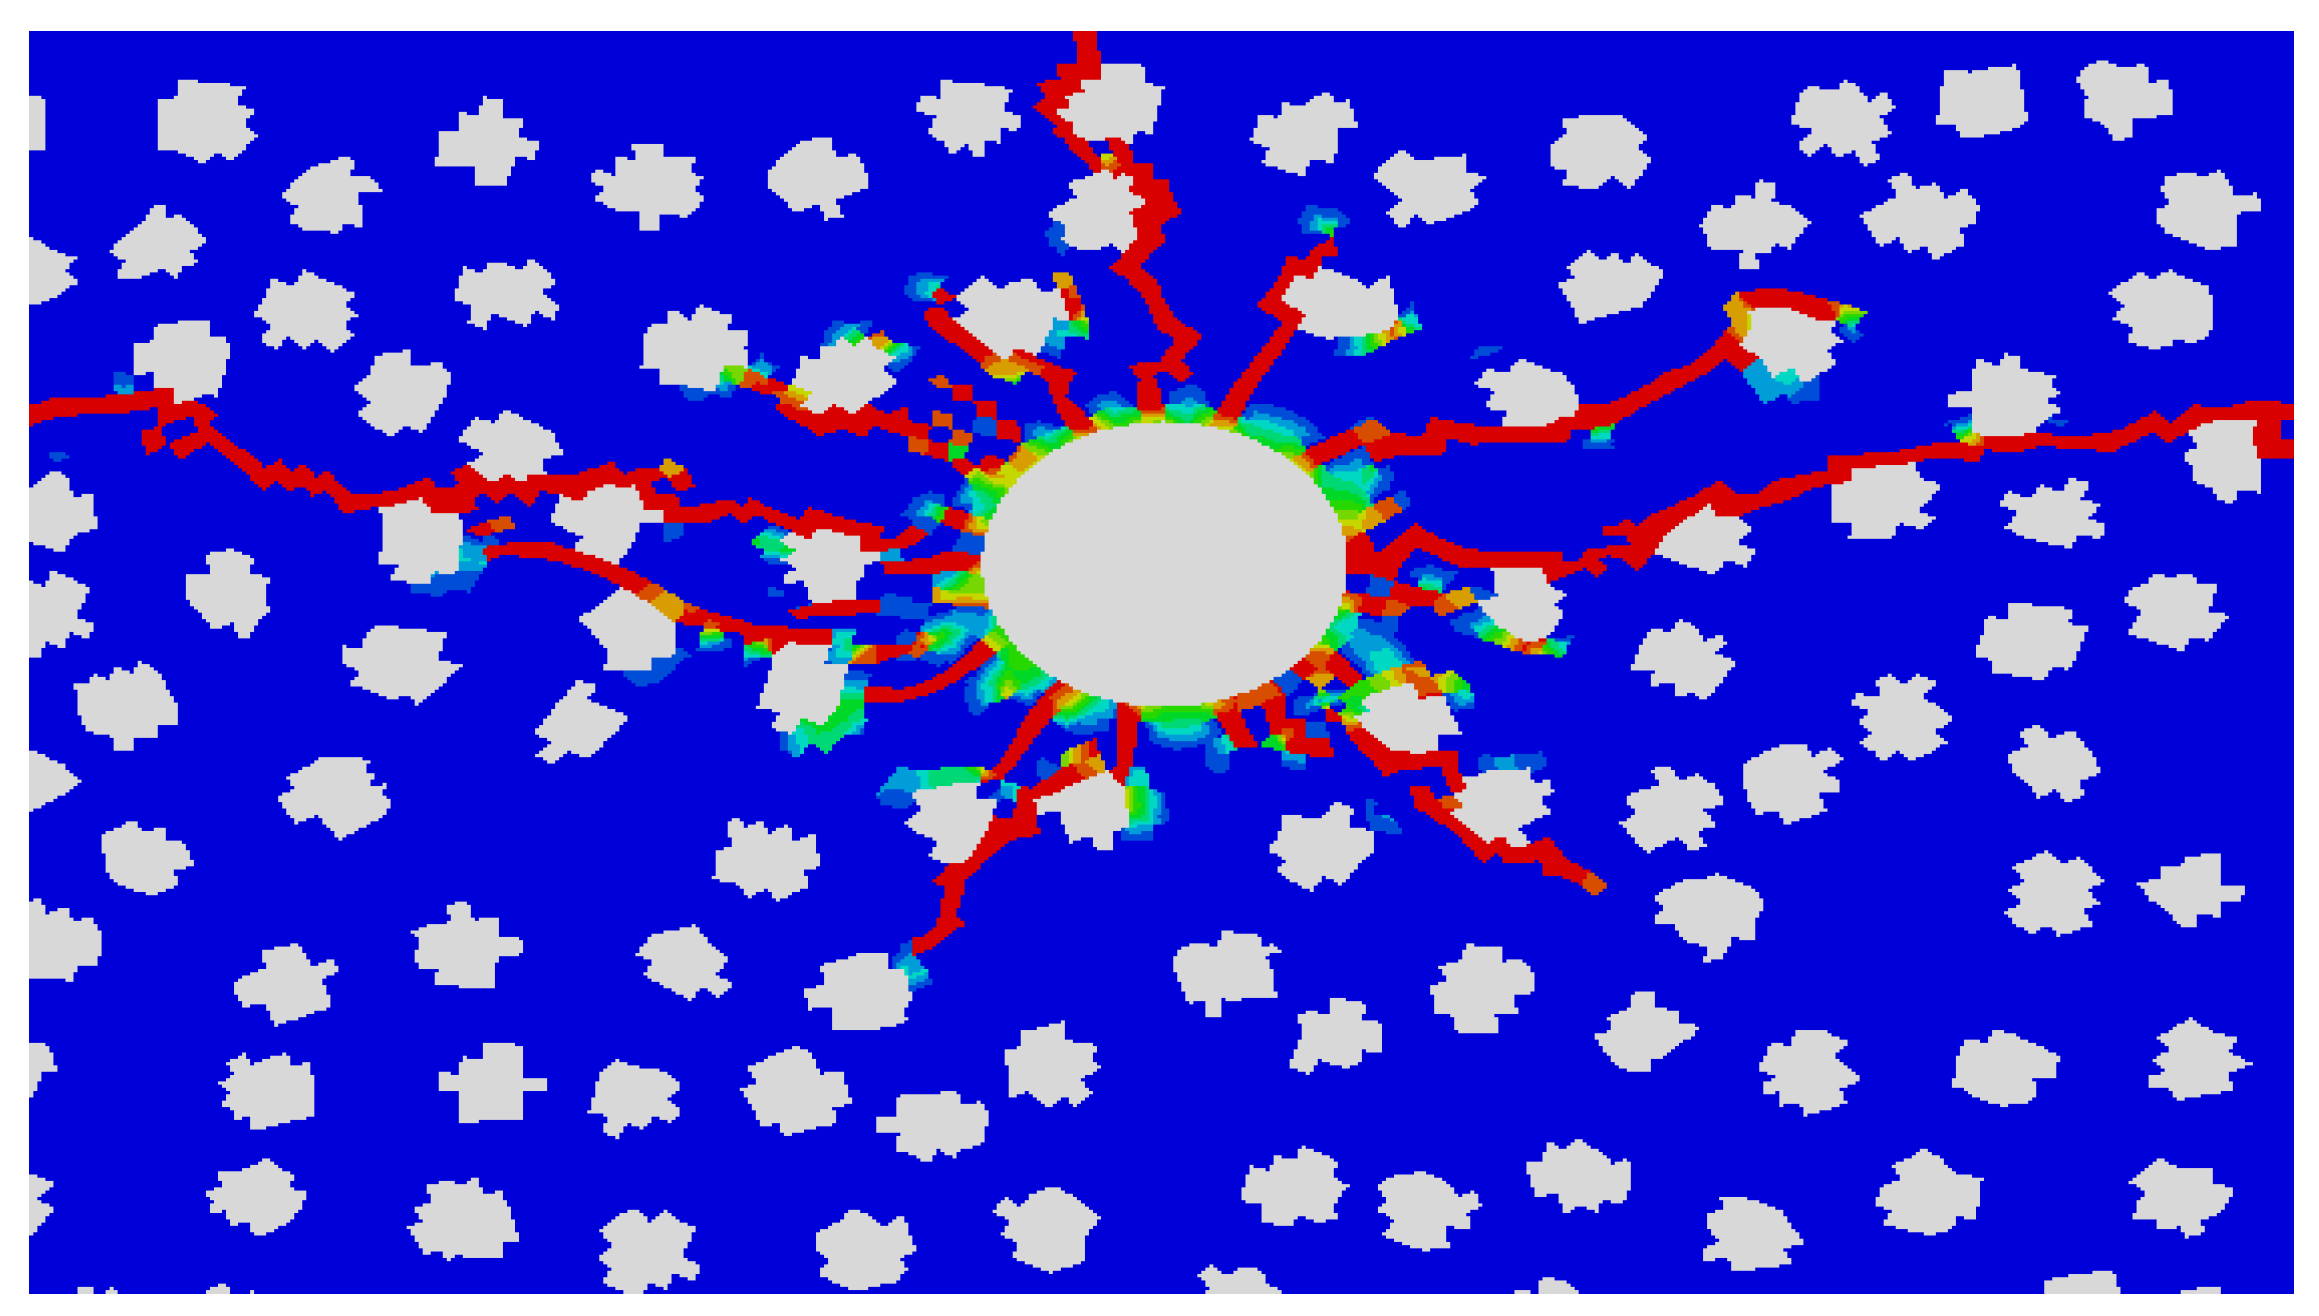
Crack initiation, propagation, penetration, and bifurcation exhibit distinct behaviors influenced by the presence of gravel and its interaction with the surrounding stress field. The occurrence of cracks penetrating through gravel particles is rare, as gravel generally acts as a stress barrier. When gravel particle sizes are large and the distribution is sparse, the main crack has sufficient space to bypass the gravel. This results in an accumulation of micro-cracks concentrated in the tip area of the main crack, further influencing crack morphology and propagation dynamics.
Crack propagation can be categorized into three distinct stages: stress accumulation stage, initial crack expansion stage, and stable crack expansion stage.
Stress Accumulation Stage:
During this stage, stress initializes and accumulates at key points such as the perforation tip. No visible cracks are formed, and the displacement energy associated with crack deformation remains at zero. This phase sets the foundation for subsequent crack initiation by creating localized stress concentration areas.
Initial Crack Expansion Stage:
Cracks begin to form around the perforation or gravel during this stage. The energy required for crack propagation starts to rise linearly, indicating the early stages of crack development. As stress continues to build, the energy demand for crack growth accelerates, marking a transition to more dynamic crack behavior.
Stable Crack Expansion Stage:
In this final stage, cracks propagate steadily along the path of least resistance, navigating around obstacles such as gravel particles. Stress redistribution occurs, and the crack morphology stabilizes as the system approaches equilibrium. Micro-cracks at the main crack tip may continue to form and cluster, contributing to the development of a fracture network.
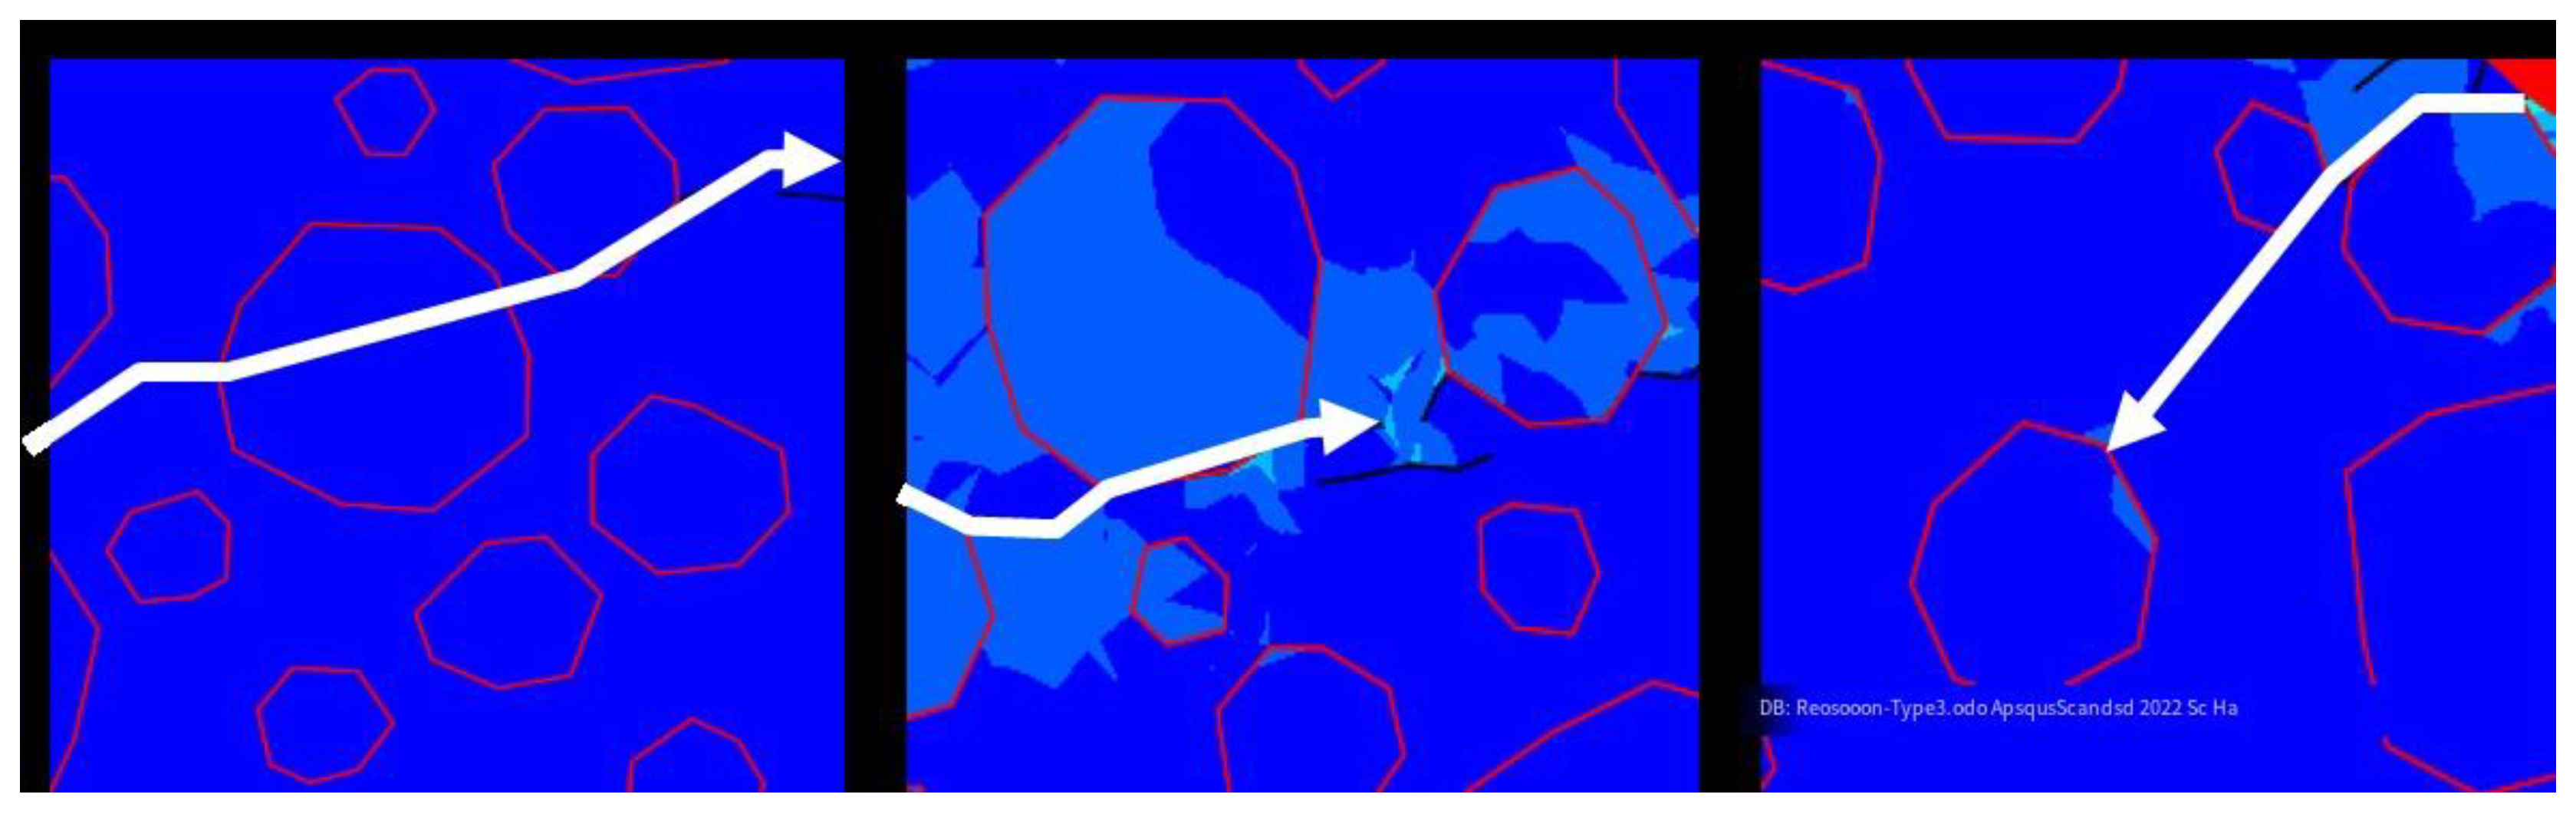
Figure 8.
Simulation of different gravel sizes2.
Figure 8.
Simulation of different gravel sizes2.
With the increase of gravel strength, the shielding effect of gravel becomes more and more obvious, and the expansion mode changes from penetrating gravel through embedding crack arrest to winding gravel. Under the condition of low stress difference, the crack spreads around the gravel and extends, and under the condition of high stress difference, the barrier and shielding effect of gravel on the crack extension is weakened.
According to the simulation results, the greater the gravel content, the greater the probability of encountering gravel in the fracture extension direction, the more complex the fracture, the more obvious the filtration loss, the faster the energy dissipation, and the less easy to create long cracks. The larger the gravel, the greater the energy required for damage, the more obvious the behavior around gravel, and the smaller the gravel, the more likely to cross gravel.
Under the condition of low stress difference, the larger the gravel strength is, the more likely it is to cross gravel in the process of fracture extension. The fracture morphology is more complex and the fracture extension distance is shorter. Under the condition of high stress difference, the lower the strength of gravel, the easier it is to cross gravel in the process of crack extension, and the crack shape is simple and the crack extension distance is long.
Figure 9.
Crack propagation diagram of gravel diameter 10mm (content 30%)3.
Figure 9.
Crack propagation diagram of gravel diameter 10mm (content 30%)3.
Figure 10.
Crack growth diagram of 10mm gravel diameter (40% content)4.
Figure 10.
Crack growth diagram of 10mm gravel diameter (40% content)4.
Figure 11.
Crack growth diagram of 5mm gravel diameter (30% content)5.
Figure 11.
Crack growth diagram of 5mm gravel diameter (30% content)5.
Figure 12.
Crack growth of 5mm gravel diameter (40% content)6.
Figure 12.
Crack growth of 5mm gravel diameter (40% content)6.
Figure 13.
Crack growth diagram of gravel diameter 10mm with 10% content, 5mm with 20% content, 3mm with 20% content7.
Figure 13.
Crack growth diagram of gravel diameter 10mm with 10% content, 5mm with 20% content, 3mm with 20% content7.
Figure 14.
Fracture growth diagram of gravel diameter 10mm with 10% content, 5mm with 10% content, and 3mm with 30% content8.
Figure 14.
Fracture growth diagram of gravel diameter 10mm with 10% content, 5mm with 10% content, and 3mm with 30% content8.