
Submitted:
04 December 2024
Posted:
04 December 2024
You are already at the latest version
Abstract
Imiquimod (IMIQ), a TLR7 agonist, enhances the anti-tumor response rapidly and persistently. In this study, we aimed to assess the effects of IMIQ in an experimental melanoma model to determine whether it is useful for restraining tumor growth and prolonging animal survival following IMIQ treatment in wild-type C57Bl/6 (WT) and C57Bl/6 CD1-knockout mice (CD1-/-). Mice were treated with IMIQ following subcutaneous injection of tumor cells into the pinna of the ears. We analyzed tumor size, survival, and splenic cell phenotypes. In addition, intracellular cytokines were evaluated after stimulation with anti-CD3. IMIQ treatment effectively restrained early tumor growth and increased survival only in WT. Antigen-presenting cell (APC) frequencies were higher in WT animals than in all CD1-/- animals regardless of IMIQ treatment. Higher numbers of NK+perforin+ splenic cells were found in WT mice, and higher numbers of IFN-gamma-producing CD4+ T cells were found in anti-CD3 stimulated splenic cells when IMIQ-treated WT mice were compared to the CD1-/- animals. Moreover, more splenic CD8+ T cells TNF-alpha+ producers were detected in WT compared to CD1-/- animals in unstimulated splenic cells. WT mice were protected by IMIQ from early mortality, presenting slowed melanoma development. The increased number of APCs in response to IMIQ was likely to be involved in the imiquimod in vivo effect and depended on the CD1 molecule. IMIQ induces higher numbers of splenic IFN-gamma+CD4+ T cells and TNF-alpha + CD8+ T cells, NK cells, and NKT cells expressing perforin.
Keywords:
melanoma
; NK-cells
; NKT-cells
; CD1
; imiquimod
Introduction
The prognosis of skin cancer, such as melanoma, depends on the stage of tumor detection. Currently, there are other treatments in addition to radiotherapy and chemotherapy. Nevertheless, early detection and surgery remains the most effective cancer treatment (Luiz et al. 2012). Many tumors escape an immune response by activating regulatory cells and regulatory cytokine responses. Myeloid suppressor cells (MDSCs) can accumulate and suppress the immune response, circumventing the anti-tumor response or causing immune response suppression and tumor growth (Sugiura et al. 1990). Immunosuppression is mediated by the production of interleukin 10 (IL-10), transforming growth factor (TGF-β), and nitric oxide (NO) (Sugiura et al. 1990). Additionally, matrix metalloprotease production contributes to angiogenesis and tissue remodeling (Ikenaka et al. 2003). Furthermore, Treg cells and immature dendritic cells (iDCs) produce factors that can suppress T cells in cancer patients (Woo et al. 2002).
Imiquimod (IMIQ) is a Toll-like receptor (TLR-7) agonist. This drug underwent topical testing for chronic viral infections and some skin cancers (Miller et al. 1999). IMIQ is a topical cream that activates the local immune response, restraining the growth of squamous cell cancer (SCC) (Huang et al. 2009). TLR-7 agonists may also function as adjuvant therapy for other skin cancers, as these receptors are expressed by various skin cells involved in cancers, including keratinocytes and melanocytes. In SCC, the IMIQ effect has been attributed to the overproduction of IFN-γ, the infiltration of CD8+ T cells at the tumor site, and the decreased production of TGF-β and IL-10 (Huang et al. 2009).
Besides CD8+ T cells, Natural Killer cells (NK) and NKT cells are usually involved in tumor control. NK cells increase adaptive immune responses to tumors and directly kill tumors that have escaped T cell responses, making NK cells promising targets for immunotherapy. Nicolai et al. (Nicolai et al. 2009) described that NK cells could directly kill CD8+ T cell-resistant tumors through the action of Type I interferons produced by STING agonists. This effect was observed in B16F10 melanoma injected into B2m−/− mice. Type I IFNs play central roles in NK cell biology, including maturation, homeostasis, and activation. When topically applied, IMIQ can induce mast cells to secrete CCL2 to recruit pDCs to secrete Type I IFNs and directly eliminate tumor cells. Furthermore, NK cells produce cytokines and chemokines that enhance the recruitment and maturation of dendritic cells (DCs) (Bottcher et al. 2018), thus fostering adaptive immune responses against melanoma (Nicolai et al. 2009).
NK cells recognize specific structures upregulated in tumor cells, including a group of identified proteins distantly related to MHC class I molecules. These proteins bind to a receptor called NKG2D in NK cells (Raulet et al. 2003). NKT cells constitute a CD1-dependent T lymphocyte population with a restricted T cell receptor repertoire characterized by an invariant NKT-cell receptor. NKT cells present NK cell markers and are recognized by anti-NK1.1 mAb in C57Bl/6 mice (Koo and Peppard 1990). Like NK cells and CTLs, NKT cells employ a perforin-dependent mechanism to kill tumor target cells. They can lyse various tumor cell lines, directly improving the rapid release of large amounts of cytokines activating NK cells, conventional T cells, B cells, dendritic cells, and monocytes (Carnaud et al. 1999).
In this study, we designed an experimental protocol involving the injection of B16F0 and used this model to test the effectiveness of imiquimod against melanoma. Our results demonstrate that imiquimod may help control melanoma development in vivo. Importantly, this effect depends on the presence of CD1 molecules, suggesting the involvement of iNKT cells in the biological activity of imiquimod.
Material and Methods
Animals
Female C57Bl/6 wild-type mice (WT) aged 4 to 6 weeks were raised and maintained at the animal care facility of the Gonçalo Moniz Institute, Oswaldo Cruz Foundation (IGM-FIOCRUZ) in Salvador, Bahia, Brazil. C57Bl/6 CD1-/- mice lacking the CD1 molecule at the same age as WT were obtained from Dr. Ricardo Gazzinelli (Rennée Rachou Research Center, Oswaldo Cruz Foundation, Belo Horizonte-MG, Brazil). The Institutional Review Board followed all experimental protocols for Animal Experimentation in FIOCRUZ-RJ (L-026/09) and FIOCRUZ-BA (L-IGM- 38/2009 e L-IGM-39/2009), Brazil. The animal house kept the mice in cages containing five animals each, with individual ventilation. Mice received autoclaved food and water, were initially obtained from Jackson Laboratory, and were maintained in a pathogen-free environment.
Cell Cultures
Renzo Brentani kindly provided melanoma tumor cells of the B16F0 cell line. Cells were thawed and maintained in culture flasks containing RPMI 1640 Gibco (Waltham, MA USA) supplemented with 10% fetal bovine serum (FBS) (Sigma Aldrich, Darmstadt, Germany) until expansion for injection purposes.
Injection of Tumor Cells and Treatment Protocol
B16F0 cells were removed from culture flasks using Trypsin-EDTA solution from Sigma Aldrich (Darmstadt, Germany) at a concentration of 0.25% and then counted and suspended in PBS at an adjusted concentration of 5 x 10⁴. To minimize suffering, the animals received an intraperitoneal injection of ketamine/xylazine: Ketamine (Sigma Aldrich, (Darmstadt, Germany)) and Xylazine 2% (Syntec, Sao Paulo, Brazil); both diluted on a 0.2 mL of 0.15M saline solution 1:1:3 proportionally. Following, mice received a subcutaneous tumor cell injection (20 μL) in the ear. In addition, treated experimental animals received a 10 μL dose of imiquimod (IMIQ) topical cream applied twice daily, every 12 hours, at 50 μg/ml concentration.
Tumor Growth and Mortality
All animals were checked twice daily, five days a week. Tumor sizes were measured every two or three days. Animals with tumor lesions larger than 1 cm at the injection site were euthanized. As depicted, one in two or three experiments is represented for other analyses.
Cellular Phenotype Determination by Flow Cytometry
Following spleen removal and cell washing, 2x10⁶ spleen cells were aliquoted for staining. Splenic cell numbers remained the same in groups treated (or not) with IMIQ), and all cells were incubated with Fc block (clone 2.4G2) for 30 minutes at 4°C in FACS buffer (PBS, 2% FBS, and 0.1% sodium azide). Next, all plates were incubated for 30 minutes at 4°C with the following monoclonal antibodies: anti-CD11c PECy5.5 (clone BU15) and anti-CD11b FITC (clone ICRF44): Thermo-fisher (Waltham, MA USA). Anti-CD8α-PECy5.5 (clone RPA-T8), from BD bioscience (New Jersey, USA. Anti-CD8-FITC (clone SK1) from Sigma Aldrich, Darmstadt, Germany). An anti-CD4-PECy5.5 (clone CT-CD4) and an anti-αβ-FITC (clone R73) from Invitrogen Waltham, MA USA. Anti-αβ-FITC (clone R73) from BioLegend (San Diego, USA); and NK1.1-PECy5.5 (PK136) from Invitrogen (Waltham, MA USA). A rat anti-mouse IgG isotype control was also used for each staining, and all samples were individually stained. Finally, all cells were washed with PBS, and readings were performed on a flow cytometer (BDFacsort) by acquiring 200.000 for phenotyping cell populations. Then, the data were analyzed by FloJowTM v10 software, graphics, statistical analyses were performed in Prism-GraphPad 10 software, and statistical tests were used as described in Statistical Analyzes.
Intracellular Cytokine Staining
The cells were first obtained in the same manner as described above. Then, cells were cultured at 37°C under 5% CO2 in 10% FBS-RPMI in the presence of 2.5 μg/ml brefeldin A for 8 hours (Invitrogen) and stimulated with soluble anti-CD3. Surface staining was carried out following the same procedure as described above. Next, the cells were fixed in Fix/Perm for intracellular cytokines, washed, permeabilized in Perm/Wash (BD Biosciences), and then incubated for 60 minutes with the following anti-cytokine antibodies: anti-IFN-γ-PE (clone XMG1.2) and anti-TNF-PE (clone MAb11) from Invitrogen (Waltham, MA USA). Anti-perforin-PE (clone B-D48) was from BioLegend (San Diego, USA). As a control, a rat anti-mouse IgG isotype was used. After adding these antibodies, all cells were washed, and flow cytometry readings were performed (BDFacsort) by acquiring 200.000 events for intracellular cytokine detection.
Statistical Analysis
Comparisons were made among the following experimental groups: saline injection (Control), injected only with melanoma cells (B16F0), injected with tumor cells, and then treated with IMIQ (B16F0+IMIQ) or only received IMIQ treatment without tumor cell injection (IMIQ). The experimental groups of WT animals and CD1 knockout mice were also compared. The Log-Rank test was used to compare longevity, and for the tumor size between groups, the Mann-Whitney test was used (n=10), with the level of significance indicated in the figures. In addition, splenic cell numbers were compared when every two samples were individually compared by non-parametric testing (n=4, Mann-Whitney, level of significance p=0.0284) for comparison of the statistical differences between more than two different groups, Kruskal Wallis non-parametric test was used. The results are shown in bar graphs as ± standard error of the mean (SEM). As described above, asterisks (*) were used to indicate statistically significant differences.
Results
Tumor containment promoted by imiquimod is CD1-dependent.
B16F0 melanoma cells are aggressive, resulting in low survival rates in inoculated mice (Drobits et al. 2012). Imiquimod has been related to improving the immune response to mouse melanoma, increasing the biological activity of many immune cells, including the CD1-dependent, invariant NKT cells. Mice lacking the CD1 molecule (CD1-/-) were employed since this molecule is fundamental for the development, antigen recognition, and effector functions of NKT lymphocytes. Therefore, we chose to evaluate whether the CD1-dependent cell population had any role in containing tumor progression and promoting survival in IMIQ-treated animals. During the experimental model establishment, parameters related to animal survival and tumor development were studied (Figure 1). In Figure 1A, tumor size is smaller in B16F0+IMIQ WT than in B16F0 WT mice, showing that IMIQ treatment delays tumor growth. Melanoma development remained unaffected after IMIQ treatment in CD1-/- animals (B16F0+IMIQ CD1-/-). Besides, the WT animals treated with IMIQ presented smaller tumor sizes than the B16F0+IMIQ group of CD1-/- each day, 12th, 16th, and 18th after tumor cell injection. Thus, enhanced tumor development and worsening survival were evidenced in CD1-/- versus WT mice, regardless of IMIQ treatment. Figure 1B shows that CD1 -/- mice of the B16F0 mice group, regardless of IMIQ treatment, had survival rates like those of the untreated B16F0 WT animal group. Also, B16F0+IMIQ WT mice survived longer than the IMIQ-treated CD1-/- animals. As illustrated in Figure 1C, rapid tumor growth was observed on the 18th day following the injection of melanoma cells into the ears of mice. The tumors were easily visible and spherically shaped, with regular borders and well-defined boundaries (Figure 1C). In addition, IMIQ-treated animals presented mild hyperemia at the site of cream application (not shown), which was not observed in untreated animals. Tumor size had delayed tumor growth in the B16F0+IMIQ WT compared to the B16F0 WT mice, and melanoma development remained unaffected after IMIQ treatment in CD1-/- animals (B16F0+IMIQ CD1-/-).
Splenic CD11b+ cells are higher in CD1-/- IMIQ-treated mice, while APCs decrease in almost all CD1-/- mice groups compared to WT mice.
Figure 2A dot plot graphs indicate gating strategies for CD11b+ mononuclear cells (CD11b+CD11cnegative) and CD11c+ cells. The upper right and the upper left quadrants indicate the total CD11c+ cells. The lower right quadrants are indicative of CD11b+CD11cnegative cells. The experimental groups represent the percentage of CD11b+CD11c+ (Figure 2A, upper right quadrants). Absolute numbers of splenic CD11b+ mononuclear cells are higher in CD1-/- groups than in the WT animals’ respective groups (Figure 2B). An assessment of cells possibly associated with anti-tumor activity indicated selectively increased CD11b+CD11c+ (APC) cell numbers in WT mice. Comparing WT animals to CD1-/- mice, more APCs were found in WT Control, B16F0+IMIQ, and IMIQ animals than in the respective CD1-/- groups individually (Figure 2C). Thus, during melanoma development, the treatment with IMIQ was found to increase the numbers of CD11b+CD11c+ only in WT. However, absolute numbers of splenic CD11b+CD11cnegative cells are higher in CD1-/- groups than in the WT animals’ respective groups (Figure 2C).
IMIQ induces higher numbers of perforin-producing NK and NKT cells in WT mice but not CD1 knockout mice.
Dot plots in Figure 3A show the relative quantifications of splenic NK (NK1.1+/PE-Cy5.5) and NK1.1 T αβTCR+/FITC (alpha-beta T-cell receptor). After gating NK-PECy5.5 or NKT-FITC, the number of each cell population producing perforin was determined by splenic cells marked with perforin-PE (as a third staining). The histograms in (Figure 3B) show dramatically higher numbers of natural killer cells producing perforin after anti-CD3 ex vivo stimulation of splenic cells of the WT B16F0+IMIQ group compared to these same experimental conditions in CD1-/- mice. Total numbers of splenic NK are shown in Figure 3C, with no statistical significance between experimental groups. In Figure 3D, IMIQ treatment restored NK cell activation following anti-CD3 stimulation only in the WT B16F0, compared to B16F0+IMIQ CD1-/- mice. A lower number of NK cells expressing perforin was found when splenic cells from the CD1-/- mice were compared to splenic cells of the WT group of mice (Figure 3D). The numbers of NK cells containing perforin in CD1-/- mice and could not be stimulated by IMIQ treatment were found in Figure 3D. In Figure 3E, the total numbers of NKT cells were evaluated, and no differences were found. The analysis of perforin expression in invariant NKT cells showed a sharp reduction of this phenotype in WT mice bearing the B16F0 melanoma. This reduction was compensated after IMIQ treatment, as corroborated in Figure 3F. The same type of study in CD1-/- mice showed that non-invariant NKT cells also diminished the perforin expression in tumor-bearing mice (data not shown). Thus, it was demonstrated that IMIQ treatment reverses NKT-cell activation only in WT mice following anti-CD3 stimulation since NKT+Perforin+ cells in B16F0+IMIQ are highly increased in the WT group compared to the B16F0. Still, this finding could not be reversed by IMIQ treatment, not shown.
IMIQ treatment increases the production of IFN-γ in CD4 and TNF-α in CD8 in splenic T cells upon anti-CD3 stimulation in vitro.
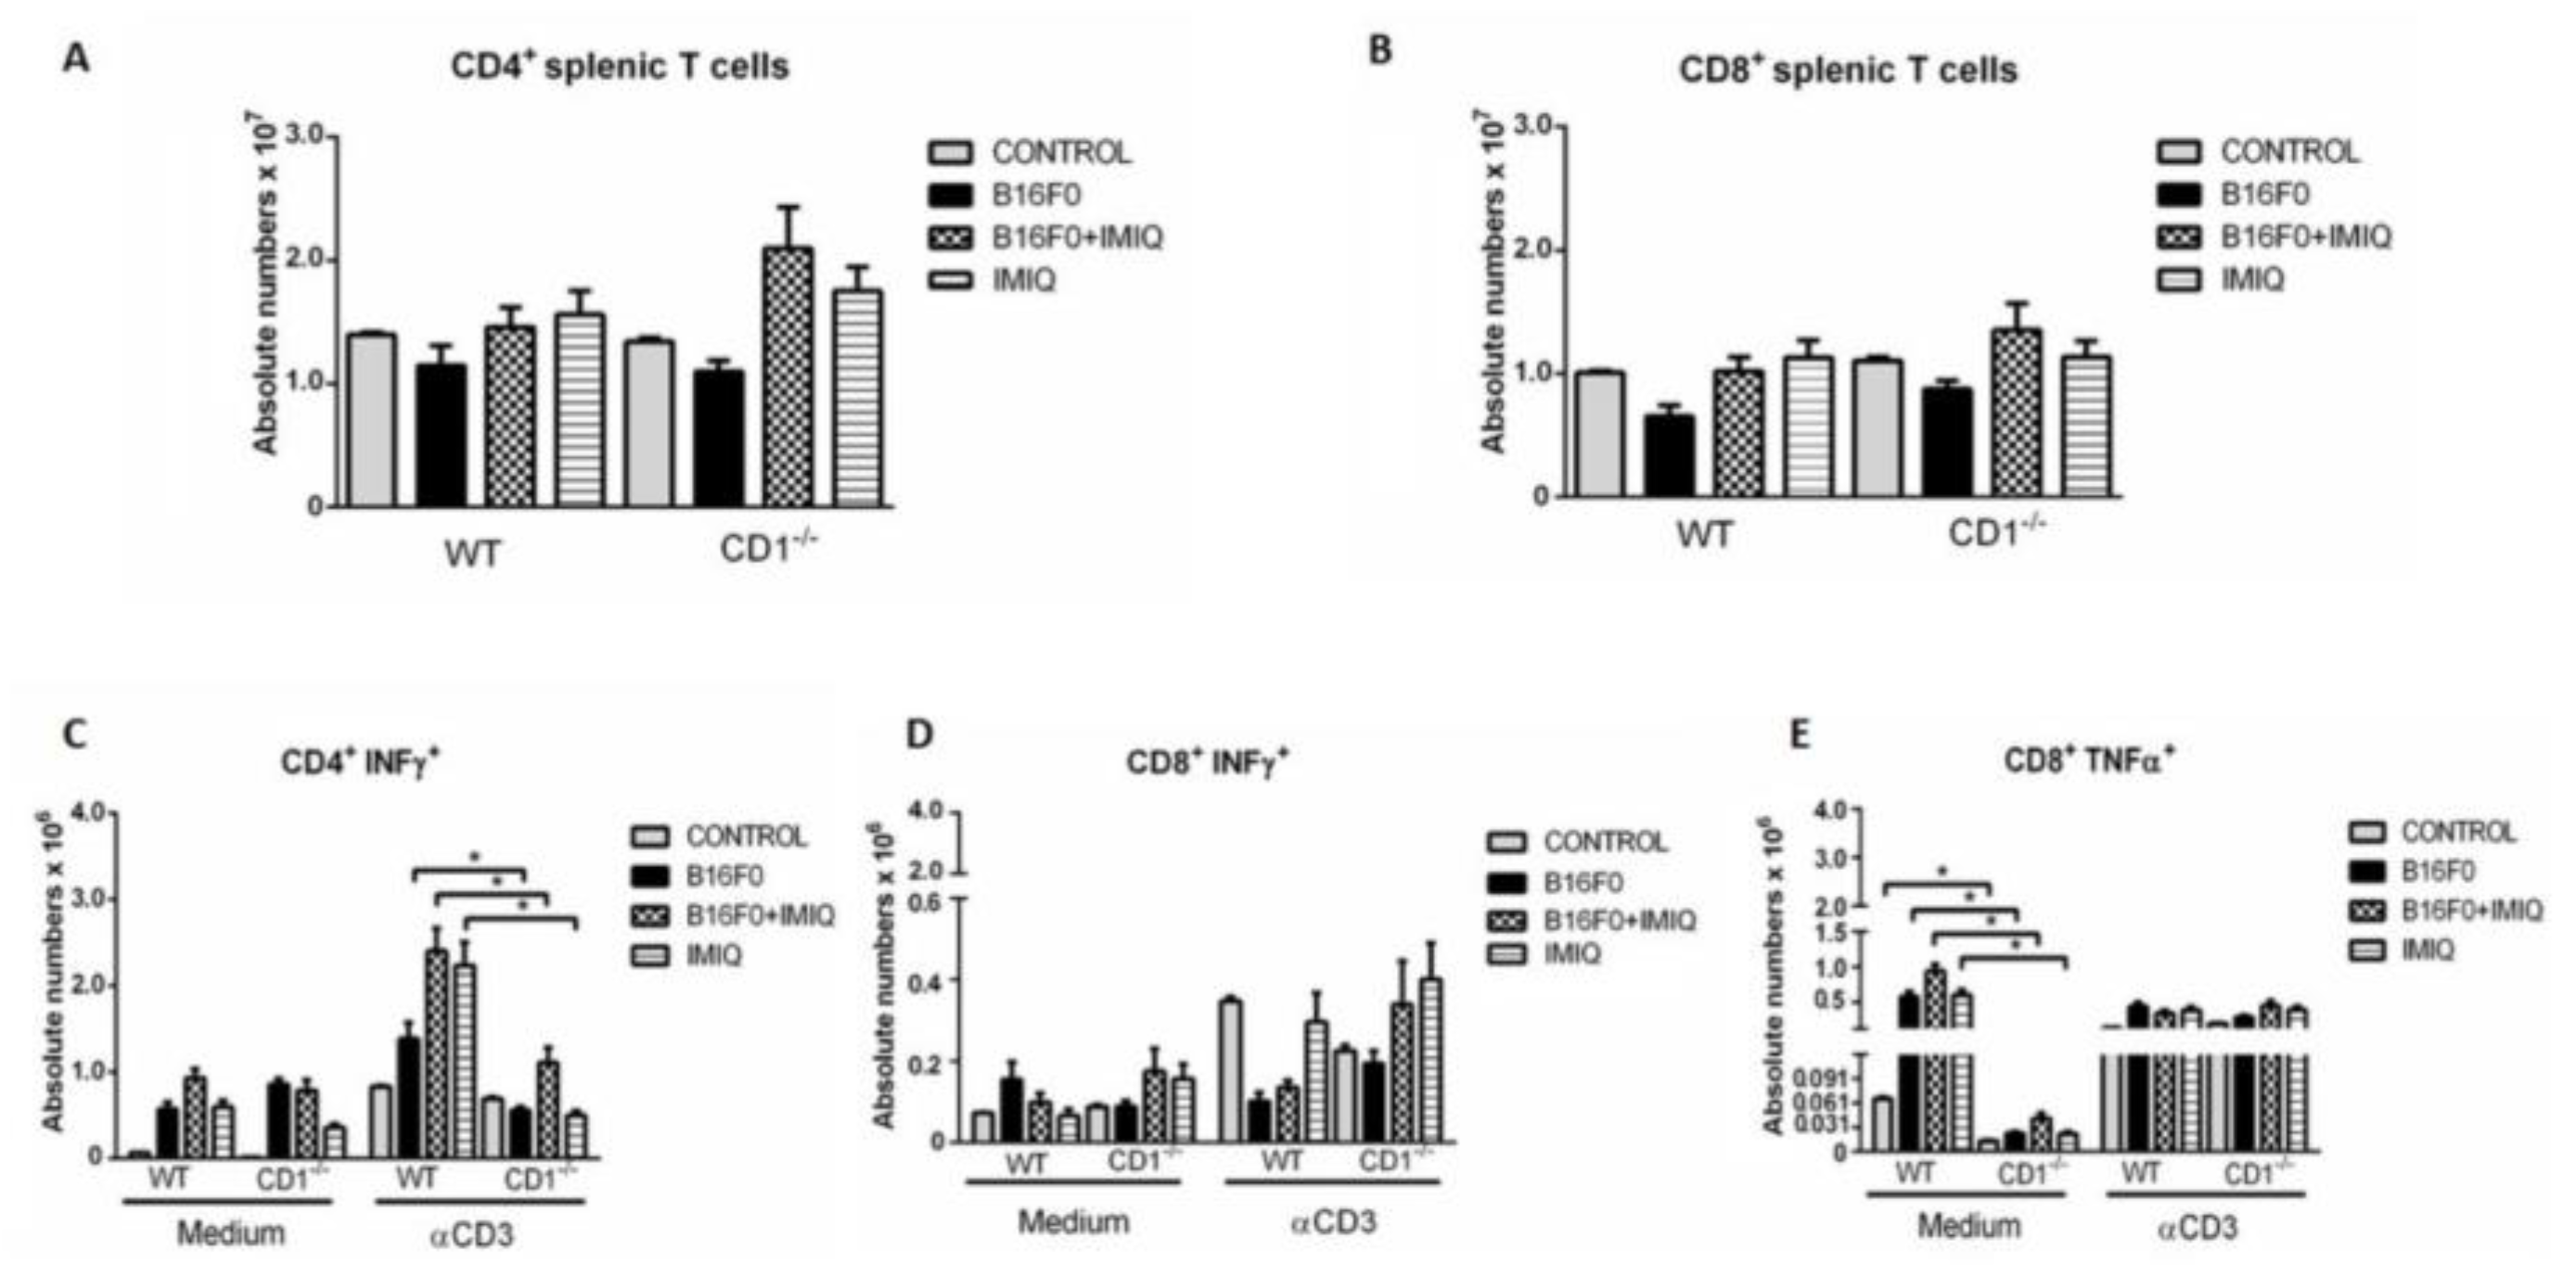
Figure 4A,B show that CD4 and CD8 T cells do not significantly vary between the experimental groups. The production of IFN-γ by CD4 T cells (CD4+IFN-γ+) was quantified, and the results are shown in Figure 4C. After anti-CD3 stimulation, higher numbers of IFN-γ producing CD4+ T cells were seen in the B16F0, B16F0+IMIQ, and IMIQ WT mice compared to the respective CD1-/- mice groups. In addition, splenic cells of the IMIQ group presented similar amounts of CD4+IFN-γ + T cells as the B16F0+IMIQ WT group. No differences were found for the CD8+ T IFN-γ producers in mice with B16F0 in Figure 4D. Higher absolute numbers of CD8+TNF-α+ splenic T cells were found in all WT groups than in the respective CD1-/- animals (Figure 4E). No statistically significant differences were observed among all experimental groups after anti-CD3 stimulation in Figure 4E.
Discussion
Due to the expected increase in new cancer cases worldwide, it is imperative to develop therapies that cause only minor side effects and discomfort in patients with cutaneous melanomas. Malignant skin neoplasia often leads to a poor prognosis. Treatment with IMIQ delays tumor development in WT mice (Figure 1A).
In this study, we have shown that imiquimod, a licensed drug in clinical use, has a beneficial effect in treating melanoma. We have also demonstrated that the biological impact depends on the CD-1 molecules opening up different strategies to improve melanoma treatments. For instance, the survival of the WT IMIQ-treated mice was significantly prolonged, exhibiting a 25% increase compared to those not receiving IMIQ treatment (Figure 1B). Notably, IMIQ treatment does not confer a survival advantage to CD1-/- animals compared to WT mice (Log-rank, p=0.014).
Other studies have also demonstrated the utility of this experimental model in organ transplantation at this site, such as heart or spleen implantation from neonates and, more recently, for pancreatic cell grafting or angiogenesis and lymphangiogenesis studies during cancer development (Cardillo et al. 1993; Cardillo et al. 1995; Benson et al. 2018). The model described above allowed us to measure and assess tumor size in vivo more easily and faster after the development of a small tumor mass. For instance, a small skin-like spot could be visualized initially (Figure 1C).
Although melanoma has a high capacity to induce metastasis to several types of organs, such as the lungs, liver, skin, and central nervous system (Sandru et al 2014), no metastasis was observed when 5x10⁴ B16F0 cells were inoculated subcutaneously (not shown).
In terms of tumor size, CD1-/- mice exhibited faster tumor development than WT animals (Figure 1B). The accelerated tumor progression is attributed to the absence of CD1 molecules and invariant NKT (iNKT) cells (O’Brien et al. 2016). Notably, protection against melanoma was induced by IMIQ treatment in WT but not in CD1-/- mice. The improved immune response induced by IMIQ treatment is also dependent on CD1 molecules and probably relies on the activity of NKT CD1-dependent cells. The enhanced immune response induced by IMIQ treatment also relies on CD1 molecules and probably depends upon the activity of NKT CD1-dependent cells. The β2 integrin CD11b is expressed in hematopoietic cells, including APCs and other mononuclear cells. Cd11b are heterodimeric leukocyte adhesion molecules and can directly inhibit full T cell activation (Varga et al. 2007) Our results reveal an increase in the splenic CD11b+CD11cnegative cells in CD1-/- mice compared to WT animals, particularly in the B16F0+IMIQ treated groups (Figure 2A). CD11b+CD11cnegative cells may comprise APCs, myeloid suppressor cells and B cells. The increased numbers of CD11b+CD11cnegative cells in CD1-/- mice are paralleled by lower numbers of splenic CD11b+CD11c+ APCs in these mice. Therefore, the balance among CD11b+ cells is disturbed in CD1-/- compared to WT mice upon the same challenge, which may result in immune deficiency. Many possibilities may explain these differences and the accompanying immune deficiency. For instance, it has been described that CD8+NK1.1+ activated T cells may function as killers of APC-bearing tumor antigens in the absence of the CD1 molecule (Wang et al. 2015). Yet, other possibilities remain to explain decreased immune responses in CD1-/- mice. For instance, the increase in CD11b+CD11cneg cells may include myeloid-derived suppressor cells (MDSCs) (Sugiura et al. 1990) and B cells, and both could downmodulate T cell immune responses. Regulatory B cells can be found in various human solid tumor types such as breast, ovarian, cervical, colorectal, and prostate carcinomas (Lindner et al. 2013). These cells can express granzyme B and suppress T-cell proliferation through TCR degradation (Lindner et al. 2013). They may contribute to modulating cellular adaptive immune responses, allowing certain tumors to escape an efficient anti-tumor immune response (Yanaba et al. 2008). Additionally, hyperexpression of CD19+ in transgenic mice (hCD19Tg; h19-1 line) efficiently suppresses the inflammation measured by ear thickness after Oxazolone sensitization in the ears (Yanaba et al. ?). Furthermore, IMIQ can experimentally induce a psoriasis-like phenotype, which is more severe in CD19+ B cell-deficient mice (Yanaba et al. ?).
Moreover, the decreased numbers of splenic CD11b+CD11c+ APCs in CD1-/- mice compared to WT mice, accompanied by a parallel augmentation of CD11b+ splenic cells, may suggest that IMIQ may fail to induce the differentiation of CD11b+ into dendritic cells expressing both markers in the absence of CD1 molecules or invariant NKT cells, as described before (Ambrosino et al. 2007). For example, activation of NKT cells induces changes in phenotypical and maturation markers of MSDCs, including CD11b, CD11c, and CD86 molecules (Ko et al. 2009). Alpha-galactosyl ceramide (αGalCer) is a ligand of type I NKT cells (invariant NKT cells) used as an adjuvant to enhance anti-tumor immunity as a free-form (Fuji 2003). It can also be loaded onto various CD1d-expressing cells, including DCs, B, or tumor cells (reviewed in Bayatipoor et al. 2023), showing the need for CD1 molecules to activate APCs fully.
The efficacy of IMIQ is primarily associated with tumors related to epithelial tissue. Topical IMIQ treatment activates mastocytes via TLR-7, leading to CCL2 production, dendritic cells (DCs) recruitment, and production of IFN-α/β (Ambach et al. 2004). Additionally, higher TNF-α and IL-12 production levels and increased GZB expression in DCs were reported (Drobits et al. 2012). However, the role of CD1 molecules or invariant NKT cells in activating or differentiating dendritic cells (CD11c+) by imiquimod remains unclear.
The activation of NKT and NK cells induced by imiquimod in WT animals may indicate the importance of these cells in the early control of tumor development in the presence of the CD1 molecule. Perforin is a protein that mediates the cytotoxicity that forms pores in the membranes of target cells and consequently facilitates the entry of granzymes (Masson et al. 1985; Smyth and Trapeni 1995; Pardo et al. 2008). IMIQ can also activate cytotoxic T lymphocytes to produce perforin in vitro (Ambach et al. 2004). According to the described gating strategies for NK and NKT identification (Figure 3A), perforin production for these cell populations was quantified in Figs 3B, 3D). Our results showed that the WT animals’ perforin expression in NK was increased in the IMIQ-treated groups but not in the CD1-/- mice (Figs. 3B and 3D), similar to the NKT cells of the WT animals in Figure 3F. This finding could help to explain the early control of melanoma development in WT mice. The lower number of NK perforin-producers in CD1-/- animals following anti-CD3 activation (Figure 3A) may account for the importance of a direct effect of tumoricidal NK cells after IMIQ treatment in WT mice. Without the CD1 molecule, the numbers of splenic NK cells producing perforin are lower, indicating a deficiency in NK immune activation in CD1-/- animals upon B16F0 challenge, thus contributing to decreased mice’s longevity by lacking tumor size control when compared to WT mice treated with IMIQ. The percentages of NK cells are represented in Figs. 3C and 3E. Splenic NK(T) cells are similar in the experimental groups analyzed (Figure 3C and 3E). IMIQ treatment reverses NKT-cell inhibition in WT mice following anti-CD3 stimulation since the number of NKT cells expressing perforin increases in the B16F0+IMIQ group compared to the B16F0 group (Figure 3F). However, NKT activation is not changed by IMIQ treatment in CD1-/- (not shown). ZHAO et al. have demonstrated that a TLR-7 agonist (3M-052) and CpG ODN significantly increase CTL activity, helping control tumor cells (Zhao et al. 2014).
NKT cells constitute a unique subset of CD1d-restricted T cells with both NK and T cell characteristics that can be subdivided into functional subsets: IFN-γ-producing NKT1, IL-4 producing NKT2, which results in settings of type 2 inflammation, and IL-17-producing NKT17 cells (Gumperz et al. 2002; O’Brien et al. 2016). These subsets express different transcription factors, such as T-bet, GATA3, and ROR γT (O’Brien et al. 2016). Intermediate expression of IL-13 early during thymic development gives rise to mature iNKT1, iNKT2, and iNKT17 subsets. The preferential production of IL-4 over IL-13 in iNKT2 cells results, in part, from their reduced GATA-3 expression (O’Brien et al. 2016). Invariant natural killer T (iNKT) cells are a group of innate-like T Lymphocytes that recognize lipid antigens. NKT-cells (expressing variable TCR usage) are expected to develop in CD1d-/- mice, but in the absence of the CD1d molecule, suggesting a distinct pathway from iNKT cells, which do not develop in the absence of the CD1 molecule (Dufait et al. 2019). The data obtained in Figure 4A reinforce the role of IMIQ on T-cell functions and IFN-γ production since the number of splenic CD4+INF-+ cells T cells are higher in WT animals receiving IMIQ treatment (with or without B16F0) upon stimulation with anti-CD3, suggesting that a fast IFN-γ production could help in the early control of melanoma grows. TLR7 triggers T cells to induce greater IFN-γ than TNF-α production after IMIQ (Figure 4C compared to Figure 4E, respectively). IFN-γ production is commonly observed in response to TLR7/8 stimulation. Furthermore, intratumoral injection of TLT7/8 could also induce a CD4+ T cell response shift from Th2 to Th1, enhancing CD8+ T cell responses and inhibiting T regulatory cell responses, as described by Mullins et al., 2019 (Mullins et al 2019). INF- has been used in clinical trials and other treatments in anti-melanoma therapy, as reviewed by PARKER et al. (2016). Other authors also investigated a positive correlation between PD-L1 and INF-γ in melanoma, essentially in T-cell areas inside the tumors (37). IFN-γ, conversely, can regulate the expression of PD-L1 in melanoma cells. IFN-γ-inducible PD-L1 can be more common than its constitutive expression and is also related to the presence of p53 in melanoma (Thiem et al. 2019). Thus, IMIQ could be combined with checkpoint therapy in treating melanoma, as suggested by other authors (Barry et al. 2018).
In Figure 4B, TNF-α production by unstimulated CD8+ splenic T lymphocytes was also evaluated. More CD8+TNF-α+ producers were detected in all WT groups of mice than CD1-/-. In another study, IMIQ led to the activation of APCs and increased antigen presentation to T cells, which resulted in higher TNF-α production (12). TNF-α exhibits a generally pro-inflammatory profile capable of inducing the apoptosis of several tumor cells and stimulating the cytotoxic activity of macrophages, NK cells (35), and T cells for anti-tumor activity (Xu et al. 2004).
After tumor cell injection and IMIQ treatment, CD4 and CD8 T cells are prone to increase their IFN-γ and TNF-α production in WT mice. Without anti-CD3 stimulation, more CD8+TNFα-producers were detected in all WT groups of mice compared to CD1-/- animals. CD4+IFN-γ+ splenic cells rapidly increased in the WT animals after ex vivo stimulation. IMIQ also demonstrates efficacy in containing melanoma development and promotes an increase in APCs, inducing higher NK+perforin+ and NKT+perforin+ cells when WT is compared to the CD1-/- mice.
In conclusion, the activation of NK and NKT cells and protection of WT mice leading to tumor restrainment after IMIQ treatment are CD1-dependent and possibly related to the NK cells. Consequently, splenic CD4 T cell producers of IFN-γ and NK+perforin+ cells are highly increased only in the B16F0 WT group after IMIQ treatment. Further studies concerning the intratumor cellular composition and the activation profile induced by TLR-7 could improve future TLR/7 clinical applications and prognosis (Antohe et al. 2019).
Statements: The authors have no competing interests to declare that are relevant to the content of this article. All authors made substantial contributions to the conception of the work and revised it critically for important intellectual content.
Acknowledgments
We thank Dr. Lain Pontes de Carvalho (in memorian) and Dr. Washington Luis Conrado dos Santos for the critical reading of the manuscript. Supported by: CNPq-FIOCRUZ (F.C. grant proc. 407752/2012-9 partial support remaining) and FIOCRUZ (J.M.; jomengel@terra.com.br) Fellowships were supported by CAPES (M.B.; mnbc.bonfim@gmail.com) and FAPESB (A.S.; acatariny@gmail.com).
References
- Ambach A, Bonnekoh B, Nguyen M, Schön MP, Gollnick H. Imiquimod, a Toll-like receptor-7 agonist, induces perforin in cytotoxic T lymphocytes in vitro. Mol Immunol. 2004, 40, 1307–14. [Google Scholar] [CrossRef] [PubMed]
- Ambrosino E, Terabe M, Halder RC, Peng J, Takaku S, Miyake S, Yamamura T, Kumar V, Berzofsky JA. Cross-regulation between type I and type II NKT cells in regulating tumor immunity: a new immunoregulatory axis. J Immunol. 2007, 179, 5126–36. [Google Scholar] [CrossRef] [PubMed]
- Antohe M, Nedelcu RI, Nichita L, Popp CG, Cioplea M, Brinzea A, Hodorogea A, Calinescu A, Balaban M, Ion DA, Diaconu C, Bleotu C, Pirici D, Zurac SA, Turcu G. Tumor-infiltrating lymphocytes: The regulator of melanoma evolution. Oncol Lett. 2019, 17, 4155–4161. [Google Scholar] [CrossRef]
- Barry KC, Hsu J, Broz ML, Cueto FJ, Binnewies M, Combes AJ, Nelson AE, Loo K, Kumar R, Rosenblum MD, Alvarado MD, Wolf DM, Bogunovic D, Bhardwaj N, Daud AI, Ha PK, Ryan WR, Pollack JL, Samad B, Asthana S, Chan V, Krummel MF. A natural killer-dendritic cell axis defines checkpoint therapy-responsive tumor microenvironments. Nat Med. 2018, 8, 1178–1191. [Google Scholar] [CrossRef]
- Bayatipoor H, Mehdizadeh S, Jafarpour R, Shojae Z, Pashangzadeh S, Motallebnezhad M. Role of NKT cells in cancer immunotherapy- from bench to bed Medical Oncology. 2023, 40, 29. [Google Scholar] [CrossRef]
- Benson RA, Garcon F, Recino A, Ferdinand JR, Clatworthy MR, Waldmann H, Brewer JM, Okkenhaug K, Cooke A, Garside P, Wållberg M. Non-Invasive Multiphoton Imaging of Islets Transplanted Into the Pinna of the NOD Mouse Ear Reveals the Immediate Effect of Anti-CD3 Treatment in Autoimmune Diabetes. Front Immunol. 2018, 18, 1006. [Google Scholar] [CrossRef]
- Böttcher JP, Bonavita E, Chakravarty P, Blees H, Cabeza-Cabrerizo M, Sammicheli S, Rogers NC, Sahai E, Zelenay S, Reis-Sousa C. NK Cells Stimulate Recruitment of cDC1 into the Tumor Microenvironment Promoting Cancer Immune Control. Cell. 2018, 172, 1022–1037e14. [Google Scholar] [CrossRef]
- Cardillo F, Falcão RP, Rossi MA, Mengel J. An age-related gamma delta T cell suppressor activity correlates with the outcome of autoimmunity in experimental Trypanosoma cruzi infection. Eur J Immunol. 1993, 23, 2597–605. [Google Scholar] [CrossRef]
- Cardillo F, Mengel J, Garcia SB, Cunha FQ. Mouse ear spleen grafts: a model for intrasplenic immunization with minute amounts of antigen. J Immunol Methods. 1995, 188, 43–9. [Google Scholar] [CrossRef]
- Carnaud C, Lee D, Donnars O, Park SH, Beavis A, Koezuka Y, Bendelac A. , Cutting edge: Cross-talk between cells of the innate immune system: NKT cells rapidly activate NK cells. J Immunol. 1999, 163, 4647–50. [Google Scholar] [CrossRef]
- Dufait I, Pardo J, Escors D, De Vlaeminck Y, Jiang H, Keyaerts M, De Ridder M, Breckpot K. Perforin and Granzyme B Expressed by Murine Myeloid-Derived Suppressor Cells: A Study on Their Role in Outgrowth of Cancer Cells. Cancers (Basel). 2019, 11, 808. [Google Scholar] [CrossRef]
- Drobits B, Holcmann M, Amberg N, Swiecki M, Grundtner R, Hammer M, Colonna M, Sibilia M. , 2012. Imiquimod clears tumors in mice independent of adaptive immunity by converting pDCs into tumor-killing effector cells. J Clin Invest. 2012, 122, 575–85. [Google Scholar] [CrossRef] [PubMed]
- Fujii S, Shimizu K, Smith C, Bonifaz L, Steinman RM. Activation of natural killer T cells by alpha-galactosylceramide rapidly induces the full maturation of dendritic cells in vivo and thereby acts as an adjuvant for combined CD4 and CD8 T cell immunity to a coadministered protein. J Exp Med. 2003, 198, 267–79. [Google Scholar] [CrossRef] [PubMed]
- Gumperz JE, Miyake S, Yamamura T, Brenner MB. Functionally distinct subsets of CD1d-restricted natural killer T cells revealed by CD1d tetramer staining. J Exp Med. 2002, 1‘2a95, 625–36. [Google Scholar] [CrossRef]
- Huang SJ, Hijnen D, Murphy GF, Kupper TS, Calarese AW, Mollet IG, Schanbacher CF, Miller DM, Schmults CD, Clark RA. Imiquimod enhances IFN-gamma production and effector function of T cells infiltrating human squamous cell carcinomas of the skin. J Invest Dermatol. 2009, 129, 2676–85. [Google Scholar] [CrossRef]
- Ikenaka Y, Yoshiji H, Kuriyama S, Yoshii J, Noguchi R, Tsujinoue H, Yanase K, Namisaki T, Imazu H, Masaki T, Fukui H. Tissue inhibitor of metalloproteinases-1 (TIMP-1) inhibits tumor growth and angiogenesis in the TIMP-1 transgenic mouse model. Int J Cancer. 2003, 105, 340–6. [Google Scholar] [CrossRef]
- Koo GC, Peppard JR. Establishment of monoclonal anti-NK-1.1 antibody. Hybridoma. 1984, 3, 301–3. [CrossRef]
- Lindner S, Dahlke K, Sontheimer K, Hagn M, Kaltenmeier C, Barth TFE, Thamara Beyer, Reister F, Fabricius D, Lotfi R, Lunov O, Nienhaus GU, Simmet T, Kreienberg R, Moller P, Schrezenmeier H, Jahrsdorfer B. Induced Granzyme B–Expressing B Cells Infiltrate Tumors and Regulate T Cells. Microenvironment and Immunology. Cancer Res. 2013, 73. [Google Scholar] [CrossRef]
- Luiz OC, Gianini RJ, Gonçalves FT, Francisco G, Festa-Neto C, Sanches JA, Gattas GJ, Chammas R, Eluf-Neto J. Ethnicity and cutaneous melanoma in the city of Sao Paulo, Brazil: a case-control study. PLoS One. 2012, 7, e36348. [Google Scholar] [CrossRef]
- Masson D, Tschopp J. Isolation of a lytic, pore-forming protein (perforin) from cytolytic T-lymphocytes. J Biol Chem. 1985, 260, 9069–72. [Google Scholar] [CrossRef]
- Miller RL, Gerster JF, Owens ML, Slade HB, Tomai MA. Imiquimod applied topically: a novel immune response modifier and new class of drug. Int J Immunopharmacol. 1999, 21, 1–14. [Google Scholar] [CrossRef] [PubMed]
- Mullins SR, Vasilakos JP, Deschler K, Grigsby I, Gillis P, John J, Elder MJ, Swales J, Timosenko E, Cooper Z, Dovedi SJ, Leishman AJ, Luheshi N, Elvecrog J, Tilahun A, Goodwin R, Herbst R, Tomai MA, Wilkinson RW. Intratumoral immunotherapy with TLR7/8 agonist MEDI9197 modulates the tumor microenvironment leading to enhanced activity when combined with other immunotherapies. J Immunother Cancer. 2019, 7, 244. [Google Scholar] [CrossRef] [PubMed]
- Nicolai CJ, Wolf N, Chang IC, Kirn G, Marcus A, Ndubaku CO, McWhirter SM, Raulet DH. NK cells mediate clearance of CD8+T cell-resistant tumors in response to STING agonists. Sci Immunol. 2009, 5, 2738. [Google Scholar] [CrossRef]
- O’Brien TF, Bao K, Dell’Aringa M, Ang WXG, Abraham S, Reinhardt RL. Cytokine expression by invariant natural killer T cells is tightly regulated throughout development and settings of type-2 inflammation. Mucosal Immunology 2016, 9, 597–609. [Google Scholar] [CrossRef]
- Pardo J, Wallich R, Martin P, Urban C, Rongvaux A, Flavell RA, Müllbacher A, Borner C, Simon MM. Granzyme B-induced cell death exerted by ex vivo CTL: discriminating requirements for cell death and some of its signs. Cell Death Differ. 2008, 15, 567–79. [Google Scholar] [CrossRef]
- Parker BS, Rautela J, Hertzog PJ. Antitumor actions of interferons: implications for cancer therapy. Nat Rev Cancer. 2016, 16, 131–44. [Google Scholar] [CrossRef]
- Potez M, Trappetti V, Bouchet A, Fernandez-Palomo C, Güç E, Kilarski WW, Hlushchuk R, Laissue J, Djonov V. Characterization of a B16-F10 melanoma model locally implanted into the ear pinnae of C57BL/6 mice. Plos One. 2018, 13, e0206693. [Google Scholar] [CrossRef]
- Raulet, DH. Roles of the NKG2D immunoreceptor and its ligands. Nat Rev Immunol. 2003, 3, 781–90. [Google Scholar] [CrossRef]
- Sandru A, Voinea S, Panaitescu E, Blidaru A. Survival rates of patients with metastatic malignant melanoma. J Med Life. 2014, 7, 572–6. [Google Scholar]
- Smyth MJ, Trapani JA. Granzymes: exogenous proteinases that induce target cell apoptosis. Immunol Today. 1995, 16, 202–6. [Google Scholar] [CrossRef]
- Sugiura K, Inaba M, Ogata H, Yasumuzu R, Sardiña EE, Inaba K, Kuma S, Good RA, Ikehara S. Inhibition of tumor cell proliferation by natural suppressor cells present in murine bone marrow. Cancer Res. 1990, 50, 2582–6. [Google Scholar]
- Thiem A, Hesbacher S, Kneitz H, di Primio T, Heppt MV, Hermanns HM, Goebeler M, Meierjohann S, Houben R, Schrama D. IFN-gamma-induced PD-L1 expression in melanoma depends on p53 expression. J Exp Clin Cancer Res. 2019, 38, 397. [Google Scholar] [CrossRef] [PubMed]
- Varga G, Balkow S, Wild MK, Stadtbaeumer A, Krummen M, Rothoeft T, Higuchi T, Beissert S, Wethmar K, Scharffetter-Kochanek K, Vestweber D, Grabbe S. Active MAC-1 (CD11b/CD18) on DCs inhibits full T-cell activation. Blood. 2007, 109, 661–9. [Google Scholar] [CrossRef] [PubMed]
- Wang C, Liu X, Li Z, Chai Y, Jiang Y, Wang Q, Ji Y, Zhu Z, Wan Y, Yuan Z, Chang Z, Zhang M. CD8(+)NKT-like cells regulate the immune response by killing antigen-bearing DCs. Sci Rep. 2015, 15, 14124. [Google Scholar] [CrossRef]
- Woo EY, Yeh H, Chu CS, Schlienger K, Carroll RG, Riley JL, Kaiser LR, June CH. Cutting edge: Regulatory T cells from lung cancer patients directly inhibit autologous T cell proliferation. J Immunol. 2002, 168, 4272–6. [Google Scholar] [CrossRef]
- Xu D, Gu P, Pan PY, Li Q, Sato AI, Chen SH. 2004. NK and CD8+ T cell-mediated eradication of poorly immunogenic B16-F10 melanoma by the combined action of IL-12 gene therapy and 4-1BB costimulation. Int J Cancer. 2004, 109, 499–506. [Google Scholar] [CrossRef]
- Yanaba K, Bouaziz JD, Haas KM, Poe JC, Fujimoto M, Tedder TF. A regulatory B cell subset with a unique CD1dhiCD5þ phenotype controls T cell-dependent inflammatory responses. Immunity 2008, 28, 639–50. [Google Scholar] [CrossRef]
- Yanaba K, Kamata M, Ishiura N, Shibata S, Asano Y, Tada Y, Sugaya M, Kadono T, Tedder TF, Shinichi SJ. Regulatory B cells suppress imiquimod-induced, psoriasis-like skin inflammation. Leukoc Biol. 2013, 94, 563–573. [Google Scholar] [CrossRef]
- Zhao B. G.,Vasilakos J.P., Tross D., Smirnov D., Klinman D.M. Combination therapy targeting toll-like receptors 7, 8 and 9 eliminates large established tumors. Journal for immunotherapy of cancer. 2014, 2, 12. [Google Scholar] [CrossRef]
Figure 1.
IMIQ treatments effectively induce prolonged survival in C57Bl/6 mice than in C57Bl/6 mice lacking the CD1 molecule (C57Bl/6 CD1-/-). In A: Survival rates in B16F0+IMIQ WT mice (squares) were compared to each experimental group (p=0.014 log-rank test, n=10). Figure 1B individually compared tumor sizes in the B16F0+IMIQ WT group to each experimental group of WT and CD1 mice at the 12th (p=0.0014), 16th (p=0.0048), and 18th days (*p=0.0078). Mann-Whitney test was used to compare B16F0+IMIQ to every experimental group at each time point individually. In figure C, the B16F0 tumor is shown after intra-ear injection. The left ear of C57Bl/6 mice presents a spherically shaped tumor with regular borders and well-defined boundaries obtained in all described experiments in Materials and Methods. Figure 1A indicates the median for each n=10 population. Figs 1A and 1B represent three independent experiments. In figure C, the B16F0 tumor is shown after intra-ear injection. The left ear of C57Bl/6 mice presents a spherically shaped tumor with regular borders and well-defined boundaries obtained in all described experiments in Material and Methods.
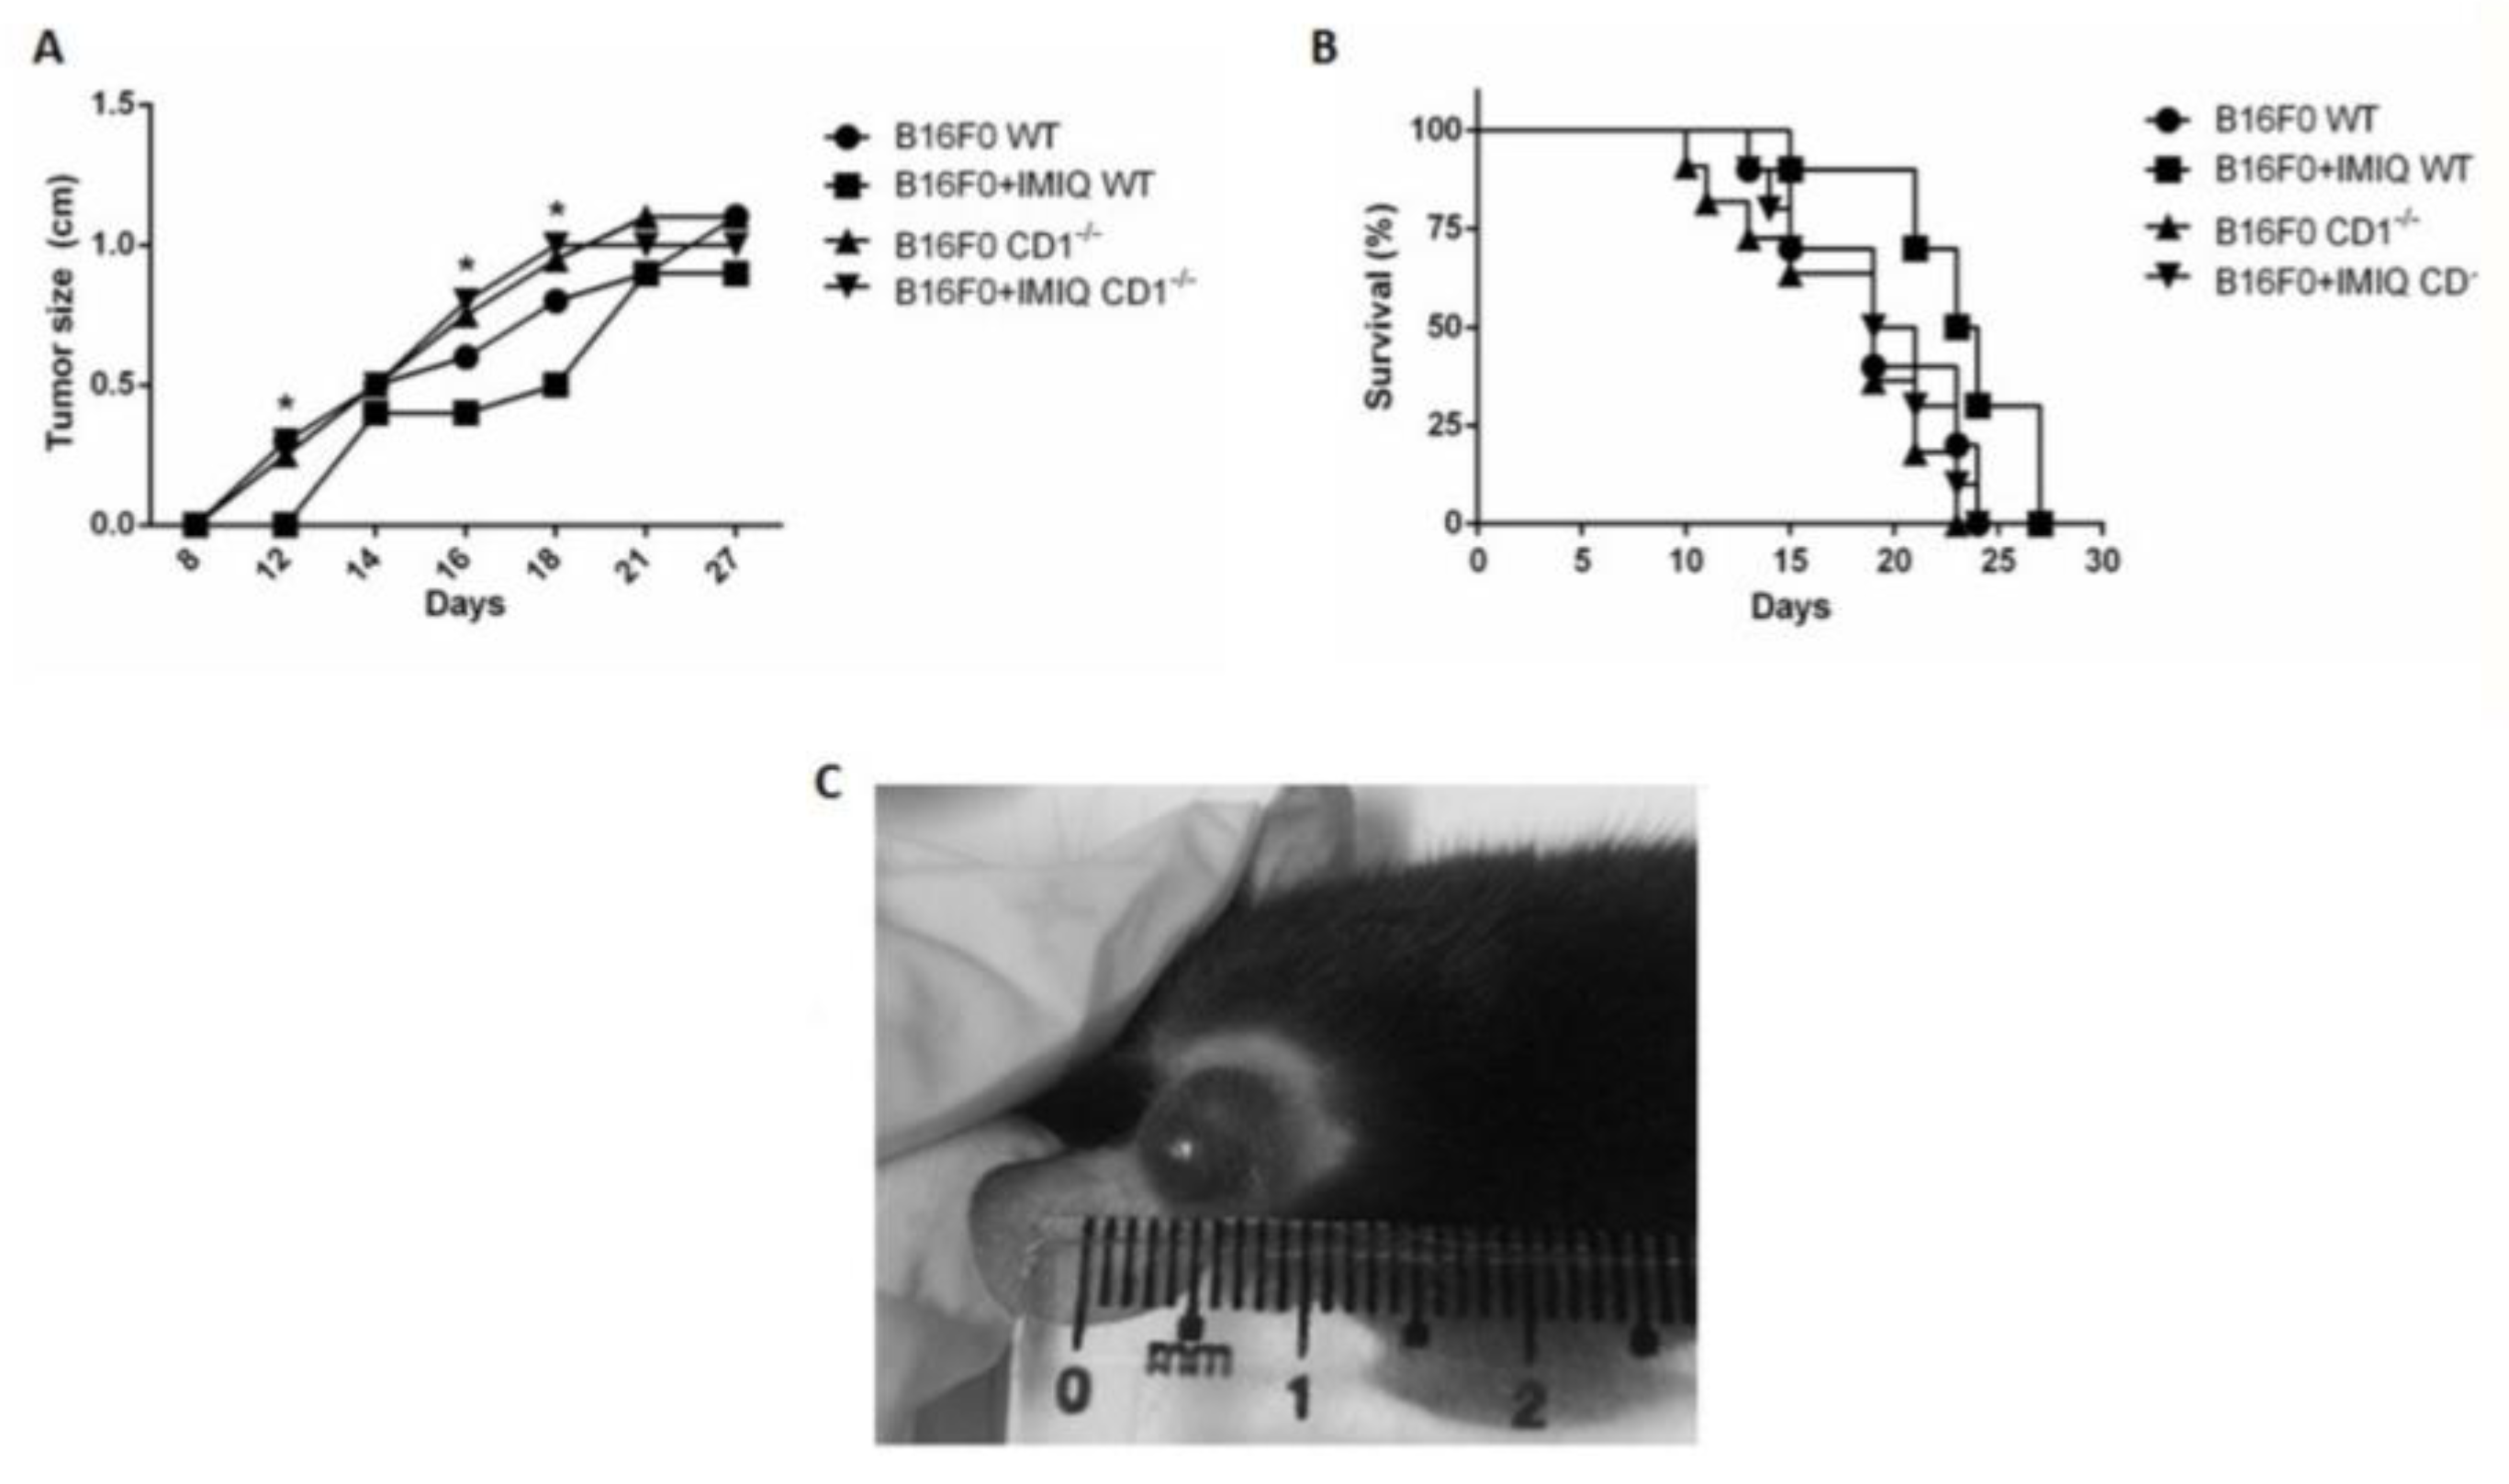
Figure 2.
Splenic CD11b+ cells are higher in IMIQ-treated CD1-/- mice, while APCs decrease in almost all CD1-/- mice groups compared to WT mice. In figure 2A, dot plots of CD11c+ (upper left quadrants), CD11b+CD11cnegative (low right quadrants), and double-positive CD11b+CD11c+ (upper right quadrants) are shown. As described in Methods, anti-CD11c PE-Cy5.5 and anti-CD11b FITC were used. Mann-Whitney test is represented by (*) and p= 0.0286: the B16F0+IMIQ is compared among WT and CD1-/- mice groups. Individually, the B16F0+IMIQ group was also compared to the other groups. Results represent one in three experiments and are expressed as SEM +. n=4. In 2B, absolute numbers of splenic CD11b+ mononuclear cells of WT and CD1-/- animals treated with IMIQ are shown, and B16F0 is compared to each group of WT. Among WT and CD1-/- animals, the CONTROL, B16F0+IMIQ, and IMIQ graphs are compared individually to the respective CD1-/- mice groups. Results represent one in three experiments and are expressed as SEM+; p= 0.0286, Mann-Whitney test, n=4. In figure 2C, absolute numbers of splenic CD11b+CD11c+ cells are shown.
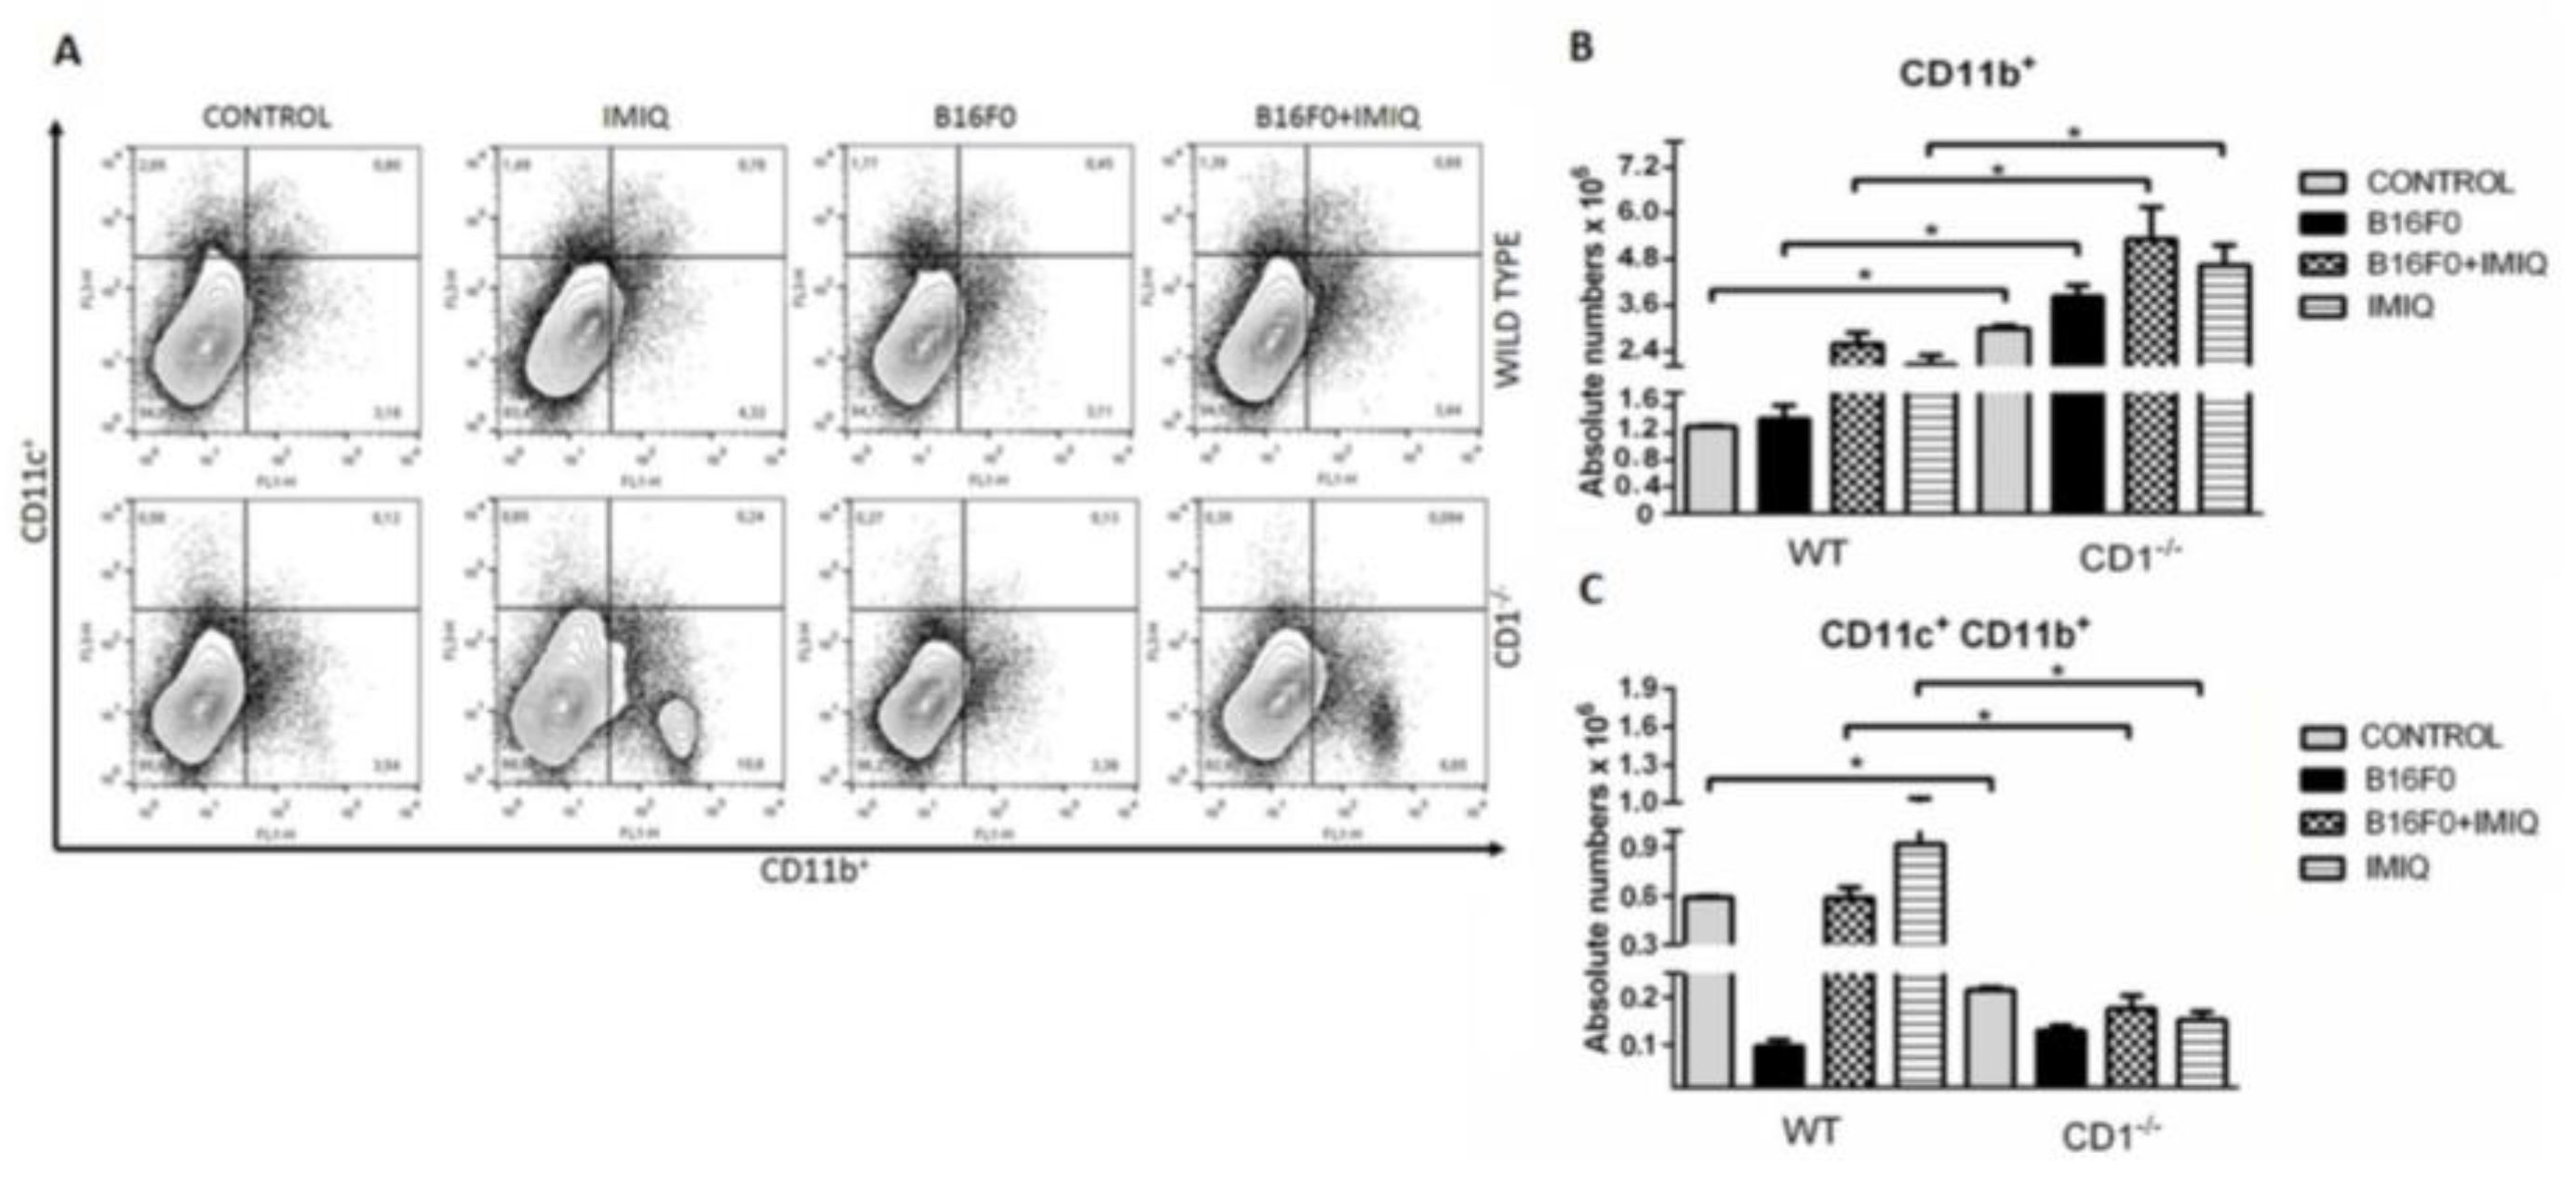
Figure 3.
Numbers of NK cells and NKT perforin producers after ex vivo stimulation. In A, gates for NK and NKT cell determination are shown. In B, Histograms illustrate NK+perforin+ cells in the experimental conditions studied. In C, total NK cells of the WT mice were evaluated and compared to each CD1-/- animal: no differences were found. In D, NK cells of the WT groups were compared to each CD1-/- group (medium or anti-CD3 stimulation). In E, total NKT cells of the WT were compared to each CD1-/- experimental group; no statistical differences were found. In F, NKT splenic cells of B16F0 and B16F0+IMIQ of the WT groups were compared after anti-CD3 stimulation. Results from one in three experiments are shown. Each group was compared to the other after individual staining of technical triplicates by flow cytometry. SEM+; Mann-Whitney test, *p=0.0286; n = 4.
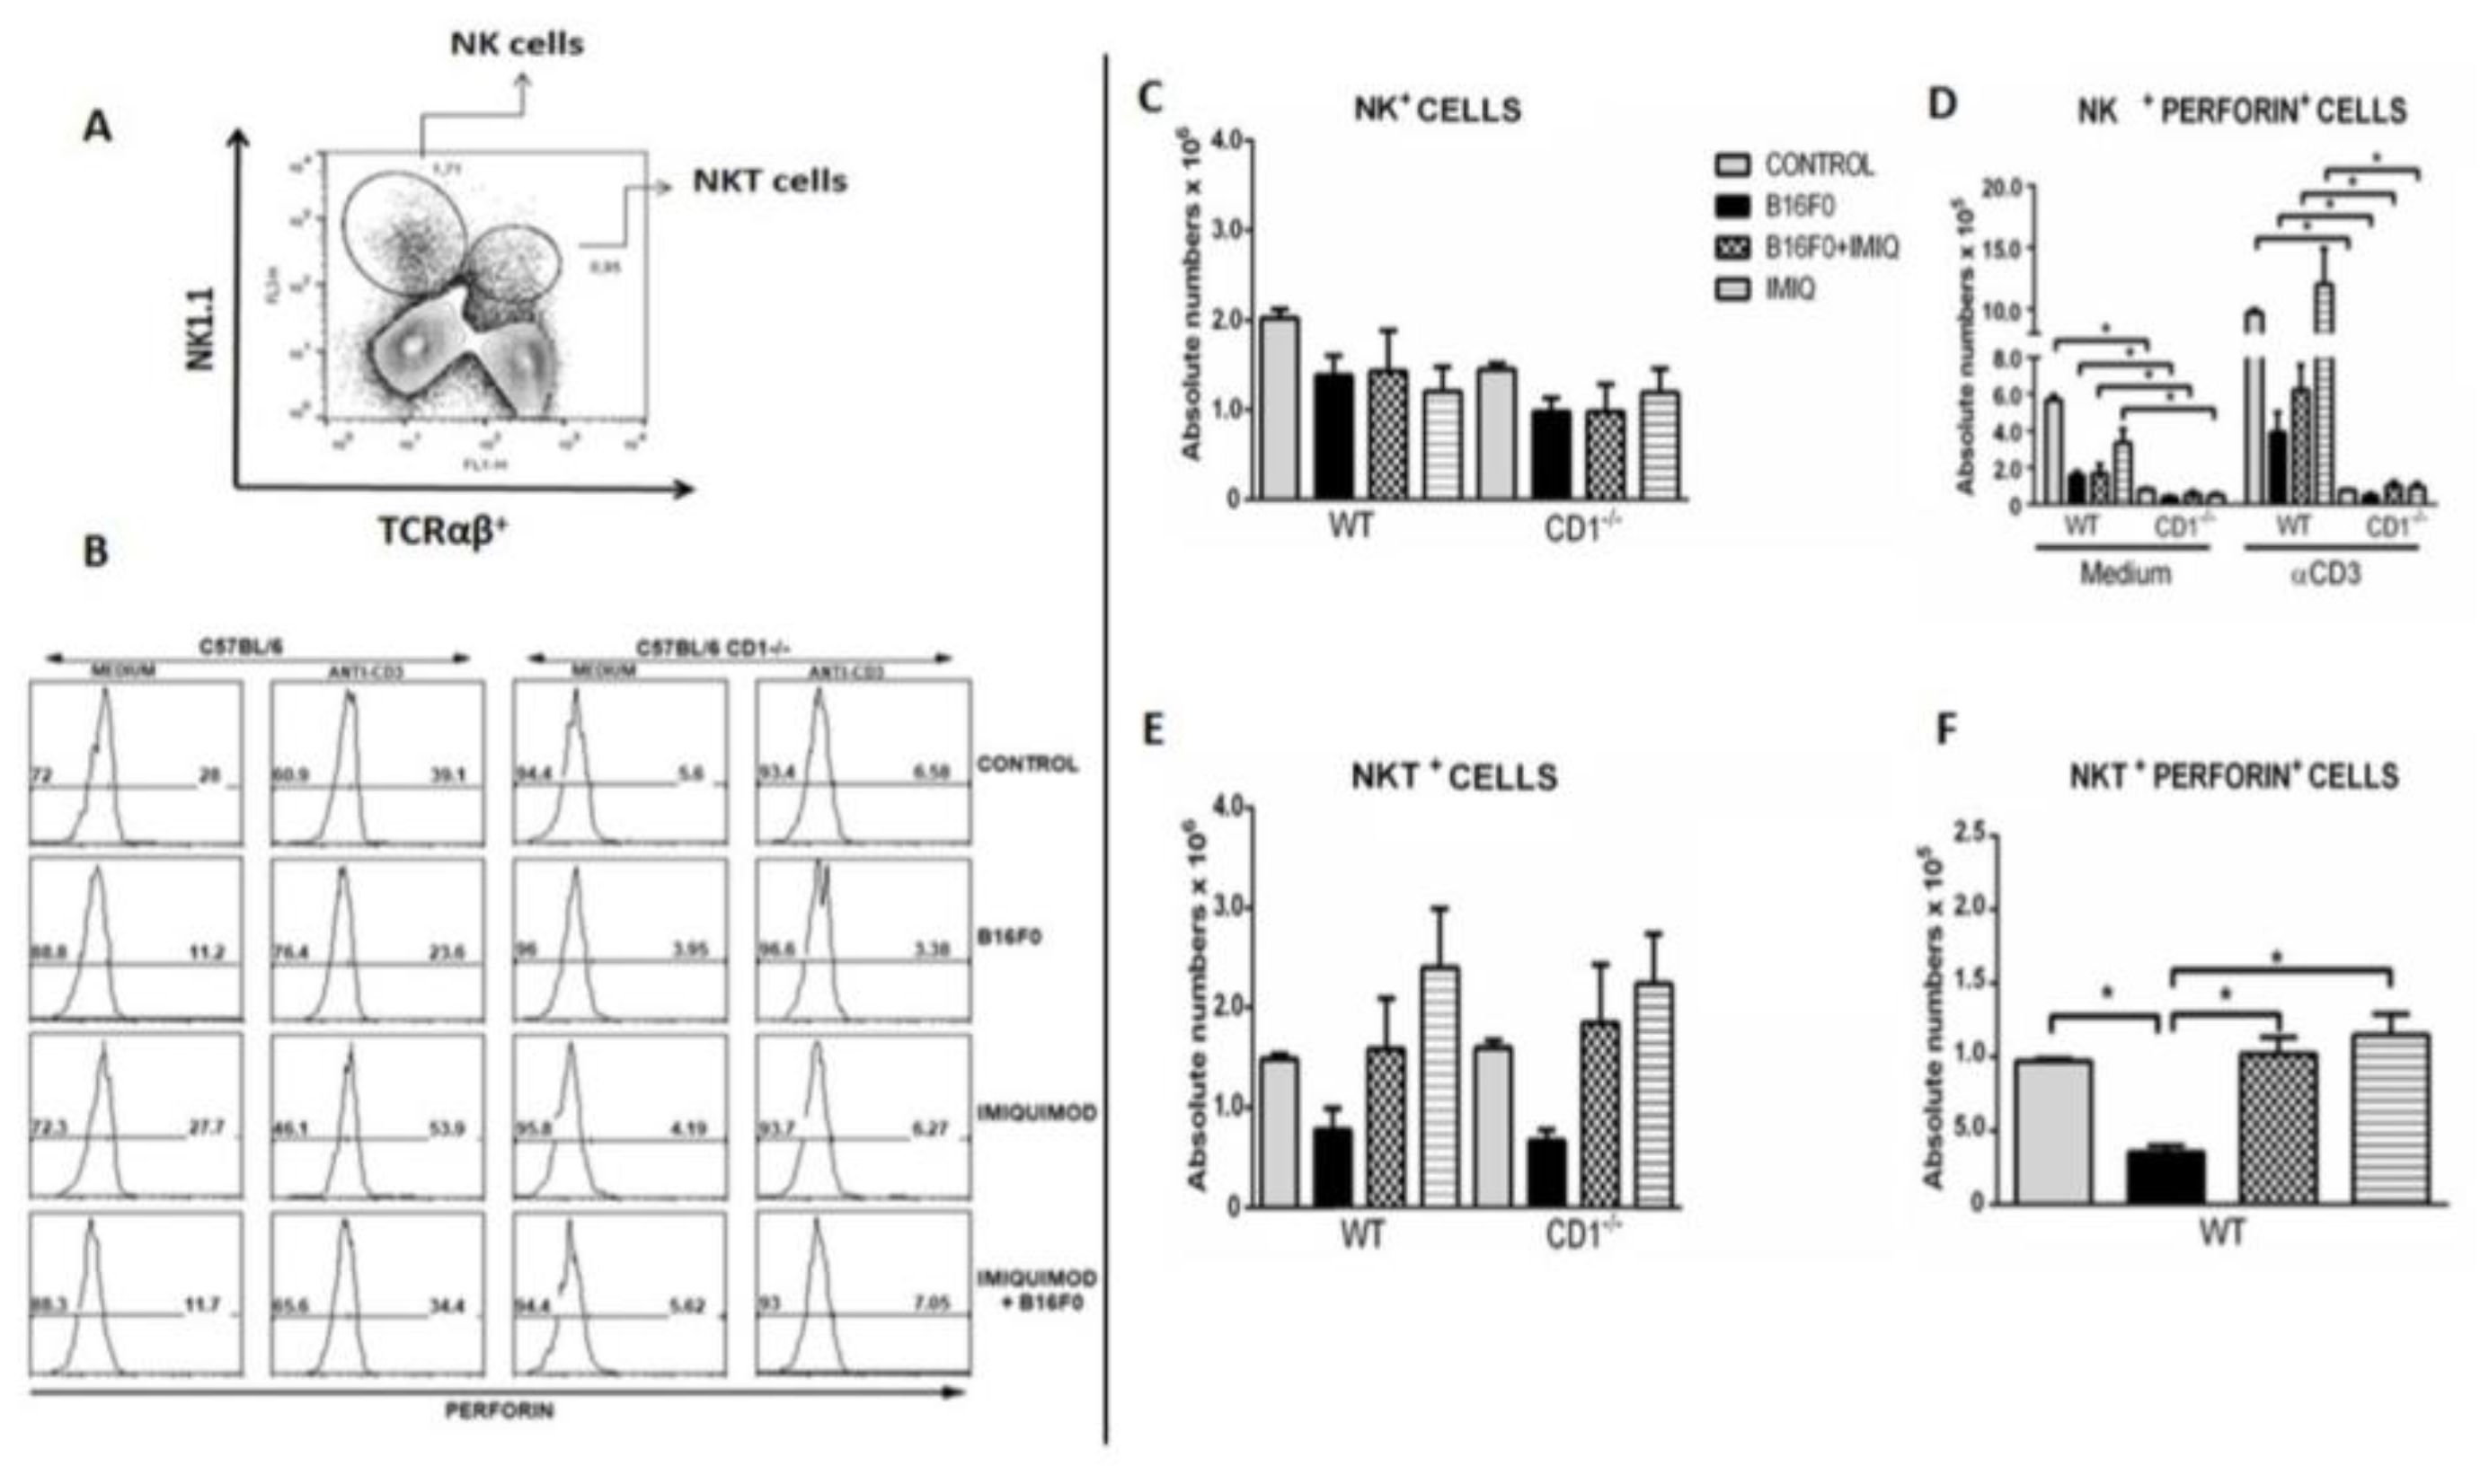
Figure 4.
IFN-γ and TNF-α production by CD4 or CD8 splenic T cells, respectively. In A, the total CD4 T cells of the WT groups were quantified and compared to each CD1-/- group. In B, the total CD8 T cells of the WT groups were quantified and compared to each CD1-/- group. Comparing WT and CD1-/- experimental conditions for cytokine production, an anti-CD3 was used for splenic cell stimulation. B16F0, B16F0+IMQ, or IMIQ WT groups were compared to the respective CD1-/- groups. In C, absolute numbers of CD4+IFN-γ+ T cells were determined. In D, absolute numbers of CD8+IFN-γ+ cells are shown. In E, TNF-α production by CD8+ splenic T cells. All WT groups are individually compared to the respective CD1-/- experimental groups without anti-CD3 stimulation. Average+SE is representative of one in two experiments. *p=0.0286, Mann-Whitney test. n=4.
Disclaimer/Publisher’s Note: The statements, opinions and data contained in all publications are solely those of the individual author(s) and contributor(s) and not of MDPI and/or the editor(s). MDPI and/or the editor(s) disclaim responsibility for any injury to people or property resulting from any ideas, methods, instructions or products referred to in the content. |
© 2024 by the authors. Licensee MDPI, Basel, Switzerland. This article is an open access article distributed under the terms and conditions of the Creative Commons Attribution (CC BY) license (http://creativecommons.org/licenses/by/4.0/).
Copyright: This open access article is published under a Creative Commons CC BY 4.0 license, which permit the free download, distribution, and reuse, provided that the author and preprint are cited in any reuse.


