1. Introduction
Cannabis or hemp (
Cannabis sativa L.) is a versatile plant from the Cannabaceae family, cultivated across various habitats, from sea level to high altitudes. The cultivation and use date back to 5,000 BCE [
1] in Central Asia; since then, different civilizations have used it as food and medicine [
2]. The production of cannabis seeds and fiber began in Egypt and Western Asia, subsequently spreading to Europe around 1000–2000 BCE, reaching South America in 1545, and was later introduced to North America approximately 60 years later, in 1606 [
3].
Cannabis is a plant of remarkable chemical complexity, attracting significant scientific interest due to its diverse natural components, including cannabinoids, terpenes, flavonoids, and phenols, primarily found in its flowers [
4,
5]. These compounds have demonstrated medicinal potential, being cannabinoids mainly studied for treating various diseases. Additionally, cannabis leaves and seeds are functional and bioactive, making them valuable in nutrition [
6,
7].
The legalization of cannabis and hemp consumption worldwide has been a topic of debate. It varies significantly by region and country, with considerable changes in laws and regulations regarding the use of the plant as a raw material, intermediate products, and finished products for food, medicinal, and recreational purposes [
8].
In Ecuador, the
Asamblea Nacional reformulated the C
ódigo Orgánico Integral Penal (COIP) in December 2019, decriminalizing non-psychoactive cannabis or hemp from the list of controlled substances. It established that the delta-9-tetrahydrocannabinol (THC) content in the flower must be less than one percent by weight on a dry basis for industrial use [
9]. This reform came into effect in June 2020, presenting new opportunities for the development and economic revitalization of the Ecuadorian industry following the COVID-19 pandemic [
10].
Additionally, the Ecuadorian government has issued Ministerial Resolutions No. 109 and No. 141 from the Ministerio de Agricultura y Ganadería, and Resolution ARCSA-DE-002-2021-MAFG from the Agencia de Regulación y Control Sanitario (ARCSA), which regulate the entire process of importing seeds, planting, cultivation, harvesting, post-harvest processing, storage, transportation, processing, commercialization, and export of non-psychoactive cannabis or hemp for industrial use based on the delta-9-tetrahydrocannabinol (THC) content in dry weight [
11,
12].
Cannabis (
Cannabis sativa L.) is a plant with numerous properties and multiple therapeutic and pharmacological benefits [
13]. Cannabis and its derivatives have been used in traditional Eastern medicine as therapeutic agents, with evidence dating back to 2700 BCE; however, the systematic study of its properties began approximately 60 years ago [
14]. Scientific and technological advancements have enabled the use of this plant in industrial and even cosmetic applications [
15]. Additionally, cannabis has nutritional benefits as it contributes valuable nutrients to the human diet [
16].
In 1964, Professor Raphael Mechoulam from the Hebrew University of Jerusalem in Israel was the first to study the properties of the cannabis plant (
Cannabis sativa L.) and determine that it contains compounds with three rings (cyclohexene, tetrahydropyran, and benzene) in their structure, naming them cannabinoids [
17]. Among the cannabinoids discovered are delta-9-tetrahydrocannabinol (THC), which has psychotropic activity, and cannabinol (CBN), cannabigerol (CBG), and cannabidiol (CBD), which do not have psychotropic effects like THC [
18]. According to the World Health Organization (2020), cannabidiol (CBD) does not classify as a substance subject to international control; for this reason, studies have been conducted on its medicinal and therapeutic benefits, providing positive treatment options for diseases such as epilepsy, Parkinson's disease, Crohn's disease, multiple sclerosis, among others [
19].
Various studies have shown that climatic and environmental conditions alter the enzymatic systems of the cannabis plant, including the enzymes that catalyze the synthesis of THCA and CBDA. Factors such as geographic region, soil type, humidity, oxygen, light, and fertilizer type directly influence the production and quantity of secondary metabolites and the macro and micronutrients present in the plant [
20,
21,
22].
In Ecuador, there are no scientific studies related to the use of non-psychoactive cannabis flowers that identify and quantify the secondary metabolites and bioactive components present in varieties grown at altitudes above 2450 m.a.s.l., as well as studies focused on their use for food production and therapeutic products.
Therefore, this research contributes to the study of the extraction and analysis of bioactive and nutritional components in non-psychoactive cannabis flower varieties. Its primary objective is to extract and characterize the phytochemical compounds of cannabis (Cannabis sativa L.) cultivated in Ecuador, assessing their potential for food and medicinal applications.
2. Results and Discussion
2.1. Extraction Yields for Non-Psychoactive Cannabis Flowers
The parameter to compare each extraction method is the full-spectrum extract yield. This parameter relates the product or extract obtained to the amount of raw material, meaning the effectiveness of the extract recovered. We also employ the extraction rate for each method, which means the ratio between the yield and the time consumed for each extraction. This metric provides a more comprehensive view of the methods' effectiveness, considering both the amount of product obtained and the time invested in each procedure.
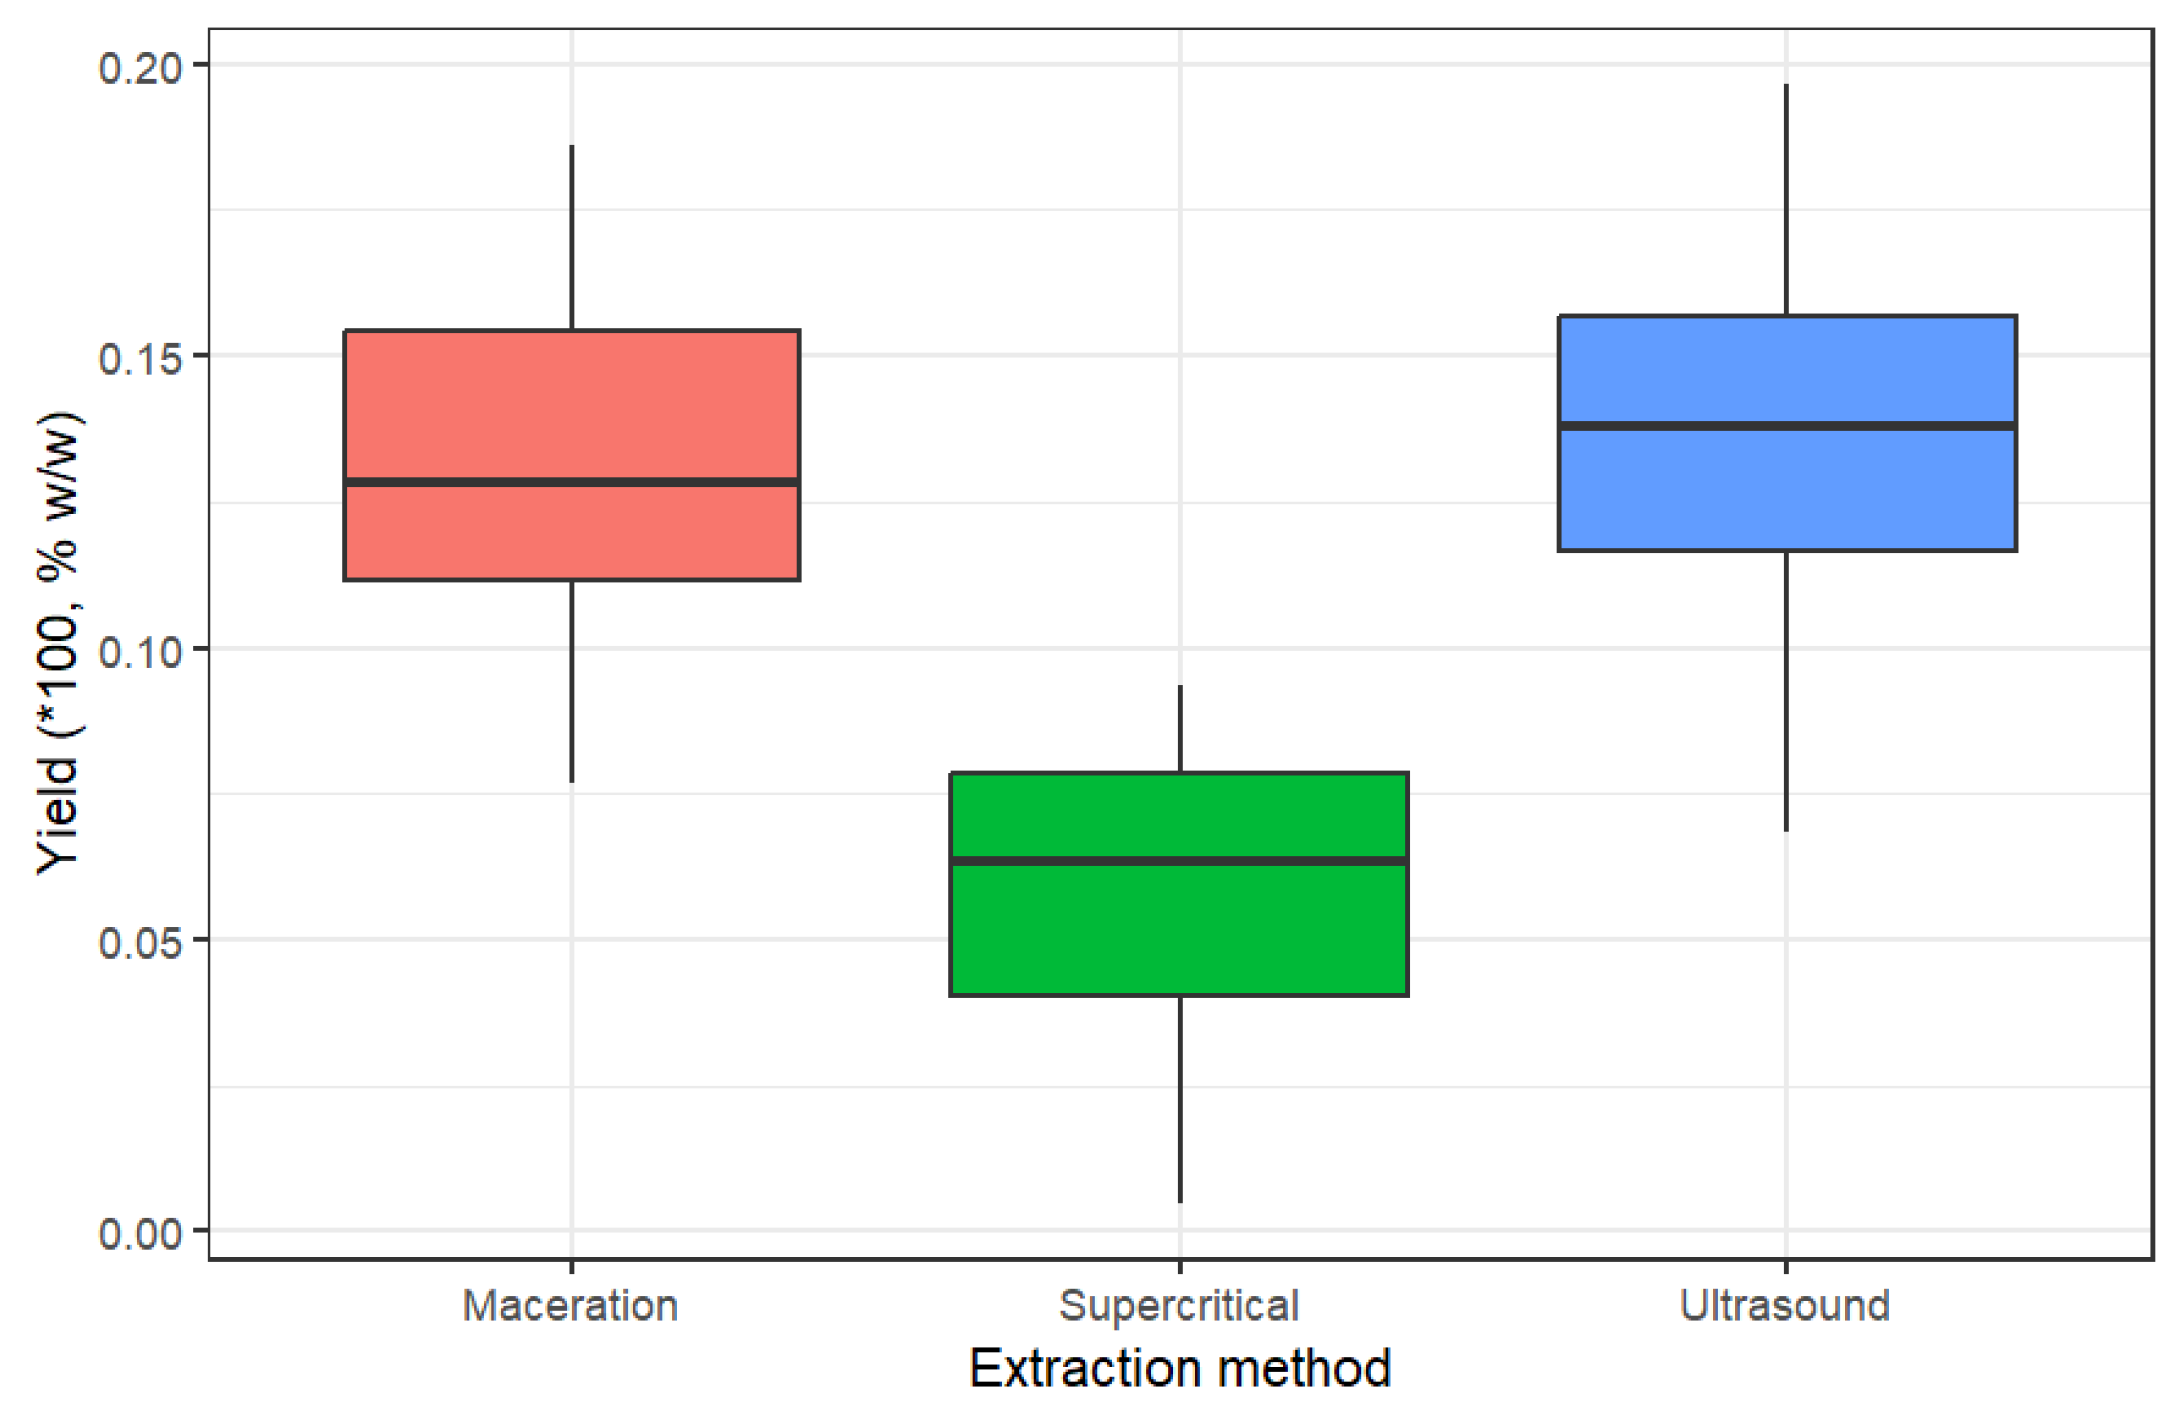
The ultrasound-assisted extraction (UAE) method can generate a higher yield than maceration and supercritical fluids. However, as illustrated in
Figure 1, there is no significant difference with the maceration method since their maximum yield values are similar (13,44% UEA y 12,96% MAC). This trend agrees with a previous work published by Al Ubeed [
23], where both the maceration and ultrasound methods obtained values close to 25% w/w. On the other hand, the supercritical fluid extraction (SFE) method exhibited the lowest extraction yield, with values that can fall to half of other yields. This is due to the highly selective nature of SFE, which targets specific compounds rather than extracting a broad spectrum.
An ANOVA (Analysis of Variance) was conducted for each extraction method to identify the factors significantly influencing the yield of the full-spectrum extract. This statistical analysis helps determine which variables, such as temperature, pressure, and time, considerably impact extraction efficiency and thus assists in optimizing the extraction conditions to maximize yields.
Table 1 presents the analysis of variance (ANOVA) for the ultrasound-assisted extraction (UAE) and maceration methods, highlighting two significant factors with p-values less than 0.05: "Variety" and "Temperature." Additionally, it is observed that there are no significant interactions between these factors. When applying the multiple range test for the significant factors, it is possible to identify which conditions optimize the extract yield.
For example,
Table 2 shows that the variety with the highest yield for both extraction methods was Titan, with 17.44% w/w ± 0.19% for ultrasound-assisted extraction (UAE) and 16.89% w/w ± 0.20% for maceration (MAC). In contrast, the variety with the lowest yield for both methods were Lemonge, with 9.25% w/w ± 0.19% for UAE and 9.46% w/w ± 0.21% for MAC. Furthermore,
Table 2 indicates that the second significant factor, temperature, reveals that the best yields for both UAE and MAC were achieved at the highest experimental temperature of 16°C.
A study conducted by Radoiu [
24] compared the extraction methods of ultrasound, microwave, solvent, and supercritical fluids, concluding that the ultrasound and microwave methods are the most efficient from an ecological perspective due to their lower solvent consumption. On the other hand, for the maceration method, it is noted that temperatures of 16°C and 0°C produced the best yields, with 13.41% w/w ± 0.14% and 13.05% w/w ± 0.15%, respectively.
Non-significant factors, such as time for ultrasound-assisted extraction (UAE) and maceration (MAC), as well as temperature and pressure for supercritical fluid extraction (SFE), indicate that these factors do not have a considerable impact on the final extraction yield. Therefore, in
Table 2, it can be observed that there are no minimum or maximum values associated with these factors, as the yield obtained is similar regardless of the time in UAE and MAC or the temperature and pressure in SFE.
The ANOVA analysis in
Table 1 for the supercritical fluid extraction method shows that the only statistically significant factor is the 'Variety' factor, with a p-value less than 0.05. No interactions were recorded for these extraction methods.
Table 2 indicates that the Titan variety presents the best yield for the supercritical fluid method, with 8.1% w/w ± 0.35%, while the Lemonge variety shows the lowest yield with a value of 1.8% w/w ± 0.30%. Comparing these results with those obtained by Jokić [
25], it is observed that their highest yield is 8.83% under conditions of 361.4 bar pressure and 50°C temperature, while the highest yield of the Titan variety was obtained at 325 bar pressure and 55°C temperature.
Some of the high yields of maceration (MAC) and ultrasound-assisted (UAE) methods can be attributed to the type of solvent used. In the case of ethanol, its high dissolving power and polar nature allow it to dissolve a full spectrum of secondary metabolites, including cannabinoids, terpenes, and flavonoids. However, it can also carry undesired water-soluble molecules, such as chlorophyll, glycosides, sugars, and alkaloid salts, which can be removed in subsequent processes such as winterization to meet FDA requirements [
26]. On the other hand, CO2 tends to be selective with cannabinoid and terpene molecules in the supercritical extraction process; therefore, yields may be less affected by the raw material entering the process [
27]. The ultrasound method, being the most efficient, could be scaled up to increase production; however, the associated costs could result in a significant investment.
Table 3 shows the optimal conditions for high yield for each extraction method. Non-significant factors, such as extraction time for maceration and ultrasound-assisted extraction, can be set to the lowest values to minimize energy consumption. The same logic applies to supercritical fluid extraction, where temperature and pressure, being non-significant, can be chosen at the lowest settings to save energy consumption.
2.2. Cannabinoid Analysis in Non-Psychoactive Cannabis Flower Extracts
The MANOVA statistical analysis showed a significant difference in cannabinoid content for the "Variety" factor across all extraction methods (
Table 4) and a significant difference for the "Temperature" factor in the ultrasound-assisted extraction method. No interactions or correlations were observed between factors. The variety can influence the concentration of the analyzed cannabinoids (CBD, THC, CBN, CBG), meaning certain varieties may present higher CBD concentrations due to their genetics. This aligns with the findings of Wilson et al. [
28], who observed different CBD percentages in the studied varieties using traditional extraction methods. In their study, the first variety showed a CBD content of 65% w/w, while the second had 61% w/w, despite using the same extraction conditions. The significant factor of temperature in the ultrasound-assisted extraction method indicates a direct relationship between temperature and cannabinoid concentration; as the temperature increases, so does the concentration of these compounds.
In this study, we optimized the decarboxylation process of non-psychoactive cannabis extracts to maximize the conversion of acid cannabinoids to decarboxylated cannabinoids (active cannabinoids), as suggested by Gallo [
29]. This procedure was performed on the extracts rather than on the inflorescences, due to the risk of losing thermolabile and volatile molecules, such as flavonoids and terpenes, which are compounds of interest for further analysis. These compounds contribute to the organoleptic properties and health benefits of the final product [
30]. We employed high-performance liquid chromatography (HPLC) to analyze cannabinoids, this methodology allows to differentiate the presence of acidic and non-acidic forms. If the extract contains cannabinoids in their acidic forms, gas chromatography (GC) allows partial conversion to active forms due to the equipment's heating conditions [
31].
In terms of quantification, the total content of each cannabinoid can be expressed as the sum of both forms [
32]. In this study, decarboxylation was used to quantify the total of each cannabinoid, which helps us comply with Ecuadorian legislation[
11].
This process ensures a comprehensive analysis of both the acidic and active forms of cannabinoids, providing insights into the effectiveness of different extraction and decarboxylation methods for optimizing the cannabinoid profile of non-psychoactive cannabis extracts.
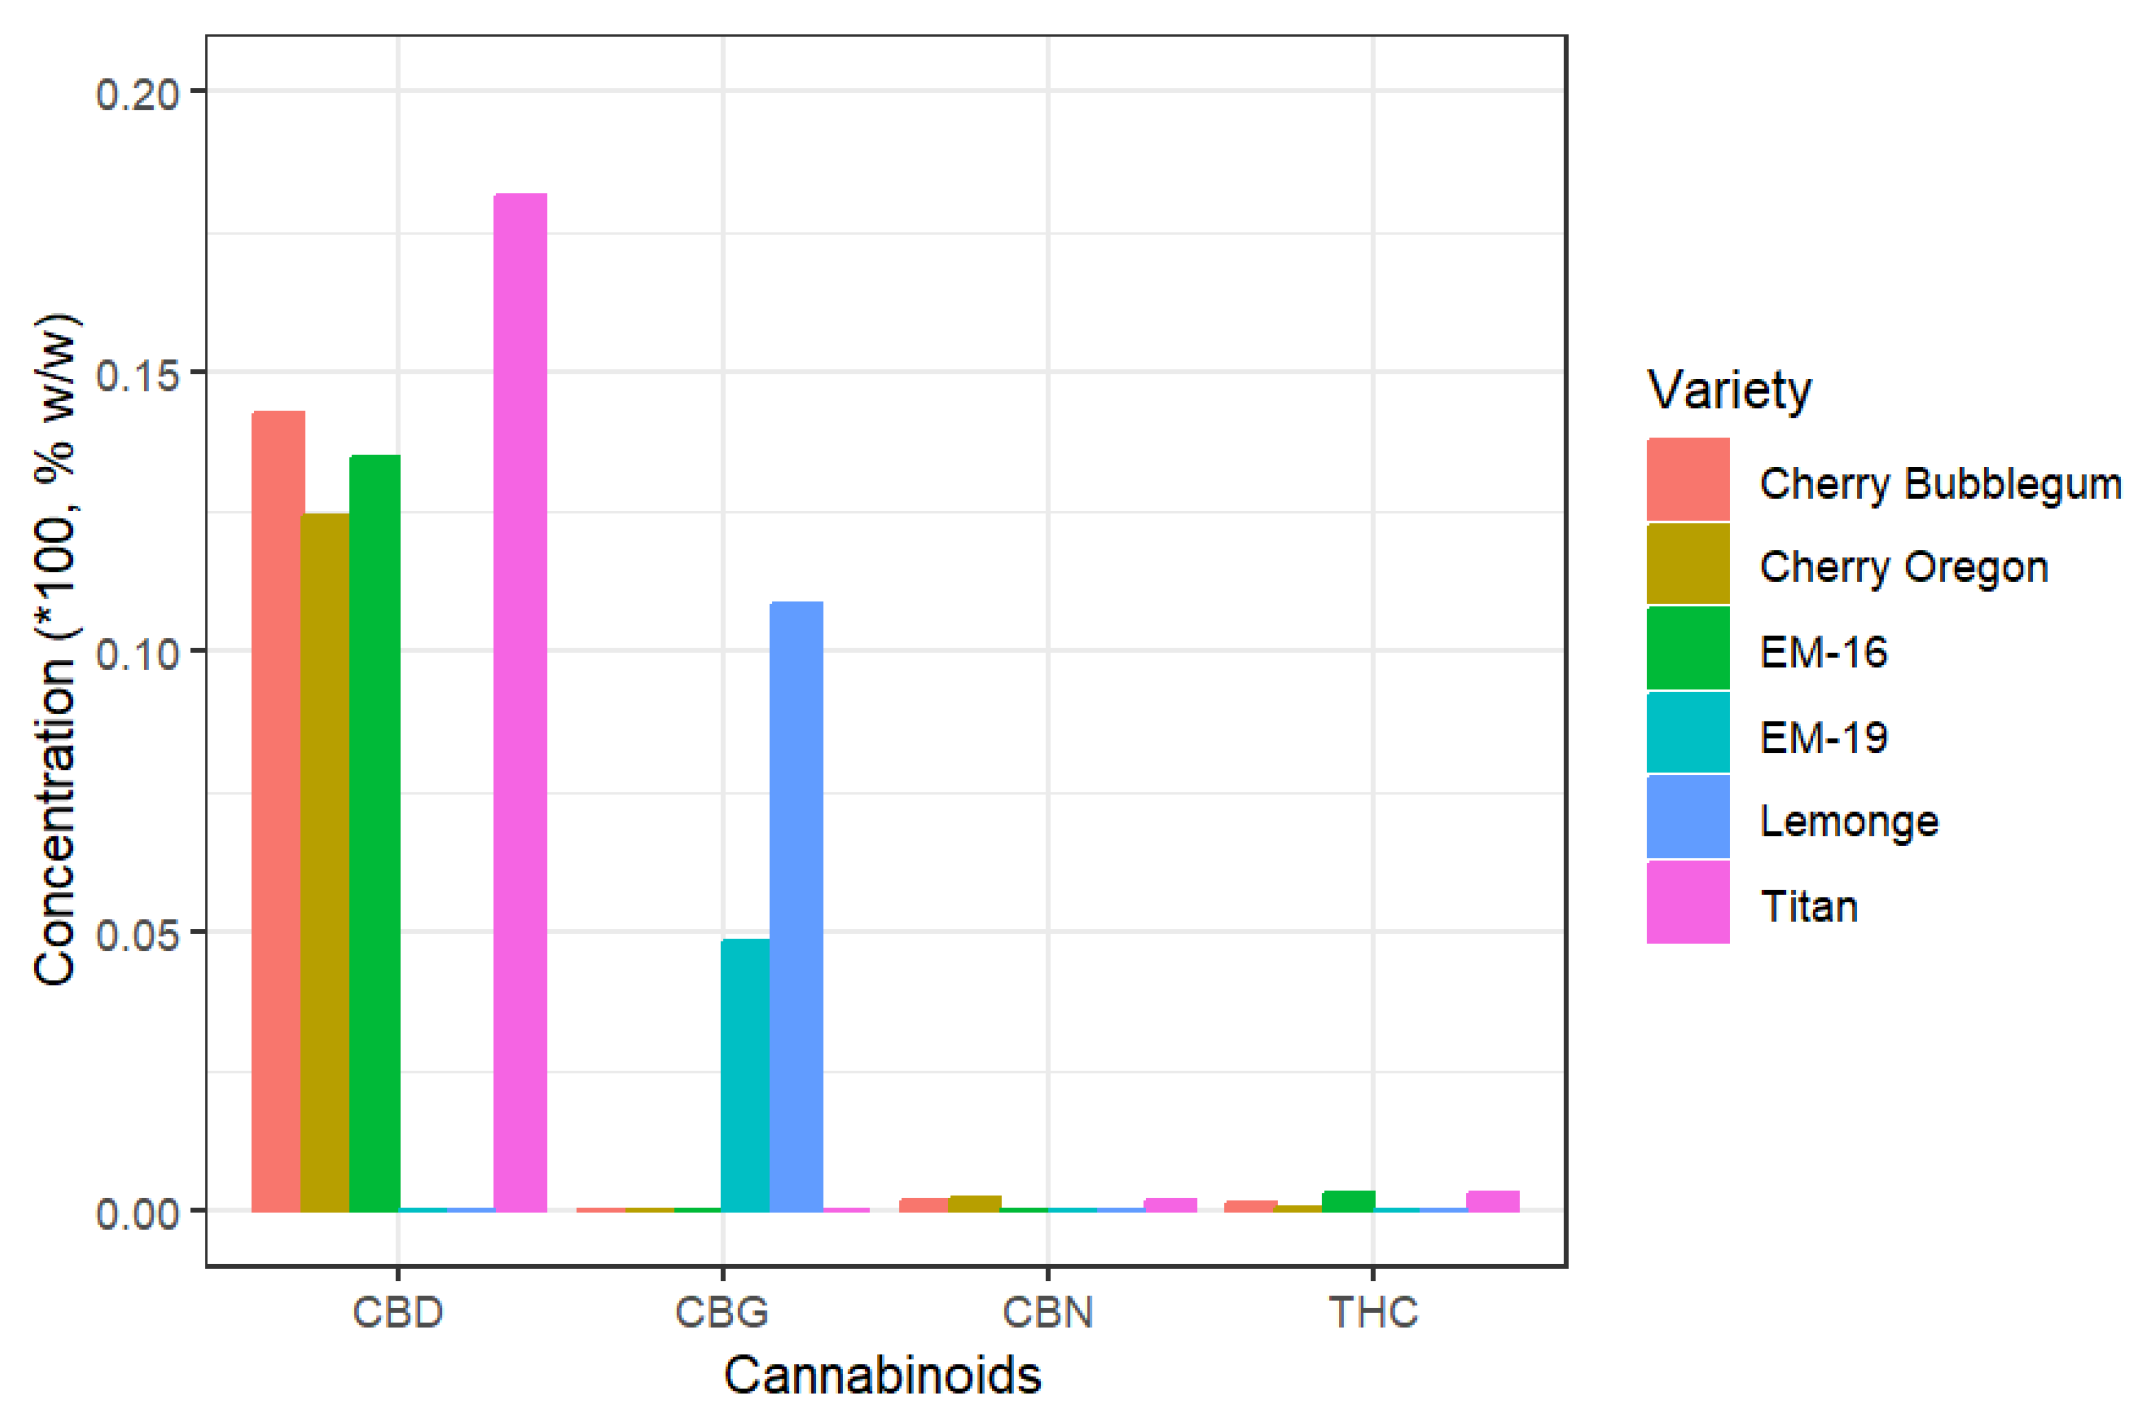
The total cannabinoid analysis in non-psychoactive cannabis flowers is presented in
Figure 2, which shows that the Titan variety contains the highest concentration of CBD, with 18.15% w/w. Regarding CBG, the Lemonge variety exhibits the highest concentration at 10.83% w/w. All flower samples present less than 1% THC on a dry weight basis, complying with Ecuadorian regulations that stipulate THC should not exceed this limit in non-psychoactive cannabis. In CBG-rich varieties like Lemonge and EM-19, cannabinoids such as CBD and THC are absent. This is because cannabigerol (CBG) is the precursor of other cannabinoids in the plant's biosynthesis, as noted by Chen and Pan [
7], resulting in extremely low concentrations of other cannabinoids. The highest concentration of cannabinoids is found in the flowers, which is why quality control primarily focuses on analyzing this part of the plant. Kleinhenz [
33] reported similar findings, with a concentration of 3509 µg/g in the flowers and less than 1000 µg/g in other parts of the plant.
The cannabinoid results obtained from non-psychoactive cannabis flowers differ from the values provided in commercial technical datasheets. For example, the Titan variety, according to its datasheet, should have a CBD content of 10.59% and a THC content of 0.36%. However, the analyses conducted show values of 18.15% for CBD and 0.34% for THC.
Table 5 reflects these discrepancies between the commercial technical datasheet values and the results of varieties cultivated in Ecuador. The differences may be due to various factors, such as seed quality, climate, soil type, geographic location, and the use of organic fertilizers in Ecuador [
34].
The cannabis varieties used in this study have high percentages of CBD or CBG and low levels of THC, complying with local regulations. In Ecuador, THC content must be below 1% in dry weight of inflorescence according to the COIP [
9].
American varieties, such as Cherry Oregon, Cherry Bubblegum, and Titan, show higher concentrations of CBD when cultivated in Ecuador compared to their commercial technical datasheets. This suggests that the adaptability of these seeds to Ecuadorian soil and climate might enhance the expression of inherent plant characteristics, such as secondary metabolites. The Titan variety, with a higher CBD concentration, was cultivated in Cotogchoa, Pichincha, under conditions of an average annual temperature between 14 and 15 °C, daily temperature variations of 9 °C, an average annual relative humidity of 86%, and an altitude of 2,614 meters above sea level, as shown in
Table 12.
In contrast, CBG varieties cultivated in Ecuador show lower concentrations compared to their technical datasheet specifications. This difference may be related to geographic conditions, especially altitude, as these varieties were cultivated at over 2,450 meters above sea level. It is possible that the seeds need more time to adapt to these extreme conditions.
The
Table 6 shows the statistical means of yields for each treatment of the extraction methods depending on the variety that gave the best results.
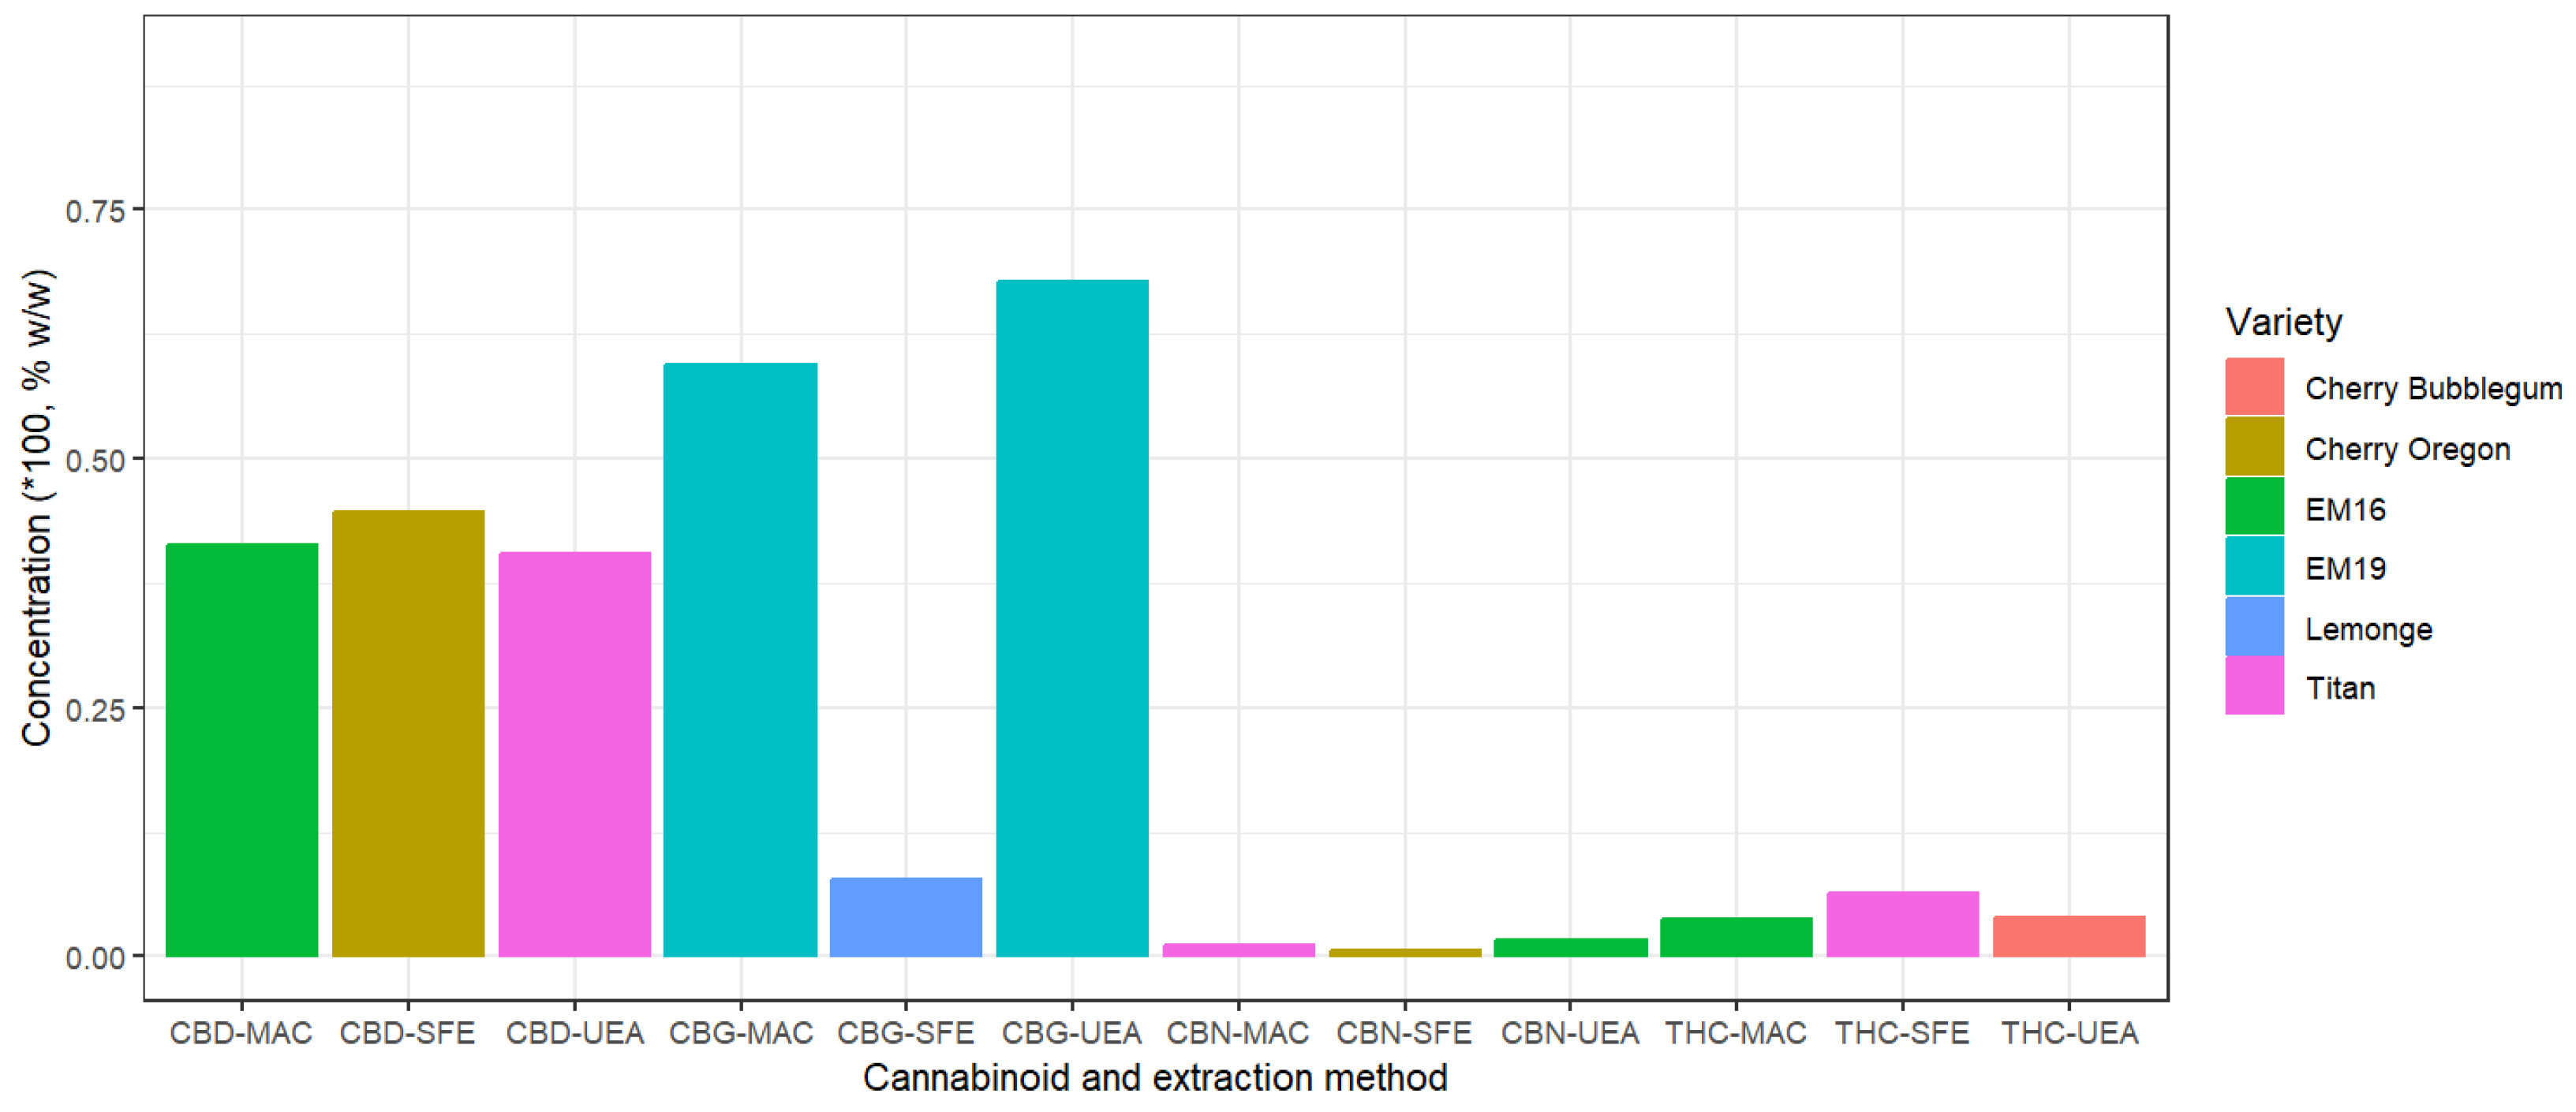
The results of cannabinoid concentrations for each extraction method, based on the significant factor "Variety," are presented in
Figure 3. This figure shows the highest concentrations of each cannabinoid for the analyzed cannabis varieties. For cannabigerol (CBG), the highest concentration was obtained with the EM-19 variety using the ultrasound method, reaching 67.77% w/w. The lowest concentration of CBG was recorded for the Lemonge variety with supercritical fluids, at 7.69% w/w. On the other hand, cannabinol (CBN) shows very low concentrations, as it is not naturally produced in the plant but rather derives from the oxidation of THC [
35].
Figure 3 shows that the concentration of ∆9-Tetrahydrocannabinol (THC) is significantly lower compared to CBD; however, the highest concentration of THC in extracts was observed in the Titan variety using supercritical fluids, reaching a value of 6.32%. Cannabinoid percentages increase significantly after flower extraction and continue to concentrate as the refinement process advances, until complete isolation is achieved [
36].
Additionally, the highest concentration of cannabidiol (CBD) was achieved with supercritical fluid extraction, reaching 44.65% w/w, with slight variations of ±1% compared to other methods. Supercritical fluids have medium-low extraction potential for cannabinoids and terpenes due to their solubility characteristics [
37]. In contrast, ethanol shows higher solubility for various secondary metabolites and unwanted compounds, which requires a subsequent "winterization" step to precipitate unwanted compounds, such as fats, by reducing the temperature below -40 °C. Grijó [
38] indicate a decrease in cannabinoid concentration after the winterization process. Also, King [
36] suggests that cannabinoid solubility in ethanol extraction depends on temperature, while the supercritical fluid method can achieve higher solubility by adjusting the pressure and temperature of CO
2.
Multiple range tests conducted for each cannabinoid showed that higher temperatures and longer times favor higher cannabinoid concentrations in maceration and ultrasound methods, results that align with those obtained by De Vita [
39]. Conversely, the supercritical fluid method showed an extraction efficiency ranging between 70% w/w and 85% w/w at temperatures of 35-45 °C and pressures of 300-325 bar.
2.3. Identification of the Terpene Profile in Non-Psychoactive Cannabis Extract
The terpene content present in non-psychoactive cannabis flowers is primarily hereditary, meaning that its concentration varies according to the variety [
40]. According to Jin [
41], cannabis inflorescences contain the highest number of terpenes. To maximize the concentration of mono- and sesquiterpenes, extraction processes are essential. It is important to perform the extraction without excessive delays in flower storage, as prolonging the storage time can lead to terpene losses [
42].
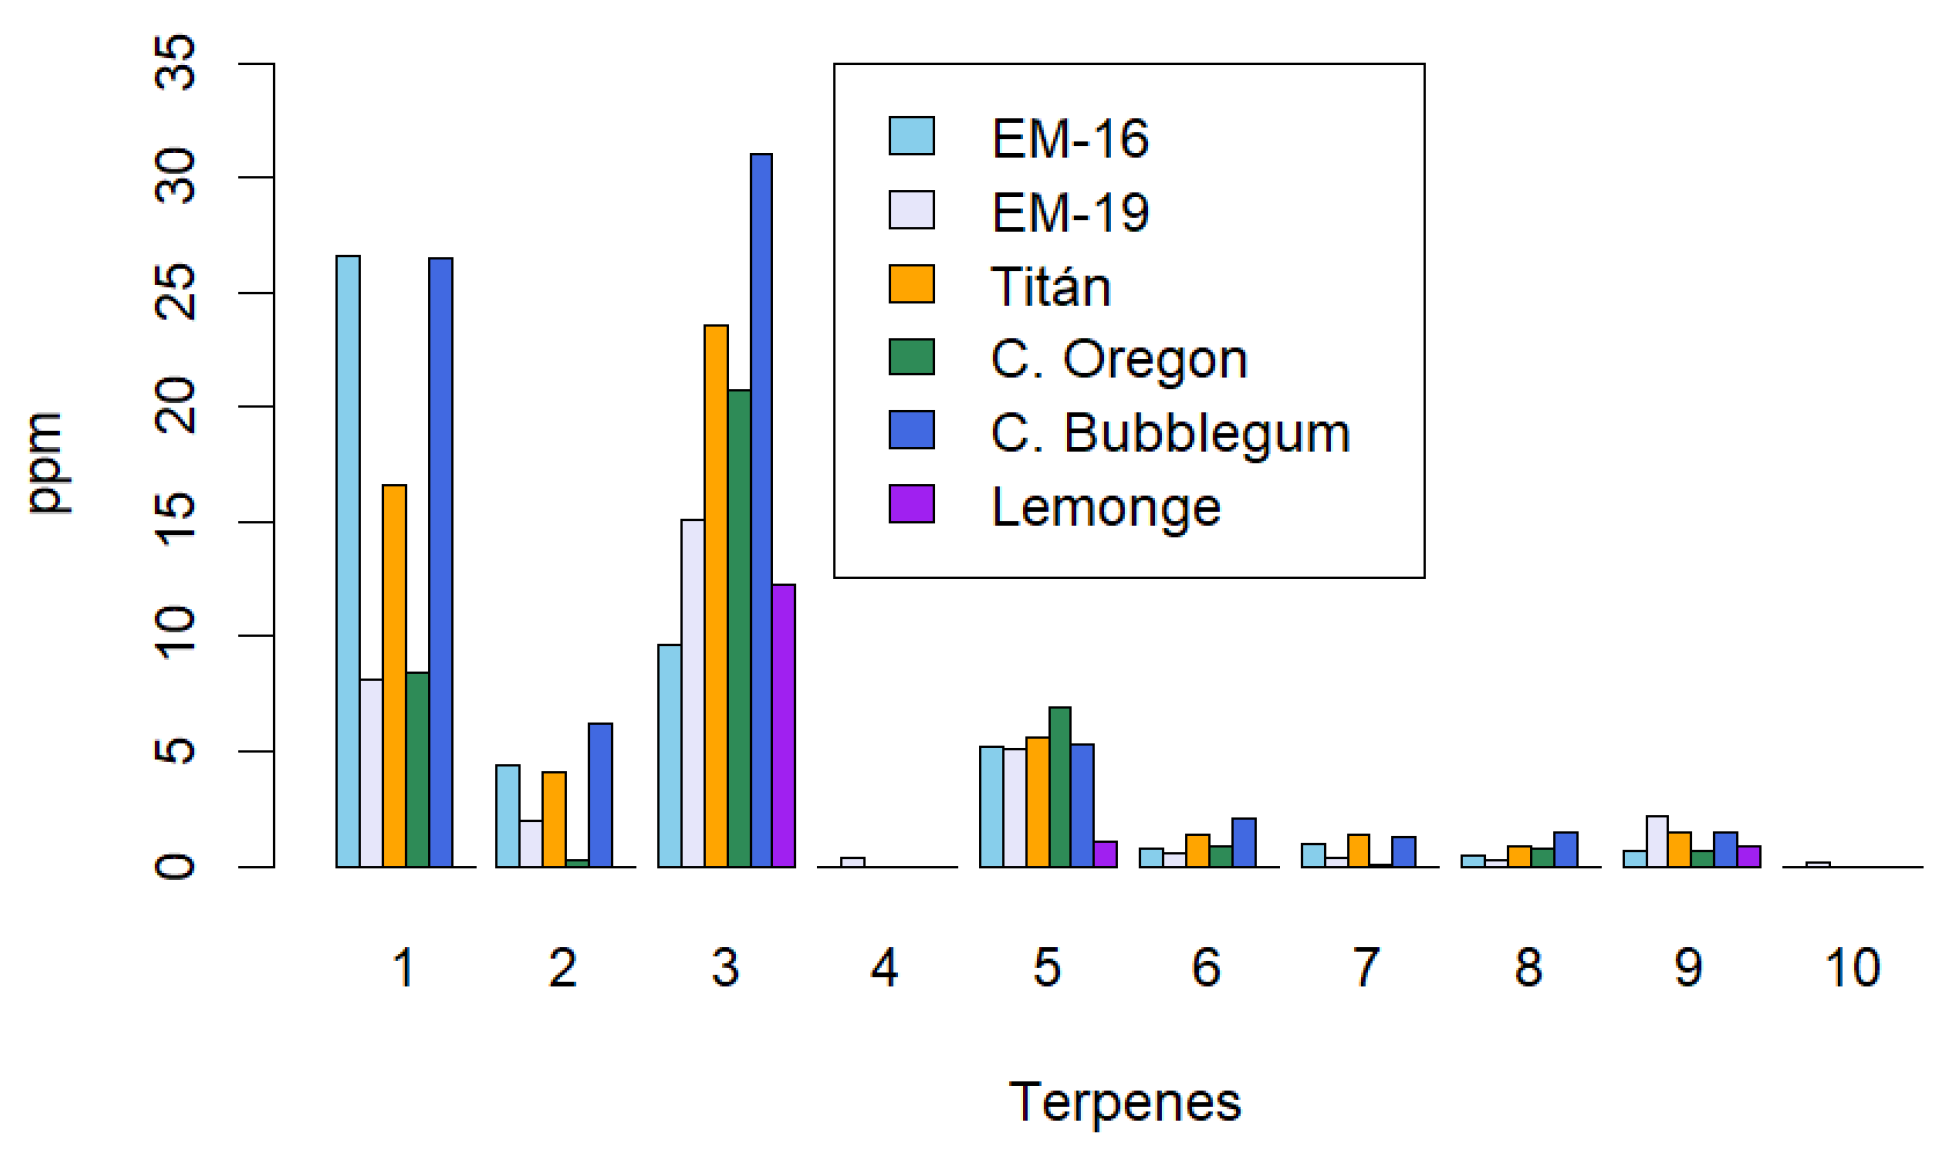
The total yield of terpenes also depends on the extraction method used. In the case of maceration,
Figure 4 shows that bisabolol is most abundant in the Cherry Bubblegum variety, with a value of 31 µg/g, followed by β-caryophyllene in the EM-16 variety with 26.6 µg/g. Terpenes with lower presence in the extracts are β-myrcene and cedrene, detected only in the EM-19 variety, with values of 0.4 µg/g and 0.2 µg/g, respectively. Similar results are found by Ascrizzi [
43], where terpenes from two cannabis varieties are compared with a hop variety used in beverage production. The concentration of terpenes in extracts obtained through maceration shows a significant loss compared to the cannabis inflorescence, possibly due to decarboxylation temperatures exceeding 100°C, which causes the volatilization of certain monoterpenes with boiling points below this temperature.
The results obtained using the ultrasound-assisted extraction method are similar to those from maceration extraction, as the same solvent (ethanol) was used in both cases. In contrast, the concentration values obtained by SFE are significantly higher, possibly due to the superior solubility of terpenes in supercritical CO₂ (4.6 g/100 g) compared to ethanol (2.14 E-4 g/100 g) [
44,
45]. Bisabolol was the most abundant terpene, with a concentration of 49.6 µg/g in the Cherry Oregon variety. In contrast, β-myrcene was the least abundant, with a concentration of 0.4 µg/g in the Lemonge variety. The variability in terpene concentrations is primarily due to differences between non-psychoactive cannabis varieties, but the extraction method also plays a crucial role in the selectivity of the extracted compounds. For example, cedrene was detected only in samples obtained through maceration, while citronellol was identified only in extracts obtained via ultrasound. These findings highlight the influence of the extraction method on the final terpene profile, consistent with Rocha's report [
46] on terpene identification in cannabis varieties grown under different geographical conditions.
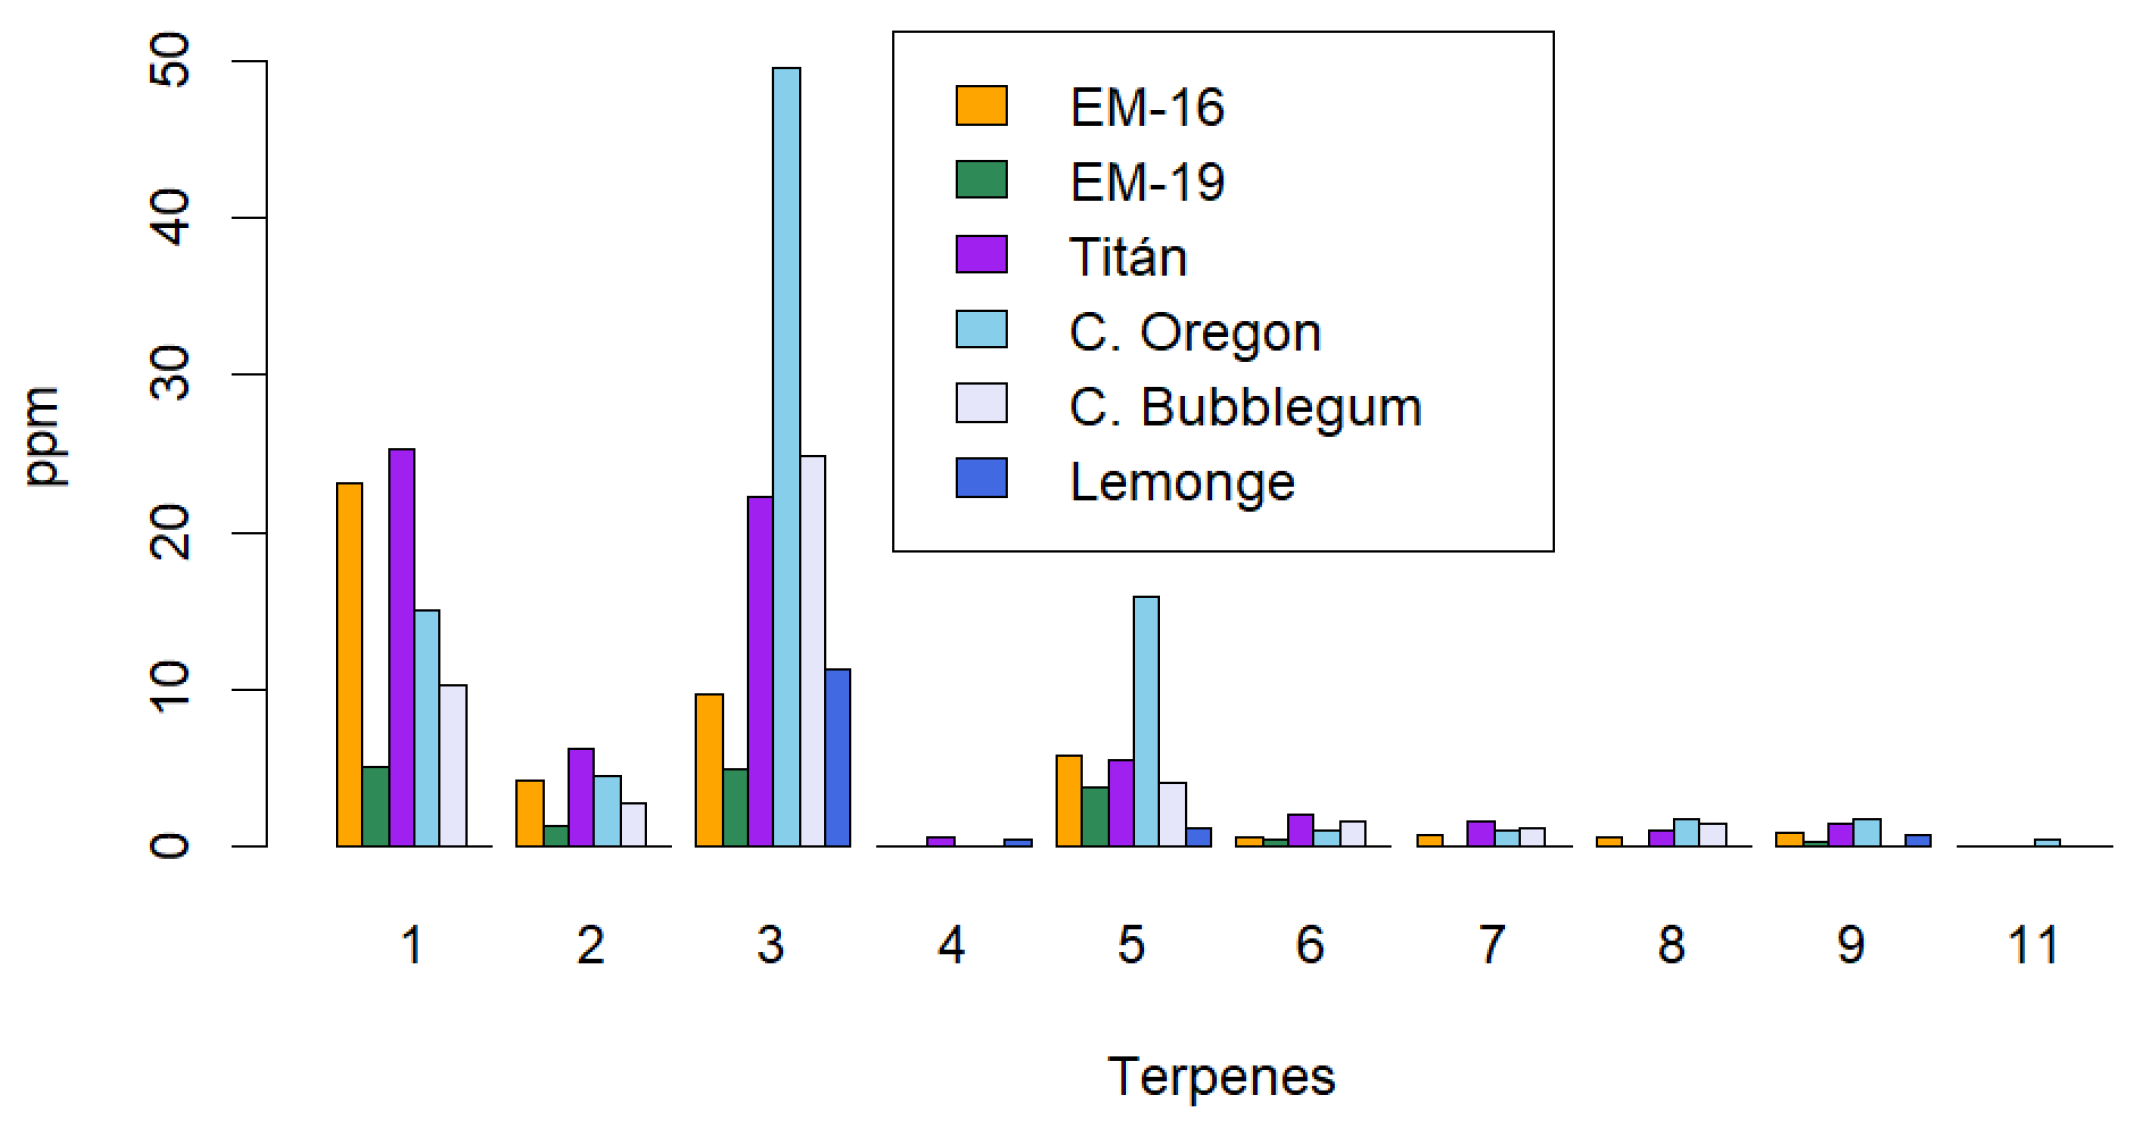
Figure 5.
Terpene profile identification using the ultrasound-assisted method. The identified terpenes are: 1: β-caryophyllene, 2: Humulene, 3: Bisabolol, 4: β-myrcene, 5: Nerolidol, 6: (-)-linalool, 7: Fenchol, 8: Geranyl acetate, 9: Cedrol, 11: Citronellol.
Figure 5.
Terpene profile identification using the ultrasound-assisted method. The identified terpenes are: 1: β-caryophyllene, 2: Humulene, 3: Bisabolol, 4: β-myrcene, 5: Nerolidol, 6: (-)-linalool, 7: Fenchol, 8: Geranyl acetate, 9: Cedrol, 11: Citronellol.
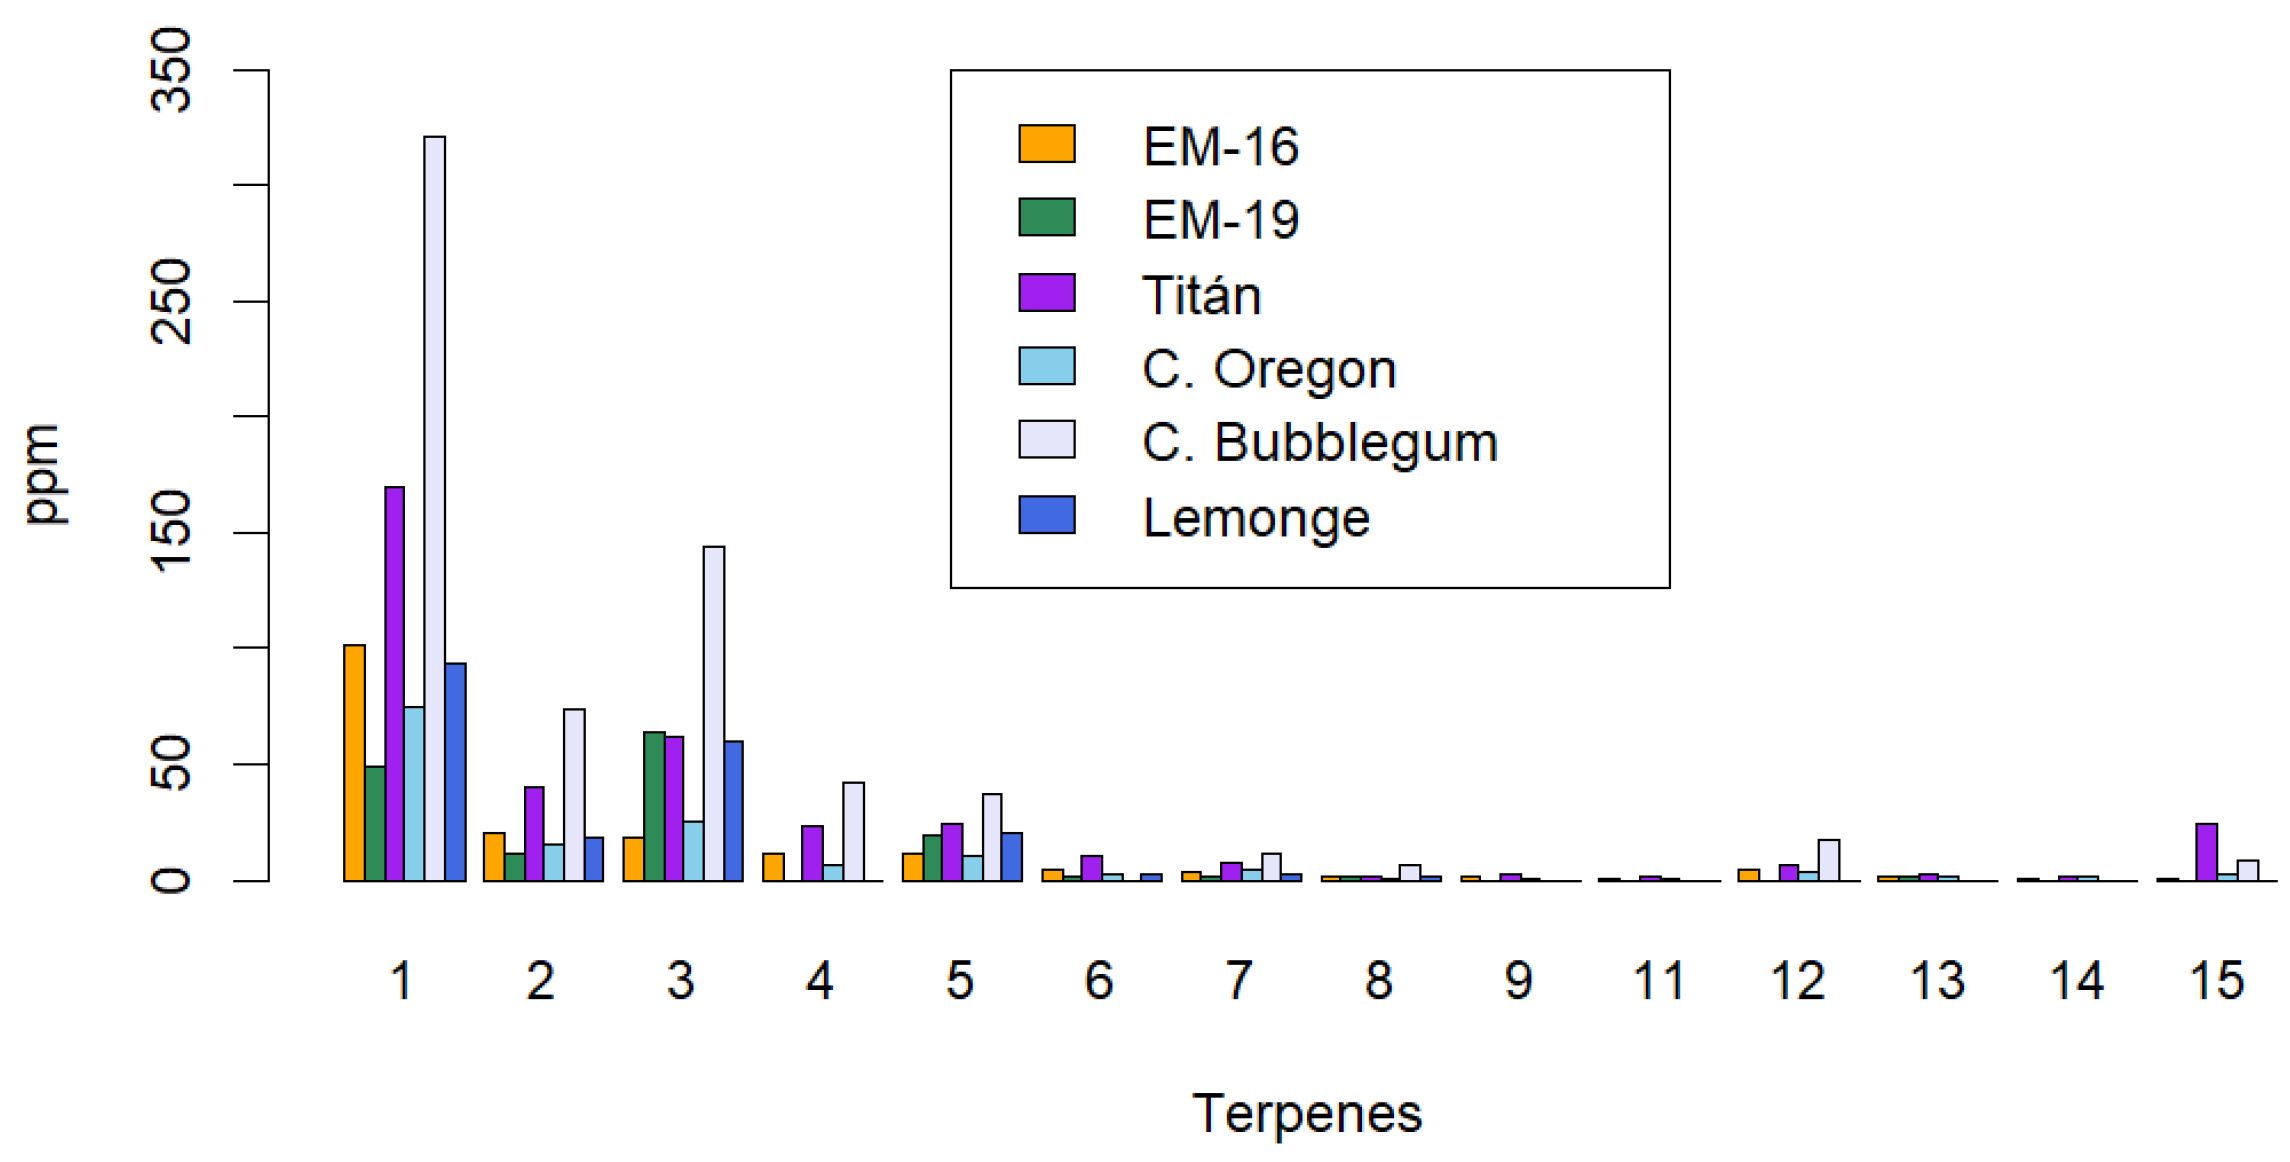
Figure 6 shows that the number of terpenes identified using the supercritical fluid extraction method is higher (14 terpenes) compared to the maceration and ultrasound methods, which each identified 10 terpenes. This suggests greater selectivity of the supercritical fluid method for extracting these secondary metabolites. Additionally, the terpene concentrations obtained with this method are significantly higher than those from the maceration and ultrasound methods. The terpene with the highest concentration was β-caryophyllene (320.79 ppm) in the Cherry Bubblegum variety. Other notable terpenes in this variety include: humulene (73.84 ppm), bisabolol (143.57 ppm), myrcene (42.17 ppm), and nerolidol (37.35 ppm).
The two most abundant terpenes identified across all varieties of non-psychoactive cannabis were bisabolol and β-caryophyllene. Supercritical fluid extraction (SFE) resulted in the highest concentrations of these terpenes, followed by ultrasound-assisted extraction (UAE) and, finally, maceration (MAC). The efficiency of the maceration method may be influenced by factors such as solvent temperature and extraction time. In comparison, ultrasound-assisted extraction requires less time, as ultrasonic waves facilitate the rupture of the cell wall, quickly releasing the present phytochemicals. However, cavitation produced during sonication can lead to partial or complete evaporation of terpenes with low boiling points, as temperatures at cavitation points can briefly exceed 100°C [
47].
The supercritical fluid extraction method was the most effective for obtaining both monoterpenes (such as β-myrcene, (-)-linalool, α-pinene, fenchol, geraniol acetate, β-pinene, fenchone, citronellol, (R)-(+)-limonene) and sesquiterpenes (β-caryophyllene, humulene, bisabolol, nerolidol, cedrol). Among the primary terpenes present in cannabis, β-caryophyllene, bisabolol, and nerolidol are known for their antioxidant and therapeutic properties. β-Caryophyllene, for instance, has anti-inflammatory and anticancer effects; bisabolol possesses antimutagenic and antimicrobial properties; and nerolidol is recognized for its antifungal and anxiolytic effects [
48,
49].
2.4. Identification of Cannaflavins, Total Flavonoids, Total Polyphenols, and Tannins
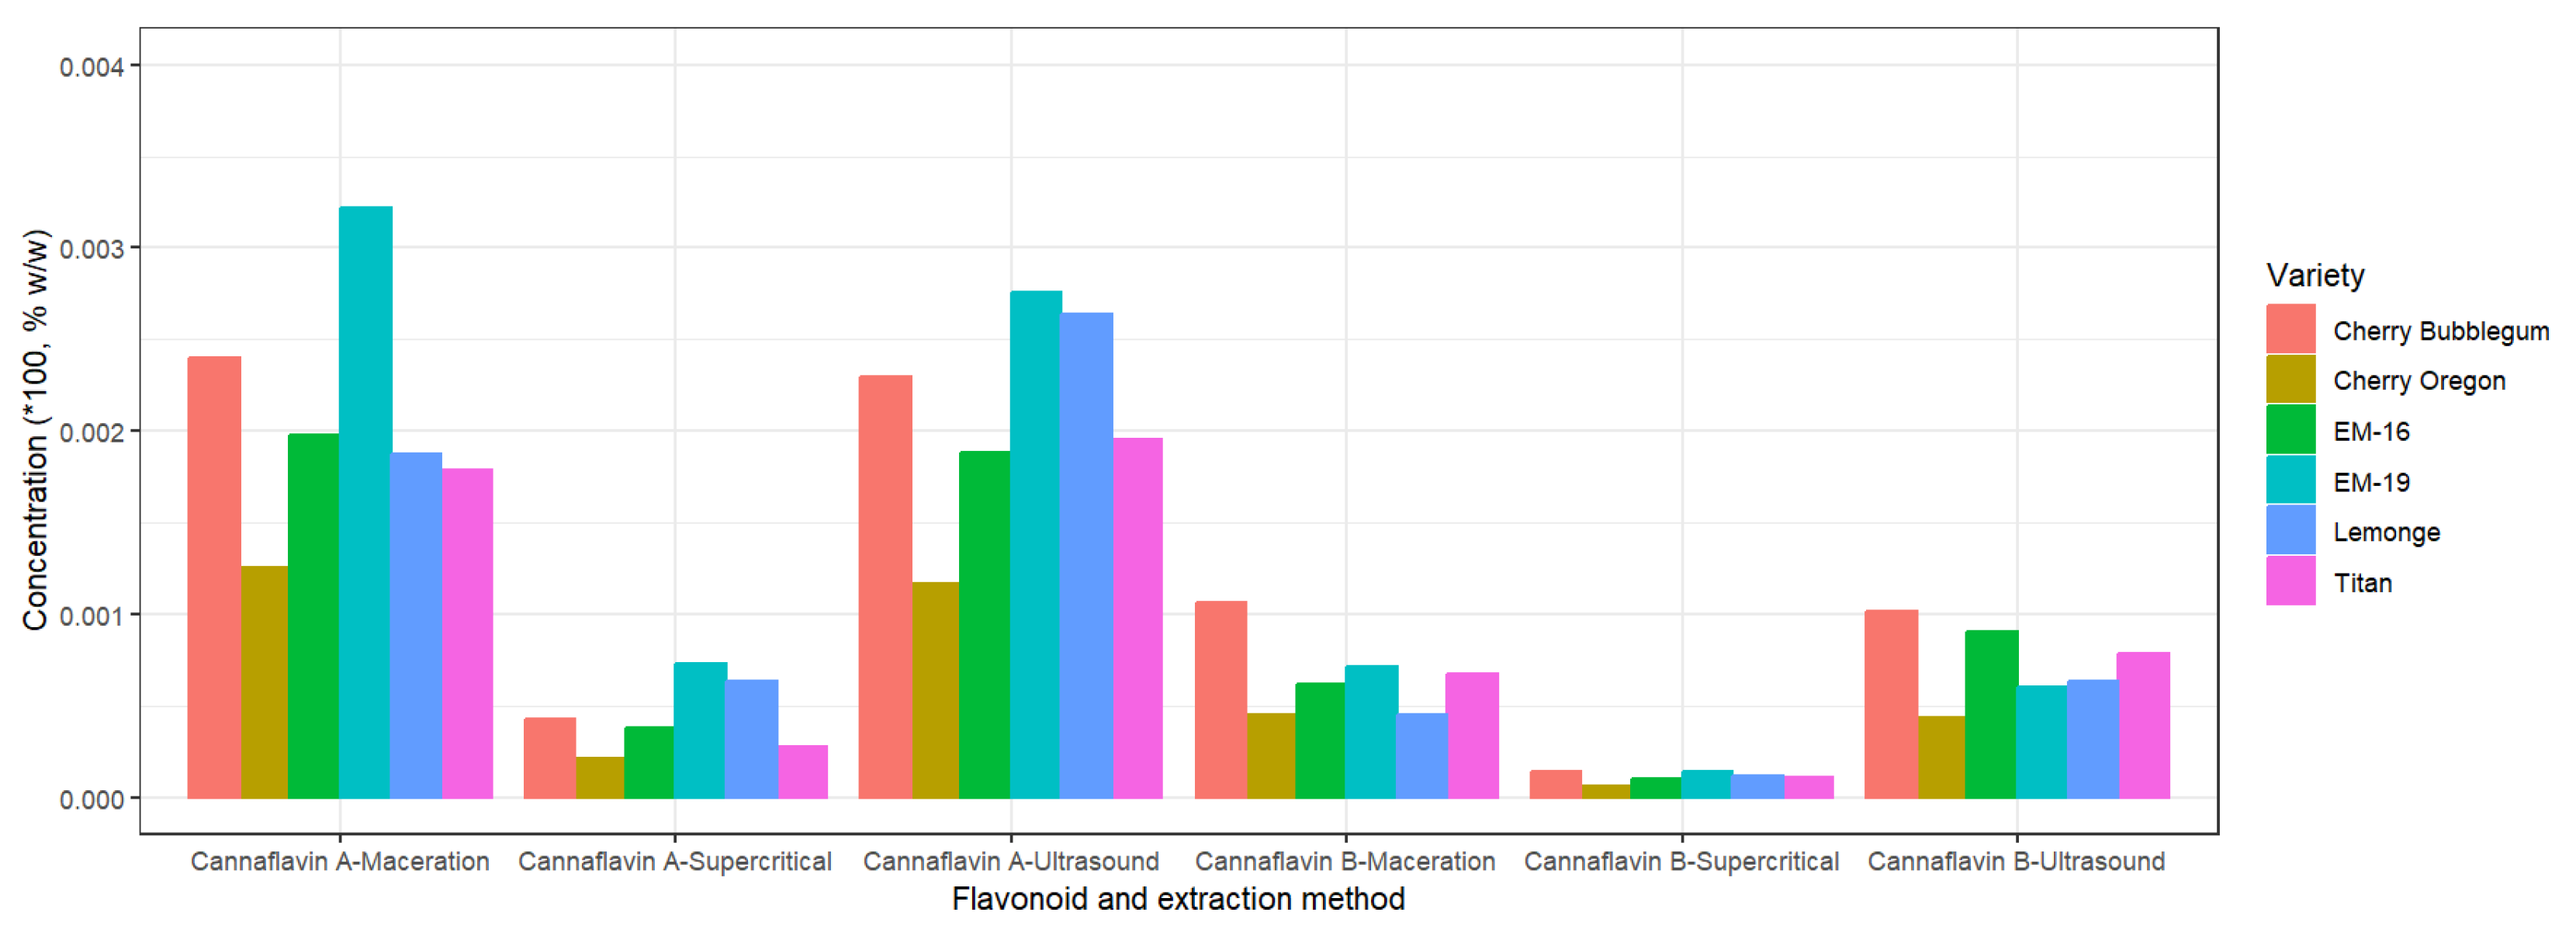
Cannaflavins A and B are flavonoids present in cannabis with potent anti-inflammatory properties. Studies have shown that cannaflavin A inhibits the production of PGE2, a molecule associated with inflammation, up to thirty times more effectively than aspirin [
50].
Figure 7 shows that the variety EM-19 has the highest concentration of cannaflavin A across all extraction methods, reaching a maximum yield of 0.32% p/p through maceration. Meanwhile, cannaflavin B is found in higher concentrations in the variety Cherry Bubblegum, with a maximum value of 0.11% p/p, also obtained through maceration.
The variation in cannaflavin concentration is mainly due to the genetics of each cannabis variety. However, it was observed that the values of cannaflavins A and B obtained using the supercritical fluid extraction method are the lowest compared to other extraction methods. This behavior contrasts with the extraction of terpenes, where supercritical fluid extraction was more effective. The globally low concentration of cannaflavins could be related to suboptimal growing conditions, such as high temperatures and low sunlight during the early stages of flowering [
51].
The study by Barrientos Ramírez [
52] suggests that antioxidant capacity is higher in wild plants compared to cultivated ones, with the effect being more pronounced in fruits and leaves. These plant parts contain a greater abundance of secondary metabolites with antioxidant properties, such as flavonoids, polyphenols, and tannins. These compounds have shown beneficial biochemical and antioxidant effects, which are associated with the prevention and treatment of neurodegenerative diseases such as Alzheimer's and multiple sclerosis [
53]. Additionally, some flavonoids have anti-inflammatory and neuroprotective properties [
54].
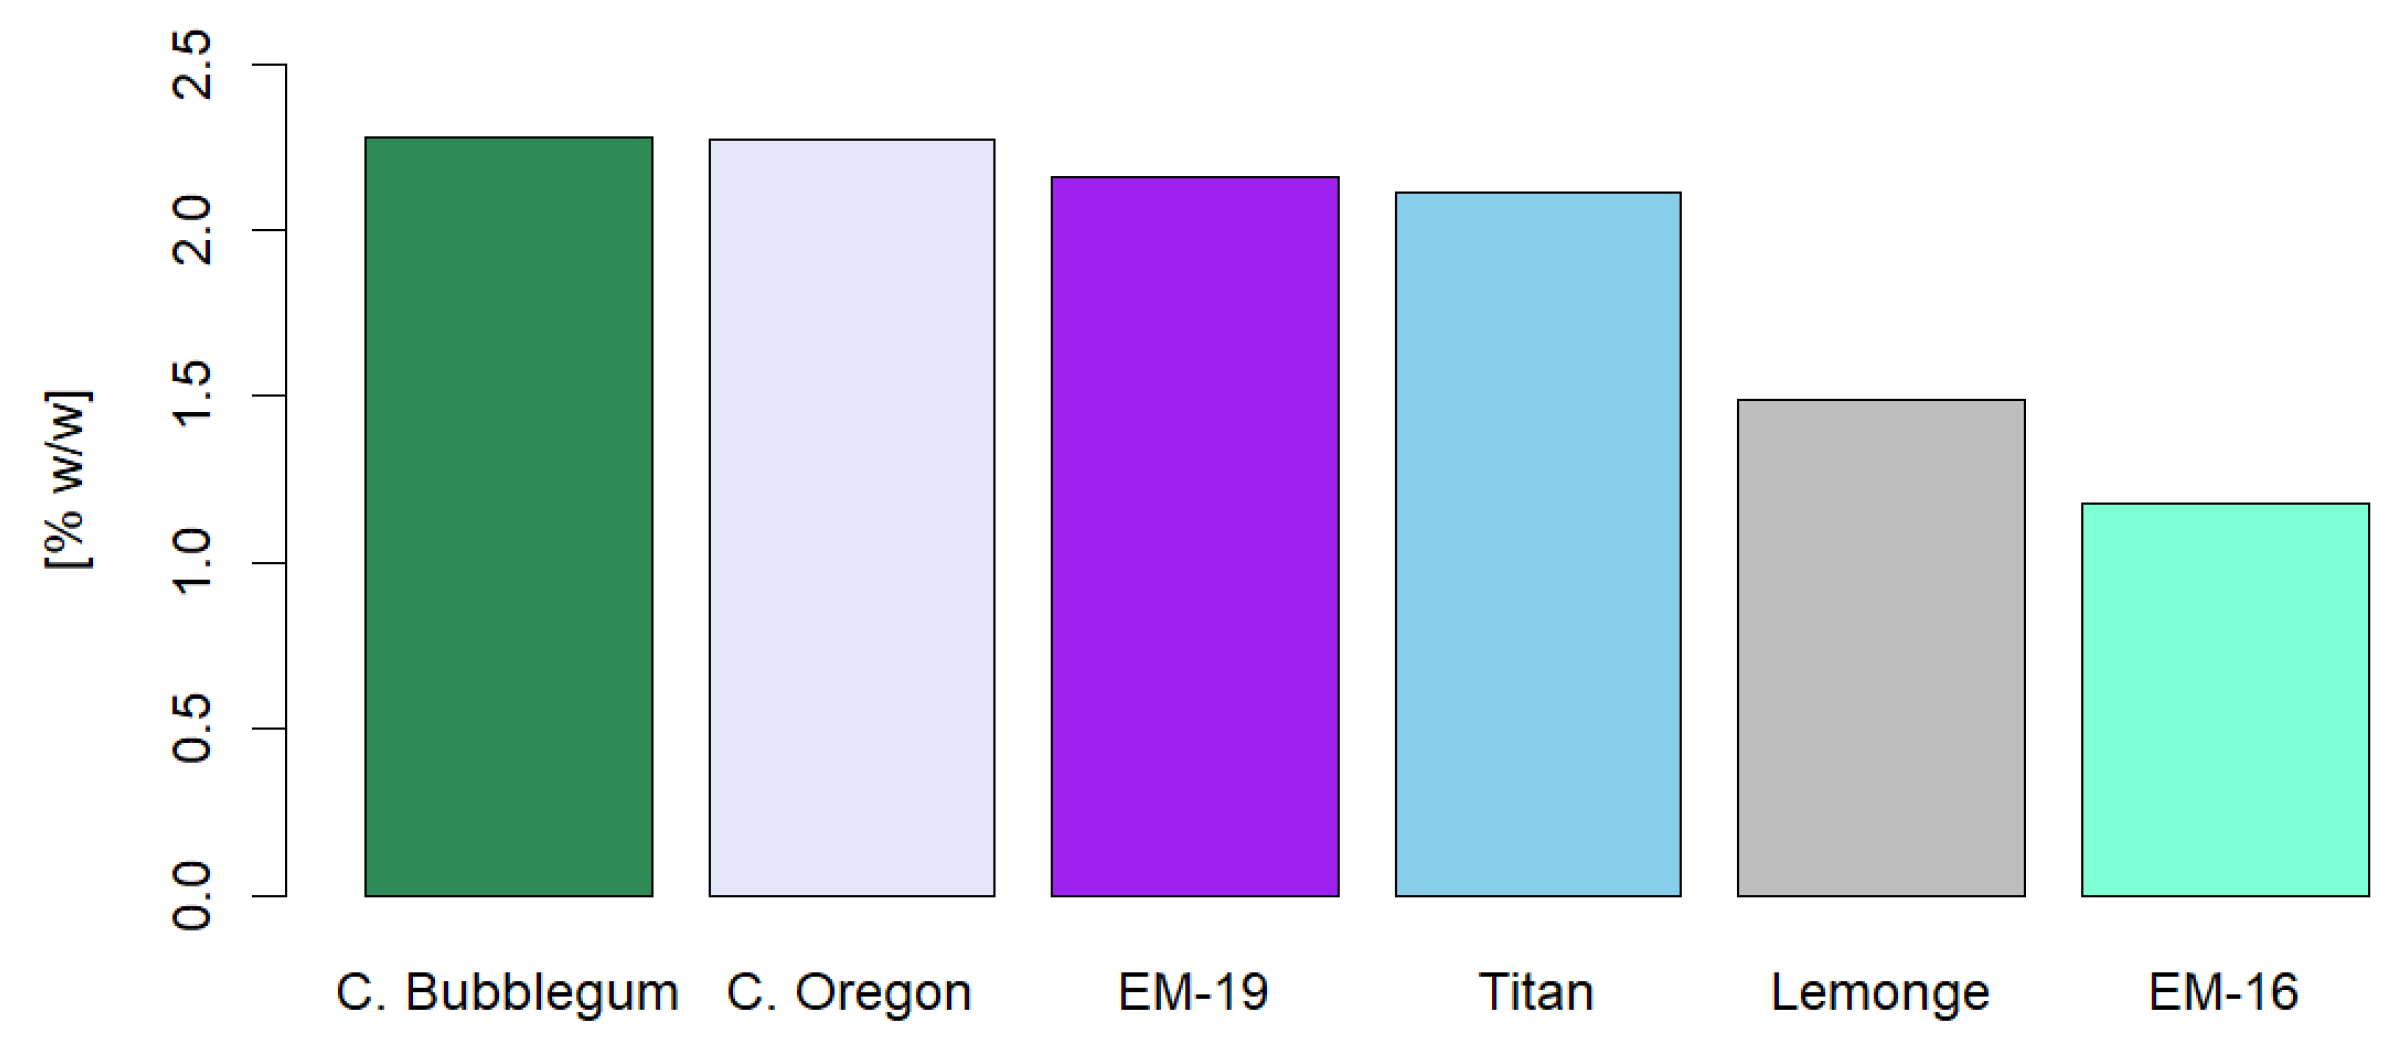
Figure 8 displays the percentage of total flavonoids in the different cannabis varieties studied, with Cherry Bubblegum and Cherry Oregon standing out with concentrations of 2.28% p/p and 2.27% p/p, respectively. Tomko [
55] reported similar values of total flavonoids, indicating that these compounds can represent up to 2.5% of the dry weight in certain parts of the cannabis plant. These results align with the data obtained in our study, supporting the consistency and validity of our measurements in the analyzed cannabis varieties.
Polyphenols are compounds with antioxidant properties that help prevent the oxidation of LDL lipoproteins, as well as the activity of microbial, mutagenic, and inflammatory agents [
56].
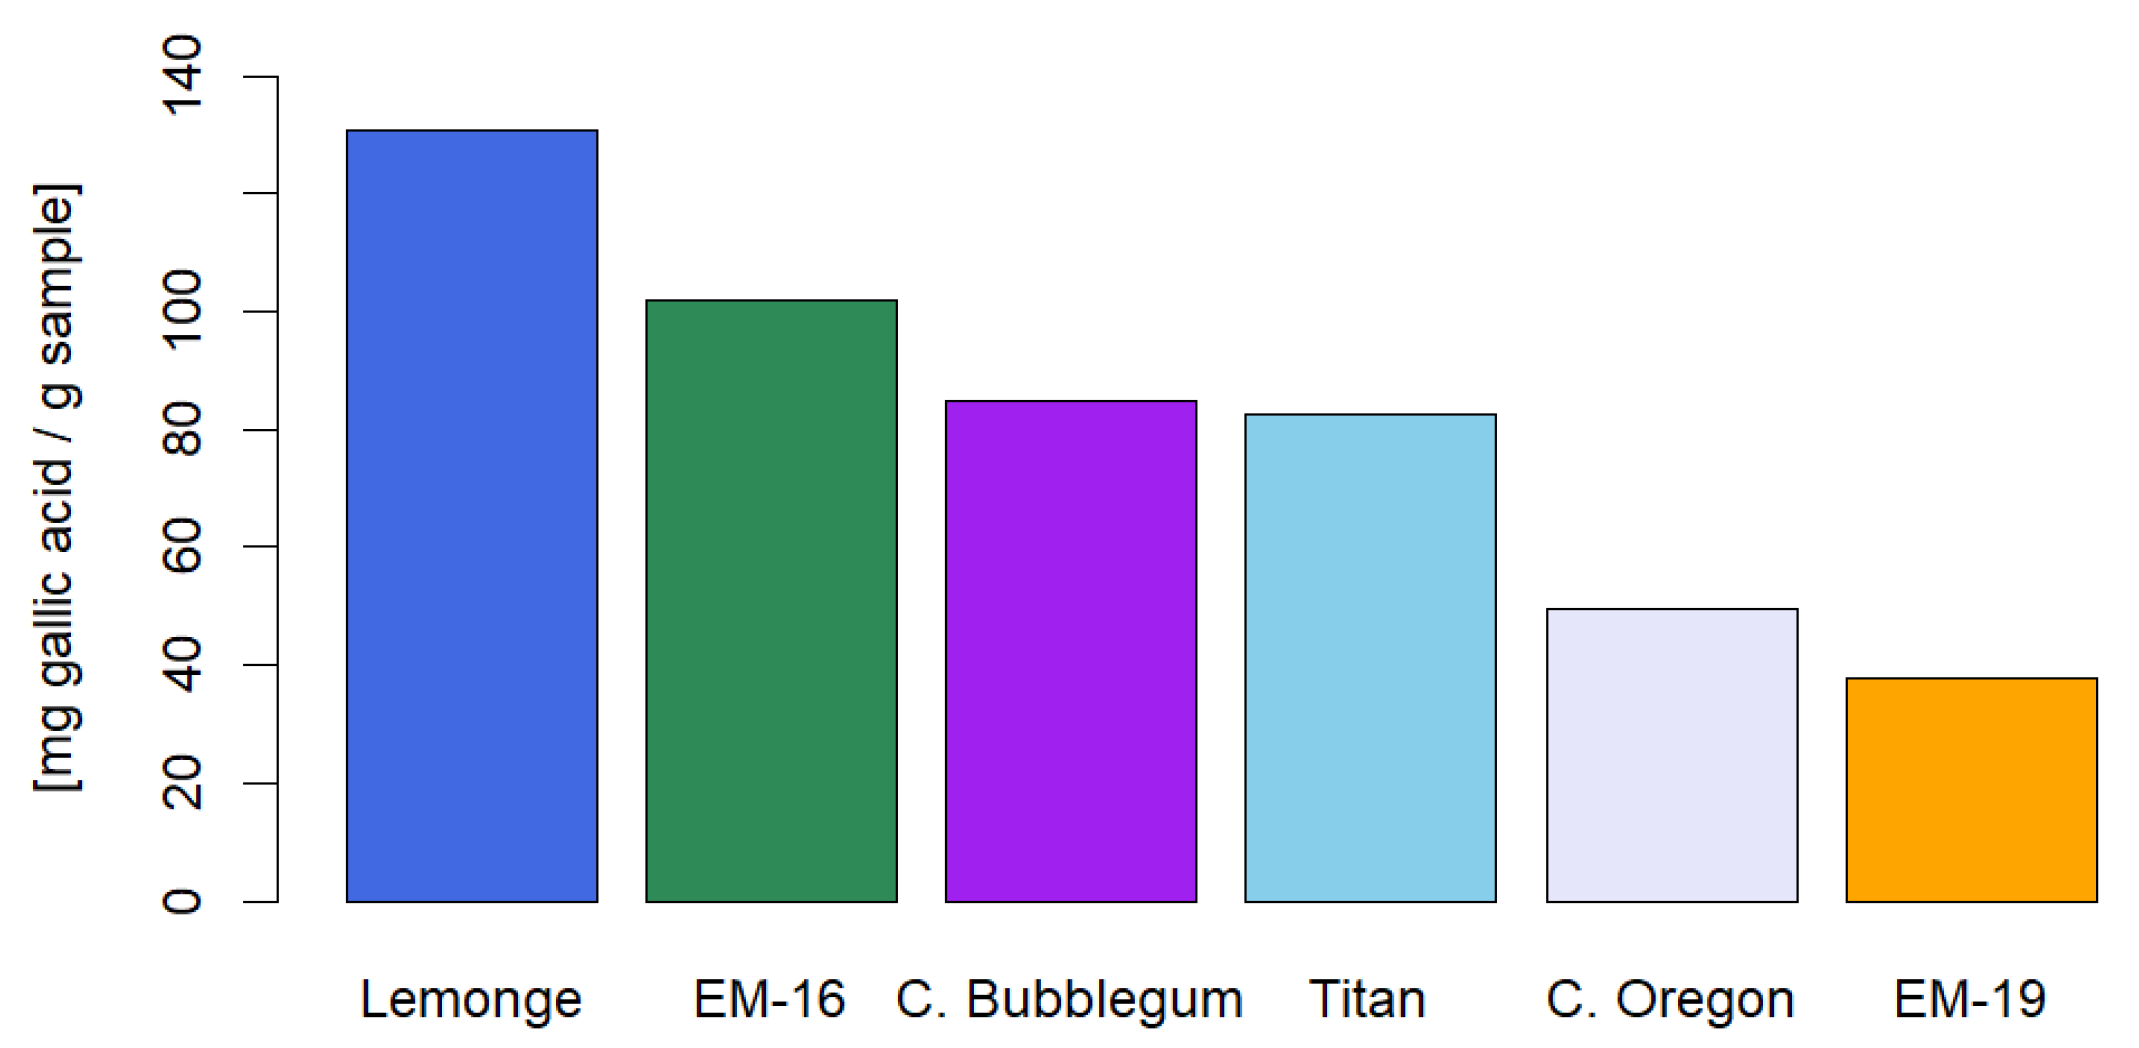
Figure 9 shows the concentration of total polyphenols in different cannabis flower varieties, with Lemonge standing out for having the highest concentration (130.91 mg/g) and EM-19 the lowest (37.97 mg/g). In contrast to the results of Barrientos Ramírez [
52], who studied total polyphenols in wild plant fruits and in
Physalis chenopodifolia Lam, with reported values of 196.46 mg/g and 9.44 mg/g, respectively, this suggests that the concentration of antioxidants in cannabis inflorescences grown in greenhouses can be compared to that of some wild plants. Additionally, Buenrostro-Figueroa [
57] demonstrated that the total polyphenol content in pomegranate peel ranges from 127.67 ± 2.64 mg/g to 189.93 ± 4.40 mg/g, which is similar to the polyphenol content found in the Lemonge variety. On the other hand, Spagnuolo [
68] found a total polyphenol content in hazelnut skin of 70.07 ± 1.38 mg/g. Moreover, Sandru [
69] quantified total polyphenols in plants with potential bioactive properties, reporting values of 1607.73 mg/L in blueberry, 4673.12 mg/L in artichoke, 2667.48 mg/L in mint, 2483.00 mg/L in cranberry, 856.17 mg/L in fennel, and 5975.61 mg/L in wormwood. These data highlight the variability in polyphenol content across different plants and plant parts, underscoring the importance of cultivation methods and environmental conditions.
Tannins are natural chemical compounds present in plants that exhibit antioxidant, antibacterial, and antifungal properties.
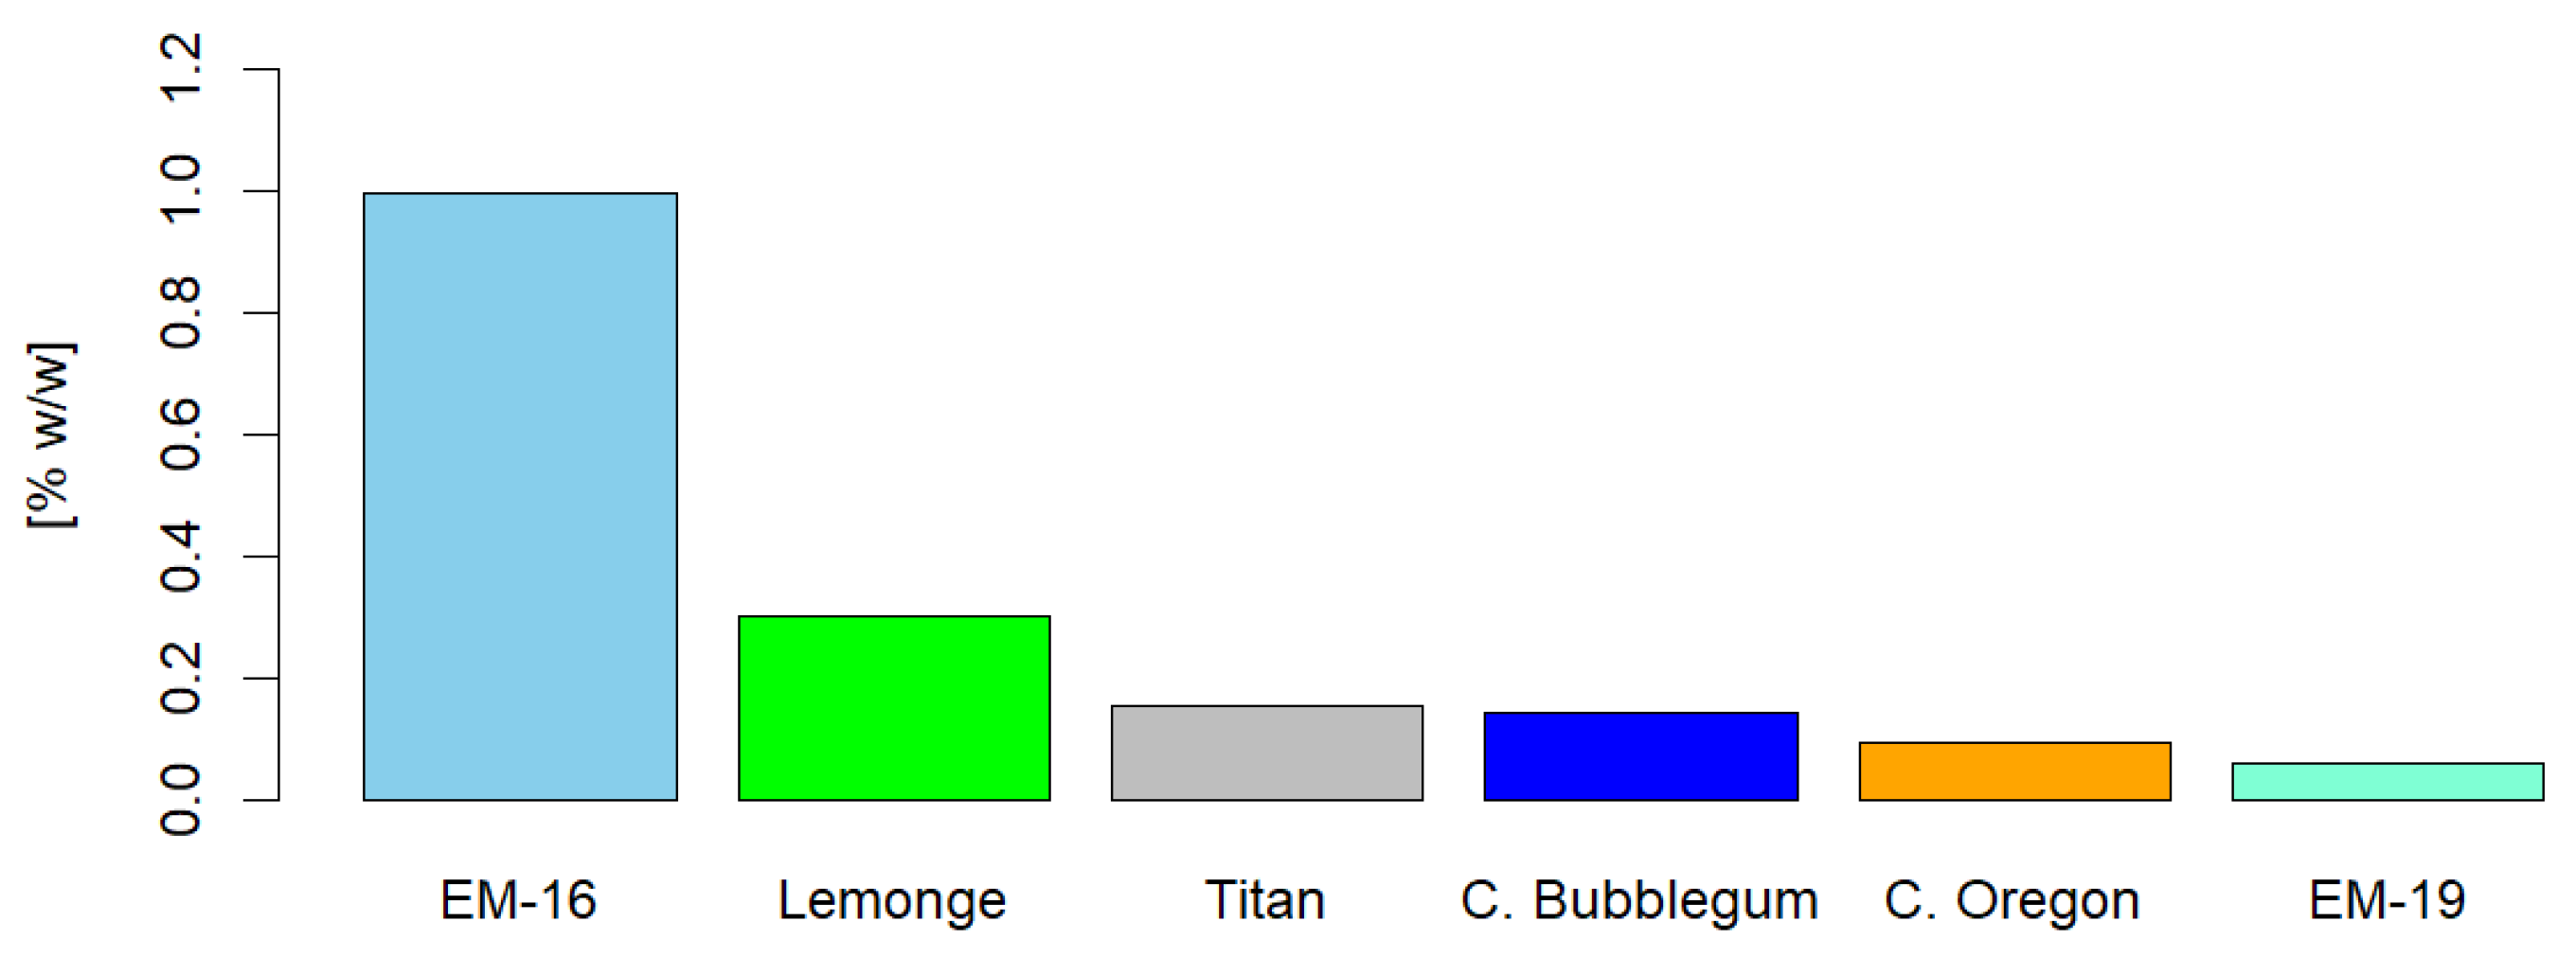
Figure 10 shows that the EM-16 variety has the highest concentration of tannins, at 0.99% p/p. These results are consistent with the findings of Tong [
58], who investigated the biological function of plant tannins in animal health, finding that tannin concentrations of 0.13%, 0.45%, and 2.25% significantly improved feed conversion rates and reduced ammonia concentrations. Additionally, other studies have demonstrated that tannins may exert protective effects against cardiovascular diseases, diabetes, and cancer [
59].
These properties make tannins of great interest in medical and pharmaceutical research, both for their direct health benefits and their potential in developing treatments and dietary supplements with antioxidant and antimicrobial properties.
The EM-19 variety shows the lowest values for total flavonoids, total polyphenols, and tannins; however, it exhibited the highest concentration of Cannaflavin A.
2.5. Microbiological Analysis of Non-Psychoactive Cannabis Inflorescences
Table 7 presents the coding assigned to hemp inflorescence samples for various basic microbiological assays.
Table 8 shows that in the hemp inflorescences, the presence of heterotrophic bacteria exceeds the maximum allowed levels (10
4 CFU/g) established by the NTE INEN 2570 standard, which is used as a reference for requirements applicable to grains and cereals. It is important to note that the samples were analyzed without any prior treatment, so to reduce these bacterial levels, it is necessary to reduce the microorganism content in the inflorescences before using them as raw material for extractions.
The mold count analysis performed on cannabis flower samples does not exceed the limit established by the NTE INEN 2570 standard (102 CFU/g). However, for yeasts, the NTE INEN 2392 standard was used as a reference, which sets a maximum allowable limit of 104 CFU/g. The results indicate that the samples exceed this limit, which could be attributed to improper storage of the raw material, with prolonged exposure to ambient moisture.
Table 8.
Basic microbiological results of non-psychoactive cannabis flowers.
Table 8.
Basic microbiological results of non-psychoactive cannabis flowers.
| Sample |
Heterotrophic bacteria
(UFC/g) |
Escherichia coli
(UFC/g) |
Total coliforms
(UFC/g) |
Molds
(UFC/g) |
Yeasts
(UFC/g) |
| M1 |
2.50 x 10¹⁰
|
7.30 x 10⁷
|
>1.70 x 10¹¹
|
<10 |
1.50 x 10¹⁰
|
| M2 |
1.17 x 10¹⁰
|
<10 |
6.00 x 10¹⁰
|
<10 |
1.80 x 10¹⁰
|
| M3 |
1.50 x 10¹⁰
|
<10 |
5.20 x 10¹⁰
|
<10 |
1.10 x 10¹⁰
|
| M4 |
1.00 x 10⁹
|
<10 |
3.00 x 10⁸
|
<10 |
9.00 x 10⁸
|
| M5 |
8.00 x 10⁹
|
<10 |
4.10 x 10¹⁰
|
<10 |
1.90 x 10¹⁰
|
| M6 |
6.20 x 10⁹
|
<10 |
2.00 x 10¹⁰
|
<10 |
5.90 x 10⁹
|
E. coli is one of the microorganisms that requires special attention due to the severity of the diseases it can cause, such as diarrhea, urinary tract infections, respiratory diseases, and bloodstream infections [
60]. According to the NTE INEN 2392 standard, the maximum allowable limit for E. coli is 10 CFU/g. The analyzed samples comply with this limit, except for the EM-19 flower. This deviation may be due to inadequate sterilization of the equipment used for collection or cross-contamination between the product and the environment.
The Gram staining presented in
Table 9 reveals and quantifies the bacteria present in the flower samples with the highest levels of contamination. The results indicate a higher abundance of Gram-negative bacilli, followed by Gram-positive bacilli, and finally Gram-negative cocci.
On the other hand, the flowers are considered raw material for extractions, where various solvents with antimicrobial properties are used, and different purification methods, such as thermal processes, distillation, and preparative chromatography, are applied. Therefore, it is likely that the resulting extracts will reduce their microbial load to acceptable levels according to current regulations.
2.6. Pesticide Analysis in Non-Psychoactive Cannabis Flowers
Table 10 shows that the results for organochlorines and organophosphates are below the detection limit of the GC equipment, indicating the absence of these compounds in the analyzed samples. These results suggest that the crops were developed organically, without the use of harmful and toxic chemical compounds for human health.
These results demonstrate that the non-psychoactive cannabis flower cultivars are intended for processing for pharmaceutical and food uses, reflecting good agricultural practices and responsible management of organic pesticides and insecticides. Biofumigation, an emerging technique, is gaining popularity as a method to obtain higher quality products with less impact on consumer health [
61].
2.7. Identification of Heavy Metals in Non-Psychoactive Cannabis Flowers
In Ecuador, water contamination is a widespread issue affecting all watercourses due to the discharge of pollutants from various industrial and commercial activities. This phenomenon directly impacts irrigation sources used in the country's agricultural areas, resulting in contamination by nitrates, chlorides, sulfates, and heavy metals. Among these metals, mercury stands out as a contaminant that can also originate from the use of fertilizers and pesticides [
62,
63].
Table 11 indicates that the presence of lead in all cannabis flower samples exceeds the permissible limits established by the reference standard NTE INEN 2392, which sets the maximum lead content at 0.5 mg/kg. This excess may be attributed to the cultivation process, particularly the type of soil and the amount of fertilizers used. In contrast, the presence of arsenic and mercury is well below the maximum levels permitted by FAO (Food and Agriculture Organization) standards, which is positive, as these heavy metals pose significant risks to human health. Regarding cadmium, where the FAO's maximum permissible limit is 0.2 mg/kg, only the Lemonge (2.09 ppm) and Titan (0.60 ppm) samples exceed this limit.
To interpret the data, it is relevant to consider that the Lemonge variety is cultivated on volcanic soils in the Poalo region, Cotopaxi, which could increase the concentration of certain heavy metals in the flowers. Additionally, the irrigation water used may be contaminated by impurities and industrial residues during its course, which also influences contamination levels. In contrast, the Titan variety is grown in Cotogchoa, Pichincha, an area without volcanic soil or evident problems with irrigation water. The cadmium content exceeding 0.4 ppm in this variety may be related to the type of fertilizer used during the vegetative stage, a period when non-psychoactive cannabis plants require more nutrients [
64].
Regarding the heavy metal chromium, only two samples show notable concentrations: the Cherry Oregon variety with 2.60 ppm and the Titan variety with 1.40 ppm.
The presence of heavy metal concentrations exceeding the maximum permitted levels could limit the commercialization of the flower, as it may not be suitable for direct consumption or as a finished product.
2.8. Machine Learning Predictions for Cannabis Flower Yield
The study conducted a multivariate analysis using multiple linear regression, regression trees, and neural networks to evaluate the performance of different extraction methods on non-psychoactive cannabis flowers. It began with descriptive statistics of the data, followed by an ANOVA to compare the means of the extraction methods and determine the influence of each independent variable on yield [
65]. Subsequently, the mean squared error of the predictions generated by the multiple linear regression models, regression trees, and neural networks was compared.
Multiple linear regression (MLR) assesses the relationship between a continuous dependent variable and multiple predictor variables, represented by the equation: Y=Xβ+e [
66]. Regression trees, on the other hand, are algorithms that predict an average value rather than a class and minimize the mean squared error [
66,
67]. Neural networks, inspired by the functioning of the human brain, can perform complex tasks such as voice recognition and image classification [
66,
68].
Using RStudio software, predictions of cannabis flower yield were made for each extraction method.
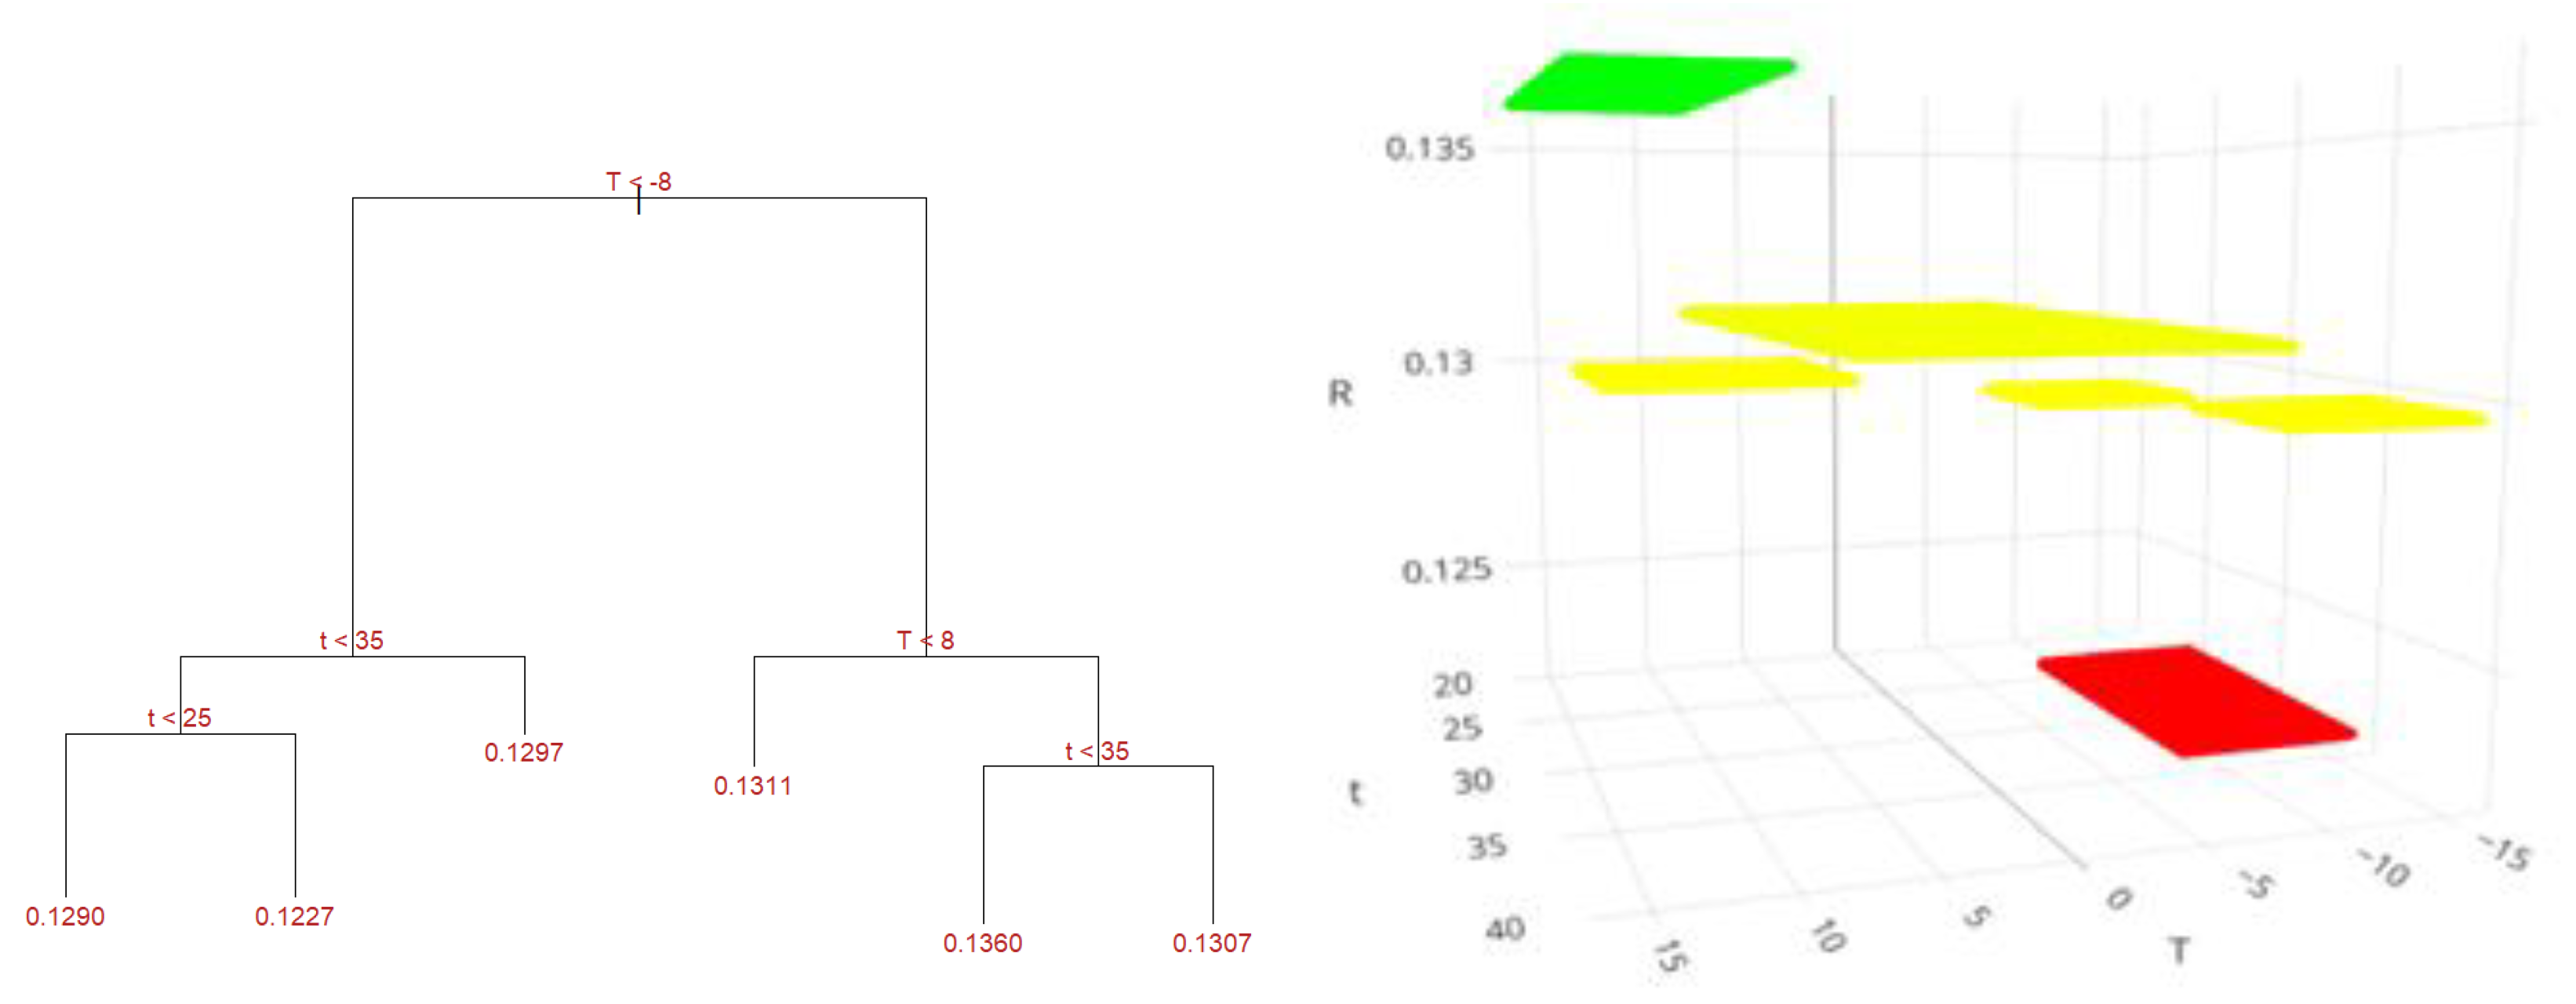
Figure 11 shows the structure of the regression tree for the maceration method. Each branch of the tree illustrates the path to follow based on the conditions and values of the predictor variables: temperature (T) and time (t), to forecast yield (R). When the temperature is below -8°C and the time exceeds 35 minutes, a yield of 12.97% is predicted. For times between 25 and 35 minutes, the estimated yield is 12.27%, and if the time is less than 25 minutes, a yield of 12.90% is anticipated. Conversely, if the temperature is between -8°C and less than 8°C, the predicted yield is 13.11%. For temperatures above 8°C and times less than 35 minutes, the maximum predicted yield is 13.60%. If the temperature is greater than 8°C and the time exceeds 35 minutes, a yield of 13.07% is estimated.
Similarly,
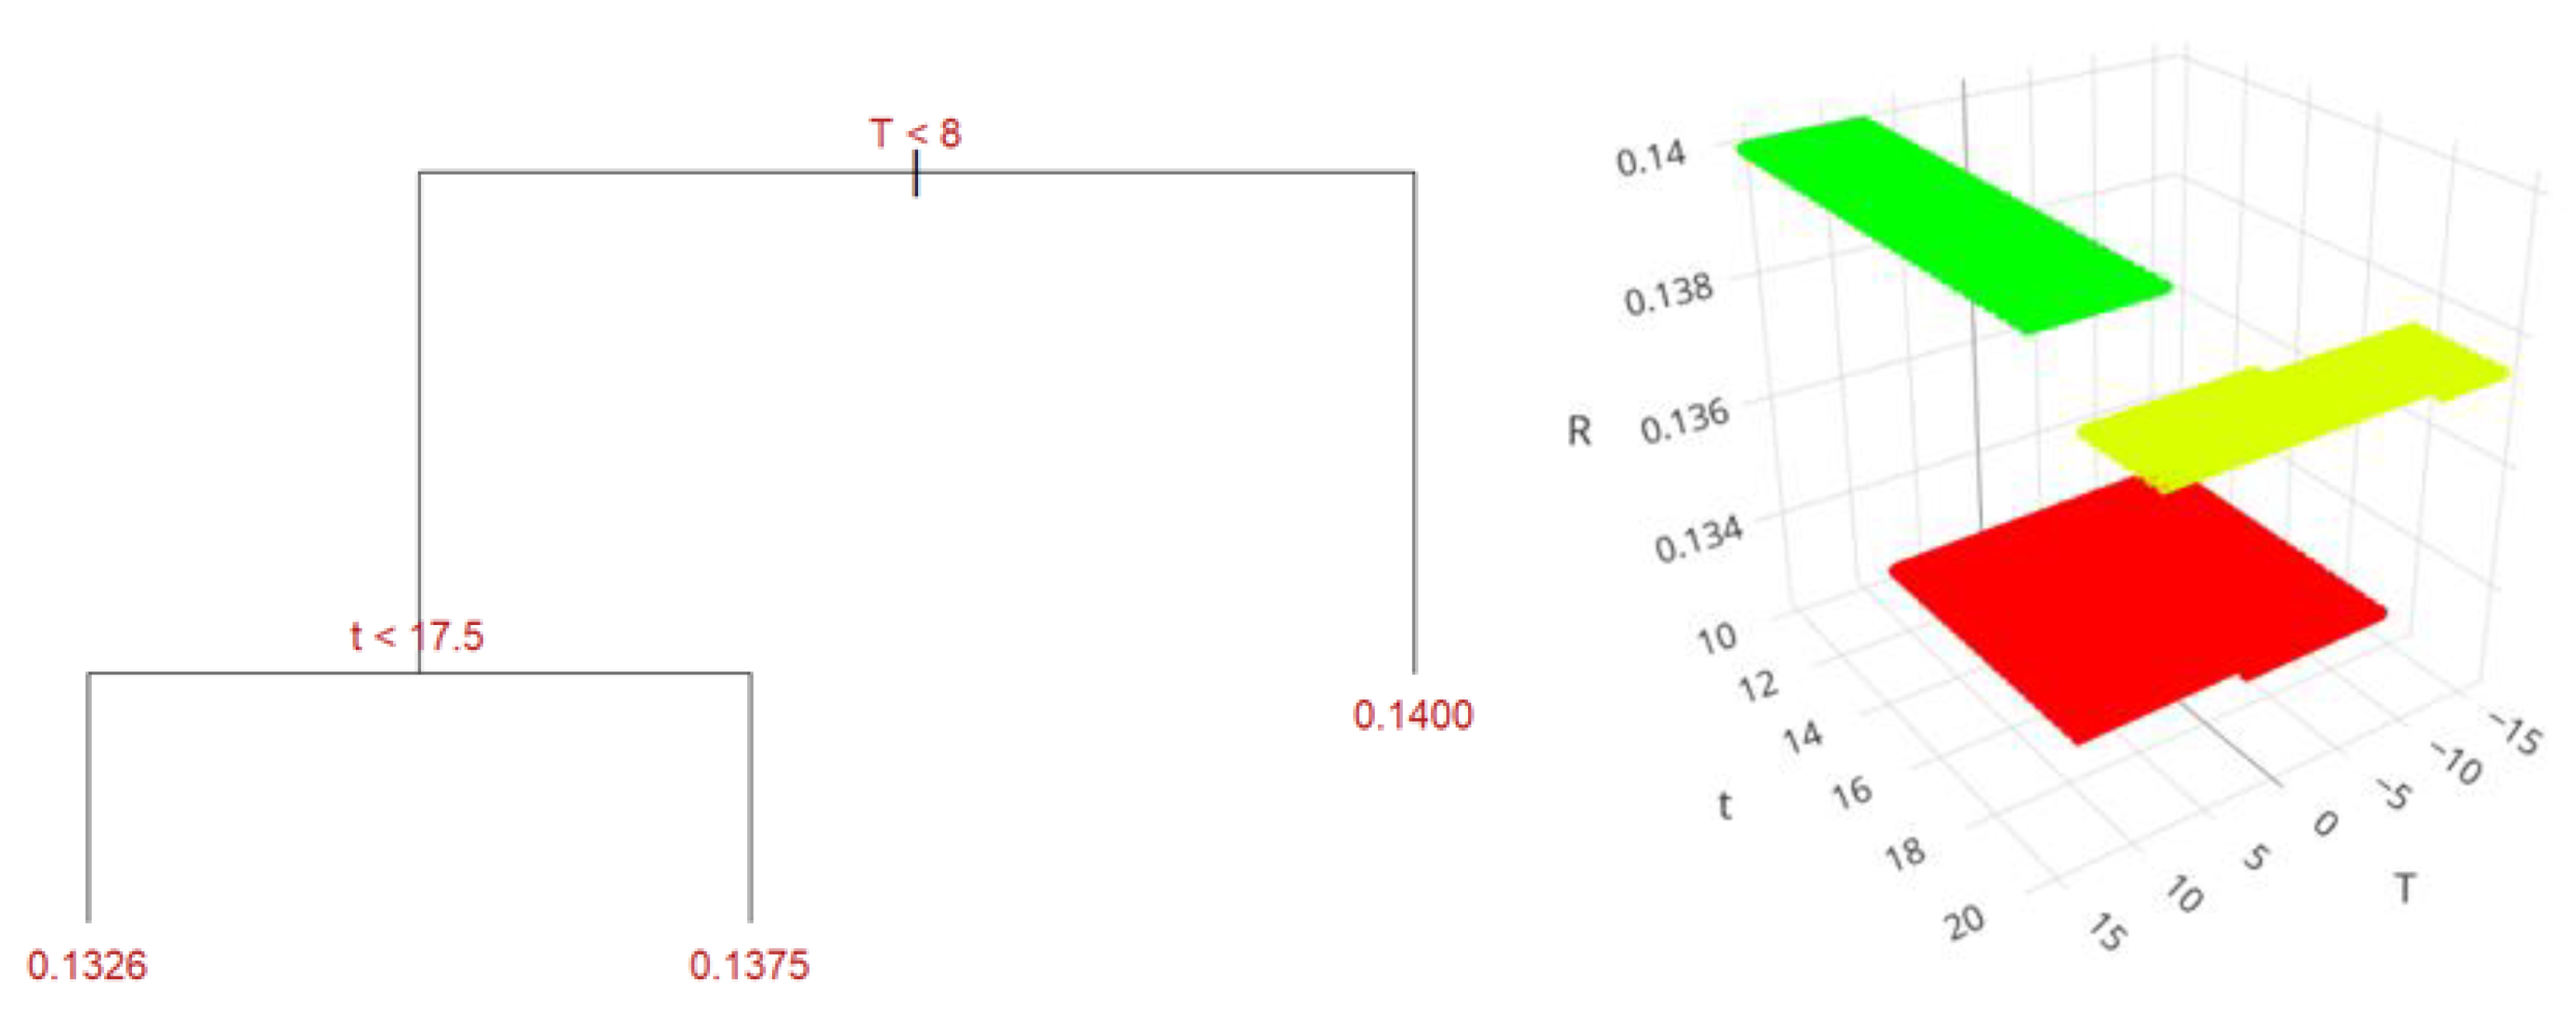
Figure 12 presents the structure of the regression tree for the ultrasound-assisted method. This figure reveals that at temperatures exceeding 7.8 °C (281 K) and times greater than 17.5 minutes, the highest yield of 14% is achieved. When the temperature is below 7.8 °C and the time is less than 17.5 minutes, the estimated yield is 13.26%. If the temperature is below 7.8 °C but the time exceeds 17.5 minutes, the yield is 13.75%.
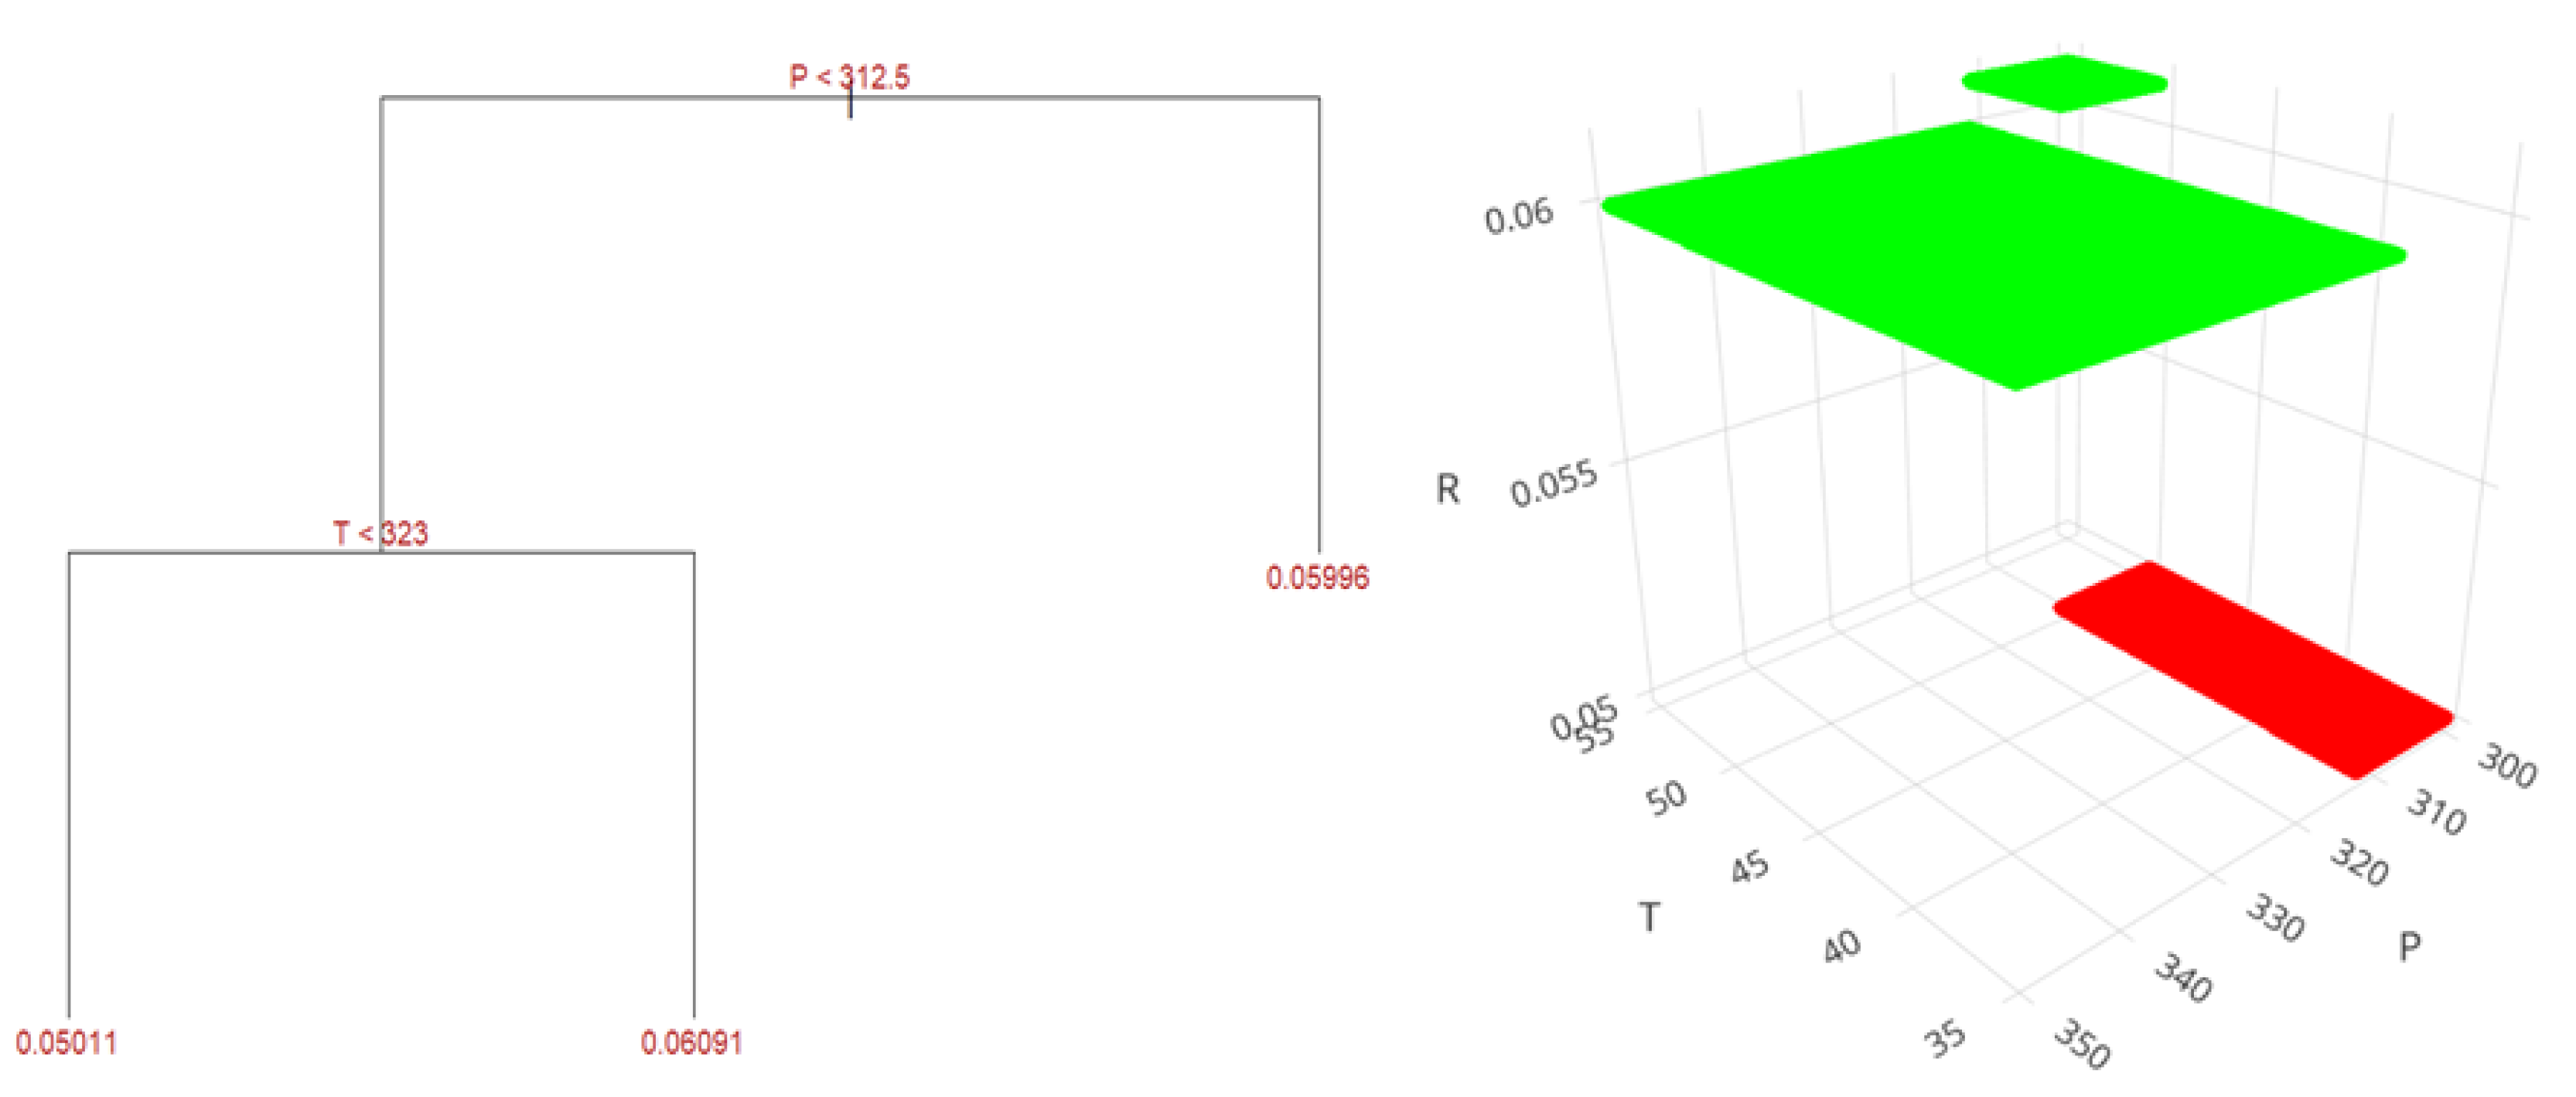
Lastly,
Figure 13 shows the regression tree for the supercritical fluid extraction method. At pressures above 312.5 bar, the yield reaches 5.99%. In contrast, at pressures below 312.5 bar and temperatures lower than 50°C (323 K), the yield decreases to 5.01%. However, when the pressure is below 312.5 bar and the temperature exceeds 50°C, the yield improves to 6.09%, the highest value obtained through predictions and training with experimental data for this method.
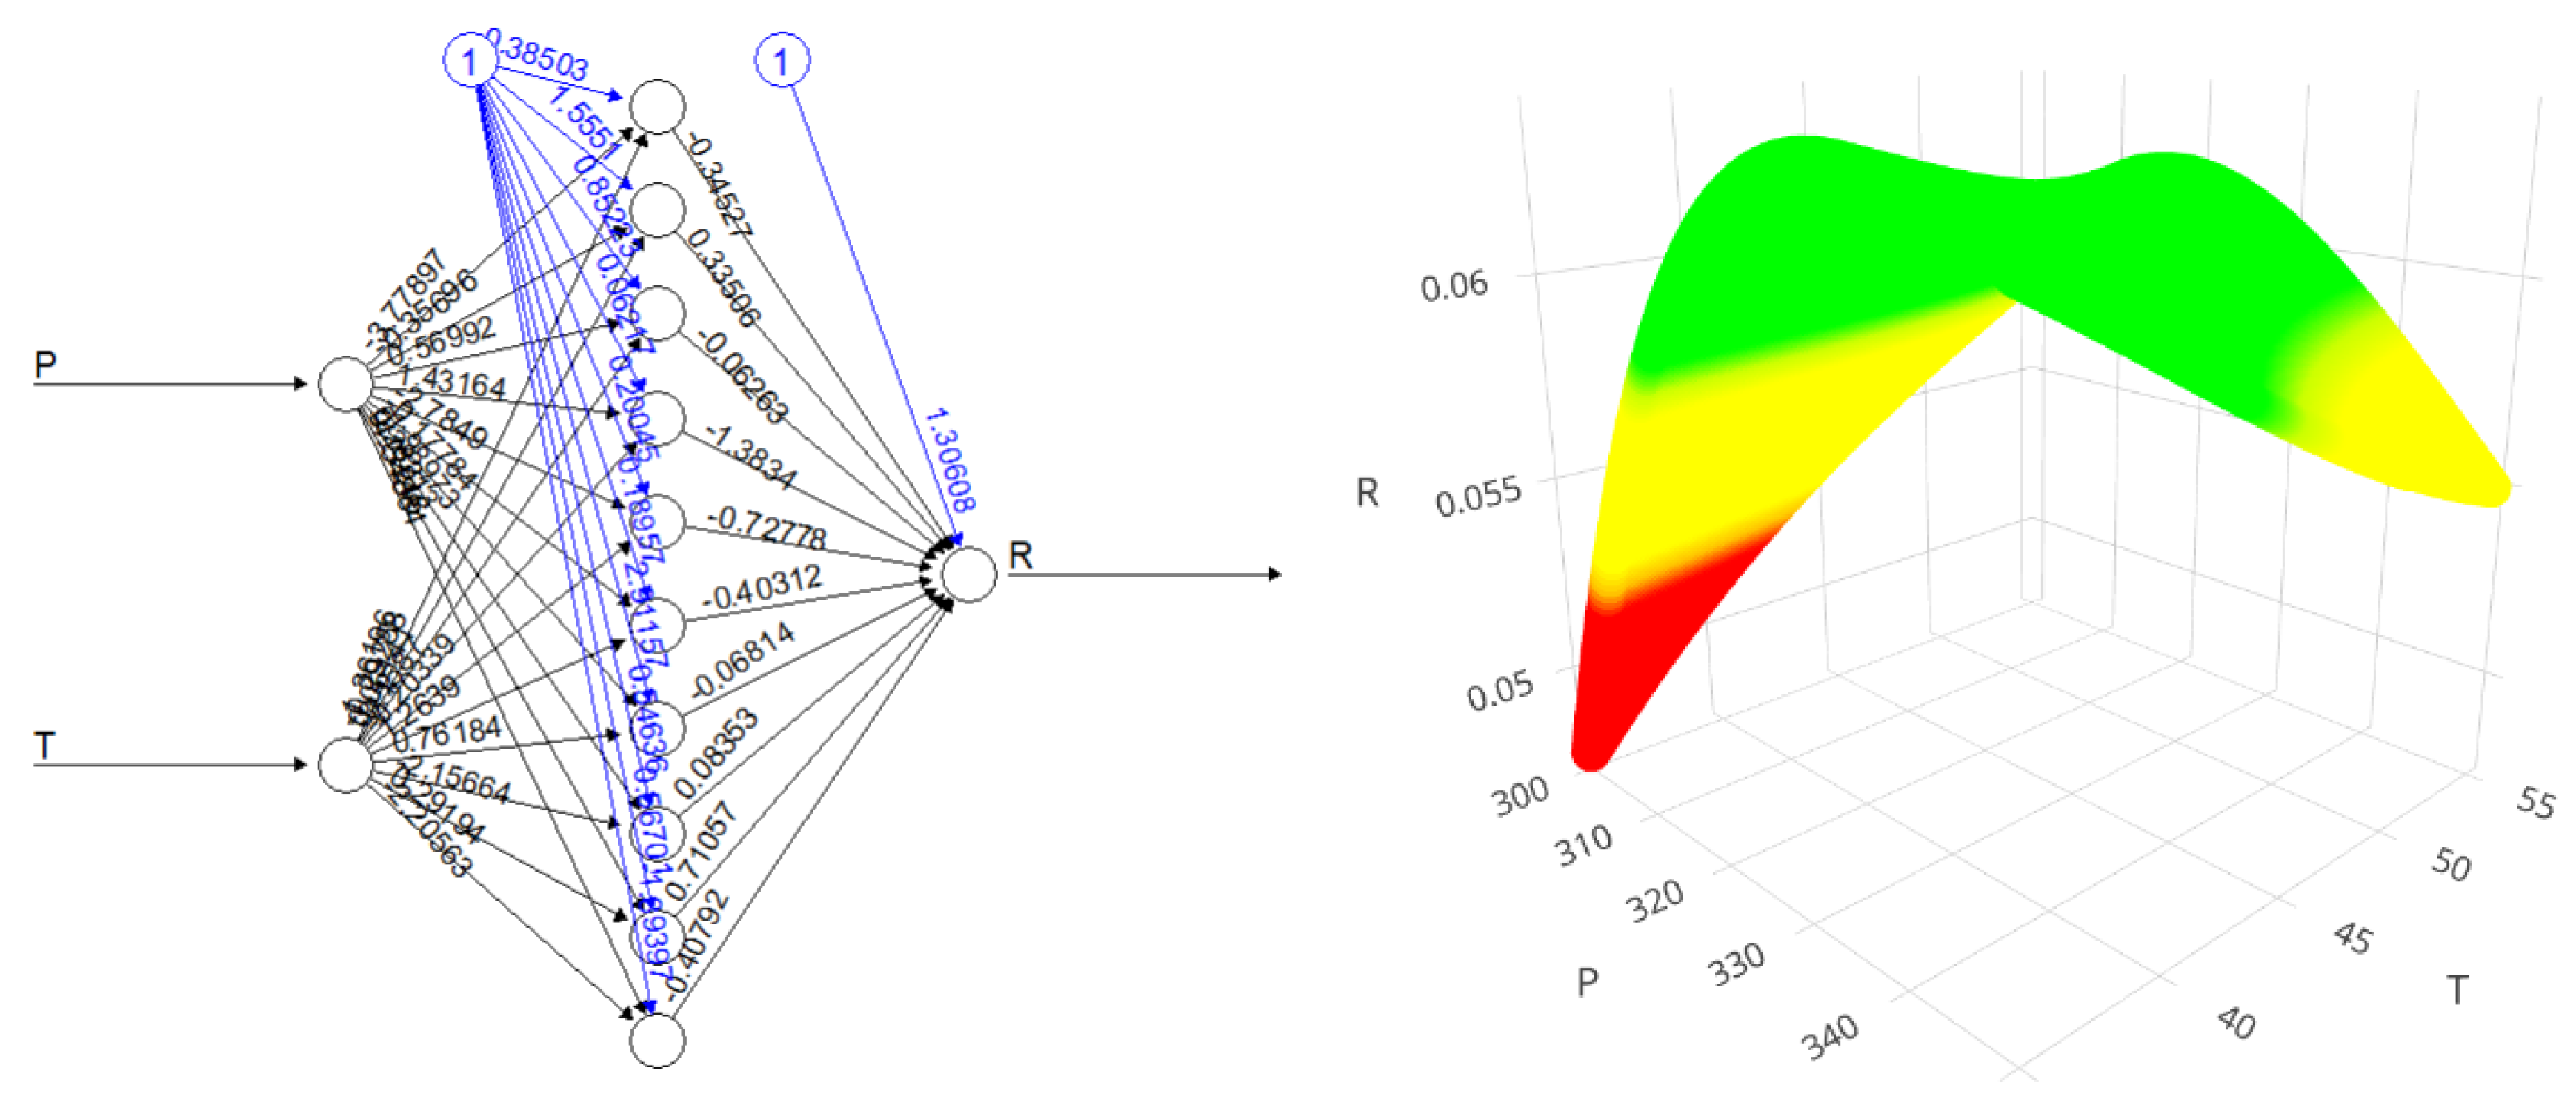
The neural network model with a hidden layer of 10 neurons can be seen below in conjunction with the performance prediction surface, indicating the non-linear behavior of the data for the supercritical fluid extraction method.
Figure 14.
Prediction of the neural network model with a hidden layer of 10 neurons for the supercritical fluid extraction method.
Figure 14.
Prediction of the neural network model with a hidden layer of 10 neurons for the supercritical fluid extraction method.
3. Materials and Methods
3.1. Materials
Cannabis (Cannabis sativa L.) plants were used in this study provided companies authorized for the cultivation and research in Ecuador. Cherry Oregon variety characterized by containing 10.10% CBD and 0.76% THC (CANNANDES S.A., Tabacundo, Ecuador, Latitude: 0°03'25.7"N, Longitude: 78°12'43.4"W) were kindly provided by Mr. Alfredo Lopez; Titan and Cherry Bubblegum varieties with CBD contents of 10.59% and THC of 0.364%, and 13.84% CBD and 0.551% THC, respectively, (CBD SOLUTIONS S.A.S., Cotogchoa, Ecuador, Latitude: 0°22'47.3"S, Longitude: 78°27'31.0"W) were kindly provide by Mr. Hector Mora; Lemonge variety with a cannabinoid profile of 17% CBG and 0.1% THC (PHOENICIAN FARMS S.A.S., Poaló, Ecuador, Latitude: 0°52'54.8"S, Longitude: 78°41'17.0"W) were kindly provide by Mr. Khoueiry Michel; Medicinal Emerald 16 (EM16) and Medicinal Emerald 19 (EM19) varieties with concentrations of 16.78% CBD and 0.55% THC, and 15% CBG and 0.1% THC, respectively, (AITANA S.A.S., San Antonio de Pichincha, Latitude: 0°00'38.1"N, Longitude: 78°27'40.6"W) were kindly provide by Mr. Hugo Solís.
Each sample was handled under controlled conditions (humidity: 40 -55%; temperature: 18 – 22°C) to preserve the integrity of its phytochemical compounds, ensuring representativeness and accuracy in subsequent analyses.
Table 12.
Companies Climatologic Conditions Cultivating Non-Psychoactive Cannabis Flowers in Ecuador.
Table 12.
Companies Climatologic Conditions Cultivating Non-Psychoactive Cannabis Flowers in Ecuador.
| Variety |
Location |
Tmax, °C |
Tavg annual, °C |
Tmin, °C |
RH avg annual, % |
Evapotranspiration, mm/year |
Altitude, m.a.s.l. |
Precipitation, mm/year |
| Cherry Oregon |
Tabacundo |
20 |
13-14 |
11 |
82 |
600-650 |
2800 |
900-1000 |
| Cherry Bubblegum |
Cotogchoa |
21 |
14-15 |
12 |
86 |
650-700 |
2614 |
1700-1800 |
| Titan |
Cotogchoa |
21 |
14-15 |
12 |
86 |
650-700 |
2614 |
1700-1800 |
| Lemonge |
Poaló |
18 |
13-14 |
9 |
82 |
650-700 |
2968 |
500-600 |
| Medicinal Emerald 16 (EM16) |
San Antonio de Pichincha |
27 |
15-16 |
6 |
73 |
700-750 |
2577 |
500-600 |
| Medicinal Emerald 19 (EM19) |
San Antonio de Pichincha |
27 |
15-16 |
6 |
73 |
700-750 |
2577 |
500-600 |
The study employed Milli-Q water, ACS reagent-grade solvents, and ultra-pure gases at various experimental stages. For the identification and quantification of compounds, standard cannabinoids including CBD, THC, CBG, and CBN were used, as well as a terpene kit Mix A containing β-myrcene, (R)-(+)-limonene, β-caryophyllene, (-)-linalool, and naphthalene, all supplied by Sigma Aldrich. Cannaflavin standards, specifically cannflavins A and B, were obtained from LGC Standards. Analysis for heavy metals employed atomic absorption with Standards from Inorganic Ventures.
3.2. Methods
To evaluate the optimal extraction yields and chemically characterize the obtained extracts, three different extraction methods were tested by triplicate: supercritical fluid extraction (SFE), solid-liquid extraction (SLE), and ultrasound-assisted extraction (UAE). In each method, 5 grams of non-psychoactive cannabis flower with a particle size of less than 2 mm were used. Upon completion of the extraction, the extracts were vacuum-filtered and stored in Petri dishes. Subsequently, they were subjected to a two-stage thermal treatment: first, in an oven at 75°C for 1 hour, followed by a temperature increase to 120°C for 20 minutes to complete the decarboxylation phase [
69]. Finally, the extracts were refrigerated until further analysis. The specific procedures for each extraction method are detailed below.
3.2.1. Phytocannabinoid Extraction Using Supercritical Fluid
This extraction (SFE) follows the methodology detailed by Rochfort [
70], with modifications tailored to the characteristics of cannabis flowers. The system employed was the SPE-ED SFE from Applied Separations, configured by the predefined experimental variables. Initially, we placed the cannabis flower samples into the extraction chamber, then we opened a carbon dioxide (CO₂) bottle (with a purity of 99.9%), controlling the potential gas leaks within the system. The oven heaters and outlet valve set the required temperatures of each test to 35, 45, and 55°C. Once the system achieves temperature stability, the pump introduces CO₂ into the extraction chamber to reach desired pressure conditions ranging from 300 to 350 bars. After stabilizing both temperature and pressure, a static extraction period of 30 minutes took place, followed by a dynamic extraction phase of 60 minutes, maintaining a constant solvent flow rate of 5 L/min. Concurrently with the initiation of the dynamic extraction, a vial was positioned at the outlet valve to collect the extract. Upon completion of the extraction process, all valves were closed, and we carefully removed the vial containing the obtained extract.
3.2.2. Solid-Liquid Extraction (Maceration)
The solid-liquid extraction process, specifically maceration, was performed following the methodology outlined by Valizadehderakhshan [
37], with modifications to the solvent temperature parameters. We placed a previously grinned sample into a 100 ml Erlenmeyer flask. A laboratory-grade cooling system controlled the low-temperature maceration and maintained optimal solvent extraction conditions. Then, using a universal stand, we fitted the Erlenmeyer flask sample to the maceration system's chamber, ensuring it was not fully submerged. Anhydrous ethanol was added to the flask in volumes of 30 ml at temperatures of -16, 0, and 16°C, and extraction times corresponded to 20, 30, and 40 minutes considering the initial contact between solvent and sample. Once the extraction finished, we carried out vacuum filtration to separate the solvent from the sample through vacuum distillation. Then, we recover the solvent from the extract using a rotary evaporator. Finally, the extract was placed on a Petri dish and underwent thermal treatment in an oven at 75°C for 1 hour, followed by a temperature increase to 120°C for 20 minutes to finalize the decarboxylation phase.
3.2.3. Ultrasonic-Assisted Extraction
The extraction procedure employs an ultrasonic bath unit, with modifications involving replacing water in the equipment's reservoir with ethanol (96% v/v) at various temperatures (-16, 0, and 16°C), selected based on the results from Addo et al. [
71], which demonstrated efficient extraction within the temperature range of -40°C to ambient conditions. Initially, we placed 5 grams of non-psychoactive cannabis flower into an Erlenmeyer flask. Then, we set up the cooling circulation system, employing ethanol as the refrigerant, from the reservoir to the ultrasonic bath tank. After that, the Erlenmeyer flask containing the sample was positioned in the equipment's reservoir, supported by a universal stand and clamp to maintain a constant temperature throughout the extraction process. Finally, we added 30 ml of anhydrous ethanol at temperatures of -16, 0, and 16°C to the Erlenmeyer and triggered the ultrasonic bath for the specified extraction times of 10, 15, and 20 minutes.
3.2.4. Analytical Methods for Tannins, Total Flavonoids, and Total Polyphenols
Employing an Agilent Cary 60 UV-Vis spectrophotometer, we analyzed the presence of the tannins, total flavonoids, and total polyphenols. Tannin analysis followed the methodology described by Herrera-Fuentes [
72] with specific modifications. The sample preparation consisted of weighing 10 grams of ground cannabis flower, mixing it with 500 ml of 50% (v/v) ethanol, and stirring the blend for 6 hours. The outcome needed an 8-hour rest before filtration.
Filtration requires a previous dilution of 3 ml sample in 50 ml distilled water. A standard solution consists of tannic acid at a concentration of 0.05 mg/ml, and the solution's absorbance corresponded to a wavelength of 700 nm.
The total flavonoid analysis followed the protocol by Ortíz [
73]. This procedure established a mix preparation of 0.5 grams of grinded cannabis flower, 20 ml of sulfuric acid, and 20 ml of ethanol. This mix requires a refluxed for 2 hours followed by a vacuum filtration. Then, we washed the residue with 30 ml of 96% (v/v) ethanol, evaporated the filtrate to reduce its volume by half, and dissolved it in 70 ml of 96% (v/v) ethanol (previously heated to 50°C). This solution requires boiling, volume adjusting to 100ml with 96% (v/v) ethanol, and storing at 4°C. Meanwhile, we prepared a quercetin dissolved in ethanol at a 0.8 mg/ml concentration as a standard solution, and we determined the flavonoid concentration in the samples at a wavelength of 258 nm.
To determine total polyphenols, we relied on the methodology described by García [
74]. This method suggests departing from a mix of 1 gram of grinded flowers in 75 ml of 70% v/v methanol stirred for 45 minutes. Subsequently, we filtered the extract and adjusted the volume to 100 ml with methanol of the same concentration. Then, 1 ml of this dilution was mixed with 6 ml of distilled water and 1 ml of Folin & Ciocalteu reagent, allowing the mixture to rest for 3 minutes. Finally, we added 2 ml of a sodium carbonate solution. The standard preparation replicates the previous procedure, including the reaction and dilution step. The calibration employs gallic acid standard solutions with concentrations ranging from 5 to 200 µg/ml, obtaining correlation coefficients (R²) equal to or greater than 0.998 (
Figure S1).
3.2.5. Cannabinoids and Cannaflavins
Quantification and identification of cannabinoids (CBD, THC, CBG, CBN) and flavonoids (cannaflavin A and cannaflavin B) employed an Agilent Infinity 1290 HPLC system equipped with a diode array detector, following AOAC 2018.11 guidelines for sample analysis and preparation [
75,
76]. Thus, 0.50 ± 0.01 g of sample was mixed with 20 ml of ethanol during 20 min at 250 rpm. Supernatant was centrifuged and separated from ethanol and new solvent was added to repeat the extraction twice. A 3 ml aliquot was filtered (PTFE, 0.22 µm) and 10 fold or 100 fold (as needed to fit into the calibration curve) diluted with methanol. The final dilution was transferred to a HPLC vial and analyzed as described further. The column is a Teknokroma Mediterranean SEA18 column (3 µm, 10 x 0.4 mm) with a temperature of 25°C. The mobile phase consisted of an ammonium formate gradient (20 mM, pH 3.2) as phase A and acetonitrile as phase B, adjusted according to the conditions specified in
Table 13. Standard solution concentrations correspond to 5 µg/ml and detection wavelengths of 240 nm for cannabinoids and 340 nm for cannaflavins. Calibration curves were generated by injecting varying volumes of standard solutions, ranging from 5 to 40 µl, achieving correlation coefficients (R²) equal to or greater than 0.998 and acceptable limits of detection and quantification (
Figures S2-S7).
3.2.6. Terpenes
Terpenes were analyzed using a gas chromatograph (Agilent Technologies 7820A-5977E) with electron impact (EI) ionization at 70 eV and an HP-5 column (30 m x 320 μm x 0.25 μm). The experimental parameters included a sample injection volume of 1 μL, helium as the carrier gas at 2.43 psig, and a 1.5 ml/min flow rate. The inlet temperature corresponds to 220°C, the transfer line to 280°C, the quadrupole at 150°C, and the ion source to 230°C. The acquisition mode "Scan" functions in the range of 25 to 250 amu, with a split ratio of 1:1. The oven program consisted of a series of temperature ramps: 60°C for 1 minute, followed by an increase to 80°C at a rate of 15°C/min with a 1-minute hold, then to 100°C at a rate of 10°C/min for 3.5 minutes, and finally to 180°C at a rate of 10°C/min for 18 minutes. Compound identification compared the obtained mass spectra with the NIST database using ChemStation software.
For sample preparation, we mixed 0.05 g of flower (dried and grinded) with 5 ml of methanol and sonicated the mixture for 10 minutes in a closed vial. The sample rested in the dark at room temperature for 1 hour to be filtered using Titan 3 PVDF with a 0.45 mm pore size. Finally, we dissolved 1 ml of the filtrate in GC vials with 20 μl of an internal standard solution (16 μg/ml of naphthalene dissolved in cyclohexane).
The standard concentrations ranged from 1.6 µg/ml to 9.6 µg/ml, diluting the terpene with methanol. Calibration curves showed correlation coefficients (R²) equal to or greater than 0.977 and acceptable limits of detection and quantification (
Figures S8-S29). In cases where a detected terpene was unavailable in the calibration terpene mix or as a single terpene standard, we calculate an approximate concentration, assuming it exhibited the same response factor as a nearby terpene with an appropriate calibration curve [
77].
3.2.7. Heavy Metals
Perkin Elmer Analyst 400 atomic absorption spectrometer with a Milestone Ethos Up high-performance digestion system determined the concentration of heavy metals. For the analysis of lead and cadmium, mercury, and chromium, we followed the method AOAC 999.10 [
78], AOAC 2015.01 [
79], and the EPA 6020 standard [
80], respectively. The samples were analyzed by the external laboratory OSP with SAE LEN 04-002 accreditation.
3.2.8. Pesticides
Organophosphorus and organochlorine pesticides were applied according to the methods outlined in AOAC 2007.01, EPA 8081 B, APHA 6630 B, and EPA 8141 B standards [
81,
82,
83,
84]. The samples were analyzed by the external laboratory LASA with SAE LEN 06-002 accreditation.
3.2.9. Microbiological Testing
The mesophilic aerobic bacterial count employed the plate count method specified in ISO 7218:2024/Amd 1:2013 [
85]. For fecal coliforms and E. coli, the standard AOAC 110402 method was used [
86]. Mold and yeast counting followed the plate count method according to ISO 21527-2:2008 [
87]. Each analysis was performed ensuring that control and blank samples pass successfully the quality standards.
4. Conclusions
The conclusions of this study highlight the efficacy and specificity of different extraction methods applied to non-psychoactive cannabis varieties cultivated in Ecuador, based on various operational and compositional parameters.
Among the methods evaluated, ultrasound extraction was found to be the most efficient in terms of full-spectrum extract yield, achieving an average of 17.44% w/w ± 0.19% at a temperature of 16 °C and 10 minutes of extraction for the Titan variety, making it a promising option for industrial-scale applications.
Regarding the optimization of conditions for the different extraction methods, it was identified that the best conditions for maceration were 16 °C and 20 minutes; for the ultrasound method, 16 °C and 10 minutes; and for the supercritical fluid method, there are two conditions depending on the type of cannabinoid extracted. The first condition is 325 bar and 45 °C for CBD, THC, and CBN, and the second is 300 bar and 35 °C for CBG. Specifically, the supercritical fluid extraction method proved to be superior in the amount of cannabinoids obtained, achieving 44.65% ± 4.06% CBD in the Cherry Oregon variety and 6.32% ± 0.36% THC in the Titan variety under conditions of 45 °C and 325 bar. This method not only provides extracts free of solvent traces but also optimizes cannabinoid concentration, making it ideal for applications in the food and pharmaceutical industries.
Additionally, the terpene analysis showed that the highest concentration of these compounds was obtained using the supercritical fluid method in the Cherry Bubblegum variety, with notable values for β-caryophyllene (320.79 ppm), humulene (73.84 ppm), bisabolol (143.57 ppm), myrcene (42.17 ppm), and nerolidol (37.35 ppm). This terpene profile underscores the potential of non-psychoactive cannabis as a rich and diverse source of bioactive compounds for human consumption.
For cannaflavins, the EM-19 variety presents the highest concentration of cannaflavin A in all extraction methods, reaching a maximum yield of 0.32% w/w through maceration extraction. On the other hand, cannaflavin B is found in higher concentration in the Cherry Bubblegum variety, with a maximum value of 0.11% w/w, also obtained through maceration.
The variability in the concentration of total polyphenols, total flavonoids, and tannins among the different varieties indicates a strong genetic influence on the production of these secondary metabolites. The varieties Lemonge, Cherry Bubblegum, and EM-16 presented the highest concentrations of total polyphenols (130.91 mg/g), total flavonoids (2.28% w/w), and tannins (0.99% w/w), respectively. In addition to genetics, environmental factors such as altitude, temperature, humidity, soil type, and the quality of irrigation water in Ecuador appear to influence the chemical composition of cultivated cannabis, as evidenced by the increased cannabinoids compared to the commercial technical data sheets of the flowers studied.
The pesticide analysis showed favorable results, suggesting proper management with organic fertilizers. However, microbiological analyses revealed that, although the raw flower material exceeds some microbiological criteria, these contaminants do not transfer to the final extracts due to the solvents and extraction processes used, which could reduce the microbial load.
Finally, it was observed that the concentrations of heavy metals in the cultivated cannabis flowers exceed the permissible limits for lead, cadmium, and chromium in several varieties, raising concerns about human health safety. Particularly, the Titan, Cherry Oregon, and Lemonge varieties showed concerning levels of Cd and Cr. To mitigate these risks, it is recommended to implement effective irrigation water treatment using ion exchange systems to remove heavy metals, apply soil bioremediation techniques such as hemp planting for metal phytoremediation, and rigorously control the substrate used for cultivation, complemented with the use of organic fertilizers.
For the study of predictions using machine learning of the flower yield obtained by different extraction methods, the most relevant results indicate that, in the maceration method, a maximum yield of 13.60% is achieved at temperatures above 8°C and times less than 35 minutes. In the ultrasound-assisted method, the highest yield of 14% is obtained at temperatures above 7.8°C and times greater than 17.5 minutes. For supercritical fluid extraction, a maximum yield of 6.09% is achieved at pressures below 312.5 bar and temperatures above 50°C. The multivariate analysis reveals that temperature, time, and pressure are determining factors for maximizing extraction yields in each method. The use of machine learning models provides a deep understanding of the interactions between operational variables, allowing the optimization of process conditions to improve extraction efficiency. These findings are fundamental for industrial applications, where maximizing the extraction of bioactive compounds is key to the efficient and cost-effective production of non-psychoactive cannabis-derived products.
In conclusion, this study provides a detailed understanding of the factors influencing the yield and quality of non-psychoactive cannabis flower extracts cultivated in Ecuador at over 2450 meters above sea level, offering valuable information for process optimization and variety selection for specific applications in industries such as food, pharmaceutical, and cosmetics.
Supplementary Materials
The following supporting information can be downloaded at the website of this paper posted on
Preprints.org, Figure S1. Total Polyphenols calibration curve; Figure S2. Cannflavins A and B calibration curves; Figure S3. CBD calibration curve; Figure S4. THC calibration curve; Figure S5. CBG calibration curve; Figure S6. CBN calibration curve; Figure S7. Alpha – Pinene calibration curve; Figure S8. Beta-Pinene calibration curve; Figure S9. Camphene calibration curve; Figure S10. Carene calibration curve; Figure S11. Humulene calibration curve; Figure S12. Bisabolol calibration curve; Figure S13. Menthol calibration curve; Figure S14. Fenchol calibration curve; Figure S15. Fenchone calibration curve; Figure S16. Isoborneol calibration curve; Figure S17. Nerolidol calibration curve; Figure S18. Citronellol calibration curve; Figure S19. Camphor calibration curve; Figure S20. Pulegone calibration curve; Figure S21. Geranyl acetate calibration curve; Figure S22. Cedrene calibration curve; Figure S23. Cedrol calibration curve; Figure S24. Gamma-Terpinene calibration curve; Figure S25. Alpha-Terpinene calibration curve; Figure S26. Limonene calibration curve; Figure S27. beta-Caryophyllene calibration curve; Figure S28. Linalool calibration curve. The online version contains supplementary material and R codes available at:
https://zenodo.org/records/13823859.
Author Contributions
Conceptualization, H.S. D.G. and S.S.; methodology, H.S., P.L. and A.D.; validation, H.S., P.L. and S.S.; formal analysis, H.S. and L.V.; investigation, H.S., S.S. and L.V.; data curation, H.S., C.M. and A.D.; writing—original draft preparation, H.S. and S.S.; writing—review and editing, L.V. and H.S.; supervision, L.V. and A.D. All authors have read and agreed to the published version of the manuscript.
Funding
The work was funded by Universidad Central del Ecuador (UCE) through Senior Project No. DI-CONV-2022-040 “Study of the nutritional value, medical benefits, and food uses of hemp seeds (Cannabis sativa L.) cultivated in Ecuador” and Doctoral Project DOCT-DI -2022-07 “Extraction and characterization of cannabinoids and fatty acids from non-psychoactive cannabis varieties (Cannabis sativa L.) produced in Ecuador”.
Data Availability Statement
The original contributions presented in this study are included in the article and
Supplementary Materials, further inquiries can be directed to the corresponding authors
Acknowledgments
We would like to express our deepest gratitude to Universidad Central del Ecuador for its invaluable financial support, which has been essential for the realization of this research. We also extend our sincere appreciation to Faculty of Chemical Engineering “La Facultad de la Creatividad” and the research laboratory for providing the facilities and equipment necessary for this study, without which this research would not have been possible.
Furthermore, we are especially grateful to Universidad Nacional Agraria La Molina and its esteemed professors for the knowledge imparted, as well as for their academic and technical support throughout the research process. Their guidance and collaboration have been invaluable in the development of this work.
Lastly, we wish to express our thanks to the companies that generously provided the raw materials essential for this study. Their contributions have been crucial to achieving the results obtained. To all, we are deeply grateful for your commitment and dedication, which have made this research possible.
Conflicts of Interest
The authors declare that there are no conflicts of interest.
References
- E. Small, “Classification of Cannabis sativa L.: In relation to agricultural, biotechnological, medical and recreational utilization,” in Cannabis sativa L. - Botany and Biotechnology, Springer International Publishing, 2017, pp. 1–62. [CrossRef]
- V. R. Preedy, Handbook of Cannabis and Related Pathologies: Biology, Pharmacology, Diagnosis, and Treatment. 2017.
- M. A. ElSohly, M. M. Radwan, W. Gul, S. Chandra, and A. Galal, “Phytochemistry of Cannabis sativa L,” Jan. 01, 2017. [CrossRef]
- M. M. Radwan, S. Chandra, S. Gul, and M. A. Elsohly, “Cannabinoids, phenolics, terpenes and alkaloids of cannabis,” Molecules, vol. 26, no. 9, 2021. [CrossRef]
- W. Leonard, P. Zhang, D. Ying, and Z. Fang, “Hempseed in food industry: Nutritional value, health benefits, and industrial applications,” Compr Rev Food Sci Food Saf, vol. 19, no. 1, pp. 282–308, Jan. 2020. [CrossRef]
- F. Potin and R. Saurel, “Hemp Seed as a Source of Food Proteins,” 2020. [CrossRef]
- C. Chen and Z. Pan, “Cannabidiol and terpenes from hemp – ingredients for future foods and processing technologies,” Journal of Future Foods, vol. 1, no. 2, pp. 113–127, Dec. 2021. [CrossRef]
- R. Ransing et al., “Current state of cannabis use, policies, and research across sixteen countries: cross-country comparisons and international perspectives,” 2022. [CrossRef]
- COIP, “Ley Orgánica Reformatoria Al Código Orgánico Integral Penal,” Asamblea Nacional del Ecuador, p. 24, 2019, [Online]. Available: https://www.asambleanacional.gob.ec/es/leyes-aprobadas?leyes-aprobadas=All&title=&fecha=.
- H. Gallegos, “Aplicaciones de cáñamo como alternativa rentable a la reactivación económica de Ecuador tras la pandemia de Covid-19,” Perfiles, vol. 1, no. 25, pp. 45–53, Jan. 2021. [CrossRef]
- Ministerio de Agricultura y Ganadería, “Acuerdo Ministerial No. 109,” Quito, Oct. 2020. Accessed: Oct. 22, 2021. [Online]. Available: https://www.agricultura.gob.ec/wp-content/uploads/2020/10/109-2020-1.pdf.
- ARCSA, “Normativa técnica sanitaria para regulación y control de productos terminados de uso y consumo humano que contengan cannabis no psicoactivo o cáñamo, o derivados de cannabis no psi-coactivo o cáñamo,” Quito, 2021. [Online]. Available: https://www.controlsanitario.gob.ec/wp-content/uploads/downloads/2021/02/Resolucion-ARCSA-DE-002-2021-MAFG_Normativa-Tecnica-Sanitaria-para-la-regulacion-y-control-de-productos-terminados-de-uso-y-consumo-humano-que-contengan-Cannabis-No-Psicoactivo-o-Can.
- E. Rodríguez and J. Fontaine, “Situación actual de Cannabis sativa, beneficios terapéuticos y reacciones adversas | Rodríguez-Venegas | Revista Habanera de Ciencias Médicas,” Revista Habanera de Ciencias Médicas, vol. 19, no. 6, pp. 1–17, Nov. 2020, Accessed: Oct. 22, 2021. [Online]. Available: http://www.revhabanera.sld.cu/index.php/rhab/article/view/2992.
- D. Scublinsky, “Uso de la marihuana medicinal en enfermedades neurológicas,” Rev Argent Reumatol, vol. 28, no. 3, pp. 7–11, 2017, [Online]. Available: http://revistasar.org.ar/revistas/2017/n3/3_actualizacion.pdf%0Ahttp://www.scielo.org.ar/scielo.php?script=sci_arttext&pid=S2362-36752017000300003&lng=es&nrm=iso&tlng=.
- J. M. Andrade, E. Ramírez, J. D. Cedeño, N. A. Ardila, and A. L. López, “Avances científicos y tecno-lógicos del cannabis en el campo medicinal,” Universitaria, Corporacion Dios, Minuto De, vol. 39, no. November, pp. 20–34, 2018, Accessed: Oct. 22, 2021. [Online]. Available: http://www.revistaespacios.com/a18v39n39/a18v39n39p20.pdf.
- S. O. Aloo, G. Mwiti, L. W. Ngugi, and D. H. Oh, “Uncovering the secrets of industrial hemp in food and nutrition: The trends, challenges, and new-age perspectives,” 2022. [CrossRef]
- R. Mechoulam and R. Gallily, “Cannabidiol: An Overview of Some Pharmacological Aspects,” The Journal of Clinical Pharmacology, vol. 42, no. 11, pp. 11–19, 2010. [CrossRef]
- B. F. Thomas and M. ElSholy, The Analytical Chemistry of Cannabis. Quality Assessment, Assurance, and Regulation of Medicinal Marijuana and Cannabinoid Preparations. Amsterdam: Elsevier B.V. Book Aid International, 2016.
- T. J. Jackson and S. Chakraborty, “The Cannabis sativa genetics and therapeutics relationship network: automatically associating cannabis-related genes to therapeutic properties through chemicals from cannabis literature,” J Cannabis Res, vol. 5, no. 1, Mar. 2023. [CrossRef]
- M. Monroe, “Factores que influyen en la producción de THC,” Cannabis Magazine, pp. 1–1, Sep. 2014, Accessed: Oct. 23, 2021. [Online]. Available: https://www.cannabismagazine.net/factores-que-influyen-en-la-produccion-de-thc/.
- F. Siano et al., “Comparative study of chemical, biochemical characteristic and ATR-FTIR analysis of seeds, oil and flour of the edible Fedora cultivar hemp (Cannabis sativa L.),” Molecules, vol. 24, no. 1, 2019. [CrossRef]
- R. A. Burton, M. Andres, M. Cole, J. M. Cowley, and M. A. Augustin, “Industrial hemp seed: from the field to value-added food ingredients,” Dec. 01, 2022, BioMed Central Ltd. [CrossRef]
- H. M. S. Al Ubeed, D. J. Bhuyan, M. A. Alsherbiny, A. Basu, and Q. V. Vuong, “A Comprehensive Re-view on the Techniques for Extraction of Bioactive Compounds from Medicinal Cannabis,” Molecules, vol. 27, no. 3, pp. 1–18, 2022. [CrossRef]
- M. Radoiu, H. Kaur, A. Bakowska-Barczak, and S. Splinter, “Microwave-Assisted Industrial Scale Cannabis Extraction,” Technologies (Basel), vol. 8, no. 3, pp. 1–16, 2020. [CrossRef]
- S. Jokić et al., “Terpenes and Cannabinoids in Supercritical CO2 Extracts of Industrial Hemp Inflorescences: Optimization of Extraction, Antiradical and Antibacterial Activity,” Pharmaceuticals, vol. 15, no. 9, 2022. [CrossRef]
- C. López-Olmos, M. T. García-Valverde, J. Hidalgo, C. Ferrerio-Vera, and V. Sánchez de Medina, “Comprehensive comparison of industrial cannabinoid extraction techniques: Evaluation of the most relevant patents and studies at pilot scale,” Frontiers in Natural Products, vol. 1, 2022. [CrossRef]
- L. J. Rovetto and N. V. Aieta, “Supercritical carbon dioxide extraction of cannabinoids from Cannabis sativa L.,” Journal of Supercritical Fluids, vol. 129, pp. 16–27, Nov. 2017. [CrossRef]
- J. Wilson, T. Simpson, and K. Spelman, “Total cannabidiol (CBD) concentrations and yields from traditional extraction methods: Percolation vs. maceration,” Front Pharmacol, vol. 13, Oct. 2022. [CrossRef]
- M. Gallo, A. Formato, M. Ciaravolo, G. Formato, and D. Naviglio, “Study of the kinetics of extraction process for the production of hemp inflorescences extracts by means of conventional maceration (CM) and rapid solid-liquid dynamic extraction (RSLDE),” Separations, vol. 7, no. 2, 2020. [CrossRef]
- M. M. Lewis, Y. Yang, E. Wasilewski, H. A. Clarke, and L. P. Kotra, “Chemical Profiling of Medical Cannabis Extracts,” ACS Omega, vol. 2, no. 9, pp. 6091–6103, 2017. [CrossRef]
- L. Nahar, A. Onder, and S. D. Sarker, “A review on the recent advances in HPLC, UHPLC and UPLC analyses of naturally occurring cannabinoids (2010–2019),” Phytochemical Analysis, vol. 31, no. 4, pp. 413–457, 2020. [CrossRef]
- United Nations, “RECOMMENDED METHODS FOR THE IDENTIFICATION AND ANALYSIS OF CANNABIS AND CANNABIS PRODUCTS NATIONAL DRUG ANALYSIS LABORATORIES,” Viena, Mar. 2022.
- M. D. Kleinhenz et al., “Nutrient concentrations, digestibility, and cannabinoid concentrations of industrial hemp plant components,” Applied Animal Science, vol. 36, no. 4, 2020. [CrossRef]
- L. S. Jiménez Álvarez, N. Vega, E. D. Capa Mora, N. del C. Fierro Jaramillo, and P. Q. Miguitama, “Learning teaching styles and strategies of University Students of Soil Science,” Revista Electronica de Investigacion Educativa, vol. 21, no. 1, 2019. [CrossRef]
- C. Scholz, M. M. Madry, T. Kraemer, and M. R. Baumgartner, “LC–MS-MS Analysis of ∆9-THC, CBN and CBD in Hair: Investigation of Artifacts,” J Anal Toxicol, vol. 46, no. 5, 2022. [CrossRef]
- J. W. King, “The relationship between cannabis/hemp use in foods and processing methodology,” 2019. [CrossRef]
- M. Valizadehderakhshan, A. Shahbazi, M. Kazem-Rostami, M. S. Todd, Bhowmik, and Arnab, “Ex-traction of Cannabinoids fromCannabis sativaL.(Hemp)—Review,” Agriculture, vol. 11, no. 384, 2021.
- D. R. Grijó, I. A. Vieitez Osorio, and L. Cardozo-Filho, “Supercritical extraction strategies using CO2 and ethanol to obtain cannabinoid compounds from Cannabis hybrid flowers,” Journal of CO2 Utilization, vol. 28, no. May, pp. 174–180, 2018. [CrossRef]
- D. De Vita et al., “Comparison of different methods for the extraction of cannabinoids from cannabis,” Nat Prod Res, vol. 34, no. 20, pp. 2952–2958, 2020. [CrossRef]
- S. R. Sommano, C. Chittasupho, W. Ruksiriwanich, and P. Jantrawut, “The Cannabis Terpenes,” Dec. 01, 2020, MDPI. [CrossRef]
- D. Jin, K. Dai, Z. Xie, and J. Chen, “Secondary Metabolites Profiled in Cannabis Inflorescences, Leaves, Stem Barks, and Roots for Medicinal Purposes,” Sci Rep, vol. 10, no. 1, 2020. [CrossRef]
- J. Bueno, E. Leuer, M. Kearney, E. H. Green, and E. A. Greenbaum, “The preservation and augmentation of volatile terpenes in cannabis inflorescence,” J Cannabis Res, vol. 2, no. 1, 2020. [CrossRef]
- R. Ascrizzi, M. Iannone, G. Cinque, A. Marianelli, L. Pistelli, and G. Flamini, “‘Hemping’ the drinks: Aromatizing alcoholic beverages with a blend of Cannabis sativa L. flowers,” Food Chem, vol. 325, 2020. [CrossRef]
- L. B. Eddin et al., “Health Benefits, Pharmacological Effects, Molecular Mechanisms, and Therapeutic Potential of α-Bisabolol,” 2022. [CrossRef]
- H. Sovová, R. P. Stateva, and M. Koptová, “Measurement and correlation of α-bisabolol solubility in near critical carbon dioxide,” J Chem Eng Data, vol. 58, no. 5, 2013. [CrossRef]
- E. D. Rocha et al., “Qualitative terpene profiling of Cannabis varieties cultivated for medical purposes,” Rodriguesia, vol. 7, 2020. [CrossRef]
- D. Y. Hoo et al., “Ultrasonic cavitation: An effective cleaner and greener intensification technology in the extraction and surface modification of nanocellulose,” 2022. [CrossRef]
- T. Nuutinen, “Medicinal properties of terpenes found in Cannabis sativa and Humulus lupulus,” Sep. 05, 2018, Elsevier Masson SAS. [CrossRef]
- D. Cox-Georgian, N. Ramadoss, C. Dona, and C. Basu, “Therapeutic and medicinal uses of terpenes,” in Medicinal Plants: From Farm to Pharmacy, 2019. [CrossRef]
- M. L. Barrett, A. M. Scutt, and F. J. Evans, “Cannflavin A and B, prenylated flavones from Cannabis sativa L.,” Experientia, vol. 42, no. 4, 1986. [CrossRef]
- R. Pavlovic et al., “Phytochemical and Ecological Analysis of Two Varieties of Hemp (Cannabis sativa L.) Grown in a Mountain Environment of Italian Alps,” Front Plant Sci, vol. 10, 2019. [CrossRef]
- L. Barrientos Ramírez et al., “Contenido de polifenoles y capacidad antioxidante de Physalis cheno-podifolia Lam. silvestre y cultivo,” Rev Mex Cienc For, vol. 10, no. 51, 2019. [CrossRef]
- Panche, A.N.; Diwan, A.D.; Chandra, S.R. “Flavonoids: An overview,” Jan. 08, 2016, Cambridge University Press. [CrossRef]
- K. Murti, M. A. Panchal, V. Gajera, and J. Solanki, “Pharmacological Properties of Matricaria recutita: A Review,” Pharmacologia, vol. 3, no. 8, 2012. [CrossRef]
- Tomko, A.M.; Whynot, E.G.; Ellis, L.D.; Dupré, D.J. “Anti-cancer potential of cannabinoids, terpenes, and flavonoids present in cannabis,” Jul. 01, 2020, MDPI AG. [CrossRef]
- M. Quiñones, M. Miguel, and A. Aleixandre, “The polyphenols, naturally occurring compounds with beneficial effects on cardiovascular disease.,” 2012.
- J. J. Buenrostro-Figueroa et al., “Improved Extraction of High Value-Added Polyphenols from Pomegranate Peel by Solid-State Fermentation,” Fermentation, vol. 9, no. 6, 2023. [CrossRef]
- Z. Tong, W. He, X. Fan, and A. Guo, “Biological Function of Plant Tannin and Its Application in Animal Health,” 2022. [CrossRef]
- L. U. Thompson, “Potential health benefits and problems associated with antinutrients in foods*,” 1993.
- N. Allocati, M. Masulli, M. F. Alexeyev, and C. Di Ilio, “Escherichia coli in Europe: An overview,” 2013. [CrossRef]
- E. Aysanew and D. Alemayehu, “Integrated management of ginger bacterial wilt (Ralstonia solanacearum) in Southwest Ethiopia,” Cogent Food Agric, vol. 8, no. 1, 2022. [CrossRef]
- M. Espín, “Evaluación de los efectos de la contaminación ambiental, en la productividad de los cultivos agrícolas, en la parroquia de Tumbaco.,” Investigación y Desarrollo, Quito, Jul. 2016.
- C. Taco, G. Vistín, V. Rosero, O. López, and W. Fonseca, “Las actividades productivas y su relación con la contaminación del agua de la Microcuenca Negroyacu, en Guaranda, Ecuador.,” Revista Ciencia UNEMI, vol. No. 10, pp. 88–97, 2017.
- D. Caplan, M. Dixon, and Y. Zheng, “Optimal rate of organic fertilizer during the vegetative-stage for cannabis grown in two coir-based substrates,” HortScience, vol. 52, no. 9, 2017. [CrossRef]
- M. Kuhn and K. Johnson, Applied Predictive Modeling. New York: Springer, 2013. [CrossRef]
- V. R. Benalcázar-Rojas, W. J. Yambay-Vallejo, and E. P. Herrera-Granda, “Multivariate Analysis for Prediction of Splitting Tensile Strength in Concrete Paving Blocks,” Applied Sciences (Switzerland), vol. 13, no. 19, 2023. [CrossRef]
- S. Sheather, A Modern Approach to Regression with R. in Springer Texts in Statistics. New York, NY: Springer New York, 2009. [CrossRef]
- Géron, A. Hands-On Machine Learning with Scikit-Learn, Keras, and TensorFlow, Second. Canada: Kristen Brown, 2019. [Online]. Available: http://oreilly.com.
- M. Wang et al., “Decarboxylation Study of Acidic Cannabinoids: A Novel Approach Using Ul-tra-High-Performance Supercritical Fluid Chromatography/Photodiode Array-Mass Spectrometry,” Cannabis Cannabinoid Res, vol. 1, no. 1, pp. 262–271, Jan. 2016. [CrossRef]
- S. Rochfort et al., “Utilisation of Design of Experiments Approach to Optimise Supercritical Fluid Ex-traction of Medicinal Cannabis,” Sci Rep, vol. 10, no. 1, pp. 1–7, 2020. [CrossRef]
- P. W. Addo et al., “Microwave- and Ultrasound-Assisted Extraction of Cannabinoids and Terpenes from Cannabis Using Response Surface Methodology,” Molecules, vol. 27, no. 24, Mar. 2022. [CrossRef]
- I. A. Herrera-Fuentes, K. L. Quimis-Ponce, N. A. Sorroza-Rojas, F. S. García-Larreta, W. Mariscal-Santi, and R. E. Mariscal-Garcia, “Determinación de Taninos y Cumarinas presente en la planta tres filos,” Polo del Conocimiento, vol. 2, no. 7, 2017. [CrossRef]
- W. Ortíz Fernández, Y. Aguilera, J. Rodríguez, D. M. Guzmán Mayancha, H. M. Cobo Salinas, and L. R. Bravo Sánchez, “Desarrollo y Validación de Técnicas Espectrofotométricas para la Determinación de Flavonoides Totales, Basada en Quercetina, en las Hojas de Psidium guajava L.,” Revista Amazónica. Ciencia y Tecnología, vol. 5, no. 3, 2016. [CrossRef]
- E. García, I. Fernández, and A. Fuentes, “Determinación de polifenoles totales por el método de Folin- Ciocalteu,” Etsiamn, 2015.
- L. Vaclavik et al., “Quantitation of cannabinoids in cannabis dried plant materials, concentrates, and oils using liquid chromatography-diode array detection technique with optional mass spectrometric detection: Single-laboratory validation study, first action 2018.11,” J AOAC Int, vol. 102, no. 6, 2019. [CrossRef]
- P. Lapwibunsuk, P. Wongphichai, y S. Lapwibunsuk, "Determinación del contenido de cannabinoides en bebidas de cáñamo mediante la técnica de cromatografía líquida de ultra alto rendimiento y espectrometría de masas en tándem", Metri, Journal of Applied Science. Departamento de Servicios Científicos, vol. 12, no. 1, 2023. [CrossRef]
- K. Rome and A. McIntyre, “Intelligent use of relative response factors in gas chromatography-flame ionisation detection.,” Chromatography Today, Macclesfield, UK, pp. 52–56, Jun. 2012. Accessed: May 12, 2024. [Online]. Available: https://www.chromatographytoday.com/article/gc-mdgc/32/astrazeneca/intelligent-use-of-relative-responsenbspfactors-in-gas-chromatography-flame-ionisation-detection/1205.
- AOAC, “AOAC Official Method 999.10 Lead, Cadmium, Zinc, Cooper, and Iron in Foods,” Official methods of analysis of AOAC International, 2008.
- Principle, A. “AOAC Official Method 2015.01 Heavy Metals in Food,” J AOAC Int, 2015.
- M. E. Calcina-Benique, L. E. Calcina-Rondán, F. R. Huaraya-Chambi, A. R. Salas-Camargo, and K. Tejada-Meza, “Arsenic in groundwater of the Callacame river basin, and its impact on agricultural soils in Desaguadero, Puno-Perú,” DYNA (Colombia), vol. 89, no. 221, 2022. [CrossRef]
- Caruso, A.; Santoro, M. “Detection of Organochlorine Pesticides by GC-ECD Following U.S. EPA Method 8081,” Detection of Organochlorine Pesticides by GC-ECD Following U.S. EPA Method 8081, 2014.
- D. Schwantes, A. Celso Gonçalves, É. Conradi Junior, M. A. Campagnolo, and J. Zimmermann, “De-termination of CHLORPYRIFOS by GC/ECD in water and its sorption mechanism study in a RHODIC FERRALSOL,” J Environ Health Sci Eng, vol. 18, no. 1, 2020. [CrossRef]
- L. I. N. Ezemonye, “Concentrations and distribution of Polychlorinated biphenyls (PCBs) in aquatic environment of Niger Delta of Nigeria (water and sediments),” Discov Innov, vol. 18, no. 2, 2006. [CrossRef]
- AOAC, Association of official analytical chemists., G. W. Latimer, and William. Horwitz, Official methods of analysis of AOAC international. AOAC International, 2006.
- I. Standard, “ISO 7218,” Reference number ISO, 2007.
- H. Kodaka, S. Mizuochi, H. Teramura, and T. Nirazuka, “Comparison of the Compact Dry EC with the most probable number method (AOAC official method 966.24) for enumeration of Escherichia coll and coliform bacteria in raw meats Performance-Tested MethodSM 110402,” J AOAC Int, vol. 89, no. 1, 2006. [CrossRef]
- B. O. Obong’O, G. Ayodo, F. Kawaka, and M. K. Adalla, “Fungi and Aflatoxin Levels in Traditionally Processed Cassava (Manihot esculenta Crantz) Products in Homa Bay County, Kenya,” Int J Microbiol, vol. 2020, 2020. [CrossRef]
- Geron, A. Hands-On Machine Learning with Scikit-Learn, Keras, and TensorFlow: Concepts, Tools, and Techniques to Build Intelligent Systems, 2nd ed. O’Reilly Media, Inc., 2019.
- M. Kuhn and K. Johnson, Applied Predictive Modeling. 2013. [CrossRef]
- Breiman L, Friedman JH, Olshen RA, and Stone CJ, Classification and regression trees. 1984.
- M. Mielsen, Neural Networks and Deep Learning. 2019.
Figure 1.
Comparison of Yields Among Extraction Methods for Non-Psychoactive Cannabis.
Figure 1.
Comparison of Yields Among Extraction Methods for Non-Psychoactive Cannabis.
Figure 2.
Total Cannabinoid Analysis by Variety in Non-Psychoactive Cannabis Flower.
Figure 2.
Total Cannabinoid Analysis by Variety in Non-Psychoactive Cannabis Flower.
Figure 3.
Results of the cannabinoid concentration for each extraction method for the significant factor "Variety.".
Figure 3.
Results of the cannabinoid concentration for each extraction method for the significant factor "Variety.".
Figure 4.
Identification of terpenes using the maceration method. The identified terpenes are: 1: β-caryophyllene, 2: Humulene, 3: Bisabolol, 4: β-myrcene, 5: Nerolidol, 6: (-)-linalool, 7: Fenchol, 8: Geranyl acetate, 9: Cedrol, 10: Cedrene.
Figure 4.
Identification of terpenes using the maceration method. The identified terpenes are: 1: β-caryophyllene, 2: Humulene, 3: Bisabolol, 4: β-myrcene, 5: Nerolidol, 6: (-)-linalool, 7: Fenchol, 8: Geranyl acetate, 9: Cedrol, 10: Cedrene.
Figure 6.
Identification of the terpene profile using the supercritical fluid method. The identified terpenes are: 1: β-caryophyllene, 2: Humulene, 3: Bisabolol, 4: β-myrcene, 5: Nerolidol, 6: (-)-linalool, 7: Fenchol, 8: Geranyl acetate, 9: Cedrol, 11: Citronellol, 12: α-Pinene, 13: β-Pinene, 14: Fenchone, 15: (R)-(+)-limonene.
Figure 7.
Concentration of Cannaflavins in Extracts Obtained by Different Extraction Methods.
Figure 7.
Concentration of Cannaflavins in Extracts Obtained by Different Extraction Methods.
Figure 8.
Total flavonoids present in the cannabis flower.
Figure 8.
Total flavonoids present in the cannabis flower.
Figure 9.
Total polyphenols present in cannabis flower.
Figure 9.
Total polyphenols present in cannabis flower.
Figure 10.
Tannins in the cannabis flower.
Figure 10.
Tannins in the cannabis flower.
Figure 11.
Regression tree for the yield of cannabis flower extracts using the maceration method.
Figure 11.
Regression tree for the yield of cannabis flower extracts using the maceration method.
Figure 12.
Regression tree for the yield of cannabis flower extracts using the ultrasound method.
Figure 12.
Regression tree for the yield of cannabis flower extracts using the ultrasound method.
Figure 13.
Regression tree for the yield of cannabis flower extracts using the supercritical fluids method.
Figure 13.
Regression tree for the yield of cannabis flower extracts using the supercritical fluids method.
Table 1.
ANOVA Analysis Results for Each Extraction Method.
Table 1.
ANOVA Analysis Results for Each Extraction Method.
| Variable |
UEA |
MAC |
SFE |
| Main Effects |
P-value |
P-value |
P-value |
| A: Variety |
0.0000 |
0.0000 |
0.0000 |
| B: Time |
0.2122 |
0.7602 |
0.5982 1
|
| C: Temperature |
0.0001 |
0.0232 |
0.5982 |
| Interactions |
- |
- |
- |
Table 2.
Multiple range test for each statistically significant factor.
Table 2.
Multiple range test for each statistically significant factor.
| Variable |
UEA |
MAC |
SFE |
| Main Effects |
Min |
Max |
Min |
Max |
Min |
Max |
| A: Variety |
Lemonge |
Titan |
Lemonge |
Titan |
Lemonge |
Titan |
| B: Time, min |
- |
- |
- |
- |
- |
- |
| C: Temperature, °C |
-16 |
16 |
-16 |
16 |
- |
- |
| Yield, % |
9.26 ± 0.19 |
17.44 ± 0.18 |
9.46 ± 0.21 |
16.89 ± 0.20 |
1.88 ± 0.35 |
8.11 ± 0.35 |
Table 3.
Optimal conditions for each extraction method using ANOVA analysis.
Table 3.
Optimal conditions for each extraction method using ANOVA analysis.
| Method |
Pressure, bar |
Temperature, °C |
Time, min |
| MAC |
- |
16 |
20 |
| UEA |
- |
16 |
10 |
SFE
(CBD, THC, CBN) |
325 |
45 |
- |
SFE
(CBG) |
300 |
35 |
- |
Table 4.
Results of the Multivariate MANOVA Test for Cannabinoids (Method: Wilks' Test).
Table 4.
Results of the Multivariate MANOVA Test for Cannabinoids (Method: Wilks' Test).
| Cannabinoids |
Value |
F |
GL
Num |
GL
Denom |
p |
| Maceration |
|
|
|
|
|
| Variety |
0.01884 |
15.829 |
20 |
136 |
0.000 |
| Time |
0.87636 |
0.699 |
8 |
82 |
0.691 |
| Temperature |
0.80341 |
1.185 |
8 |
82 |
0.318 |
| Ultrasound |
|
|
|
|
|
| Variety |
0.01721 |
16.455 |
20 |
136 |
0.000 |
| Time |
0.86861 |
0.748 |
8 |
82 |
0.649 |
| Temperature |
0.68956 |
2.093 |
8 |
82 |
0.046 |
| Supercritical Fluids |
|
|
|
|
|
| Variety |
0.00701 |
23.700 |
20 |
136 |
0.000 |
| Pressure |
0.89317 |
0.596 |
8 |
82 |
0.779 |
| Temperature |
0.81850 |
1.080 |
8 |
82 |
0.386 |
Table 5.
Comparison between cannabinoid values analyzed in flowers cultivated in Ecuador and commercial technical datasheets.
Table 5.
Comparison between cannabinoid values analyzed in flowers cultivated in Ecuador and commercial technical datasheets.
| Variety |
Unit |
CBDt / CBDv |
THC / THCv |
CBN / CBNv |
CBG / CBGv |
| Cherry Bubblegum |
% w/w |
13.84 / 14.27 |
0.55 / 0.16 |
0.00 / 0.19 |
0.00 / 0.00 |
| Cherry Oregon |
% w/w |
10.10 / 12.42 |
0.55 / 0.06 |
0.00 / 0.21 |
0.00 / 0.00 |
| Titan |
% w/w |
10.59 / 18.15 |
0.36 / 0.34 |
0.00 / 0.19 |
0.00 / 0.00 |
| Esmeralda 16 |
% w/w |
16.78 / 13.46 |
0.55 / 0.33 |
0.00 / 0.00 |
0.00 / 0.00 |
| Esmeralda 19 |
% w/w |
0.00 / 0.00 |
0.10 / 0.00 |
0.00 / 0.00 |
15.00 / 4.81 |
| Lemonge |
% w/w |
0.00 / 0.00 |
0.10 / 0.00 |
0.00 / 0.00 |
17.00 / 10.83 |
Table 6.
Average Cannabinoids extract percentage values depending on the extraction method and variety.
Table 6.
Average Cannabinoids extract percentage values depending on the extraction method and variety.
| Method |
CBD [% w/w] |
THC [% w/w] |
CBN [% w/w] |
CBG [% w/w] |
| MAC |
41.32 ± 1.85
(EM-16) |
3.73 ± 0.15
(EM-16) |
1.12 ± 0.14
(Titan) |
59.36 ± 2.95
(EM-19) |
| UEA |
40.48 ± 2.52
(Titan) |
3.81 ± 0.35
(Cherry Bubblegum) |
1.54 ± 0.36
(EM-16) |
67.77 ± 3.43
(EM-19) |
| SFE |
44.65 ± 4.06
(Cherry Oregon) |
6.32 ± 0.36
(Titan) |
0.64 ± 0.06
(Cherry Oregon) |
7.68 ± 0.63
(Lemonge) |
Table 7.
Sample coding of non-psychoactive cannabis inflorescences.
Table 7.
Sample coding of non-psychoactive cannabis inflorescences.
| Laboratory coding |
Sample information |
| M1 |
EM-19 flower |
| M2 |
EM-16 flower |
| M3 |
Titan flower |
| M4 |
Cherry Bubblegum flower |
| M5 |
Cherry Oregon flower |
| M6 |
Lemonge flower |
Table 9.
Gram staining results.
Table 9.
Gram staining results.
| Morphology |
Number of axenic isolates |
| Gram positive cocci |
6 |
| Gram-negative bacilli |
12 |
| Gram-positive bacilli |
10 |
| Total, isolates |
28 |
Table 10.
Pesticide results (organochlorines and organophosphates) in non-psychoactive cannabis inflorescences.
Table 10.
Pesticide results (organochlorines and organophosphates) in non-psychoactive cannabis inflorescences.
| Samples |
Unit |
Organochlorines |
Organophosphates |
| Cherry Bubblegum |
µg/kg |
< 4 |
< 10 |
| Cherry Oregon |
µg/kg |
< 4 |
< 10 |
| Titan |
µg/kg |
< 4 |
< 10 |
| Lemonge |
µg/kg |
< 4 |
< 10 |
| EM-19 |
µg/kg |
< 4 |
< 10 |
| EM-16 |
µg/kg |
< 4 |
< 10 |
Table 11.
Heavy metal results in non-psychoactive cannabis flowers.
Table 11.
Heavy metal results in non-psychoactive cannabis flowers.
| Variety |
Unit |
Cadmium, Cd |
Chromium, Cr |
Mercury, Hg |
Arsenic, As |
Lead, Pb |
| Cherry Bubblegum |
ppm |
0.20 |
< 0.05 |
< 0.02 |
< 0.025 |
1.70 |
| Cherry Oregon |
ppm |
0.20 |
2.60 |
< 0.02 |
< 0.025 |
2.63 |
| EM-16 |
ppm |
< 0.001 |
< 0.05 |
< 0.02 |
0.051 |
3.52 |
| EM-19 |
ppm |
< 0.001 |
< 0.05 |
< 0.02 |
0.034 |
3.39 |
| Lemonge |
ppm |
2.09 |
< 0.05 |
< 0.02 |
< 0.025 |
2.84 |
| Titan |
ppm |
0.60 |
1.40 |
< 0.02 |
< 0.025 |
2.01 |
Table 13.
Details of the mobile phase gradient used for cannabinoid analysis.
Table 13.
Details of the mobile phase gradient used for cannabinoid analysis.
| Time, min |
Mobile phase A, % |
Mobile phase B, % |
Flow, ml/min |
|
| 0.00 |
40 |
60 |
0.60 |
|
| 6.00 |
5 |
95 |
0.60 |
|
| 12.01 |
5 |
95 |
0.20 |
|
| 14.00 |
0 |
100 |
0.20 |
|
| 18.00 |
40 |
60 |
0.20 |
|
|
Disclaimer/Publisher’s Note: The statements, opinions and data contained in all publications are solely those of the individual author(s) and contributor(s) and not of MDPI and/or the editor(s). MDPI and/or the editor(s) disclaim responsibility for any injury to people or property resulting from any ideas, methods, instructions or products referred to in the content. |
© 2024 by the authors. Licensee MDPI, Basel, Switzerland. This article is an open access article distributed under the terms and conditions of the Creative Commons Attribution (CC BY) license (http://creativecommons.org/licenses/by/4.0/).