
Submitted:
02 December 2024
Posted:
03 December 2024
You are already at the latest version
Abstract
During the initial steps of green biorefining aimed at protein recovery, endogenous proteins and enzymes, along with e.g. phytochemical constituents, are decompartmentalized into a green juice. This creates a highly dynamic environment prone to a plethora of reactions including oxidative protein modification and deterioration. Obtaining a fundamental understanding of the enzymes capable of exerting antioxidant activity ex vivo could help mitigate these reactions for improved product quality. In this study, we investigated perennial ryegrass (Lolium perenne), one of the most widely used turf and forage grasses, as a model system. Using size exclusion chromatography, we fractionated the green juice to investigate in vitro antioxidant properties and coupled this with quantitative bottom-up proteomics, GO-term analysis, and fraction-based enrichment. Our findings revealed that several enzymes, already known for their involvement in in vivo oxidative protection, are enriched in fractions displaying increased in vitro antioxidant activity, indicating retained activity ex vivo. Moreover, this study provides the most detailed characterization of the L. perenne proteome today and delivers new insights into protein-level partitioning during wet fractionation. Ultimately, this work contributes to better understanding the first steps of green biorefining and provides the basis for process optimization.
Keywords:
Perennial ryegrass
; green biorefining
; wet fractionation
; antioxidant activity
; size fractionation
; bottom-up proteomics
; bioinformatics
; enrichment analysis
1. Introduction
Changes in the global climate have become a planetary crisis, drawing considerable attention, and need to be addressed through a green transition. According to UN Sustainable Development Goals, this involves implementing emission-free energy systems, sustainable production practices, and effective by-product and waste management in order to mitigate environmental degradation, ensure long-term sustainability, and meet the needs of the growing human population. Plant-based foods represent a significant component of this sustainable solution. The production of plant-based foods is generally less resource-intensive and environmentally destructive, as it typically requires less land, water, and energy compared to raising livestock, and shows significantly lower levels of greenhouse gas emissions [1]. Conventional animal-based products are typically the primary sources of protein in traditional diets, particularly in Western countries. Given that proteins are essential macronutrients for human nutrition, it becomes essential to prioritize development of sustainable plant-based protein sources that can effectively supplement or replace traditional sources [2]. This especially applies to plant-based protein ingredients, as they provide a concentrated source of protein, enabling the creation of a wide range of products allowing for diverse dietary options and specific nutritional needs.
In recent years, green leaves such as alfalfa, clover, grasses, immature cereals, and plant shoots have gained increasing interest as promising protein sources [3,4]. Grasses, in particular, are versatile, thrive in various climates and soils from agricultural to marginal lands, and cover around 70% of the global land area [5]. Generally, grasses contain high amounts of protein, ranging between 6-26% in dry matter, with protein levels being linked to the growth stage of the grass and affected by soil nutrition [5,6]. This makes grasses a ubiquitous resource for protein production.
Grasses are especially favored in temperate climates, which provide adequate soil temperatures, sunlight, and rainfall throughout the year [5,7]. Perennial ryegrass (Lolium perenne) is a common indigenous temperate crop and one of the most widely used turf and forage grasses [8]. Compared to annual crops, perennials, such as L. perenne, can achieve greater biomass production due to its extended growing period, which allows for enhanced interception of solar radiation and repeated harvest [9]. Additionally, the deeper root systems of perennial crops facilitate access to water and nutrients from deeper soil layers, which contributes to improved resilience against environmental stresses such as drought. This also supports better nutrient uptake and reduces nitrate leaching associated with fertilization [9]. During the vegetative growth phase and with high nitrogen input, the protein content of ryegrass species can exceed 30% in dry matter [10].
Utilizing grasses for protein production in temperate regions like Northern Europe can reduce dependence on imported plant proteins, such as soy, which require warmer climates for cultivation, thereby minimizing the environmental footprint associated with transport. Furthermore, locally produced plant-based proteins can strengthen the local supply chain and contribute to long-term sustainable food security. Currently, most of the market for grass is limited to feed, primarily for ruminants, as the direct use of the biomass is unsuitable for monogastric animals and humans [9,11]. However, through biorefinery processes, it is possible to extract the proteins from the grass, making it available for both monogastric and human consumption. Green biorefining is the use of fresh, green biomass as feedstock for the production of various products, such as food, feed, chemicals, bioactive components, energy, and/or biofuels. Strategies aimed at utilizing all side streams and optimizing production are generally employed [6,12,13]. The first step in extracting protein from green biomass is plant tissue disruption to release the intracellular content. This is often referred to as wet fractionation and is usually performed by mechanically fractionating using a press, resulting in a green juice and a fibrous pulp [14]. The green juice is rich in proteins, chlorophyll, membrane fragments and other cellular compounds and debris. Secondary processing can be performed to separate and concentrate the proteins further [15,16].
As wet fractionation disrupts cell compartments, the extracted proteins consist both of soluble cytoplasmic proteins and insoluble membrane proteins. The cytoplasmic proteins, typically referred to as “white protein”, include mainly chloroplast enzymes. These are stable soluble proteins, odorless, tasteless and with a clear color, making them suitable for food applications [14]. One of the most abundant and widely studied proteins in this relation, is the photosynthetic enzyme ribulose-1,5-bisphosphate carboxylase/oxygenase (RuBisCO), which possess great nutritional value and functional properties such as foaming, gelling and emulsification [17,18,19]. Under optimal conditions, RuBisCO constitutes about 50% of the soluble protein of plant leaves by mass, however several other functional proteins could be present in the green juice, indicating the potential of green biomass as a multifunctional protein source for food applications.
Unfortunately, several challenges arise during processing in green biorefineries, which can result in undesirable changes in protein properties and functionality. Such changes, e.g. proteolysis, aggregation, and chemical modifications, occur as soluble proteins, enzymes, and phytochemicals are mixed ex vivo after being removed from their original subcellular location and environment. Additionally, homogenization operations, exposure to UV-light, or release of complex-bound transition metals, can facilitate e.g. amino acid side chain modification and protein cross-linkage through oxidative processes [20,21]. Consequently, antioxidant capacity is necessary to maintain native state and functionally of proteins in the green juice. Plants are typically considered abundant sources of natural antioxidants metabolites. Hitherto, research on plant antioxidants in relation to food applications has predominantly focused on non-enzymatic compounds, such as polyphenols, flavonoids, vitamins, and volatile chemicals, rather than proteins [22,23]. When plant proteins are studied for their antioxidant properties, the focus is often on protein-derived peptides [24,25,26,27,28,29]. However, during green biorefining, the primary goal is often to maximize protein concentration as much as possible, which includes removal of antioxidant metabolites and peptides. Moreover, biorefining ideally aims to preserve proteins in their native form, thereby maintaining solubility and original functionality. This highlights the importance of exploring the antioxidant potential of whole plant proteins. A deeper understanding of this potential would allow to optimize processes for their enrichment, ultimately enhancing product stability, extending shelf-life, and broadening their applicability as food ingredients.
The research on antioxidant proteins has mainly been focused on the intricated redox balance of cells in vivo, where antioxidants are highly interactive constituting a complex defense system against redox imbalance. In relation to L. perenne, the expression level during stress conditions of known enzymatic antioxidants such as ferredoxin–thioredoxin reductase, thioredoxin, superoxide dismutase, catalase, ascorbate peroxidase, glutathione reductase, monodehydroascorbate reductase, and dehydroascorbate reductase, has been investigated to improve agricultural productivity [30,31,32,33]. As eukaryotic cells are highly compartmented, the subcellular location of proteins is crucial for protein function. Hereby, their catalytic activity is influenced by cellular dynamics and variation in compartmental conditions [34]. To our knowledge, no prior studies have investigated the ex vivo antioxidant activity of native proteins from L. perenne green juice. Therefore, less is known about the activity of these known antioxidant proteins when separated from cellular conditions such as presence of co-factors and synergistic effectors.
This knowledge gap provides an opportunity to uncover novel insights at a fundamental level of native antioxidant proteins, as the inherent antioxidant and other functional properties could enhance their value in relation to food applications. In this study, the ex vivo antioxidant activity of fractionated L. perenne green juice protein is investigated, and responsible effectors are evaluated. Moreover, the study provides the first comprehensive proteomic analysis of L. perenne and provides insights on the fate of individual proteins during the first step of a biorefinery process.
2. Materials and Methods
2.1. Grass Cultivation and wet fractionation
Lolium perenne (var. Abosan 1, DLF Seeds A/S, Denmark) was cultivated in two different batches. Seeds were planted in seed boxes with Forest Gold, pH 6, soil (Pindstup, Denmark) consisting of 70% sphagnum and 30% wood fiber soil and placed in a FITOCLIMA 5.000 PLH (Aralab, Portugal) climate chamber (18 h light/6 h dark, 195 μmol·m−2·s−1, 21/19 °C, 50% relative humidity). Batch 1 and 2 were cultivated for 48 and 50 days respectively, and the soil was kept moist during the cultivation. Both batches were wet fractionated immediately after harvest using an Angelia 8500 S juicer (Angel Co., Netherland) at standard settings. Batch 1 juice was used for protein separation (protein fractions), while batch 2 was used for analysis of the raw grass, pulp, and juice (initial crude fractions).
2.2. Crude protein estimation and dry matter analysis
Crude protein was estimated by elemental analysis using a FlashSmartTM CHNS/O (Thermo-Fisher Scientific, USA). Lyophilized grass, pulp, and juice were cryogenically ground, and 2-3 mg was packed in soft tin capsules. Acetanilide (OAE Labs, UK) was used as a reference standard for calibration and analyses were run on CN mode with helium as carrier gas at a flow rate of 140 mL/min. The combustion furnace temperature was 950 °C and the detector oven temperature was 50 °C. Crude protein content was calculated from the nitrogen content by using the nitrogen-to-protein conversion factor of 6.25. All samples were analyzed as triplicates.
Dry matter content (DM) of grass and pulp was determined by drying 2-5 g of biomass at 105 °C overnight. The DM of the juice was determined using 20 µL and drying it overnight at 60 °C. All samples were analyzed with at least three replications.
2.3.1. D SDS-PAGE
One-dimensional SDS-PAGE was performed under both reducing and non- reducing conditions using surePAGE 4-20% polyacrylamide gels (Genscript, USA) and a Tris-MOPS SDS Running Buffer system (Genscript). Liquid samples of protein fraction were mixed with SDS sample buffer (50 mM Tris pH 6.8, 2% SDS, 10% glycerol, 0.02% bromophenol blue, 12.4 mM EDTA, and, for reducing gels, 1 M DTT) and ddH2O in a 10:7:5 ratio and subsequently incubated for 10 min at 95 °C and 200 rpm. For solid samples (crude fractions), lyophilized biomass was incubated in sample buffer for 10 min at 95 °C, centrifuged, and supernatant recovered for SDS-PAGE analysis. The amount of dry biomass and volume of liquid fractions was standardized, according to crude protein estimation and Qubit concentration (see below), respectively, to reach 18 μg protein in the wells. The electrophoreses were carried out at 160 V for 40 to 60 min until the dye front reached the bottom of the gel and subsequently stained over night with InstantStain Coomassie blue (Kem-En-Tec Nordic A/S, Denmark) before imaging using a ChemDoc MP imaging System (BioRad, USA).
2.4. Protein Fractionation by Size Exclusion Chromatography
The juice from batch 1 was centrifuged at 3134 rcf for 20 min, and the supernatant was immediately transferred to new tubes and centrifuged at 14100 rcf for 10 minutes. Subsequently, the supernatant was filtered through a 0.45 μm LABSOLUTE sterile filter (TH. Geyer, Denmark). The green juice was separated by size exclusion chromatography (SEC) using an NGC chromatography system (Bio-Rad) equipped with a 320 mL HiPrepTM 26/60 with Sephacryl® S-200 (dextran-acrylamide copolymer) HR column (Cytiva, France). The column was washed and subsequently equilibrated using 0.2 M phosphate buffer (pH 6.5) according to the manufacture’s guidelines. Ten mL of the centrifuged and filtered green juice was injected into the system. Using a flow rate of 1.8 mL/min, fractions of 4 mL were collected while absorbance at 280 nm and conductivity were measured. The protein concentration and the 260/280 ratio were subsequently measured by UV-spectroscopy using an SDS-11 FX (Denovix, USA) at standard settings (1 Abs = 1 mg/mL). All protein fractions were kept cool at pH 6.5 throughout the rest of the experimental work.
2.4.1. Size Estimation of Protein Fractions
To generate a calibration curve, standards (all Cytiva) including 1 mL Blue Dextran 2000 (2 mg/mL in MilliQ) and a calibration mix consisting of ovalbumin (4 mg/mL in PBS), conalbumin (3 mg/mL in PBS), and aldolase (4 mg/mL in PBS) was injected and monitored at 280 nm with a flow rate of 1.2 mL/min. The distribution coefficient (Kd) for the standards was calculated by:
where Ve is the elution volume, V0 is the void volume and Vc is the column volume. The calibration curve was constructed by plotting Kd against the logarithmic molecular weight (MW) of the standard proteins. By linear regression, the MW can be estimated for the fractions based on the average elution volume of each fraction.
2.5. DPPH Radical Scavenging Activity Screening and Fraction Selection
Each SEC fraction was screened for radical scavenging activity (RSA) through the DPPH assay, according to Nicklisch and Waite [35] with minor adjustments. Briefly, the assay was performed in 96 well microplates (Flat base & Transparent, Sardstedt, Germany) using a working volume of 150 μL. The protein fractions were standardized in volume and subjected to two-fold tree-point dilution series using phosphate buffer. Subsequently, Triton X-100 (AppliChem, Germany) and methanolic DPPH (Sigma Aldrich, Denmark) were added to reach final concentrations of 0.3 %(V/V) and 300 μM, respectively. Trolox (TCI, Ireland) was used as a positive control, and PBS as negative control. Furthermore, blanks of Trolox or protein fraction, phosphate buffer, and Triton X-100 were made to determine and account for background absorbance. The microplates were incubated for 1 hour (darkness, ambient temperatures, 200 rpm), and subsequently absorbance was measured at 517 nm on a Spark microplate reader (Tecan, Switzerland). The absorbance was converted into a percentage of RSA by the following equation:
where AS is absorbance measured for the sample, AB is absorbance for the blanks, and AC is absorbance for the negative control. All samples were analyzed as three-point dilution series. Based on empirical observations, high DPPH radical scavenging, as well as a desire to cover different parts of the MW range, 15 fractions were selected for further downstream analyses.
2.6. Quantification of Antioxidant Properties in Selected Protein Fractions
Prior to further downstream analyses, the selected fractions were purified to remove potential interference from buffer salts and other components, ensuring a better estimate of concentrations.
2.6.1. Desalting and protein concentration determination
The selected fractions were desalted using PD-10 (Sephadex G-25 resin) columns (Cytiva) according to manufacturer’s guidelines with ddH2O as eluent. The protein concentrations of PD-10 eluates were quantified using the QubitTM Protein Assay Kit and Qubit4 Fluorometer (Invitrogen, USA).
2.6.2. Protein Concentration
To increase protein concentration, approximately 3 mL of each fraction was lyophilized, and resuspended in 1.5 mL Milli-Q water. To check that all protein was solubilized, samples were centrifuged at 600 rcf for 5 minutes. If protein was not solubilized after two rounds of vortexing and 10 min sonication, the supernatant was used. Protein concentration in the resuspended samples was measured by Qubit, as previously described. The concentration range used for DPPH radical scavenging was based on results from DPPH screening. As the iron chelating assay was not employed for screening (incompatible with PBS), similar concentrations as the DPPH assay were used.
2.6.3. DPPH Radical Scavenging Activity
The DPPH RSA assay was performed similarly to described above. Briefly, a working volume of 60 μL was used and a dilution series with a dilution factor of 1.25 was made using Milli-Q water. Trolox was used as a positive control with concentrations ranging from 18.8 to 75 μM and included on all analyzed microplates.
2.6.4. Iron Chelation Activity
The iron chelating activity (ICA) of the protein fractions was investigated according to the method of Sabeena Farvin et al. [36] with minor adjustments. The same initial concentrations of protein fractions, dilution factor and working volume were used as described for the DPPH RSA assay. FeCl2 (Alfa Aesar, MA, USA) and Ferrozine (Serva, Germany) solutions were added to the microplate, reaching final concentrations of 40 μM and 200 μM, respectively. EDTA (AppliChem) was used as a positive control with concentrations ranging from 1.6 to 50 μM and included on all analyzed microplates. A negative control without EDTA and a blank without Ferrozine was made, following the same principle as for the DPPH assay. The microplates were incubated for 10 minutes (darkness, ambient temperatures, 200 rpm). Absorbance was measured at 562 nm using a Spark microplate reader (Tecan).
2.6.5. EC50 Calculations
Percentages of RSA and ICA were calculated as described above. The blanks for Trolox and EDTA also served as blanks for all fractions. A linear or logarithmic regression was fitted to the activity against the concentrations to account for the expected sigmoidal shape of the curve. The aim was the best curve fit at 50% activity, where a linear trend is expected. If data points were positioned above 80% activity a logarithmic curve fit was used. EC50 was calculated depending on a linear or logarithmic model. EC50 values were converted to molar concentrations by using the estimated average MW for each fraction based on mean SEC retention volume of the respective fraction.
2.7. Bottom-Up Proteomics by LC-MS/MS
Quantitative protein identification by bottom-up proteomics (BUP) was performed for both the selected SEC fractions and the initial crude fractions. Due to the different nature of the samples, different sample preparation methods were employed during preparation.
2.7.1. In-Solution Digest of Selected SEC Fractions
A volume of desalted protein fractions, corresponding to a protein mass of 10 μg, was collected and lyophilized overnight for proteomic analysis by MS. The lyophilized fractions were resuspended in 20 μL digestion buffer (1 %(V/V) sodium deoxycholate (SDC, Sigma) in 50 mM triethylammonium bicarbonate (TEAB, Merck)), heated to 99 °C on a heating block for 8 minutes, and afterwards cooled below 37 °C. The samples were incubated for 30 minutes at 37 °C with 0.8 μg tris(2-carboxyethyl)phosphine hydrochloride (TCEP, Sigma-Aldrich) before 1 μg iodoacetamide (IAA, Fluka Biochemika, Switzerland) was added and incubation continued for another 20 minutes in the dark. To digest the proteins, 0.2 μg Sequencing grade Trypsin (Promega, USA) was added and the samples were incubated overnight at 37 °C. To precipitate the SDC, formic acid (FA, VWR, Denmark) was added to a final concentration at 0.5 %(V/V) and incubated for 5 minutes at ambient temperatures. The digests were centrifuged at 11336 rcf for 20 minutes at 4 °C. The supernatant from each fraction was collected and further centrifuged for 20 minutes just before microcolumn purification using in-house prepared C-18 StageTips according to Rappsilber et al [37]. The purified samples were dried using a vacuum concentrator before resuspension and analysis.
2.7.2. Protein Extraction and in-Solution Digest of Crude Fractions
The initial crude fractions (grass, juice and pulp) were prepared in triplicates using the iST kit for plant tissue (PreOmics, Germany) according to manufacturer guidelines with minor modifications. Briefly, lyophilized biomass corresponding to 70 ug protein (by N*6.25) was weighed off in LoBind tubes (Eppendorf, Germany), dissolved in 800 uL Lyse buffer, and heated to 95°C for 5 minutes at 1000 rpm in a Thermomixer (Eppendorf). Next, solution and as much biomass as possible was transferred to a 1 mL AFA tube (Covaris, USA) for focused ultrasonication-assisted extraction using a M220 focused ultrasonicator (Covaris). For the fibrous fractions (raw grass and pulp), samples were subjected to four cycles of the protein extraction protocol specified by the manufacturer (peak incident power of 75 W, a duty factor of 10%, 200 cycles per burst, and 180 s per cycle at 6°C), while the more soluble juice fraction was subjected to one cycle. Next, samples were transferred to new LoBind tubes and heated to 95°C at 1000 rpm for another five minutes. Samples were cooled and followed by addition of resuspended Trypsin/LysC for digestion at 37°C and 500 rpm for three hours. Afterwards, the digests were transferred to iST cartridges for washing (including “Wash 0” for plant tissue), double elution, drying, and resuspension as described by the manufacturer.
2.7.3. LC-MS/MS Analysis
The dried peptide samples were resuspended in 20 μL buffer (2 %(V/V) acetonitrile, 0.1 %(V/V) formic acid for protein fractions and “LC Load” from iST kit for crude fractions) and peptide concentration was measured with UV-spectroscopy at standard settings (1 Abs = 1 mg/mL) and diluted as required. The buffer served as a blank. Samples were loaded onto a 96-well microplate (Thermo Scientific). The microplate was covered with sealing tape and loaded into an ultra-high-performance liquid chromatography system (nLC-1200, Thermo) with ESI coupled to a Q Exactive HF tandem mass spectrometer (Thermo). Approximately 1 μg digest was loaded on a PEPMAP precolumn (75 μm x 2 cm, C18, 3 μm, 100 Å) followed by separation on an analytical PEPMAP column (75 μm x 50 cm, C18, 2 μm, 100 Å). The mobile phase, consisting of solvent A (0.1 %(V/V) formic acid) and solvent B (80 %(V/V) acetonitrile, 0.1 %(V/V) formic acid), was run with a stepwise gradient from 5 % solvent B to 100 % solvent B. The sample loading volume and flow were 20 μL and 8 μL/min, respectively. For protein fractions, a gradient of 60 minutes was employed while for the initial crude fractions, a 90-minute gradient was employed to increase analytical depth. For both methods, the remaining settings were identical. The analysis was run in a full MS/ddMS2 data-dependent mode with an MS1 scan range of 300-1600 m/z, positive polarity, and a default charge of 2. The MS1 resolution was 60000, while the dd-MS2 resolution was 15000. TopN, AGC target, and Maximum IT were set to 20, 1e5, and 45 ms, respectively. Isolation window, (N)CE, and Dynamic exclusion window were set to 1.2 m/z, 28 eV, and 20.0 s, respectively. Peptide match was preferred, and isotopes were excluded.
2.7.4. LC-MS/MS Data Processing
LC-MS/MS data was processed with MaxQuant v.2.2.0.0 [38]. The database for MaxQuant built-in Andromeda search engine [39]was built by selecting all proteins in the UniProt database from both the target species L. perenne (taxid = 4522) with 824 protein sequences (downloaded May 2nd 2024) and the reference proteome of the model species Brachypodium distachyon (UP000008810) with 45301 protein sequences (downloaded May 2nd 2024). The processing with MaxQuant was performed with oxidation of methionine and protein N-terminal methylation as variable modification and cysteine carbamidomethylation as a fixed modification, while trypsin (up to 2 missed cleavages was allowed) was assigned as the specific protease. The allowed m/z deviation was 4.5 ppm. Minimum peptide size was set to be 7 amino acids and maximum peptide size was set to 4600 Da. A false discovery rate of 1% was employed on both peptide- and protein-level. Match between runs watch and dependent peptides was enabled. Quantification was performed by intensity-based absolute quantification (iBAQ) for all data and MaxLFQ (triplicate analysis) for the crude fraction data.
2.7.5. Downstream Data Analysis of MaxQuant Data from SEC Fractions
Downstream processing of MaxQuant data for SEC fractions was performed with R version 4.4.1 (https://www.R-project.org/) with the following packages: tidyverse 2.0.0; dplyr 1.1.4; readxl 1.4.3; heatmaply 1.5.0; ggplot2 3.5.1; patchwork 1.2.0; UniprotR_2.4.0.
The identified proteins were filtered for removal of contaminants and reverse proteins. The protein data was then split into three groups containing: lead proteins without fragments, lead proteins with fragment annotation but with other proteins of the same name within the group, or lead protein with fragment annotation and without any full-length proteins in the group. For the latter two groups with lead proteins as fragments, the iBAQ was recalculated from the raw MS1 intensity and marked with a “*” in the protein name.
For lead proteins fragments where there are lead proteins of the same name without fragment annotation the following formular is used:
where iBAQrec is the recalculated iBAQ for the protein group, ΣIp is the sum of peptide intensities for the protein group, and TPmax is the maximum of theoretical peptides for a protein of the same name without fragment annotation within the protein group.
In the latter case, where the lead protein was annotated as a fragment and there were no full-length proteins of the same name within the group, a different approach was employed to correct iBAQ intensities. The theoretical number of peptides (TPmax) was determined through either another lead protein with the same name in the dataset (but not in the protein group) or by identified proteins from a BLAST search on the fragment lead protein. The selected proteins from BLAST search were aligned with the fragment's amino acid sequence and the one with best coverage, and similarity was used for calculating the theoretical number of peptides and a recalculated iBAQ value (see supplementary information). The molecular weight of these proteins was changed to BLAST hit proteins, since this number corresponded to the number of theoretical peptides. All iBAQ recalculations were done protein- and sample-wise.
Isoform Combination
Different UniProt IDs may be annotated with identical protein names and thus represent isoforms of the same protein with similar bioactivity/function. As a result, they receive individual iBAQ values, which may underestimate the abundance of a particular protein type/group and their overall significance when evaluating abundance distribution due to additive effects. To account for this, proteoforms with precisely the same names were pooled together under one name and their riBAQ values were summarized. The isomers were named after the name, which appeared first in alphabetical order, and the number of isoforms was written in parentheses.
Gene Ontology Analysis
Gene Ontology (GO) annotations were imported using UniProt IDs with the UniProtR package. A list of all GO annotations was examined to pick out those relevant to antioxidant activity. These were used to filter the dataset for in silico antioxidant prediction. The annotations used were GO:0034599 (cellular response to oxidative stress), GO:0009055 (electron carrier activity), GO:0042542 (response to hydrogen peroxide), GO: 0006979 (response to oxidative stress) as well as keywords "metal ion binding", "chaperone activity", "iron", "oxidative", "superoxide", "transition", "proton", "ferri", and "ferre".
2.7.6. Downstream Data Analysis of Crude Fractions
The identified proteins from the MaxQuant search were initially filtered for removal of contaminants and false positives. Next, the data was inspected for reproducibility using an inclusion criterion of positive identification in at least two of three replicates for each sample. Venn diagrams were created by Venny v 2.1 (https://bioinfogp.cnb.csic.es/tools/venny/index.html). Relative molar abundance was estimated by riBAQ quantification as described above.
MaxQuant LFQ data for triplicates of crude fractions was analyzed using Mass Dynamics 2.0 [40]. Missing values were imputed by NMAR with a mean position actor of 1.8 and a SD factor of 0.3. For pairwise analysis, proteins were considered significantly and differentially abundant if the adjusted p-value was below 0.05 (i.e. false discovery rate (FDR) < 5%) and the fold change ratio was greater than two (i.e. log2(FC) > 1).
2.8. Statistical Analysis
Statistical analysis was performed in GraphPad Prism (10.0.2) using ANOVA with a 95% confidence level. For dry matter and crude protein, ordinary ANOVA and multiple comparisons by Tukey was applied. For riBAQ protein abundance, Welch ANOVA (equal SDs not assumed) and multiple comparisons by Dunnett T3 was applied. For enrichment analysis of MaxQuant LFQ data from the initial crude fractions, statistical analysis was performed in Mass Dynamics (2.0) as described above. For hierarchical clustering and heatmap representation, a Euclidean distance of 3 row-wise Z-score normalization was applied for proteins identified as differential by the built-in ANOVA analysis.
3. Results and Discussion
3.1. Protein Characterization of Wet Fractionation
Since the method of primary processing influenced mass balances, the three fractions; Grass, pulp, and juice were analyzed in relation to DM and CP (Table 1).
The absolute mass distributions after wet fractionation for pulp and juice were similar, however approximately 10% of absolute mass (7.9 g) was lost. This was ascribed to be predominantly loss of water as the DM and CP balance was practically void of any loss (0.1% and 0.3%, respectively). Approximately 41% of the CP and 37% of the DM ended up in the juice. As a result of wet fractionation, the pulp became significantly enriched (p < 0.03) in DM, while the juice was significantly enriched for CP compared to unprocessed grass (p = 0.030) and pulp (p = 0.003). The CP and DM distributions were similar to literature, where the shares of CP and DM for green juice were reported as 40-60% and 30-50%, respectively [41]. Additionally, the CP% was less compared to literature, where CP for ryegrass, pulp and juice were 16.7+-2.7%, 16.4+-3.5%, and 15.1+-3.9% respectively [7]. These variations in literature also indicate differences between harvests, which could influence protein profile.
The protein profiles of grass, pulp and juice were analyzed by SDS-PAGE under both reduced and non-reduced conditions to investigate difference in migration patterns (Fig. 1A). Across all samples and conditions, a complex distribution and composition of proteins was detected. Notably, bands at approximately 50 kDa and 15 kDa were seen in at much higher intensity in the raw biomass compared to pulp and green juice. These correspond well with the expected monomeric bands of RuBisCO (hexadecameric complex: 560 kDa, large subunit: 56 kDa, small subunit: 16 kDa [14]). This indicated the primary processing may induce aggregation or increased formation of the hexadecameric complex. This was further substantiated by the reduced band intensities under non-reducing conditions where a higher proportion of protein was also observed at the top of the wells, as the size of the complex was above the resolving range of the gel. While the focus of grass protein research so far mainly has been on RuBisCO, these protein profiles also showed the intrinsic complexity of the ryegrass proteome and presence of other proteins, which could have nutritional or functional value.
LC-MS/MS analysis provided more detailed profiles of the grass, pulp and juice fractions in terms of identification and proteins not detectable by SDS-PAGE. After filtering of common contaminants (9) and false positives (14), a total of 1084 protein groups were identified across all samples at 1% FDR (Appendix A). Hereof, 860, 885, and 875 protein groups were quantified in at least two of three replicates in grass, pulp, and juice, respectively. Among these, the majority (762 protein groups) were identified in at least two replicates in all three fractions (Fig. 1B). The slightly higher number of protein IDs within the pulp and juice fractions may be a result of the mechanical processing during wet fractionation, providing increased accessibility of certain proteins. Not surprisingly, the majority of identified protein consisted of RuBisCO, which accounted for 34.6-38.2%, 32.9-35.0%, and 34.9-39.3% of the molar abundance (by riBAQ) in grass, pulp, and juice, respectively, when combining all isoforms of its small and large subunits (Appendix A). As the cumulative RuBisCO abundance was comparable across the crude fractions, this further suggests significant changes in complex- and/or aggregation state when comparing monomeric band intensities from SDS-PAGE analysis (Fig. 1A). In the crude fractions, various photosystem proteins (12.2-15.1%), ATP synthase subunits (5.6-7.4%), and chlorophyll a-b binding proteins (4.6-9.2%) were also identified as major constituents (Appendix A).
Figure 1.
Protein distribution in grass (G), pulp (P), and juice (J). A) SDS-PAGE analysis performed under reduced (*) and non-reduced conditions. B) Venn diagram of protein groups quantified in at least two of three replicates for grass (blue), pulp (green), and juice (yellow) by LC-MS/MS analysis.
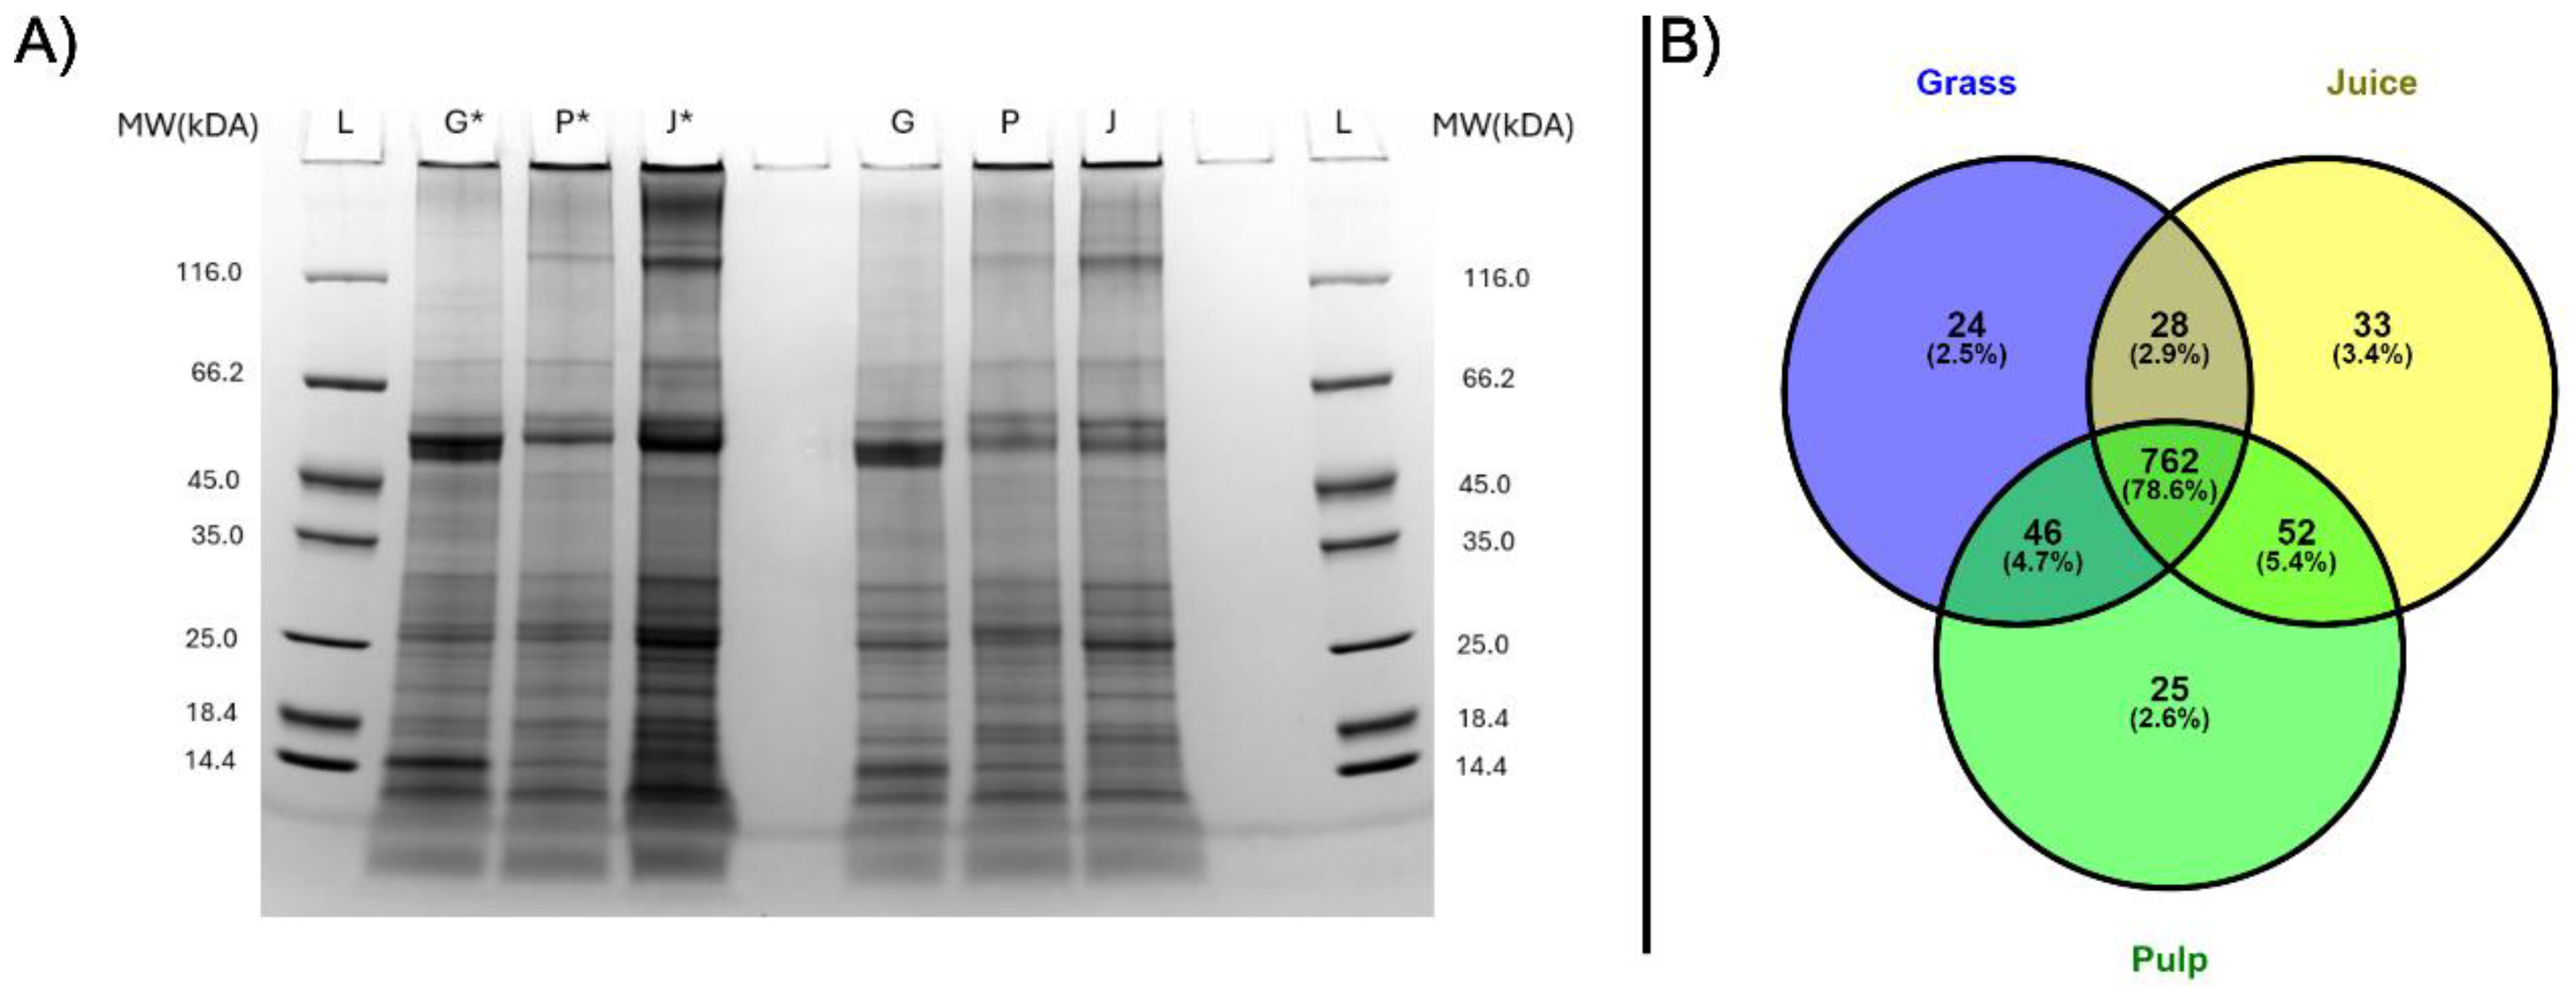
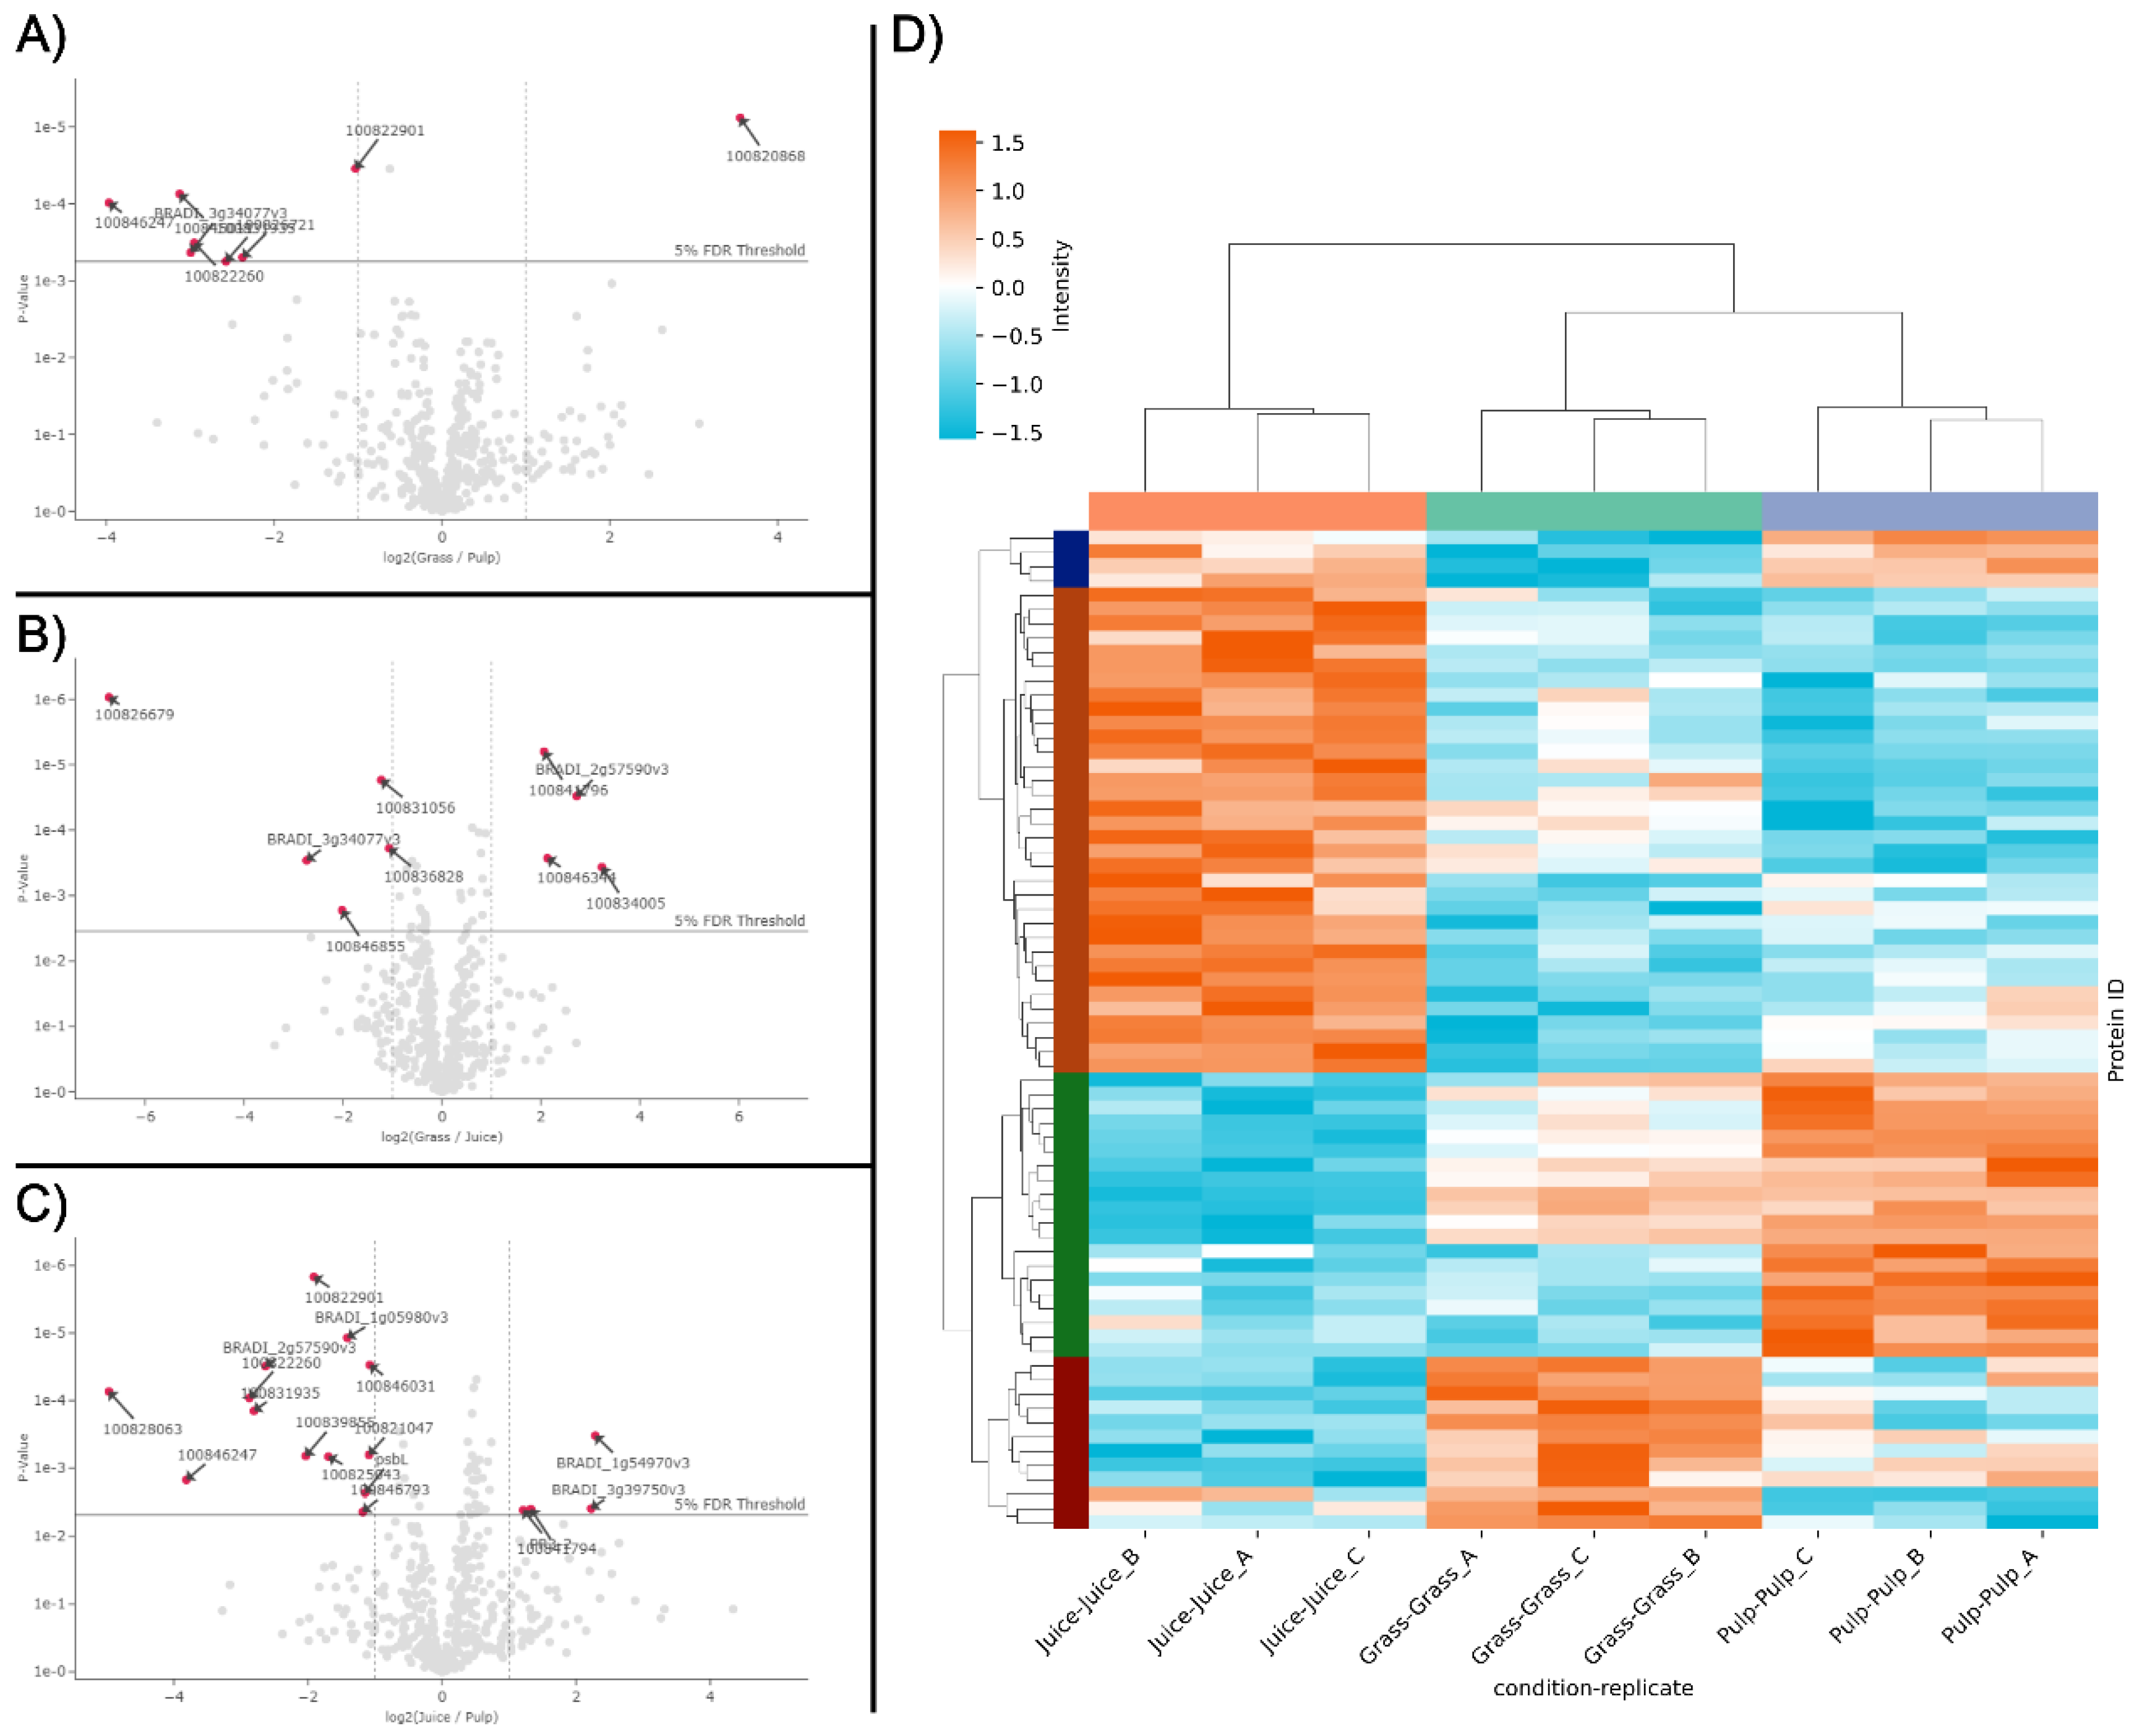
While the protein identifications from LC-MS/MS analysis showed a high level of comparability between the fractions (Fig. 1B), in line with SDS-PAGE analysis (Fig. 1A), differences were also apparent. This was further substantiated through e.g. PCA analysis, where the three crude fractions cluster explicitly (Fig. S1). To investigate this further and in a quantitative manner, an enrichment analysis was performed using normalized LFQ intensities (Fig. 2). When comparing the pulp to the raw biomass (grass), seven proteins were significantly (log2 fold change > 1; 5% FDR threshold) enriched while one was significantly depleted (Fig. 2A). Comparing the juice to the raw biomass, five proteins were significantly enriched while four were significantly depleted (Fig. 2B). In the last pair-wise comparison of juice to pulp, four proteins were significantly enriched while 13 were significantly depleted (Fig. 2C). Of these 34 differentially abundant proteins between crude fractions (Table S1), it should be noted that the majority (23) relied on imputed values, why the fold-change should be interpreted with some caution. Notably, four of the seven proteins enriched in the pulp compared to the raw grass (two beta-glucosidases (I1GNA1 and I1GNA2), Cytochrome c domain-containing protein (I1I9E4), and Pectinesterase (I1HEX8)) were also found to be enriched in the pulp compared to the juice. This indicated a degree of selectivity during wet fractionation, with these proteins preferentially localized in the residual pulp. This observation was further supported by the differential heatmap representation (Fig. 2D), which revealed four distinct clusters with specific enrichment patterns across the fractions. The heatmap included 80 protein groups identified as differentially abundant by ANOVA analysis of normalized LFQ intensities, providing a comprehensive overview of differential protein distribution across all three fractions. Moreover, replicates of fractions were grouped by hierarchical clustering, which was further validated through PCA analysis of data variance (Fig. S1). These results indicate a high degree of reproducibility in upstream sample preparation using the iST kit for plant tissue.
Figure 2.
Differentially abundant proteins in the three crude fractions. Volcano plots of differentially abundant proteins in pair-wise comparisons of grass and pulp (A), grass and juice (B), as well as juice and pulp (C). Differentially abundant proteins (log2 fold change > 1, adjusted p-value < 0.05 (5% FDR threshold)) are indicated by arrows and red dots and annotated by gene name (see Table S1). D) Heatmap representation of differentially abundant proteins (rows) across replicates of all three crude fractions. In the heatmap, normalized LFQ intensities are standardized using row-wise Z-scores and proteins are clustered by similarity using a cluster distance of three. Crude fractions and replicates (columns) are clustered hierarchically.
3.2. Protein Fractionation and Selection
The filtered green juice containing soluble protein was separated by size exclusion chromatography, which yielded 62 fractions (Fig. 3A). From the calibration experiment, the void volume was determined to be 94.7 mL (Fig. S2). A massive peak in 280 nm UV absorption was detected in fraction 4 - 8. While the apex could not be identified and due to partial overlap with the void volume, an MW estimation could not be explicitly performed. Nevertheless, the MW range corresponded well with the presence of a multimeric form of RuBisCO of 560 kDa in the green juice, corroborating the indications hereof from SDS-PAGE and initial quantitative proteomic analysis. The presence of multimeric RuBisCO after pressing of green biomass prior to any downstream processing has recently been reported from spinach [19] and alfalfa [42]. Two other peaks in 280 nm UV absorption were detected at the end of the chromatogram, which are expected to be small aromatic compounds, e.g. polyphenols, due to the high 260/280 ratio and the low estimated MW based on column calibration.
Figure 3.
Production and selection of ryegrass green juice fractions. A) Size exclusion chromatogram, protein concentrations, and 260/280 ratios. Size exclusion chromatogram showing absorbance at 280 nm relative to elution volume. The upper limit for absorbance measurements was 2800 mAU. Each collected fraction is denoted by number. Corresponding measurements of protein concentration (by A280, 1 A = 1 mg/mL) and A260/280 ratio obtained via UV-spectroscopy for each fraction are also shown. B) Activity of selected fractions for each dilution in the DPPH radical scavenging screening. Pictures of the assay results are seen above the graphs for each fraction. The background color of some protein fractions influenced absorption, and therefore certain data points are excluded due to negative activity values.
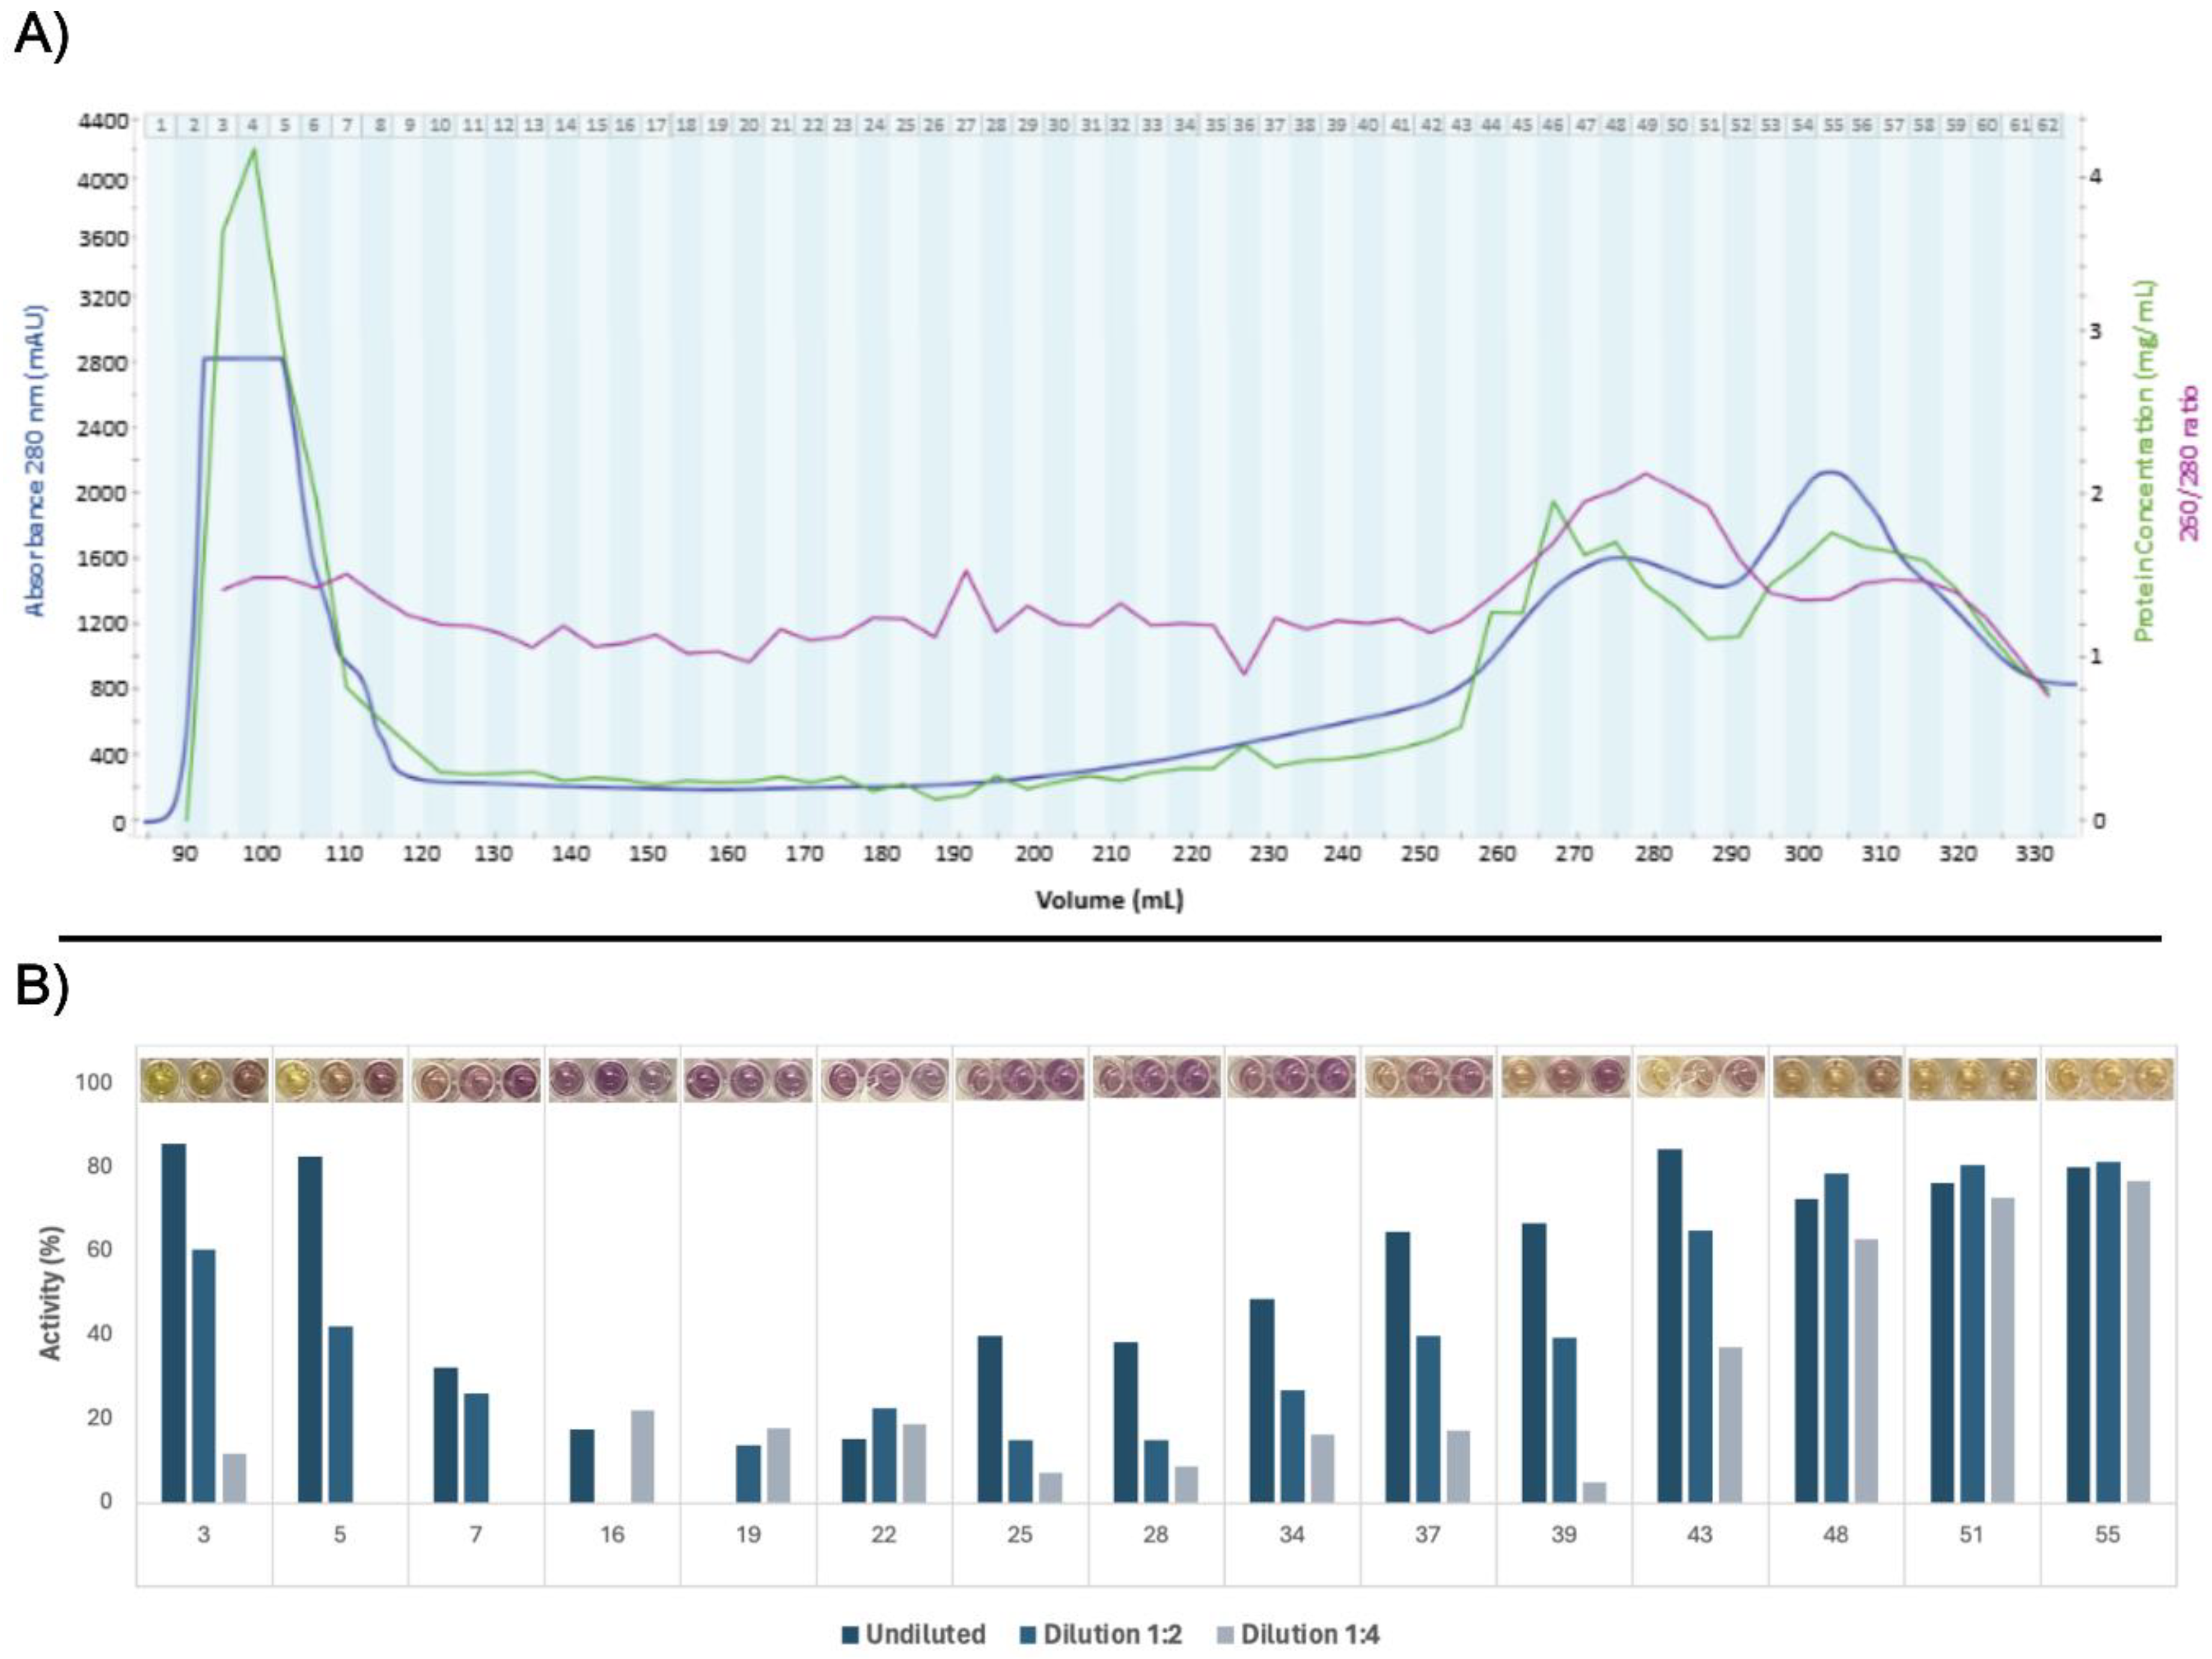
All 62 fractions were screened for DPPH radical scavenging activity, which served as basis for selecting 15 fractions for further investigations of antioxidant activity (Fig. 3B). The first six and last 30 fractions exhibited evident activity under the equivolumetric conditions (Fig. S3), which may reflect the high content of proteins and aromatic compounds, respectively, within these fractions based on high A280 (Fig. 3A). However, fractions were selected to cover all parts of the chromatogram, since protein concentration were not standardized in the crude screening assay. Late eluting fractions were included despite the presumed composition of small aromatic compounds. Iron chelation screening could not be performed due to chelation of ferrous iron by the phosphate buffer.
3.3. Ex Vivo Antioxidant Activity
Two in vitro assays, DPPH radical scavenging and iron chelation, were conducted on the selected fractions to evaluate the ex vivo antioxidant capacity of the green juice. The activity was evaluated based on a EC50 value, which was defined as the concentration of antioxidants that caused a 50% decrease in absorbance. Thus, the lower the EC50 value, the higher the DPPH radical scavenging or iron-chelating ability of the antioxidant. Ideally, the experimental data to calculate an EC50 value should fit a sigmoidal curve [43]. Due to narrow concentration spans, only parts of the sigmoidal curve were observed, and therefore a linear fit was used for DPPH radical scavenging and a logarithmic fit for iron chelation (Appendix B). Additionally, certain protein fractions were excluded due to the unavailability of curve fitting, despite the observation of activity.
Since the assays were normalized based on protein mass concentration, the interpretation of activity could be erroneous by differences in protein size, which conflicted with the stoichiometry in the reaction. Hence, EC50 values (Table 2), were converted to molar concentrations by using experimental calibration and estimated MW for each fraction to assess activity based on molar concentration rather than mass concentration. Due to the limited availability of lyophilized fractions, replicates were not performed. As the positive controls exhibited variation, identifying the most active protein fractions was associated with some uncertainty. It should be noted that antioxidant activity was quantifiably measured among closely adjacent fractions, which were assumed to have similar molecular composition. These fractions displayed comparable EC50 values and overall trends were consistent. This indicates the presence of antioxidant proteins with the potential to prolong oxidation period of the green juice. Therefore, determining the quantitative protein-level composition in each fraction was of particular interest.
3.4. Overview of Protein Composition and Most Abundant Proteins
The protein composition of the selected protein fractions was analyzed by LC-MS/MS. From the MaxQuant database search, 1277 protein groups matched the UniProt entries for L. perenne on the taxonomic level and the reference proteome of Brachypodium distachyon. After accounting for protein fragments as well as filtering contaminants and false positive protein IDs, 1204 proteins remained (Fig. 4, Appendix C). iBAQ values for each protein group were calculated by MaxQuant, and was a measure of protein abundance, where raw intensities were divided by the number of theoretically observable peptides. Thus, iBAQ values are proportional to the molar quantities of the proteins [44,45]. As the iBAQ values were not normalized, the abundance of proteins cannot be compared across fractions. Only the presence of proteins and how much of the total protein within a fraction they constituted could be compared.
Figure 4.
Quantitative overview of protein composition for selected protein fractions. The protein iBAQ (+ 1 to avoid infinity numbers) within each fraction was log2-transformed to better illustrate the broad dynamic range of protein abundances and represented in a heatmap from low (blue) to high (yellow) abundance to inspect protein-level composition and variability between SEC fractions.
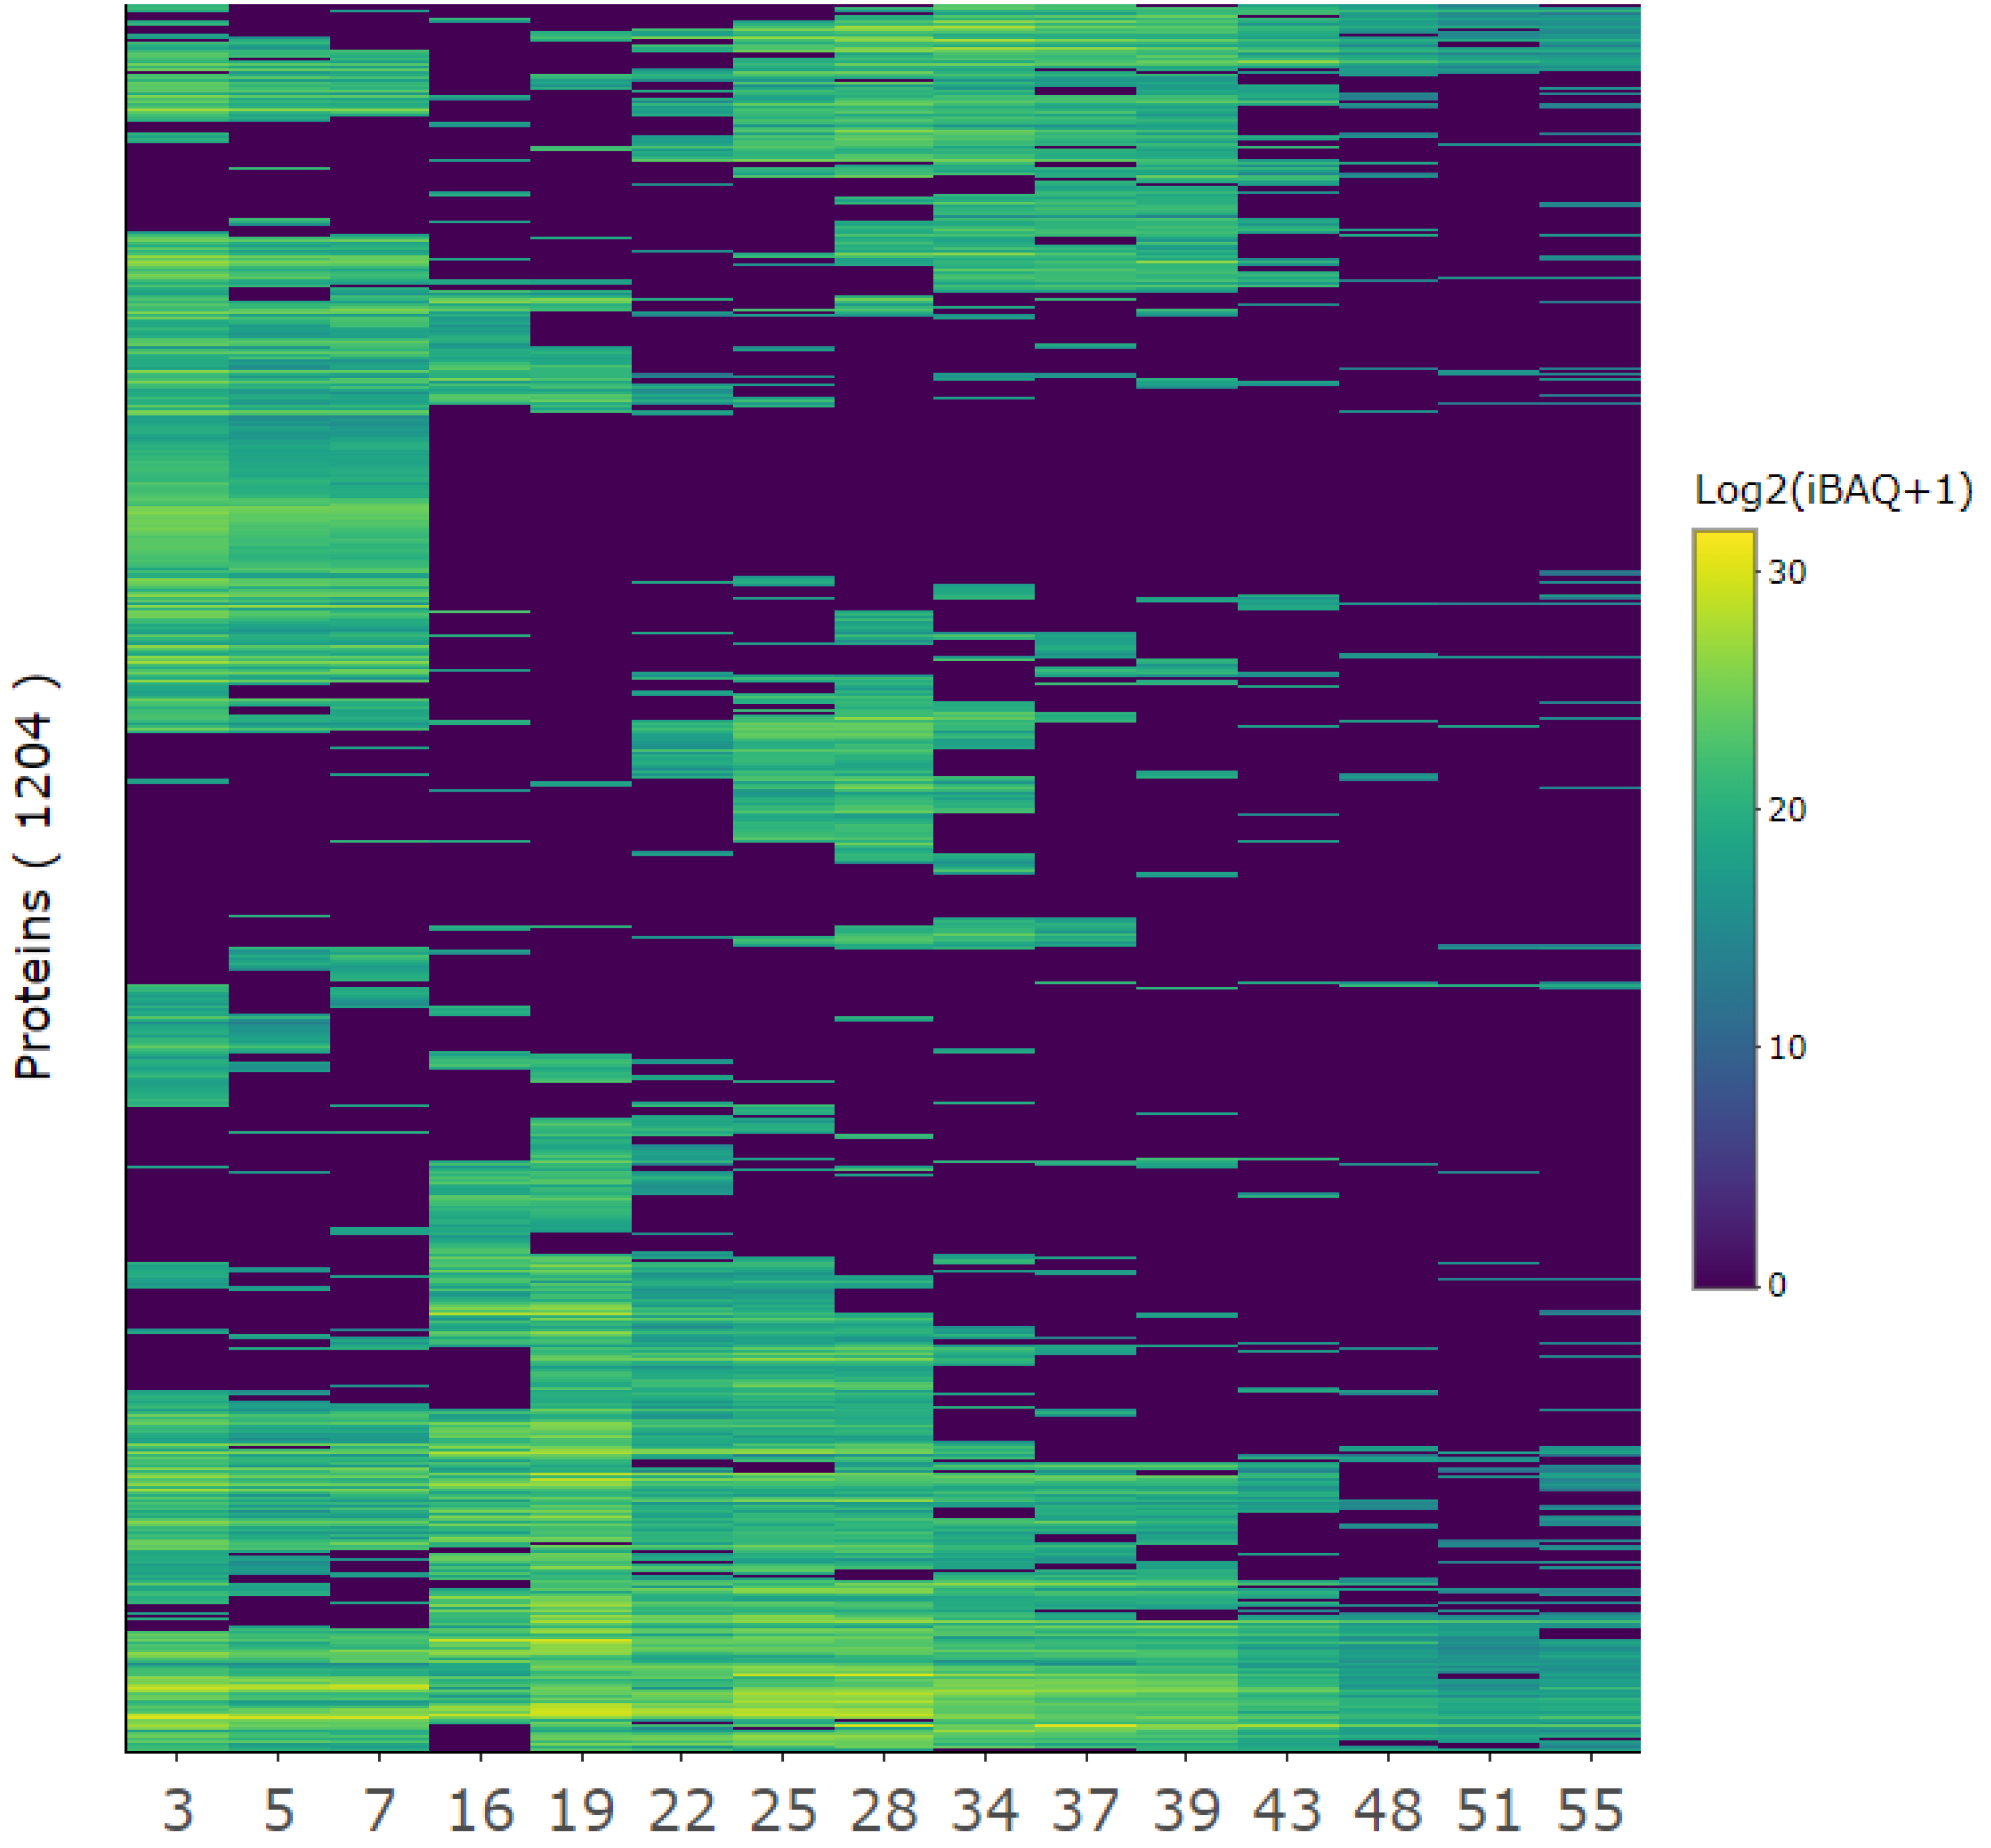
A diverse range of proteins was identified in each fraction, with a general trend indicating that earlier fractions contained a greater diversity of proteins compared to later fractions (Fig. 4). Fractions that eluted closely together displayed similar protein profiles, forming distinct clusters. For example, fractions 3, 5, and 7 showed higher similarity to one another than to later fractions. This corroborated similar EC50 values for adjacent SEC fractions (Table 2). Despite the detected clustering, certain proteins were detected across multiple fractions, with some even appearing in all fractions, suggesting inefficient separation during fractionation. This could be due to interactions with the column, as noted previously in the SEC chromatogram. However, while clustering was evident and certain proteins were consistently detected across fractions, each fraction maintained a unique protein composition.
To investigate the most abundant proteins across the juice fractions, proteins with a TriBAQ (i.e. total riBAQ) value above 0.5% were identified (Fig. 5). Proteins presented as isomers are characterized as distinct entities in UniProt but were manually combined if they shared identical protein names, giving 859 unique protein annotations from the 1204 proteins (Appendix D). This combination aimed to give a more realistic view of iBAQ of a certain protein class based on assumed similarity in functionality.
Figure 5.
Fractional distribution of the most abundant proteins across all selected fractions. A) Metadata for selected fractions, showing molecular size in kDa estimated from SEC and the EC50 values from the DPPH and FeFz assay. B) Distribution and abundance of the most abundant proteins (TriBAQ > 0.5%) across selected fractions. The TriBAQ column corresponds to the total relative abundance of proteins, all fractions combined. The gradient for fraction columns corresponds to riBAQ of filtered proteins within each fraction from low (blue) to high (yellow). The protein riBAQ within each fraction was log2-transformed and + 1 is added to avoid infinity numbers. The UniProt AC# of uncharacterized proteins and the numbers of protein isomers are presented in parenthesis. Proteins with a (*) indicate that the lead protein was a fragment and the iBAQ was therefore recalculated, while proteins beginning with a (+) are known antioxidant proteins from literature. C) The blue gradient shows broad MW range, while the number in each cell shows the actual MW or the MW range of grouped isoforms. For RuBisCO small subunit and Glycerate dehydrogenase, the MW of the best BLAST hit is used, since this size was used for recalculation of their iBAQ and riBAQ values.
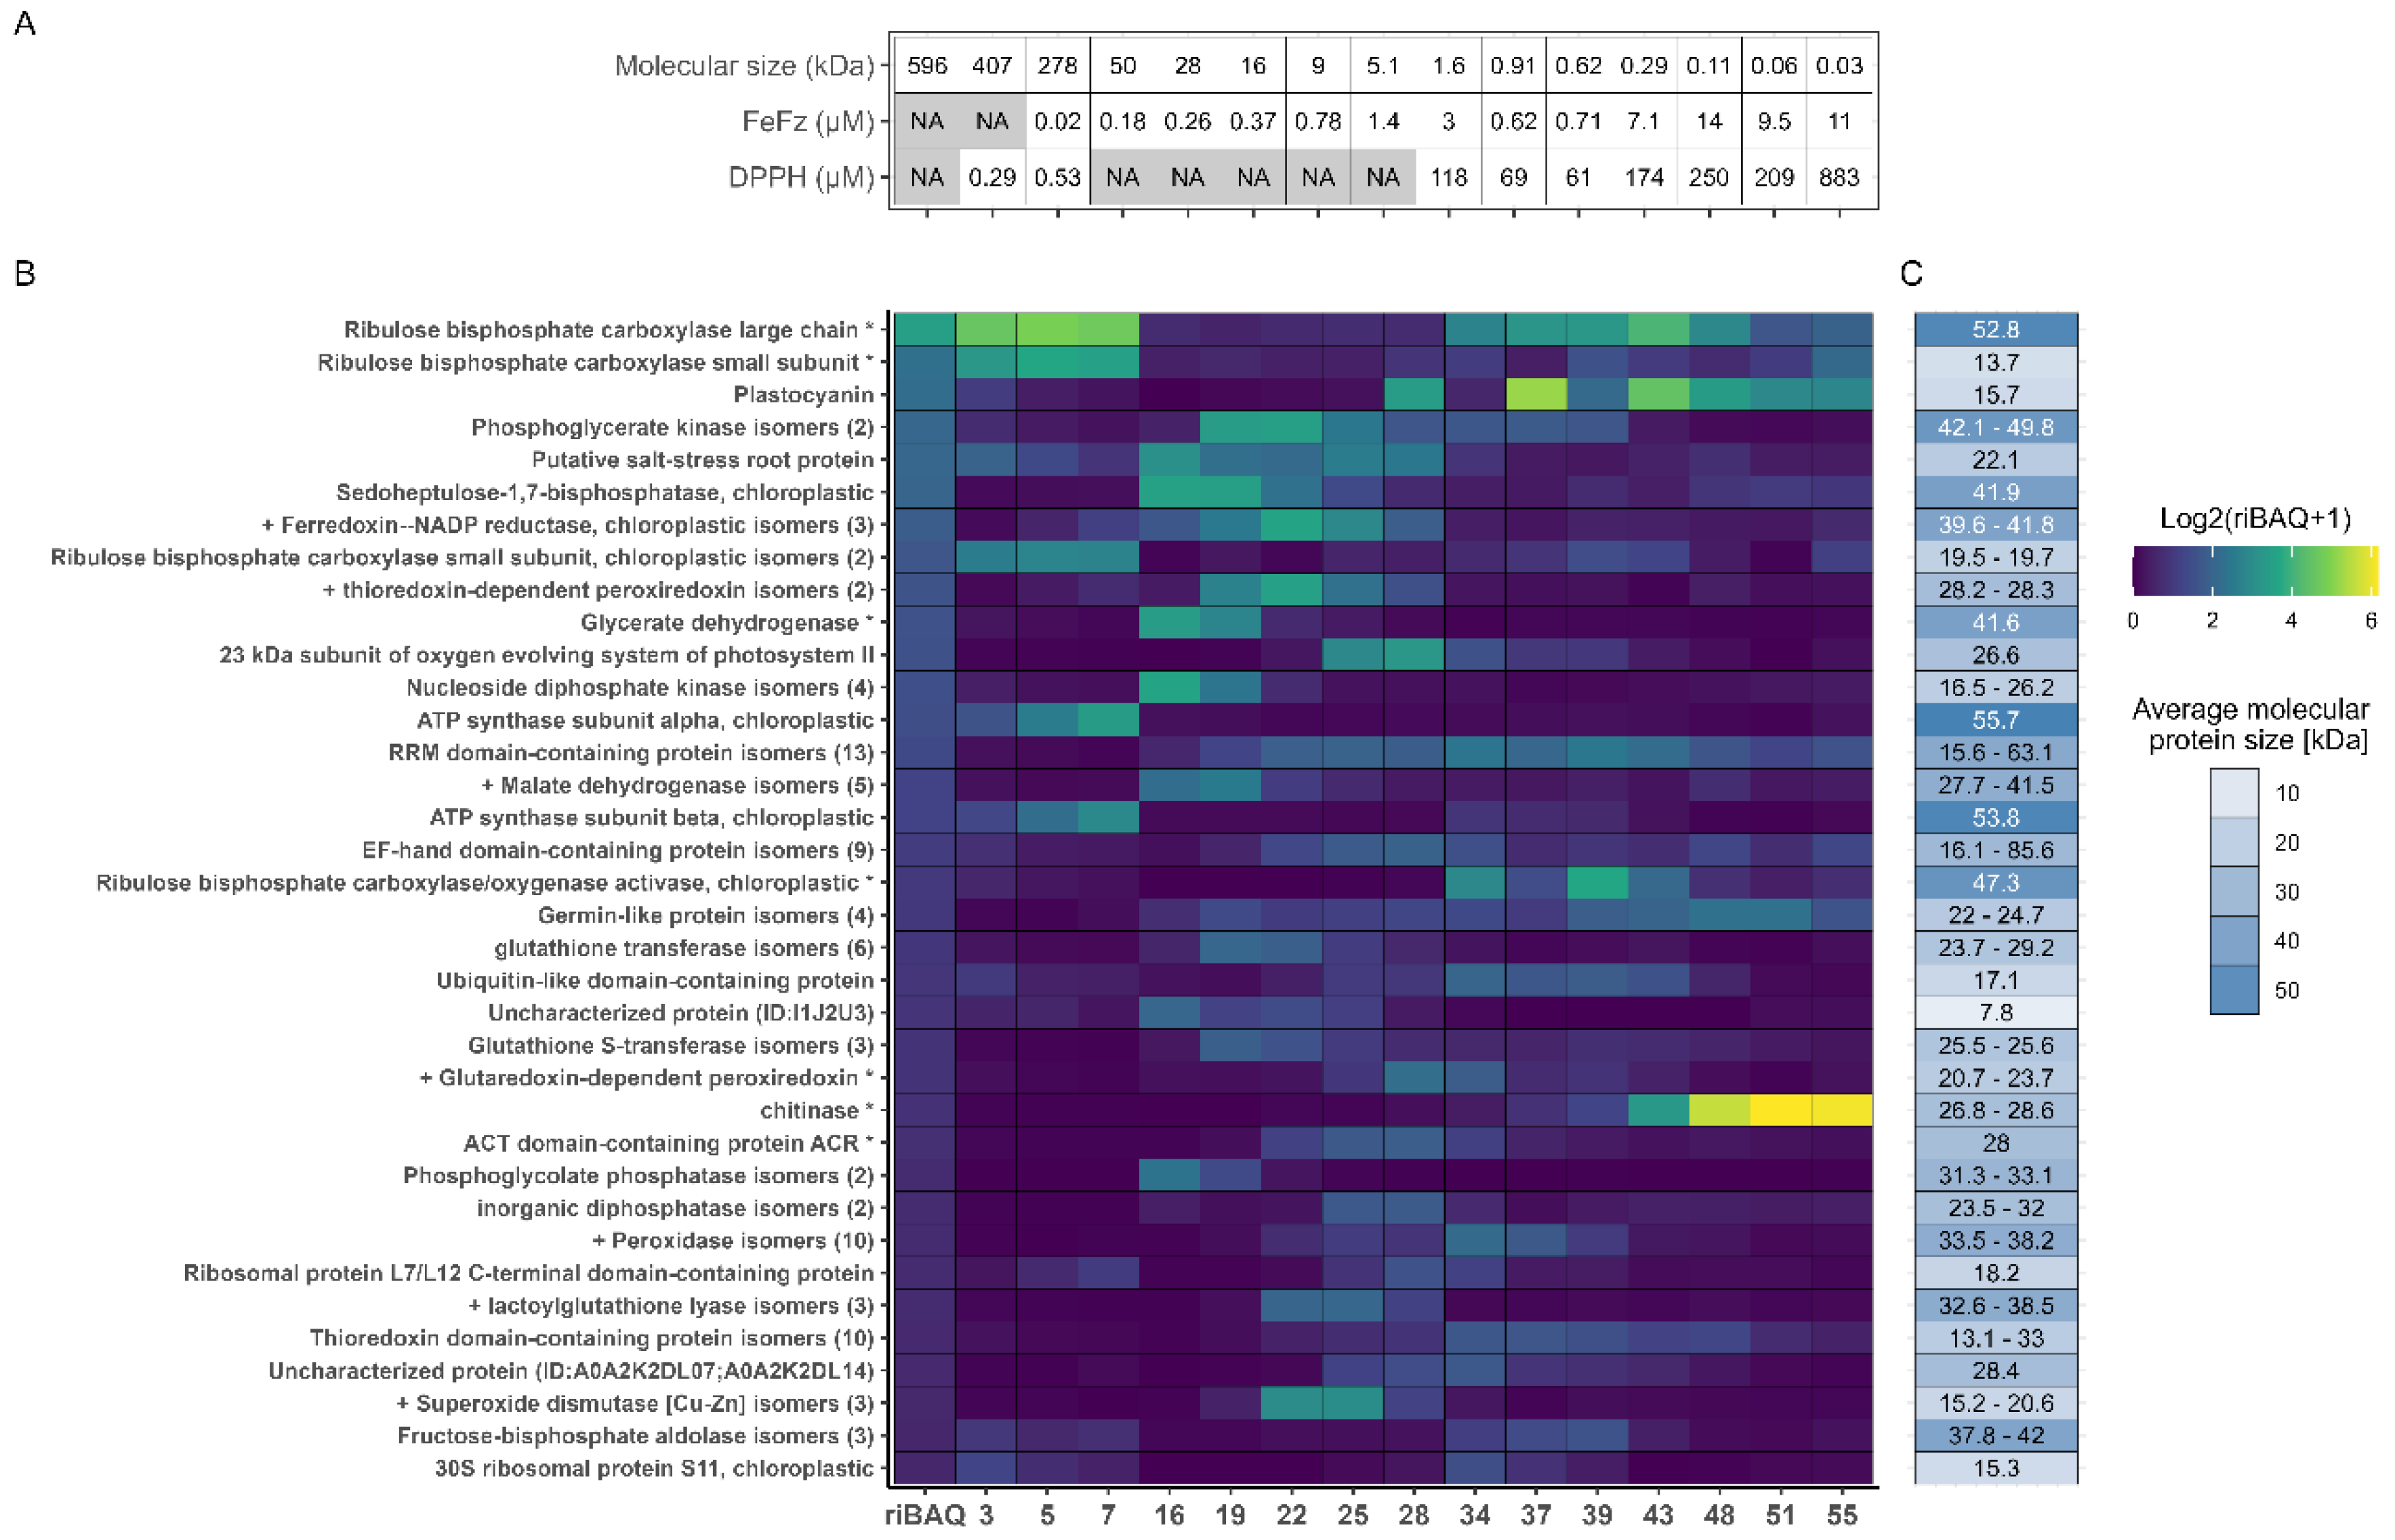
Across all investigated fractions, the most abundant proteins were the large and small subunits of RuBisCO. This is consistent with the quantitative analysis of the unfractionated juice (Appendix A) and the fact that RuBisCO is the most abundant leaf protein across plant species. In general, most of the 36 abundant proteins were associated with photosynthesis, cellular respiration, or other fundamental cellular processes. Additionally, proteins involved in oxidative stress response, such as thioredoxin-dependent peroxiredoxin, superoxide dismutase, and different peroxidases, were identified as highly abundant. Since only proteins with a TriBAQ exceeding 0.5% across all fractions were included in the analysis, proteins with high abundance in a single fraction but low abundance in others may be overlooked.
The riBAQ values of the 36 proteins in each fraction were analyzed to examine the distribution of the most abundant proteins across the fractions. Certain proteins were detected in multiple fractions. For instance, RuBisCO large subunit was found in all fractions with high abundance in both the first and the last fractions. It was expected that RuBisCO subunits would appear in high abundance in the initial fractions, due to the size of the native multimeric complex; hence their presence in the later fractions was unexpected. However, it is important to recognize that the abundance values reflected riBAQ measurements, meaning that the specific quantities may vary even if their relative shares remain consistent. Examination of the sequence coverage (data not shown) and SDS-PAGE of the 15 selected protein fractions (Fig. S4) showed that although RuBisCO large subunit was found by riBAQ to be abundant in the later fractions, the sequence coverage was low, and a no distinct bands corresponding to the RuBisCO large subunit was detected by SDS-PAGE analysis of the last fractions. Thus, peptides stemming from endogenous proteolysis of the RuBisCO large subunit might have been inaccurately presented as the whole protein. Moreover, the expected MW for the later fractions made it unfeasible for the RuBisCO large subunit to be located here. This underscored the importance of careful data interpretation and using different protein characterization methods to prevent misinterpretation of the protein composition in the fractions.
Interestingly, high abundance of chitinase was also detected in the later eluting fractions (Fig. 5). The SDS-PAGE analysis of the protein fractions revealed distinct bands around 30 kDa in fractions 43-55 (Fig. S4), which was unexpected, given that the MW in these later fractions was anticipated to be much smaller (Table 2, Fig. 5A). Chitinase from the model organism B. distachyon has a MW of approximately 34 kDa, including a 22-residue signal peptide, (UniProt AC# I1HQL2), which correspond with the band position. Due to the nature of chitinase, which catalyzes the breakdown of the β-1,4-glycoside bond of N-acetyl-D-glucosamine in chitin [46], chitinase could have interacted with the dextran-acrylamide matrix of the SEC column. Although not entirely identical, it resembled the polysaccharide structure of chitin, thus potentially facilitating this interaction.
3.5. Prediction of antioxidant proteins using GO-term analysis
Based on observed ex vivo antioxidant activity, the fractions were investigated to predict potentially responsible antioxidant proteins. The 859 proteins were filtered based on a selected molecular function GO annotations yielding 108 entries with a diverse range of molecular functions (Fig. S5).
Through literature research nine different proteins were identified to have a reported antioxidant activity. These were L-ascorbate peroxidase (APX), malate dehydrogenase (MDH), glutaredoxin-dependent peroxiredoxin (GPx), lactoylglutathione lyase (Glyoxalase I; Glo1), ferredoxin-NADP reductase (FNR), thioredoxin-dependent peroxiredoxin (TPx), two different superoxide dismutases (SOD), and the uncharacterized protein ycf33, which showed similarity to peroxiredoxin Q (Table 3). Consequently, subsequent analysis focused on these enzyme classes.
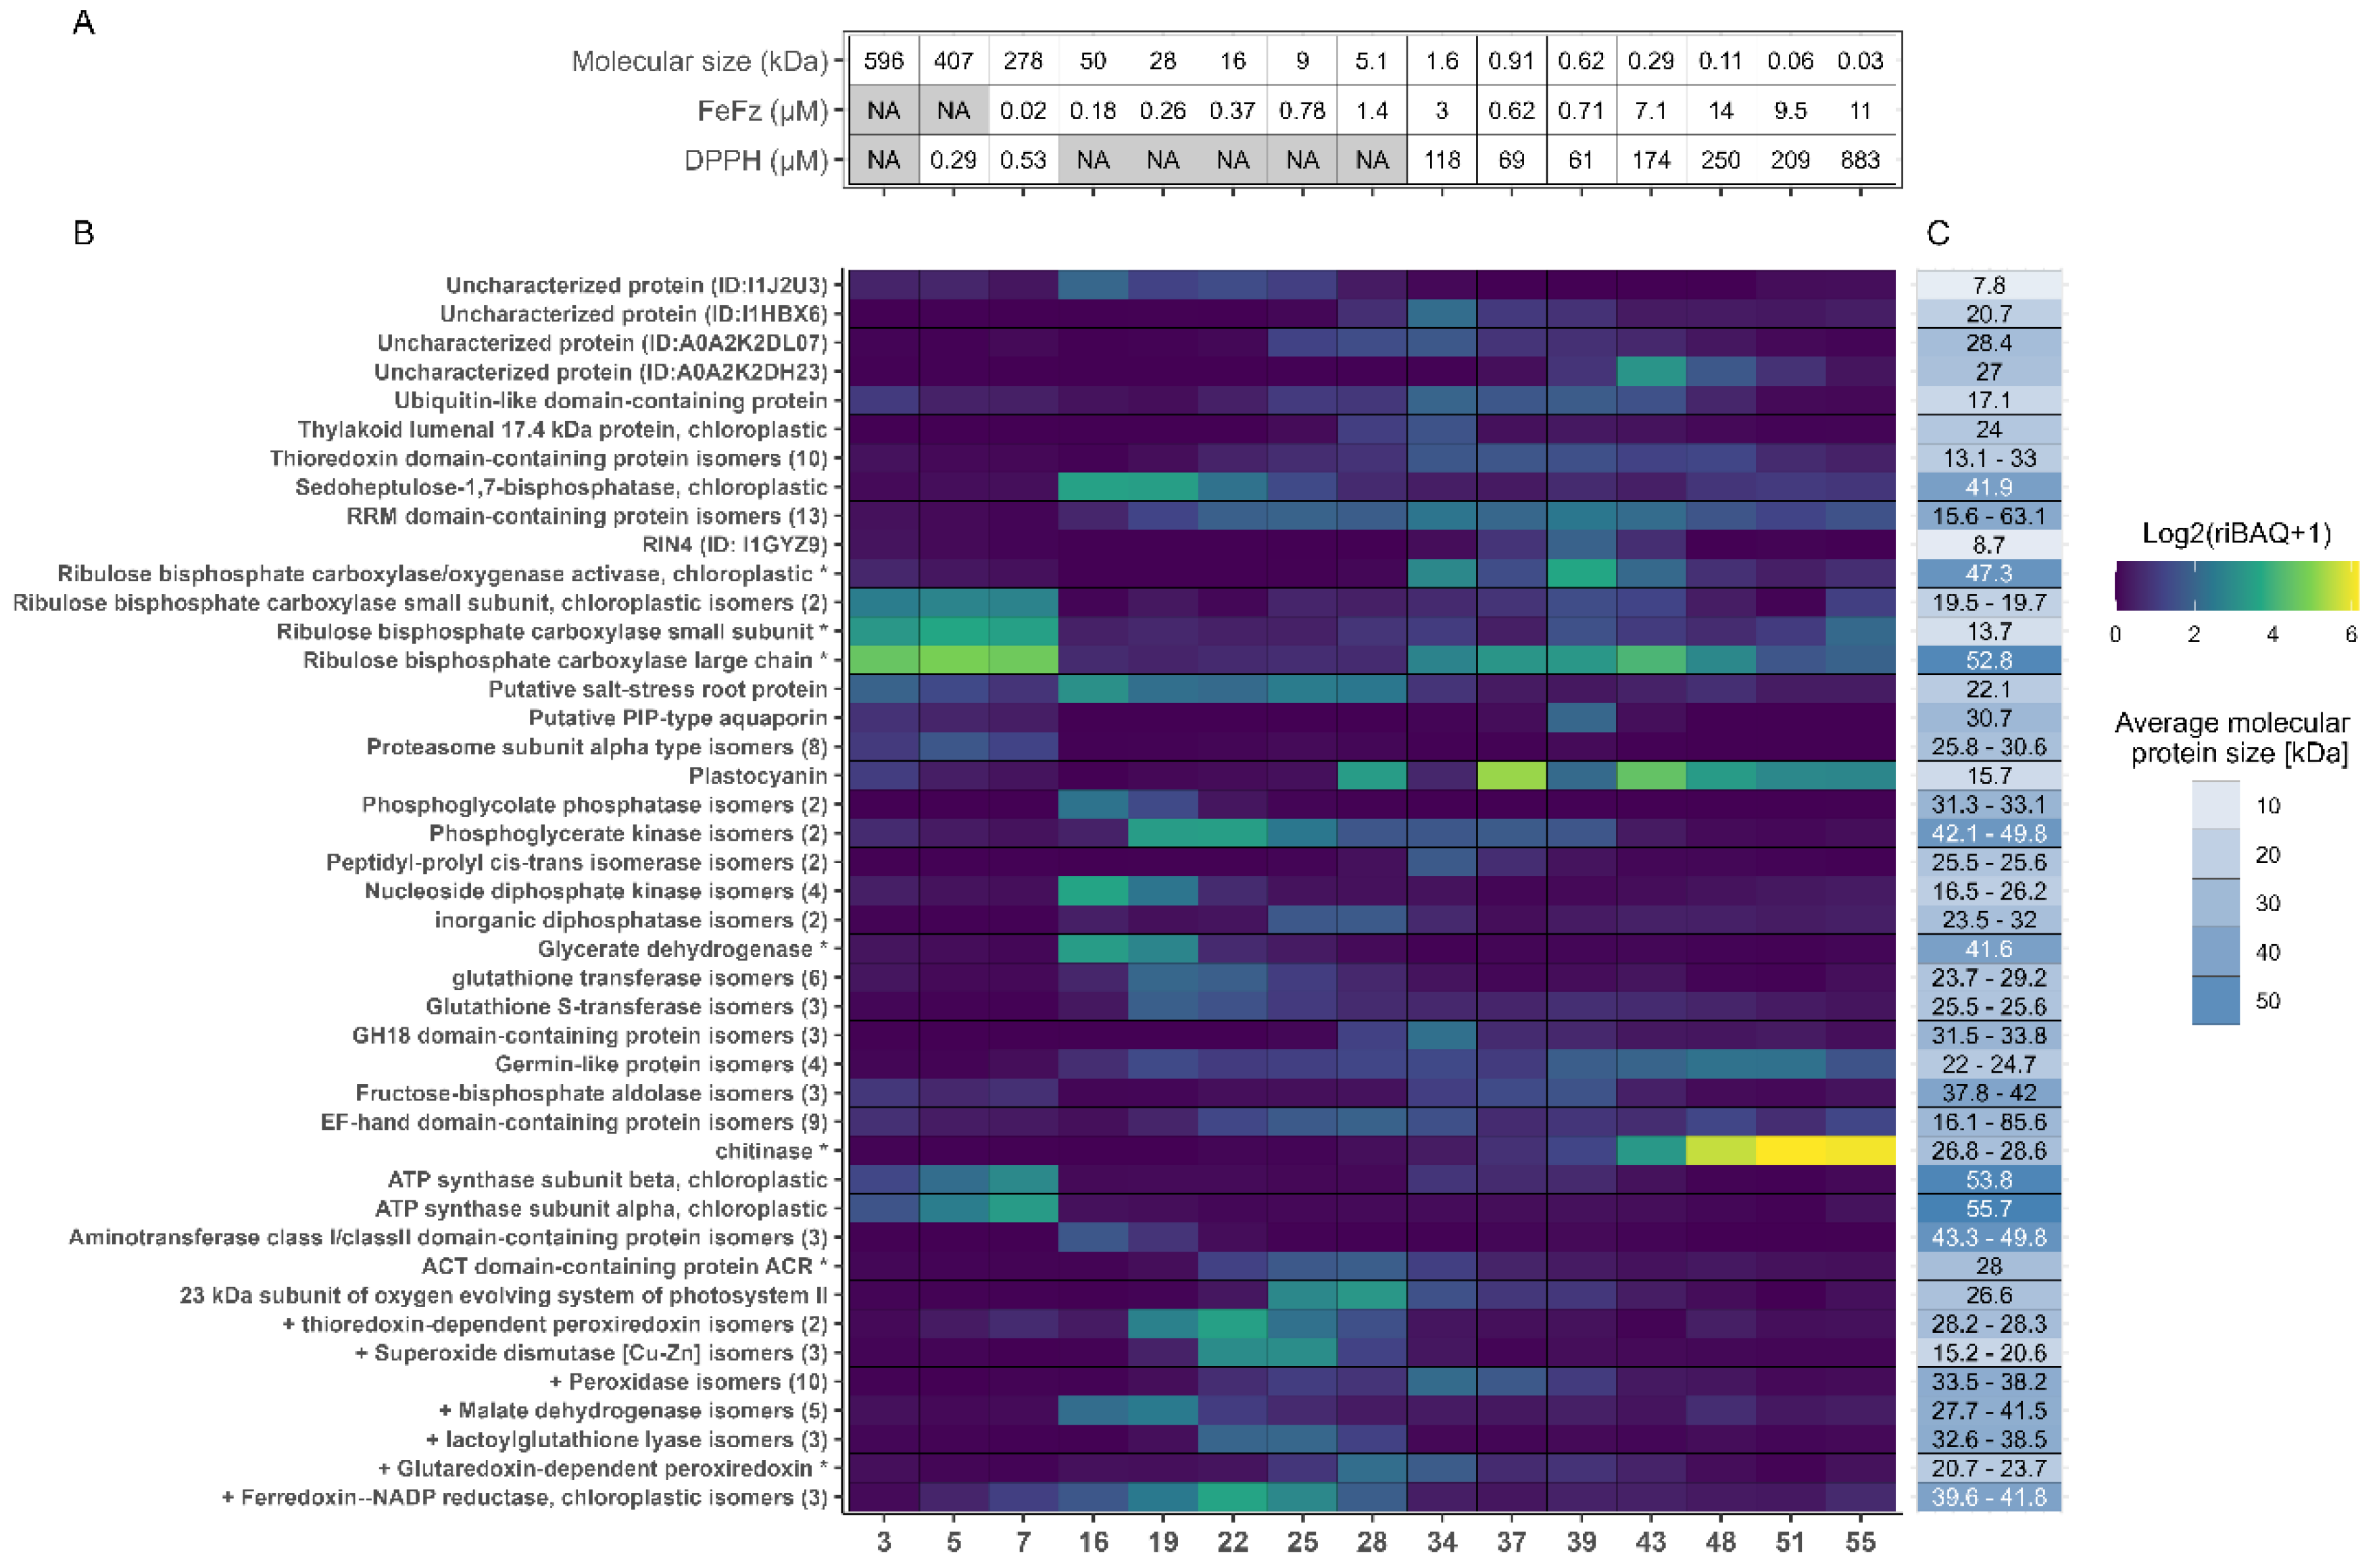
Due to potential bias in the manually selected GO annotations, an alternative method was employed to identify potentially antioxidant proteins. Rather than focusing on the most abundant proteins across all fractions (by TriBAQ), fraction-wise relative quantification (by riBAQ) was performed. Subsequently, proteins with riBAQ > 2% in any fraction were included (36 protein classes by name), under the assumption that the most abundant proteins were responsible for or contributed to the measured antioxidant activity (Fig. 6). Through a literature search of this protein subset, seven proteins with described antioxidant activity were identified, where malate dehydrogenase was found exclusively with this approach. The remaining six proteins with known in vivo antioxidant properties were also discovered using the GO-based prediction method (Table 3).
Figure 6.
Fractional distribution of the most abundant proteins across each selected fraction. A) Metadata for selected fractions, showing molecular size in kDa estimated from SEC and the EC50 values from the DPPH and FeFz assay. B) Relative quantification and fractional distributions of proteins with riBAQ > 2.0 % within at least one of the 15 selected fractions from low (blue) to high (yellow) abundance. C) Protein MW of the identified proteins, with RuBisCO small subunit and Glycerate dehydrogenase MW corresponding to their BLAST hit, since these was used for recalculation of iBAQ and riBAQ values.
3.6. Correlating Protein Abundance and In Vitro Antioxidant Activity
Fractions 5 and 7 exhibited the lowest molar EC50 values in the DPPH RSA assay, indicating the highest antioxidant activity. Both fractions showed a high abundance of RuBisCO- and ATP synthase-related proteins, as previously described. A similar protein profile was seen in Fraction 3, though its molar EC50 value was not calculated due to the lack of an estimated size (eluting in the void volume). However, based on mass EC50 value, fraction 3 aligned closely with fractions 5 and 7, suggesting a comparable antioxidant effect across the early fractions. RuBisCO and ATP synthase proteins, in their native forms, are generally not described as antioxidants in the literature. Nevertheless, known antioxidant proteins such as ferredoxin-NADP reductase (FNR) and thioredoxin-dependent peroxiredoxin (TPx) were identified in these fractions (particularly in fractions 5 and 7), with notable abundance (0.29-0.47% and 0.61-1.18%, respectively). The measured in vitro activity may originate from these proteins, however further purification and isolation would be required to validate their antioxidant potential ex vivo. While RSA activity was also detected in late eluting fractions and lower EC50 values (by mass concentration) were determined, this activity was ascribed to smaller molecules or metabolites from L. perenne based on the estimated MW within these fractions. In this respect it should be noted that the MW estimates fell outside the resolving range of the column, leading to significant uncertainty in the direct MW estimation.
In the iron chelation assay, fractions 7–22 exhibited the lowest molar EC50 values, indicating their high chelating efficiency. However, despite unavailable curve fitting, protein fractions 3 and 5 should not be disregarded, as they also demonstrated notable activity in the assay (Appendix B). Consequently, when analyzing patterns in protein abundance, these fractions should be included in the assessment. As RuBisCO is reported to chelate divalent Mg within the active site as an essential component for the enolase activity [57], this may also facilitate chelation of divalent iron as measured in the assay. As such, RuBisCO itself may display intrinsic chelating activity and could add to the oxidative stability of a product. Moreover, a large proportion of the predicted antioxidant proteins also localized in this range of fractions. For instance, malate dehydrogenase (MDH) was enriched in fractions 16-19 while predicted antioxidant proteins such as TPx, both superoxide dismutases (SOD), and FNR, were highly enriched in fraction 22, thereby indicating their potential role in iron scavenging. In contrast, Glutaredoxin-dependent peroxiredoxin (GPx) and peroxidase isoforms were enriched in later eluting fractions (28 and 34, respectively), where lower activity was measured. This indicated that these proteins were likely less responsible for iron scavenging than other antioxidant proteins predicted through GO annotation. Although several antioxidant proteins were present in the active fractions, there was no clear correlation between activity and specific protein abundance across the fractions. This suggests that the relationship between protein content and antioxidant activity may be rather complex and cannot be ascribed to single proteins but rather cumulative and/or agonistic effects.
Both prediction methods have inherent limitations, making their combination an ideal approach. In silico prediction is subject to potential bias and the inconsistency of which relevant properties were included in the GO annotations for the specific proteins resulted in uncertainty for estimating antioxidant capacity. An example of this is FNR, which uses iron as a co-factor, but was not annotated as ion binding [58]. Additionally, focusing solely on the most abundant protein in the highly active protein fraction potentially could dismiss proteins that may still have antioxidant effects even if their relative abundance fall below the selected threshold. Furthermore, only testing electron and hydrogen transfer and iron chelation mechanisms excludes other mechanisms, which might contribute to the antioxidant capacity in the green juice.
Nonetheless, the combination of the two antioxidant identification methods resulted in eight different known antioxidant protein groups being identified as abundant. However, whether these proteins were responsible for the measured ex vivo activity is somewhat ambiguous. The prediction methods were based on literature and annotations of cellular functions in vivo, why similar activity may not be retained ex vivo. As the proteins were not in their original cellular compartment, the surrounding environment as well as other proteins and co-factors diminished activity despite being recognized as antioxidants in literature. In contrast, proteins with no known antioxidant activity in vivo may exert in vitro activity when isolated. To investigate this further, a more stringent isolation and purification of individual proteins would be required, allowing to evaluate their isolated activity ex vivo.
3.7. Abundance of Known Antioxidant Enzymes in Crude Fractions
While identification of the proteins responsible for the measured antioxidant activity was associated with uncertainty, our analysis revealed substantial abundances of strong candidate proteins in the fractions showing in vitro antioxidant activity. Consequently, we investigated the dataset from the three initial crude fractions to evaluate their overall abundance and potential (Fig. 7A). Here we found that all eight protein classes were found in the unprocessed biomass with an average total abundance of 1.55% by riBAQ. Of the eight classes, FNR was the most abundant (0.47%) followed by TPx and MDH (0.34% and 0.30%, respectively). Except for the combined SOD isoforms (0.13%), the remaining groups were found at an average abundance below 0.1%.
Figure 7.
Enrichment analysis of candidate antioxidant proteins across initial crude fractions. A) Heatmap (blue to yellow) showing average (n = 3) relative molar abundance (by riBAQ) of the eight candidate protein families (identified by GO-term analysis) in unprocessed ryegrass, green juice, and residual pulp. B) Histograms and statistical analysis of riBAQ abundance of the eight candidate families and the cumulative abundance of all candidate proteins across unprocessed ryegrass (black), green juice (white), and residual pulp (grey). Abundance is indicated as mean with standard deviation (n = 3). Statistical analysis is performed by one-way ANOVA (Welch) and Dunnett T3 correction and significance level (from adjusted p-values) indicated by “ns” (p > 0.05), “*” (P ≤ 0.05), “**” (P ≤ 0.01), and “***” (P ≤ 0.001).
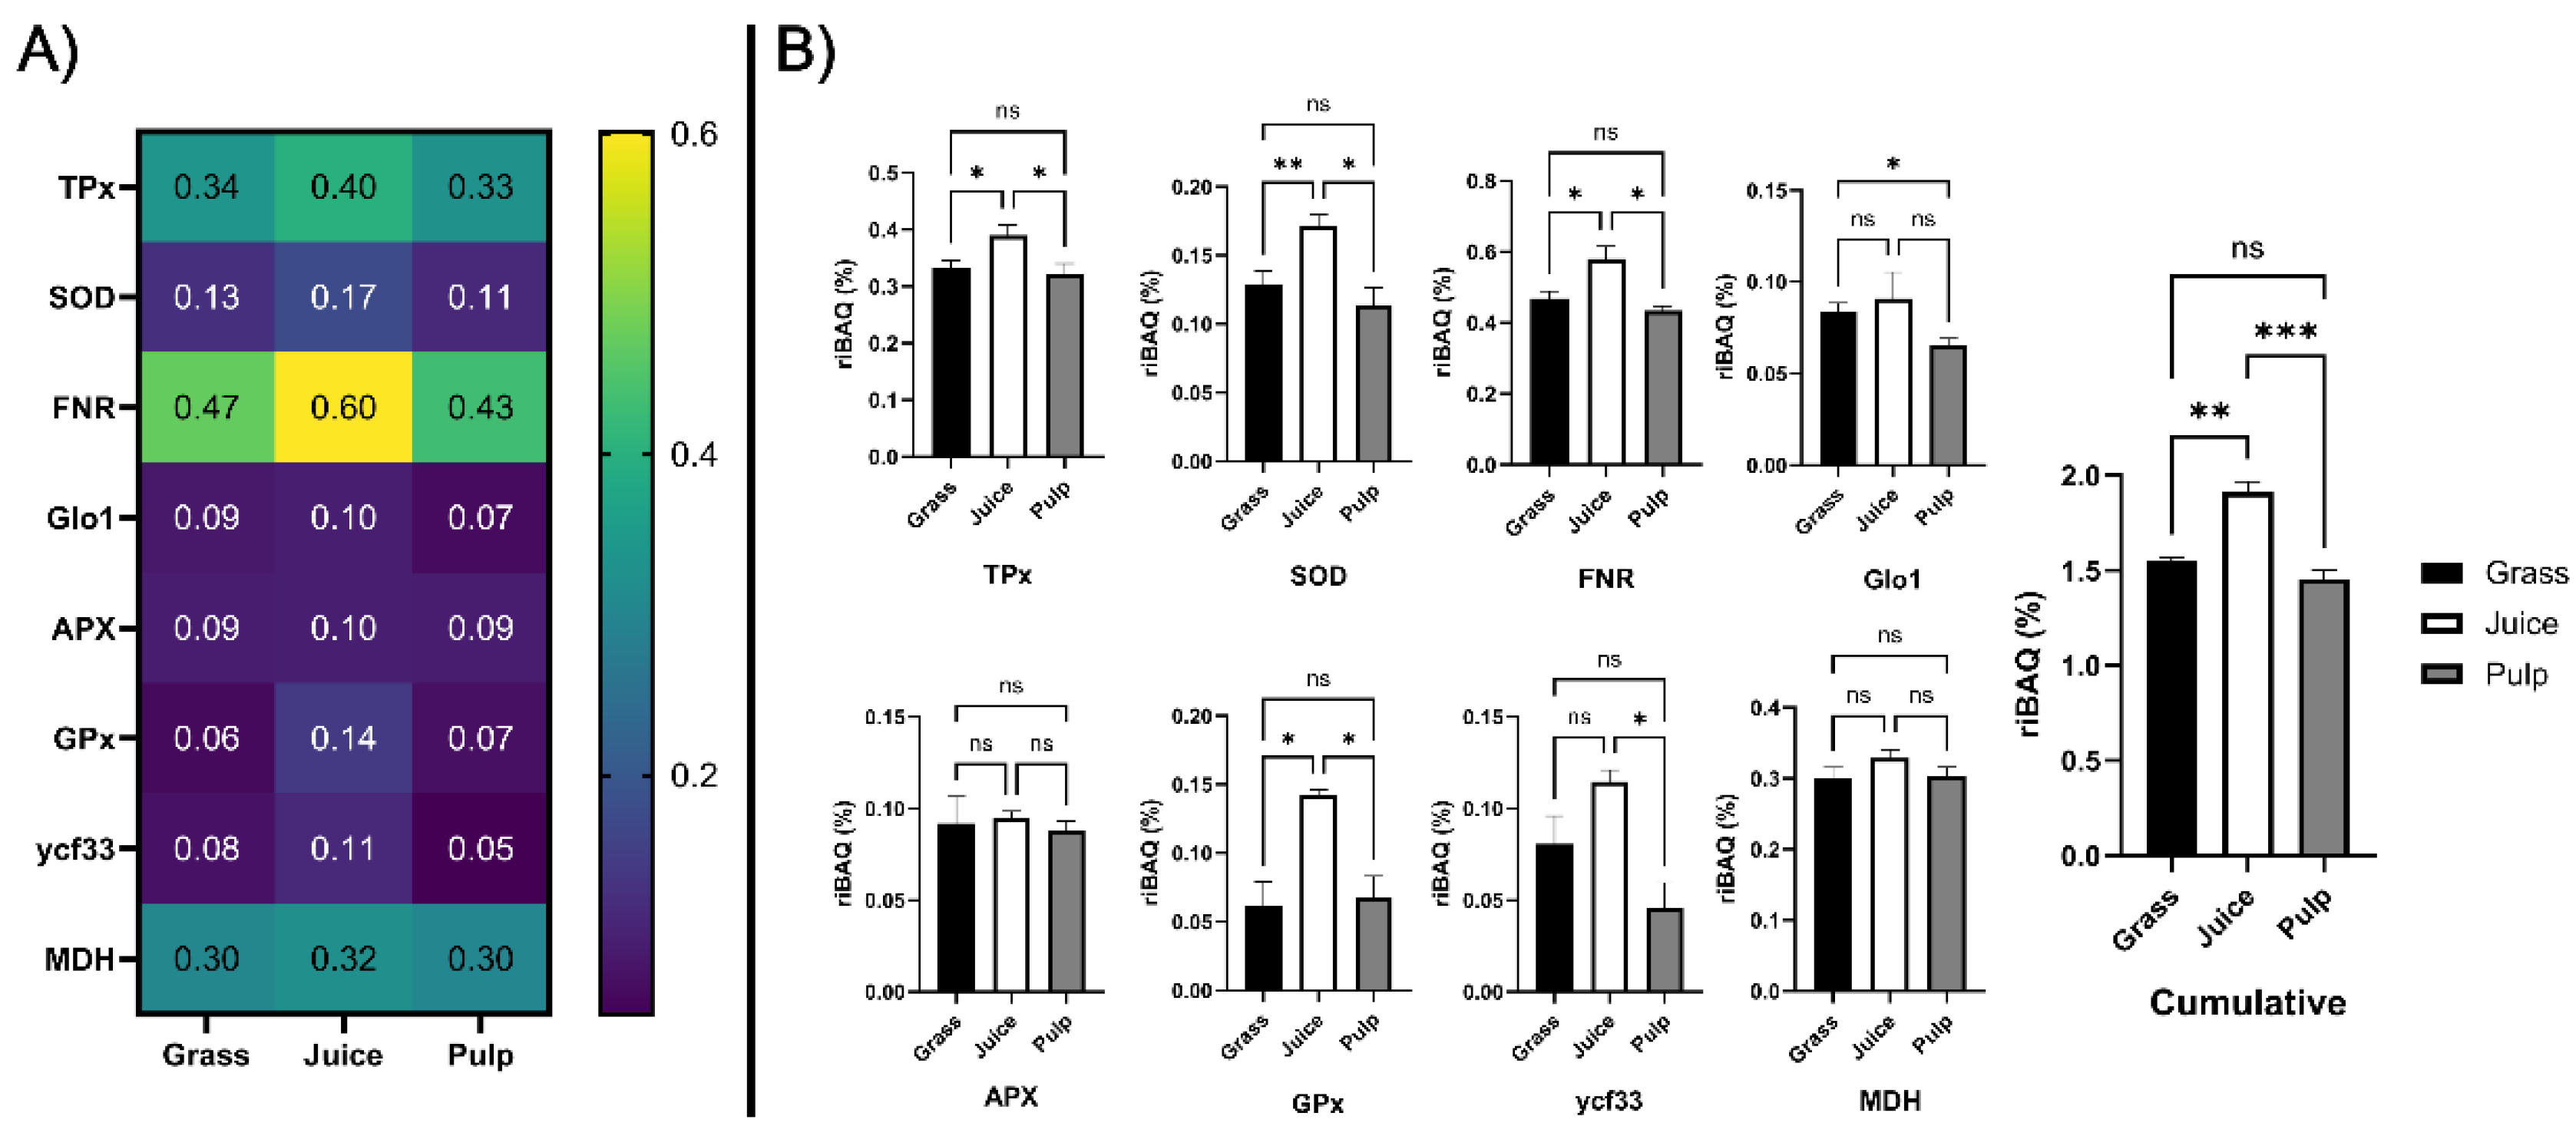
Comparing abundances across the initial crude fractions (Fig. 7B), TPx, SOD, FNR, GPx were significantly (p < 0.05) enriched in the juice compared to both raw biomass and pulp. Glo1 was significantly (p = 0.017) depleted in the pulp while no significant difference was found between raw biomass and green juice. Ycf33 was significantly (p = 0.010) enriched in the juice compared to the pulp, while no significant differences were detected in comparison to the raw biomass. No significant differences were observed for APX and MDH across crude fractions. Cumulatively, a significant (p = 0.0037) increase of 23.6% was detected in the juice, while a smaller and not significant decrease of 6.1% was determined in the pulp, when compared to the raw biomass. Taken together, these findings showed that the identified antioxidant protein candidates were enriched in juice following wet fractionation and that this was especially attributed to higher accumulation and partitioning in the liquid phase of TPx, SOD, FNR, and GPx. Based on the in vitro assays, three of these proteins (TPx, SOD, and FNR) were, along with MDH, enriched in fractions with high chelating activity. As they furthermore were the four most abundant candidate proteins (constituting ~ 1.5% of the molar protein abundance in the green juice), it is likely that these classes were responsible for the measured antioxidant activity of the fractionated green juice ex vivo and that strategies for their enrichment within a process stream may improve oxidative stability and ultimately shelf life of the end product.
4. Conclusions
Green biorefining of leafy greens such as perennial ryegrass (L. perenne) is currently undergoing major advancements for transforming the inedible biomass into a protein-rich ingredient suitable for human consumption. One of the major challenges remaining is imposed by the dynamic nature of the green juice after pressing, where proteins, enzymes, and phytochemicals are decompartmentalized, leading to a highly reactive environment. To alleviate this, a basic understanding of the endogenous antioxidative capacity of the biomass is pivotal. Here, we employed size exclusion chromatography for fractionation of the grass juice to gain a deeper understanding of the ex vivo antioxidant properties. Through in vitro assaying of L. perenne green juice fractions for radical scavenging and iron chelation, we linked the measured in vitro activity to the major protein constituents using quantitative LC-MS/MS-based proteomics. Through GO-term analysis, we identified at least nine enzymes known to be involved in in vivo antioxidant processes, indicating that their activity was maintained ex vivo. Moreover, we showed that their cumulative abundance was significantly enriched by 24% in the green juice (1.9% riBAQ) compared to the unprocessed ryegrass (1.5% riBAQ), while they were slightly depleted in the resulting pulp. Moreover, the measured activity coincided with an enrichment of especially TPx, SOD, FNR and MDH in fractions with high detected ferrous chelation.
This study also provides the, to date, most detailed characterization of the L. perenne proteome and quantitative protein partitioning in the juice and pulp fractions after wet fractionation. Our analysis further revealed that the major protein of the biomass, RuBisCO, primarily exists in the native heterohexadecameric form after pressing. This implies that it may be effectively separated from major drivers of enzymatically driven oxidation processes and subsequent phytochemical protein modification and cross-linking using size-based fractionation in a biorefinery concept, ultimately reducing unwanted side reactions in the juice. These findings open possibilities for targeted process development and optimization to improve the oxidative stability of the green juice during green biorefining, leading to a higher quality protein product.
Supplementary Materials
The following supporting information can be downloaded at the website of this paper posted on Preprints.org. Table S1: Differentially abundant proteins between crude fractions. Table S2: BLAST analysis of lead proteins annotated as fragments in SEC fractions. Figure S1: PCA plot triplicate analysis of initial crude fractions. Figure S2: Chromatogram and calibration curve of standards for SEC fractionation. Figure S3: Activity of all fractions for each dilution in the DPPH radical scavenging screening. Figure S4: Reducing (*) and non-reducing SDS-PAGE analysis of the 15 selected fractions. Figure S5: GO-term analysis of the 108 selected proteins for investigation of known antioxidant function.
Author Contributions
Conceptualization, S.G.E.; methodology, K.D.A.P., L.T.A., M.H., C.A.B., F.L.S., L.M.M., S.A.H, C.E.R-W, S.G.E.; software, M.H., S.G.E.; validation, S.A.H., C.E.R-W, S.G.E.; formal analysis, K.D.A.P., L.T.A., M.H., C.A.B., F.L.S., L.M.M., S.A.H, S.G.E.; investigation, K.D.A.P., L.T.A., M.H., C.A.B., F.L.S., L.M.M., S.G.E.; resources, S.A.H., S.G.E.; data curation, K.D.A.P., L.T.A., M.H., S.G.E.; writing—original draft preparation, K.D.A.P., L.T.A., S.G.E.; writing—review and editing, K.D.A.P., L.T.A., M.H., C.A.B., F.L.S., L.M.M., S.A.H, C.E.R-W, M.L., S.G.E.; visualization, K.D.A.P., L.T.A., M.H., S.G.E.; supervision, C.E.R-W, M.L., S.G.E.; project administration, M.L, S.G.E.; funding acquisition, M.L, S.G.E.. All authors have read and agreed to the published version of the manuscript.
Funding
This research was funded by Independent Research Fund Denmark (Grant number 1127-00245 (PhyPro)).
Data Availability Statement
The mass spectrometry proteomics data have been deposited to the ProteomeXchange Consortium via the PRIDE [59]partner repository with the dataset identifiers PXD058233 (crude fractions) and PXD058237 (SEC fractions) available at DOI 10.6019/PXD058233 and 10.6019/PXD058237, respectively. Proteomics data output from MaxQuant and processed for filtering of contaminants and false positives as well as relative quantification by riBAQ can be found in the supplementary material for crude fractions (Appendix A), SEC fractions (Appendix C) and SEC fractions after isoform combination and riBAQ recalculations (Appendix D). Curve fitting data for EC50 determinations are available in supplementary material (Appendix B). All other data will be made available upon request.
Acknowledgments
The authors would like to thank Narjes Badfar for methodological assistance. The authors would also like to thank DLF Seeds A/S (Denmark) for supplying seeds and Majken Pagter for supplying access to facilities for cultivation of L. perenne.
Conflicts of Interest
The authors declare no conflicts of interest.
Appendix A
MaxQuant output data for the initial crude fractions following filtering of contaminant and false positives. This datasheet also includes relative quantification by riBAQ.
Appendix B
Working sheet for curve fitting from antioxidant assays to determine EC50 values. The sheet includes all measured data points and the curve fitting functions applied.
Appendix C
MaxQuant output data from the SEC fractionation of green juice following filtering of contaminant and false positives. This datasheet also includes relative quantification by riBAQ.
Appendix D
MQ data from SEC fractions after isoform combination and riBAQ recalculation (based on Appendix C).
References
- Lynch H, Johnston C, Wharton C. Plant-Based Diets: Considerations for Environmental Impact, Protein Quality, and Exercise Performance. Nutrients 2018, Vol 10, Page 1841 2018;10:1841. [CrossRef]
- Sá AGA, Moreno YMF, Carciofi BAM. Plant proteins as high-quality nutritional source for human diet. Trends Food Sci Technol 2020;97:170–84. [CrossRef]
- Kromus S, Kamm B, Kamm M, Fowler P, Narodoslawsky M. Green Biorefineries: The Green Biorefinery Concept – Fundamentals and Potential. Biorefineries-Industrial Processes and Products: Status Quo and Future Directions 2008;1:253–94. [CrossRef]
- Domokos-Szabolcsy É, Yavuz SR, Picoli E, Fári MG, Kovács Z, Tóth C, et al. Green Biomass-Based Protein for Sustainable Feed and Food Supply: An Overview of Current and Future Prospective. Life 2023, Vol 13, Page 307 2023;13:307. [CrossRef]
- Gaffey J, Rajauria G, McMahon H, Ravindran R, Dominguez C, Ambye-Jensen M, et al. Green Biorefinery systems for the production of climate-smart sustainable products from grasses, legumes and green crop residues. Biotechnol Adv 2023;66:108168. [CrossRef]
- Santamaría-Fernández M, Lübeck M. Production of leaf protein concentrates in green biorefineries as alternative feed for monogastric animals. Anim Feed Sci Technol 2020;268:114605. [CrossRef]
- Damborg VK, Jensen SK, Weisbjerg MR, Adamsen AP, Stødkilde L. Screw-pressed fractions from green forages as animal feed: Chemical composition and mass balances. Anim Feed Sci Technol 2020;261:114401. [CrossRef]
- Hu L, Li H, Pang H, Fu J. Responses of antioxidant gene, protein and enzymes to salinity stress in two genotypes of perennial ryegrass (Lolium perenne) differing in salt tolerance. J Plant Physiol 2012;169:146–56. [CrossRef]
- Solati Z, Manevski K, Jørgensen U, Labouriau R, Shahbazi S, Lærke PE. Crude protein yield and theoretical extractable true protein of potential biorefinery feedstocks. Ind Crops Prod 2018;115:214–26. [CrossRef]
- Humphreys M, Feuerstein U, Vandewalle M, Baert J. Ryegrasses. Fodder Crops and Amenity Grasses 2010:211–60. [CrossRef]
- Larsen SU, Ambye-Jensen M, Jørgensen H, Jørgensen U. Ensiling of the pulp fraction after biorefining of grass into pulp and protein juice. Ind Crops Prod 2019;139:111576. [CrossRef]
- Santamaría-Fernández M, Molinuevo-Salces B, Lübeck M, Uellendahl H. Biogas potential of green biomass after protein extraction in an organic biorefinery concept for feed, fuel and fertilizer production. Renew Energy 2018;129:769–75. [CrossRef]
- Ravindran R, Koopmans S, Sanders JPM, McMahon H, Gaffey J. Production of Green Biorefinery Protein Concentrate Derived from Perennial Ryegrass as an Alternative Feed for Pigs. Clean Technologies 2021, Vol 3, Pages 656-669 2021;3:656–69. [CrossRef]
- Pérez-Vila S, Fenelon MA, O’Mahony JA, Gómez-Mascaraque LG. Extraction of plant protein from green leaves: Biomass composition and processing considerations. Food Hydrocoll 2022;133:107902. [CrossRef]
- Stødkilde L, Ingerslev AK, Ambye-Jensen M, Jensen SK. The composition and nutritional quality of biorefined lucerne protein depend on precipitation method. J Sci Food Agric 2024;104:3405–12. [CrossRef]
- Møller AH, Hammershøj M, Dos Passos NHM, Tanambell H, Stødkilde L, Ambye-Jensen M, et al. Biorefinery of Green Biomass-How to Extract and Evaluate High Quality Leaf Protein for Food? J Agric Food Chem 2021;69:14341–57. [CrossRef]
- Pérez-Vila S, Fenelon MA, O’Mahony JA, Gómez-Mascaraque LG. The emulsifying properties of protein extracts from perennial ryegrass (Lolium perenne L.) depend on the extraction method. Food Hydrocoll 2024;152:109917. [CrossRef]
- Pérez-Vila S, Fenelon M, Hennessy D, O’Mahony JA, Gómez-Mascaraque LG. Impact of the extraction method on the composition and solubility of leaf protein concentrates from perennial ryegrass (Lolium perenne L.). Food Hydrocoll 2024;147:109372. [CrossRef]
- Ma X, van Polen T, Habibi M, Landman J, Sagis LMC, Shen P. Rubisco at interfaces I: Conformational flexibility enhances air-water interface and foam stabilization. Food Hydrocoll 2025;160:110783. [CrossRef]
- Elias RJ, Kellerby SS, Decker EA. Antioxidant Activity of Proteins and Peptides. Crit Rev Food Sci Nutr 2008;48:430–41. [CrossRef]
- Domínguez R, Pateiro M, Munekata PES, Zhang W, Garcia-Oliveira P, Carpena M, et al. Protein Oxidation in Muscle Foods: A Comprehensive Review. Antioxidants 2022, Vol 11, Page 60 2021;11:60. [CrossRef]
- Gülçin I. Antioxidant activity of food constituents: an overview. Archives of Toxicology 2011 86:3 2011;86:345–91. [CrossRef]
- Abeyrathne EDNS, Nam K, Huang X, Ahn DU. Plant- and Animal-Based Antioxidants’ Structure, Efficacy, Mechanisms, and Applications: A Review. Antioxidants 2022, Vol 11, Page 1025 2022;11:1025. [CrossRef]
- Chen Z, Li W, Santhanam RK, Wang C, Gao X, Chen Y, et al. Bioactive peptide with antioxidant and anticancer activities from black soybean [Glycine max (L.) Merr.] byproduct: isolation, identification and molecular docking study. European Food Research and Technology 2019;245:677–89. [CrossRef]
- Wen C, Zhang J, Zhang H, Duan Y, Ma H. Plant protein-derived antioxidant peptides: Isolation, identification, mechanism of action and application in food systems: A review. Trends Food Sci Technol 2020;105:308–22. [CrossRef]
- Bjørlie M, Hartmann JC, Rasmussen LH, Yesiltas B, Sørensen ADM, Gregersen Echers S, et al. Screening for Metal-Chelating Activity in Potato Protein Hydrolysates Using Surface Plasmon Resonance and Peptidomics. Antioxidants 2024;13:346. [CrossRef]
- Varona E, García-Moreno PJ, Gregersen Echers S, Olsen TH, Marcatili P, Guardiola F, et al. Antioxidant peptides from alternative sources reduce lipid oxidation in 5% fish oil-in-water emulsions (pH 4) and fish oil-enriched mayonnaise. Food Chem 2023;426:136498. [CrossRef]
- Yesiltas B, García-Moreno PJ, Gregersen S, Olsen TH, Jones NC, Hoffmann S V., et al. Antioxidant peptides derived from potato, seaweed, microbial and spinach proteins: Oxidative stability of 5% fish oil-in-water emulsions. Food Chem 2022;385:132699. [CrossRef]
- César APC, Lopes FES, Azevedo FFN, Pinto YO, Andrade CR, Mesquita FP, et al. Antioxidant peptides from plants: a review. Phytochemistry Reviews 2024;23:95–104. [CrossRef]
- Vanani FR, Shabani L, Sabzalian MR, Dehghanian F, Winner L. Comparative physiological and proteomic analysis indicates lower shock response to drought stress conditions in a self-pollinating perennial ryegrass. PLoS One 2020;15:e0234317. [CrossRef]
- Rahman MA, Woo JH, Song Y, Lee SH, Hasan MM, Azad MAK, et al. Heat Shock Proteins and Antioxidant Genes Involved in Heat Combined with Drought Stress Responses in Perennial Rye Grass. Life 2022, Vol 12, Page 1426 2022;12:1426. [CrossRef]
- Jiang N, Li Z, Yang J, Zu Y. Responses of antioxidant enzymes and key resistant substances in perennial ryegrass (Lolium perenne L.) to cadmium and arsenic stresses. BMC Plant Biol 2022;22:1–15. [CrossRef]
- Li J, Zhao Q, Xue B, Wu H, Song G, Zhang X. Arsenic and nutrient absorption characteristics and antioxidant response in different leaves of two ryegrass (Lolium perenne) species under arsenic stress. PLoS One 2019;14:e0225373. [CrossRef]
- Mueller SJ, Hoernstein SNW, Reski R. Approaches to characterize organelle, compartment, or structure purity. Methods in Molecular Biology 2017;1511:13–28. [CrossRef]
- Nicklisch SCT, Waite JH. Optimized DPPH assay in a detergent-based buffer system for measuring antioxidant activity of proteins. MethodsX 2014;1:e233–8. [CrossRef]
- Sabeena Farvin KH, Baron CP, Nielsen NS, Jacobsen C. Antioxidant activity of yoghurt peptides: Part 1-in vitro assays and evaluation in ω-3 enriched milk. Food Chem 2010;123:1081–9. [CrossRef]
- Rappsilber J, Mann M, Ishihama Y. Protocol for micro-purification, enrichment, pre-fractionation and storage of peptides for proteomics using StageTips. Nat Protoc 2007;2:1896–906. [CrossRef]
- Tyanova S, Temu T, Cox J. The MaxQuant computational platform for mass spectrometry-based shotgun proteomics. Nat Protoc 2016;11:2301–19. [CrossRef]
- Cox J, Neuhauser N, Michalski A, Scheltema RA, Olsen J V., Mann M. Andromeda: A peptide search engine integrated into the MaxQuant environment. J Proteome Res 2011;10:1794–805. [CrossRef]
- Quaglieri A, Bloom J, Triantafyllidis A, Green B, Condina MR, Ngov PB, et al. Mass Dynamics 2.0: An improved modular web-based platform for accelerated proteomics insight generation and decision making. BioRxiv 2022:2022.12.12.517480. [CrossRef]
- Jørgensen U, Jensen SK, Ambye-Jensen M. Coupling the benefits of grassland crops and green biorefining to produce protein, materials and services for the green transition. Grass and Forage Science 2022;77:295–306. [CrossRef]
- Tanambell H, Møller AH, Roman L, Corredig M, Dalsgaard TK. Supramolecular structure modification of RuBisCO from alfalfa during removal of chloroplastic materials. Innovative Food Science & Emerging Technologies 2023;87:103408. [CrossRef]
- Chen Z, Bertin R, Froldi G. EC50 estimation of antioxidant activity in DPPH assay using several statistical programs. Food Chem 2013;138:414–20. [CrossRef]
- Krey JF, Scheffer DI, Choi D, Reddy A, David LL, Corey DP, et al. Mass spectrometry quantitation of proteins from small pools of developing auditory and vestibular cells. Scientific Data 2018 5:1 2018;5:1–14. [CrossRef]
- Gregersen Echers S, Abdul-Khalek N, Mikkelsen RK, Holdt SL, Jacobsen C, Hansen EB, et al. Is Gigartina a potential source of food protein and functional peptide-based ingredients? Evaluating an industrial, pilot-scale extract by proteomics and bioinformatics. Future Foods 2022;6:100189. [CrossRef]
- Stoykov YM, Pavlov AI, Krastanov AI. Chitinase biotechnology: Production, purification, and application. Eng Life Sci 2015;15:30–8. [CrossRef]
- Pérez-Pérez ME, Mata-Cabana A, Sánchez-Riego AM, Lindahl M, Florencio FJ. A comprehensive analysis of the peroxiredoxin reduction system in the cyanobacterium Synechocystis sp. strain PCC 6803 reveals that all five peroxiredoxins are thioredoxin dependent. J Bacteriol 2009;191:7477–89. [CrossRef]
- Wood ZA, Schröder E, Harris JR, Poole LB. Structure, mechanism and regulation of peroxiredoxins. Trends Biochem Sci 2003;28:32–40. [CrossRef]
- Zheng M, Liu Y, Zhang G, Yang Z, Xu W, Chen Q. The Applications and Mechanisms of Superoxide Dismutase in Medicine, Food, and Cosmetics. Antioxidants 2023, Vol 12, Page 1675 2023;12:1675. [CrossRef]
- Kozuleva M, Goss T, Twachtmann M, Rudi K, Trapka J, Selinski J, et al. Ferredoxin:NADP(H) Oxidoreductase Abundance and Location Influences Redox Poise and Stress Tolerance. Plant Physiol 2016;172:1480–93. [CrossRef]
- Shen Y, Du J, Yue L, Zhan X. Proteomic analysis of plasma membrane proteins in wheat roots exposed to phenanthrene. Environmental Science and Pollution Research 2016;23:10863–71. [CrossRef]
- Das K, Roychoudhury A. Reactive oxygen species (ROS) and response of antioxidants as ROS-scavengers during environmental stress in plants. Front Environ Sci 2014;2:121942. [CrossRef]
- Rouhier N, Gelhaye E, Jacquot JP. Glutaredoxin-dependent Peroxiredoxin from Poplar: PROTEIN-PROTEIN INTERACTION AND CATALYTIC MECHANISM. Journal of Biological Chemistry 2002;277:13609–14. [CrossRef]
- de Oliveira FK, Santos LO, Buffon JG. Mechanism of action, sources, and application of peroxidases. Food Research International 2021;143:110266. [CrossRef]
- Rouhier N, Gelhaye E, Gualberto JM, Jordy MN, De Fay E, Hirasawa M, et al. Poplar Peroxiredoxin Q. A Thioredoxin-Linked Chloroplast Antioxidant Functional in Pathogen Defense. Plant Physiol 2004;134:1027–38. [CrossRef]
- Oh TJ, Kim IG, Park SY, Kim KC, Shim HW. NAD-dependent malate dehydrogenase protects against oxidative damage in Escherichia coli K-12 through the action of oxaloacetate. Environ Toxicol Pharmacol 2002;11:9–14. [CrossRef]
- Bathellier C, Yu LJ, Farquhar GD, Coote ML, Lorimer GH, Tcherkez G. Ribulose 1,5-bisphosphate carboxylase/oxygenase activates O2 by electron transfer. Proc Natl Acad Sci U S A 2020;117:24234–42. [CrossRef]
- Hirasawa M, Tripathy JN, Sommer F, Somasundaram R, Chung JS, Nestander M, et al. Enzymatic properties of the ferredoxin-dependent nitrite reductase from Chlamydomonas reinhardtii. Evidence for hydroxylamine as a late intermediate in ammonia production. Photosynth Res 2010;103:67–77. [CrossRef]
- Perez-Riverol Y, Bai J, Bandla C, García-Seisdedos D, Hewapathirana S, Kamatchinathan S, et al. The PRIDE database resources in 2022: a hub for mass spectrometry-based proteomics evidences. Nucleic Acids Res 2022;50:D543–52. [CrossRef]

Table 1.
Mass balance and crude protein content of L. perenne grass, pulp and green juice. Values are given in average +/- standard deviation (n ≥ 3).
Table 1.
Mass balance and crude protein content of L. perenne grass, pulp and green juice. Values are given in average +/- standard deviation (n ≥ 3).
| Crude fraction | Mass (g) | DM (% w/w) | DM distribution | Crude protein1 (%, DM basis) | Crude protein distribution |
|---|---|---|---|---|---|
| Grass | 75.2 | 19.2 ± 1.1a | 100% | 11.2 ± 0.4a | 100% |
| Pulp | 32.9 | 27.7 ± 3.1b | 63.0% | 10.4 ± 0.4a | 58.7% |
| Green Juice | 34.4 | 15.5 ± 2.1a | 36.9% | 12.5 ± 0.5b | 41.0% |
1Crude protein is based on crude nitrogen using a N-to-protein conversion factor of 6.25. Superscript letters refer to significant (p < 0.05) differences between means of each column by ANOVA and multiple comparison by Tukey.
Table 2.
EC50 values of DPPH RSA and ICA and estimated average MW for the selected SEC fractions. Trolox and EDTA (positive controls) EC50 is given in average +/- standard deviation (n = 3).
Table 2.
EC50 values of DPPH RSA and ICA and estimated average MW for the selected SEC fractions. Trolox and EDTA (positive controls) EC50 is given in average +/- standard deviation (n = 3).
| DPPH | Iron Chelation | ||||
| Protein fraction | MWavg (kDa) | EC50 (ug/mL) | EC50 (µM) | EC50 (ug/mL) | EC50 (µM) |
| 3 | N/A | 130 | N/A | N/A | N/A |
| 5 | 407 | 120 | 0.29 | N/A | N/A |
| 7 | 278 | 150 | 0.53 | 6.5 | 0.023 |
| 16 | 50.0 | N/A | N/A | 9.0 | 0.18 |
| 19 | 28.2 | N/A | N/A | 7.4 | 0.26 |
| 22 | 15.9 | N/A | N/A | 5.9 | 0.37 |
| 25 | 9.00 | N/A | N/A | 7.0 | 0.78 |
| 28 | 5.08 | N/A | N/A | 7.2 | 1.4 |
| 34 | 1.62 | 191 | 120 | 4.8 | 3.0 |
| 37 | 0.914 | 63 | 69 | 0.57 | 0.62 |
| 39 | 0.624 | 38 | 61 | 0.44 | 0.71 |
| 43 | 0.291 | 51 | 170 | 2.1 | 7.1 |
| 48 | 0.112 | 28 | 250 | 1.6 | 14 |
| 51 | 0.0634 | 13 | 210 | 0.60 | 9.5 |
| 55 | 0.030 | 26 | 880 | 0.31 | 11 |
| Trolox | 0.251 | 37±18 | 150±74 | ||
| EDTA | 0.292 | 2.5±1.5 | 8.5±5.1 | ||
Table 3.
Identified proteins with antioxidant-related mechanisms, confirmed across literature in different species using both TriBAQ (Fig. 5) and fractional riBAQ (Fig. 6) for defining abundance thresholds (> 0.5 % and > 2.0 %, respectively).
Table 3.
Identified proteins with antioxidant-related mechanisms, confirmed across literature in different species using both TriBAQ (Fig. 5) and fractional riBAQ (Fig. 6) for defining abundance thresholds (> 0.5 % and > 2.0 %, respectively).
| Protein | Mechanism | Ref. |
|---|---|---|
| Thioredoxin-dependent peroxiredoxin (TPx) | Reduction of hydrogen peroxide and hydroperoxides. | [47,48] |
| Superoxide dismutase (SOD) | Oxygen radical scavenging | [49] |
| Ferredoxin-NADP reductase (FNR) | Transfer of electrons | [50] |
| Lactoylglutathione lyase (Glyoxalase I, Glo1) | Glutathione formation | [51] |
| L-ascorbate peroxidase (APX) | Reduction of hydrogen peroxide | [52] |
| Glutaredoxin-dependent peroxiredoxin (GPx) | Reduction of hydrogen peroxide | [53] |
| Peroxidase | Reduction of hydrogen peroxide | [54] |
| Peroxiredoxin Q-like (ycf33)1 | Reduction of alkyl hydroperoxides | [55] |
| Malate dehydrogenase (MDH) | Catalyzes formation of oxaloacetate | [56] |
1Uncharactericed protein ycf33 shows high similarity to Peroxiredoxin Q by BLAST.
Disclaimer/Publisher’s Note: The statements, opinions and data contained in all publications are solely those of the individual author(s) and contributor(s) and not of MDPI and/or the editor(s). MDPI and/or the editor(s) disclaim responsibility for any injury to people or property resulting from any ideas, methods, instructions or products referred to in the content. |
© 2024 by the authors. Licensee MDPI, Basel, Switzerland. This article is an open access article distributed under the terms and conditions of the Creative Commons Attribution (CC BY) license (http://creativecommons.org/licenses/by/4.0/).
Copyright: This open access article is published under a Creative Commons CC BY 4.0 license, which permit the free download, distribution, and reuse, provided that the author and preprint are cited in any reuse.


