Submitted:
02 December 2024
Posted:
03 December 2024
You are already at the latest version
Abstract
The closure of coal and lignite mines has the potential to result in long-term environmental risks and socio-economic issues. The concept described in this article aims to improve the hazard assessment and risk management of former mining regions in a European project funded by the Research Fund for Coal and Steel. A multidisciplinary approach integrates historic, geological, topographical, environmental and socio-economic aspects to support stakeholders at different decision-making levels in the risk assessment and possible mitigation. The individual hazards (post-mining, natural, and technical) are weighted using expert knowledge, their interaction analyzed, and then combined into a spatial multi-hazard index. Together with the other risk factors of social vulnerability and exposure a comprehensive, spatial risk map can be created automatically for individual regions using open-source components. In addition, GIS and statistical tools enable further analysis and visualization for decision-making by the relevant stakeholders. The methodology is validated through the examination of case studies conducted in various European countries within the scope of the project.
Keywords:
Post-Mining
; Multi-Hazard
; Decision Support System
1. Introduction
The mining industry has a very important role in economic and social sectors. However, mining site rehabilitation at the end of mines life-cycle is presented as a difficult topic [1,2,3]. The number of the closed mines are decreasing every day due geology, mining, social and economic conditions. Certain estimations mentioned there are more than a million abandoned mines in the world [4]. These former mining sites constitute a crucial and critical industrial legacy. Despite the rehabilitation work on mining sites to minimize the risk, the closed mines are often associated with the existence of several main and residual potential hazards [5]. The mining regions are consequently exposed to multirisk including natural and technology risks.
In light of these considerations, risk assessment and management continue to represent a pivotal objective for the mining industry, authorities, and decision-makers. The issue of post-mining management represents a significant concern for states and regions with a history of extensive mining operations. The primary distinction between the mining and post-mining phases is the long-term social, economic, and environmental management risk for vulnerable regions. Post-mining hazards, with catastrophic consequences, can manifest after a prolonged period of mine closure, often spanning several years. These hazards can be exacerbated by natural disasters, such as the combustion of coal deposits and forest fires. In such instances, the post-mining hazard (combustion) can interact with the natural hazard (forest fire) [6].
The European project POMHAZ (Post-Mining Multi-Hazards evaluation for land-planning) [7], funded by the Research Fund for Coal and Steel (RFCS), aims to improve the methodological knowledge for practical realization of multi-hazard analyses, at the scale of a mining basin, in correlation with the main post-mining hazards [8].
The novel approach discussed in this article shows the practical implementation of the post-mining multi-hazard assessment in a self-developed spatial decision support system (sDSS), which can be applied automatically and scalable for different scenarios and mines
2. Hazards in Post-Mining Regions
Mine closure can result in hazards, such as geotechnical, induced seismicity, hydraulic perturbations, flooding events, dangerous or toxic gas emissions or releases of potentially dangerous chemical substances into the environment [9,10]. Various mining hazards can occur in closed mining areas [5,9,11,12]. They are gathered into four groups: ground movements, environmental pollution, hydrological issues / water disturbances and gas / fire. Table 1 provides a list of 17 hazardous phenomena identified in the project POMHAZ for different mine types [13]. The following sections provide a brief overview of these concepts. The primary focus of this approach is on examining these hazards not in isolation, but in conjunction with potential interactions. Additional hazards can be added depending on the local mining or regional conditions, including natural and technical hazards [14].
Ground Movements
Different ground movements can occur in former mine site. For example, the localized collapse (crown hole, sink hole) [14]. The localized collapse is evidenced by a sudden sinking of several meters in a relatively limited area (dimensions ranging from one meter to a few tens of meters). This phenomenon can also be linked to the presence of old mining shafts [15]. Additionally, subsidence is a ground movement linked to the presence of large exploitation areas, at great depths of a few dozen meters to several hundred or even over thousand meters. The subsidence is caused by the collapse of old mining operations, especially mines using longwall-mining or rooms and pillar methods [14,15]. Large and local landslides are generally encountered on deposit structures or open cast mines. The phenomenon of slope instability can be observed in both gradual and accelerated movements, which ultimately result in the displacement of materials [16,17].
Environmental Pollution
The infiltration of rainwater into flooded mining lands can result in the contamination of the water with a range of chemical compounds [13,14]. The potential for contamination of groundwater, soil, and vegetation exists. Post-mining pollution and nuisance may result from the interaction between mining operations and water flows, which can lead to soil, surface water, and groundwater contamination. Surface conditions, including air and precipitation, can influence the discharge of substances into the environment that may be harmful or dangerous to different ecosystems and residents.
Hydroligical Issues / Water Disturbances
A further hazard is posed by water, in the form of both hydrological and hydrogeological disturbances, as well as flooding [13,14]. Following the closure of a mine, the water table rises gradually, returning to its natural level. This can result in the partial or complete filling of reservoirs and voids created by mining, as well as joining the surface hydrographic network or topographical depressions that may have been created by mining. Such hydrological and hydrogeological disturbances have the potential to be detrimental to the utilization of the land or subsoil.
Gas / Fire
Mining gases represent a post-mining hazard [13,14]. Additionally, coal mines are prone to issues related to self-heating and combustion of deposits and waste materials. The extraction of underground mines has contributed to the formation of a reservoir that can fill with gas emitted from the exploited rock or from sources further away. This gas is a complex mixture of multiple components with varying concentrations. These gas emissions can potentially pose a hazard. Moreover, the natural gases present in the surrounding rock mass may also exhibit increased mobility as a consequence of the disturbances caused by mining activities. In some instances, elevated levels of the radioactive gas radon have been documented in the vicinity of the mine, which is indicative of the nature of the rock mass in question [18].
Interatctions
Different types of interactions (dependence, combination, cascade) [6] between the post-mining hazards can be identified in the mining area and consequently increasing the associated risks. For instance, ground movements can increase the probability of the flooding hazard; toxic mine gases can cause health and environmental consequences; flooding of a mine can induce consequent ground movement; mine flooding can trigger or worsen the sinkhole hazard. The assessment of the different hazards must consider and assess their potential [14].
The development of more effective tools for understanding the multiplicity of hazards and their constraints is essential for land use planning and specific planning for adequate rehabilitation of former mining sites. The management of multi-hazards represents a significant challenge for communities [19,20]. Eventually, risk management is a dynamic and iterative process that must consider environmental, social, and economic factors in a unified manner [21,22,23].
3. Methodology of Multi-Risk Assessment
The methodology for the Multi-Risk assessment is comprised of several steps and necessitates the initial collation, classification and pre-processing of data by multi-disciplinary experts [23] in order to facilitate the subsequent automatic calculations of a multi-risk index. A multi-risk index reflects the level of the impact of the multi-hazards.
It is necessary for a studies site to gather and prepare data on a range of factors, including hazards, the environmental context, infrastructure, and geotechnical aspects, in formats that can be read by a geographic information system (GIS). Vector formats, such as Shapefiles or GeoJSON, may be employed for the initial processing. However, for the subsequent calculation of pixel-wise Multi-Risk values, all data must be rasterized. Equation (1) illustrates the calculation of the Multi-Risk value [24,25] for each pixel and scenario. The various factors are discussed in the following section.
To ensure the consistency of the data, it is advisable to select a uniform grid resolution. In the case study, a resolution of 10 x 10 m was selected, corresponding to the resolution of the Land Use/Land Cover derived from the Sentinel-2 data [26]. This resolution allows for effective computing performance over larger areas while maintaining sufficient resolution for subsequent analyses, making it a suitable standard for different mining sites.
After the multi-risk calculation, different courses of action are proposed based on the level of risk (Figure 1). The decision support system should help to use the appropriate mitigation or/and land use of the mining site. This ranges from no action for no risk areas, monitoring for low risk, risk mitigation for medium risk and changes in current or future land use by land planning methods for high-risk areas, depending on the national and regional regulations.
4. Definition and Calculation of Multi-Hazard, Vulnerability and Exposure Factors
To enable the automated calculation of the Multi-Risk for each cell, the three components must first be defined and subsequently calculated, or alternatively, suitable values must be selected by an expert user. In order to accommodate the varying requirements of the stakeholders and the numerous interactions between multiple post-mining, natural and technical hazards, it is possible to utilize more than one scenario throughout this process. This allows for more suitable
Multi-Hazard Index (MHI)
The principal of the calculation to determine a value to assess how much the interaction is important. Following an examination of various multi-criteria decision-making (MCDM) and indicator-based techniques for calculating a MHI from multiple single hazards, the factor multiplication method, as developed by Liu et al. [27], is employed in the context of both natural and technological hazards [28], with specific consideration of their potential interactions [25].
The method comprises four principal stages [28]. The initial stage of the process entails the identification of the post-mining hazards and the assignment of an initial intensity rating on a scale of 1 to 5, which indicates the severity of each independent hazard. Subsequently, in the second step, an interaction matrix is constructed, with primary hazards positioned on the vertical axis and secondary hazards triggered by the primary ones on the horizontal axis. Each multi-hazard scenario includes both primary and secondary hazards. The matrix comprises a series of cells, each representing a potential interaction between a primary and secondary hazard. The categories indicate the probability of potential interaction between the corresponding hazards, with low and high probability representing the two extremes. The third step is to adjust the intensity of secondary hazards based on their interaction with primary hazards. Hazards with high potential interaction probabilities are assigned increased intensities, whereas those with low or no interaction retain their initial values. This adjustment process entails multiplying the original intensity by specific adjusted principles, which were developed for post-mining hazards and take into account interactions among natural, mining, and technological hazards [29].
where is the adjusted hazard level of hazard i, the initial hazard intensity of hazard i, the hazard interaction level with k varying from 1 to 3 and the number of different interactions (with other hazards) for each interaction level.
The final step in this method is calculating the MHI by summing the adjusted intensities of all hazards in each scenario.
where n is the number of hazards identified on the studied site. This index offers a comprehensive assessment of the collective impact of multiple hazards, facilitating a comparative analysis across diverse multi-hazard scenarios [28]. For the sake of comparison, the MHI should be normalized, in the case study from 0 to 9.
Exposed Elements at Risk (EAR)
The identification of EAR can be achieved by determining which elements are present in hazard zones and which of these elements are susceptible to potential losses [22,25]. Given that the losses in question can be of both quantitative and qualitative value, the data pertaining to this factor may vary depending on the specific regional or national regulations that apply. To ensure consistency across case studies, Land Use/Land Cover data derived from Sentinel-2 data was employed [30]. The expert user is required to define a risk level (ranging from 1 to 9) for each class. However, the integration of more detailed datasets, if available, can facilitate the EAR factor.
Vulnerability Index (VI)
Vulnerability is a pivotal element in multi-risk analysis, signifying the extent to which specific EAR (persons, structures, and infrastructures) are susceptible to risk [25]. It incorporates a multitude of factors, including demographics, infrastructure, socio-economic conditions, and community resilience. The Social Vulnerability Index (SoVI) represents a state-of-the-art approach and a potential method for assessing vulnerability. Social Vulnerability Indices (SoVI), developed by different authors [31,32], evaluate vulnerability through a composite index that includes a range of socio-economic and demographic variables, such as income levels, age distribution, education, and housing quality. These factors can affect a community's ability to cope with and recover from hazards.
For the POMHAZ project, a specific post-mining SoVi was developed [33,34] and later adjusted to a more holistic Vulnerability Index (VI), that includes social and physical vulnerability. It is calculated from 4 weighted classes with 10 subclasses:
- Socioeconomic status (Unemployment rate, GDP per capita)
- Household composition (Population < 15 y.o. / > 64 y.o., population density)
- Environment (Settlement area, agricultural area)
- Infrastructure (Building ag, material, geometry and traffic area)
After normalization of each subclass from 1 to 9 and calculating the average for each class, the VI can be calculated for each zone (e.g. municipality) and then rasterized:
where is the normalized, average index value for each class and the adjustable weight for each class, calculation a sum for the four classes. The standard weights are 0,3 for socioeconomic status, 0,4 for household composition, 0,1 for environment and 0,2 for infrastructure [28].
5. Development of the Spatial DSS
In the realm of integrating the risk factors in an open-source tool for understanding their spatial extent and relationship, spatial Decision Support Systems (sDSS) comes into place [35,36,37,38,39,40,41]. This interactive tool serves as a vital resource for decision-making by relevant stakeholders. The sDSS was developed using a Python Flask-based Application Programming Interface (API), establishing routes that correspond to each factor in the risk assessment: Hazard assessment, Exposed element at risk and Vulnerability routes. These routes facilitate the processing and analysis of individual risk components. Additionally, a composite route was developed to integrate all factors, enabling the definition of risk classes according to the assessment methodology designed for implementation by the stakeholders.
Front-End and Backend Architecture
All data is stored in a PostGIS database, which allows spatial queries and raster data management. Each route within the sDSS establishes a connection with the database based on the user-selected study cases, ensuring that only relevant data is processed for the specific analysis (Figure 2).
In the hazard assessment process, the backend integrates multiple multi-hazard scenarios by applying user-defined weightings to the contributing factors (hazards) and calculating the Multi-Hazard Index (MHI). For each scenario, users can select the hazards relevant to the specific study area. The weighting of each hazard is performed using the adjusted principle [16].
The Graphical User Interface (GUI) collects the intensity levels and positional data for each hazard through JavaScript libraries. This information is then sent to the backend, which interacts with the database management system (DBMS) to rasterize the selected hazards. Using Equation (2), the backend adjusts the weight of each hazard. Subsequently, all hazards are aggregated to compute the MHI for each scenario, refining the risk assessment based on expert input.
The exposed elements at risk route provides users with the capability to reclassify the land use and land cover (LU/LC) classes for each study area. The LU/LC data used for this reclassification is derived from an Esri global map of LU/LC ESA Sentinel-2 imagery at 10m resolution product of Impact Observatory’s deep learning AI land classification model [26,42]. Eleven distinct LU/LC classes were established to represent various land cover types, enabling the discrimination of elements that are more susceptible to risk, such as urban areas, agricultural lands, or forests.
The Vulnerability route uses the Vulnerability Index (VI) map to assess the vulnerability of each study area. The VI was calculated for all municipalities within the area of interest, providing a comprehensive measure of vulnerability that includes both social and physical dimensions. This route establishes a connection with the database to retrieve the base values for the VI classes in the study area. Given the user input in the API, the weights for each class of the VI—socioeconomic status, household composition, environment, and infrastructure—are adjusted based on their assessment. In the backend, the VI is recalculated using Equation (4), which integrates these classes, ensuring that the vulnerability assessment reflects the user-defined priorities
Finally, the results from all previous routes are integrated into the Risk Assessment route to generate a comprehensive risk map for the study area. A raster is calculated using a matrix product that combines the spatial data from the MHI, Exposed Elements at Risk, and the SoVI map. The integration produces a visual output in the API’s front-end, classifying the area into four risk categories: No Risk, Low Risk, Medium Risk, and High Risk. Stakeholders have the flexibility to define the interval levels for each class based on expert knowledge. Using the risk interval route, the classes selected by the user are used to calculate the different risk class maps, helping to establish the most effective methodology to address each post-mining multi-hazard environment.
6. Case Study: Southern Ruhr Area (Germany)
The impact of mining activities over the past few centuries has been significant, leaving a discernible imprint on numerous regions across Germany [43], Europe, and the globe. In the southern Ruhr area, for instance, the legacy of coal mining is particularly evident, with a multitude of unpreserved shafts, mining areas situated in close proximity to the surface, and extensive networks of abandoned tunnels and dewatering adits [44,45]. These structures, if left unaddressed, pose a potential risk to the stability of the earth's surface [46]. Therefore it is used as one of the case studies in the project, alongside the former hard coal mining cities Wałbrzych, Sosnowiec and Piekary Śląskie in Poland, the lignite surface mines in Ptolemais and Megalopolis, Greece and the Cocheren mine in the East of France-Lorraine coal basin [47].
To test the methodology and the developed sDSS, only open source, public and archival data was used. In the 1000 km² area of interest (Figure 3) data for several post-mining and natural hazards alongside socioeconomic data for the VI calculation was collected: Sinkhole (local collapse) hazards where derived from shafts [48], adits [49,50] and coal seams [51] with their intensity decreasing with distance to the object or the surface; Flood hazards from open source flood maps (intensity increasing with reoccurrence intervals) [52]; rockfall and landslide hazards from open source digital elevation models (based on angle and curvature) [53].
7. Results
Following the described methodology, the multi-hazard and multi-risk assessment was tested using the first case study: the southern Ruhr area in western Germany (Figure 3). In this verification process, only publicly accessible and historical data were utilized [30,48,49,50,51,52,53,54,55]. However, for data protection reasons the following maps only show parts of the Area of Interest (AOI) without scale and coordinates. For subsequent applications, the sDSS will also be supplemented with more confidential company and administrative data, resulting in enhanced outcomes. Stringent data protection protocols are implemented to prevent any unauthorized use or disclosure of the data.
Using the four hazards “Subsidence” (SU), “Sinkhole” (SH), “Gas Emissions linked to Mining” (MG) and “Hydrological disturbances, mining induced floods (surface)”1 (FL), two basic scenarios with potential interactions where tested2:
- Scenario 1: Sinkholes opening new ways for mine gas emissions
- Scenario 2: Subsidence creating hydrological disturbances and/or floods
MHI Calculation
In accordance with the identified hazard sources, hazard polygons were devised, to which a range of factors (see above) were assigned intensity values from 1 to 5. These were subsequently transformed into 10 x 10 m cells. By employing the formula (2) and the corresponding interaction levels (SU = 2, SH = 3, MG = 1 and FL = 3), it is possible to calculate and visualize the spatial MHI for the two scenarios (Figure 4).
EAR Assessment
In order to conduct the EAR assessment, open LU/LC data [26] was employed. As with the MHI calculation, the use of more precise data from stakeholders can facilitate the generation of superior results in later uses. The land use values were reclassified in Table 2 in order to represent their respective risk levels:
The result of the reclassification is shown in Figure 5, highlighting higher risks for elements on the surface in denser populated areas in the northern part of the AOI.
VI Calculation
The calculation of the VI utilizing the four classes was conducted for each municipality within the AOI, representing the lowest data resolution available. The open data [56,57,58] allowed for the gathering of values for each subclass, which were then normalized from 1 to 9 in comparison to national averages. The class value was calculated as the mean of the subclasses, weighted and used as a factor for the overall VI calculation using equation (4). Table 3 shows the values for the cities in the case study AOI, while Figure 6 provides a visual representation of this data.
It is evident that the socioeconomic, household, and environmental factors for the region are below the national average, which is to be expected for a region that has been affected by decades of mining. However, the infrastructure is a significant advantage for this region, as it can be utilized to facilitate the post-mining transition process.
Multi-Risk Calculation
Ultimately, all three factors were transformed into a raster and homogenized to a uniform spatial resolution. For the 10,000,000 individual cells within the 1000 km² AOI, the multi-risk was then calculated from the three factors in accordance with the formula (1). This will result in a scale from 0 to a theoretical maximum of 729 (MHI = 9, EAR = 9, VI = 9) for each cell. Figure 7 depicts the final spatial visualization for both multi-hazard scenarios. The values have been reclassified from numeral values to four classes: No color shows areas with no risk, the expert user can define the limits for the risk classes “low risk”, “medium risk” and “high risk” individually. These classes lead the user directly to different choices, e.g., monitoring [46], risk mitigation [59] or land planning [60].
The two maps illustrate the impact of disparate choices during the analytical process on the resulting outcome, particularly the utilization of disparate hazards and their potential interactions. A comparison of the outcome with the other factors, EAR and VI, reveals that they also exert a significant influence on the transition from multi-hazard to multi-risk levels, contingent on the elements at risk and their vulnerability.
Usage of the sDSS methodology and the programmed server and GUI will be tested and validated using other mining sites from France, Greece and Poland within the scope of project POMHAZ.
8. Discussion
The paper contributes to develop an operational decision support tool for assessing the risk related to post-mining hazards in mining regions, as an improvement of previous theoretical and limited approaches. The users of the tool are the decisionmakers facing the management of mining region in transition. The utilization of GIS-supported evaluation of multi-hazard and multi-risk scenarios demonstrates considerable potential for post-mining areas. The server-based approach allows for low-threshold access via the respective web browser through the use of a simple graphical user interface (GUI). No additional software is necessary for the analysis. Scalability and replicability are key strengths of this approach, as its framework can be adapted to diverse regions by integrating region-specific datasets and addressing local challenges.
Expert knowledge regarding the location, the hazards, as well as the socio-economic and other factors on site, which can be sourced from open data, when combined with automated calculation, enables rapid results for various stakeholders. This allows for the preparation of decisions on monitoring measures, risk mitigation, or land planning for a variety of scenarios, which can then be analyzed in an iterative process. The capacity to alter diverse values and weights in an iterative manner and to evaluate alternative scenarios renders the sDSS a highly flexible and robust instrument for addressing post-mining challenges.
All results (and intermediate steps) of the sDSS programmed from free software can be downloaded and used in other software applications. Strict data protection guidelines, the separation but also shared use of data strings and silos, and the possibility of anonymization by reducing the resolution also enable the evaluations to be made publicly available.
In the paper, the usefulness of the sDSS and GIS tool was clearly demonstrating thanks to compare two scenarios of southern Ruhr mining region in Germany. Additional applications can be carried out to rend the use of the tool more effectiveness.
It will be particularly interesting to observe the role that AI will play in the analysis of these data sets in the future, especially if it can be further trained on the basis of previous cases.
Author Contributions
Conceptualization, B.H. and M.A.; methodology, B.H. and M.A.; software, V.I. and M.B..; validation, B.H. and V.I.; data curation, B.H.; writing—original draft preparation, B.H.; writing—review and editing, B.H., M.A., M.B. and V.I.; visualization, B.H. and V.I.; project administration, M.A. All authors have read and agreed to the published version of the manuscript.
Funding
This research has received funding from the Research Fund for Coal and Steel under Grant Agreement No. 101057326.
Data Availability Statement
The original data presented in the article will be made openly available in the EU Horizon Results Platform https://ec.europa.eu/info/funding-tenders/opportunities/portal/screen/opportunities/horizon-results-platform after the end of the project. The original data presented in the case study was derived from the following resources available in the public domain: Geoportal NRW at https://www.geoportal.nrw/ and OpenStreetMap at https://www.openstreetmap.org.
Acknowledgments
The owners would like to thank everyone else involved in the research of project POMHAZ, specifically the international partners from CERTH, GIG, PPC and SRK.
Conflicts of Interest
The authors declare no conflicts of interest.
| 1 | Natural flood risks were employed as a surrogate, albeit with the caveat that these can be intensified by the impact of mining. |
| 2 | As this is merely a test case utilizing open data, the presented scenarios should only be regarded as illustrative examples to assess the methodology. A comprehensive investigation of the area, the existing hazards and their interactions will be conducted with more precise data at a subsequent stage of the project. |
References
- Bell, F. G., Donnelly, L. J. Mining and its impact on the environment; Taylor & Francis: London, 2006.
- Benndorf, J. Closed Loop Management in Mineral Resource Extraction. Springer, Cham 2020. [CrossRef]
- Goerke-Mallet, Peter, Melchers, Christian; Kretschmann, J. Global post-mining challenges - Experiences gained from the German hard coal mining industry. 16th International Congress for Mine Surveying, Brisbane, Australia, 12-16 2016.
- Coelho, P.; Teixeira, J.; Gonçalves, O. Mining Activities: Health Impacts. Encyclopedia of Environmental Health; Elsevier, 2011; pp 788–802, ISBN 9780444522726.
- Donnelly, L. Mining Hazards. Encyclopedia of Engineering Geology 2018, 649–656. [CrossRef]
- Al Heib, M.; Franck, C. A methodology for multi-hazard interaction assessment of abandoned mines. Journal of Industrial Safety 2024, 1, 100018. [CrossRef]
- Available online: https://ec.europa.eu/info/funding-tenders/opportunities/portal/screen/opportunities/projects-details/43252449/101057326/RFCS2027 (accessed on 21 November 2024).
- Haske, B.; Bouaziz, M.; Rudolph, T.; Benndorf, J. Ganzheitliches Risikomanagement fuer europaeische Nachbergbauregionen - Das Projekt POMHAZ 2023.
- Bétournay, M.C. Abandoned metal mine stability risk evaluation. Risk Anal. 2009, 29, 1355–1370. [CrossRef]
- Shayeb, Y.E.; Heib, M.A.; Josien, J.P. Back analysis for predicting type and size of subsidence hazard over abandoned Lorraine iron mines. In , 2004.
- Bell, F.G.; Donnelly, L.J. Mining and its Impact on the Environment; CRC Press, 2006, ISBN 9781482288230.
- Lagny, C.; Salmon, R.; Pokryszka, Z.; Lafortune, S. Impact of mine closure and access facilities on gas emissions from old mine workings to surface : examples of French iron and coal Lorraine basins 2012.
- Koukouzas, N.; Zevgolis, I.; Theocharis, A.; Nalmpant Sarikaki, D.; Al Heib, M.; Velly, N.; Wysocka, M.; Haske, B.; Roumpos, C. WP2: Post-mining hazards and multi hazards identification and assessment methodology: D6 - Deliverable D2.1: Database of hazards related to closed and abandoned coalmines and lignite in Europe, 2024.
- Al Heib, M.M.; Franck, C.; Djizanne, H.; Degas, M. Post-Mining Multi-Hazard Assessment for Sustainable Development. Sustainability 2023, 15, 8139. [CrossRef]
- Kratzsch, H. Bergschadenkunde; Springer Berlin Heidelberg: Berlin, Heidelberg, 1974, ISBN 978-3-642-93035-5.
- Moraiti, E.; Christaras, B.; Brauer, R. LANDSLIDE IN NACHTERSTEDT OF GERMANY. geosociety 2017, 43, 1267. [CrossRef]
- Jia, L.; Wang, J.; Gao, S.; Fang, L.; Wang, D. Landslide risk evaluation method of open-pit mine based on numerical simulation of large deformation of landslide. Sci. Rep. 2023, 13, 15410. [CrossRef]
- Chałupnik S., Wysocka M., Janson E., Chmielewska I., Wiesner M. Long term changes in the concentration of radium in discharge waters of coal mines in Upper Silesian rivers. Journal of Environmental Radioactivity 2017, 171, 117–123.
- Chen, Y.-M., Fan, K. S., Chen, L.-C. Requirements and Functional Analysis of a Multi-Hazard Disaster-Risk Analysis System. Human and Ecological Risk Assessment: An International Journal 2010, 16, 413–428. [CrossRef]
- Komendantova, N., et al. Multi-hazard and multi-risk decision-support tools as part of participatory risk governance: Feedback from civil protection stakeholders. International Journal of Disaster Risk Reduction 2014, 8, 50–67.
- Disaster Risk Reduction for Resilience; Springer International Publishing, 2022, ISBN 9783030721961.
- Kappes, M.S.; Keiler, M.; Elverfeldt, K. von; Glade, T. Challenges of analyzing multi-hazard risk: a review. Nat Hazards 2012, 64, 1925–1958. [CrossRef]
- Risk Assessment in the Modern World: International Conference on Risk Assessment; Zio, E., Aven, T., Ed.; Springer, 2011.
- Dalezios, N.R. Environmental Hazards Methodologies for Risk Assessment and Management. Water Intell Online 2017, 16, 9781780407135. [CrossRef]
- POMHAZ Consortium. TECHNICAL REPORT (PART B): RFCS Project Number: 101057326. Reporting from 03/10/2022 to 02/04/2024, 2024.
- Esri. ArcGIS Living Atlas of the World | Sentinel-2 Land Cover Explorer. Available online: https://livingatlas.arcgis.com/landcoverexplorer/#mapCenter=55.24574%2C25.06542%2C11&mode=step&timeExtent=2017%2C2023&year=2023 (accessed on 22 November 2024).
- Liu, B.; Han, X.; Qin, L.; Xu, W.; Fan, J. Multi-hazard risk mapping for coupling of natural and technological hazards. Geomatics, Natural Hazards and Risk 2021, 12, 2544–2560. [CrossRef]
- Koukouzas, N.; Zevgolis, I.; Theocharis, A.; Nalmpant Sarikaki, D. WP3: Post-mining risks assessment methodology and decision support systems: Task 3.1: Development of the post-mining risks assessment. Presentation, unpublished, 2024.
- Degas, M.; Al Heib, M. WP2: Post-mining hazards and multi hazards identification and assessment methodology: D8 - Deliverable D2.3: Methodology of interaction between post-mining hazards, 2024.
- Haske, B.; Inojosa, V. WP3: Post mining risks assessment methodology and decision support systems: Task 3.3: Development of a DSS for risk management. Presentation, unpublished 2024.
- Cutter, S.L.; Ash, K.D.; Emrich, C.T. The geographies of community disaster resilience. Global Environmental Change 2014, 29, 65–77. [CrossRef]
- Flanagan, B.E.; Gregory, E.W.; Hallisey, E.J.; Heitgerd, J.L.; Lewis, B. A Social Vulnerability Index for Disaster Management. Journal of Homeland Security and Emergency Management 2011, 8. [CrossRef]
- van de Loo, K.; Haske, B. Proposal for a SOVI for POMHAZ. unpublished, 2024.
- Kai van der Loo; Benjamin Haske. Proposal for a SOVI for POMHAZ, 2024.
- Agostini, P.; Critto, A.; Semenzin, E.; Marcomini, A. Decision Support Systems for Contaminated Land Management: A Review. In ; pp 1–20.
- Goeran Fick; Ralph H. Sprague. Decision Support Systems: Issues and Challenges; Elsevier Ltd, 1980, ISBN 9780080273211.
- Marcomini, A., Suter II, G., & Critto, A. Decision Support Systems for Risk-Based Management of Contaminated Sites; Springer: Boston, MA, 2009.
- Newman, J.P., et al. Review of literature on decision support systems for natural hazard risk reduction: Current status and future research directions. Environmental Modelling & Software 2017, 96, 378–409.
- Power, D.J. Decision Support Systems: Concepts and Resources for Managers; Greenwood Publishing Group, 2002.
- Sugumaran, R.; DeGroote, J. Spatial DecisionSupport Systems. Principle and Practices; CRC Press. Taylor and Francis Group, 2011.
- TEXMIN. The impact of extreme weather events on mining operations, 2019-2022.
- Karra, K.; Kontgis, C.; Statman-Weil, Z.; Mazzariello, J.C.; Mathis, M.; Brumby, S.P. Global land use / land cover with Sentinel 2 and deep learning. In 2021 IEEE International Geoscience and Remote Sensing Symposium IGARSS. 2021 IEEE International Geoscience and Remote Sensing Symposium IGARSS, 2021; pp 4704–4707, ISBN 2153-7003.
- Michel Deshaies. Mines, the Environment, and Mining Landscapes in Germany. The Digital History Encyclopedia of Europe 2024.
- Harnischmacher, S.; Zepp, H. Mining and its impact on the earth surface in the Ruhr District (Germany). Zeitschrift fuer Geomorphologie, Supplementary Issues 2014, 58, 3 to 22. [CrossRef]
- Arndt, M.; los Angeles, G. de; Lucio, G. de. Geological atlas of the Ruhr Area Deliverable T2.1.14. Interreg North West Europe 2022.
- Haske, B.; Rudolph, T.; Goerke-Mallet, P. The Application of freely available Remote Sensing Data in Risk Management Systems for abandoned Mines and Post-mining. GeoResources Journal 2022, 1, 22–26.
- POMHAZ Consortium. Project Proposal "Post-Mining Multi-Hazards evaluation for land-planning": Proposal number: 101057326, 2021.
- OpenStreetMap. OpenStreetMap. Available online: https://www.openstreetmap.org/#map=15/51.61493/7.18085 (accessed on 22 November 2024).
- Niemeyer; Küper; Kapp; WBK. Historical Maps of the Ruhr Area, 1790, 1834, 1865, 1880, 1912-1931, 1931-1942.
- Research Center of Post-Mining. Internal project documentation of dewatering adits in the southern Ruhr area, 2023.
- Amt für Bodenforschung – Landesstelle Nordrhein-Westfalen, Krefeld. Geologische Karte des Rheinisch-Westfälischen Steinkohlengebietes 1 : 10 000 – digital; Geologischer Dienst NRW, 1949 - 1954.
- Ministerium für Umwelt, Naturschutz und Verkehr. Hochwassergefahrenkarten und Hochwasserrisikokarten. Available online: https://www.flussgebiete.nrw.de/hochwassergefahrenkarten-und-hochwasserrisikokarten (accessed on 22 November 2024).
- Geobasis NRW. Digitales Geländemodell. Available online: https://www.bezreg-koeln.nrw.de/geobasis-nrw/produkte-und-dienste/hoehenmodelle/digitale-gelaendemodelle/digitales-gelaendemodell (accessed on 22 November 2024).
- Inojosa, V. Framework combining remote sensing analysis with prototype spatial decision support system to address multi-hazard challenges in post-mining sites. Case of study: Southern Ruhr area. Master thesis; University of Stuttgart, Stuttgart, 2024.
- con terra GmbH. Bürgerinformationsdienst. Available online: https://geodaten.rag.de/mapapps/resources/apps/bid/index.html?lang=de (accessed on 27 November 2024).
- It.nrw. GEOportal.NRW. Available online: https://www.geoportal.nrw/?activetab=portal (accessed on 27 November 2024).
- Statistische Ämter des Bundes und der Länder | Gemeinsames Statistikportal. VGRdL | Statistikportal.de. Available online: https://www.statistikportal.de/de/vgrdl (accessed on 27 November 2024).
- Wolfram, M. Monitor der Siedlungs und Freiraumentwicklung. Available online: https://monitor.ioer.de (accessed on 27 November 2024).
- Sima, M.; Morosanu, G.A. Mining Hazard Risk Reduction and Resilience. Disaster Risk Reduction for Resilience; Springer International Publishing, 2022; pp 73–99, ISBN 9783030721961.
- Delmas, O. Task 3.3 DSS tool and report detailing its application: Sustainable socioeconomic post-mining planning. presentation, unpublished, Freiberg, 2024.
Figure 1.
The Multi-Risk calculation process. The pre-processed data is stored in the model- and geodatabase, rasterized and then used to calculate the three factors and subsequently the Multi-Risk value for each cell, leading to different causes of action.
Figure 1.
The Multi-Risk calculation process. The pre-processed data is stored in the model- and geodatabase, rasterized and then used to calculate the three factors and subsequently the Multi-Risk value for each cell, leading to different causes of action.
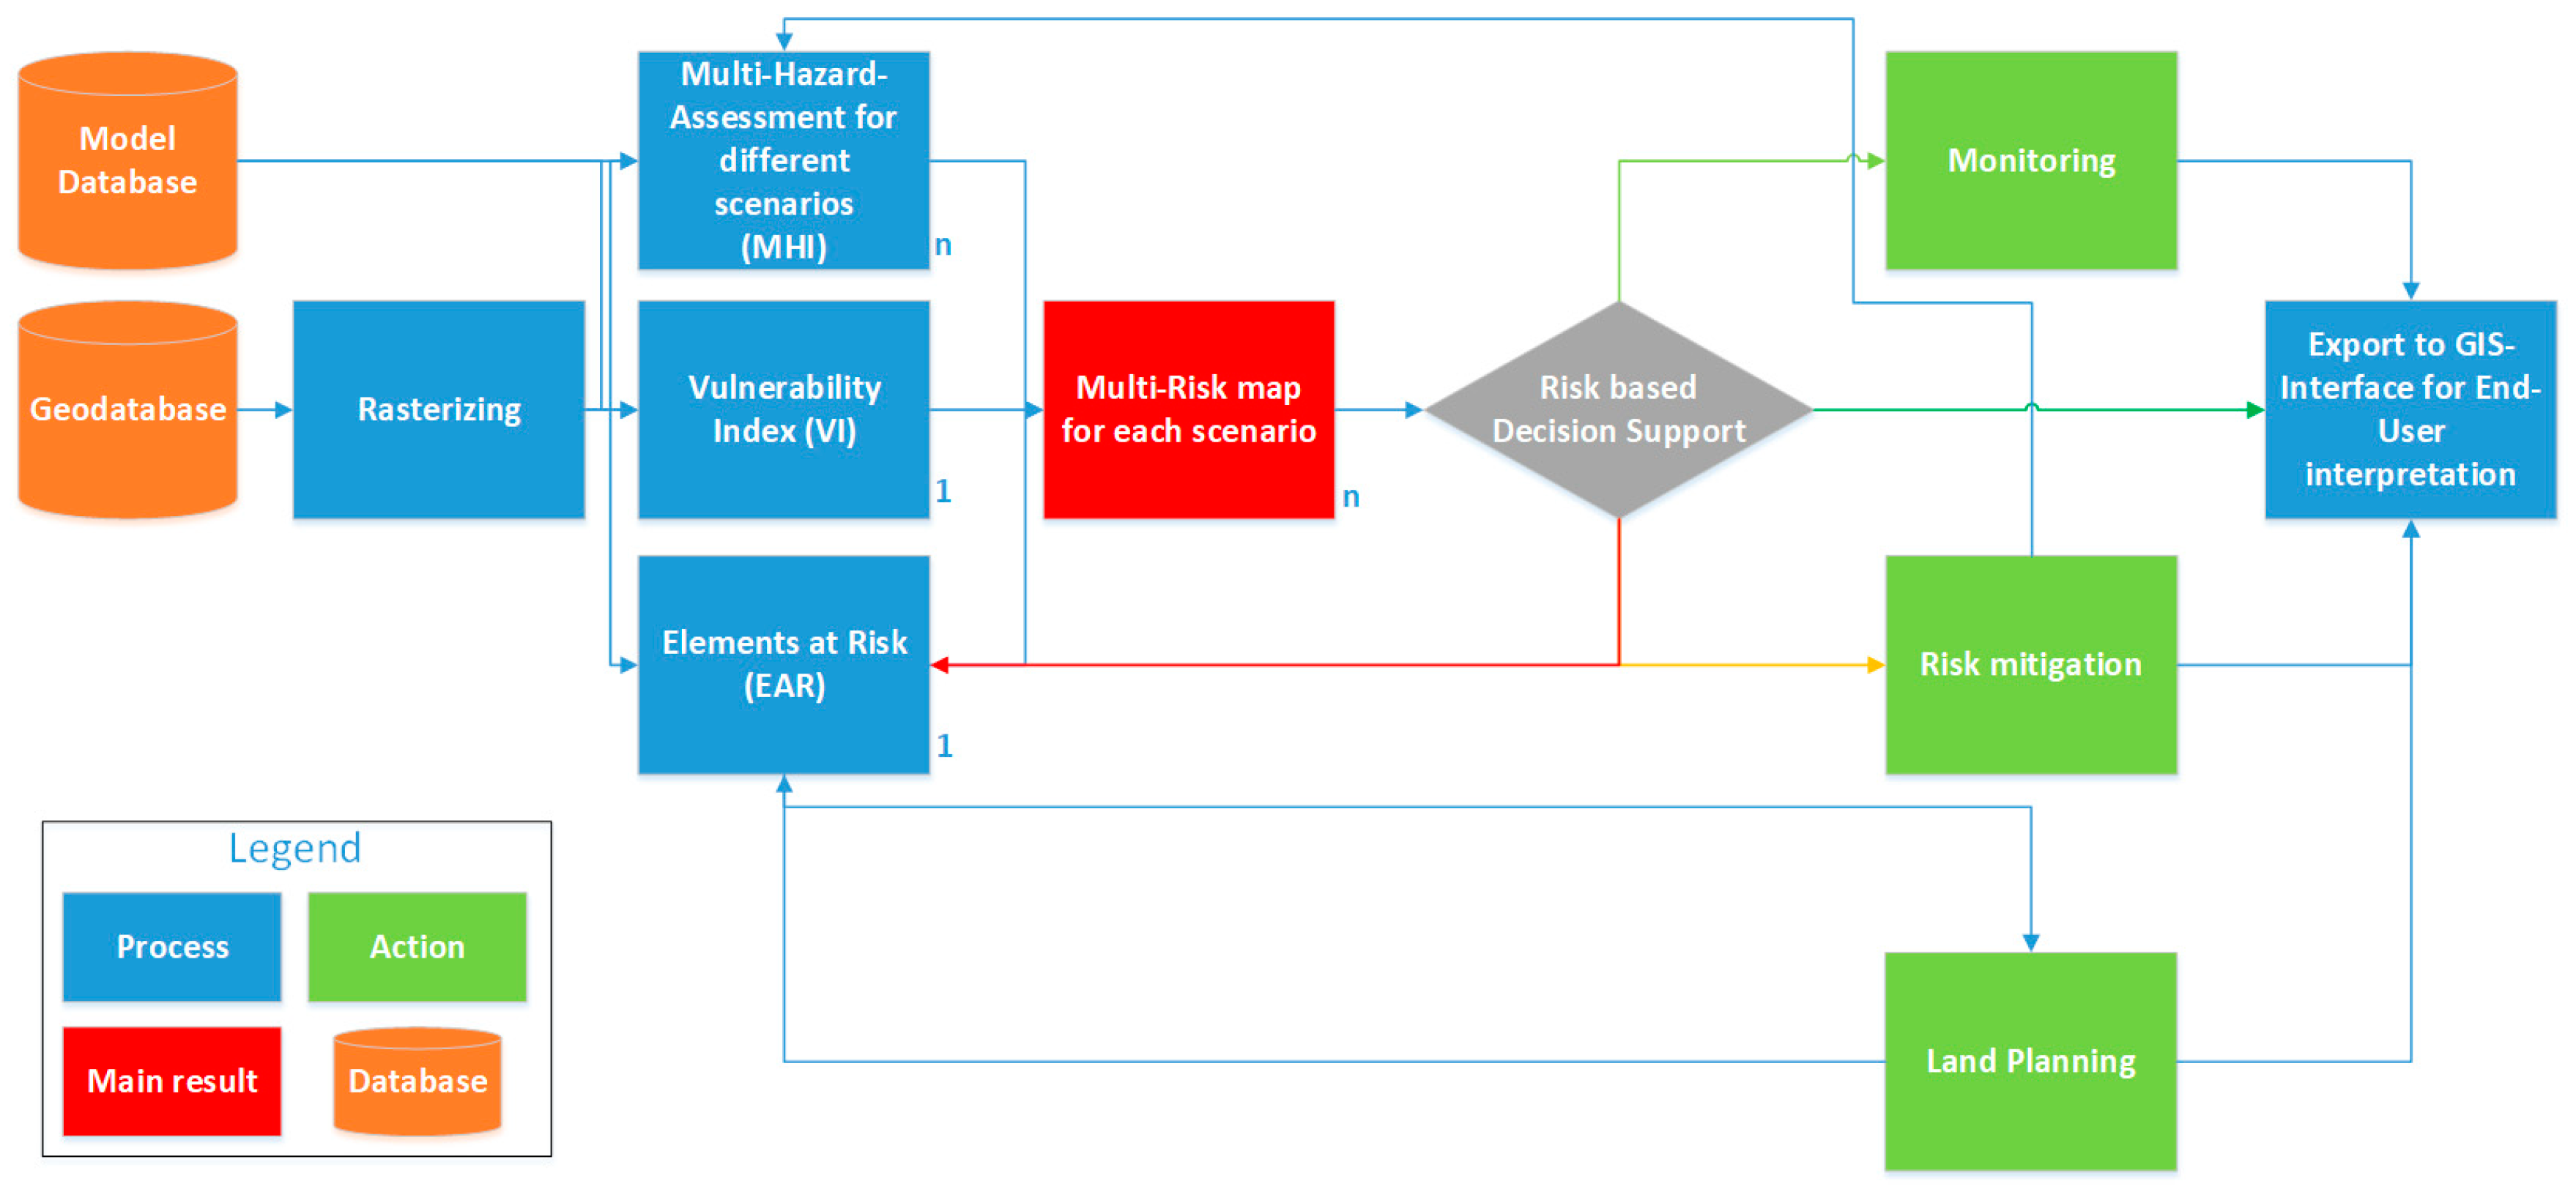
Figure 2.
The different routes in the backend of the sDSS.
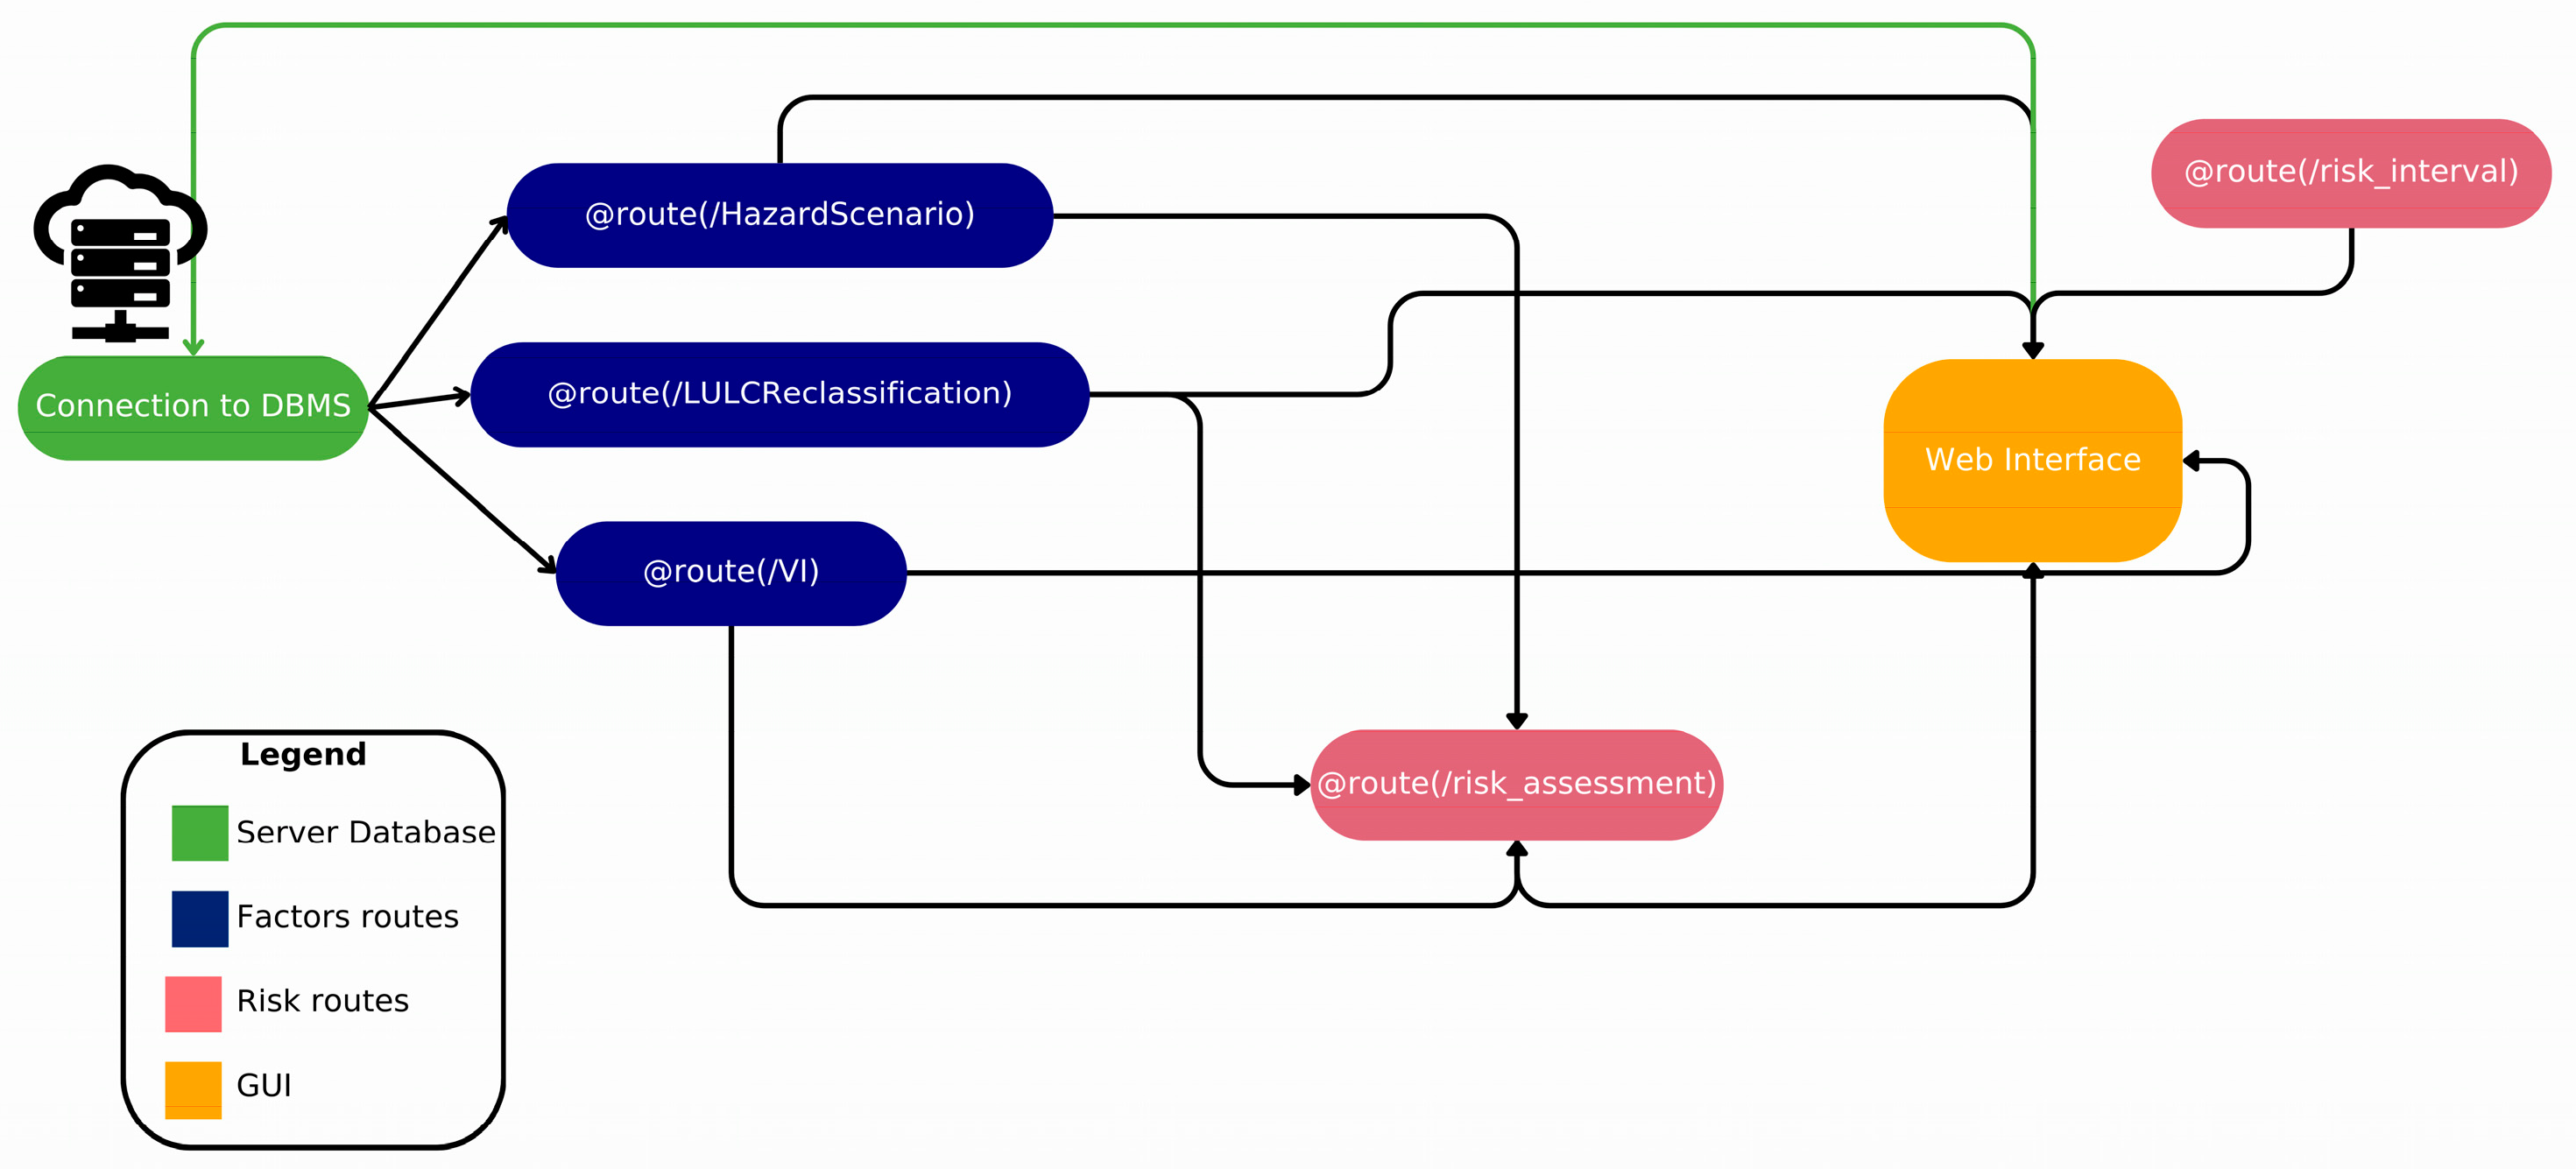
Figure 3.
The case study "Southern Ruhr Area" with open and archival data on shafts and adits alongside adminstrative boundaries.
Figure 3.
The case study "Southern Ruhr Area" with open and archival data on shafts and adits alongside adminstrative boundaries.
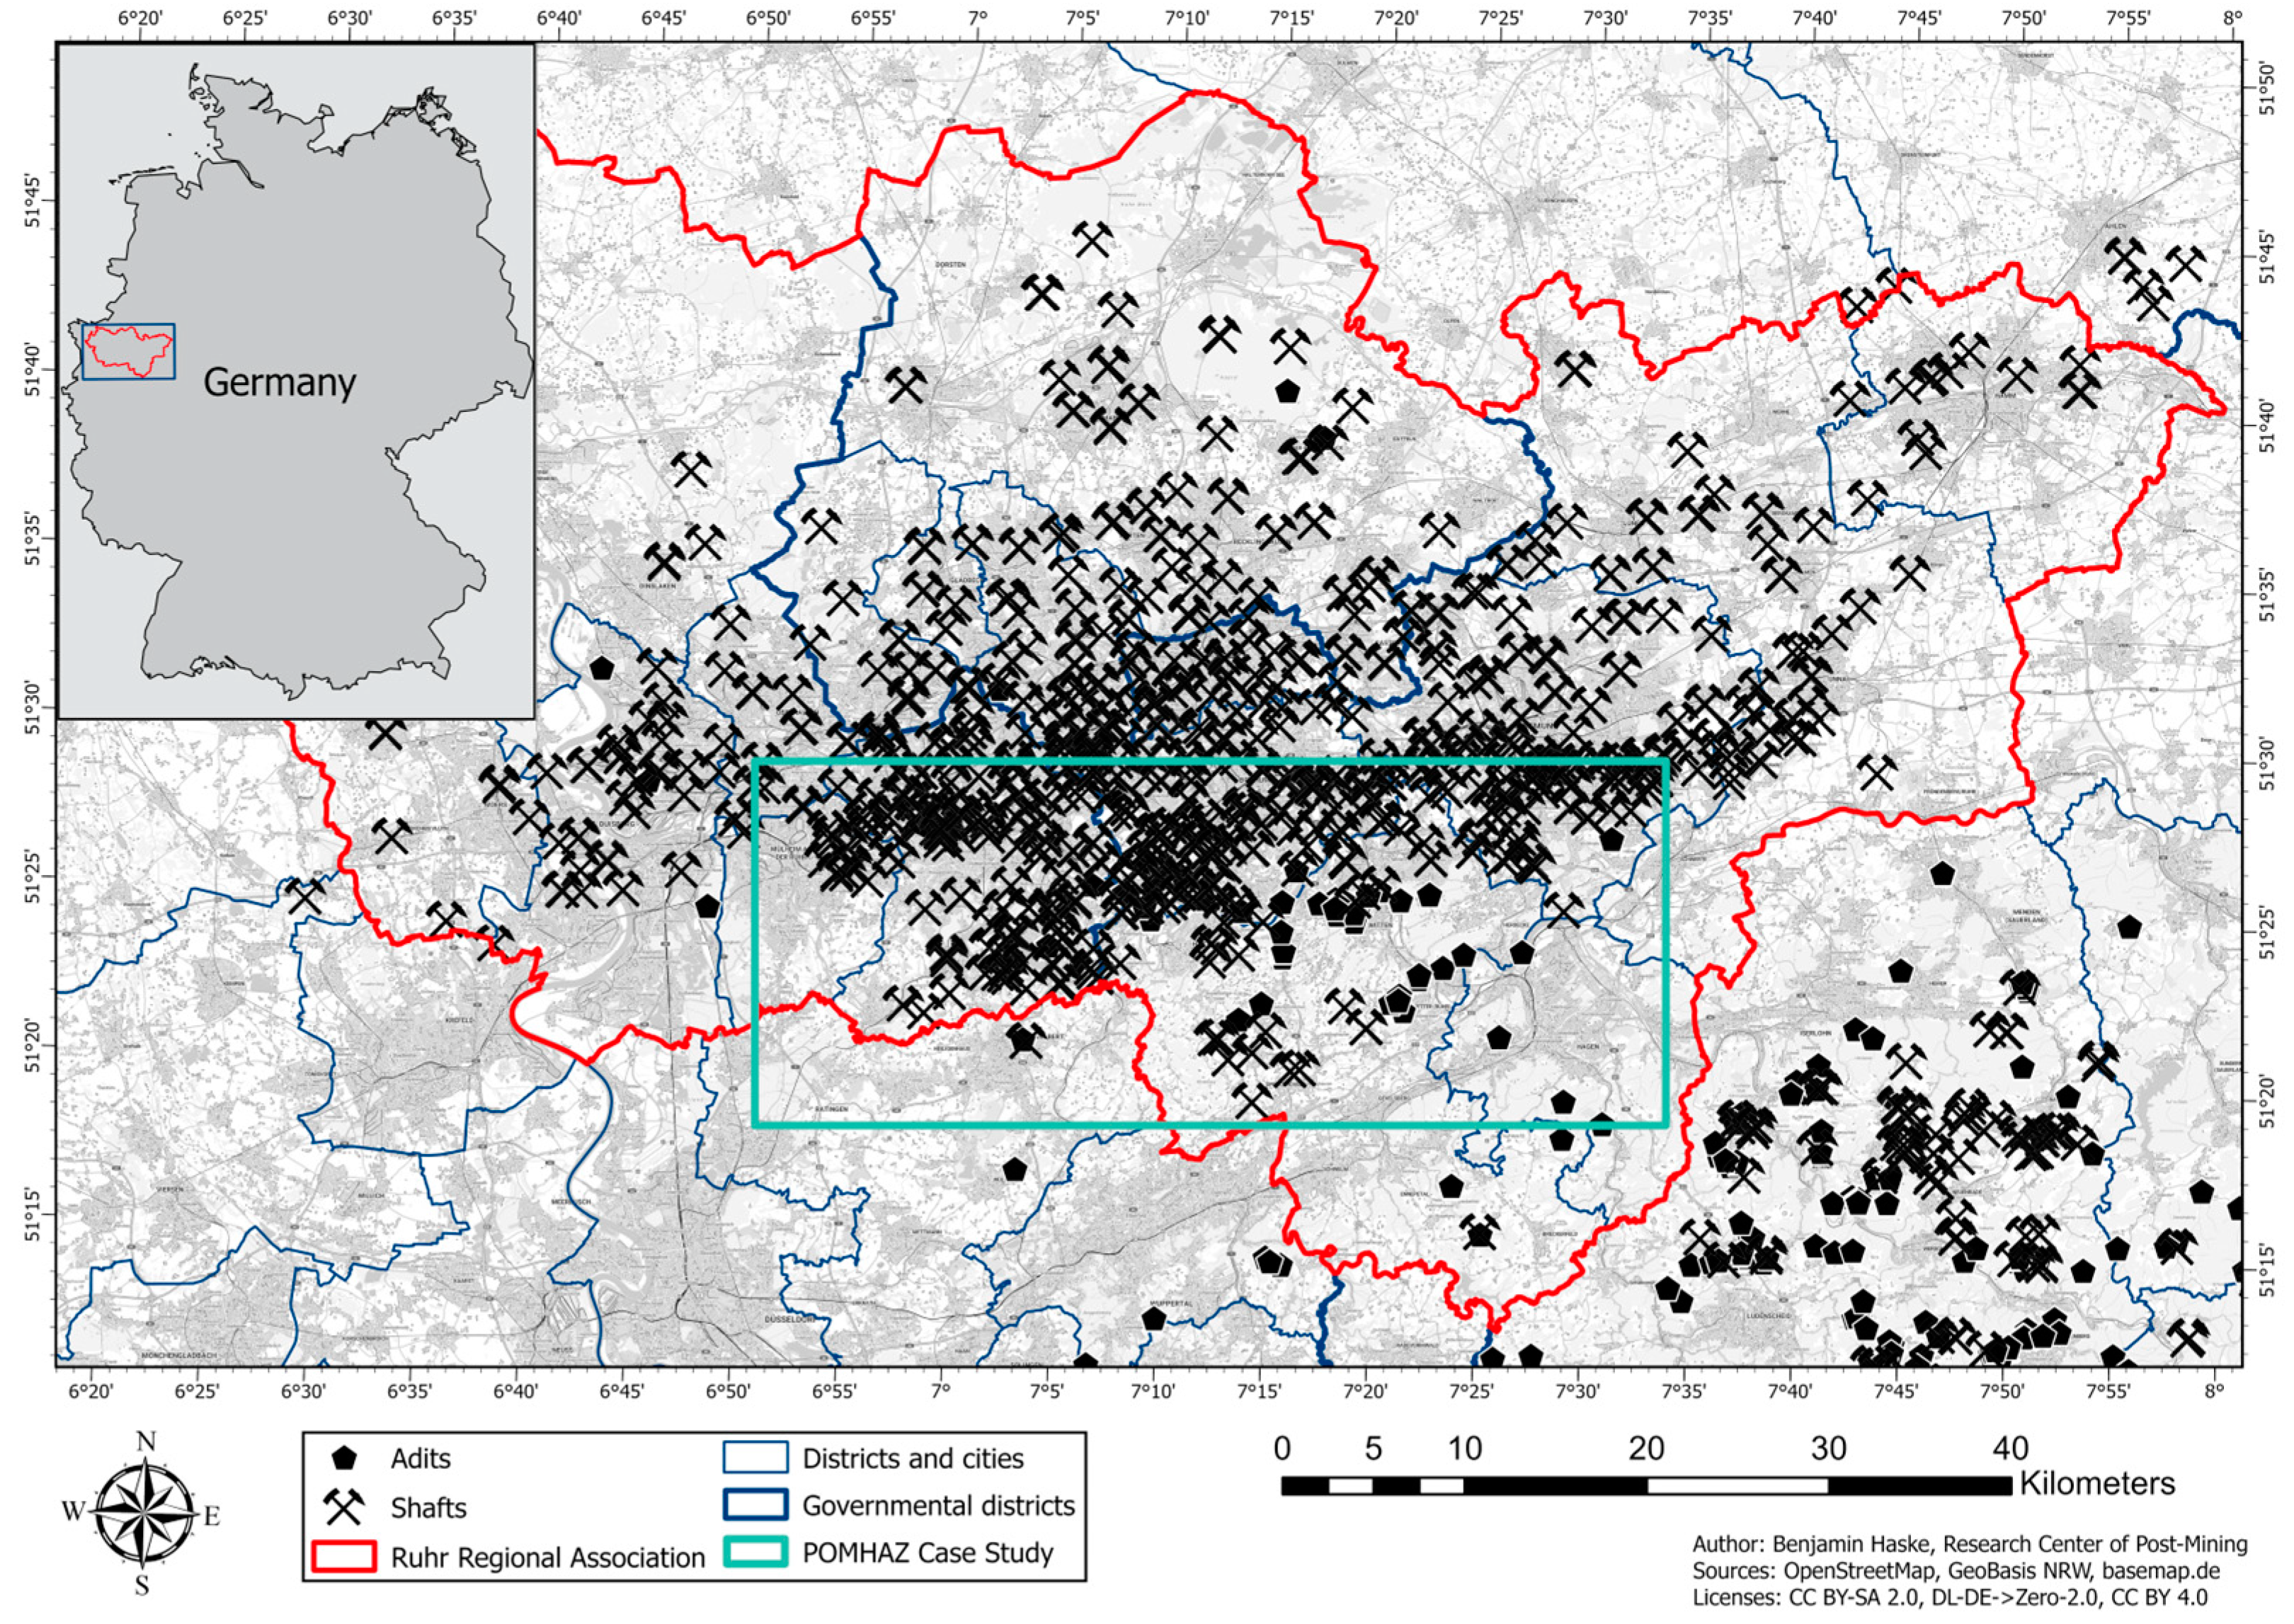
Figure 4.
The spatial MHI from 1 to 9 for both test scenarios (progessive scale).
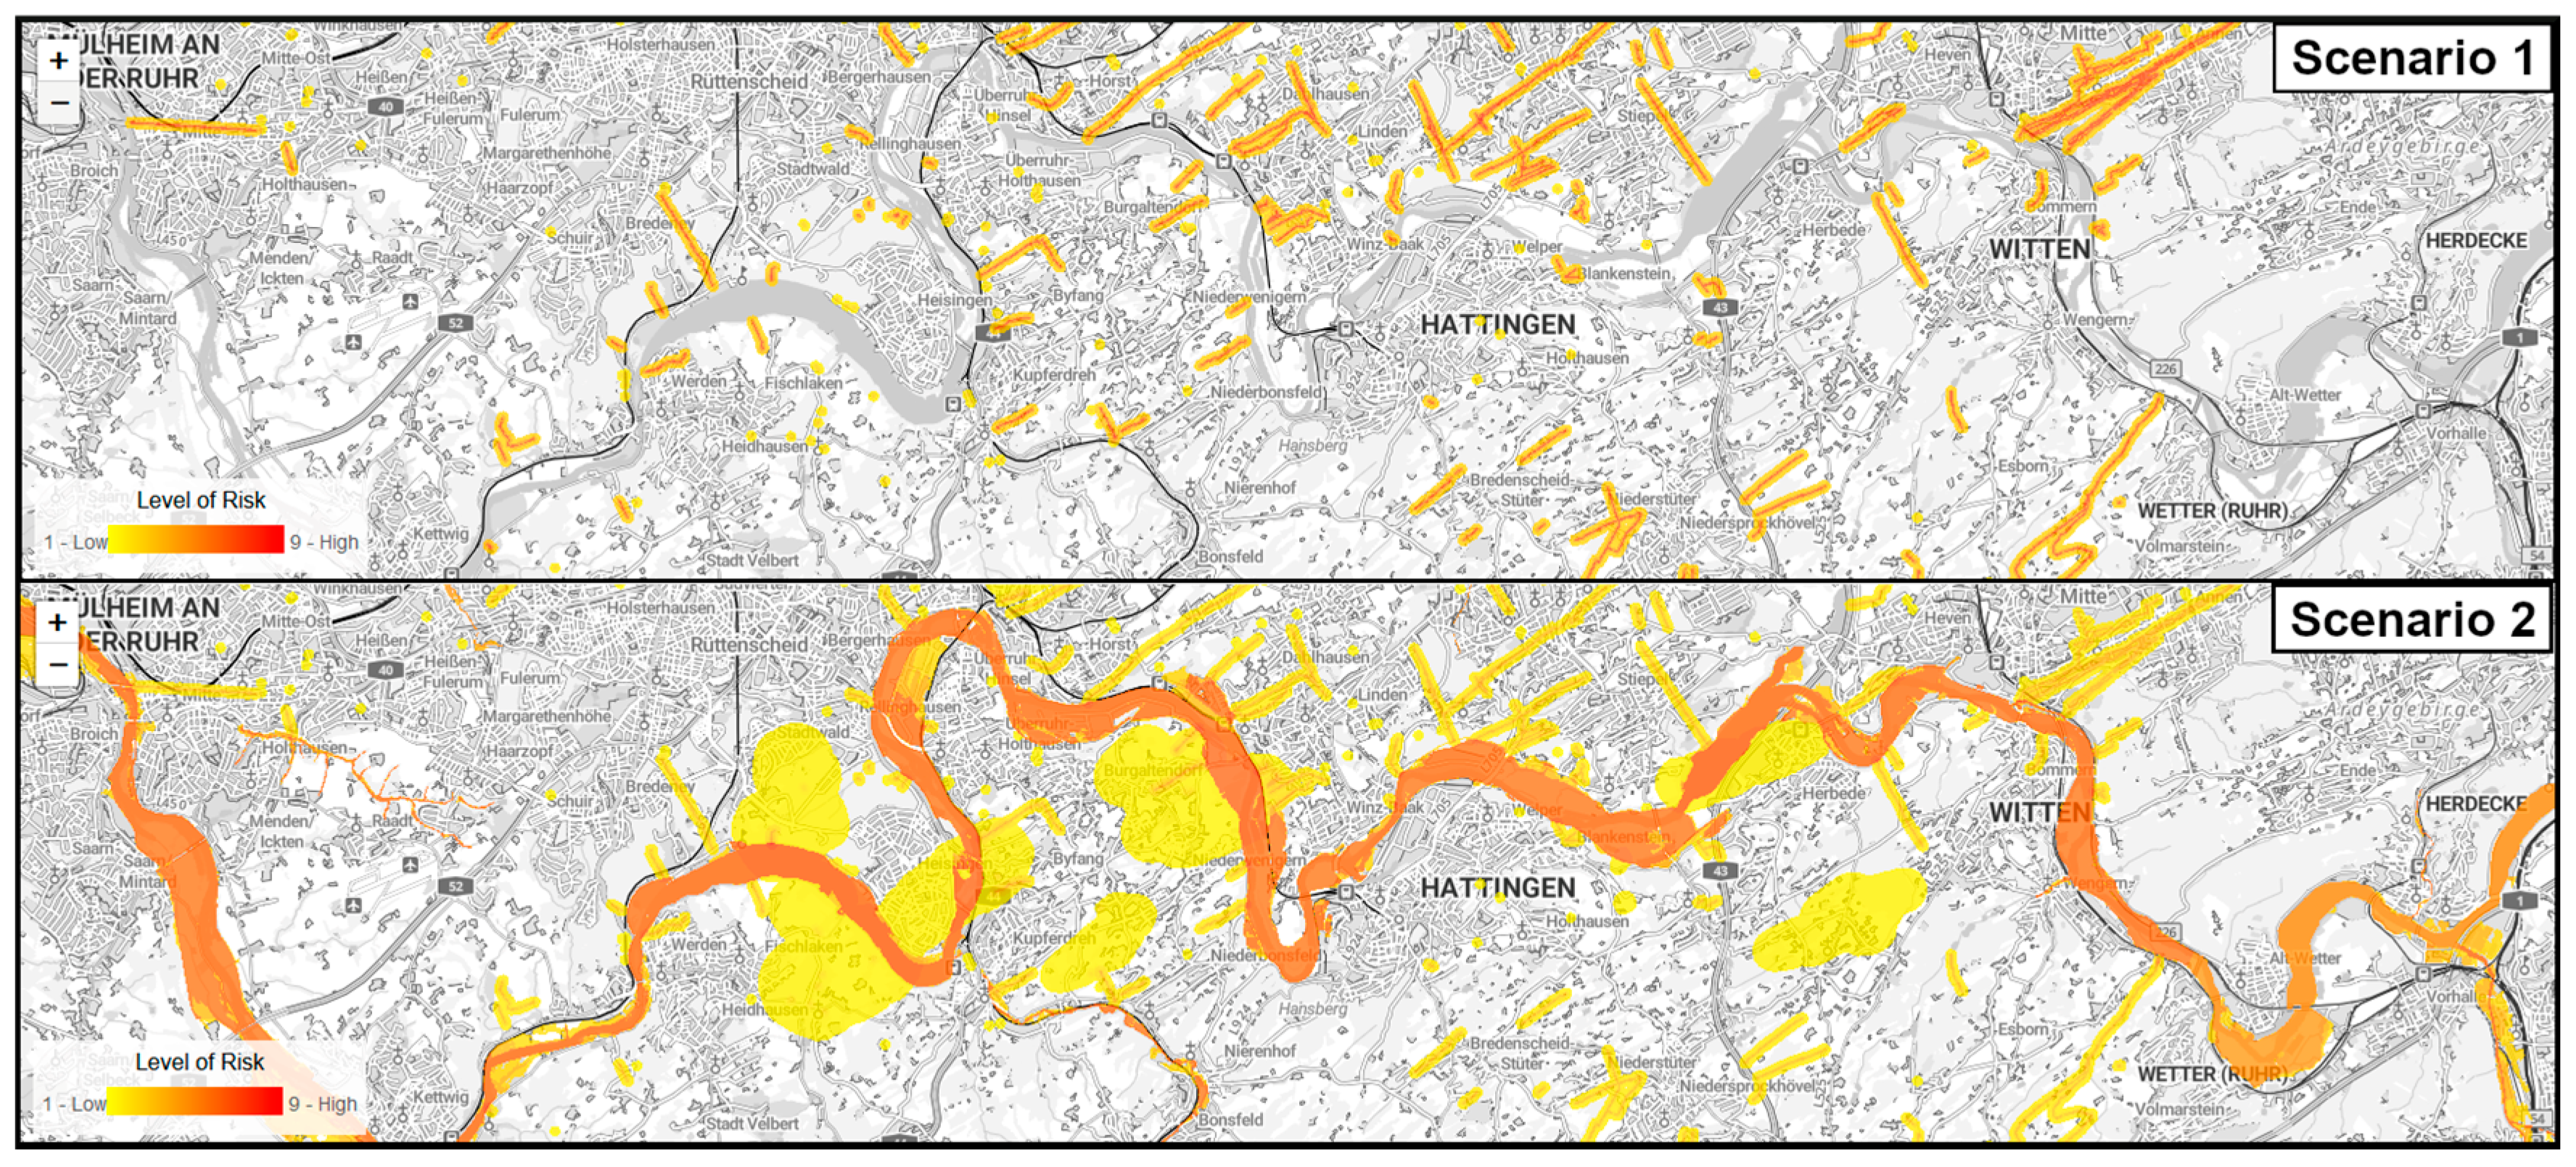
Figure 5.
The reclassified LU/LC values showing the spatial EAR risk levels in the AOI.
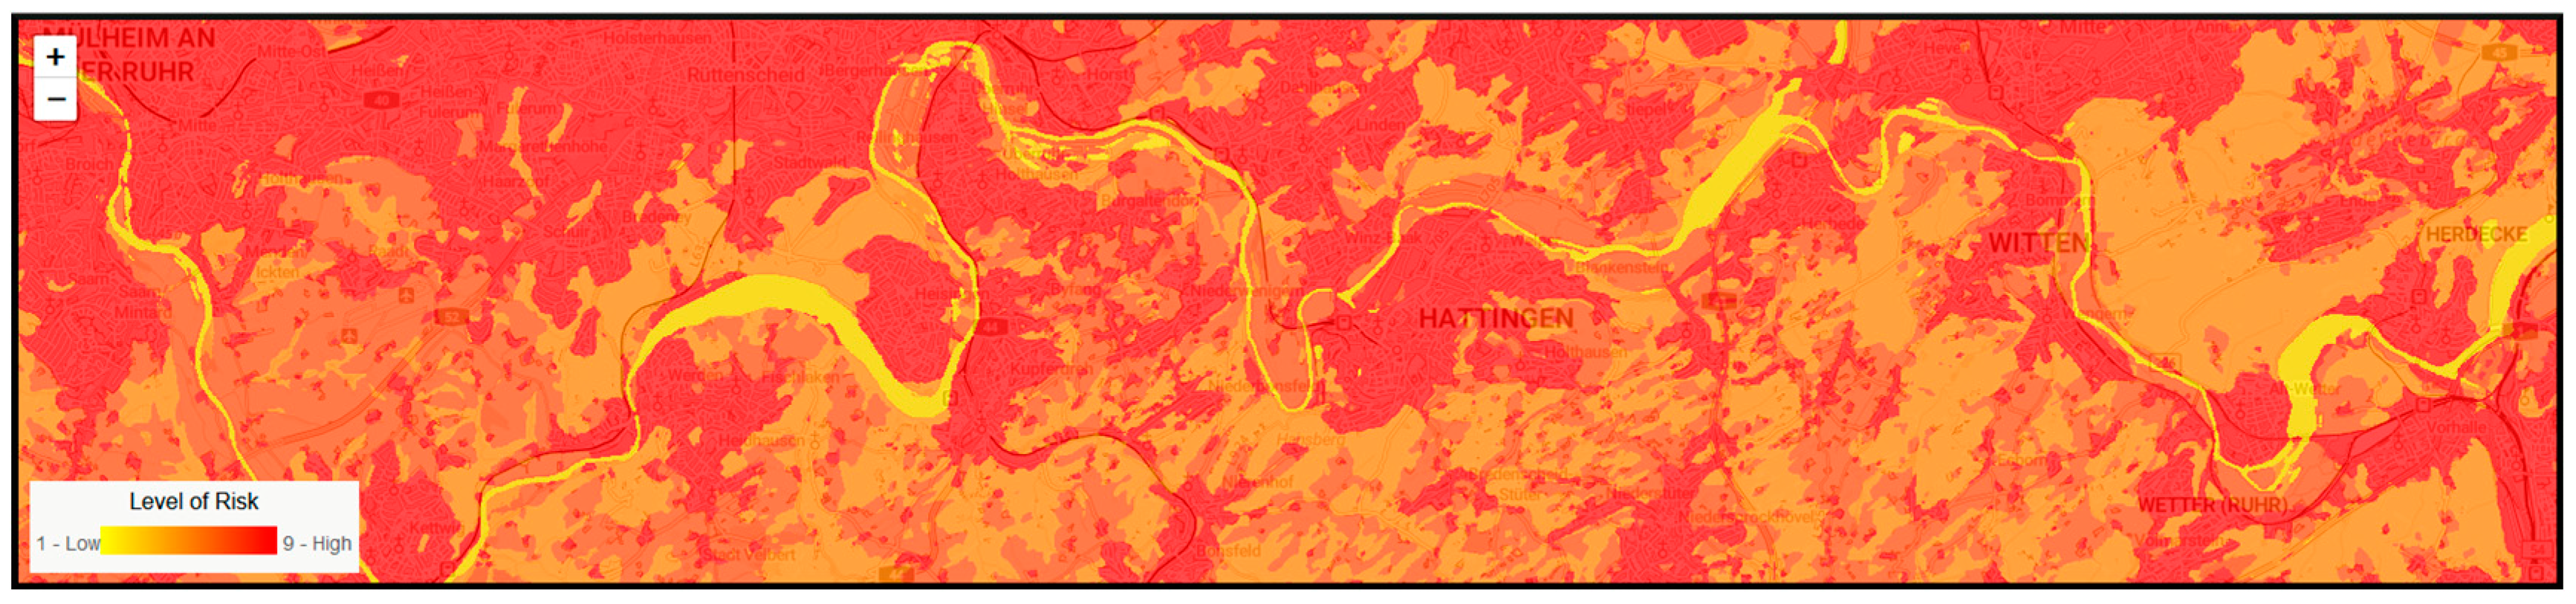
Figure 6.
Spatial VI representation in the AOI of the southern Ruhr area.
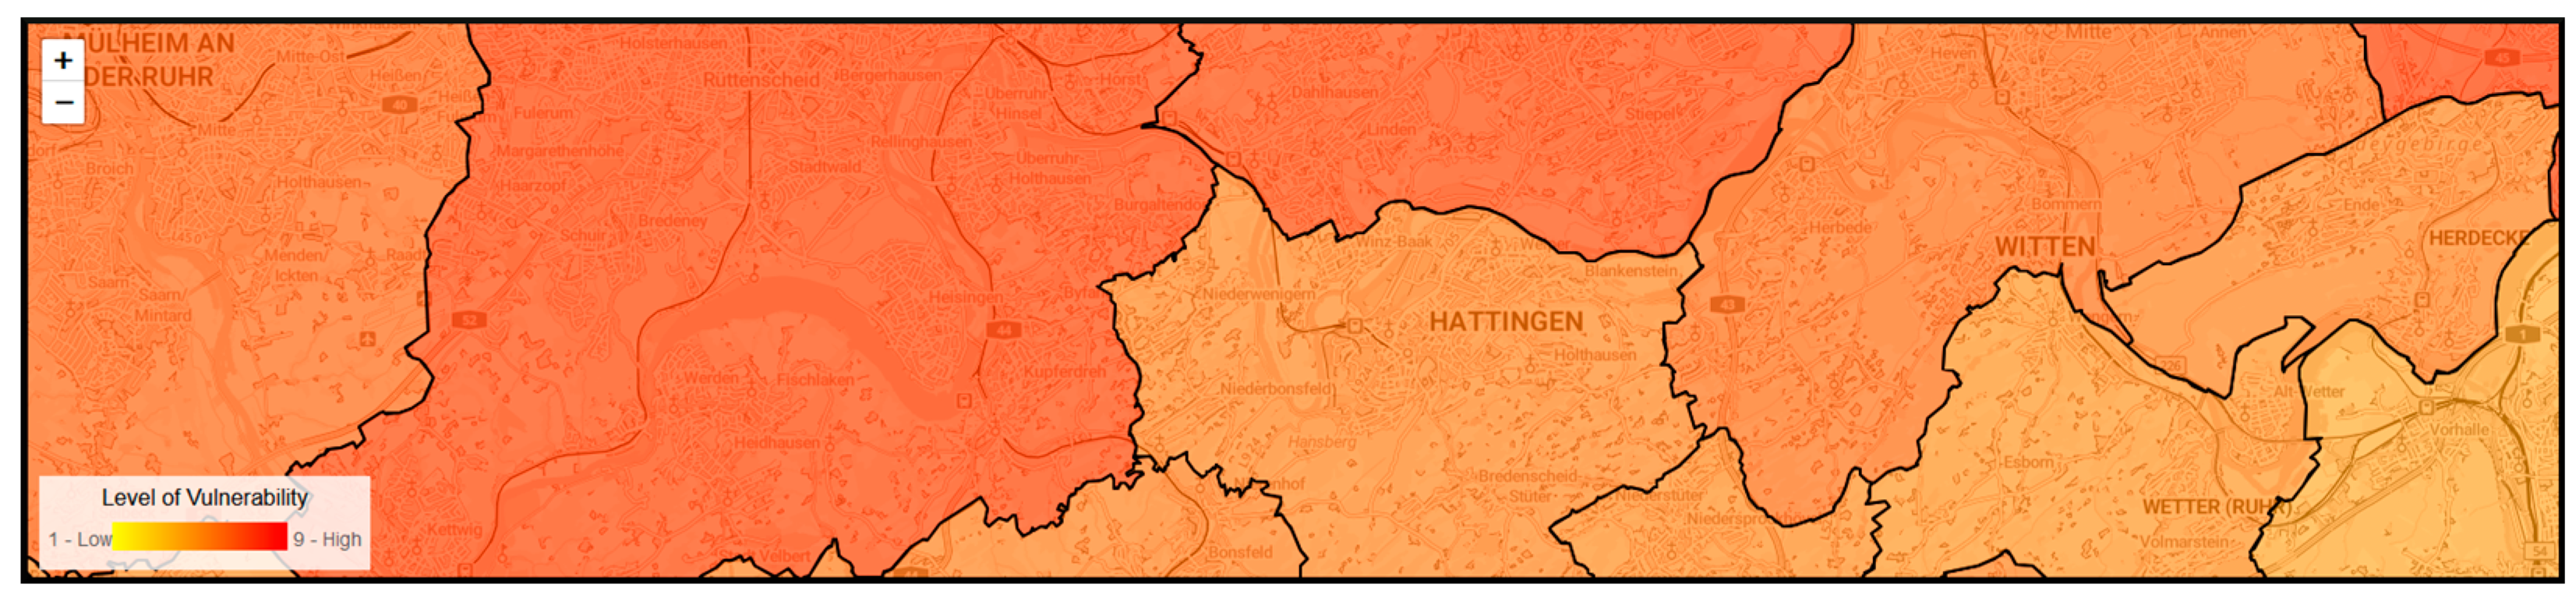
Figure 7.
The spatial multi-risk calculation for both scenarios. Limit values for low risk: 150, medium risk: 250, high risk: 350.
Figure 7.
The spatial multi-risk calculation for both scenarios. Limit values for low risk: 150, medium risk: 250, high risk: 350.
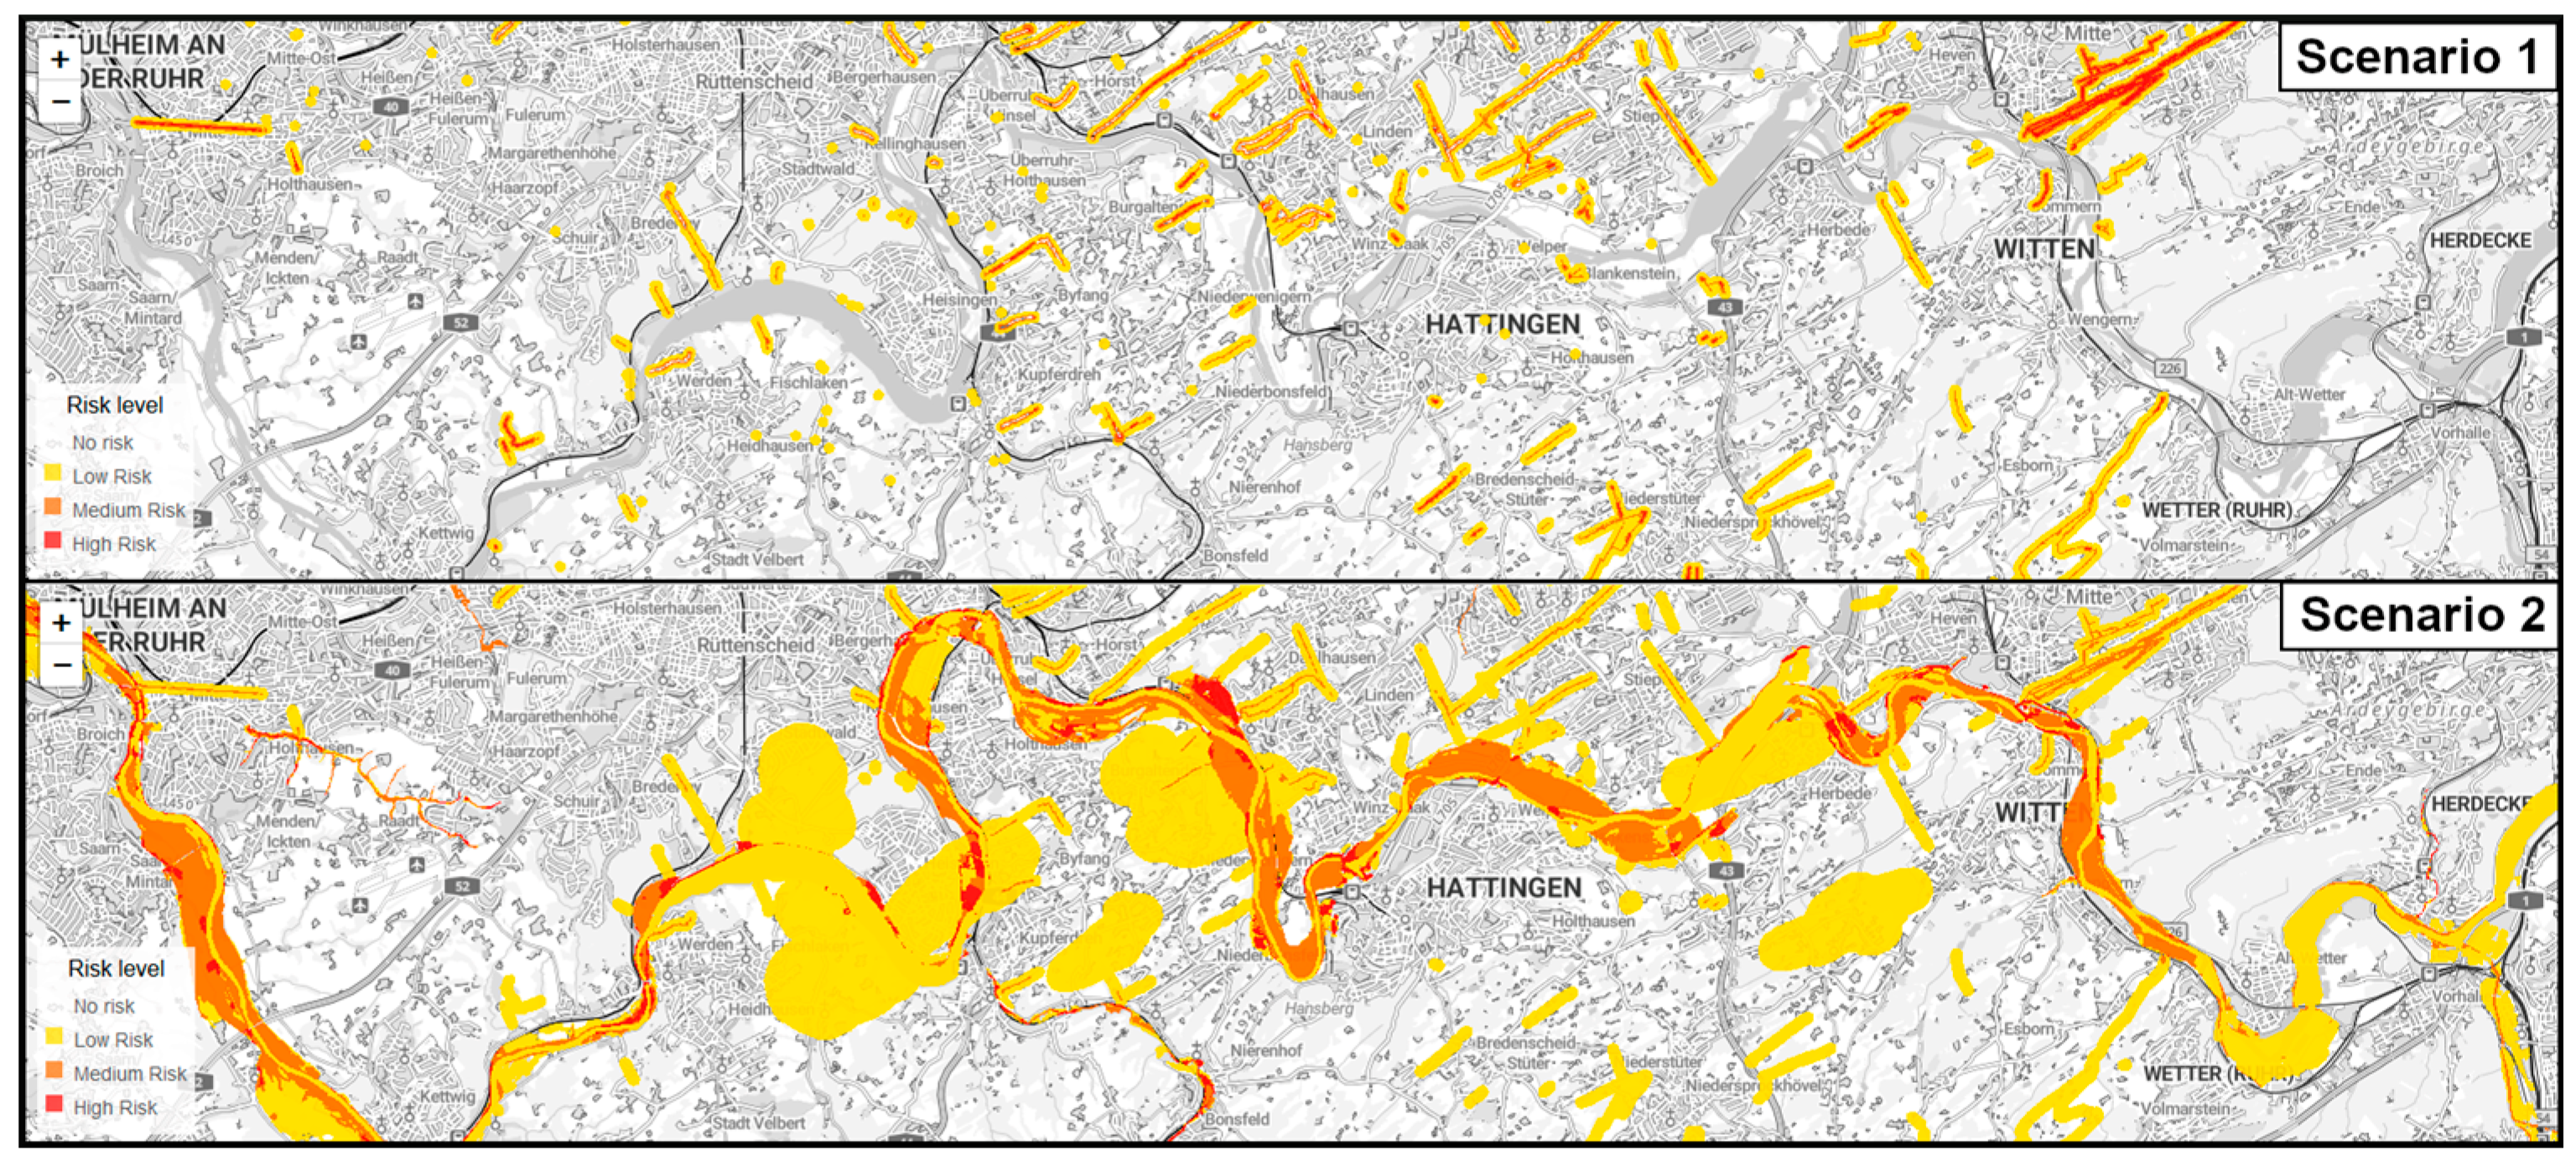

Table 1.
The different post-mining hazards for different mine types.
| Group | Hazard | Mine Type |
|---|---|---|
| Ground Movements | Subsidence | Underground |
| Settlement | Underground / Surface / Waste Embankment | |
| Slope movement (slope stability) – Generalized scale |
Surface | |
| Slope movement (slope stability) – Local scale |
Surface / Waste Embankment | |
| Rock falls | Underground / Surface | |
| Induced seismicity | Underground / Surface | |
| Sinkhole | Underground | |
| Crevice | Underground | |
| Environmental Pollution | Environmental water pollution | Surface / Pit Lake / Underground |
| Environmental pollution from spoils | Surface / Underground | |
| Environmental pollution from tailings dams | Waste Embankment | |
| Hydrological Issues / Water Disturbances | Hydrological disturbances, mining induced floods | Pit Lake |
| Hydrological disturbances, mining induced floods | Surface | |
| Hydrological disturbances, mining induced floods | Underground | |
| Gas / Fire | Ionizing radiation emissions | Underground / Surface |
| Gas emissions linked to mining | Underground | |
| Combustion and overheating of mine waste | Waste Embankment |
Table 2.
Reclassification of land use classes using an EAR risk level.
| Land use | Risk level |
|---|---|
| Water | 2 |
| Trees | 5 |
| Flooded vegetation | 3 |
| Crops | 7 |
| Built area | 9 |
| Bare ground | 2 |
| Snow/Ice | 1 |
| Rangeland | 7 |
Table 3.
Calculation of the VI for different cities in the AOI using open data and the standard weights.
Table 3.
Calculation of the VI for different cities in the AOI using open data and the standard weights.
| City | Socioeconomic factor |
Household factor |
Environmental factor |
Infrastructure factor |
Vulnerability Index (VI) |
|---|---|---|---|---|---|
| Bochum | 5,5 | 7 | 5 | 3,5 | 5,65 |
| Breckerfeld | 4 | 4 | 5 | 3,125 | 3,925 |
| Dortmund | 6 | 7 | 5 | 3,5 | 5,8 |
| Ennepetal | 4,5 | 5,5 | 4 | 3,125 | 4,575 |
| Essen | 6 | 7 | 5 | 3,25 | 5,75 |
| Gelsenkirchen | 6,5 | 7 | 5 | 3,5 | 5,95 |
| Gevelsberg | 4 | 6 | 5 | 3,375 | 4,775 |
| Hagen | 6 | 3,5 | 1,5 | 3,175 | 3,985 |
| Hattingen | 4,5 | 6 | 3,5 | 3,125 | 4,725 |
| Heiligenhaus | 4 | 6 | 5 | 3 | 4,7 |
| Herdecke | 3,5 | 6,5 | 4 | 3,375 | 4,725 |
| Mülheim a. d. R. | 5 | 6,5 | 5 | 3,25 | 5,25 |
| Oberhausen | 7 | 7 | 5 | 3,5 | 6,1 |
| Ratingen | 3,5 | 6 | 5,5 | 3 | 4,6 |
| Schwelm | 4,5 | 6,5 | 5,5 | 3,375 | 5,175 |
| Schwerte | 4 | 5,5 | 5 | 3,375 | 4,575 |
| Sprockhövel | 3,5 | 6 | 5,5 | 3,125 | 4,625 |
| Velbert | 4,5 | 6 | 4,5 | 3 | 4,8 |
| Wetter (Ruhr) | 4 | 5,5 | 4 | 3,125 | 4,425 |
| Witten | 5 | 6 | 5 | 3,25 | 5,05 |
| Wülfrath | 4 | 6 | 4,5 | 3,125 | 4,675 |
| Wuppertal | 6 | 7 | 5 | 3,425 | 5,785 |
Disclaimer/Publisher’s Note: The statements, opinions and data contained in all publications are solely those of the individual author(s) and contributor(s) and not of MDPI and/or the editor(s). MDPI and/or the editor(s) disclaim responsibility for any injury to people or property resulting from any ideas, methods, instructions or products referred to in the content. |
© 2024 by the authors. Licensee MDPI, Basel, Switzerland. This article is an open access article distributed under the terms and conditions of the Creative Commons Attribution (CC BY) license (https://creativecommons.org/licenses/by/4.0/).
Copyright: This open access article is published under a Creative Commons CC BY 4.0 license, which permit the free download, distribution, and reuse, provided that the author and preprint are cited in any reuse.


