Submitted:
28 November 2024
Posted:
02 December 2024
You are already at the latest version
Abstract
Endometriosis is a prevalent gynecological condition affecting up to 25-40% of women with infertility. Endoferin, a protein complex derived from the bovine ovarian follicles, has demonstrated high efficacy in clinical trials for treating endometriosis. It contains bovine serum albumin and a biologically active protein from the TGF-β superfamily. However, the mechanisms underlying its therapeutic effects are not studied well. Immunoblotting revealed that TGF-β in Endoferin is presented by predominantly pro-activin A (56 kDa) and to lesser extend by mature activin A (32 kDa). Heating endoferin facilitated the processing of pro-activin A to activin A, enhancing its differentiation-inducing activity in Xenopus ectoderm. Protease assays and inhibitor studies indicated that MMP-9 is responsible for this processing. Immunohistochemical analysis showed that endoferin treatment significantly decreased VEGF expression by 42% to 83% compared to control (p < 0.05) and increased apoptosis indices up to 4.5-fold (p < 0.05) in rat endometriotic tissue samples. The therapeutic efficacy of endoferin in treating endometriosis is attributed to the ability of activin A to suppress angiogenesis and induce apoptosis in a surgical model of the endometriosis in rats and activate apoptosis in endometriomas. MMP-9-mediated processing of pro-activin A is crucial for activating activin A within the preparation. These findings support the use of endoferin as a promising non-hormonal treatment option for endometriosis.
Keywords:
Endoferin
; activin A
; endometriosis
; angiogenesis inhibition
; apoptosis induction
; MMP-9
; TGF-β superfamily
1. Introduction
Genital endometriosis (adenomyosis) is a widespread condition. According to a 2008 review of the Cochrane international database [1], it affects 0.5-5% of fertile women and 25-40% of women experiencing infertility. Endoferin is a protein complex derived from cattle follicles, designed for the treatment of endometriosis. The preparation includes: a stabilizing protein—bovine serum albumin—and a biologically active protein from the TGF-β superfamily with immunologically specific inhibin β-A activity, with a molecular weight of approximately 56 kDa. It is important to note that the precursor of activin A also exhibits specific activity of inhibin β-A [2]. The substance is obtained through chromatographic purification of follicular fluid extracted from cattle ovarian follicles, followed by sterilizing filtration and lyophilization. The substance contains no less than 90% protein (the remainder being NaCl and water). Before use, the substance is heated for 3 minutes at 98-100C, resulting in the active drug Endoferin. Follicular fluid serves as a unique source of biologically active substances involved in the regulation of endometrial cells, as the sequential stages of follicular development require bidirectional communication between oocytes and granulosa cells, as well as between granulosa and theca cells. Many extracellular signaling molecules involved in this dialogue belong to the transforming growth factor-β (TGF-β) superfamily [3].
Endoferin has demonstrated high efficacy in clinical trials [4,5]. However, many aspects of its mechanism of action and the roles of the individual proteins it contains remain unclear. Activins, but not pro-activins or inhibins, have been shown to induce mesoderm formation in ectoderm preparations from Xenopus laevis embryos [6,7,8]. In this work, we showed the presence of pro-activin A and activin A in Endoferin, and investigated the role activin A in Endoferin therapeutic activity.
2. Materials and Methods
2.1. Immunoblotting
Immunoblotting was performed following previously described methods, using antibodies against various types of inhibins with the Western blot technique. Preliminary separation of the proteins by molecular weight was carried out in a 10% polyacrylamide gel using the Laemmli system. As a result, individual peptides were analyzed, as the stringent treatment prior to gel electrophoresis disrupted the quaternary structure of the proteins. All sera (Santa Cruz, catalog numbers: sc-30146, sc-50288, sc-50287, sc-68434) were raised against the C-terminal sequences of specific inhibin types and thus did not require the native structure of the proteins.
2.2. Evaluation of Differentiation Activity Using Xenopus Laevis Ectoderm
To determine the induction strength of the differentiation activity of Endoferin and its individual components, an early gastrula ectoderm preparation of X. laevis embryos were used. It is known from previously published data that low concentrations of Endoferin cause the formation of mesoderm rudiments (Figure 1). As the concentration increases, individual outgrowths, multiple axial structures, and a "pseudo-tadpole" are formed. The high concentrations (0.6-1 mg/ml) lead to the formation of endodermal rudiments. The score for each sample in this experiment is based on the sum of inductions from ectoderm samples of three embryos placed in one small Petri dish. Thus, a difference of 3 units between two experiments is considered statistically significant for this method. Low activity (1 or 2 units) may result from non-specific effects. This scoring system allows for quantitative assessment of differentiation activity in response to various concentrations of Endoferin or its components.
2.3. Immunohistochemical Analysis
For immunohistochemical analysis, selected endometrioma samples were fixed in 10% formalin and processed using standard histological techniques: washing in running water, dehydration in a series of ascending isopropanol concentrations, paraffin infiltration, and embedding in paraffin [9]. Sections 3-5 µm thick were prepared from paraffin blocks. Polysine slides (Thermo Scientific) were used for the sections. The sections were deparaffinized in three portions of xylene, followed by two portions of 100% Deol and one portion of 70% Deol for 10 minutes each. They were then washed in distilled water.
For subsequent immunohistochemical staining, the slides were subjected to heat-induced antigen retrieval in boiling citrate buffer (pH 6.0) for 20 minutes, followed by three washes in phosphate-buffered saline (PBS, pH 7.4). To block endogenous peroxidase, the slides were incubated with 200 µl of H2O2 per slide for 10 minutes, followed by three washes in PBS.
Rabbit polyclonal antibodies to VEGF (ab9570, Abcam) at a concentration of 2.5 µg/mL, and Caspase-3 (ab4051, Abcam) at a 1:100 dilution were used as primary antibodies. Histofine Simple Stain MAX PO (multi) and Histofine DAB-3s (Nichirei Biosciences Inc.) were used as detection systems for the primary antibodies. The secondary antibodies were applied in a volume of 200 µl per slide and incubated in a humidified chamber at room temperature for 50 minutes.
2.4. Protease Activity Assessment
Protease activity was assessed using the method described by [10]. Briefly, fluorescein isothiocyanate-labeled casein assay for proteolytic enzymes was used.
2.5. Morphological Analysis
Morphological analysis was performed using a Carl Zeiss Axio Scope A1 (Germany) light microscope at magnifications of 50, 100, 200, and 400×. Microphotography was conducted with an AxioCamICc 1 digital camera and AxioVision Rel. 4.8 software (Germany).
2.6. Evaluation of Marker Expression
Semi-quantitative evaluation of marker expression was performed in three fields of view at 200× magnification for each marker. VEGF expression was counted in the epithelial and stromal components of the endometrioma. The intensity of staining (IS) was graded on a scale of 0 to 5, based on the following criteria:
0 – absence of immunopositive cells in the field of view;
1 – minimal factor expression in immunopositive cells;
2 – the majority of cells show weak factor expression;
3 – moderate factor expression in immunopositive cells;
4 – immunopositive cells with moderate to strong factor expression;
5 – the majority of cells show strong factor expression.
The activity index of the corresponding factors was calculated using the following formula:
I = N+/ Ntotal,
where N+ is the number of immunopositive cells in the field of view, and Ntotal is the total number of cells in the field of view.
2.7. Data Analysis
Descriptive statistics were applied to all data. The Shapiro-Wilk test was used to check for normal distribution. In cases where the data followed a normal distribution, the mean and standard deviation were calculated, and these, along with the sample size (n), are presented in the final tables. For data that did not meet the normal assumption, the median and interquartile range were calculated.
For data with normal distribution, one-way analysis of variance (ANOVA) was used, followed by post-hoc comparisons with Tukey's test or pairwise comparisons using the Student’s t-test. For non-normally distributed data, as well as for semi-quantitative measures (scores), the Kruskal-Wallis test was applied, followed by post-hoc comparisons using rank averages or pairwise comparisons with the Mann-Whitney test. Differences were considered significant at p ≤ 0.05. Statistical analysis was performed using Statistica 10.0 software (USA).
3. Results
3.1. Analysis of TGF-β Proteins in the Endoferin
In this work we performed protein electrophoresis with the drug Endoferin followed by immunoblotting (Figure S1). Antibodies specific to various proteins of the TGF-β family were used: A, B, C, D, and E. The analysis showed the presence of only TGF-βA proteins. A minimum of 5 µg of Endoferin was necessary for the detection of TGF-βA proteins by immunoblotting. Antibodies against human inhibin βA (they are able to bind both activin A and inhibin βA) allowed the detection of the 56 kDa protein in the Endoferin preparation derived from cattle. At higher protein loads (80 and 40 µg), the 32 kDa protein becomes visible, and at 80 µg load, the 16 kDa glycoprotein, previously described in the literature, is also detected. Endoferin predominantly contains pro-activin (56 kDa), with approximately 15–16 times more of it than mature, biologically active activin A.
3.2. Heat-Mediated Activation of the Endoferin
The activity of Endoferin before and after heating was evaluated using an early gastrula ectoderm of X. laevis embryos. The lack of response from the Endoferin substance in ectoderm preparations indicates that the TGF-β proteins are either in a latent state or bound to inhibitors and are inactive (Figure 2A). However, after heating the Endoferin substance at 98-100 °C for 3–4 minutes, it begins to stimulate the differentiation of ectoderm preparations, suggesting the presence of mature (active) TGF-β proteins. The heated albumin preparation did not significantly activate differentiation. A low level of differentiation (up to 3 points) could be caused by non-specific effects or by inhibin or trace amounts of mature TGF-β proteins. Thus, only heated Endoferin shows a strong ability to induce ectoderm differentiation.
The albumin preparation used as a control was obtained from “Bovine serum albumin” (Sigma) and further purified using one of the steps involved in Endoferin production — on DEAE Sephadex, which was in the same buffer and contained the same amount of NaCl as the Endoferin substance. The preparation was dialyzed under the same conditions as Endoferin.
Figure 2B shows that protease activity (measured by the degradation of FITC-casein) is only detected in heated Endoferin preparations. While albumin and the unheated Endoferin preparation showed no significant protease activity.
Endoferin samples heated for 1 to 3 minutes were analyzed via Western blot with serum against inhibin βA. The 32 kDa protein was faintly visible after 2 minutes of heating and clearly visible after 3 minutes. This indicates proteolysis, which apparently occurs in two stages, resulting in the formation of mature activin A protein. Thus, activin is at least one of the TGF-β proteins responsible for Endoferin’s differentiation-inducing activity.
3.3. Identification of the Proteases
To identify the type of protease responsible for processing pro-activin A in Endoferin, the preparation was treated with inhibitors that suppress major enzyme families, then dialyzed. As shown in Table 1, 10 mM EDTA completely and 3 mM leupeptin partially inhibit ectoderm differentiation in Xenopus gastrula preparations. Addition of the 20 μM ZnCl₂ after dialysis allows partial activation of the EDTA-treated Endoferin.
An inhibitor analysis using the specific MMP inhibitor chlorhexidine [11] showed that at both concentrations tested (0.01 and 0.0025 %), the inhibitor suppressed Endoferin’s ability to activate differentiation of early gastrula ectoderm preparations from Xenopus (Figure 3).
To estimate the molecular weight of the protease responsible for processing pro-activin A, pro-Endoferin was fractionated on Sephadex S-300 into six fractions (Figure 4A). Each fraction was supplemented with 2 mg of pro-Endoferin treated with 10 mM EDTA and fully dialyzed. In the control, these fractions were not supplemented with such preparations. After that all mixtures were heat-activated and analyzed using gastrula ectoderm for ability differentiation activation. Only the second fraction (proteins with molecular weights of 85 – 120 kDa) addition allowed to activate Endoferin substance and significantly increase gastrula ectoderm differentiation activity (Figure 4B). The range of molecular weights (85 – 120 kDa) corresponds to the molecular weight of MMP-9. The first fraction showed weak activation, i.e. it contains few Endoferin, and the fractions 3, 5 and 6 showed middle effect. The fraction 4 contains the inhibitor, therefore no effect was detected.
3.4. Effect of Endoferin in Rat Model
To create a model of endometriosis, female rats weighing about 160 g were taken. Their uterine horn was sewn to the peritoneal wall. The rats were divided into groups according to the dosage of the drug received. The experiment lasted for 4 months. At the end of the experiment, endometrioma sections were made with subsequent immunohistological analysis.
To analyze the effectiveness of the blood supply to the endometrioma, an analysis of the expression of the endothelial growth factor (VEGF) was carried out (Figure 5, Table 2). In the analysis of normally distributed data, the "group" factor significantly affected the VEGF expression index (ANOVA, p < 0.05). Post-hoc comparisons using Tukey’s test showed a significant reduction in this index across all groups treated with Endoferin compared to the control, which was confirmed by pairwise comparisons with the Student’s t-test (p < 0.05, Table 2). The average decrease in VEGF expression index ranged from 42% to 83% compared to the control group.
Apoptosis was assessed using immunopositive staining for the enzyme most specific to this process — caspase-3 (Figure 6). In most cases, immunopositive (for caspase-3) cells were found in both the epithelial and stromal components of the endometrioma. However, in some cases, immunopositive cells were absent from the field of view. In the analysis of normally distributed data, the "group" factor significantly influenced the "apoptosis index" (ANOVA, p < 0.05). Post-hoc comparisons using Tukey’s test showed a significant increase in the apoptosis index in the group treated with Endoferin at 300 µg/kg compared to the control (on average, a 4.5-fold increase), which was confirmed by pairwise comparisons using the Student’s t-test (Table 3). A significant increase in the apoptosis index (on average, 2.5 times compared to the control) was also observed in the group treated with 10 µg/kg of the drug (p < 0.05, t-test).
4. Discussion
The findings indicate that Endoferin contains both processed activin A and its precursor pro-activin, as well as the protease MMP-9, which processes it. The differentiation-inducing activity of the preparation is primarily due to activin A, despite its lower quantity compared to pro-activin (see Figure S1). Heating the preparation sample is likely to induce conformational changes or activate MMP-9, facilitating the processing of pro-activin into its mature and active form. This is supported by the observation that only heated Endoferin significantly induces ectoderm differentiation, in contrast to albumin and unheated Endoferin (Figure 2).
The role of MMP-9 in processing pro-activin A aligns with known mechanisms where matrix metalloproteinases activate TGF-β superfamily proteins [12,13]. The inhibition of differentiation activity by EDTA and partial restoration with Zn²⁺ further indicate the involvement of MMPs, as they require metal ions for activity [14,15]. The identification of MMP-9 as the processing enzyme is supported by inhibitor studies using chlorhexidine and molecular weight estimations from fractionation experiments.
Activin A's significant role in endometriosis is underscored by its ability to suppress angiogenesis [16,17]. The observed decrease in VEGF expression index confirms Endoferin's anti-angiogenic effect, which is crucial in inhibiting the vascularization necessary for endometrial tissue proliferation. These findings are consistent with results from clinical trials [18].
Furthermore, activin A's known apoptotic activity [19,20,21] is reflected in the increased apoptosis index observed in Endoferin-treated groups. The induction of apoptosis in endometriotic cells contributes to reducing the pathological tissue burden. The dual action of activin A in both suppressing angiogenesis and promoting apoptosis makes Endoferin a promising non-hormonal therapeutic agent for endometriosis.
The stability and activation of Endoferin upon heating suggest a potential method for enhancing its therapeutic efficacy. Heat-induced activation may facilitate the processing of latent proteins within the preparation, maximizing the bioavailability of active compounds at the target site.
5. Conclusions
Endoferin effectively suppresses angiogenesis and induces apoptosis in endometriomas and developing endometrioid cysts via mature activin A produced by limited proteolysis by MMP-9. These mechanisms support the potential of Endoferin as a non-hormonal treatment option for endometriosis.
Supplementary Materials
The following supporting information can be downloaded at the website of this paper posted on Preprints.org., Figure S1: Detection of βA inhibins of the drug "Endoferin" depending on the total protein of the drug. Figure S2: Raw microscopy image for Figure 5A. Figure S3: Raw microscopy image for Figure 5B. Figure S4: Raw microscopy image for Figure 6A. Figure S5: Raw microscopy image for Figure 6B.
Author Contributions
Investigation: A.A.B., A.A.T., A.V.I., Y.A.G., and Z.Y.U.; validation: A.A.B., A.A.T., A.V.I., Y.A.G., Z.Y.U., A.A.V., S.V.B., I.V.M., A.G.K., D.G.M., and V.N.U.; Writing, editing: A.A.V., S.V.B., I.V.M., A.G.K., and V.N.U.; writing original draft: D.G.M.; project administration: D.G.M. and V.N.U. All authors have read and agreed to the published version of the manuscript.
Funding
The study was supported by the Ministry of Science and Higher Education of the RF, project FSMF-2023-0010.
Data Availability Statement
Data are contained within the article.
Conflicts of Interest
The authors declare no conflicts of interest. The funders had no role in the design of the study; in the collection, analyses, or interpretation of data; in the writing of the manuscript; or in the decision to publish the results.
References
- Ozkan S., Murk W., Arici A. Endometriosis and infertility. Epidemiology and evidence-based treatments. Annals of the New York Academy of Sciences, 2008, Vol. 1127, 92-100. [CrossRef]
- Suresh P. S., Rajan T., Tsutsumi R. New targets for old hormones: Inhibins clinical role revisited [Review]. Endocrinol. J., 2011, Vol. 58, 223–235. [CrossRef]
- Knight P. G., Glister C. TGF-β superfamily members and ovarian follicle development. Reproduction, 2006, Vol. 132, Issue 2, 191–206. [CrossRef]
- Andreeva E. N., Urumova L. T., Bolotnikov A. I., Chubarova G. D., Ilyichev A. V., Maldov D. G. Endometriosis: The first experience of non-hormonal drug therapy. Medical News, 2017, No.6, 29-33.
- Fadeeva N. I., Yavorskaya S. D., Dolina O. V., Luchnikova E. V., Chubarova G. D., Ilyichev A. V., Maldov D. G. Adenomyosis: New therapy opportunities. Medical News, 2017, No. 5, 13-15.
- Chertov O. Yu., Krasnoselskii A. L., Bogdanov M. E., Hoperskaya O. A. Mesoderm-inducing factor from bovine amniotic fluid: Purification and N-terminal amino acid sequence determination. Biomed Sci, 1990, 1(5): 499-506.
- Green J. B. A., Smith J. C., New H. V. Responses of embryonic Xenopus cells to activin and FGF are separated by multiple dose thresholds and correspond to distinct axes of the mesoderm. Cell, 1992, Vol. 71(5): 731-9. [CrossRef]
- Faure S., Lee M. A., Keller T., ten Dijke P., Whitman M. Endogenous patterns of TGFβ superfamily signaling during early Xenopus development. Development, 2000, Vol. 127, 2917-2931.
- Muzhikyan A. A., Makarova M. N., Gushchin Y. A. Histological processing features of laboratory animal organs and tissues.. International Bulletin of Veterinary Medicine, 2014, Vol. 2, 103-109.
- Twining S. S. Fluorescein isothiocyanate-labeled casein assay for proteolytic enzymes. Anal Biochem, 1984, Nov 15, 143(1): 30-4. [CrossRef]
- Gendron R., Grenier D., Sorsa T., Mayrand D. Inhibition of the Activities of Matrix Metalloproteinases 2, 8, and 9 by Chlorhexidine. Clin Diagn Lab Immunol, 1999, 6(3): 437-9. [CrossRef]
- Stamenkovic Y. Q. Cell surface-localized matrix metalloproteinase-9 proteolytically activates TGF-beta and promotes tumor invasion and angiogenesis. Genes Dev, 2000, Vol. 14, 163–176. [CrossRef]
- Kobayashi T., Kim H., Liu X., Sugiura H., Kohyama T., Fang Q., Wen F. -Q., Abe S., Wang X., Atkinson J. J., Shipley J. M., Senior R. M., Rennard S.I. Matrix metalloproteinase-9 activates TGF-β and stimulates fibroblast contraction of collagen gels. Am J Physiol Lung Cell Mol Physiol, 2014, Vol. 306, L1006–L1015. [CrossRef]
- Van Wart H. E., Birkedal-Hansen H. The cysteine switch: A principle of regulation of metalloproteinase activity with potential applicability to the entire matrix metalloproteinase gene family. Proc Natl Acad Sci U S A, 1990, Vol. 87(14): 5578–5582. [CrossRef]
- Rossano R., Larocca M., Riviello L., Coniglio M. G., Vandooren J., Liuzzi G. M., Opdenakker G., Riccio P. Heterogeneity of serum gelatinases MMP-2 and MMP-9 isoforms and charge variants. J Cell Mol Med, 2014, 18(2): 242–252. [CrossRef]
- Maeshima K., Kojima I., Kishi S. The role of activin A in angiogenesis. Investigative Ophthalmology & Visual Science, 2011, Vol. 52, Issue 14, 4839.
- Kaneda H., Arao T., Matsumoto K., De Velasco M. A., Tamura D., Aomatsu K., Kudo K., Sakai K., Nagai T., Fujita Y., Tanaka K., Yanagihara K., Yamada Y., Okamoto I., Nakagawa K., Nishio K. Activin A inhibits vascular endothelial cell growth and suppresses tumor angiogenesis in gastric cancer. Br J Cancer, 2011, 105(8): 1210-7. [CrossRef]
- Zairatiyants O. V., Andreeva E. N., Adamyan L. V., Sonova M. M., Urumova L. T., Bolotnikov A. I., Ilyichev A. V., Maldov D. G. Endometriosis: A new experience of non-hormonal drug therapy. Reproduction Problems, 2018, Vol. 24(6), 113-120.
- Valderrama-Carvajal H., Cocolakis E., Lacerte A., Lee E. -H., Krystal G., Ali S., Lebrun J. -J. Activin/TGF-β induces apoptosis through Smad-dependent expression of the lipid phosphatase SHIP. Nature Cell Biology, 2002, Vol. 4, 963–969. [CrossRef]
- Nishihara T., Okahashi N., Ueda N. Activin A induces apoptotic cell death. Biochem Biophys Res Commun, 1993, 197(2): 985-91. [CrossRef]
- Zhang Y., Qi Y., Zhao Y., Sun H., Ge J., Liu Z. Activin A induces apoptosis of mouse myeloma cells via the mitochondrial pathway. Oncology Letters, 2017, Vol. 15(2), 1792-1074. [CrossRef]
Figure 1.
Endoferin concentrations (in µg/mL) inducing differentiation in ectoderm preparations from early gastrula of X. laevis embryos. The induced structures are scored as follows: formation of outgrowths – 1 point, multiple axial structures – 2 points, "pseudotadpole" – 3 points, appearance of endodermal primordia – 4 points. If the structures are well-defined and developed, an additional point may be added. Since 3 ectoderm preparations are placed in one spot in a vial, the induction is evaluated based on the total score.
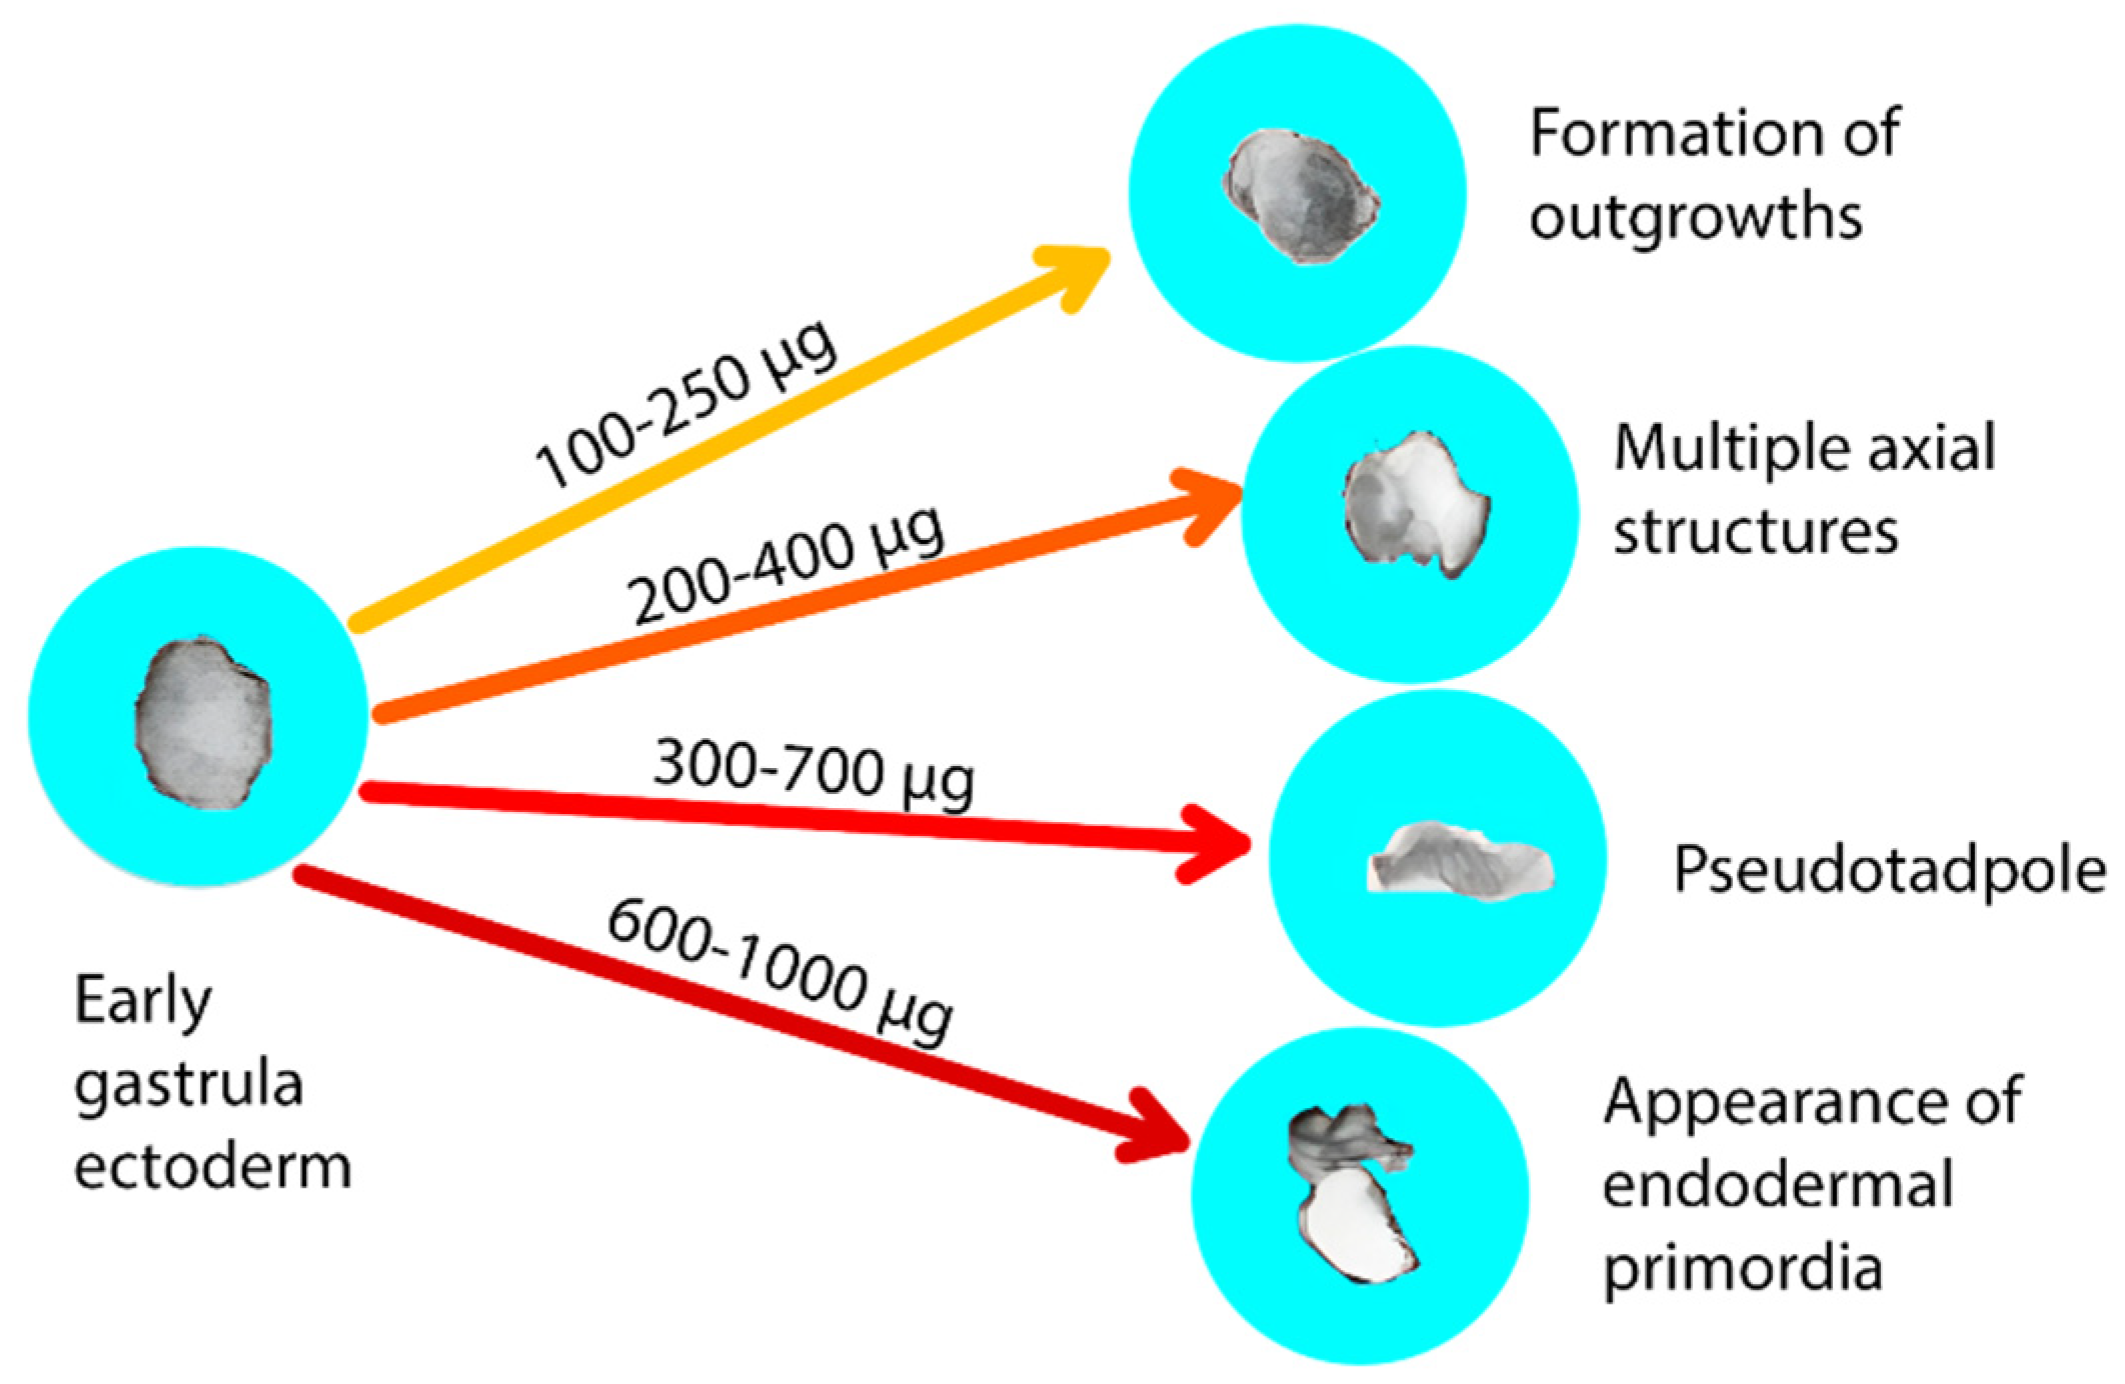
Figure 2.
Activation of the drug Endoferin (3 mg/mL) by heating. A – Activation of ectoderm differentiation in Xenopus embryos. The x-axis shows the incubation time of ectoderm samples after contact with the preparations. B – Fluorescence intensity of FITC-casein fragments after incubation with Endoferin and BSA. Incubation with FITC-casein was carried out for 24 hours at 37°C, with all components at a concentration of 1 mg per sample. Key sample designations: E – Endoferin, HE – heated Endoferin (3 minutes at 98-100°C), HB – heated BSA (3 minutes at 98-100°C).
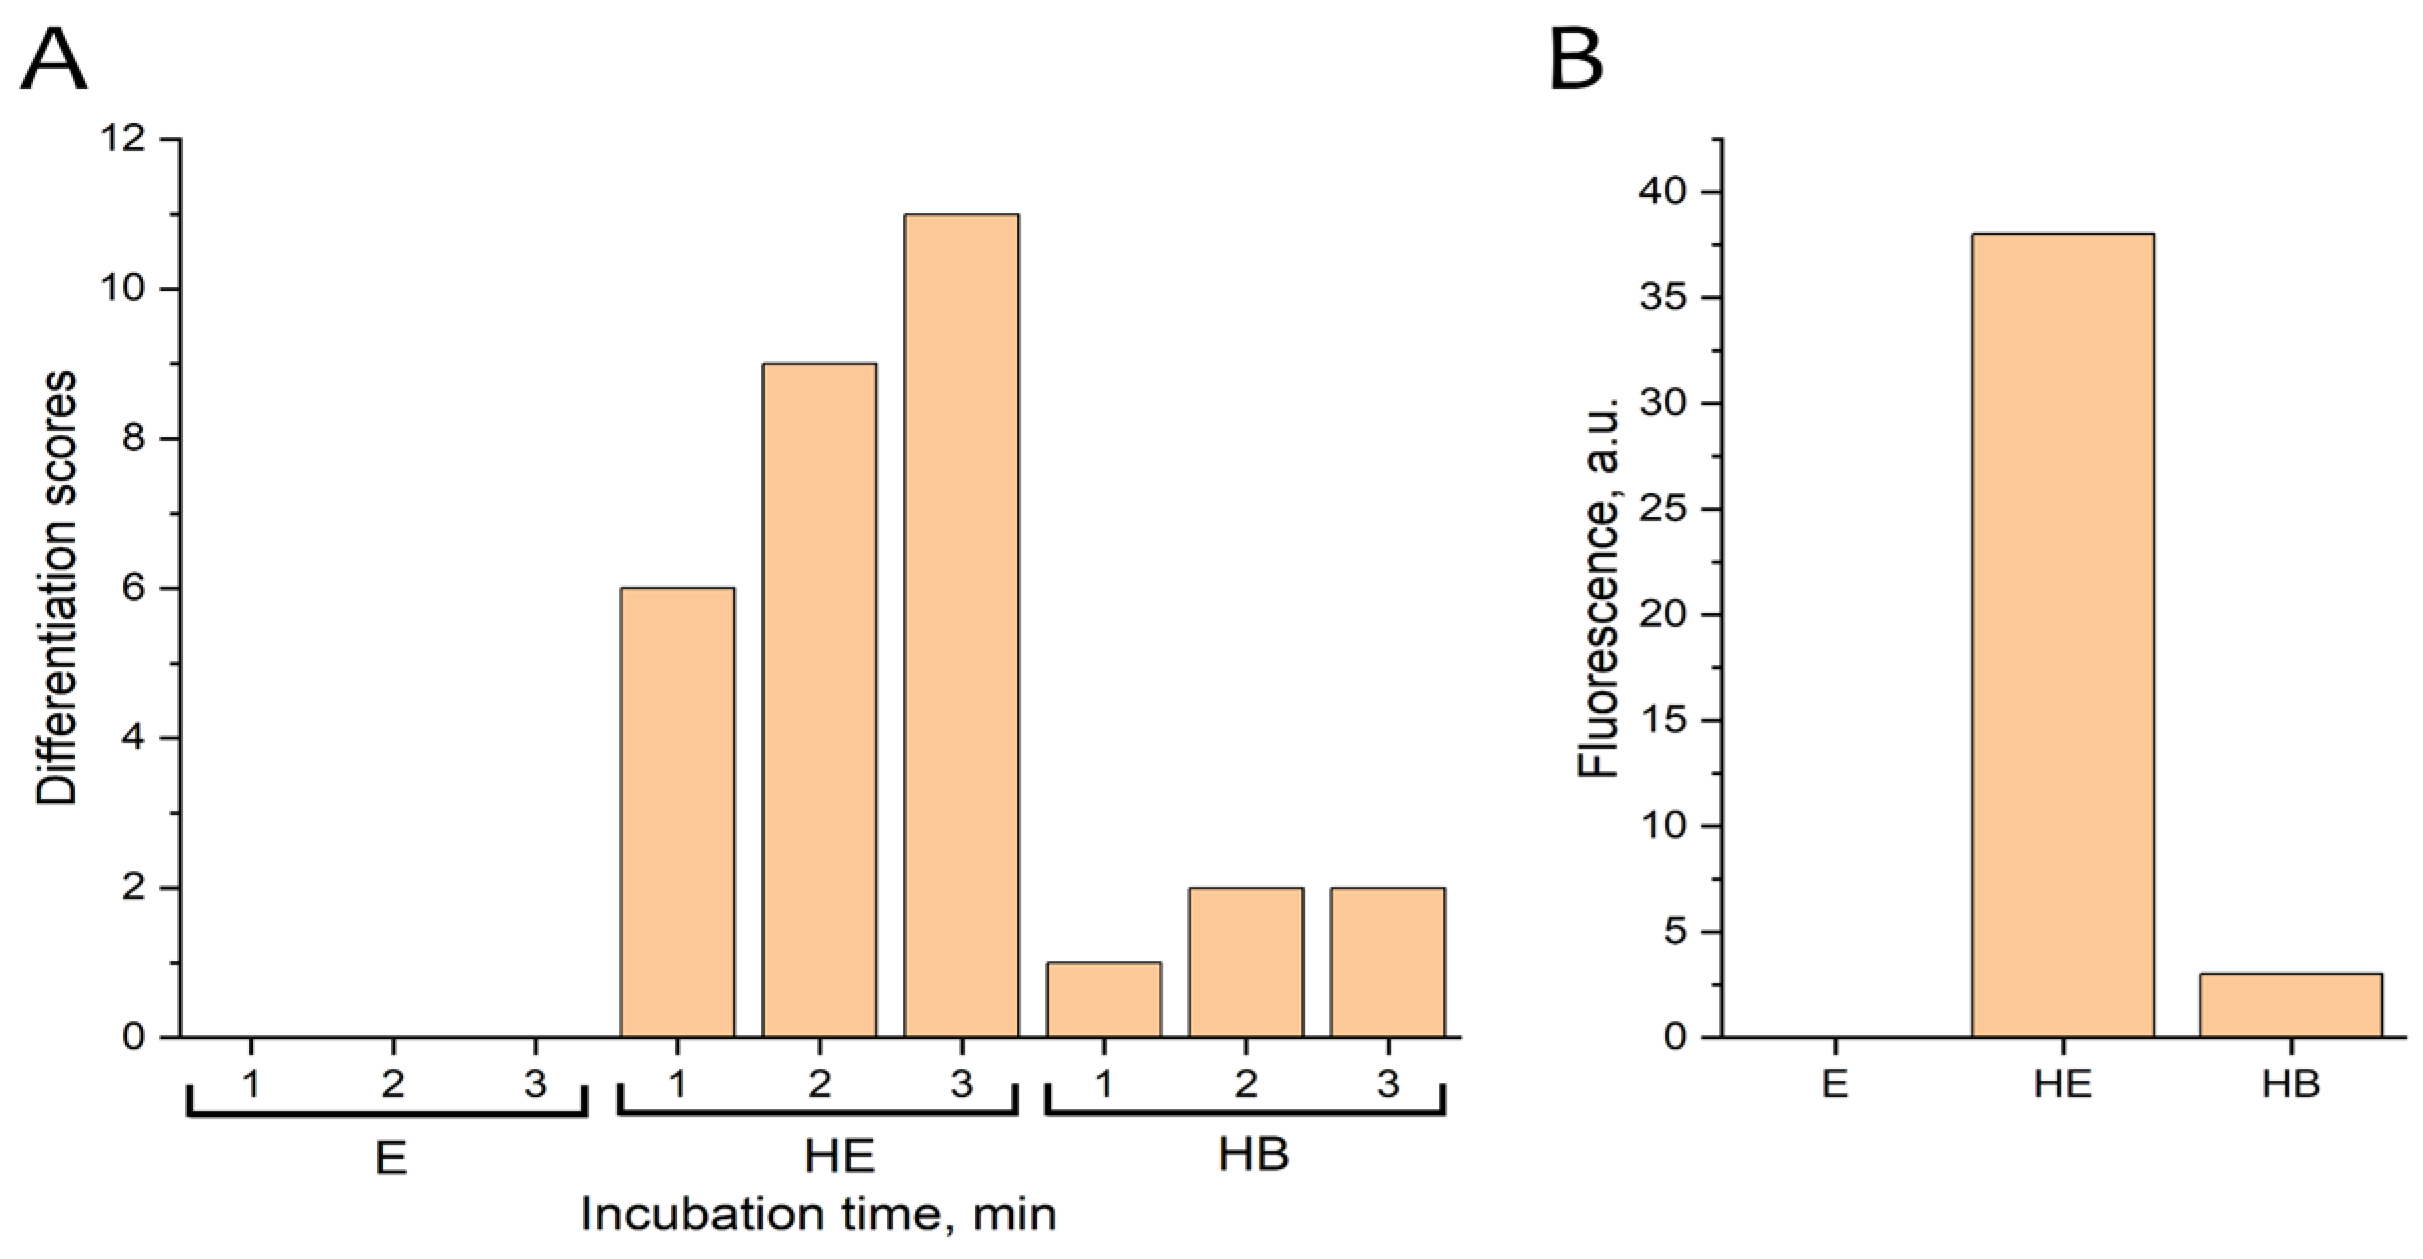
Figure 3.
Effect of chlorhexidine on ectoderm differentiation within three days.
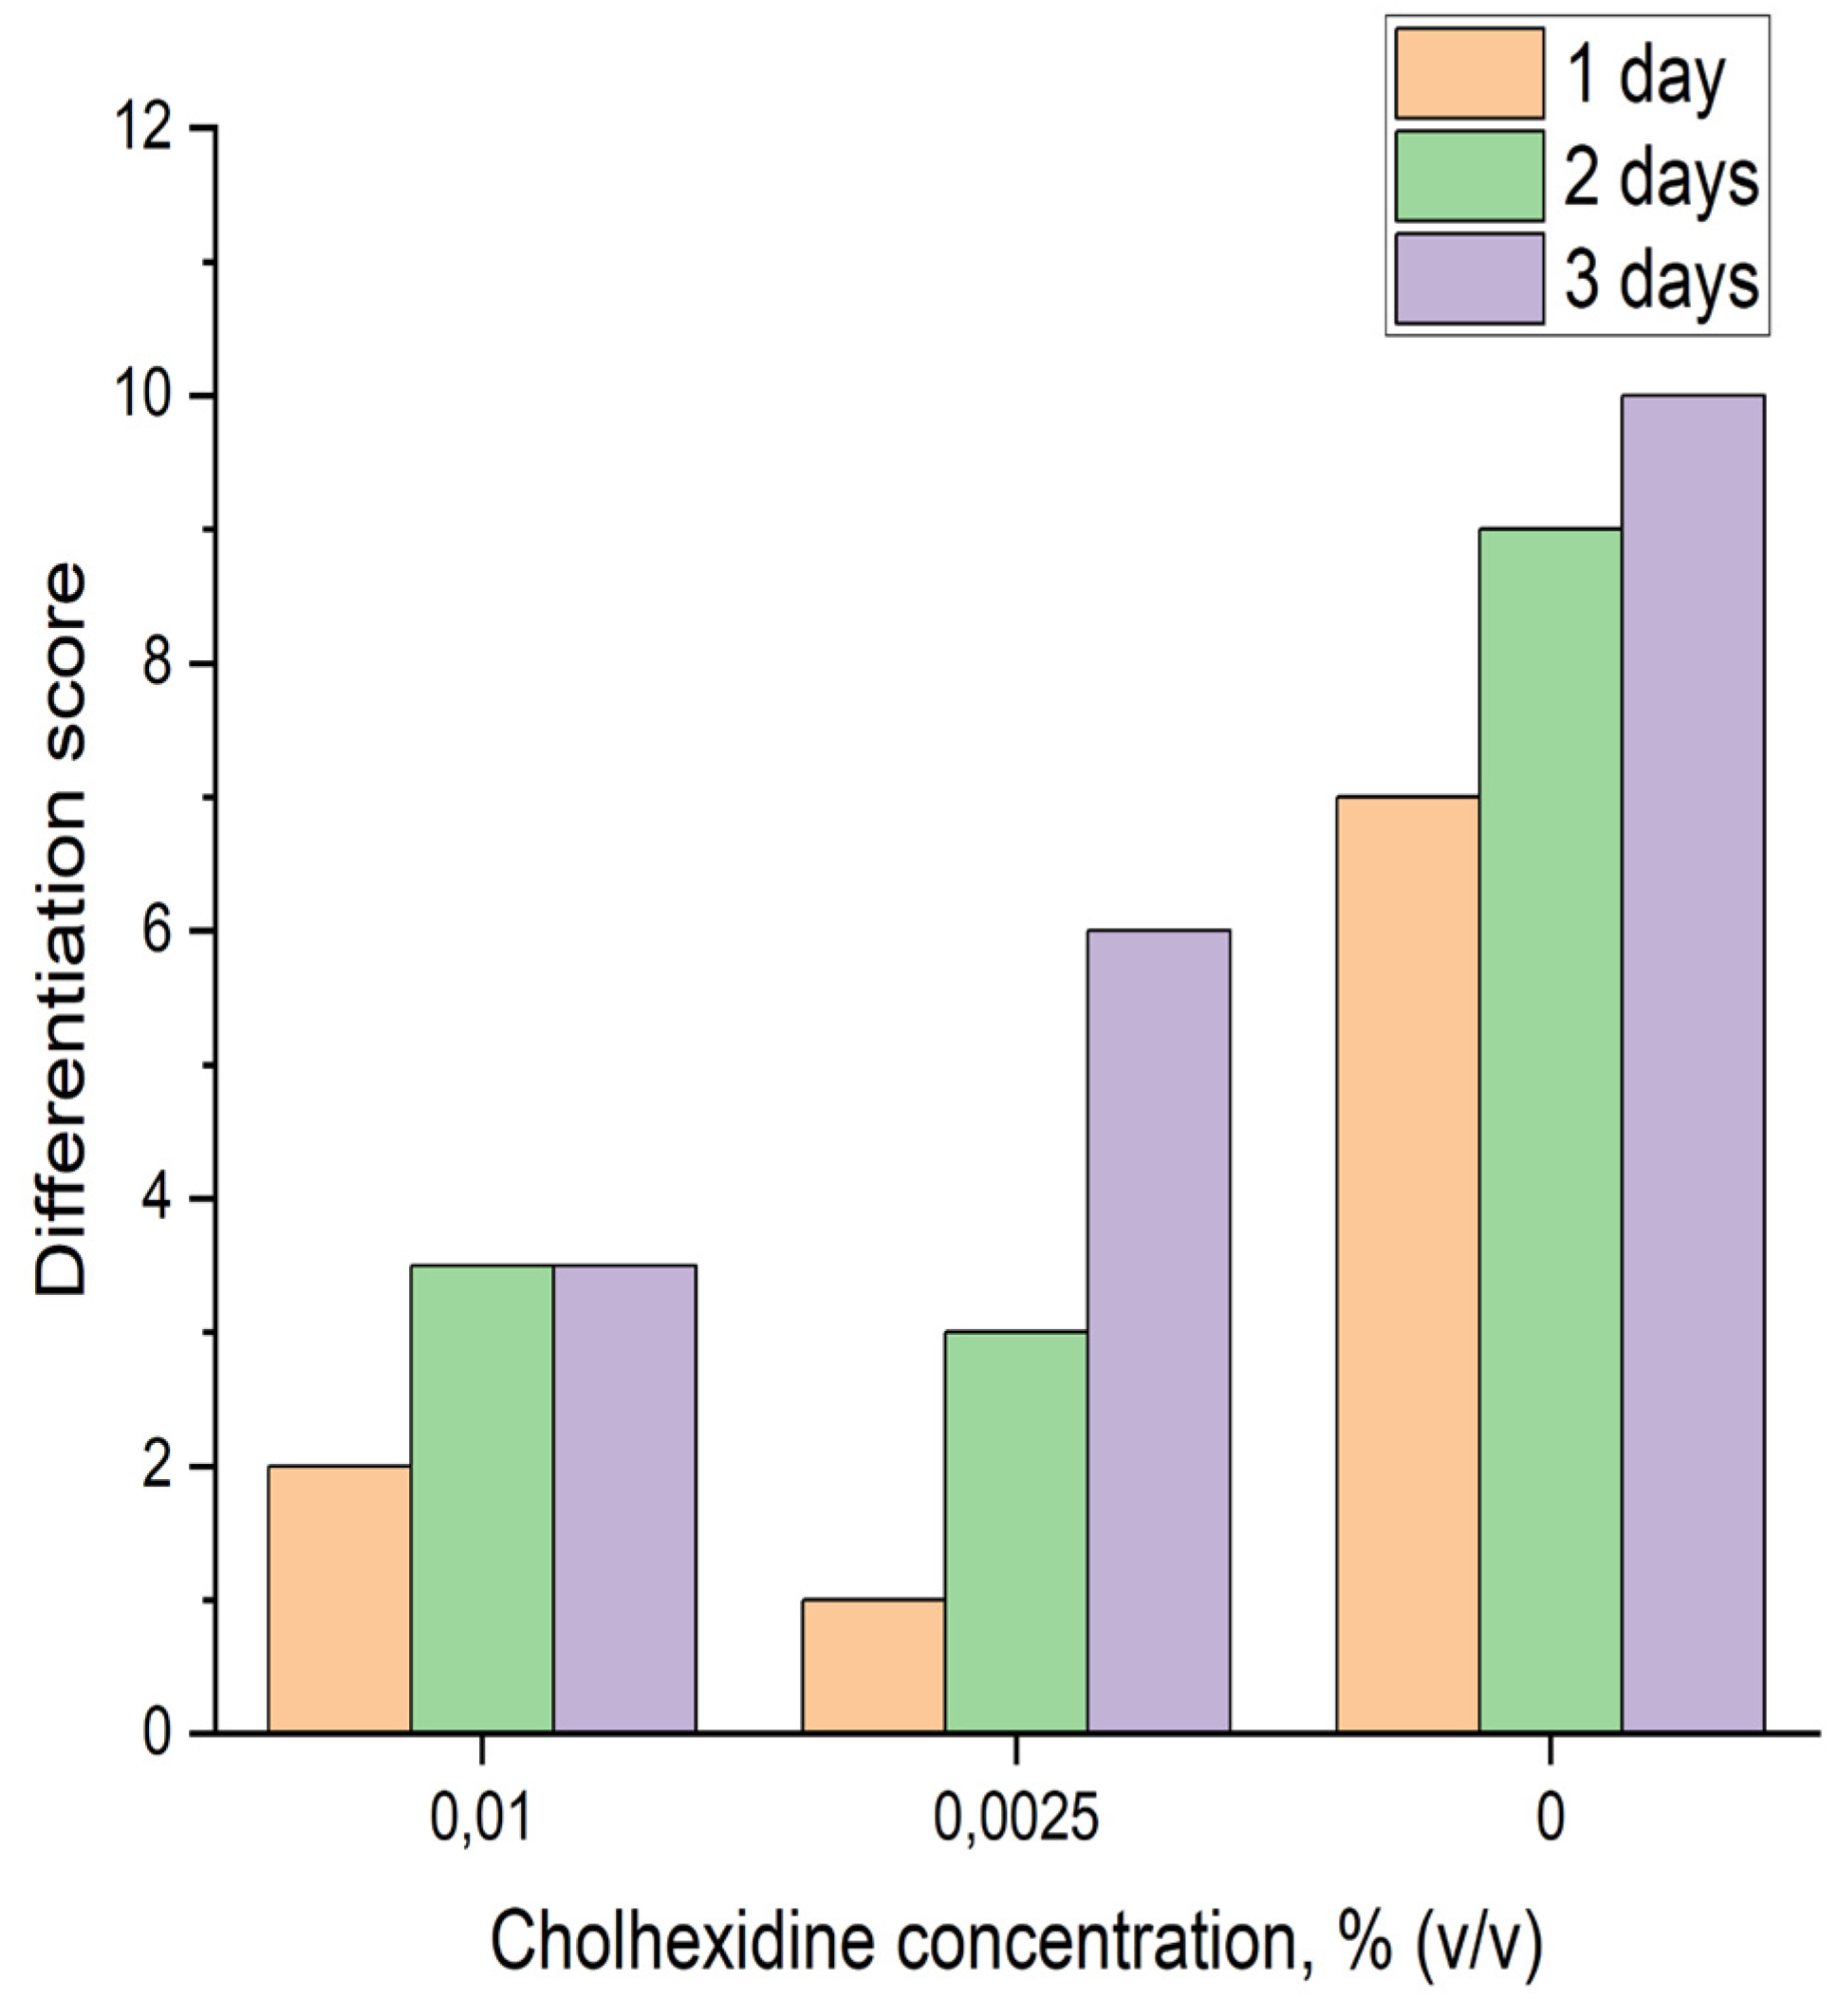
Figure 4.
A - Chromatogram of native Endoferin separated on Sephadex S-300. OD at 280 nm is shown (blue), the fractions are marked in red. B - Activation of differentiation in early gastrula explants from Xenopus embryos by fractions of native Endoferin, with 1 mg of whole EDTA-treated Endoferin. Blue bars represent heating of individual Endoferin fractions separated by molecular weight via gel filtration, while red bars represent heating of each fraction together with whole EDTA-treated Endoferin. Rows 1 and 4 – first day of incubation, Rows 2 and 5 – second day of incubation, Rows 3 and 6 – third day of incubation.

Figure 5.
VEGF expression in endometrioma samples. A - Control without treatment. B - Endoferrin at a dose of 10 μg/kg. Arrows point to immunopositive cells. Magnification: 200×. The corresponding raw microscopy images are shown in supplementary Figures S2 and S3.
Figure 5.
VEGF expression in endometrioma samples. A - Control without treatment. B - Endoferrin at a dose of 10 μg/kg. Arrows point to immunopositive cells. Magnification: 200×. The corresponding raw microscopy images are shown in supplementary Figures S2 and S3.
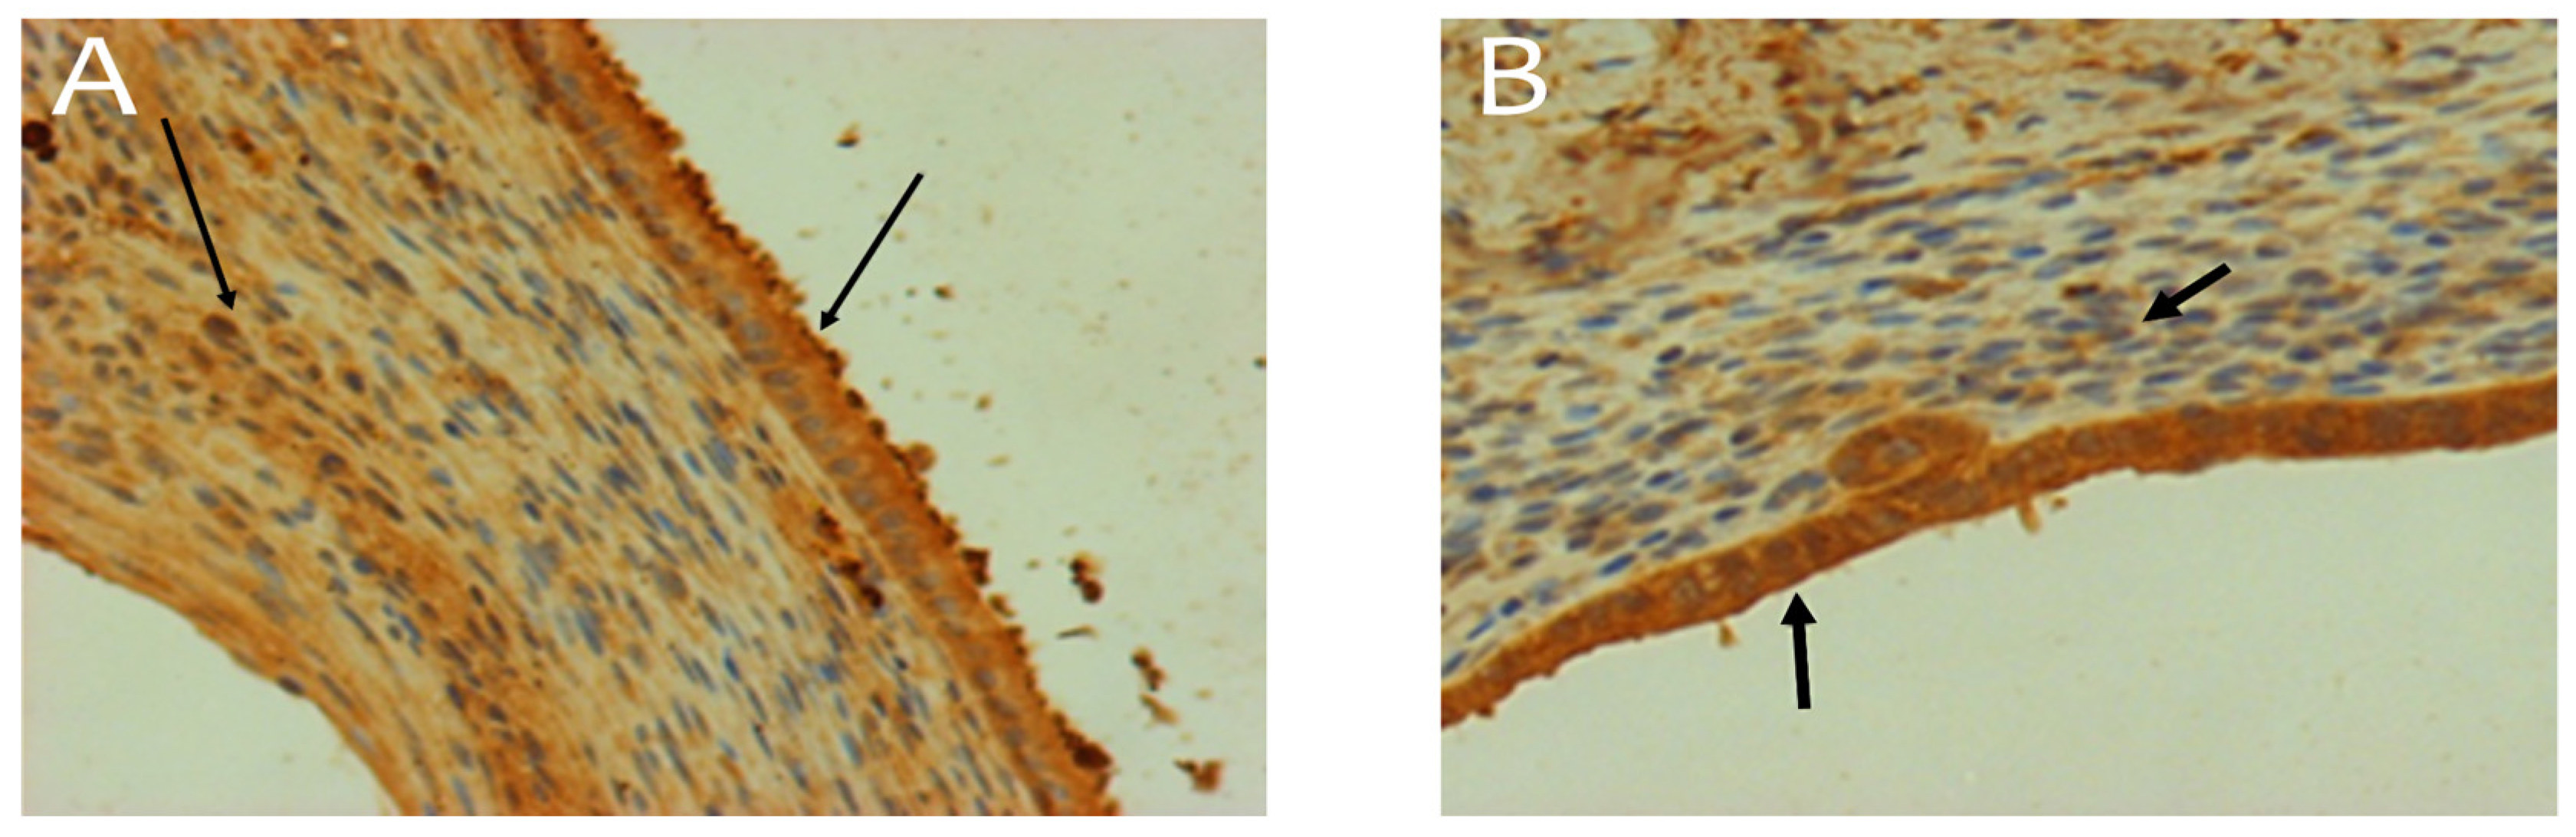
Figure 6.
Caspase-3 expression in an endometrioma sample. A - Control without treatment. B - Endoferin at a dose of 30 µg/kg. Arrows indicate immunopositive cells. Magnification: 200×. The corresponding raw microscopy images are shown in supplementary Figures S4 and S5.
Figure 6.
Caspase-3 expression in an endometrioma sample. A - Control without treatment. B - Endoferin at a dose of 30 µg/kg. Arrows indicate immunopositive cells. Magnification: 200×. The corresponding raw microscopy images are shown in supplementary Figures S4 and S5.
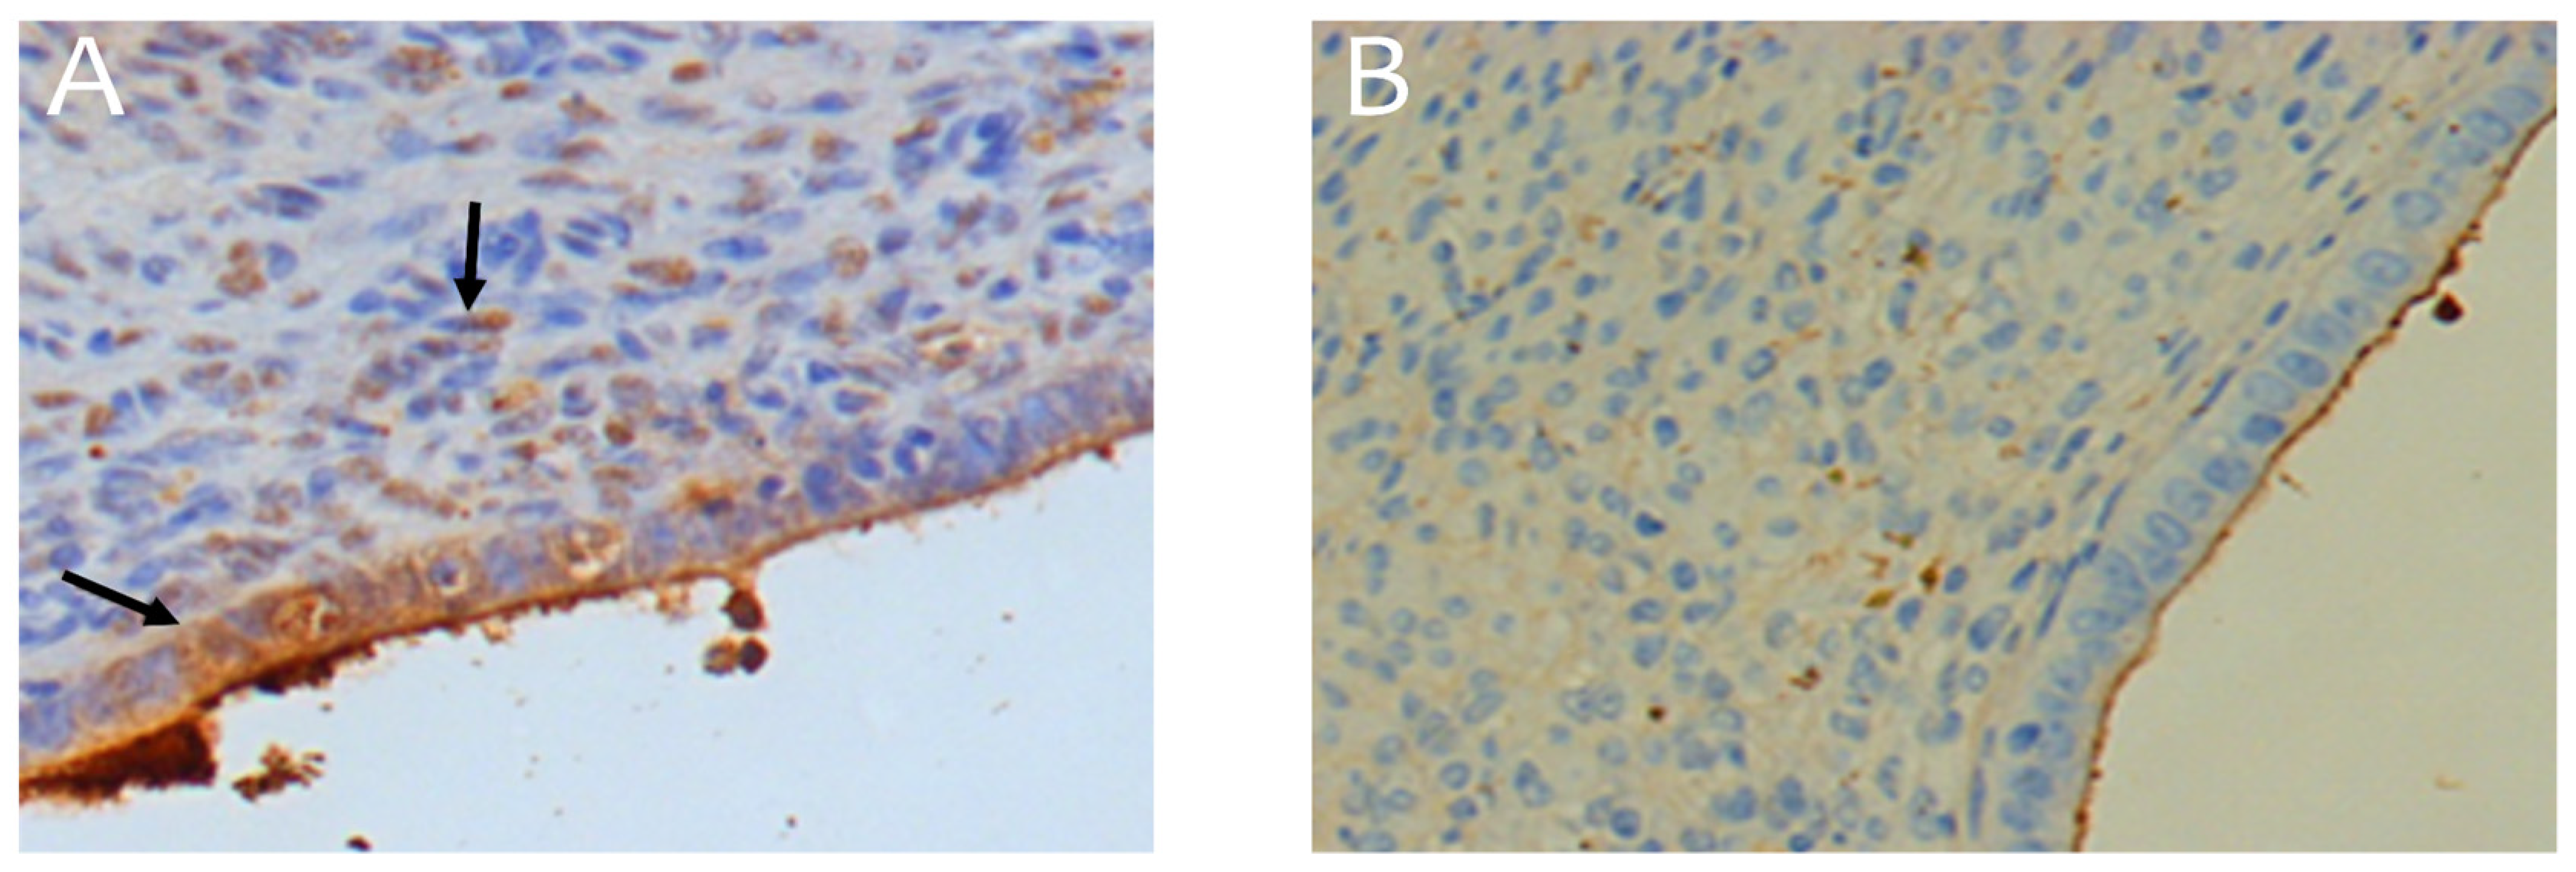

Table 1.
Effect of protease inhibitors on Endoferin activity in the differentiation of Xenopus ectoderm.
Table 1.
Effect of protease inhibitors on Endoferin activity in the differentiation of Xenopus ectoderm.
| Protease Inhibitors | Ectoderm Incubation Time | |
| Day 1 | Day 2 | |
| Control | 12 | 12 |
| PMSF 5 mM | 9 | 10 |
| Pepstatin 3 mM | 10 | 11 |
| Leupeptin 3 mM | 5 | 7 |
| EDTA 10 mM | 0 | 0 |
| EDTA + Zn²⁺ (20 μM)* | 1.5 | 5 |
*The Endoferin sample was treated with 10 mM EDTA, then dialyzed against 50 mM Tris HCl, pH 7.2, in saline for 18 hours, followed by an additional 2 hours. Afterward, 20 μM ZnCl₂ was added.
Table 2.
Effect of Endoferin on VEGF expression (staining intensity in points, Me (Q1; Q3)) and Proliferation Index (M ± SEM) in the stroma of endometriomas. .
Table 2.
Effect of Endoferin on VEGF expression (staining intensity in points, Me (Q1; Q3)) and Proliferation Index (M ± SEM) in the stroma of endometriomas. .
| Group | Dose (µg/kg) | Number of sections with stroma per group | Evaluated Indicators |
| EI | |||
| Physiological Solution | 0 | 8 | 0.24 ± 0.036 |
| Test Drug Endoferin | 3 | 8 | 0.05 ± 0.008**# |
| 10 | 7 | 0.10 ± 0.016**# | |
| 30 | 6 | 0.07 ± 0.008**# | |
| 90 | 8 | 0.10 ± 0.012**# | |
| 300 | 7 | 0.04 ± 0.004**# |
Notes: 1. # - p<0.05, statistically significant difference from the control group, Tukey’s test. 2. ## - p=0.05, statistically significant difference from the control group, rank mean method. 3. * - p≤0.05, statistically significant difference from the control group, Mann-Whitney test. 4. ** - p<0.05, statistically significant difference from the control group, t-test. 5. EI – VEGF Expression Index (N+/Ntotal).
Table 3.
Effect of Endoferin on caspase-3 expression (staining intensity in points, Me) and Apoptosis Index (M ± SEM) in the stroma of endometriomas. .
Table 3.
Effect of Endoferin on caspase-3 expression (staining intensity in points, Me) and Apoptosis Index (M ± SEM) in the stroma of endometriomas. .
| Group | Dose (µg/kg) | Number of Slices with Stroma per Group | Measured Indicator |
| EI | |||
| Physiological Saline | 0 | 8 | 0.04 ± 0.011 |
| Tested Drug Endoferin | 3 | 7 | 0.03 ± 0.006 |
| 10 | 6 | 0.10 ± 0.021** | |
| 30 | 5 | 0.07 ± 0.014 | |
| 90 | 8 | 0.06 ± 0.012 | |
| 300 | 7 | 0.18 ± 0.048**# |
Notes: 1. # - p < 0.05, statistically significant difference from all groups except the test drug group at a dose of 10 µg/kg, Tukey’s test. 2. ## - p = 0.05, statistically significant difference from the control group, rank mean method. 3. * - p < 0.05, statistically significant difference from the control group, Mann-Whitney test. 4. ** - p < 0.05, statistically significant difference from the control group, t-test. 5. EI – Apoptosis Index (N+/Ntotal).
Disclaimer/Publisher’s Note: The statements, opinions and data contained in all publications are solely those of the individual author(s) and contributor(s) and not of MDPI and/or the editor(s). MDPI and/or the editor(s) disclaim responsibility for any injury to people or property resulting from any ideas, methods, instructions or products referred to in the content. |
© 2024 by the authors. Licensee MDPI, Basel, Switzerland. This article is an open access article distributed under the terms and conditions of the Creative Commons Attribution (CC BY) license (http://creativecommons.org/licenses/by/4.0/).
Copyright: This open access article is published under a Creative Commons CC BY 4.0 license, which permit the free download, distribution, and reuse, provided that the author and preprint are cited in any reuse.


