Submitted:
02 December 2024
Posted:
02 December 2024
You are already at the latest version
Abstract
Background/Objectives: Pentacyclic triterpenoids, as bioactive phytochemicals proved significant bioactivity (antioxidant, anti-inflammatory, hypoglycemic, and anticancer) and low cytotoxicity. This study developed convenient methods for extracting and characterizing a birch bark extract enriched in pentacyclic triterpenoids (betulin betulinic acid and lupeol) and entrapped in two bioavailable nanoformulations. The performance of ATR-FTIR spectroscopy as a cost-effective and non-destructive method was evaluated comparatively with accurate HPLC-based methods. Methods: The bark extract and pure betulin or betulinic acid were used to obtain PEGylated liposomes and Nano Lipid Carriers (NLC). Their size was characterized by light scattering diffraction. UV-VIS spectrometry was applied as a preliminary evaluation (1), the UHPLC-QTOF-ESI+-MS for structure identification (2), the ATR-FTIR spectroscopy (for semi-quantitative evaluation) (3), HPLC-DAD for accurate quantification of each component, either in the organic solvents and in nanoformulations (4). Results: The PEGylated liposomes had smaller sizes, and higher entrapment efficiency, significantly correlated between the three analytical methods. The performance of ATR-FTIR spectroscopy was positively correlated with HPLC-DAD data and confirmed the potential of this cheaper and reliable semi-quantitative method to evaluate the entrapment efficiency of TTs in liposome and NLC nanoformulations. Conclusions: The results recommend using liposomal nanoformulations for entrapment of bioactive terpenoids and their characterization by ATR-FTIR after validation by HPLC-DAD. The ATR-FTIR spectroscopy also offers the possibility of screening in a short time different recipes of nanoformulations as well as their stability and bioavailability, useful for investigations in vitro and in vivo which may confirm their efficacy as therapeutic agents.
Keywords:
Pentacyclic triterpenoids
; PEGylated liposomes
; Nano Lipid Carriers
; Diffraction Light Scattering
; ATR-Fourier Transform Infrared Spectroscopy
; High performance Liquid Chromatography
; Mass Spectrometry
1. Introduction
Pentacyclic triterpenoids are an important family of bioactive phytochemicals, and are classified in different classes, lupane-type (lupeol, betulin, and betulinic acid), oleanane type (oleanolic acid, ß-amyrin, erythrodiol) and ursane type (ursolic acid, α-amyrin, uvaol). The lupane family is the most known, betulin, betulinic acid and lupeol showing to have diverse therapeutic effects. The outer Bark of Betula Pendula Roth (birch tree) contains betulin (B) as a major component along with betulinic acid (AB), lupeol (L), as shown in Figure 1.
These pentacyclic triterpenes (TTs) has proven to have various biological functions, including antiviral, anticancer, antioxidant, anti-inflammatory and hypoglycemic activities, assuming their action as pharmacological agents and potent anticancer molecules [1,2,3,4]. The interest on lupane-type molecules increased since betulinic acid and betulin proved to induce cytotoxicity against human melanoma lines in vitro and in vivo [5,6,7]. A recent review systematically summarized the chemical structures, plant sources, bioactivities, absorption, metabolism, and oral bioavailability of TTs, their self-assembly properties suggesting that their derived nanostructures are not only efficient as oral forms [8]. Meanwhile, chemical modifications and new functional delivery systems were realized, to attenuate their hydrophobicity, poor absorption and to improve their bioavailability and bioactivity [9]. Some of these molecules are recognized by the US Food and Drug Administration as Generally Recognized as Safe (GRAS), considered as bioactive compounds and excipients for other phytochemicals or drugs, especially for topical routes of administration [10].
Betulinic acid (AB), found mainly in white or silver birch, showed potent pharmacological properties, low side-effects, and a prominent efficiency on cancer therapy. The anti-proliferative effect of AB is explained by inhibition of topoisomerase I and II in tumour cells (1), changes in the mitochondrial membrane potential and mitochondrial apoptosis (2) and anti-angiogenesis (3), DNA polymerase inhibition, activation of caspases, production of reactive oxygen species, as recently reviewed [6].
The last decades, nanoparticle-based drug delivery has been extensively exploited for cancer treatment, by oral, parenteral or topical delivery of drugs, due to their improved stability and biocompatibility, enhanced permeability and retention, and precise targeting. Multiple forms of lipid nanoparticles exist including liposomes, solid lipid nanoparticles, Nanostructured Lipid Carriers (NLC), micro- and nanoemulsions, phytosomes, lipid-coated nanoparticles, and nano-assemblies. Recently there were reported updated information about the nanoformulations for the delivery of TTs in anticancer therapies [1,7]. Meanwhile it was shown that some triterpenoids can be self-assembled as 3D structures or bilayer structures and can incorporate different fluorophores as well anti-cancer agents at physiological and lower pH, making it useful as drug delivery vehicles [13].
To enhance AB's solubility, half-life, and efficacy by using nanoscale drug delivery systems, several systems-including polymeric nanoparticles, magnetic nanoparticles, liposomes, polymeric conjugates, nanoemulsions, cyclodextrin complexes, complexes with carbohydrate nanoparticles and carbon nanotubes-have been developed [12,13]. Different liposomal systems incorporating AB were obtained (with sizes around 100-150 nm) which induce cell cytotoxicity & apoptosis, destruction of mitochondrial membrane potential and in vivo inhibition of tumors in mice by intratumoral injection [14,15]. The PEGylated AB liposomes with sizes of around 142 nm, can effectively accumulate in the tumor tissues and had an increased drug release, tumor inhibitory effect, compared with those of free AB, and represents a better alternative for the cancer therapy [16].
Due to their unique size-dependent properties, Nanostructured Lipid Carriers (NLCs), a second generation of Solid Lipid Nanoparticles (SLNs) contains a mixture of physiologically similar lipids and are well tolerated [16,17,18]. Their ability to incorporate lipophilic drugs, offers a possibility to create new prototypes with increased bioavailability for drug delivery, along with controlled and site-specific drug delivery. NLCs produced by melt-emulsification & ultrasonication method have numerous applications in both pharmaceutical and cosmetic industry due to ease of preparation, the feasibility of scale-up, biocompatibility, non-toxicity, enhanced targeting efficiency and the possibility of site-specific delivery via various routes of administration [19,20].
To evaluate the composition and stability of terpenoids like AB, B or L, in organic solvents or in different nanoformulations, several analytical methods were applied, from Gas-or Liquid chromatography coupled with UV-VIS detection or Mass Spectrometry (HPLC-DAD or UHPLC-MS), Infrared or Fourier Transform Infrared spectroscopy (FTIR), Near-Infrared (NIRS) or Raman Spectroscopy. IR spectroscopy has been used successfully for qualitative or semi-quantitative analysis in various fields including pharmaceutical, food industry and biological evaluation. A simple, rapid and non-destructive method for the determination of betulin in the outer birch bark was developed using NIRS, combined with HPLC-DAD to determine the quality and to quantify the betulin content of the outer birch bark [21]. Vibrational FTIR and FT-Raman spectroscopy was applied for qualitative and semi-quantitative analysis of Betula pendula bark samples dissolved in methanol in parallel with GC-MS analysis, revealing two major compounds, betulin (59%) and lupeol (41%) and traces of betulinic acid, with specific absorbances of –COOH group at 1681 and 1718 cm-1 [15]. Also, complexes of betulin–cyclodextrins have been prepared and analysed using FT-Raman spectroscopy [22].
Recently, NLCs with entrapped Betulin were synthesized using the emulsification /solidification method, exhibiting a spherical shape and particle sizes of around 183 nm, a Poly dispersibility Index (PDI) of 0.142, and a high zeta potential of -38.64 mV, reflecting a relative stability of the nano system. The drug loading into NLC had Entrapment Efficiencies (EE) from 47% to 87%, useful for a topical application in psoriasis treatment. [23]
The Attenuated Total Reflection ATR-FTIR provides a rapid, cost-effective and attractive platform without the need for any sample preparations, as solutions or after evaporation on the ATR diamond crystal without further preparation [24]. Considerable research data have demonstrated the superior performance of FTIR in comparison to conventional techniques, including accessible disease diagnostics, although its routine application within clinical laboratories remains elusive [25]. Recent developments and updates for the qualitative and quantitative analysis of herbal medicine using FTIR were reviewed, useful in herbal drug development, in production for process monitoring, or in quality control laboratories [26,27].
HPLC-MS is a highly sensitive method for the quantitative determination triterpenoids in plant extracts based on a combination of HPLC with atmospheric pressure chemical ionization and tandem mass spectrometric detection was reported, with detection limits of 0.7–1.8 μg/L [28]. Recently the quantitative analysis of pentacyclic triterpenoids and the separation of ten major molecules in different plants, including birch Bark were reported, using supercritical fluid chromatography–tandem mass spectrometry (SFC-MS/MS) on silica-based reversed stationary phases was reported [29].
This study developed convenient methods for the extraction and characterization of a birch bark extract enriched in pentacyclic triterpenoids (betulin betulinic acid and lupeol) and entrapped in two bioavailable nanoformulations (PEGylated liposomes and NLC). The size characterization of two types of nanoformulations which can entrap bioactive pentacyclic triterpenoids (pure B or AB and a birch bark extract) was achieved by diffraction light scattering and their entrapment efficiency used successively the UV-VIS spectrometry as a preliminary evaluation (1), ), UHPLC-QTOF-ESI+-MS for structure identification (2), ATR-FTIR spectroscopy (as a fingerprint and semi-quantitative evaluation (3), and quantification by HPLC-DAD of each component from the bark extract comparative to pure standards of AB and B (4). Finally, the performance of ATR-FTIR spectroscopy as a cost effective and non-destructive method is evaluated comparatively with accurate HPLC-based methods.
2. Results
2.1. Preparation and Characterization of the TTs extract by UV-Vis Spectrometry
The TTs extract was obtained in three steps by successive extractions with different solvents, as described in Materials and methods. A preliminary evaluation of the TTs extract was done by UV spectrometry (200-320 nm) in the solvent mix EtOH: DMSO (3:1) comparative to calibrations with pure standards AB and B measured at four different concentrations, from 2 to 20 mg/ml (data not shown). The total concentration of terpenoids in the TTs extract was evaluated from its maxima absorption at 212 nm in the UV spectra. The mean value from a triplicate measurement indicated a concentration of 28.35 mg/ml. This was a rough evaluation, before its quantification by HPLC-DAD.
2.2. Identification and Quantification of TTs Components by UHPLC-QTOF-ESI+-MS and HPLC-DAD
The same TTs extract was characterized by UHPLC-QTOF-ESI+-MS analysis. Figure 2 shows the LC chromatograms of the initial raw bark extracted in acetonitril (A) and fraction F2 collected between 9.5-11 min, representing the TTs extract to be used in further experiments (B).
In fraction F2 there were identified three major terpenoids namely Betulin(B), Betulinic acid (AB) and Lupeol (L). Their identification was made by Mass spectrometry, based on specific precursor ions and fragments, as shown in Figure 3. By Extract Ion chromatogram (EIC), each component was characterized, as shown in in the left side of Figure 3. The mass spectra of precursors [M+H] + and other fragments, mainly [M+H-H2O] + are mentioned.
Betulin (B) (min 9.9) was identified by its main precursor with m/z= 443.3238 Da and the dominant fragment with m/z=425.3495 Da (100%), while Betulinic acid (AB) eluted at 10.1 min, the precursor ion had m/z= 457.3066 Da (100%) and the fragment [M+H-H2O]+ with m/z= 439.3279 Da. Luteol was identified at min 10.6 and had 3 specific fragments at 427.2653 Da (low abundance), 409.2081 Da (100%) and 381.27 Da. In parallel, calibrations were made with four different concentrations of betulin (1 to 10 mg/ml) by HPLC-DAD, see details in section 2.5 as and Supplementary file S1 (HPLC-DAD chromatograms and calibration curve with pure Betulin (1-10 mg/ml). Considering that the protocol of HPLC-DAD, the solvents and the gradient protocol were different (see Materials and methods), the maximal absorption was at 212 nm and the retention times in the TTs extract were different in this case, namely, for B-Rt = 5.5 min, AB-Rt= 5.9 min and for L-Rt= 6.35 min. The ratio of B: AB: L was determined to be 55: 35: 10 according to peak areas ratios. The concentration of the stock extract of TTs expressed in B equivalents was estimated to be 25.4 mg/ml. This standardized extract TTs was used to build all nanoformulations and compared with similar formulations containing pure AB and B (as positive controls).
2.3. Characterization of the Nanoformulations with Entrapped AB and TTs,
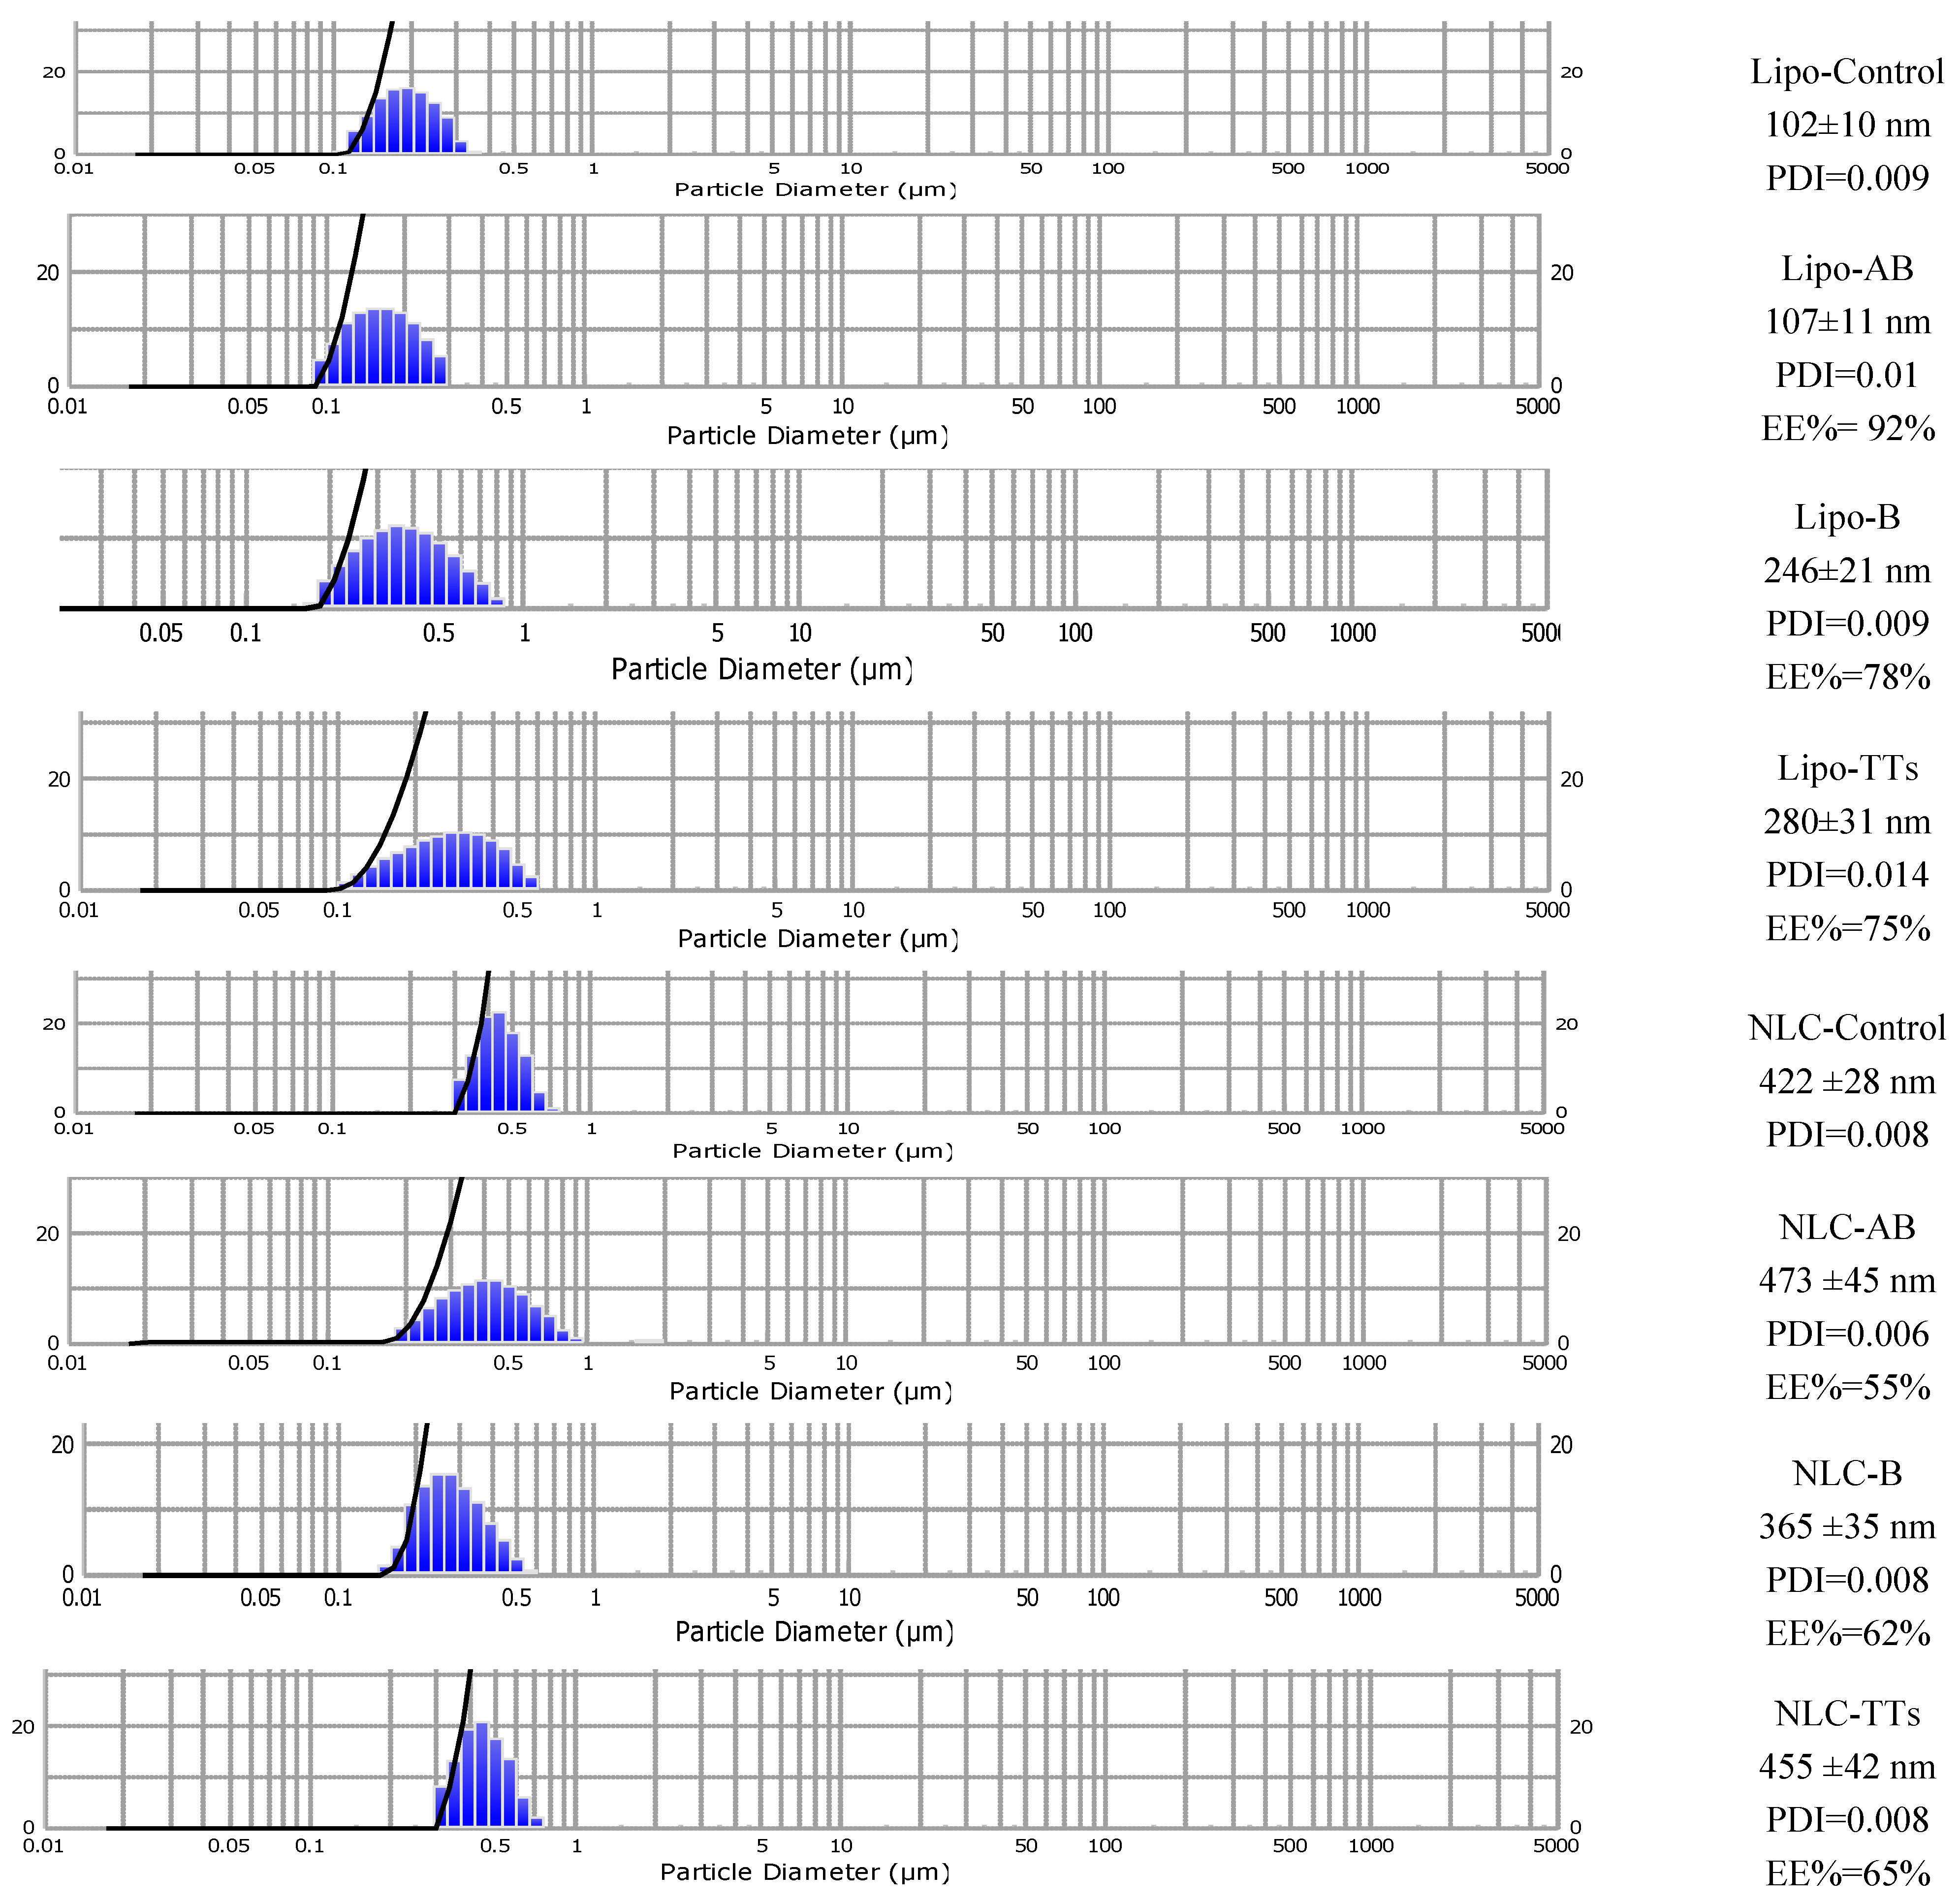
Figure 4 includes the size distribution and diameters (mean ± SD (nm) and dispersibility index (PDI) of all Lipo- and NLC-formulations. The entrapment efficiency (EE%) is also mentioned. It was determined by UV spectrometry after the elimination (by ultrafiltration) of the non-entrapped terpenoids, for details see Materials and methods.
As shown, the population of nanoparticles have had sizes between 102-473 nm, depending on the type of nanostructure and the terpenoid type. The polydispersibility index (PDI) showed a good distribution of nanoparticles in all cases. The smaller Lipo- structures entrapped AB with higher EE% (92%) while B and TTs had larger sizes (above 200 nm) and EE% values of 78 and 75%, respectively. All NLCs formulation had larger sizes and showed the formation of cloudy networks of lipid nanostructures, with increased tendency for aggregation comparative to Lipo- structures. NLC-AB had a mean diameter of 473 nm and EE%= 55%, while entrapped B and TTs showed sizes of 365 ±35 nm and 455 ±42 nm, respectively while EE%, 62% and 65%, respectively. The stability of both types of nanoformulations was high, with constant sizes, as checked for one month storage at 4°C. Significant correlations were found between microscopic evaluation and the DLS measurements, as checked previously [31].
Figure 4.
Mean sizes of Lipo- and NLC-nanoformulations containing entrapped AB, B and TTs comparative to controls, as determined by DLS. Size distribution diameters (mean± SD) (nm) of the formulations the PDI value and the encapsulation efficiency (EE%) are included.
Figure 4.
Mean sizes of Lipo- and NLC-nanoformulations containing entrapped AB, B and TTs comparative to controls, as determined by DLS. Size distribution diameters (mean± SD) (nm) of the formulations the PDI value and the encapsulation efficiency (EE%) are included.
2.4. ATR-FTIR Fingerprinting and Semi-Quantitative Evaluations of AB, B and TT Before and After Entrapment in Lipo- and NLC-Nanoformulations
The ATR-FTIR fingerprinting of TTs extract comparative to AB and B was done either in the solvent mix and in the evaporated sample on the diamond cell (see Supplementary file S2A). Figure 5A and B shows the ATR-FTIR superposed fingerprints of AB and B comparative to TT extract, after evaporation. The spectra were recorded in the region 850-1750 cm-1 (A) and 2800-3400 cm-1 (B).
The spectral pattern was rather similar for all three molecules, exhibiting almost same main band positions and relative intensities at common wavenumbers corresponding to specific vibrations of polar and non-polar bounding. Table 1 includes details about these vibrational bands, corresponding to different molecular vibrations.
The assignments were similar with other reported data [15,38], as can be seen in columns 4-7. Regarding the peaks of the region, 2800-3400 cm-1. There were identified shifts from 2852 cm-1 and 2945 cm-1 (specific to AB), to 2823 and 2922 cm-1 (for B) and 2866.2 and 2939.5 cm-1 for TTs. These strong bands correspond to the symmetric and anti-symmetric stretching in the CH2 groups of alkyl chains, while the band centered at 1741 cm−1 corresponds to the stretching vibrations of the ester carbonyl groups. The band centered at 1650 cm−1 is assigned to C=O stretching, and the scissoring vibrations of the CH2 groups are represented by the band at 1465 cm−1.
The ATR-FTIR absorbance of the TTs extract comparative to pure betulin and betulinic acid revealed specific molecular fingerprints of triterpenes, based on the main bands in both regions (850-1750 cm-1 and 2800-3400 cm-1). There were identified 11 specific bands, as presented in Table 1, the spectral feature is observed for the band at 1716-1735 cm-1 attributable to the ν(C=O) mode, that is prominent in the Bark spectrum [15]. In agreement with literature data, stretching vibrations of C=O, were identified from 1028 to 1180 cm−1 Characteristic alkyl (R-CH2) stretching modes from 2850 to 3000 cm−1 were observed, in accordance with other references [39].
For a semi-quantitative evaluation of these molecules, either as free molecules in solvent mix or in nanoformulations, calibration curves for B were built based on their ATR-FTIR spectra recorded in solution at four different concentrations (2, 4, 10 and 20 mg/ml). For each of the 11 wavenumbers (mentioned in Table 2) the calibration curve was built and the equation together with the R2 (coefficient of determination) was mentioned (see Supplementary file S3).
The highest values of R2 and correlation between concentration/absorbance were identified at 2866.2 and 2939.5 cm-1 for B standards. The same correlation was obtained from the extract TTs using 4 dilutions (dilution nr 4 representing the stock solution diluted 2.5 times in EtOH: DMSO ), as shown in Figure 6. All dilutions were made in the same solvent mix and the highest R2 values (above 0.91) were found at 2939.5 and 2866.2 cm-1 (Figure 6 D).
According to the equation for B (y=0.0034x + 0.0199; R2=0.992) at 2939.5 cm-1, the concentration of TTs dilution 4 was determined to be 10.32 mg/ml. Therefore the stock solution of TTs was calculated to be 2.5 times this value, namely 25.8 mg/ml. This value was compared with the evaluation made by HPLC-DAD (25.4 mg/ml) and UV spectrometry (28.35 mg/ml), as presented in sections 2.1 and 2.2. In conclusion, ATR-FTIR evaluation of Ts extract gave similar results with the other methods and can be considered reliable for quantitation in further experiments, considering the specific wavenumbers 2866.2 and 2939.5 cm-1.
These data were useful to make the evaluation of the entrapment efficiency of AB, B and TTs in lipo- and NLC- formulations, considering specifically the absorbance values recorded at 2866.2 and 2939.5 cm-1.In the supplementary file S2B the ATR-FTIR spectra of Lipo-entrapped TTs, B and AB comparative to Lipo-control are presented, recorded after dissolving in the solvent mix (s) or after evaporation. In the supplementary file S2C similar ATR-FTIR spectra of NLC-entrapped TTs, B and B to NLC-control are presented, recorded after dissolving in the solvent mix (s) or after evaporation. In both cases, considering their absorbances at wavenumbers 2866.2 and 2939.5 cm-1, the entrappment efficiency was calculated. Figure 7 shows comparatively the EE% values calculated for the entraped AB, B and TT in Lipo- and NLC-formulations and the organic solutions used for entrappment.
The EE% values shown in the first columns (blue), were similar in Lipo- and NLC, and represented around 74% comparative to initial concentration of Bs. The EE% values shown in the red columns were 78% in Lipo-ABs-C comparative to 51% for NLC-ABs-C. For TTs, the EE% vakues were 89% vs 57% in Lipo- versus NLC-formuations. for B in solutin (Bs) comparative to B entrapped in Lipo- and NLC. Formulations.Asa conclusion, Lipo- formulations showed similar Ee% values for all terpenoids while NLC-formulations showed inferior values and especially for ABs and TTs.
2.5. Chromatographic Fingerprints and Quantification of Terpenoid Components Entrapped in Lipo- and NLC-Nanoformulations by HPLC-DAD
Figure 8 includes the superposed HPLC-DAD chromatograms (recorded at 212 nm) of the Lipo-nanoformulations by the solubilization of the retentate after entrapment of AB, B and TT in Liposomes, comparative to empty liposomes (A) and solubilized NLC retentates after entrapment of AB, B and TT in NLC, comparative to empty NLC (B.).
The HPLC-DAD fingerprints of Lipo-formulations show the presence of lecithin (Rt= 6.3-6.5 min), the main component of liposomes, a shift of Rt values, Lipo-AB having AB-Rt=5.5 min, B-Rt=5.8 and TT presenting a main peak similar to B (Rt=5.8 min), a second one, as a shoulder, attributed to AB (Rt=5.5 min) and a minor peak at Rt=6 min attributed to L. The fingerprints of NLC-formulations were different: the Rt values for B and TT were similar and superposed at (Rt=5.8 min), for AB at 5.7-5.9 min and TT had a more pronounced shoulder at 6-6.2 min. The large peak between 6.4-6.7 min corresponded to other lipid constituents of NLC after entrapment (presumably oxidized lipid derivatives), while the control NLC had only a small peak at 5.5 min.
According to the calibrations made with B standard (see Supplementary file S1), the entrapment efficiency (EE% values) were determined in the by the solubilized retentate, in each case. Figure 9 shows comparatively the peak intensity values and the mean EE% values determined in each case.
The EE% values in Lipo- were superior to NLC, and ranged from 90% for AB to 68% for B. For TT, the major component B showed the highest E% comparative to AB and L, without significant differences of entrapment into Lipo- and NLC-formulations. These entrapment values were compared with the ones obtained by UV spectrometry and ATR-FTIR, as presented below (section 2.6)
2.6. Integration of Data Related to Entrapment Efficiency of the Three Methods
Figure 10 integrates the data obtained by UV spectrometry, HPLC-DAD and ATR-FTIR regarding the entrapment of AB, B and TT in Lipo- and NLC-formulations.
With some exceptions (Lipo-Ab, Lipo-TT and NLC-B) , the ATR-FTIR semi-quantitative evaluation of concentrations and EE% for the three terpenoids proved to have non-significant differences as compared to the accurate HPLC-DAD evaluation and also preliminary UV evaluation.
3. Discussion
In the current study, an extract rich in pentacyclic terpenoids (TTs) including Betulin, Betulinic acid, Lupeol) from the outer bark of silver birch was obtained by successive extractions in organic solvents, modifying a procedure used before [32], and considering the improved solubility of betulin, as main component, in iso-propanol, ethyl acetate and ethanol: DMSO [35]. The final concentrated extract TTs reached the concentration of 28.35 mg total terpenoids /ml, according to a preliminary UV spectrometry. The entrapment efficiency was higher in liposomes comparative to NLC formulations and superior for betulinic acid comparative to betulin.
This rough evaluation was compared with the accurate quantification by HPLC-DAD, resulting a total concentration of terpenoids expressed as 25.4 mg betulin equivalents /ml and a weight ratio of Betulin: betulinic acid: Lupeol of 55: 35: 10. By UHPLC-QTOF-ESI+-MS , Betulin was identified by its main precursor with m/z= 443.3238 Da and a dominant fragment of 425.3495 Da (100%), while Betulinic acid with a precursor ion of 457.3066 Da (100%) and a fragment of 439.3279 Da. Lupeol was identified by its specific fragments at 427.2653 Da, 409.2081 Da (100%) and 381.27 Da.
The standardized extract TTs was used to build PEGylated liposomes and nano Lipid Carriers (NLC) and compared with similar formulations containing pure AB and B (as positive controls). The procedures used for PEGylated liposomes were adapted from the classical hydration of lipid layers [36] to the ethanol injection method [30,37], while the composition of NLC was adapted from the other references [18,19]. Such formulations showed size ranges from 102 to 473 nm, the NLCs having significantly higher diameters. In agreement with other references, a succession of analytical methods was applied to identify and quantify the components of the extract, either in organic solvents or in nanoformulations [34].
The use of ATR-FTIR as semi-quantitative method for the evaluation of plant-based bioactive molecules, food and food supplements or derived formulations for biomedical applications is well documented [38,39]. Here the ATR-FTIR spectroscopy of the TTs extract was applied comparatively to pure betulin and betulinic acid, either as free molecules in solvent mix or in nanoformulations. There were identified their specific molecular fingerprints based on the main bands in two regions (850-1750 cm-1 and 2800-3400 cm-1). There were identified 11 specific bands, with spectral features at 1716-1735 cm-1 attributable to the ν(C=O) mode, stretching vibrations of C=O identified from 1028 to 1180 cm−1 and characteristic alkyl stretching modes at 2823-2866 cm−1 and 2922-2945 cm−1. For a semi-quantitative evaluation, the calibration curves with pure Betulin based on its ATR-FTIR spectra were obtained, and according to the equations with highest R2 (coefficient of determination) the wavelength at 2939.5 cm-1 was considered the most significant for the quantity. Accordingly, the encapsulation efficiency of all three terpenoids in nanoformulations was calculated and showed similar values (75 to 73%) of betulin entrapped in both Lipo- and NLC formulations, respectively. Meanwhile the entrapment of betulinic acid and TTs in NLC formulations had lower values, comparative ti liposomal formulations.
By the HPLC-DAD, the fingerprints and quantitation of betulin, betulinic acid and lupeol in solvent and in Lipo- and NLC-formulations as well their entrapment calculation was determined. This method was able to identify each component, including excipients (lecithin in liposomes or lipids in NLC) and quantify the concentration and entrapment efficiency of each terpenoid in nanoformulations. The entrapment values in Lipo- were superior to NLC, and ranged from 90% for AB to 68% for B. In the TTs, the major component B showed the highest entrapment comparative to AB and L, either in Lipo- and NLC-formulations. These values were compared with the ones obtained by UV spectrometry and ATR-FTIR, showing that ATR-FTIR offers a semi-quantitative evaluation which can be reliable comparative to the accurate evaluation by HPLC. Therefore, ATR-FTIR spectroscopy is recommended to be used as a faster and cheaper method for the screening and semi-quantitative evaluation of free and entrapped terpenoids in nanoformulations, easier to be used directly for screening by ATR-FTIR. This method offers also the possibility of evaluating in shorter time different recipes of nanoformulations as well their stability and bioavailability.
4. Materials and Methods
4.1. Chemicals and Reagents
Betulin and Betulinic acid (99% purity) were purchased from Roth GmbH Germany. HPLC-grade solvents Methanol, Ethanol, iso-Propanol, Acetonitrile, Formic acid, Stearic acid, Oleic acid, triethanolamine were purchased from Merck, Germany. PEG 2000, Triton X-100, Tween80, Lecithin (>98%), cholesterol were purchased from Sigma Aldrich Germany. Compritol 888ATO was provided from Gattefosse, France
4.2. Preparation of Birch Bark Extract TTs
The outer Bark of Silver birch (Betula pendula) was collected from forestry departments in Transylvania region in September 2023. The detached outer layer was dried for 24 hours at 65°C and stored in a dark desiccator. After grinding, 5 g of powder was washed 2x with petroleum ether to eliminate resins and then extracted successively with 2x100 ml mixture of iso-propanol: ethyl acetate,1:1 (v/v) during 48 hrs. at 50°C and after evaporation, re-extracted in acetonitrile. Finally, this extract was evaporated under vacuum and re-extracted in a solvent mix of ethanol: dimethyl sulfoxide (DMSO), 3:1. This stock extract (TTs) was used in further experiments.
4.3. Preliminary Evaluation of TTs by UV-Vis Spectrometry
For a semi-quantitative evaluation of the total terpenoid content in TTs, 3 successive dilutions were made in the solvent mix and the UV absorption was recorded, in the range 200-320 nm, using a spectrometer Perkin Elmer Lambda 25. In parallel two calibration curves were built using pure betulinic acid (AB) and betulin (B), respectively, dissolved in the solvent mix of ethanol: dimethyl sulfoxide (DMSO) 3:1, in a range of 2-20 mg/ml. The calibration curves and equations were used to determine the concentration of terpenoids in TTs extract, considering the triplicate measurement of UV absorption at 212 nm.
4.4. Preparation of PEGylated Liposomes Using the Ethanol Injection Method
Details about the procedure applied by Ethanol injection method [30] were reported in our previous publications [31]. Shortly, a lipid phase included 16 ml soybean lecithin 6.25% in pure ethanol with an addition of 25 mg cholesterol. The aqueous phase included 20 ml phosphate buffer 0.01M pH 6.5, 40 µl Tween-80 and 20 mg PEG2000. Under magnetic stirring at 65°C, the lipid phase was added dropwise to the aqueous phase, for min. 20 min. To remove residual ethanol, the emulsion was stirred gently for one hour. The liposomal suspension was ultrasonicated at highest amplitude, on a UP50H Compact Lab Homogenizer (Hielscher). Empty control liposomes and liposomes containing the TTs (Lipo-TTs), pure AB (Lipo-AB) and B (Lipo-B) were prepared using the same procedure, as follows. The Lipo-AB and Lipo-B and were produced following this procedure: 50 mg AB and 50 mg B respectively were dissolved in 2 ml solvent mix and added to the lipid phase, just before mixing with the aqueous phase. A volume of 2 ml extract TTs was added similarly to the lipid phase.
4.5. Preparation of NLC Formulations by Melt Emulsification
To obtain the NLC formulations, Compritol 888ATO, a standardized glycerol dibehenate mixed with stearic acid, oleic acid, Tween 80 and Triethanolamine, in a ratio 10:5:2.5:2.5 (weight ratios) was melted at 78°C as described previously using the melt emulsification procedure [31]. A dropwise addition of 20 ml hot ultrapure water phase (pH 7.2) to 2 g melted lipid mix (at 80°C) was applied under ultraturax mixing at 20000 rpm, for 15 min. The hot emulsion was ultrasonicated for 10 min at highest amplitude using the UP50H Compact Lab Homogenizer (Hielscher). The resulting suspension was kept on ice for 15 min. To obtain NLC-TTs, NLC-AB, NLC-B formulations, 50 mg AB, 50 mg B and 2 ml TTs were dissolved in ethanol: DMSO (3:1), introduced in 20 ml hot water, and added dropwise to the melted lipid mix. The final suspension had a volume of 20 ml.
4.6. Entrapment Efficiency and Size Determination PEGylated Liposomes and NLCs
To evaluate the entrapment efficiency (EE%) percentage of AB, B and TTs in each formulation (Lipo- and NLC-), 10 ml from the Lipo- or NLC- suspensions were filtered under centrifugation (Hettich Rotofix 46 Centrifuge, 4600 rpm, 30 min at 25°C) through Amicon® Ultra 15 mL Centrifugal Filter devices (Millipore) with 100K cut-off. The retentate was collected after two successive washings. After restoration of the initial volume of 10 ml, the absorption values (recorded at 212 nm by UV-VIS spectrometry) of AB, B and TTs in the retentate were determined after dissolving in a solution of 0.1% Triton X-100 in ethanol and compared to the absorptions of the initial suspensions dissolved in the same solvents. The entrapment efficiency was calculated by the formula EE% = (At-Aret/At) x 100, where At- absorption of initial suspension; Aret - absorption of retentate suspension. The sizes of all nanoformulations and the Polydispersibility Index (PDI) were also determined by laser diffraction technique using the Shimadzu SALD 2300 DLS instrument (Shimadzu, Japan) with the software Wing SALDII version 3.4.10., using a procedure, previously described [31].
4.7. Identification of TT Components by UHPLC-QTOF-ESI+-MS
This analysis was performed on a Bruker Daltonics MaXis Impact (Bruker GmbH, Bremen, Germany) device including a Thermo Scientific HPLC UltiMate 3000 system with a Dionex Ultimate quaternary pump delivery and ESI+-QTOF-MS detection, on C18 reverse-phase column (Kinetex, UPLC C18) (5µm, 4.6 x 150 mm) at 25°C, a flow rate of 0.8 ml/ min and an injection volume of 25 µl. The mobile phase was represented by a gradient of an eluent A (pure water containing 0.1% formic acid) and eluent B (Methanol: Acetonitrile: Isopropanol, 1:1:1, containing 0.1% formic acid). The gradient system consisted of 70% A (min 0), 30% A (min 4), 0% A (min 7), 30% A(min 10), 70% A(min 13), followed by 2 min isocratic elution with 70%A. The total running time was 15 min. The MS parameters were set for a mass range between 100-1000 Da. The nebulizing gas pressure was set at 2.8 bar, the drying gas flow at 12 l/min, the drying gas temperature at 300°C. During the each chromatographic run, a calibration with sodium formate was done. The control of the instrument and data processing used the specific software provided by Bruker Daltonics, namely Chromeleon, TofControl 3.2, Hystar 3.2 and Data Analysis 4.2. The identification of each component was done by Data Analysys, considering the MS spectral analysis for each component and specific fragmentation. The Extract Ion Chromatogram was also used to confirm the specific fragments for B, AB and L in the TT extract.
4.8. Fourier Transform Infrared ATR-FTIR Spectroscopy
The ATR-FTIR spectra were recorded from 3700 to 800 cm−1 (4 cm−1 resolution and 64 scans) using a Spectrum 400 spectrometer (Shimadzu, Japan). The specific fingerprints and the absorbances corresponding to each wavenumber were evaluated and processed by the OPUS 5.5 software. The samples were analyzed in triplicate as standard solutions AB, B and TTs in the solvent-mix solutions, as liquid suspensions (Lipo- and NLC complexes) and after evaporation.
4.9. Quantitative Evaluation by HPLC-DAD
Pure standards of betulin and betulinic acid were used to build a calibration curve (1-10 mg/ml), to make quantitative evaluations (details in Suppl file S1). There were used aliquots of 0.5 g in triplicate, which were mixed with a mix of ethanol:DMSO 3:1 and homogenized under sonication 15 min. After 30 minutes, the extract was filtered by Millipore Nylon membrane (0.25 μm) and injected (10 μl) in the HPLC column (Acclaim 120, 100 mm × 2.1 mm × 5 μm) of an Agilent 1200 HPLC device, with UV detection, applying a gradient of two mobile phases consisting of acetonitrile with 0.1% Formic acid (A) and water with 0.1% formic acid (B. The gradient program was: B=55 to 15% (0-4 min), B=30 (min 6) , B=55% (min 8), with flow 0.3 ml/min at 25°C. The detection was set at 210 and 280 nm. The concentrations of each component (AB and B) were calculated according to the calibration curve and expressed in mg per ml.
5. Conclusions
According to the general aims of medicinal chemistry, this study focused on the development of new bioactive molecules from natural resources, intending to find best formulations for their application in biomedicine. Based on previous studies, we developed rapid and convenient methods for the extraction of a subclass of pentacyclic triterpenoids, which offer good perspectives to be used as therapeutic drugs, either by parenteral, oral or topical administration. Considering their limitations related to hydrophilicity and bioavailability, two types of nanoformulations were obtained and characterized. PEGylated liposomes and Nanostructured Lipid Carriers were able to entrap Betulin or Betulinic acid pure standards and an organic extract from the outer birch bark, with different entrapment efficiencies. This objective was fulfilled, there were obtained nanoformulations which in which there were identified and quantified the individual components and compared with their organic solutions. The UV-VIS spectra were recorded as a preliminary investigation, The advanced UHPLC-QTOF-ESI+-MS for the identification of components, the HPLC-DAD for the quantitative evaluation and calculation of the entrapment efficiency. The ATR-FTIR spectroscopy (which, despite its inability to provide full structural information, may be used as a fast, non-destructive technique to identify specific vibrational bands which can be correlated with the quantity of targeted molecules either in organic solvents or in nanosuspensions) was found to be a reliable method, giving results positively correlated with HPLC-DAD data. Therefore, it was confirmed the potential of ATR-FTIR to realise a fast “fingerprint” of samples, a semi-quantitative evaluation, being a non-destructive, cheaper and easy to use technique. The results obtained can recommend the use of these nanoformulations, especially the liposomal ones for further investigations in vitro and in vivo which may confirm the efficacy of these terpenoids as therapeutic agents (antioxidant, antiviral, anti-inflammatory) and especially as anticancer agents.
Supplementary Materials
Suppl file S1. HPLC-DAD chromatograms for pure Standards (AB and B) at 2.5 mg/ml and TTs at two dilutions (2.5 and 1.25 mg/ml). Calibration curve of betulin (B) by HPLC-DAD recorded at 280 nm. Suppl file S2. A. ATR-FTIR spectra (850-1750 cm-1 and 2800-3600 cm-1) of pure triterpenoid standards AB and B at 2.5 mg/ml each, comparative to TT extract. The spectra were recorded in EtOH: DMSO (3:1) solvent mix, before evaporation (s) and after evaporation. B. ATR-FTIR spectra of liposomal (LIPO) suspensions entrapped with AB, B and TT, before (s) and after evaporation. C. ATR-FTIR spectra of NLC suspensions entrapped with AB, B and TT, before (s) and after evaporation. Suppl file S3. Calibration curves based on FTIR-ATR spectra of Betulinic acid (A-D) and Betulin (E-H) at four successive concentrations (2, 4, 10 and 20 mg/ml solution Ethanol: DMSO, 3:1. There were considered the main peaks identified and attributed to characteristic vibrations of triterpenoid molecules: 1028.1, 1184.3, 1373.3, 1456.3,1489.3, 1645.3, 1683.33,1716.6, 1732.1, 2866.2, 2939.5 cm-1.
Author Contributions
Conceptualization S.C.; Methodology F.F.; validation F.F. and S.M.A.; resources S.M.A. data curation S.C., F.F. and S.M.A.; writing—original draft preparation, S.C. and S.M.A.; writing—review and editing, S.C. and S.M.A.; visualization, S.C.; supervision S.C and S.M.A.; project administration S.C.; funding acquisition, S.C. All authors have read and agreed to the published version of the manuscript.
Funding
This research was funded by the Romanian National Executive Authority for Scientific Research (UEFISCDI), grant nr. PN-III-P4-PCE-2021-0378.
Institutional Review Board Statement
Not applicable.
Informed Consent Statement
Not applicable.
Acknowledgments
-.
Conflicts of Interest
The authors declare no conflicts of interest. The funder had no role in the design of the study; in the collection, analyses, or interpretation of data; in the writing of the manuscript; or in the decision to publish the results.
References
- Nistor, M.; Rugină, D.; Diaconeasa, Z.; Socaciu, C.; Socaciu, M.A. Pentacyclic Triterpenoid Phytochemicals with Anticancer Activity: Updated Studies on Mechanisms and Targeted Delivery. Int J Mol Sci 2023, 24, 12923. [Google Scholar] [CrossRef] [PubMed]
- Hordyjewska, A.; Ostapiuk, A.; Horecka, A. Betulin and betulinic acid: triterpenoids derivatives with a powerful biological potential. Phytochem Rev 2019, 18, 929–951. [Google Scholar] [CrossRef]
- Król, S.K.; Kiełbus, M.; Rivero-Muller, A.; Stepulak, A. Comprehensive review on betulin as a potent anticancer agent. BioMed Res Intl 2015, 584189. [Google Scholar] [CrossRef] [PubMed]
- Cichewicz, R.H.; Kouzi, S.A. Chemistry, biological activity, and chemotherapeutic potential of betulinic acid for the prevention and treatment of cancer and HIV infection. Med Res Rev 2004, 24, 90–114. [Google Scholar] [CrossRef]
- Furtado, N.A.J.C.; Pirson, L.; Edelberg, H.; Miranda, L.M.; Loira-Pastoriza, C.; Preat, V.; Larondelle, Y.; André, C.M. Pentacyclic Triterpene Bioavailability: An Overview of In Vitro and In Vivo Studies. Molecules 2017, 22, 400. [Google Scholar] [CrossRef] [PubMed]
- Ghante MH, Jamkhande P. G, Role of Pentacyclic Triterpenoids in Chemoprevention and Anticancer Treatment: An Overview on Targets and Underling Mechanisms, J Pharmacopuncture 2019, 22, 55–67.
- Kaps, A.; Gwiazdo´ n, P.; Chodurek, E. Nanoformulations for Delivery of Pentacyclic Triterpenoids in Anticancer Therapies. Molecules 2021, 26, 1764. [Google Scholar] [CrossRef] [PubMed]
- Liu, S.; Liu, H.; Zhang, L.; Ma, C.; Abd El-Aty, A. M. Edible pentacyclic triterpenes: A review of their sources, bioactivities, bioavailability, self-assembly behavior, and emerging applications as functional delivery vehicles. Critical Rev Food Sci Nutr 2022, 1–17. [Google Scholar] [CrossRef]
- Sohag, A.A.; Hossain, T.; Rahaman, A.; Rahman, P.; Hasan, M.S.; Das, R.C.; Khan, K. , Sikder, M.H.; Alam, M.; Uddin, J.; Rahman, H.; Islam, T.; Moon, I.S.; Hannan, A. Molecular pharmacology and therapeutic advances of the pentacyclic triterpene lupeol. Phytomedicine: Int J Phytother Phytopharmacol 2022, 99, 154012. [Google Scholar] [CrossRef]
- Gómez-Favela Mario Armando, David Ulises Santos-Ballardo, Magdalena Elizabeth Bergés-Tiznado, Dulce Libna Ambriz-Pérez, Chapter 6 - Nanoformulations applied to the delivery of terpenes, Editor(s): J. ABsilio Heredia, Erick P. Gutiérrez-Grijalva, Angel Licea-Claverie, Janet Alejandra Gutierrez-Uribe, Jayanta Kumar Patra, In Nanotechnology in Biomedicine, Phytochemical Nanodelivery Systems as Potential Biopharmaceuticals, Elsevier, 2023, 221-256, ISBN 9780323903905. [CrossRef]
- Bag, B. G.; Majumdar, R. Self-assembly of Renewable Nano-sized Triterpenoids. Chem Record 2017, 17, 841–873. [Google Scholar] [CrossRef]
- Saneja, A.; Arora, D.; Kumar, R.; Dubey, R.D.; Panda, A.K.; Gupta, P.N. Therapeutic applications of betulinic acid nanoformulations. Ann NY Acad Sci 2018, 1421, 5–18. [Google Scholar] [CrossRef]
- Mierina, I.; Vilskersts, R.; Turks, M. Delivery Systems for Birch-Bark Triterpenoids and their Derivatives in Anticancer Research. Curr Med Chem 2020, 27, 1308–1336. [Google Scholar] [CrossRef] [PubMed]
- Chen, X.; Lu, S.; Gong, F.; Sui, X.; Liu, T.; Wang, T. Research on the synthesis of nanoparticles of betulinic acid and their targeting antitumor activity. J Biomed Mater Res 2022, 110, 1789–1795. [Google Scholar] [CrossRef]
- Cinta Pinzaru, S.; Dehelean, C.; Soica, C.; Culea, M.; Borcan, F. Evaluation and differentiation of the Betulaceae birch Bark species and their bioactive triterpene content using analytical FT-vibrational spectroscopy and GC-MS. Chem Central J 2012, 6, 67. [Google Scholar] [CrossRef]
- Mishra, V.; Bansal, K.K.; Verma, A.; Yadav, N.; Thakur, S.; Sudhakar, K.; Rosenholm, J.M. Solid Lipid Nanoparticles: Emerging Colloidal Nano Drug Delivery Systems. Pharmaceutics 2018, 10, 191. [Google Scholar] [CrossRef] [PubMed]
- Müller, R.H.; Alexiev, U.; Sinambela, P.; Keck, C.M. Nanostructured Lipid Carriers (NLC): The Second Generation of Solid Lipid Nanoparticles. In Percutaneous Penetration Enhancers Chemical Methods in Penetration Enhancement; Springer: Berlin/Heidelberg, Germany, 2016; pp. 161–185. [Google Scholar]
- Dhiman, N.; Awasthi, R.; Sharma, B.; Kharkwal, H.; Kulkarni, G.T. Lipid Nanoparticles as Carriers for Bioactive Delivery. Frontiers in Chemistry, 2021, 9, DOI–10.3389. [Google Scholar] [CrossRef] [PubMed]
- Muntean, P.; Socaciu, C.; Socaciu, M. Lipid nanostructured particles as emerging carriers for targeted delivery of bioactive molecules: applications in food and biomedical sciences (an overview). Bull UASVM Food Sci Technol 2020, 77, 37–46. [Google Scholar] [CrossRef] [PubMed]
- Khosa, A.; Reddi, S.; Saha, R.N. Nanostructured lipid carriers for site-specific drug delivery. Biomed Pharmacother 2018, 103, 598–613. [Google Scholar] [CrossRef]
- Kim, N.Y.; Miao, Y.; Dong, Y.L.; Young, H.H.; Young, C.K.; Sang, H.S.; Seung, H.K. Rapid Determination of Betulin in Betula Platyphylla Outer Bark Using Near-Infrared Spectroscopy. Anal Lett 2013, 46, 1289–1298. [Google Scholar] [CrossRef]
- Fǎlǎmaş, S.; Cîntǎ Pînzaru, S.; Dehelean, C.A. , Peev, C. I.; Soica C. Betulin and its natural resource as potential anticancer drug candidate seen by FT-Raman and FT-IR spectroscopy, J Raman Spectroscopy 2011, 42, 97–107. [Google Scholar]
- Biswasroy, P.; Pradhan, D.; Pradhan, DK.; Ghosh, G.; Rath, G. Development of Betulin-Loaded Nanostructured Lipid Carriers for the Management of Imiquimod-Induced Psoriasis. AAPS PharmSciTech 2024, 25, 57. [Google Scholar] [CrossRef] [PubMed]
- Pop, O.L.; Vodnar, D.C.; Socaciu, C. Encapsulation field polymers: FTIR characterization. Encyclopedia of Biomedical Polymers and Polymeric Biomaterials, (ed.Munmaya Mishra ) in Handbook Of Encapsulation And Controlled Release,CRC Press, Taylor & Francis, Taylor & Francis, New York, USA. 2015. Pag. 617-639 ISBN 9781439898796. [CrossRef]
- Finlayson, D. , Rinaldi C.; ABker, M.J. Is Infrared Spectroscopy Ready for the Clinic? Anal Chem 2019, 91, 19–12117. [Google Scholar] [CrossRef] [PubMed]
- Bunaciu, A.A.; Aboul-Enein, H.Y.; Fleschin, S. Recent Applications of Fourier Transform Infrared Spectrophotometry in Herbal Medicine Analysis. Appl Spectroscopy Rev 2011, 46, 251–260. [Google Scholar] [CrossRef]
- Popa, R.M.; Fetea, F.; Socaciu, C. ; Socaciu C. ATR-FTIR-MIR Spectrometry and Pattern Recognition of Bioactive Volatiles in Oily versus Microencapsulated Food Supplements: Authenticity, Quality, and Stability. Molecules 2021, 26, 4837. [Google Scholar]
- Kosyakov, D.S.; Ul’yanovskii, N.V.; Falev, D.I. Determination of triterpenoids from birch Bark by liquid chromatography-tandem mass spectrometry. J Anal Chem 2014, 69, 1264–1269. [Google Scholar] [CrossRef]
- Falev, DI.; Ul'yanovskii, NV.; Ovchinnikov, DV.; Faleva, A.V.; Kosyakov, D.S. Screening and semi-quantitative determination of pentacyclic triterpenoids in plants by liquid chromatography-tandem mass spectrometry in precursor ion scan mode. Phytochem Anal 2021, 32, 252–261. [Google Scholar] [CrossRef]
- Fan, M.; Xu, S.; Xia, S. Preparation of salidroside nano-liposomes by ethanol injection method and in vitro release study. Eur Food Res Technol 2008, 227, 167–174. [Google Scholar] [CrossRef]
- Rugină, D.; Socaciu, M.A.; Nistor, M.; Diaconeasa, Z.; Cenariu, M.; Tăbăran, F.; Socaciu, C. Liposomal and nanostructured lipid nano formulations of a pentacyclic triterpenoid birch Bark extract: structural charac-terization and in vitro effects on Melanoma B16-F10 and Walker 256 tumor cells apoptosis. Pharmaceuticals accepted. 2024. [Google Scholar] [CrossRef]
- Holonec, L.; Ranga, F.; Crainic, D.; Truţa, A. ; Socaciu, C*. Evaluation of Betulin and Betulinic Acid Content in Birch Bark from Different Forestry Areas of Western Carpathians. Not Bot Horti Agrobo 2012, 40, 99–105. [Google Scholar]
- Demets, O.V.; Takibayeva, A.T.; Kassenov, R.Z.; Aliyeva, M.R. Methods of Betulin Extraction from Birch Bark. Molecules 2022, 27, 3621. [Google Scholar] [CrossRef] [PubMed]
- Takibayeva, A.T.; ZhumaAByeva, G.K.; ABkiABev, A.A.; Demets, O.V.; Lyapunova, M.V.; Mamaeva, E.A.; Yerkassov, R.S.; Kassenov, R.Z.; Ibrayev, M.K. Methods of Analysis and Identification of Betulin and Its Derivatives. Molecules 2023, 28, 5946. [Google Scholar] [CrossRef] [PubMed]
- Cao, D.; Zhao, G.; Yan, W. Solubilities of Betulin in Fourteen Organic Solvents at Different Temperatures. J. Chem. Eng. Data 2007, 52, 1366–1368. [Google Scholar] [CrossRef]
- Socaciu, M.; Diaconeasa, Z.; Socaciu, C. Simple and fast procedure to incorporate Doxorubicine in small unilamellar liposomes: Effects on liposome size and zeta potential. Studia UBB Chemia LXIV 2019, 3, 181–192. [Google Scholar] [CrossRef]
- Liu, Y.; Gao, D.; Zhang, X.; Liu, Z.; Dai, K.; Ji, B.; Wang, Q.; Luo, L. Antitumor drug effect of betulinic acid mediated by polyethylene glycol modified liposomes. Materials Sci Eng C 2016, 64, 124–132. [Google Scholar] [CrossRef]
- Socaciu, C.; Fetea, F.; Ranga, F.; Bunea, A.; Dulf, F.; Socaci, S.; Pintea, A. Attenuated Total Reflectance-Fourier Transform Infrared Spectroscopy (ATR-FTIR) Coupled with Chemometrics, to Control the Botanical Authenticity and Quality of Cold-Pressed Functional Oils Commercialized in Romania, Appl Sci 2020, 10, 8695. [CrossRef]
- Junaedi, E.C.; Lestari, K.; Muchtaridi, M. Infrared spectroscopy technique for quantification of compounds in plant-based medicine and supplement. J Adv Pharm Technol Res 2021, 12, 1–7. [Google Scholar] [CrossRef] [PubMed]
- Van Haaren, C.; De Bock, M.; Kazarian, S.G. Advances in ATR-FTIR Spectroscopic Imaging for the Analysis of Tablet Dissolution and Drug Release. Molecules 2023, 28, 4705. [Google Scholar] [CrossRef] [PubMed]
Figure 1.
Most representative pentacyclic lupane-type triterpenoids: structure, molecular weight [MW] and maximal UV absorption.
Figure 1.
Most representative pentacyclic lupane-type triterpenoids: structure, molecular weight [MW] and maximal UV absorption.
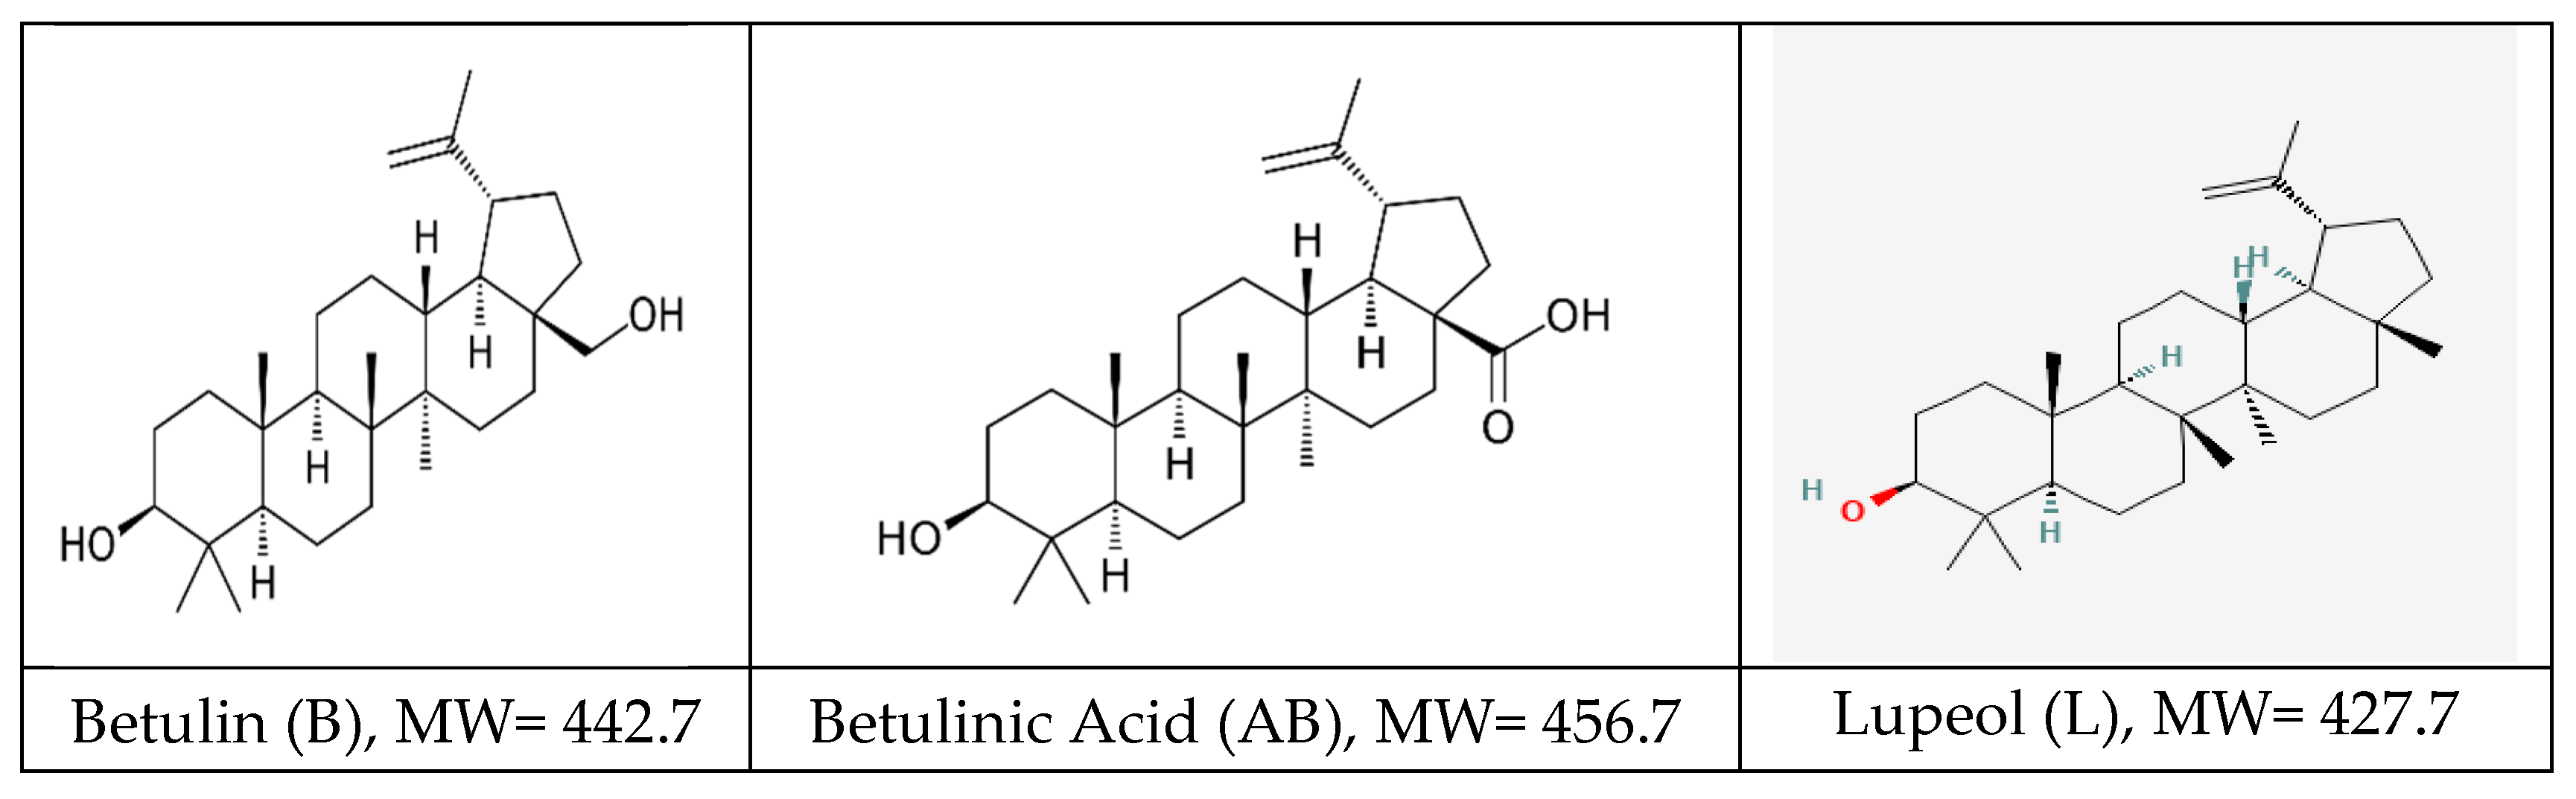
Figure 2.
The LC-MS chromatogram of the initial raw TTs extract (A) and of fraction F2 collected between 9.5-11 min and used a a standardized TTs in further experiments (B).
Figure 2.
The LC-MS chromatogram of the initial raw TTs extract (A) and of fraction F2 collected between 9.5-11 min and used a a standardized TTs in further experiments (B).
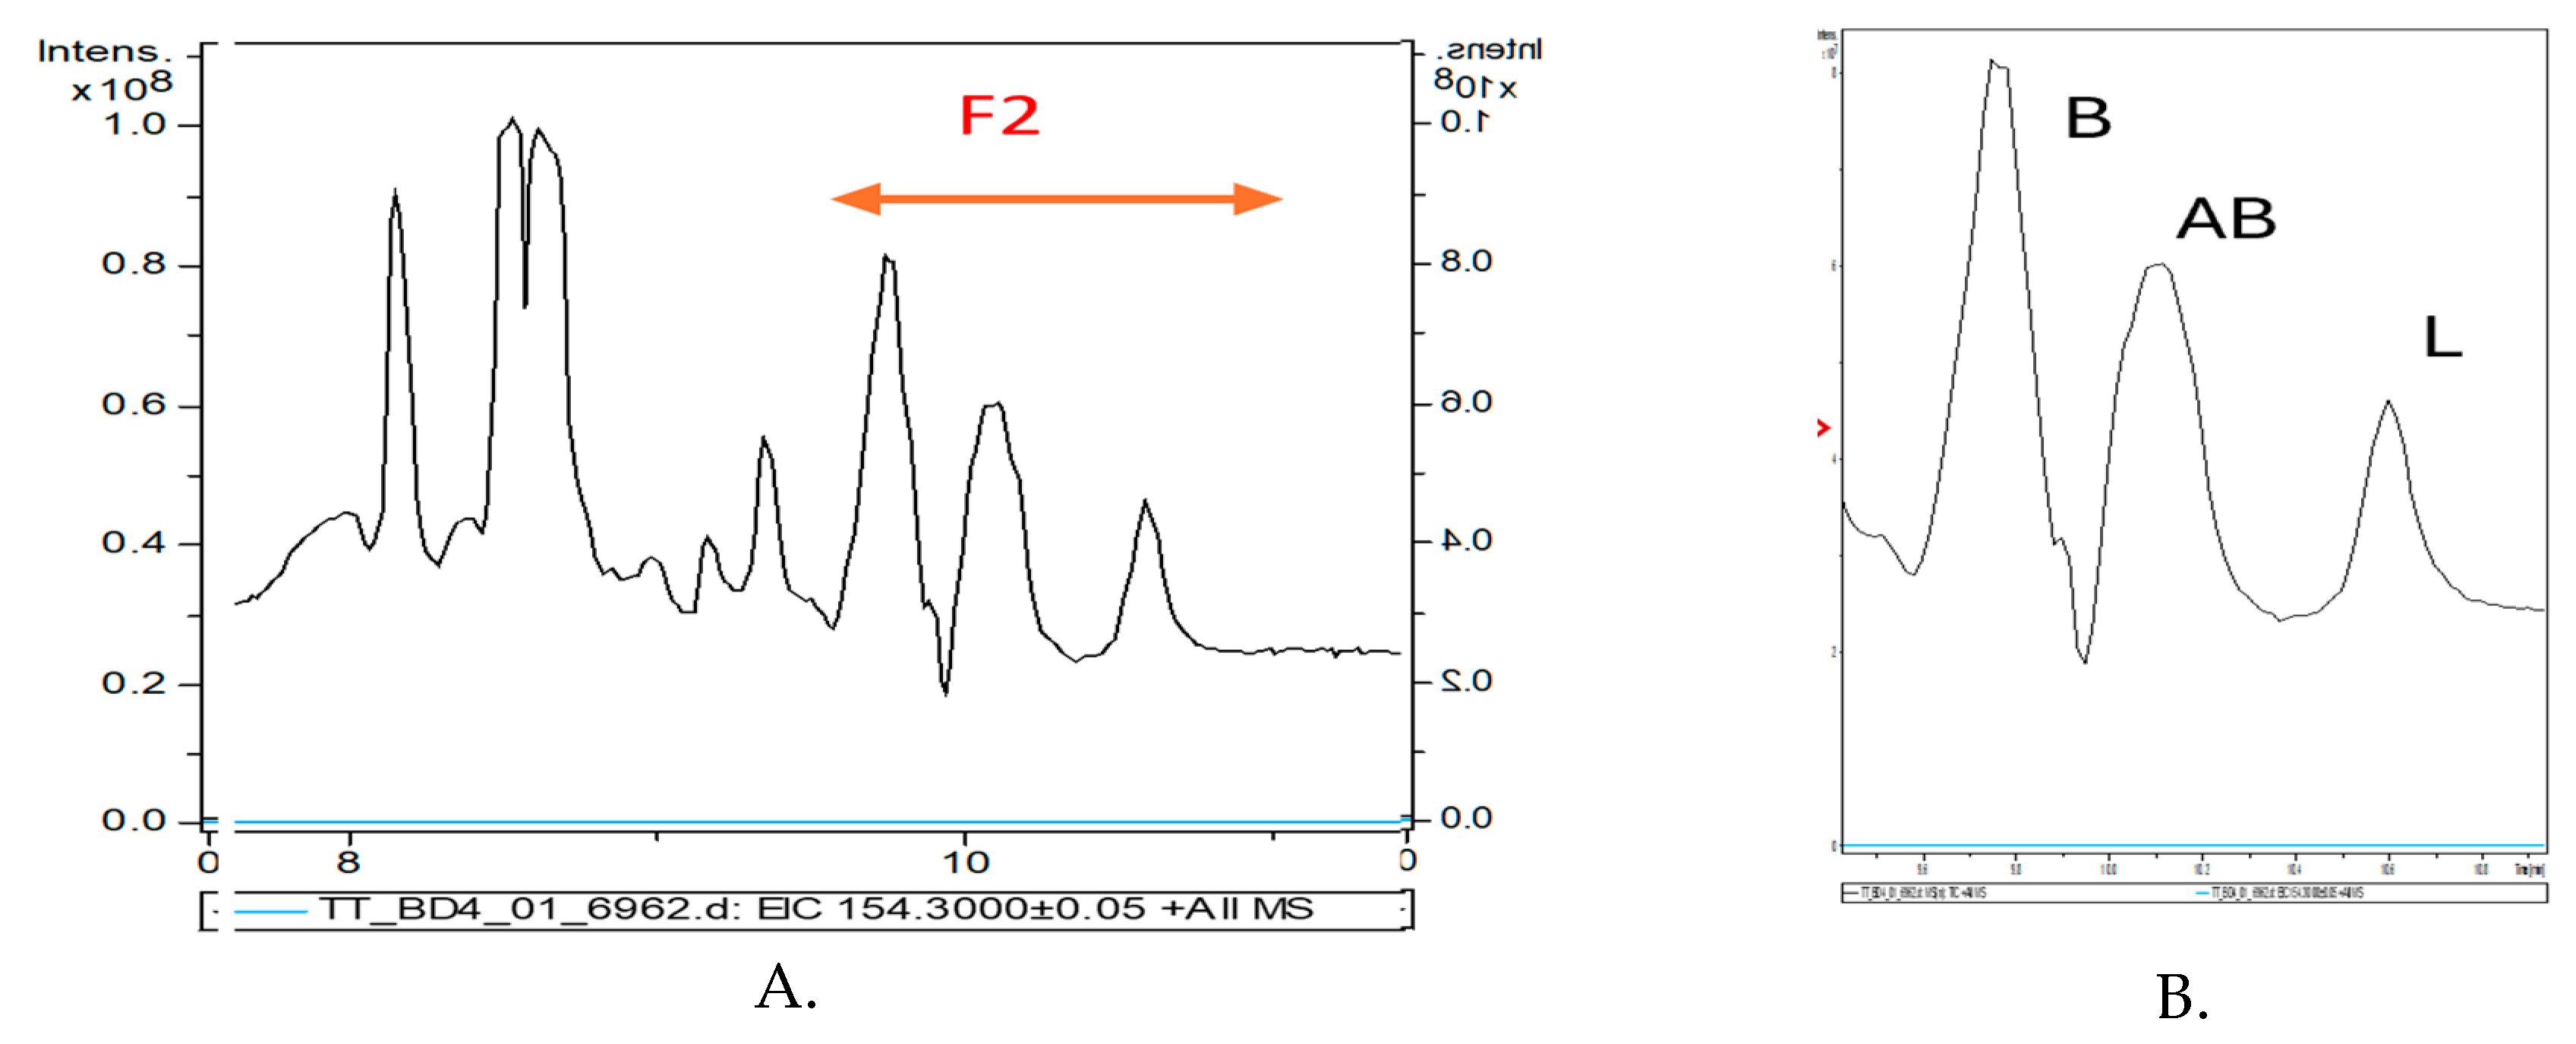
Figure 3.
Identification of the three components of the TTs extract (B, AB and L) using EIC and the specific MS fragments.
Figure 3.
Identification of the three components of the TTs extract (B, AB and L) using EIC and the specific MS fragments.
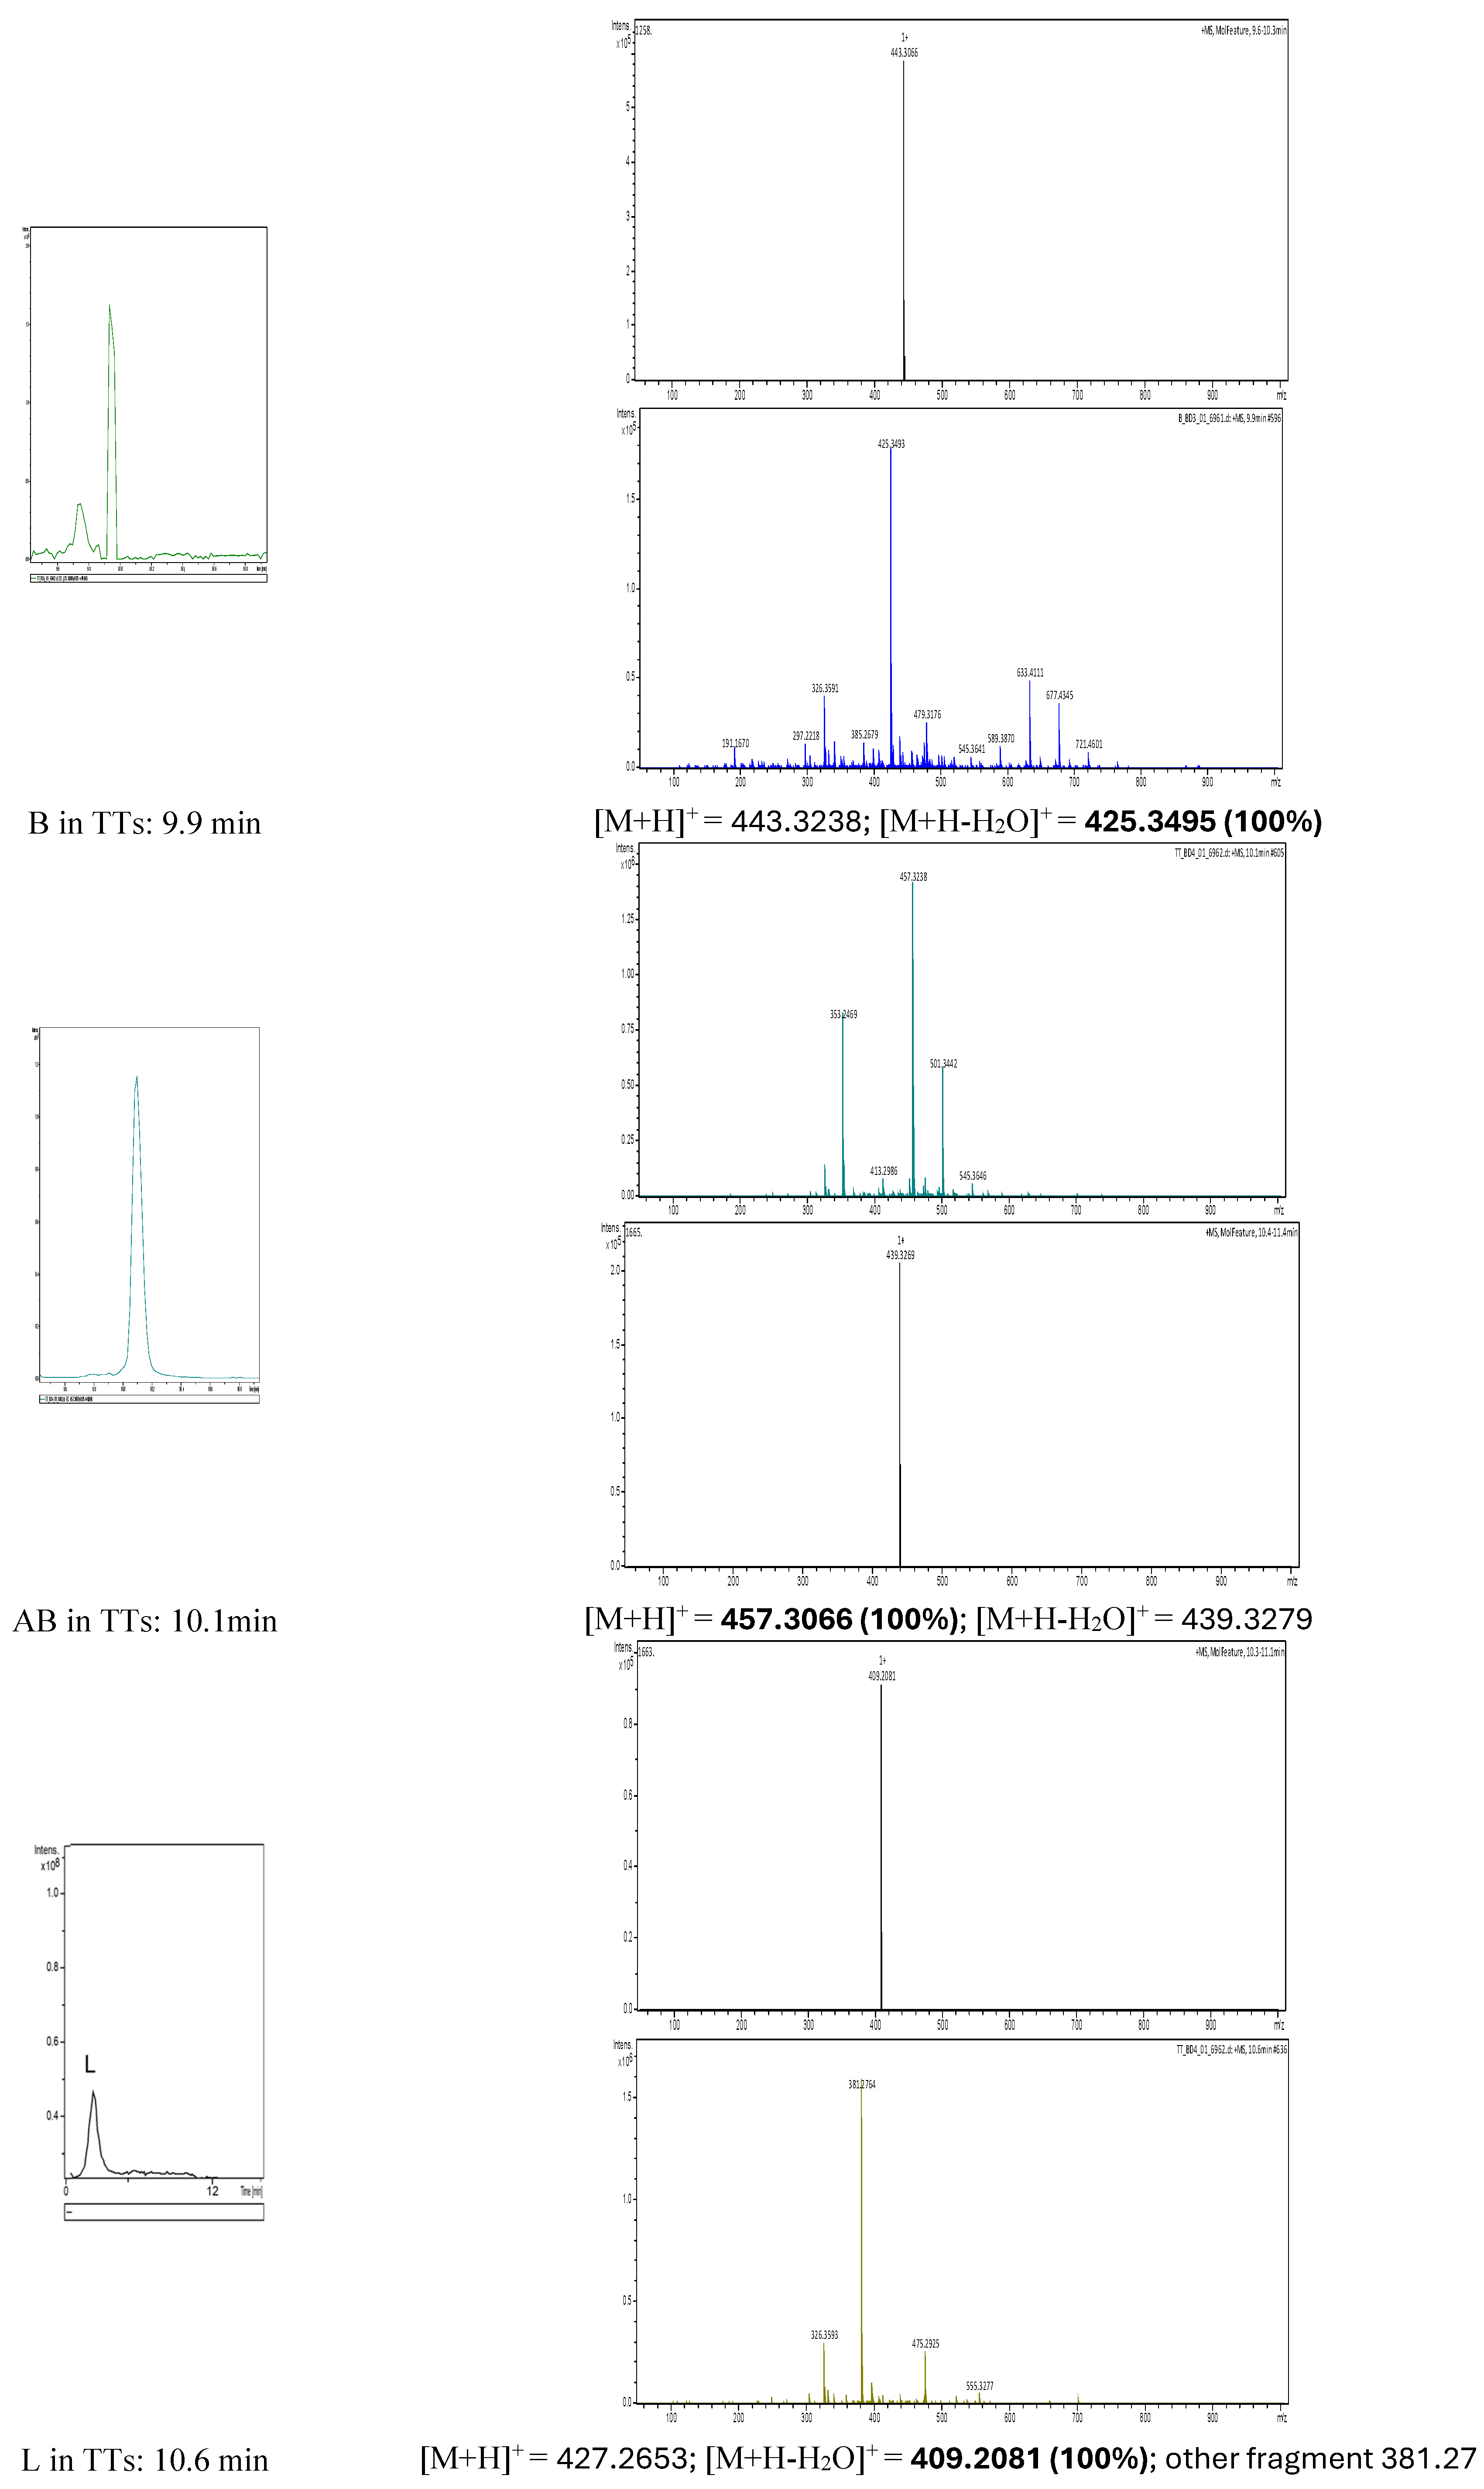
Figure 5.
The ATR-FTIR superposed fingerprints of AB and B comparative to TT extract, after evaporation on the diamond cell. The spectra were recorded in region 850-1750 cm-1 (A) and 2800-3400 cm-1 (B).
Figure 5.
The ATR-FTIR superposed fingerprints of AB and B comparative to TT extract, after evaporation on the diamond cell. The spectra were recorded in region 850-1750 cm-1 (A) and 2800-3400 cm-1 (B).
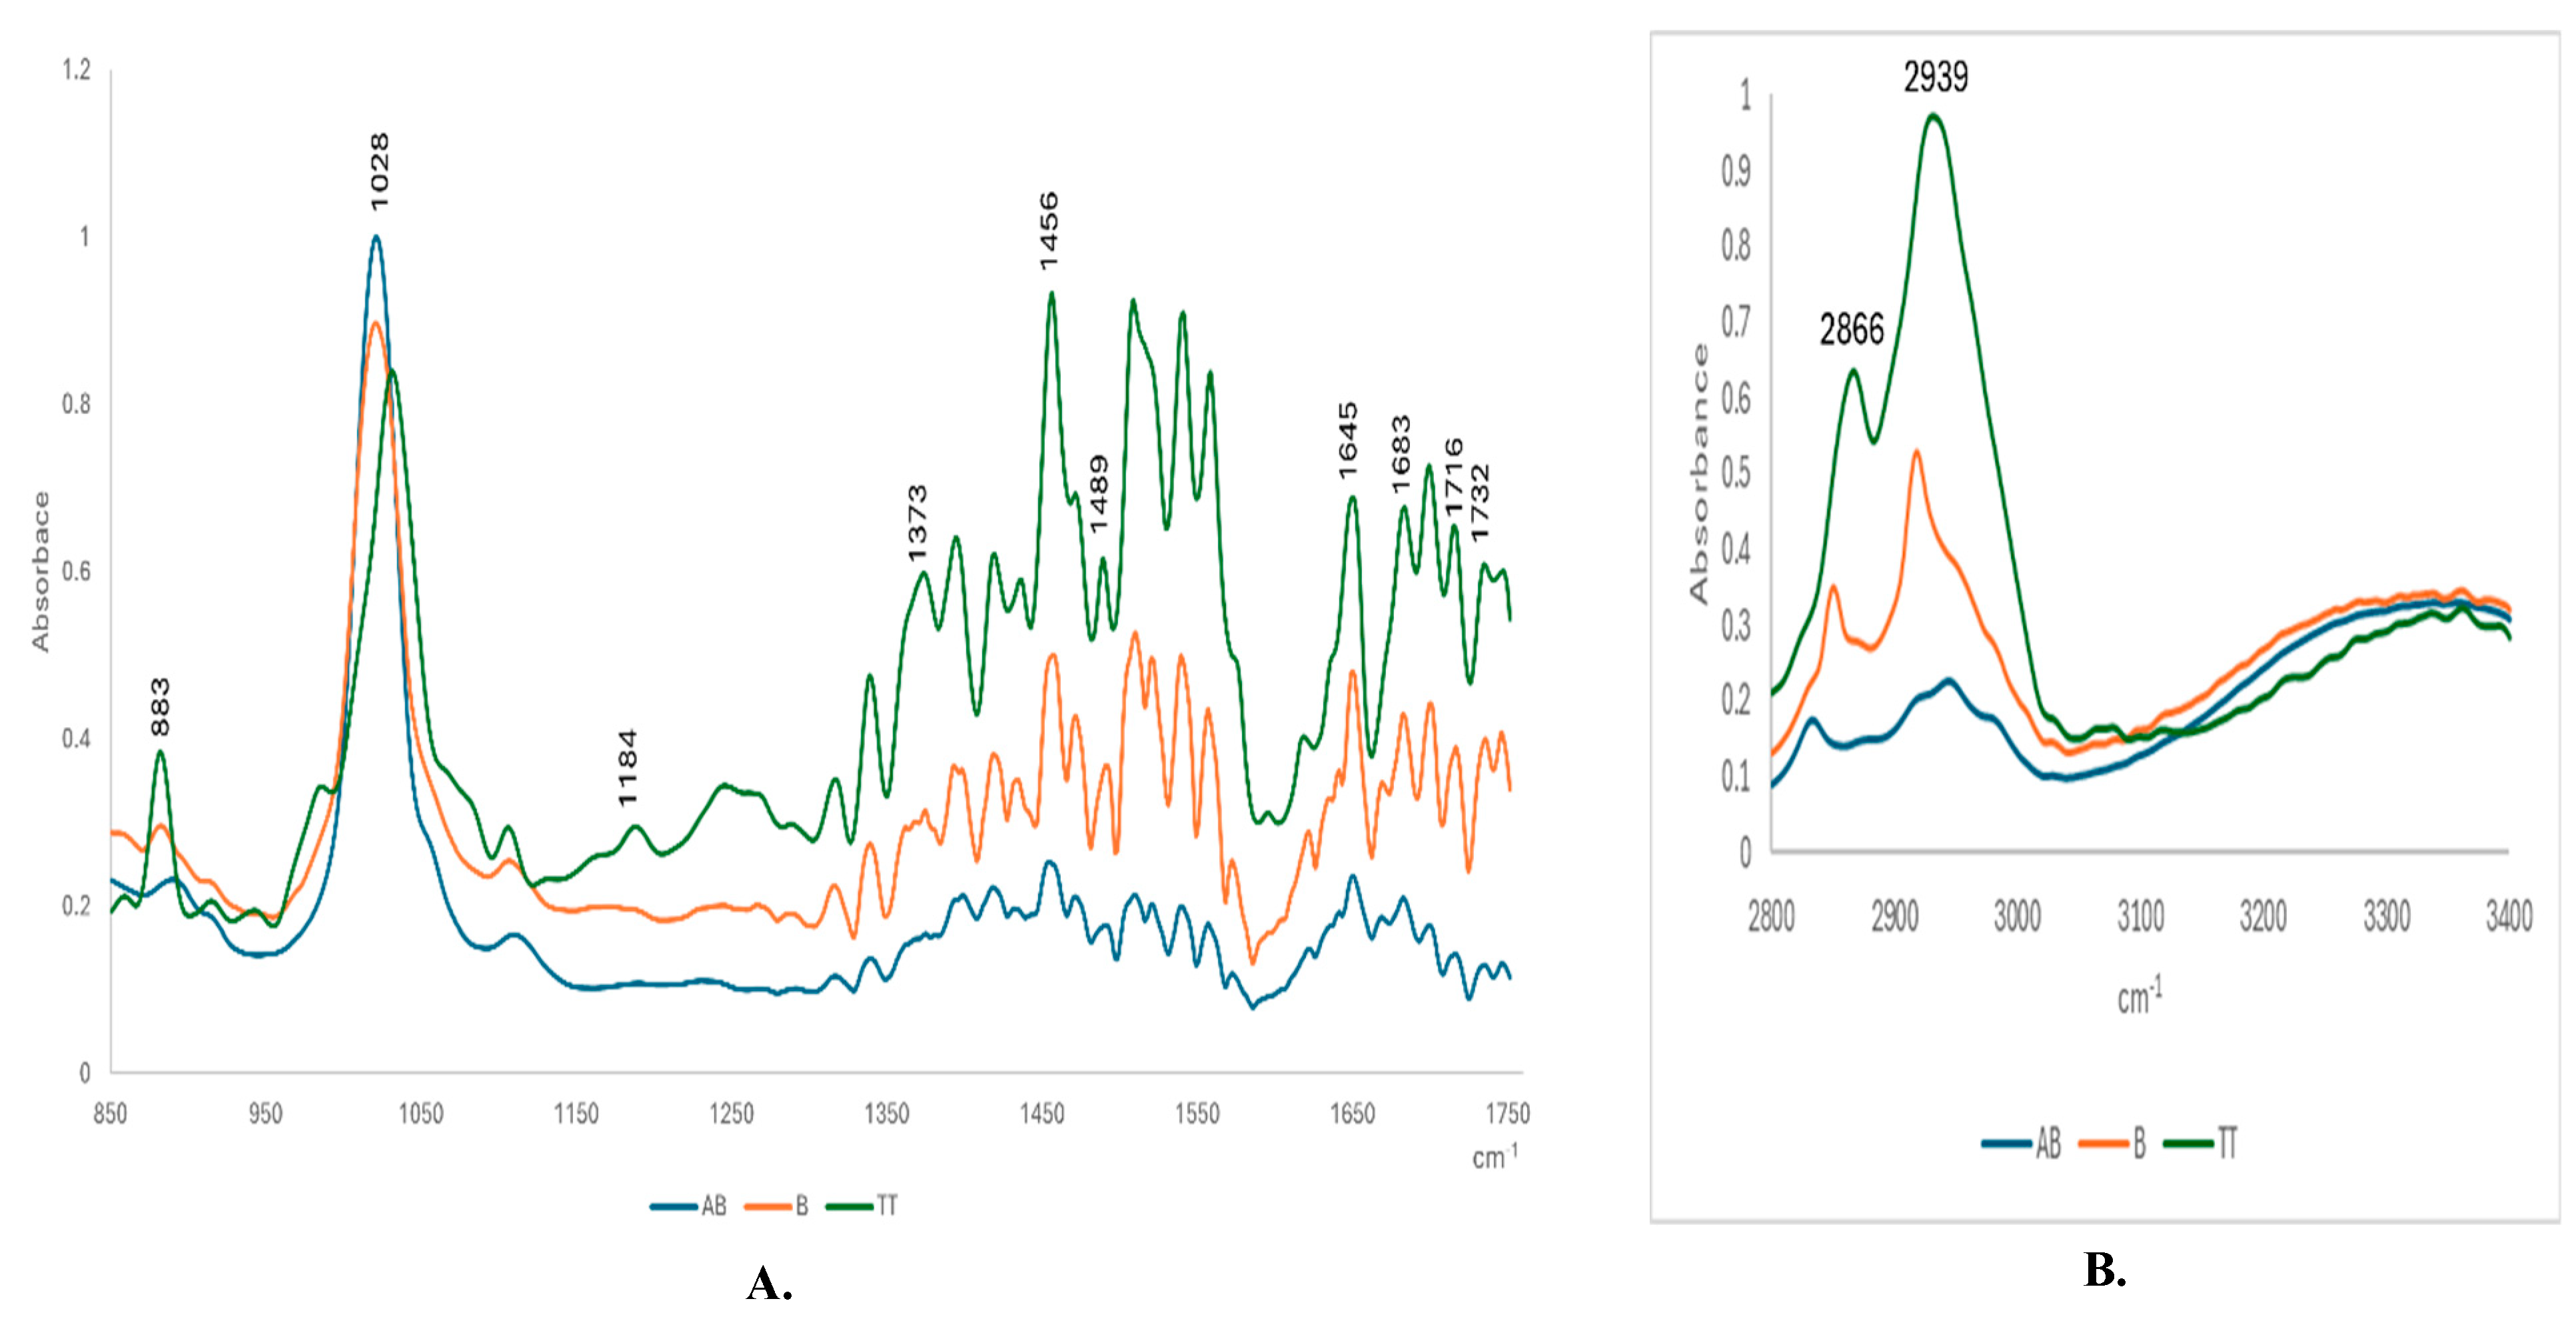
Figure 6.
Dose-absorbance curves recorded for four dilutions of TTs in EtOH:DMSO (3:1) at 11 wavenumbers, as mentioned in the legend. Dilution 4 = stock TTs diluted 2.5x with EtOH:DMSO (3:1). Dilutions 3, 2, 1 = succesive dilutions of 4 (1.5, 2 and 4 times).
Figure 6.
Dose-absorbance curves recorded for four dilutions of TTs in EtOH:DMSO (3:1) at 11 wavenumbers, as mentioned in the legend. Dilution 4 = stock TTs diluted 2.5x with EtOH:DMSO (3:1). Dilutions 3, 2, 1 = succesive dilutions of 4 (1.5, 2 and 4 times).
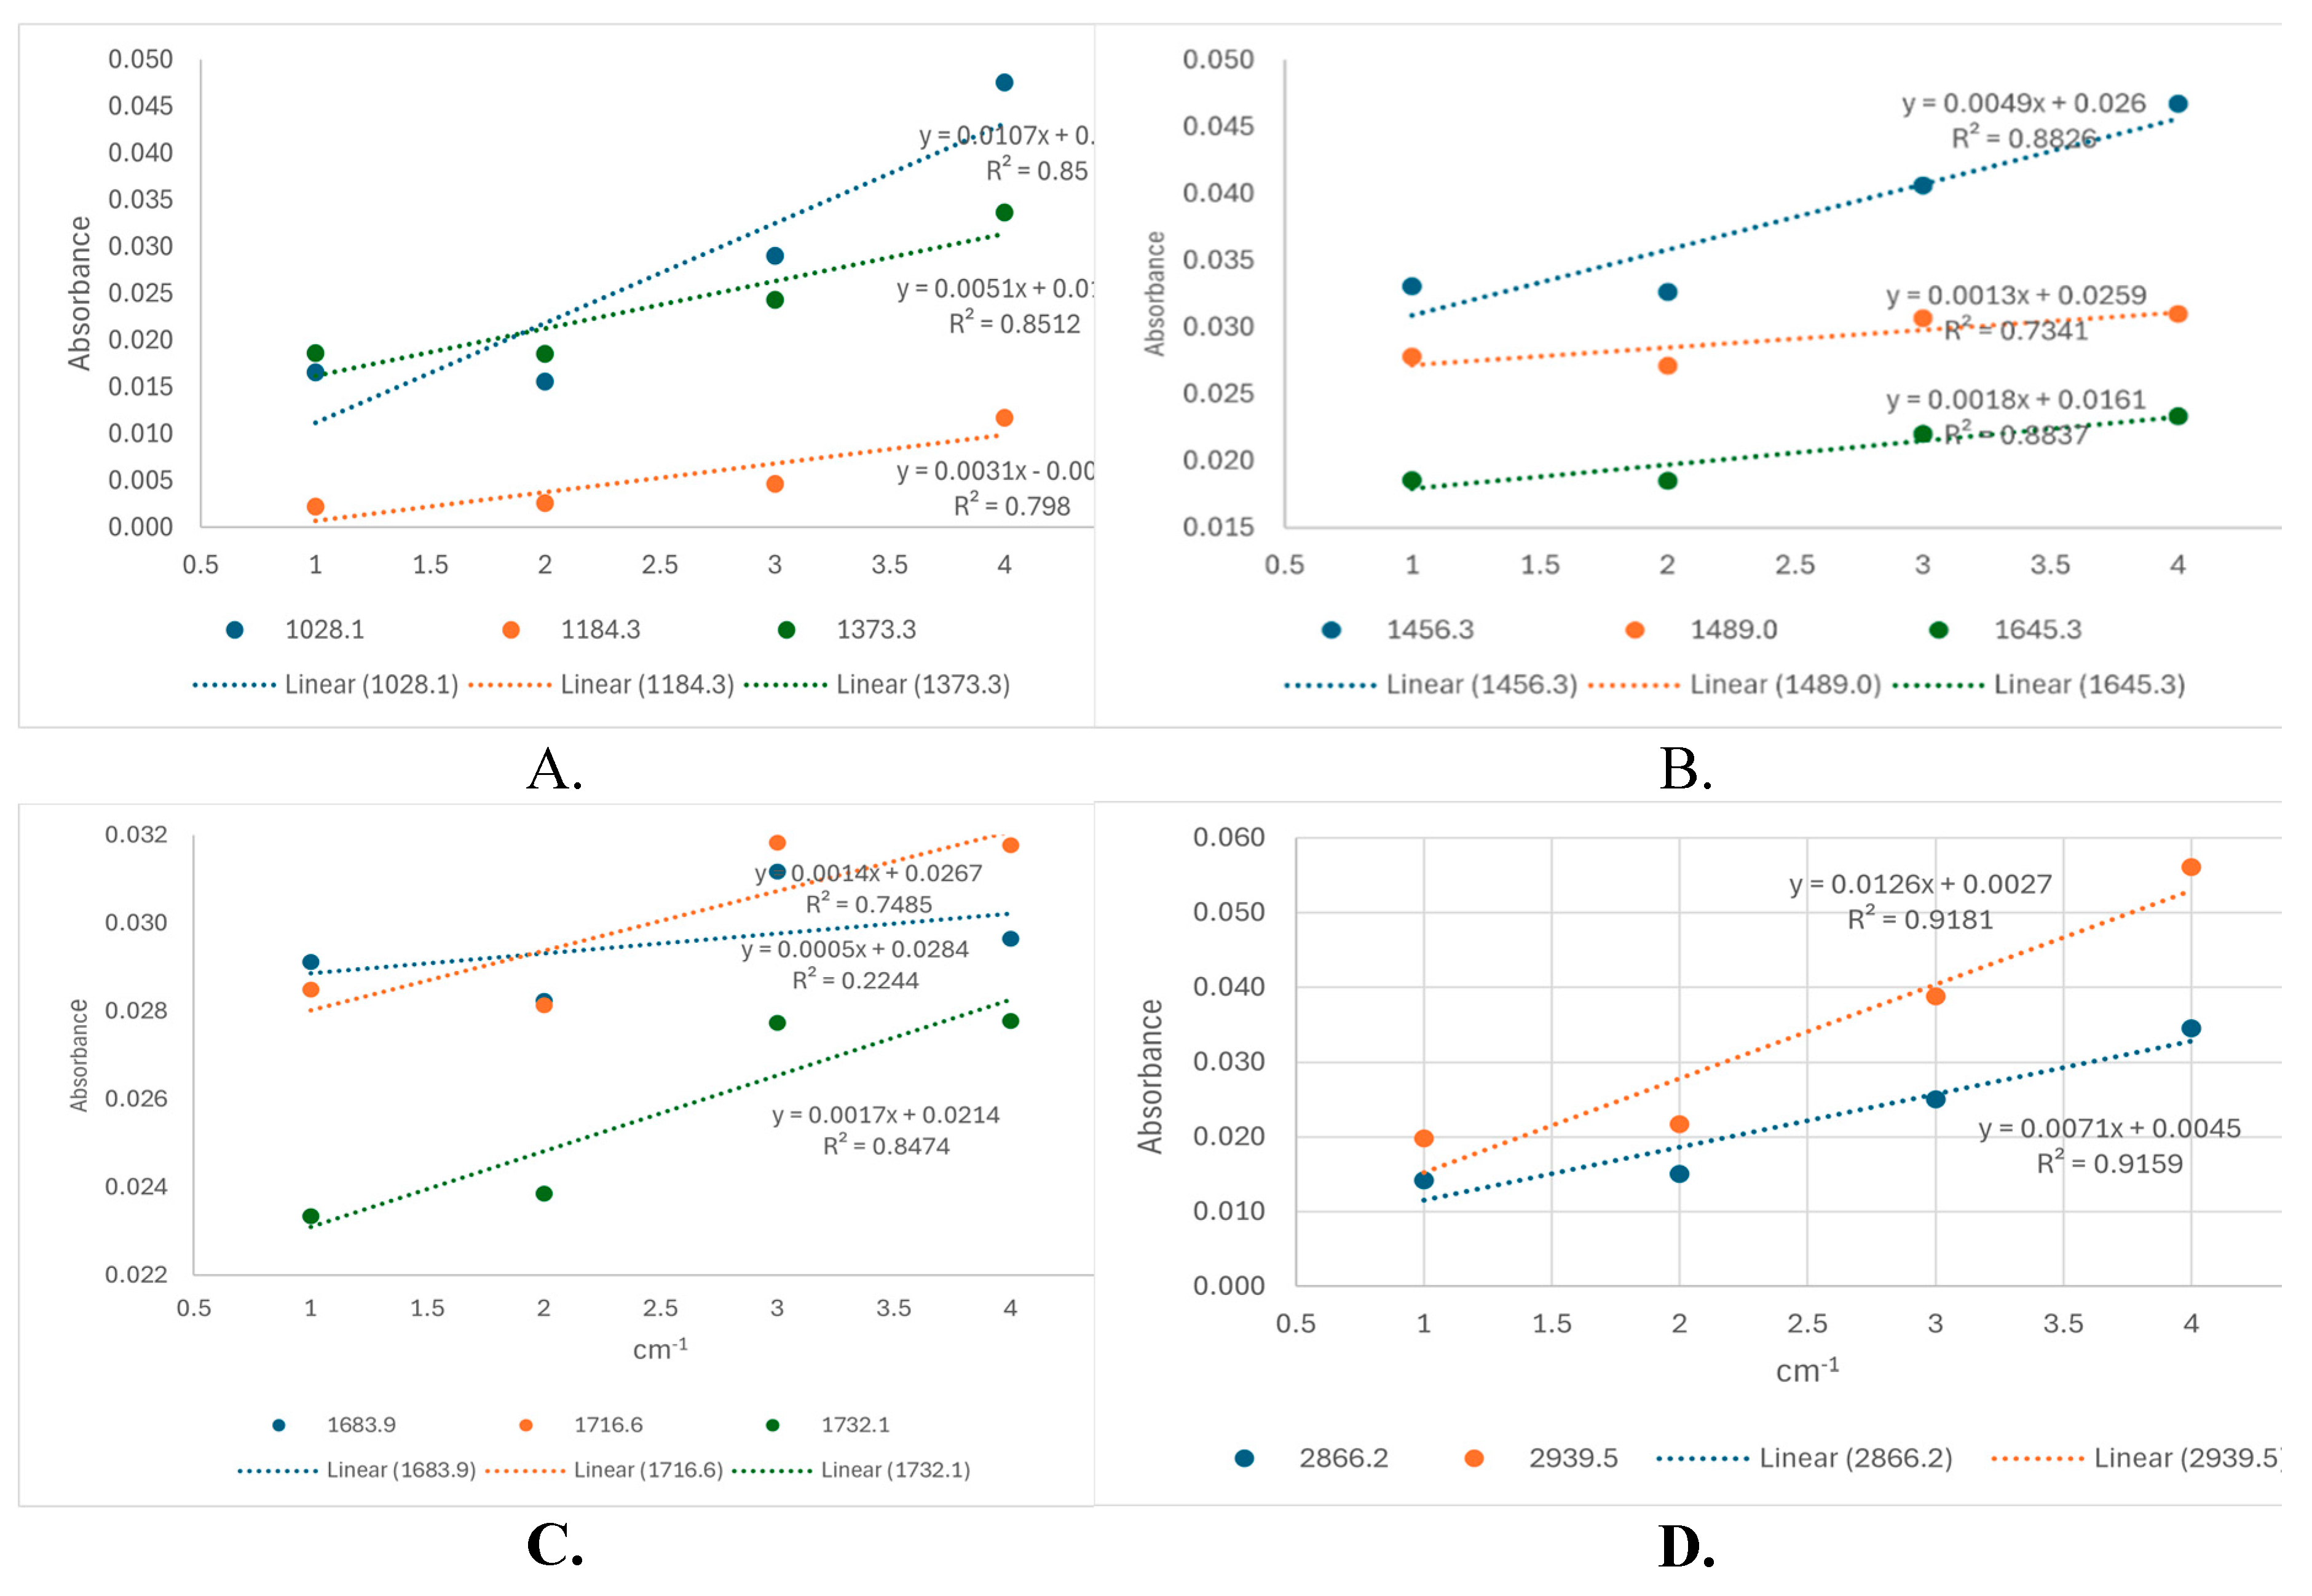
Figure 7.
The EE% values calculated from the ATR-FTIR spectra at 2939.5 cm-1, considering the absorbance of the entrapped ABs, Bs and TTs in Lipo- and NLC-formulations with substracted values from controls (C ).
Figure 7.
The EE% values calculated from the ATR-FTIR spectra at 2939.5 cm-1, considering the absorbance of the entrapped ABs, Bs and TTs in Lipo- and NLC-formulations with substracted values from controls (C ).
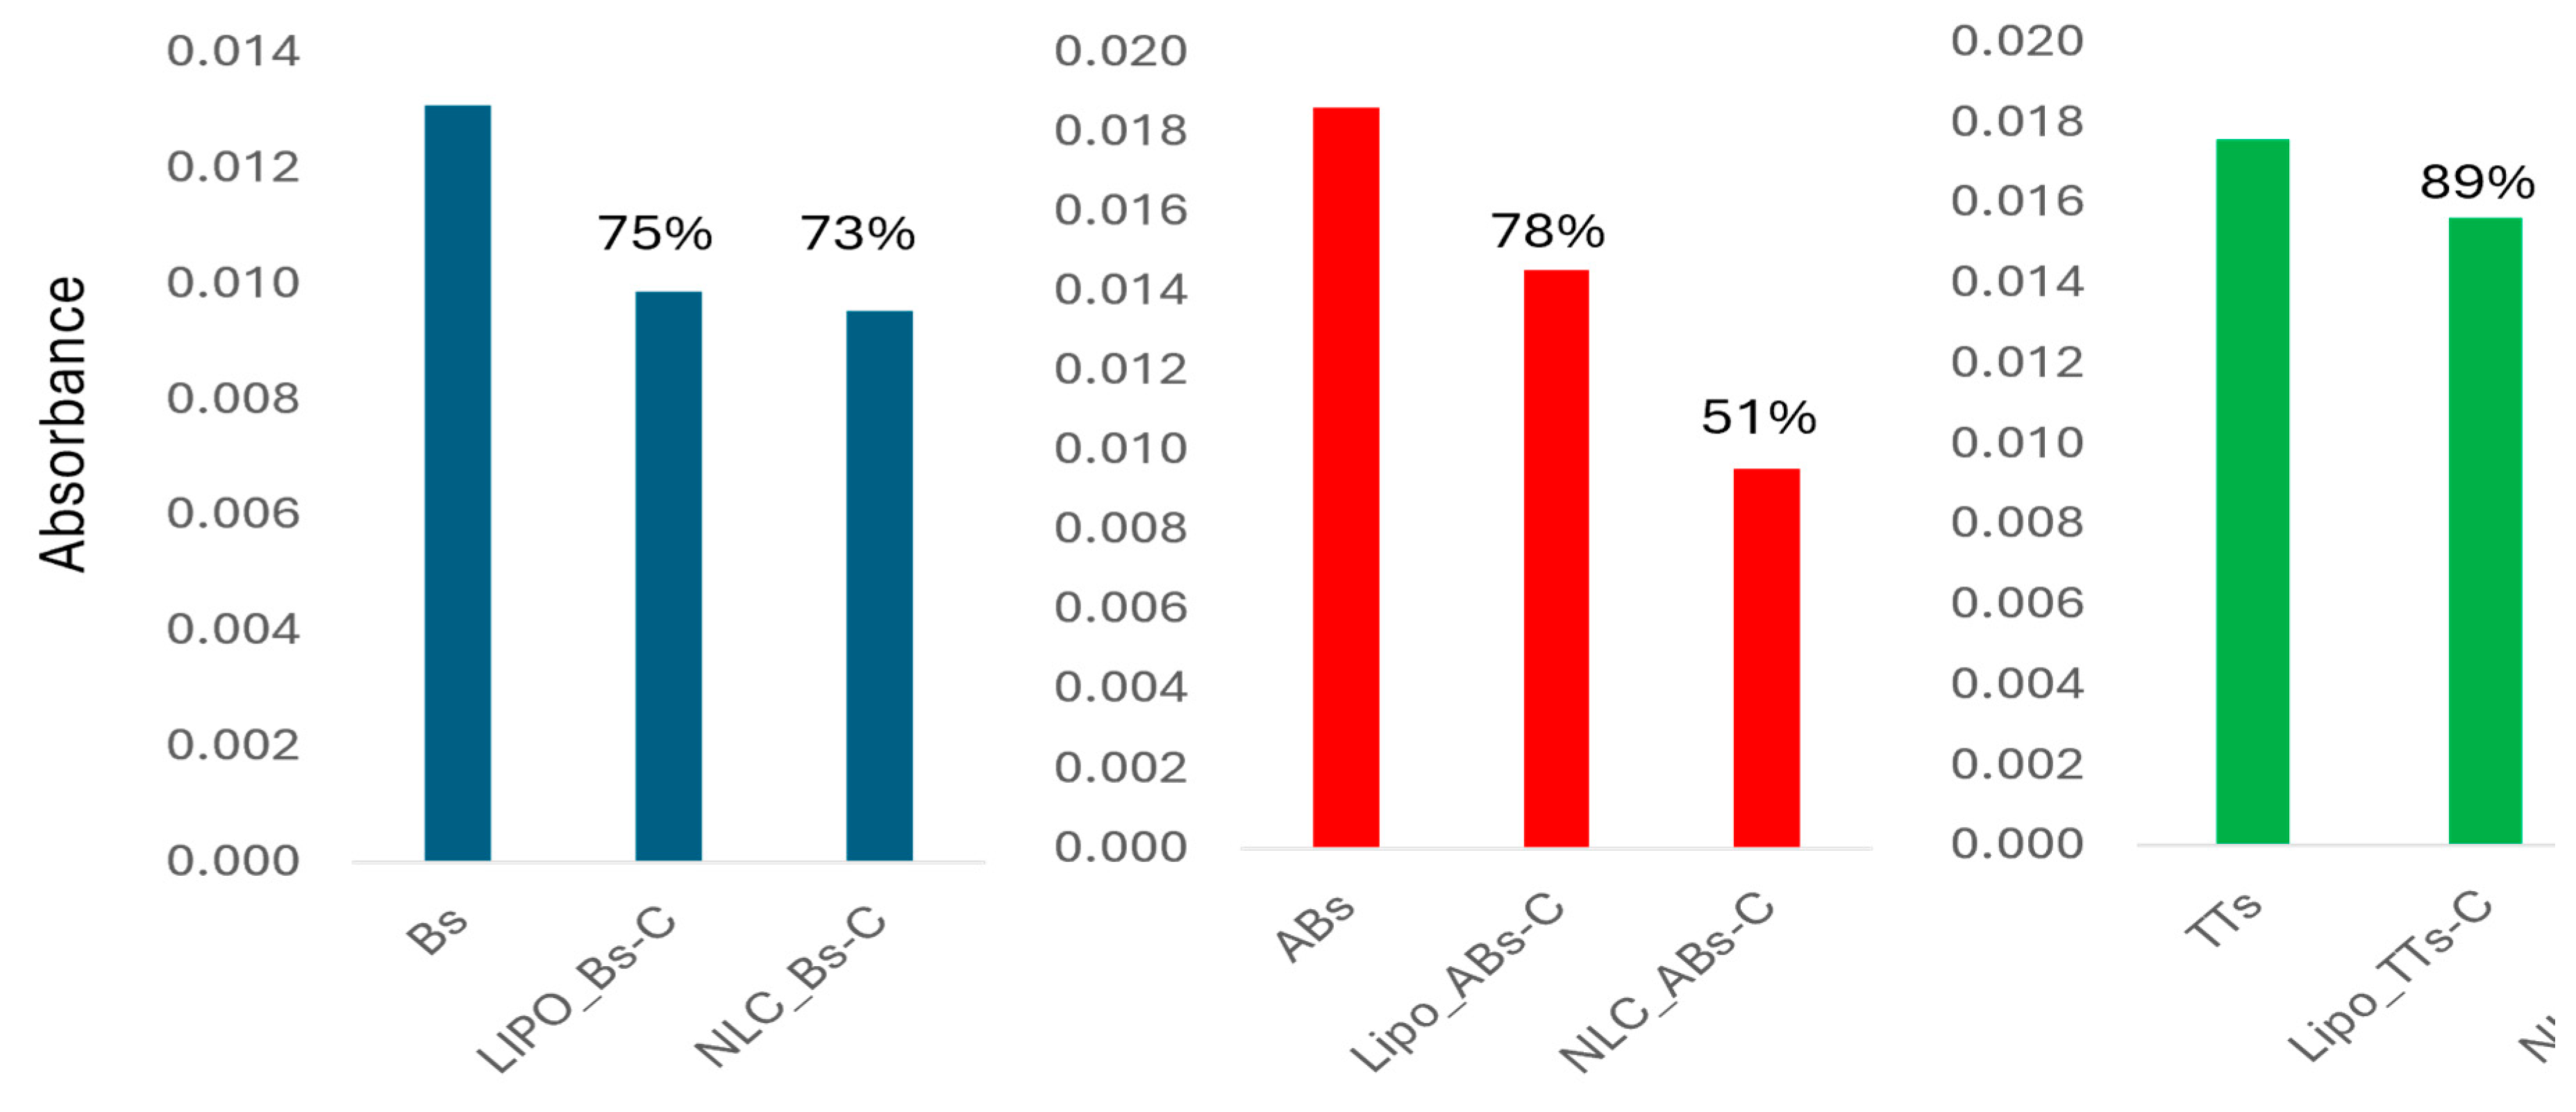
Figure 8.
A. Comparative, superposed HPLC-DAD chromatograms of Lipo-nanoformulations after entrappment of AB, B and TT in Liposomes, comparative to empty Lipo (C). B. Superposed HPLC-DAD chromatograms of NLC formulations after entrappment of AB, B and TT in NLC, comparative to empty NLC (C).
Figure 8.
A. Comparative, superposed HPLC-DAD chromatograms of Lipo-nanoformulations after entrappment of AB, B and TT in Liposomes, comparative to empty Lipo (C). B. Superposed HPLC-DAD chromatograms of NLC formulations after entrappment of AB, B and TT in NLC, comparative to empty NLC (C).
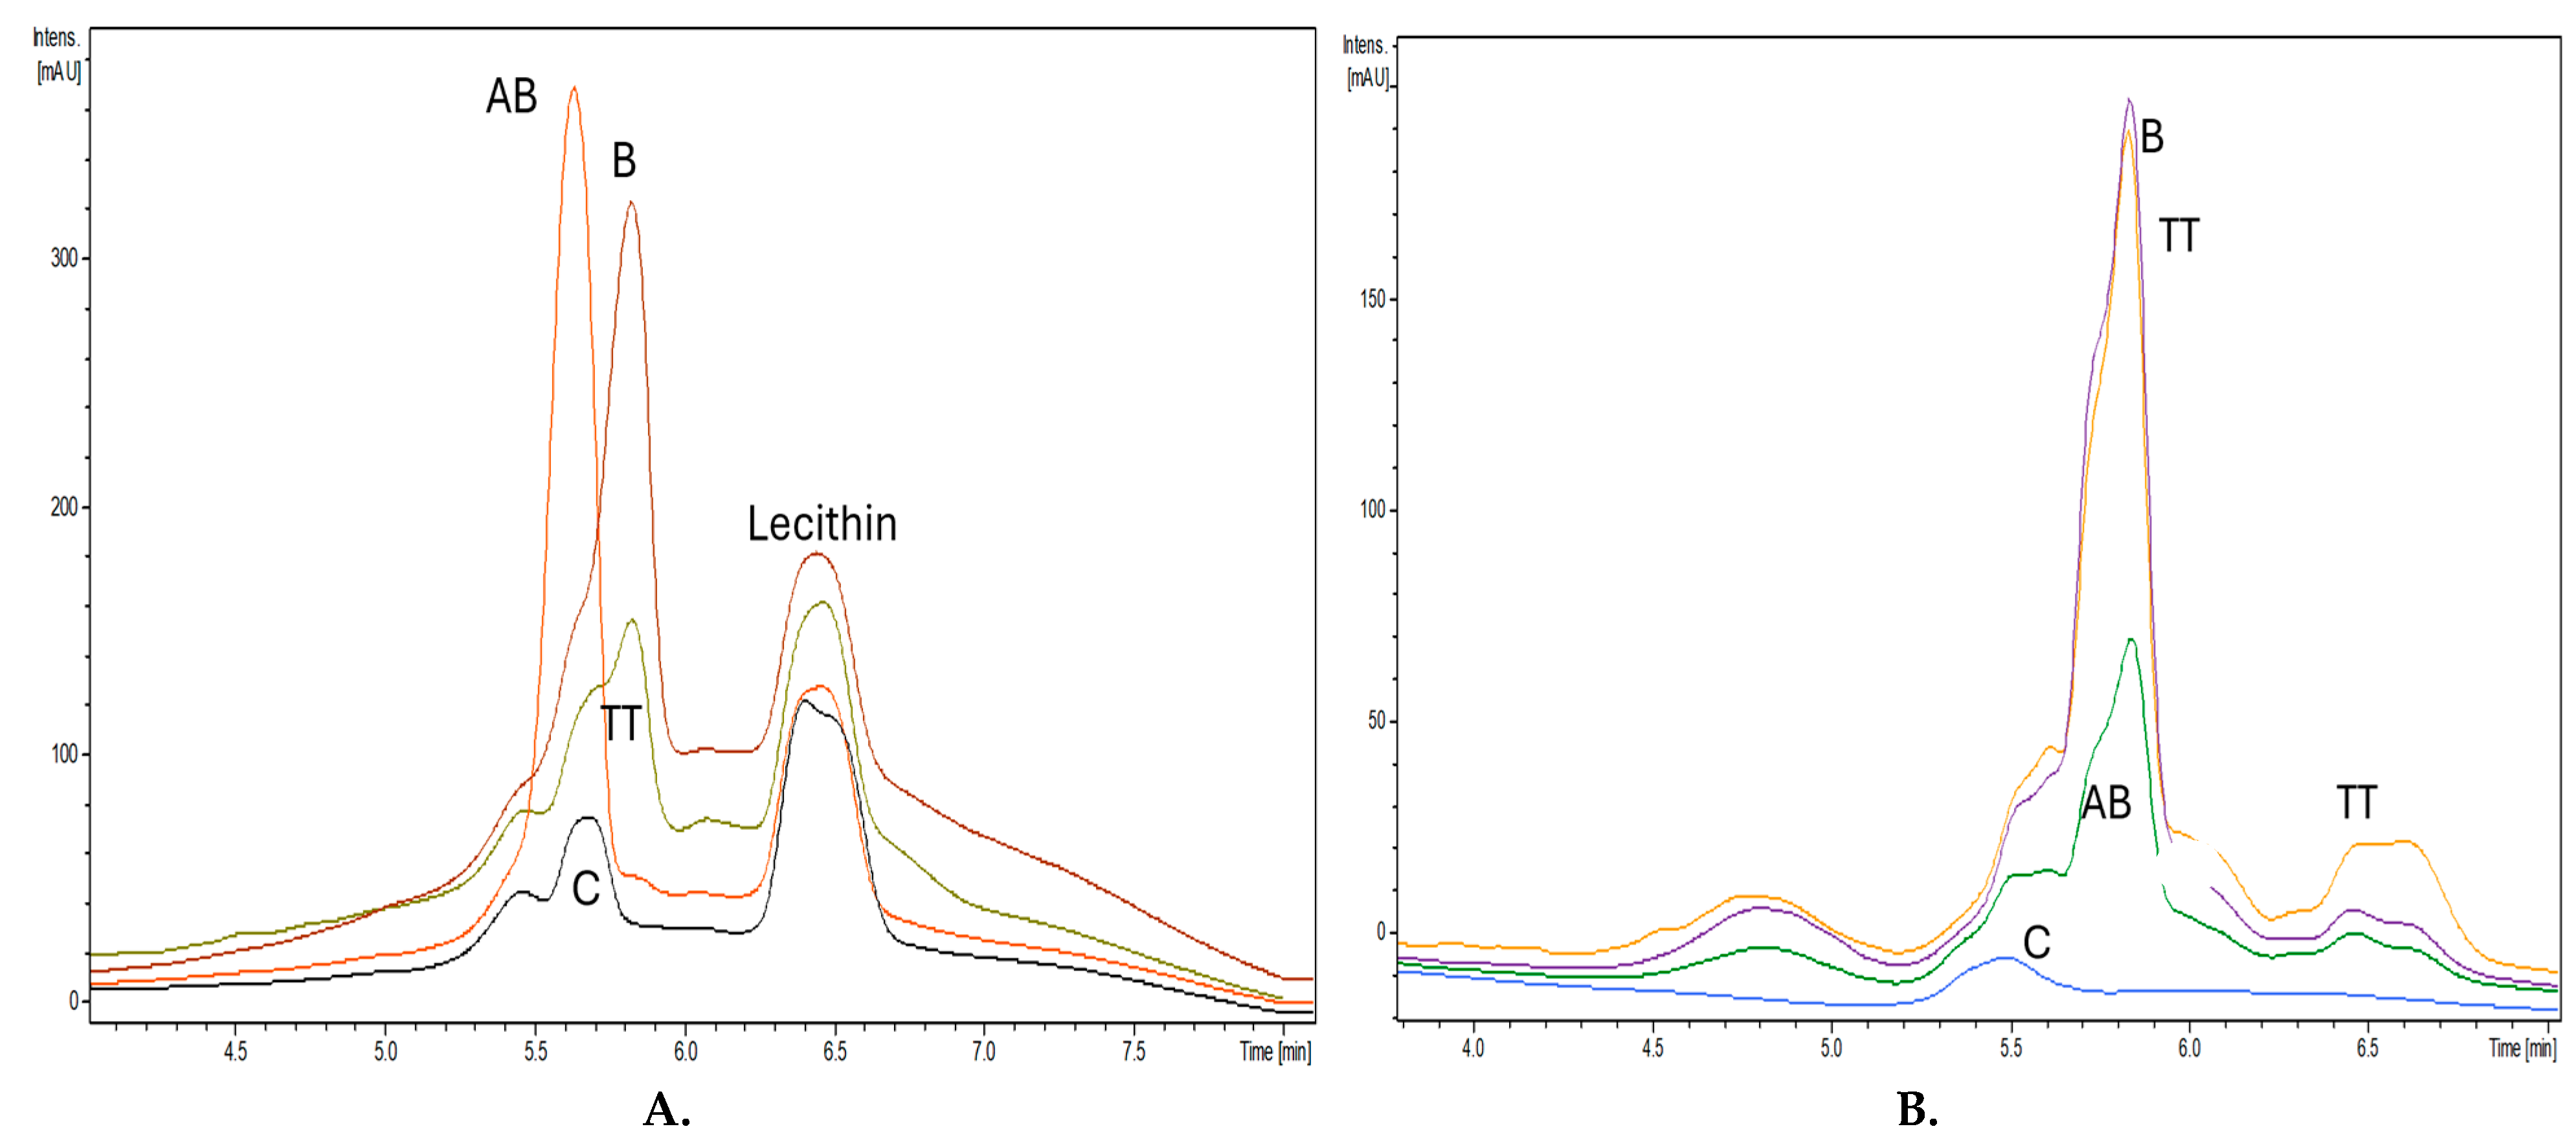
Figure 9.
Comparative values of peak intensity (212 nm) for the initial concentrations (I) of pure standards AB and B, as well in TT, according to HPLC-DAD data and the peak intensity values recorded for the same terpenoids in the solubilized retentate after entrapment in Lipo- and NLC-formulations. The mean EE% values are marked on the top of columns.
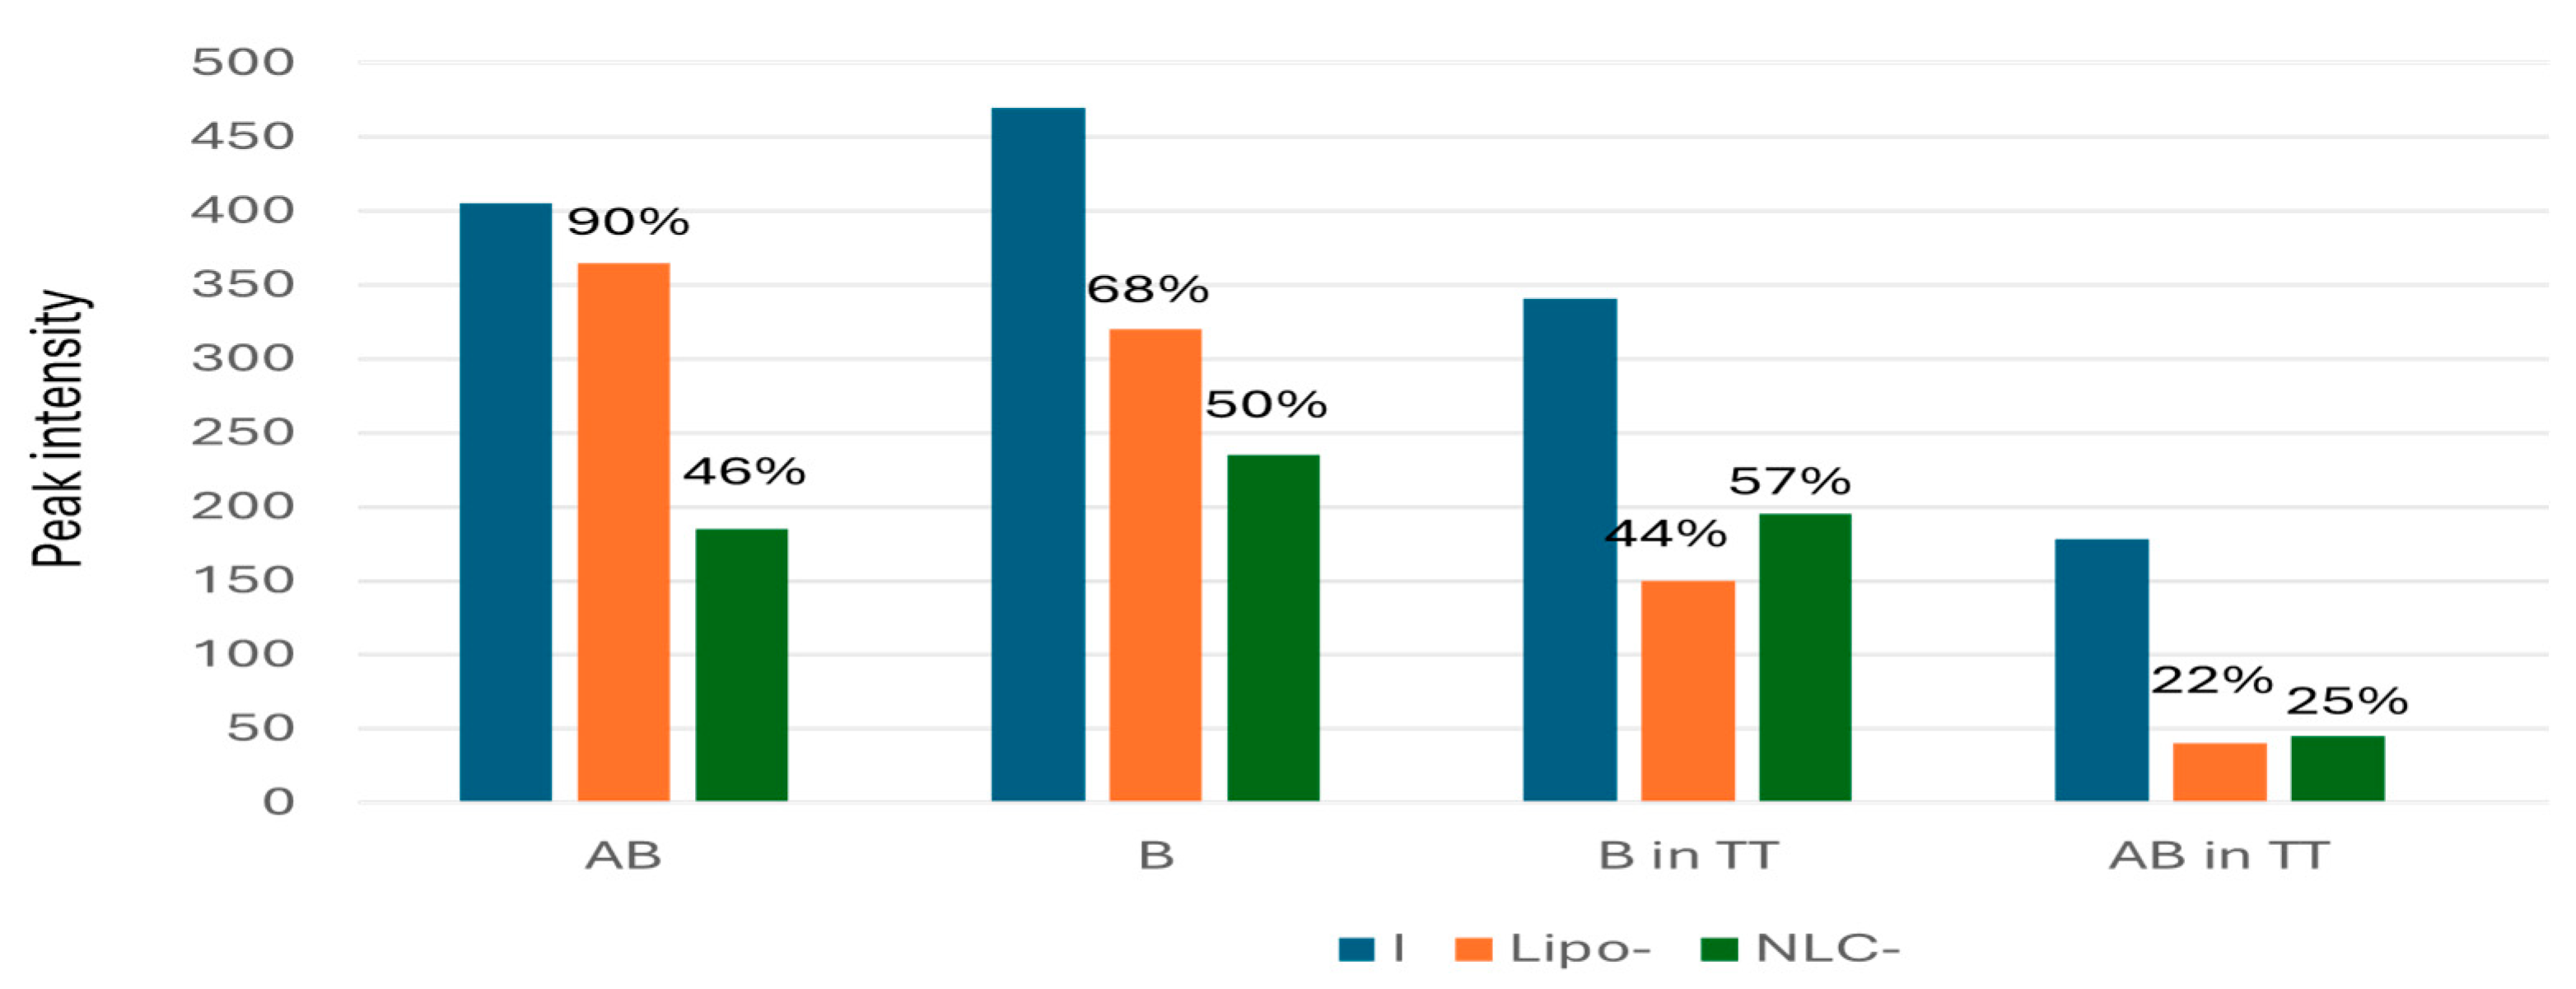
Figure 10.
Comparative evaluations of EE%, as mean values, calculated according to the entrapment of AB, B and TT in Lipo- and NLC-formulations. The mean values of EE% were obtained independently by the three methods: UV spectrometry, ATR-FTIR and HPLC-DAD. * p<0.01.
Figure 10.
Comparative evaluations of EE%, as mean values, calculated according to the entrapment of AB, B and TT in Lipo- and NLC-formulations. The mean values of EE% were obtained independently by the three methods: UV spectrometry, ATR-FTIR and HPLC-DAD. * p<0.01.
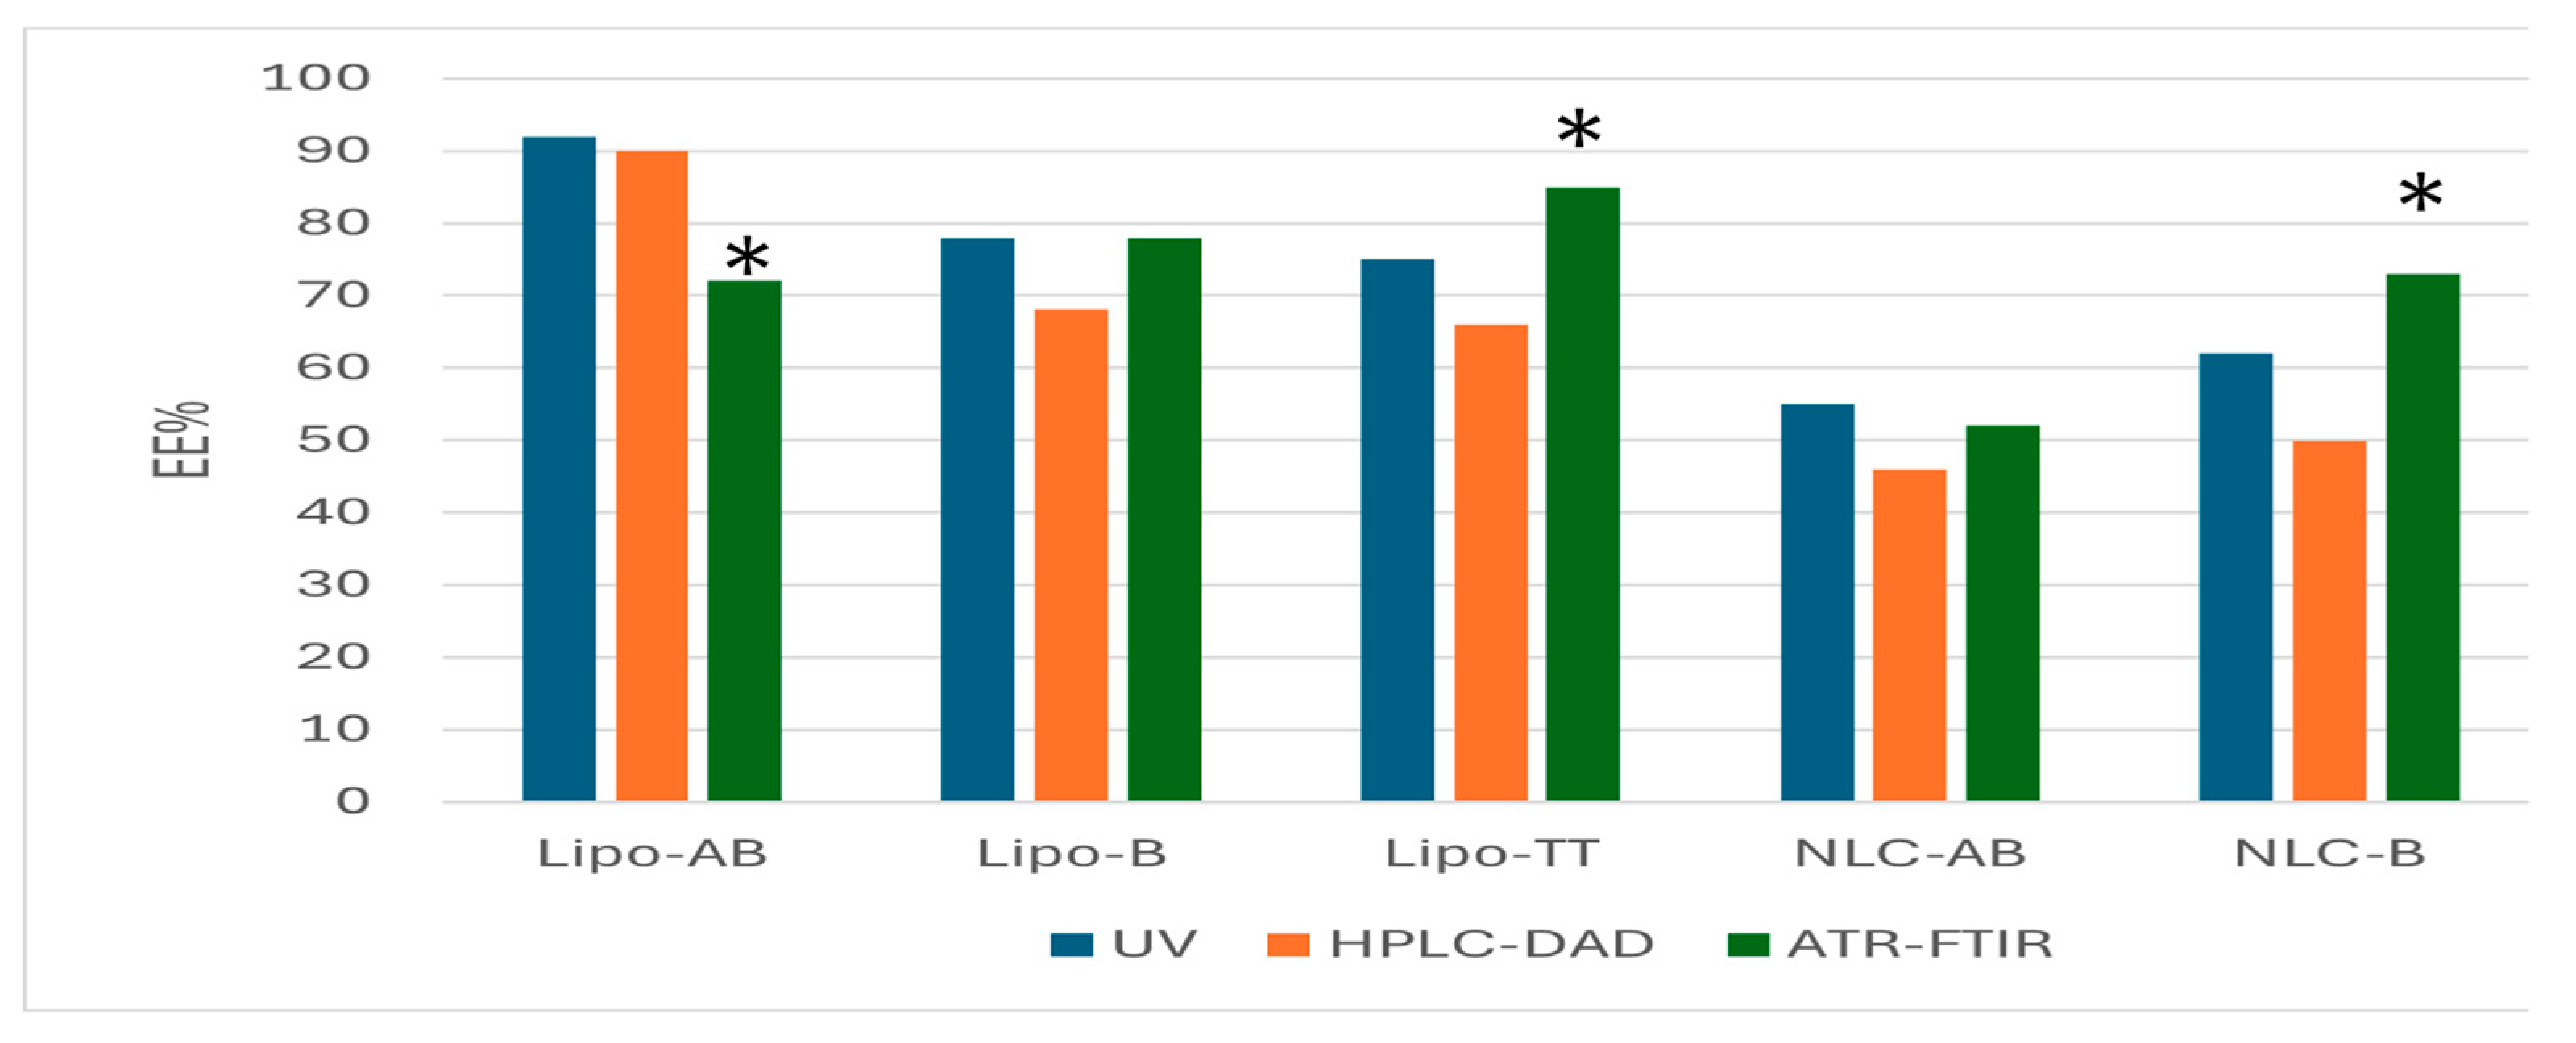

Table 1.
Specific vibrational bands identified in the TTs extract comparative to pure extracts of betulin (B) and Betulinic acid (AB). Specific vibrations (ν- stretching, δ- bending; τ- torsion; ω- wedging) were attributed to molecular vibrations found in terpenoids. The data were compared with published references.
| Region (cm-1) |
Wavenumbers for TTs/B/AB | Molecular vibrations |
References [15,39] | |||
| Raw Extract Betula Pendula |
B | AB | L | |||
| 2800-3400 cm-1 | 3363/3363/- w | ν (OH) | 3362 s | 3362 s | - | 3309 s |
| 2939.5/2922/2945 vs | νas(CH3) + νas(CH2) | 2940 vs | 2968 vs | 2943 vs | 2982 s | |
| 2866.2/2823/2852 s | + ν (CH3+ ν(CH2) | 2867 s | 2866 vs | 2878 vs | 2874 vs | |
| 860-1800 cm-1 | 1732.1 m; 1716.6 m | ν (C = O) | 1709-1684, broad | 1735 w,1708 sh | 1716 sh, 1681 vs | - |
| 1683.9 s; 1645.3 m | δ(CH2) + ν((C= C) | 1642 | 1642 m | 1642 m | 1642 m | |
| 1489.0 m; 1456.3 s | δ(CH3) + δ(CH2) | 1484 m, 1452 s | 1485 m, 1450 s | 1451m | 1453 m | |
| 1373.3 m | δ(CH3) + δ(CH2) | 1373 m | 1373 m | 1377 m | 1374 m | |
| 1184.3 m | ν(C-C) + δ(OH) + τ(CH2) + δ(CH) |
1190 m | 1190 m | 1190 m | 1190 m | |
| 1028.1 s | ν(C-O) from CH2-OH, + δ(CH) + ρ (CH3, CH2) |
1028 s | 1032 ms | 1043 m | 1046 m | |
| 881 m | ω (H-C-H) alkene | 881 m | 875 m | 885 m | 895 s | |
m- medium; s-strong; vs-very strong; as-asymetric; w-weak.
Table 2.
The equations of the calibration curves obtained for B standards (2, 4, 10 and 20 mg/ml) by ATR-FTIR spectroscopy at each of the 11 wavenumbers from ATR-FTIR spectra.
Table 2.
The equations of the calibration curves obtained for B standards (2, 4, 10 and 20 mg/ml) by ATR-FTIR spectroscopy at each of the 11 wavenumbers from ATR-FTIR spectra.
| Wavenumber ( cm-1) | Equation curve | R2 | Wavenumber ( cm-1) | Equation curve | R2 | |
| 1028.1 | 0.0022x + 0.0084 | 0.960 | 1683.9 | 0.0032x + 0.0115 | 0.931 | |
| 1184.3 | 0.001x + 0.0176 | 0.993 | 1716.6 | 0.0005x + 0.0342 | 0.627 | |
| 1373.3 | 0.0017x + 0.0002 | 0.973 | 1732.1 | 0.0005x + 0.0023 | 0.452 | |
| 1456.3 | 0.002x + 0.0144 | 0.883 | 2866.2 | 0.0021x + 0.0136 | 0.988 | |
| 1489.0 | 0.0008x + 0.0134 | 0.768 | 2939.5 | 0.0034x + 0.0199 | 0.992 | |
| 1645.3 | 0.0003x + 0.0209 | 0.396 | ||||
Disclaimer/Publisher’s Note: The statements, opinions and data contained in all publications are solely those of the individual author(s) and contributor(s) and not of MDPI and/or the editor(s). MDPI and/or the editor(s) disclaim responsibility for any injury to people or property resulting from any ideas, methods, instructions or products referred to in the content. |
© 2024 by the authors. Licensee MDPI, Basel, Switzerland. This article is an open access article distributed under the terms and conditions of the Creative Commons Attribution (CC BY) license (http://creativecommons.org/licenses/by/4.0/).
Copyright: This open access article is published under a Creative Commons CC BY 4.0 license, which permit the free download, distribution, and reuse, provided that the author and preprint are cited in any reuse.


