
Submitted:
29 November 2024
Posted:
02 December 2024
You are already at the latest version
Abstract
The deformation features of a thermoplastic matrix under long-term and cyclic loads have not yet received the necessary broad coverage. The evolution of deformations and accumulation of tensile damage in polysulfone reinforced with unidirectional high-strength and high-modulus carbon fiber threads under long-term and cyclic loads are studied. Composites were prepared by im-pregnating carbon fibers with a polysulfone solution and then removing the solvent. Stress re-laxation, creep, and low-cycle fatigue, as well as the structure and nature of damage to materials under load, are studied. The dependence of the effective modulus of elasticity on the maximum applied stresses is studied. It is shown that in composite materials with a thermoplastic matrix, the tensile diagrams are nonlinear, and the effective modulus of elasticity increases with increasing stress. Poisson's ratio at the initial moment is close to those for the pure polymer and is about 0.40, whereas with increasing stress this value decreases to 0.19-0.22. Video processing of sample de-formation in combination with scanning electron microscopy allows us to evaluate local features of deformation processes in carbon fibers and identify the main patterns of damage accumulation processes under long-term and cyclic loads.
Keywords:
polysulfone
; unidirectional carbon fibers
; fatigue strength
; long-term strength
; stress relaxation
1. Introduction
Composite materials with a polymer matrix reinforced with continuous glass, carbon, basalt, aramid and other high-strength fibers are widely used in modern technology due to the possibility of creating lightweight, energy-efficient structures with their help. Currently, the use of such structures, which have low weight and excellent mechanical properties, determines progress in aviation, wind energy, shipbuilding and construction.
The use of various types of fibers and fabrics, various patterns of placement of reinforcing elements, various polymer binders allow designing structures with the required anisotropy of properties in various directions, which ensures the possibility of achieving an optimal level of elastic strength, heat resistance, chemical resistance and resistance to various environmental factors [1,2,3,4,5]. Depending on the type of matrix, composites can be divided into materials based on thermosetting and thermoplastic polymers. The most widely used materials today are those with thermosetting matrices, such as epoxy and polyester. In such materials, during the manufacturing process, due to the interaction of a dosed system of components and temperature, a polymerization reaction occurs, resulting in the formation of the final product.
The advantages of thermosetting binders include low viscosity at room temperature, which allows for effective impregnation of fibrous blanks without damaging them, using vacuum impregnation or pressure impregnation methods. Polymerization, as a rule, does not complete at room temperature, and upon subsequent heating, the binder again becomes fluid, which allows for the final formation of the geometry of the composite product and the removal of excess polymer using thermocompression methods. Autoclave molding of products has proven to be the most effective, providing a minimum monolayer thickness and minimum porosity, which allows for the most complete implementation of the strength characteristics of reinforcing fibers in the composite [6,7,8,9,10,11,12]. The disadvantages of composite materials with thermosetting matrices include low shear strength, low impact toughness and crack resistance due to the low plasticity of the matrix, as well as high moisture absorption, which, when used in conditions of constantly changing temperatures with the transition through the crystallization temperature of water, activates the processes of nucleation and further propagation of microcracks. Technologies used for composites based on thermosetting materials require long-term heating and controlled slow cooling to reduce internal stresses in the manufactured parts. Low thermal conductivity of binders such as epoxy limits the thickness of the product that can be obtained in one technological process, since the release of heat during polymerization can lead to heating and premature curing of the binder. It is also very difficult to repair damaged structures with matrices based on thermosetting polymers [13,14,15,16,17,18].
Composites with matrices based on thermoplastic polymers are of considerable interest, since due to high plasticity the matrices can have qualities that composites with thermosetting matrices do not have. Thermoplastics have high impact toughness, high crack resistance, increased shear strength, and in the case of structural polymers such as polysulfones, they provide higher operating temperatures and increased thermal and chemical resistance [19,20]. Currently, the rapidly developing production of highly effective thermoplastic polymers, including polysulfones, helps to reduce the cost of these polymers and increase their availability for the production of new composite materials. Particularly attractive is the possibility of significantly reducing the manufacturing time of the product, which opens up the possibility of rapid mass production of products required for use in the automotive industry. The advantages also include the possibility of recycling, the ability to restore the load-bearing capacity of damaged structures [21,22,23]. On the other hand, it is important to note that the high viscosity of thermoplastic melts is 2-3 orders of magnitude higher than that of epoxy binders. To reduce the melt viscosity to a level that ensures impregnation, it is necessary to use temperatures of 250–370 °C and pressures of up to 30 bar. Such processing modes can lead to damage to the fibrous preform and a decrease in the characteristics of the polymer used as a result of its thermal-oxidative destruction. This prevents the full realization of the strength of the reinforcing fibers in composite materials based on thermoplastics, and in terms of their strength characteristics they are inferior to composites with thermosetting matrices [24,25,26].
The issue that requires careful study. is the occurrence of deformations in such composites under the influence of long-term loads, since in the case of a thermoplastic matrix, when ensuring high adhesive strength at the interfaces, even at relatively small stresses in local overstressed zones, plastic flow of the binder can occur, which can ultimately lead to local deformations and damage. Understanding the processes of stress relaxation and yield under the influence of applied loads is necessary for correct calculations and determination of operating modes of structures made of such composite materials. For example, to verify the results of modeling the mechanical behavior of thermoplastic composites, performed using the finite element method, peridynamics methods or moving cellular automata, along with determining the structural constants of the material, it is necessary to consistently experimentally study the deformation behavior of single impregnated threads, monolayers with different architectures and finished layered composite materials under the influence of applied static and dynamic loads. The aim of this work is to study the deformation behavior of thermoplastic polymer-impregnated carbon fibers under long-term static and low-cycle loading.
2. Materials and Methods
2.1. Sample Preparation
The objects of research were high-strength and high-modulus carbon threads with a nominal value of 12K impregnated with polysulfone. To obtain the composites, high-strength carbon fibers Toray T700SC – 12K, (Toray Industries, Inc., Tokyo, Japan), and high-modulus UMT400-12K-EP (Umatex, Moscow, Russia) were used. The characteristics of the fibers used are presented in Table 1.
Ultrason S 2010 (BASF, Ludwigshafen, Germany polysulfone was used as matrix material. This polymer is amorphous with a glass transition temperature Tg of 187 °C, polysulfone density was of 1.24 g/cm3, tensile strength at break was of 75.0 MPa, and tensile modulus was of 2.60 GPa.
To obtain composite samples for testing, we used the technology described in detail in [27], in which carbon fibers are impregnated with Ultrason S 2010 polysulfone dissolved in n-methylpyrrolidone, followed by removal of the solvent by drying. The applied impregnation solutions of Ultrason S 2010 in N-methylpyrrolidone (CAS: 872-50-4, Molar mass: 99.13 g/mol, empirical formula C5H9NO), with a concentration of 30 wt.%, were obtained by mixing the polymer with the solvent in closed quartz flasks at a temperature of 50 °C for 24 hours using a magnetic stirrer.
The impregnation of carbon fibers with polysulfone solution was carried out in a fluoroplastic cuvette, the carbon fibers passed through a bath of solution using a system of fluoroplastic rollers, at the exit the excess solution was squeezed out using a fluoroplastic spinneret with an outlet diameter of 1.0 - 1.1 mm. The impregnated threads were cut into fragments of 2 m in length and pre-dried at a temperature of 23 ± 2 °C, under a load of 1 kg, in a vertical position for 24 hours, after that they were cut into fragments of 300 mm in length. Further removal of the solvent was carried out in a Binder FD-115 drying oven (BINDER GmbH, Tuttlingen, Germany) at a temperature of 115 °C for 8 hours. Impregnated yarn samples had a diameter of 1.0 to 1.1 mm
Tensile tests were carried out on samples with a working length of 100 mm with the ends glued into protective pads made of cardboard 1 mm thick, dimensions 52 x 60 mm. Fixation of samples in cardboard slips was carried out using Sicomin SR1710 epoxy binder and SD 7820 hardener. Polymerization of the epoxy binder was carried out in a Binder FD-115 drying oven at a temperature of 115 oC for 6 hours. The choice of the brand of epoxy binder used for vacuum infusion is due to its long lifetime, which makes mass production of samples convenient.
2.2. Characterization
For each sample, before gluing them into cardboard frames, the polymer content was measured using an AND GR 202 analytical balance (AND, Japan). The polymer content in the sample was calculated based on the difference in the mass of the sample and the mass of the fiber calculated based on linear density data.
Elastic modulus and Poisson's ratio of unfilled polysulfone was measured in accordance with the ISO 527-2:2012 Plastics - Determination of tensile properties - Part 2: Test conditions for molding and extrusion plastics, on type 1 samples, at a constant strain rate of 1% /min.
Strength and deformation characteristics of carbon threads impregnated with thermoplastic polymer was studied using a Zwick/Roell Z020 universal tensile testing machine (Zwick/Roell Group, Ulm, Germany) with a maximum applied force of 20 kN, equipped with a high-precision MultiXtens contact strain measurement system, considering the provisions of ASTM D4018 and ISO 10618.
The MultiXtens system provides measurement of longitudinal deformation of the samples under study with an accuracy of 0.2 μm using contact probes with polymer or steel tips, with a constant adhesion force to the sample.
The transverse strain of the composites was measured using the optical method using a Microscope Video HDMI/USB Camera brand YZ13-1605B 4K (YIZHAN, China). The construction of displacement and strain fields in composites was carried out by processing the resulting video images using ImageJ and Matlab software. The shooting was carried out with magnifications x 700 and x 1000, at a recording speed of 30 frames per second. The scheme for measuring longitudinal and transverse deformation during testing is shown in Figure 1.
Fatigue tensile tests were carried out under a constant-sign soft cycle, with an asymmetry coefficient (R = σmin/σmax) equal to 0.166 – 0.2, at maximum cycle stresses in the range from 500 to 3500 MPa, changed in increments of 500 MPa. The duration of one cycle was of 18 to 21 s. Given the ability of thermoplastic polymers to undergo large deformations, we conducted low-cycle fatigue tests with a limit of 10,000 cycles. Recording of cyclic load-strain diagrams was carried out in two modes, using the MultiXtens sensor and by moving the active gripper (accuracy 0.5 - 1 µm).
Stress relaxation and material behavior during creep were studied by selecting a number of maximum stress levels in the range from 500 to 3500 MPa, with a step of 500 MPa, while maintaining a constant deformation of the sample, changing stresses (relaxation) or a constant stress level (creep). The testing time for a single sample was 10 minutes, 1 hour or 8 hours depending on the test purpose. Before the start of the tests, corrections for the stiffness of the testing machine were obtained, entered in the form of a correction curve into the TestXpert-II software, which made it possible to reduce the error in measuring the deformation when measuring it by moving the supports.
The samples were fastened to the tensile testing machine using pneumatic vice-type grippers, maintaining a constant closing force, and a pressure in the pneumatic cylinders of 3 bar. The working length of the threads in the grippers was of 100 mm, the active grip speed during the test varied from 1 to 100 mm/min, and the base for measuring deformation using the sensor was 70 mm. To reduce the influence of the stressed state in the grips on the samples under study, protective cardboard pads protruded 2-3 mm above the surface of the clamping jaws. Specimens that did not fail during fatigue, stress relaxation and creep tests were subjected to tensile tests to study residual strength values and the type of load-strain diagrams. Before any testing was carried out, the samples were conditioned in accordance with ISO 291:2008 Plastics - Standard atmospheres for conditioning and testing at a standard atmosphere of 23/50 for 88 hours. The total number of samples tested for a single experiment was of 15 to 30.
The study of the microstructure of samples and fracture surfaces was carried out using a scanning electron microscope TESCAN VEGA Compact (Joint stock company, TESCAN, Brno, Czech Republic) and Hitachi TM-1000 (Hitachi Ltd., Japan).
To evaluate the number of fiber defects and the moment of their appearance during testing, we developed a technique for pouring samples into a conductive epoxy compound, followed by removing part of the polymer matrix using the N-methylpyrrolidon solvent and additional drying the resulting samples in an oven for 8 hours at a temperature of 115 0C.
3. Results and Discussion
Preparation of thin sections and etching of the surface using N-methylpyrrolidon made it possible to reveal the structural features of the composites. As can be seen in Figure 2a – 2b, the cross section of the samples contains individual layers of pure polymer with a diameter of up to 70 μm, randomly distributed inside the volume of the samples. When the polymer content in the samples is more than 40 wt.%, layers of polymer in the form of a jacket with a thickness of 10–100 microns, unevenly distributed throughout the volume of the material, can form on the surface. Elementary carbon fibers form individual strands consisting of 20 – 500 filaments, differing in orientation angles relative to the axis of the thread draw within 1-12 degrees; the distribution parameters were shown earlier in [28]. The characteristic appearance of strands in threads for sections of the longitudinal direction is presented in Figure 2 c-d, and it can be noted that a significant part of such strands has minimal misorientation angles. It can also be assumed that the initial tension of these threads occurring during their manufacture is inhomogeneous. High-strength and high-modulus fibers of different brands and manufacturers have the same microstructure; we have not identified any differences in the formation of layers in the polymer matrix between two types of carbon fibers during the impregnation process.
As-prepared impregnated fibers contain nearly no breaks of individual filaments. Such microstructure of the obtained samples provides the features of their deformation behavior. The stress-strain diagrams of composites (Figure 3) have a crescent shape, since as the effective stress value in the material increases, the rigidity of the samples increases. Figure 3 shows the deformation behavior for well-oriented samples based on high-strength Toray T700 fiber (Figure 3a) and high-modulus UMT400 (Figure 3b) with a fiber content of 60 wt %. By combining of nearly defect-free structure of raw carbon fibers and the optimum fiber-to-polymer ratio it is possible to realize the strength characteristics of carbon fibers in the composite most fully. The strain-stress diagram can be conditionally divided into three regions: the initial linear section from 0 to 600-800 MPa, the final linear section at stresses above 2000-2500 MPa, and the transition region within which a significant change in the deformation characteristics of the samples occurs.
The elastic modulus measured for the initial section (stresses from 25 to 100 MPa) is about 200 GPa for high-strength fibers and 280 GPa for high-modulus fibers, which is about 85% of their total stiffness; with an increase in the effective load, the effective elastic modulus increases. For Toray T700 fibers, the effective elastic modulus reaches 240 GPa, which is slightly higher than their full calculated stiffness realized when using epoxy binders. The change in the effective elastic modulus for high-modulus UMT400 fibers behaves similarly, but the strength of the fibers is not fully realized due to the destruction of individual elementary fibers and their individual bundles under loading. The destruction of composite samples occurs instantly, the sample disintegrates into a large number of needle-like fragments. Tensile tests of pure polysulfone were carried out on samples obtained by thermal molding of both green granules and films obtained by solution technology. It is shown that the modulus of elasticity and Poisson's ratio under tension do not depend on the method of sample molding and are 2.6 ± 0.05 GPa and 0.41 ± 0.01, respectively. The longitudinal deformation was measured using photographs cut from a video recording of the composite tensile testing process. Synchronization of video frames with the load-longitudinal deformation diagram was performed using the TestXpert-II software on a Zwick/Roell Z020 testing machine. The results of measuring the longitudinal and transverse deformation make it possible to obtain the value of the Poisson's ratio for polysulfone-based threads reinforced with carbon fiber. At the initial linear section of the stress-strain diagram in the stress range of 25 - 500 MPa, the Poisson's ratio was 0.40 - 0.43, which corresponds to the value for a pure polymer matrix. With increasing load, the Poisson's ratio decreases to values of 0.17 - 0.22, it can be assumed that the obtained values are close to the corresponding values of pure carbon fibers.
Visualization of the deformed state of the samples was carried out by comparing photographs corresponding to different stress states in the material, using the Matlab software. Images of the deformation fields were obtained using the MATLAB code "Augmented La-grangian Digital Image Correlation" (AL-DIC). A texture was applied to the surface of the sample and its movement during deformation was monitored using a camera, after which the displacement field and the deformation field were calculated using the image tracking algorithm.
The obtained maps of the longitudinal and transverse deformation fields, constructed from the displacement fields of points for composites for different stress states, are shown in Figure 4; loading of the samples during testing was carried out in the "y" direction. Starting with small stresses, in the range from 25 to 100 MPa (Figure 4 a, b), deformations begin to develop in the material, with the deformations localized in areas with sizes from 10 to 50 μm. Transverse deformations develop faster than longitudinal ones, which is associated with local polymer flow, leading to the alignment of individual strands inside the thread; sliding of the strands relative to each other in the direction of load application is also observed. These processes become more intense as the stress increases (Figure 4 c–e), which should lead to an increase in the effective modulus of elasticity. At stresses above 3.0 GPa, i.e. within the final linear section of the diagram, significant localization of deformations occurs (Figure 4 (d, e)), which is associated with the occurrence of longitudinal and transverse cracks in the layers of the polymer matrix between the fiber bundles and the displacement of the bundles relative to each other, while maintaining the load-bearing capacity of the sample due to the redistribution of stress fields. This orientation and redistribution of stresses in the volume of the sample ensures the implementation of the full rated rigidity of the carbon fibers used in the third section of the diagram.
Figure 5 shows the superposition of the strain images obtained using Matlab for strain fields on the original image with a transparency of 0.5. The figure indicates the localization of longitudinal strains e11 in regions containing polymer layers, mainly in regions along the fiber orientation, and transverse strains e22 associated with polymer flow and the alignment of individual fiber strands.
The damage to the fibrous filler in the material was studied by applying a load to a specified stress level and then removing the load after deformation occurred. Fiber damage was analyzed at the beginning and end of the second section of the stress-strain diagram. After such loading, the polymer matrix partially dissolved and the samples were examined using SEM. In the initial section, at a load of 500 MPa (Figure 6a), after removing the load, the number of breaks in elementary fibers is small, single breaks are detected in the fields of view of 500x500 μm. At the beginning of the third section (load of 2000 MPa), the number of breaks increases significantly, clusters of breaks are observed inside individual strands (Figure 6b). The degree of damage to more fragile high-modulus fibers is higher than to high-strength ones.
To assess the performance of materials in real structures, it is important to understand the patterns of flow and stress relaxation processes under the action of applied forces, since the thermoplastic matrix deforms well under load. The study of stress relaxation processes was carried out by loading samples to specified stress values, after which the testing machine maintained a constant deformation value. In the case of studying flow processes, a constant force was maintained throughout the experiment.
Figure 7 and Figure 8 shows the typical appearance of the creep and relaxation curves. Creep processes are localized in time, so for stresses of 1000 MPa (Figure 7a) in both high-strength and high-modulus fibers based composites, the increase in strain was completed after 30-40 minutes from the moment the load was applied. At high stresses (Figure 7b) material creep was completed within 8–10 minutes. The deformation realized due to creep is about 0.01%, and weakly depends on the polymer content in the material in the filling range from 20 to 50 wt.%. The course of the creep process is provided by the possibility of local flow of the polymer matrix, which allows to stretch and reorient the fiber bundles in the direction of load application, leading to a redistribution of loads between individual fiber bundles. The processes of stress relaxation over time are similar in nature to the processes of creep. To complete the relaxation processes at a stress level of 1000 MPa (Figure 8a) it takes 1 hour, whereas and at a stress level of 2500 MPa it takes of 10 to 15 minutes (Figure 8b).
The damage to the specimens during creep tests was studied using scanning electron microscopy (Figure 9). At stresses below 2000 MPa, no damage was observed on the surface of the specimens based on either high-strength or high-modulus fibers. Starting with stresses of 2500 MPa, cracks oriented along the fibers begin to appear on the surface of the specimens, and individual polymer ribbons 1–3 μm thick that have detached from the specimen are observed (Figure 9a). In areas consisting of polymer layers more than 15 μm in thick, systems of parallel cracks oriented perpendicular to the loading direction appear (Figure 9b, d). In some cases, intact carbon fibers pass through such fragmented areas of the matrix.
The specimens fail during creep and stress relaxation tests at stress values of approximately 4000 MPa for specimens reinforced with high-strength Toray T700-12K fibres and at stress values above 3000 MPa for specimens reinforced with high-modulus UMT400 fibres. The failure usually occurs within 20-45 min after the start of the test. The failure developed within 1-2 min, during which the deformation began to increase rapidly due to the accumulation of a large number of damages to individual threads. The failure was accompanied by significant fragmentation of the polymer matrix. The specimens that passed the tests without damage were subjected to tensile tests to measure the elastic modulus and residual strength. For the specimens tested at stresses of 500 and 1000 MPa, an increase in the elastic modulus by 10 GPa was observed during repeated tests; for the specimens tested at stresses above 1000 MPa, the increase in the modulus was 15-18 GPa.
The fatigue tests of the specimens were carried out under conditions of a soft constant-sign cycle with maintaining constant minimum and maximum values of cyclic stresses. The tests were carried out at low frequencies, one cycle took 18-22 seconds. A typical load-deformation curve during fatigue tests is shown in Figure 10. A feature of the specimens under study is a very narrow hysteresis loop, so the average amount of energy dissipated in the specimen per 1 loading cycle is only 0.01 J. The scheme of deformation measurement using a contact sensor that we used allowed us to separate the contribution to energy dissipation directly in the specimen and energy dissipation in the bonding. When determining the energy dissipated per cycle with deformation measurement by moving the crosshead, the energy value is more than an order of magnitude higher due to the influence of the testing system and energy dissipation when gluing the specimen into protective pads.
Under the action of cyclic loads, the irreversible deformation of the specimen increases, as shown in Figure 11a, which leads to a shift in the hysteresis loop and an increase in the total deformation of the specimen (Figure 11b), while the cycle deformation remains virtually unchanged. The nominal fatigue strength according to the no-failure criterion based on 10,000 cycle tests is about 2.5 GPa for specimens reinforced with high-strength Toray T700-12K fibers and about 2 GPa for specimens reinforced with high-modulus UMT400 fibers; at high values of the maximum cycle stress max, some of the specimens fail, as shown in Table 2. There is a large spread in the number of cycles before failure, and some of the specimens failed in the grip zone, which requires additional studies to create a fatigue diagram of the studied specimens.
The samples that withstood 10,000 cycles without failure were tested in tension to determine the residual strength and elastic modulus. It can be noted that the residual strength was about 80-85% and did not depend on the type of fiber used. Changes in the elastic modulus after cyclic tests are similar to those observed in creep and stress relaxation tests. The elastic modulus in the initial section increases by 10-20 MPa depending on the maximum cycle stress, the effective modulus of the final section remains virtually unchanged. In the structure of the samples that passed tests at maximum cycle stresses above 2000 MPa, damage is observed as cracks in the matrix between bundles of elementary fibers, similar to cracks that appear in creep and stress relaxation tests (Figure 9a, c).
Figure 12 shows the initial part of the strain-stress diagram for pure polysulfone. At a relative strain of 0.4%, the transverse strain (curve a) becomes non-linear; at a strain of ~0.5% and stresses of 12-13 MPa (curve b), the deformation of the polymer becomes non-linear in the longitudinal direction. As it is seen in Figure 3, the deformation of the composite as a whole also become non-linear at certain strain values. For composites reinforced with high-strength Toray T700-12K fibers the non-linearity appears at strain values of about 0.4 % (Figure 3a), whereas for samples reinforced high-modulus UMT400 fibers it appears at strain of about 0.2 % (Figure 3b). The difference in the strain moment of transition to nonlinear deformation between high-strength and high-modulus, for which this transition begins earlier, can be explained by weaker adhesive interaction between the polymer and carbon fibers in this case because of high-modulus fibers possess lower value of surface energy than high-strength fibers. Nonlinear shape of strain-stress diagrams was also noted in [29], where threads composites based on Toray T700 fiber with an epoxy matrix were investigated. However, the degree of non-linearity of diagrams for samples with an epoxy matrix is noticeably lower than with a thermoplastic one, and the transition to a non-linear section is observed at significantly higher stress values (2800 MPa) at a deformation of 1.2%. The reason for this difference may be that in the case of a brittle epoxy matrix, local cracking occurs, facilitating the displacement of individual fiber strands, rather than plastic flow, as in the case of thermoplastic polysulfone matrix.
A similar effect was observed in [30] when comparing the nature of damage of carbon fibers reinforced polyether ether ketone and epoxy resin based composites at cyclic loading. It was noted that the thermoplastic polyether ether ketone based composite is significantly superior to epoxy based one in terms of maximum shear strain, ultimate fracture stress and fracture strain. Damage in an epoxy laminate develops approximately twice as fast as in polyether ether ketone, which is due to an extensive network of microcracks. The polyether ether ketone based composite exhibited high shear strain and little high-strain cracking, as evidenced by inelastic shear lines within the matrix and at the interface tangential to the fiber surface. In our study such shear bands were observed for polysulfone based composites, see Figure 9 (c,d). Additionally, the similar results were observed in [31], where the appearance of damage inside the carbon finer yarns and their complex nature was analyzed using the 3D micro-computed tomography method.
4. Conclusions
It is shown that the deformation behavior of carbon fiber-polysulfone composite materials obtained by solution technology is provided by the ability of the thermoplastic matrix to deform under load, which leads to partial reorientation of individual carbon fiber bundles. The onset of yield of the polymer material leads to the appearance of a nonlinear section on the stress-strain curve. When the stress is removed, the polymer deformation and fiber reorientation remain, which leads to an increase in the elastic modulus by 10-20 GPa upon repeated loading. Creep and stress relaxation tests showed that at stress levels up to 3000 MPa, constant stress and strain values are achieved within 20-40 minutes. This can be explained by the polymer flow, leading to local reorientation of fiber bundles and stress equalization in the cross section of the samples. Composite material samples showed high resistance to cyclic loads under low-cycle fatigue conditions.
Author Contributions
Investigation, E.D.M., L.K.O and H.M.; writing—original draft preparation, A.A.S.; writing—review and editing, V.V.T.; supervision, A.A.S.; All authors have read and agreed to the published version of the manuscript.
Funding
The work was supported by the Russian Science Foundation, grant 22-43-02081.
Institutional Review Board Statement
Not applicable
Informed Consent Statement
Not applicable
Conflicts of Interest
The authors declare no conflict of interest.
References
- Fitzer E and Manocha LM. Carbon fiber architecture. In: Carbon reinforcements and carbon/carbon composites. Berlin/Heidelberg: Springer,1998; pp. 82–96.
- Biron M. Plastics solutions for practical problems. In: Biron M (ed) Thermoplastics and thermoplastic composites. 3rd ed. Amsterdam: Plastics Design Library, 2018; pp. 883–1038.
- Yao SS, Jin FL, Rhee KY, et.al. Recent advances in carbon-fiber-reinforced thermoplastic composites: A review. Compos B Eng 2018; 142: 241–250. [CrossRef]
- Chung DDL. Processing-structure-property relationships of continuous carbon fiber polymer-matrix composites. Mater Sci Eng R 2017; 113: 1–29. [CrossRef]
- Rajak DK, Pagar DD, Menezes L, et.al. Fiber-reinforced polymer composites: Manufacturing, properties, and applications. Polymers 2019; 11: 1667. [CrossRef]
- Meijer HEH and Govaert LE. Mechanical performance of polymer systems: The relation between structure and properties. Progr Polym Sci 2005; 30: 915–938.
- Souza RRR, Nascimento J, Sérgio L, et.al. Translaminar fracture toughness and fatigue crack growth characterization of carbon-epoxy plain weave laminates. Polym Compos 2019; 40: 3791-3804.
- Shrivastava R and Singh KK. Interlaminar fracture toughness characterization of laminated composites: A review. Polym Rev 2020; 60: 542 – 593. [CrossRef]
- Farooq U, Teuwen J and Dransfeld C Toughening of epoxy systems with interpenetrating polymer network (IPN): A review. Polymers 2020; 12: 1908.
- Sharma M, Gao S, Mäder E, et.al. Carbon fiber surfaces and composite interphases. Compos Sch Tech 2014; 102: 35-50. [CrossRef]
- Zakaria KA, Jimit RH, Ramli SNR, et.al. Study on fatigue life and fracture behaviour of fibreglass reinforced composites. J Mech Eng Sci 2016; 10: 2300–2310. [CrossRef]
- Gopalraj SK, Deviatkin I, Horttanainen M, et.al. Life cycle assessment of a thermal recycling process as an alternative to existing CFRP and GFRP composite wastes management options. Polymers 2021; 13: 4430. [CrossRef]
- Köhler T, Röding T, Gries T, et.al. An overview of impregnation methods for carbon fibre reinforced thermoplastics. Key Eng Mater 2017; 742: 473-481. [CrossRef]
- Veazey D, Hsu T and Gomez ED. Next generation high-performance carbon fiber thermoplastic composites based on poly-aryletherketones. J Appl Polym Sci 2017; 134: 44441.
- Jaewoo S, Kim DY, Kim DC, et.al. Recent developments and challenges on machining of carbon fiber reinforced polymer composite laminates. Int J Prec Eng Manufact 2021; 22: 2027-2044.
- Kojnoková T, Nový F and Markovičová L. Evaluation of tensile properties of carbon fiber reinforced polymers produced from commercial prepregs. Mater Today Proc 2022; 62: 2663–2668. [CrossRef]
- Liang Y, Wang H and Gu X. In-plane shear response of unidirectional fiber reinforced and fabric reinforced carbon/epoxy composites. Polym Test 2013; 32: 594–601. [CrossRef]
- Rafique I, Kausar A and Muhammad B. Epoxy resin composite reinforced with carbon fiber and inorganic filler: overview on preparation and properties. Polym Plast Tech Eng 2016; 55: 1653–1672. [CrossRef]
- Witten E and Mathes V. The european market for fibre reinforced plastics / composites in 2021. Market developments, trends, challenges and outlook. Frankfurt am Main: AVK – Industrievereinigung Verstärkte Kunststoffe e.V. 2022, p. 35.
- Friedrich K. Carbon fiber reinforced thermoplastic composites for future automotive applications. AIP Conf Proc 2016; 1736: 020001.
- Arquier R, Iliopoulos I, Régnier G, et.al. Consolidation of continuous-carbon-fiber-reinforced PAEK composites: A review. Mater Today Commun 2022; 32: 104036. [CrossRef]
- Yavas D. High-temperature fracture behavior of carbon fiber reinforced PEEK composites fabricated via fused filament fabrication. Compos B Eng 2023; 266: 110987. [CrossRef]
- Almushaikeh AM, Alaswad SO, Alsuhybani MS, et.al. Manufacturing of carbon fiber reinforced thermoplastics and its recovery of carbon fiber: A review. Polym Test 2023; 122: 108029. [CrossRef]
- Hou M. Stamp forming of continuous glass fibre reinforced polypropylene. Compos A Appl Sci Manuf 1997; 28: 695–702. [CrossRef]
- Ho KKC, Shamsuddin S, Riaz S, et.al. Wet impregnation as route to unidirectional carbon fibre reinforced thermoplastic composites manufacturing. Plast Rubber Compos 2011; 40: 100–107. [CrossRef]
- Agius SL, Magniez KJC and Fox BL. Fracture behaviour of a rapidly cured polyethersulfone toughened carbon fibre/epoxy composite. Compos Struct 2010; 92: 2119–2127. [CrossRef]
- Stepashkin AA, Mohammad H, Makarova ED, et.al. Deformation behavior of single carbon fibers impregnated with polysulfone by polymer solution method. Polymers 2023; 15: 570. [CrossRef]
- Stepashkin AA, Suresh C, Gromov SV, et.al. ANN-based structure peciliaties evaluation of polymer composite reinforced with unidirectional carbon fiber. Alex Eng J 2023; 82: 218–239. [CrossRef]
- Dong B, Tian L and Pan B. Tensile testing of carbon fiber multifilament using an advanced video extensometer assisted by dual-reflector imaging. Measurement 2019; 138: 325–331. [CrossRef]
- Thibault PA, Hernandez AR, Mills H, et.al. Shear driven deformation and damage mechanisms in High-performance carbon Fibre-reinforced thermoplastic and toughened thermoset composites subjected to high strain loading Compos Str 2021; 261: 113289.
- Holmes J, Sommacal S, Das R. et.al.Characterisation of off-axis tensile behaviour and mesoscale deformation of woven carbon-fibre/PEEK using digital image correlation and X-ray computed tomography. Compos B Eng 2022; 229: 109448. [CrossRef]
Figure 1.
Schemes for testing thermoplastic composites using (a) video recording to measure the magnitude of transverse strain and (b) longitudinal strain sensor.
Figure 1.
Schemes for testing thermoplastic composites using (a) video recording to measure the magnitude of transverse strain and (b) longitudinal strain sensor.
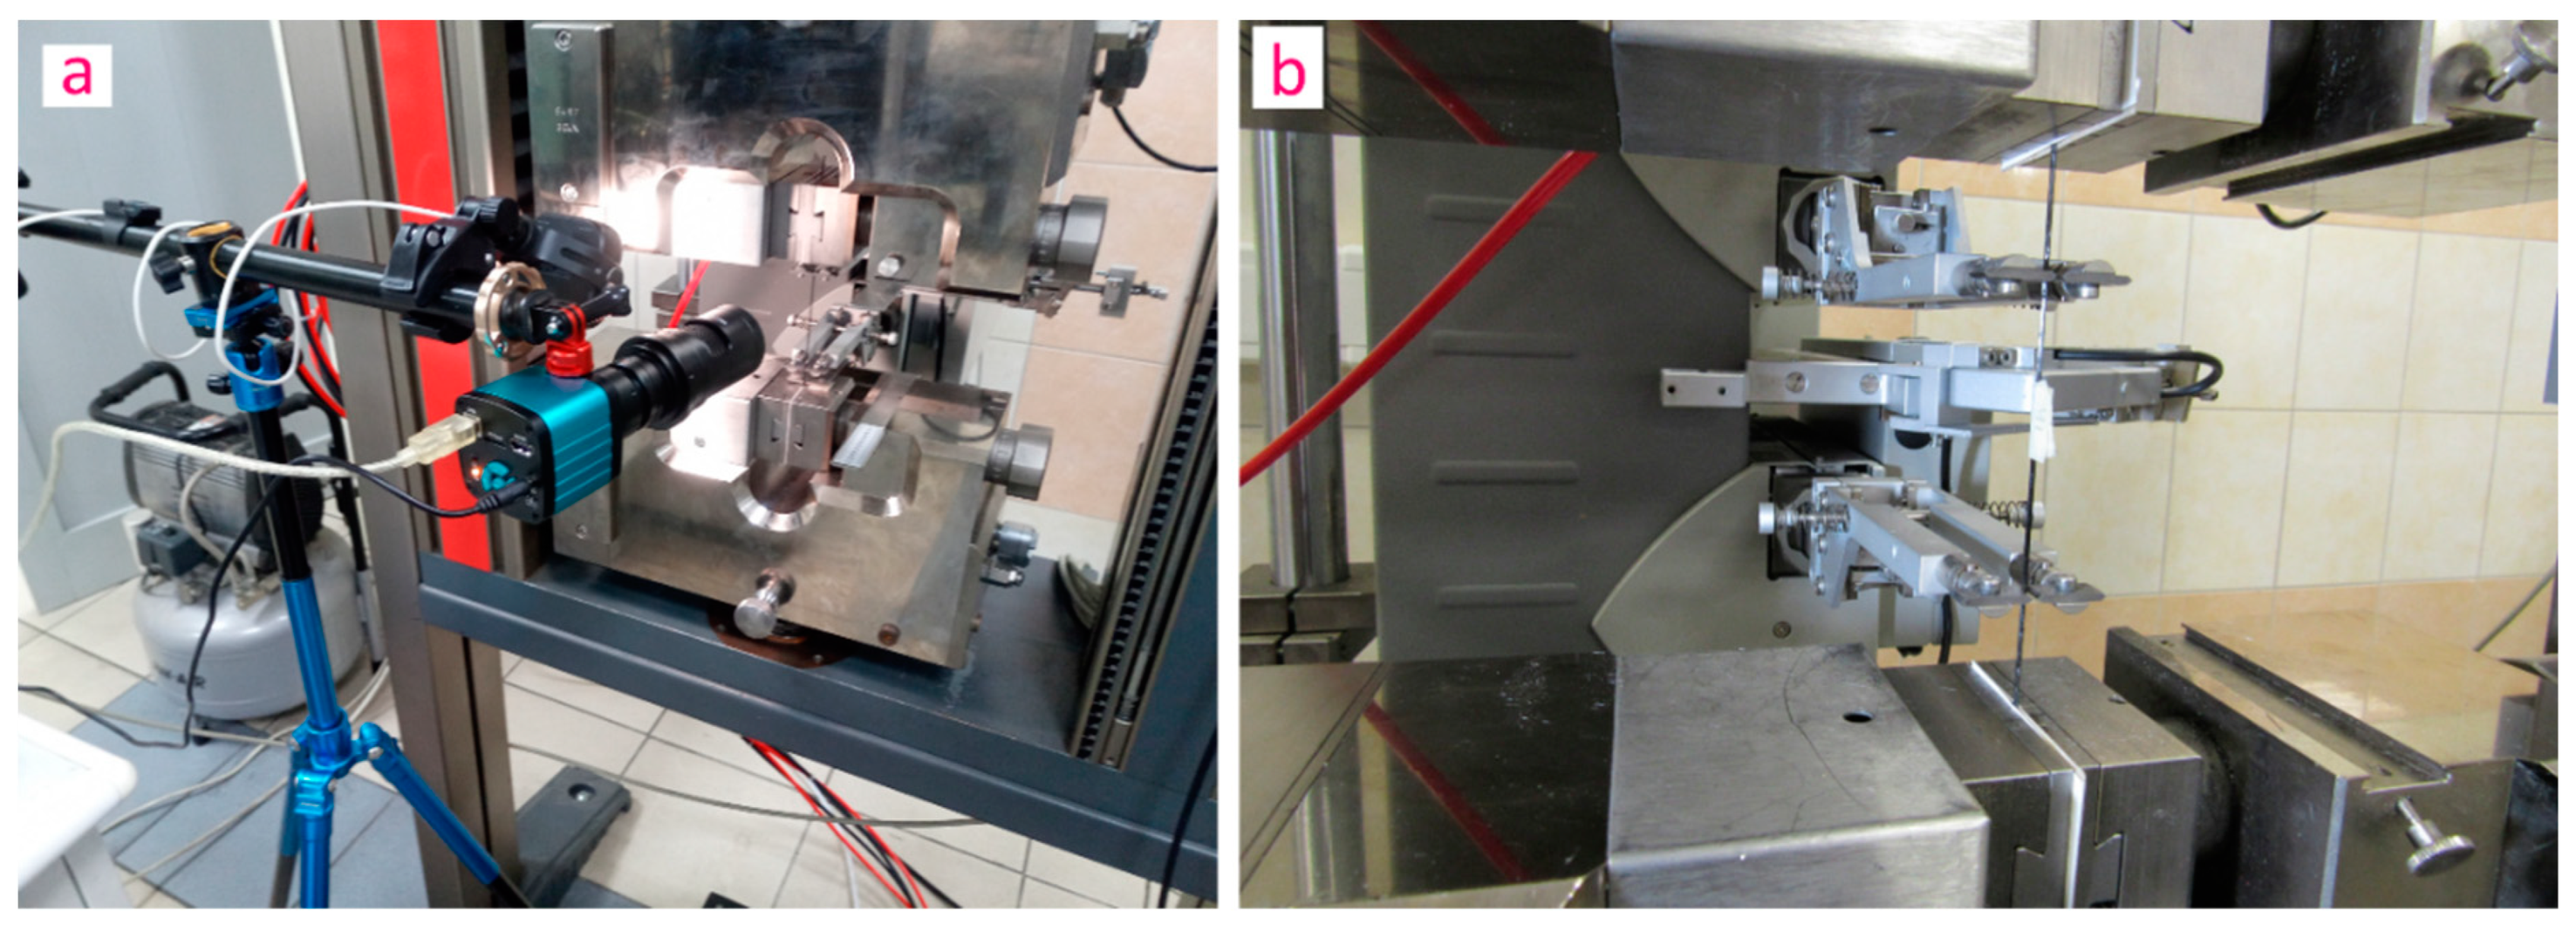
Figure 2.
SEM micrographs of polysulfone reinforced with high-strength Toray T700SC – 12K carbon fiber with the matrix polymer partially removed by dissolution, see text for comments.
Figure 2.
SEM micrographs of polysulfone reinforced with high-strength Toray T700SC – 12K carbon fiber with the matrix polymer partially removed by dissolution, see text for comments.
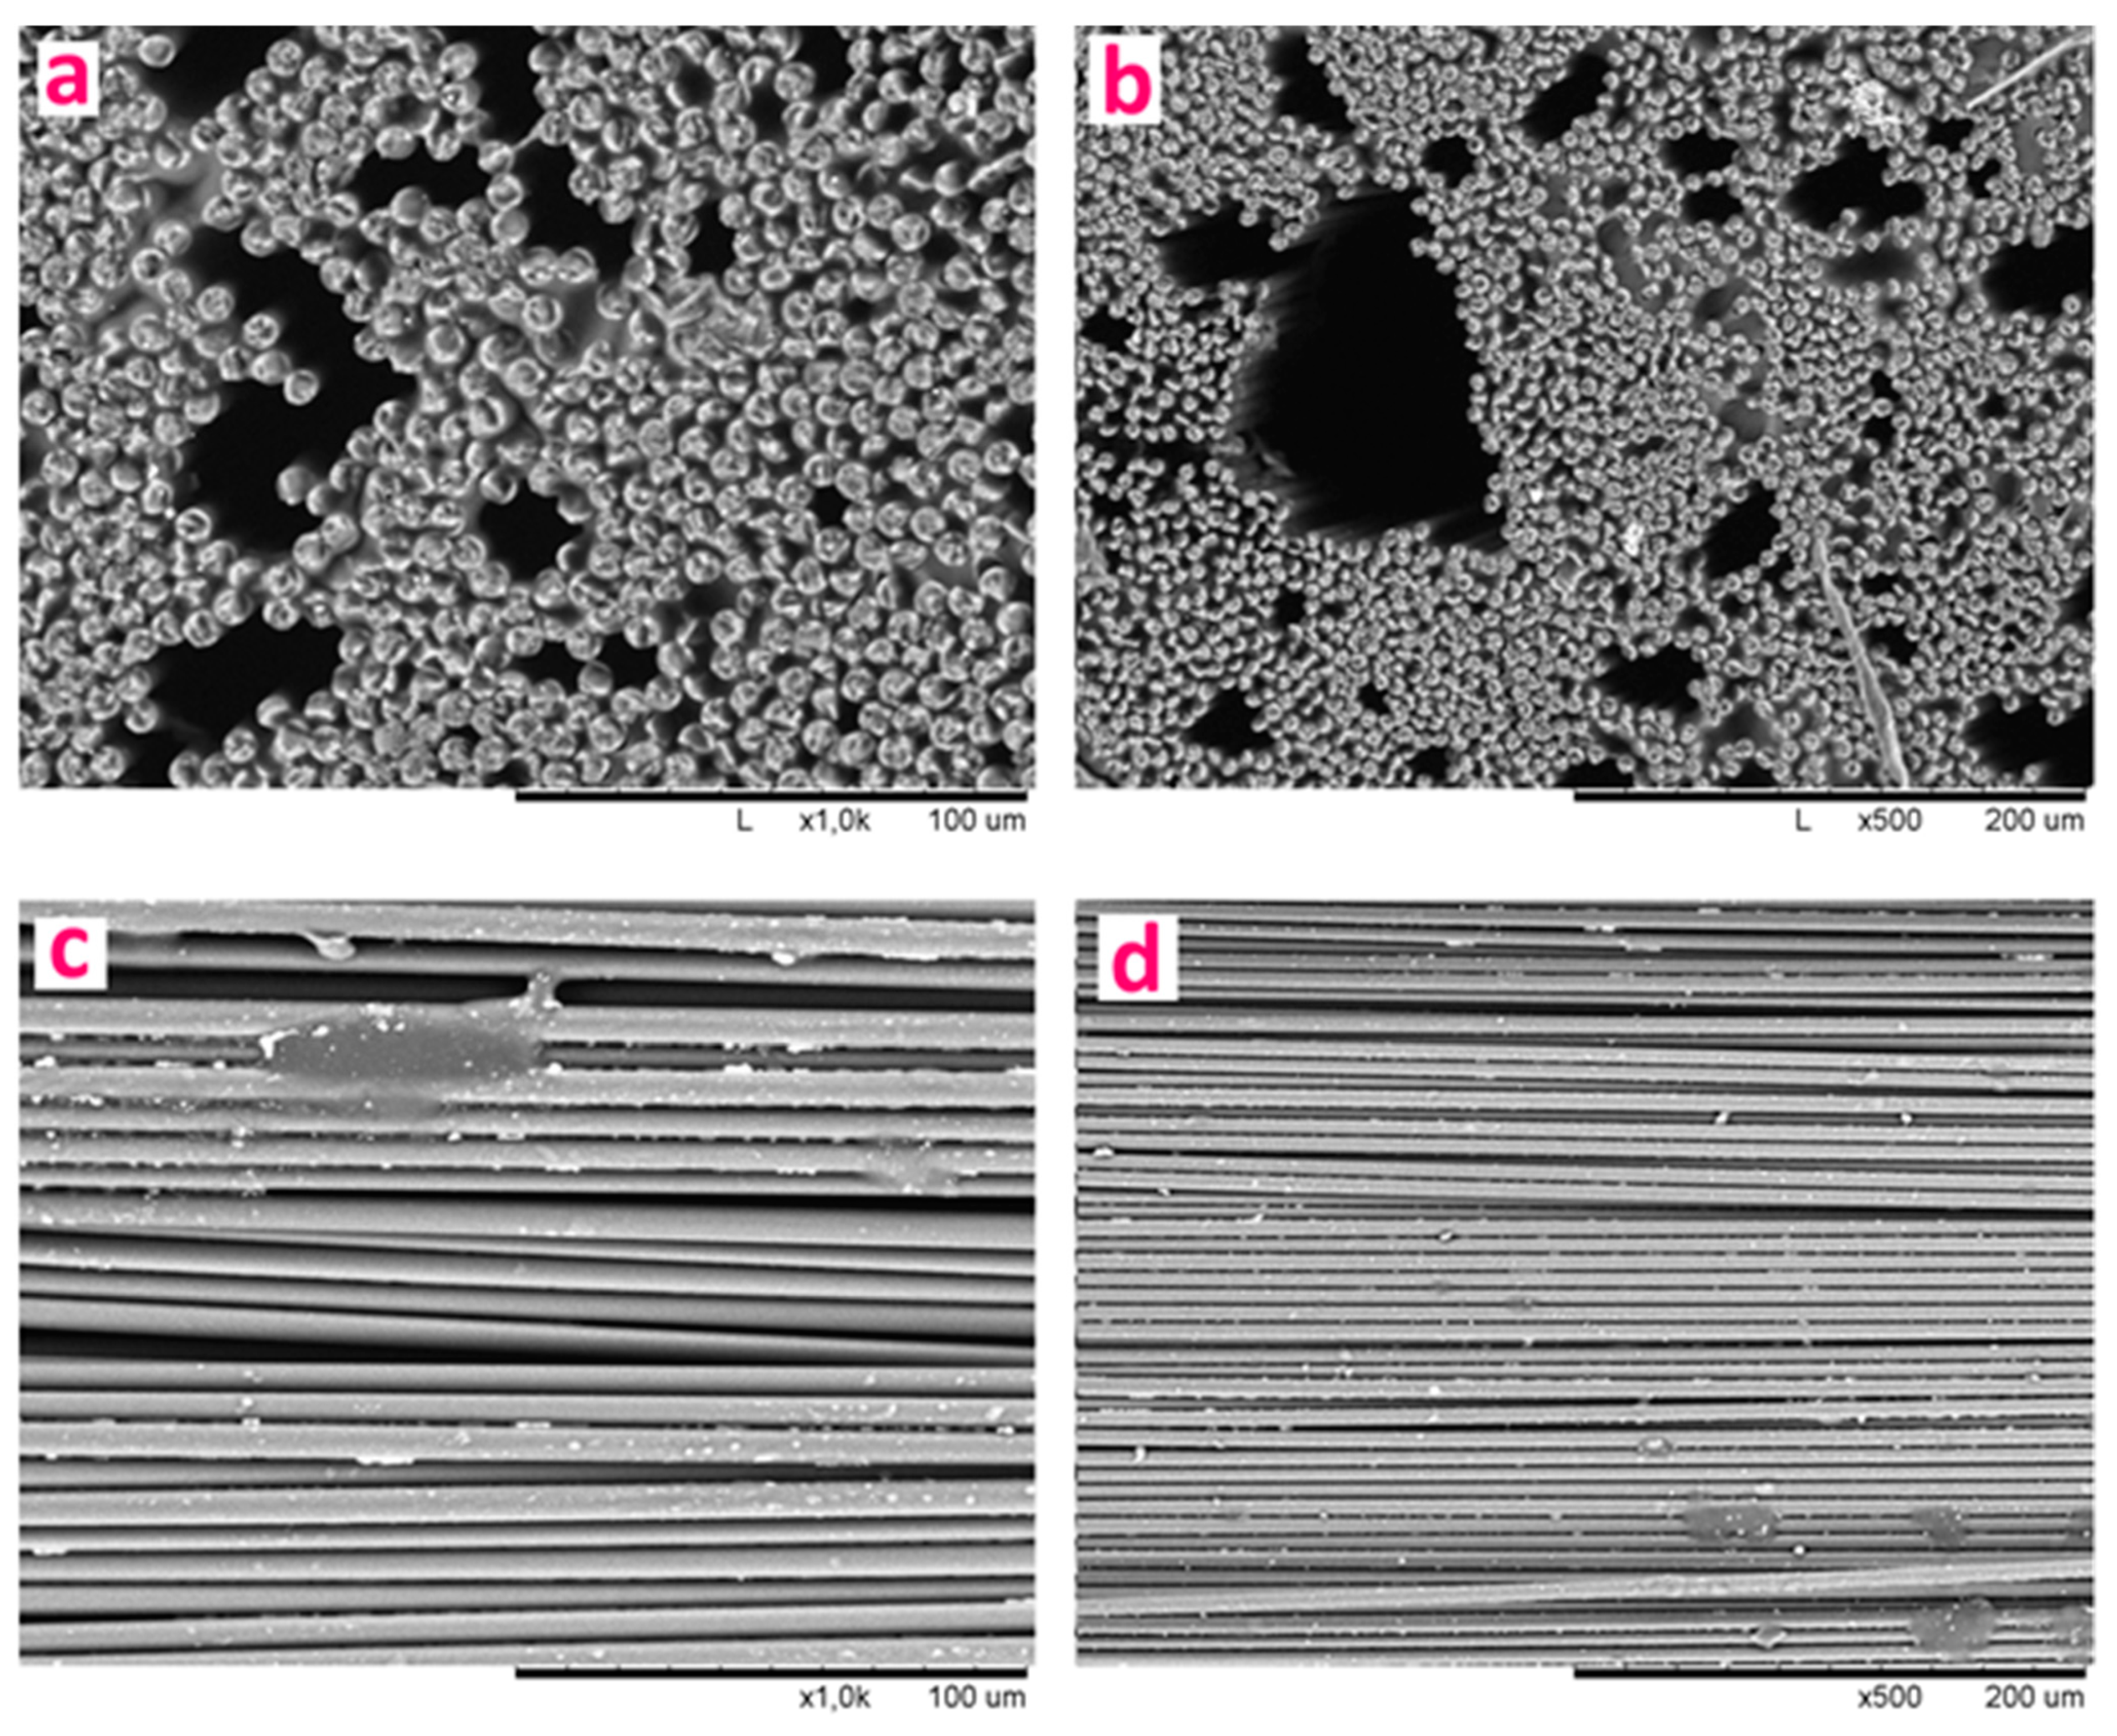
Figure 3.
Strain-stress diagrams for composites containing 60 wt. % of fiber reinforced with (a) high-strength Toray T700-12K fiber, (b) high-modulus UMT400-12K fiber.
Figure 3.
Strain-stress diagrams for composites containing 60 wt. % of fiber reinforced with (a) high-strength Toray T700-12K fiber, (b) high-modulus UMT400-12K fiber.
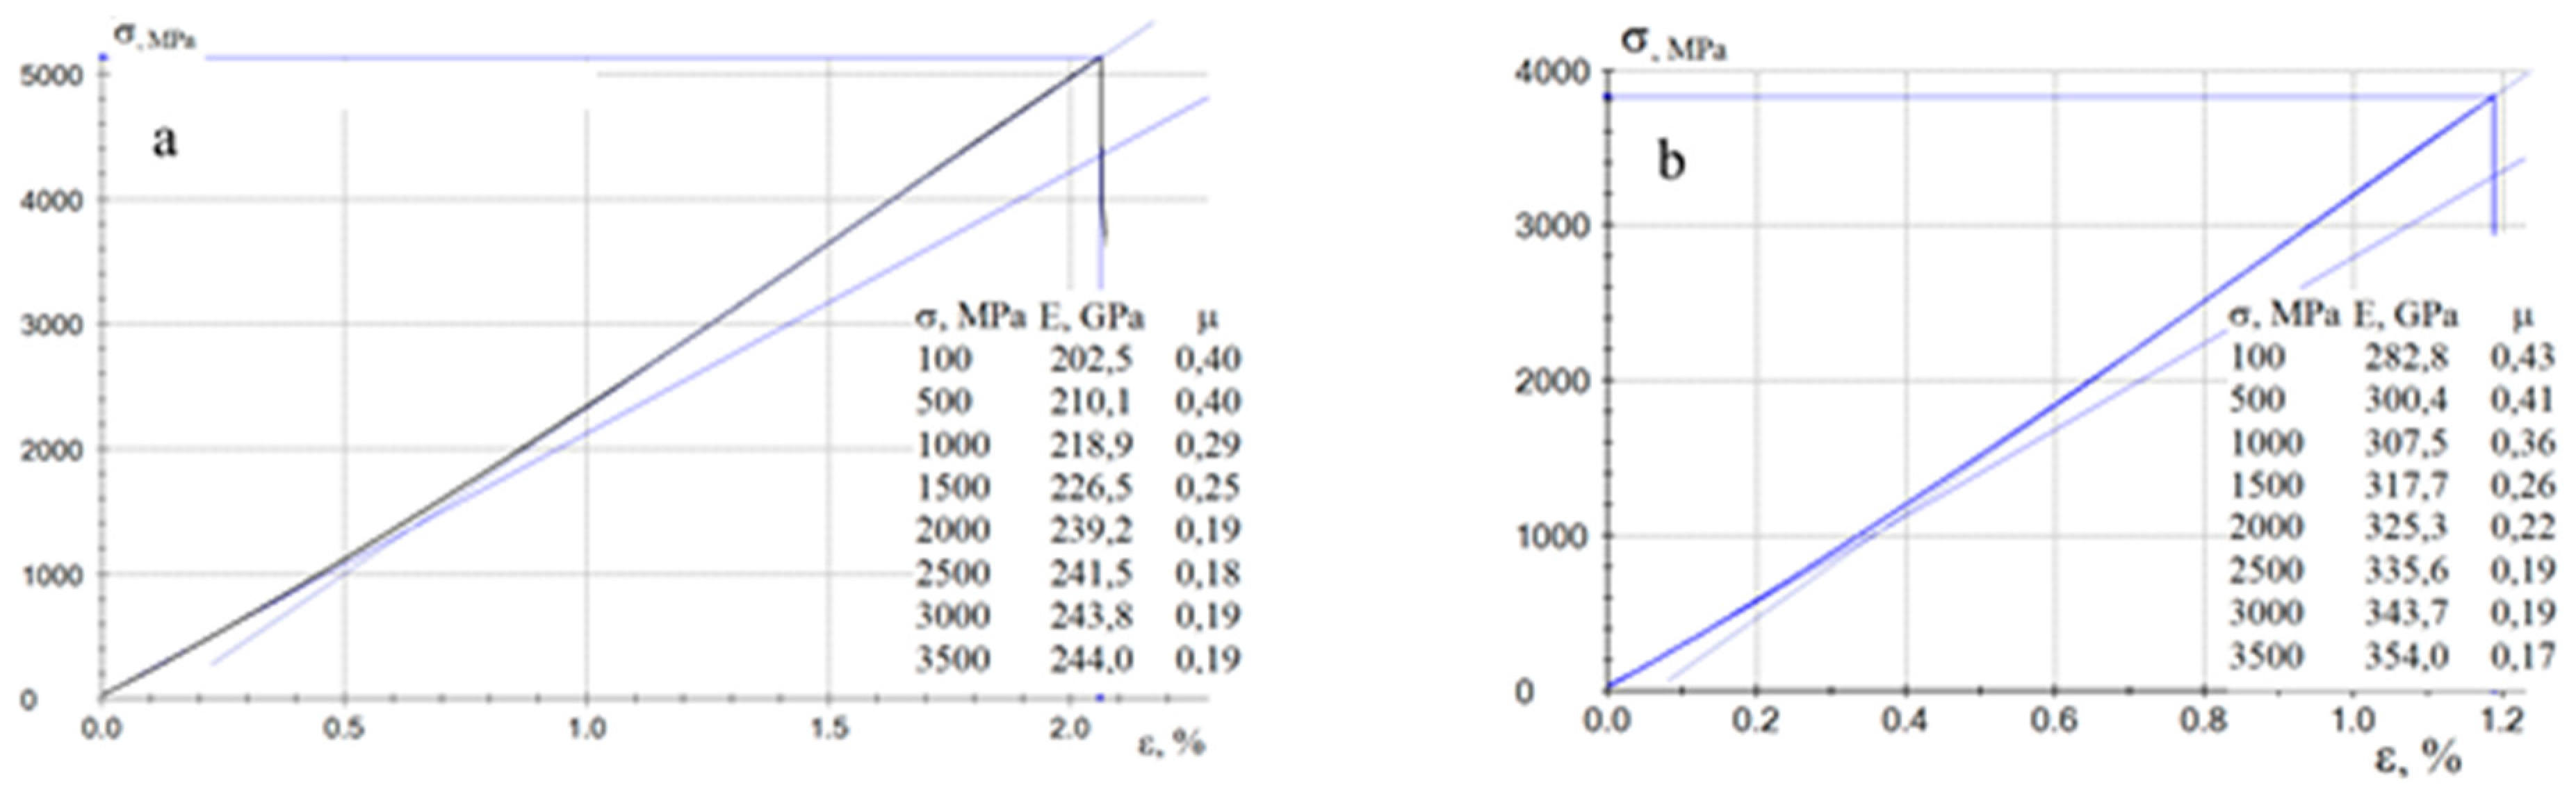
Figure 4.
Evolution of longitudinal (a, c, e) and transverse (b, d, f) deformations in the PSU+Toray T700 composite composites containing 60 wt. % of fiber. (a, b) – initial section of the diagram (stresses of 25 to 100 MPa), (c, d) – stress of 700 MPa, (e, f) – stress of 3500 MPa.
Figure 4.
Evolution of longitudinal (a, c, e) and transverse (b, d, f) deformations in the PSU+Toray T700 composite composites containing 60 wt. % of fiber. (a, b) – initial section of the diagram (stresses of 25 to 100 MPa), (c, d) – stress of 700 MPa, (e, f) – stress of 3500 MPa.
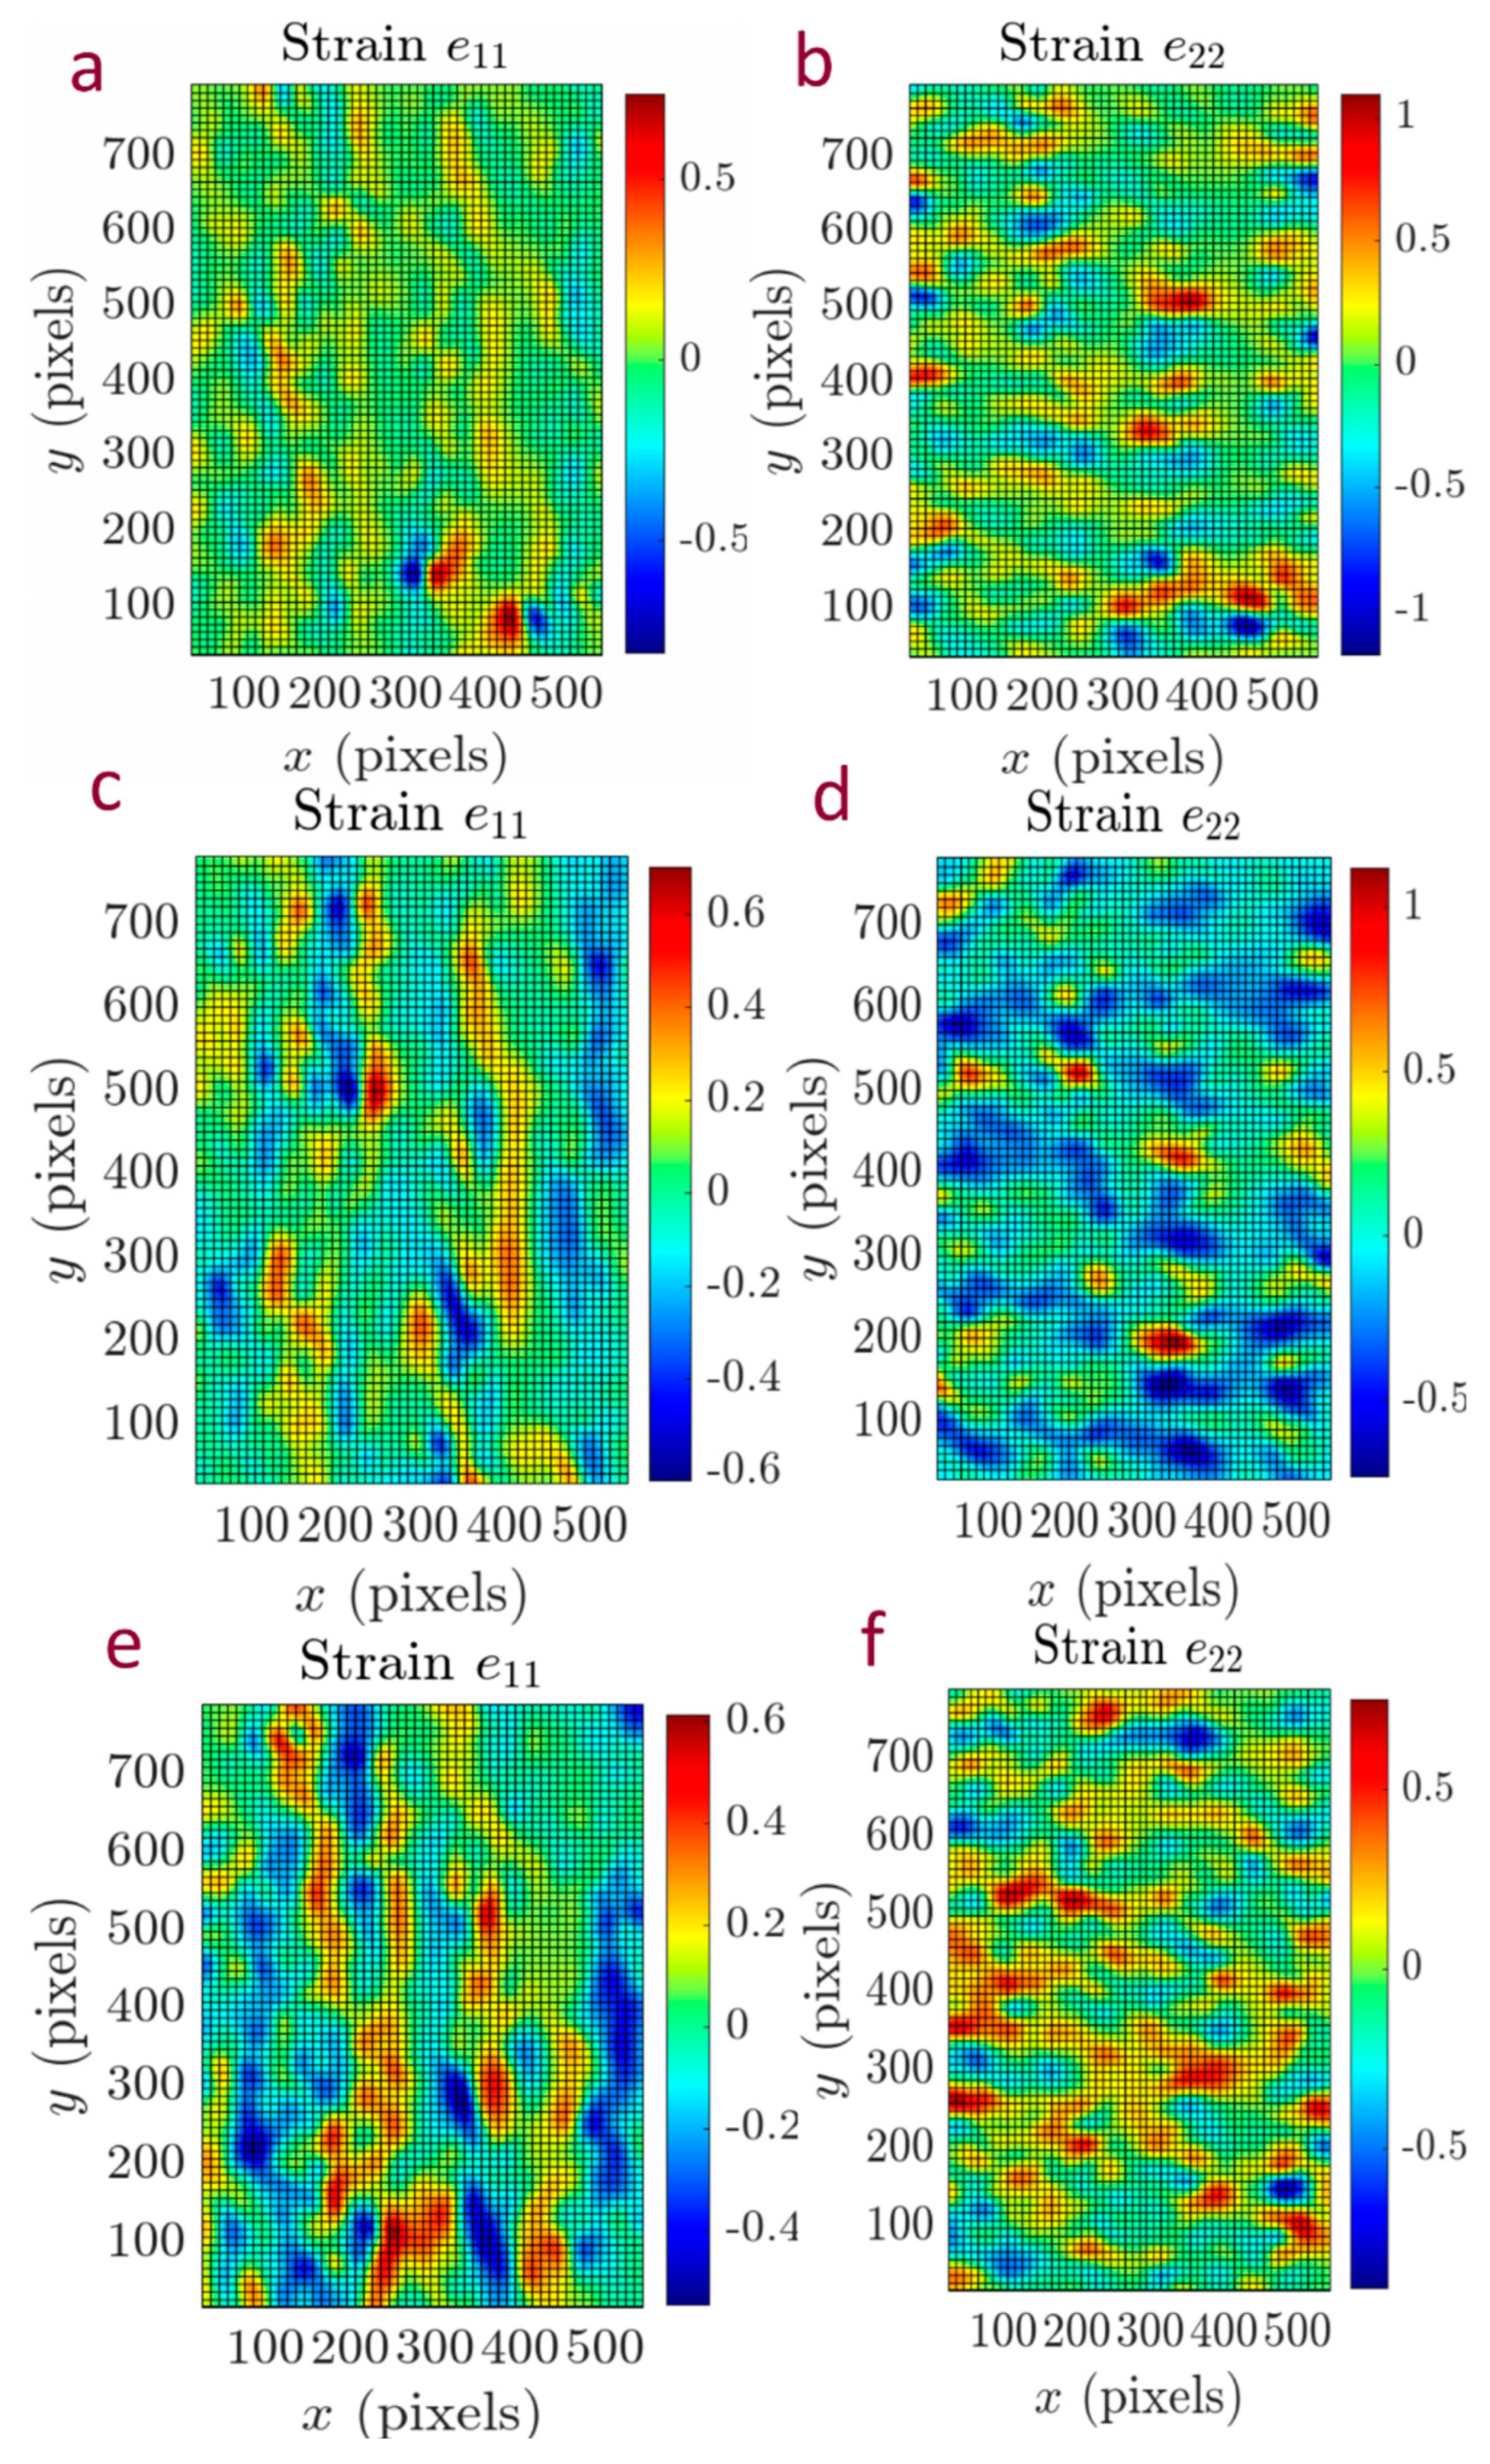
Figure 5.
Overlay of longitudinal e11 (a, c) and transverse e22 (b, d) strain fields in the PSU+Toray T700 composite containing 60 wt. % of fiber onto the SEM image of sample.
Figure 5.
Overlay of longitudinal e11 (a, c) and transverse e22 (b, d) strain fields in the PSU+Toray T700 composite containing 60 wt. % of fiber onto the SEM image of sample.
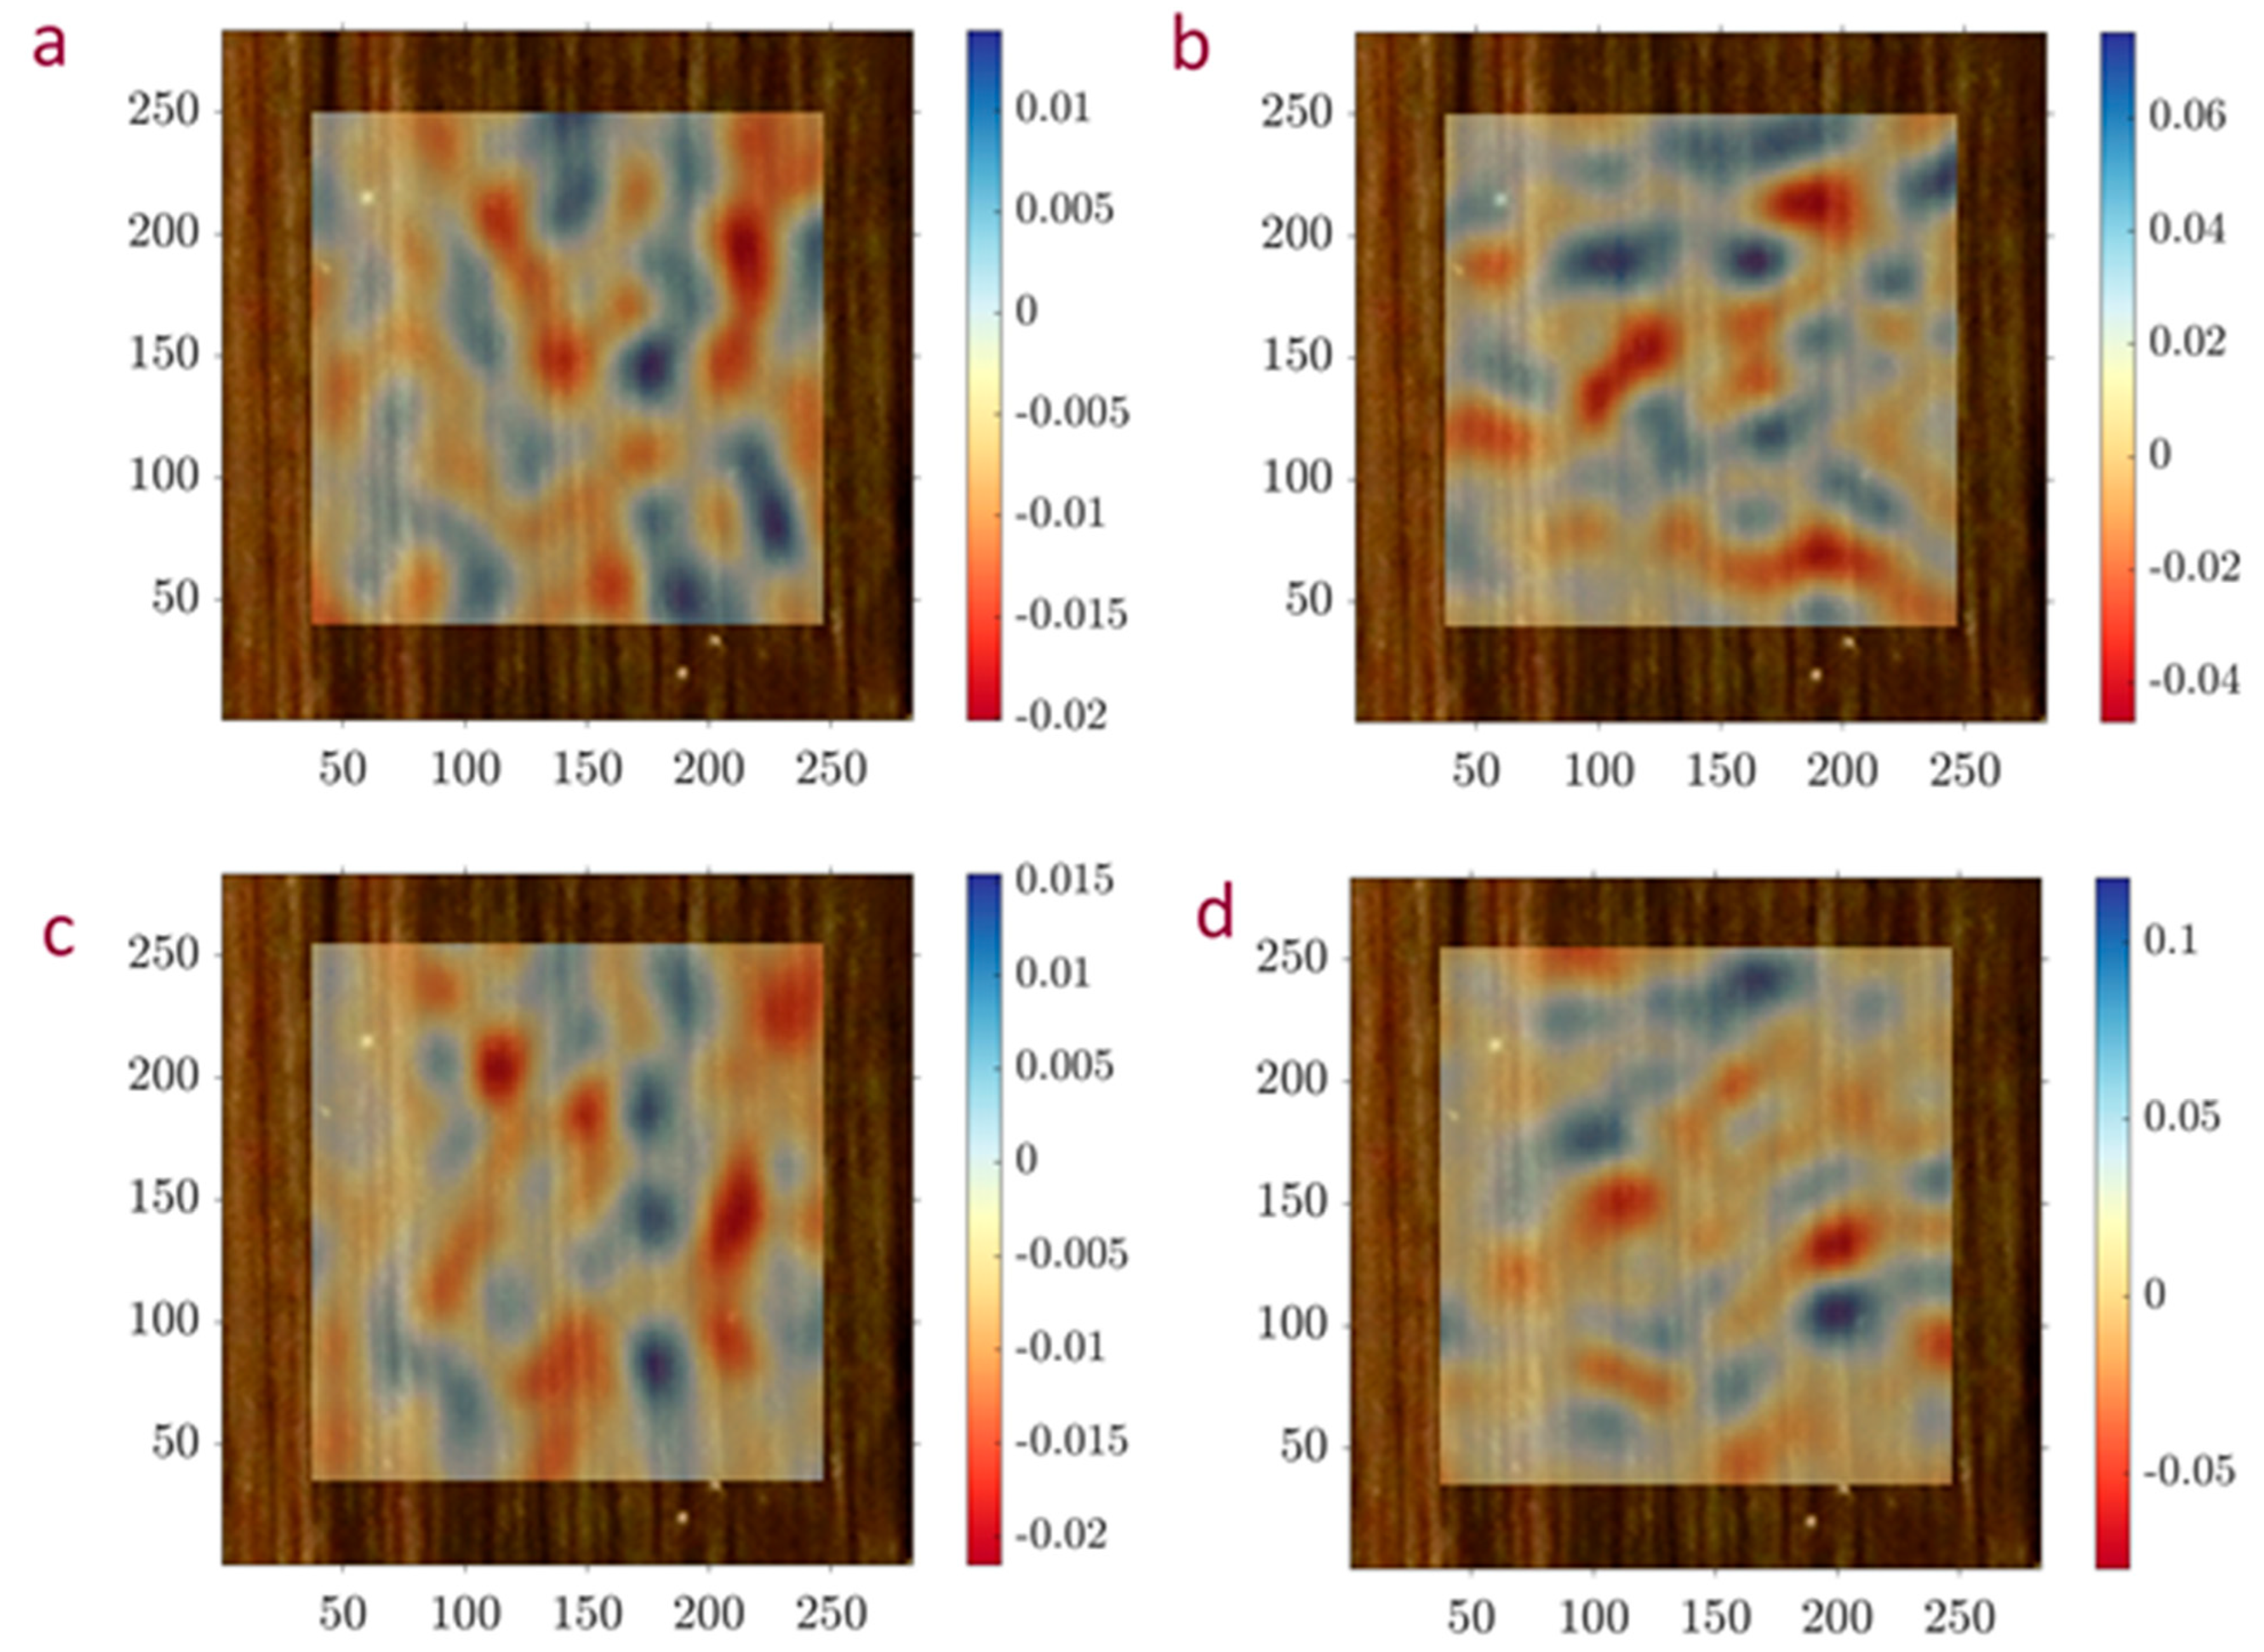
Figure 6.
SEM images of the damage of the individual filaments in UMT400-12K composite composites containing 60 wt. % of fiber after loading of (a) maximum stress of 500 MPa and (b) maximum stress of 2000 MPa.
Figure 6.
SEM images of the damage of the individual filaments in UMT400-12K composite composites containing 60 wt. % of fiber after loading of (a) maximum stress of 500 MPa and (b) maximum stress of 2000 MPa.
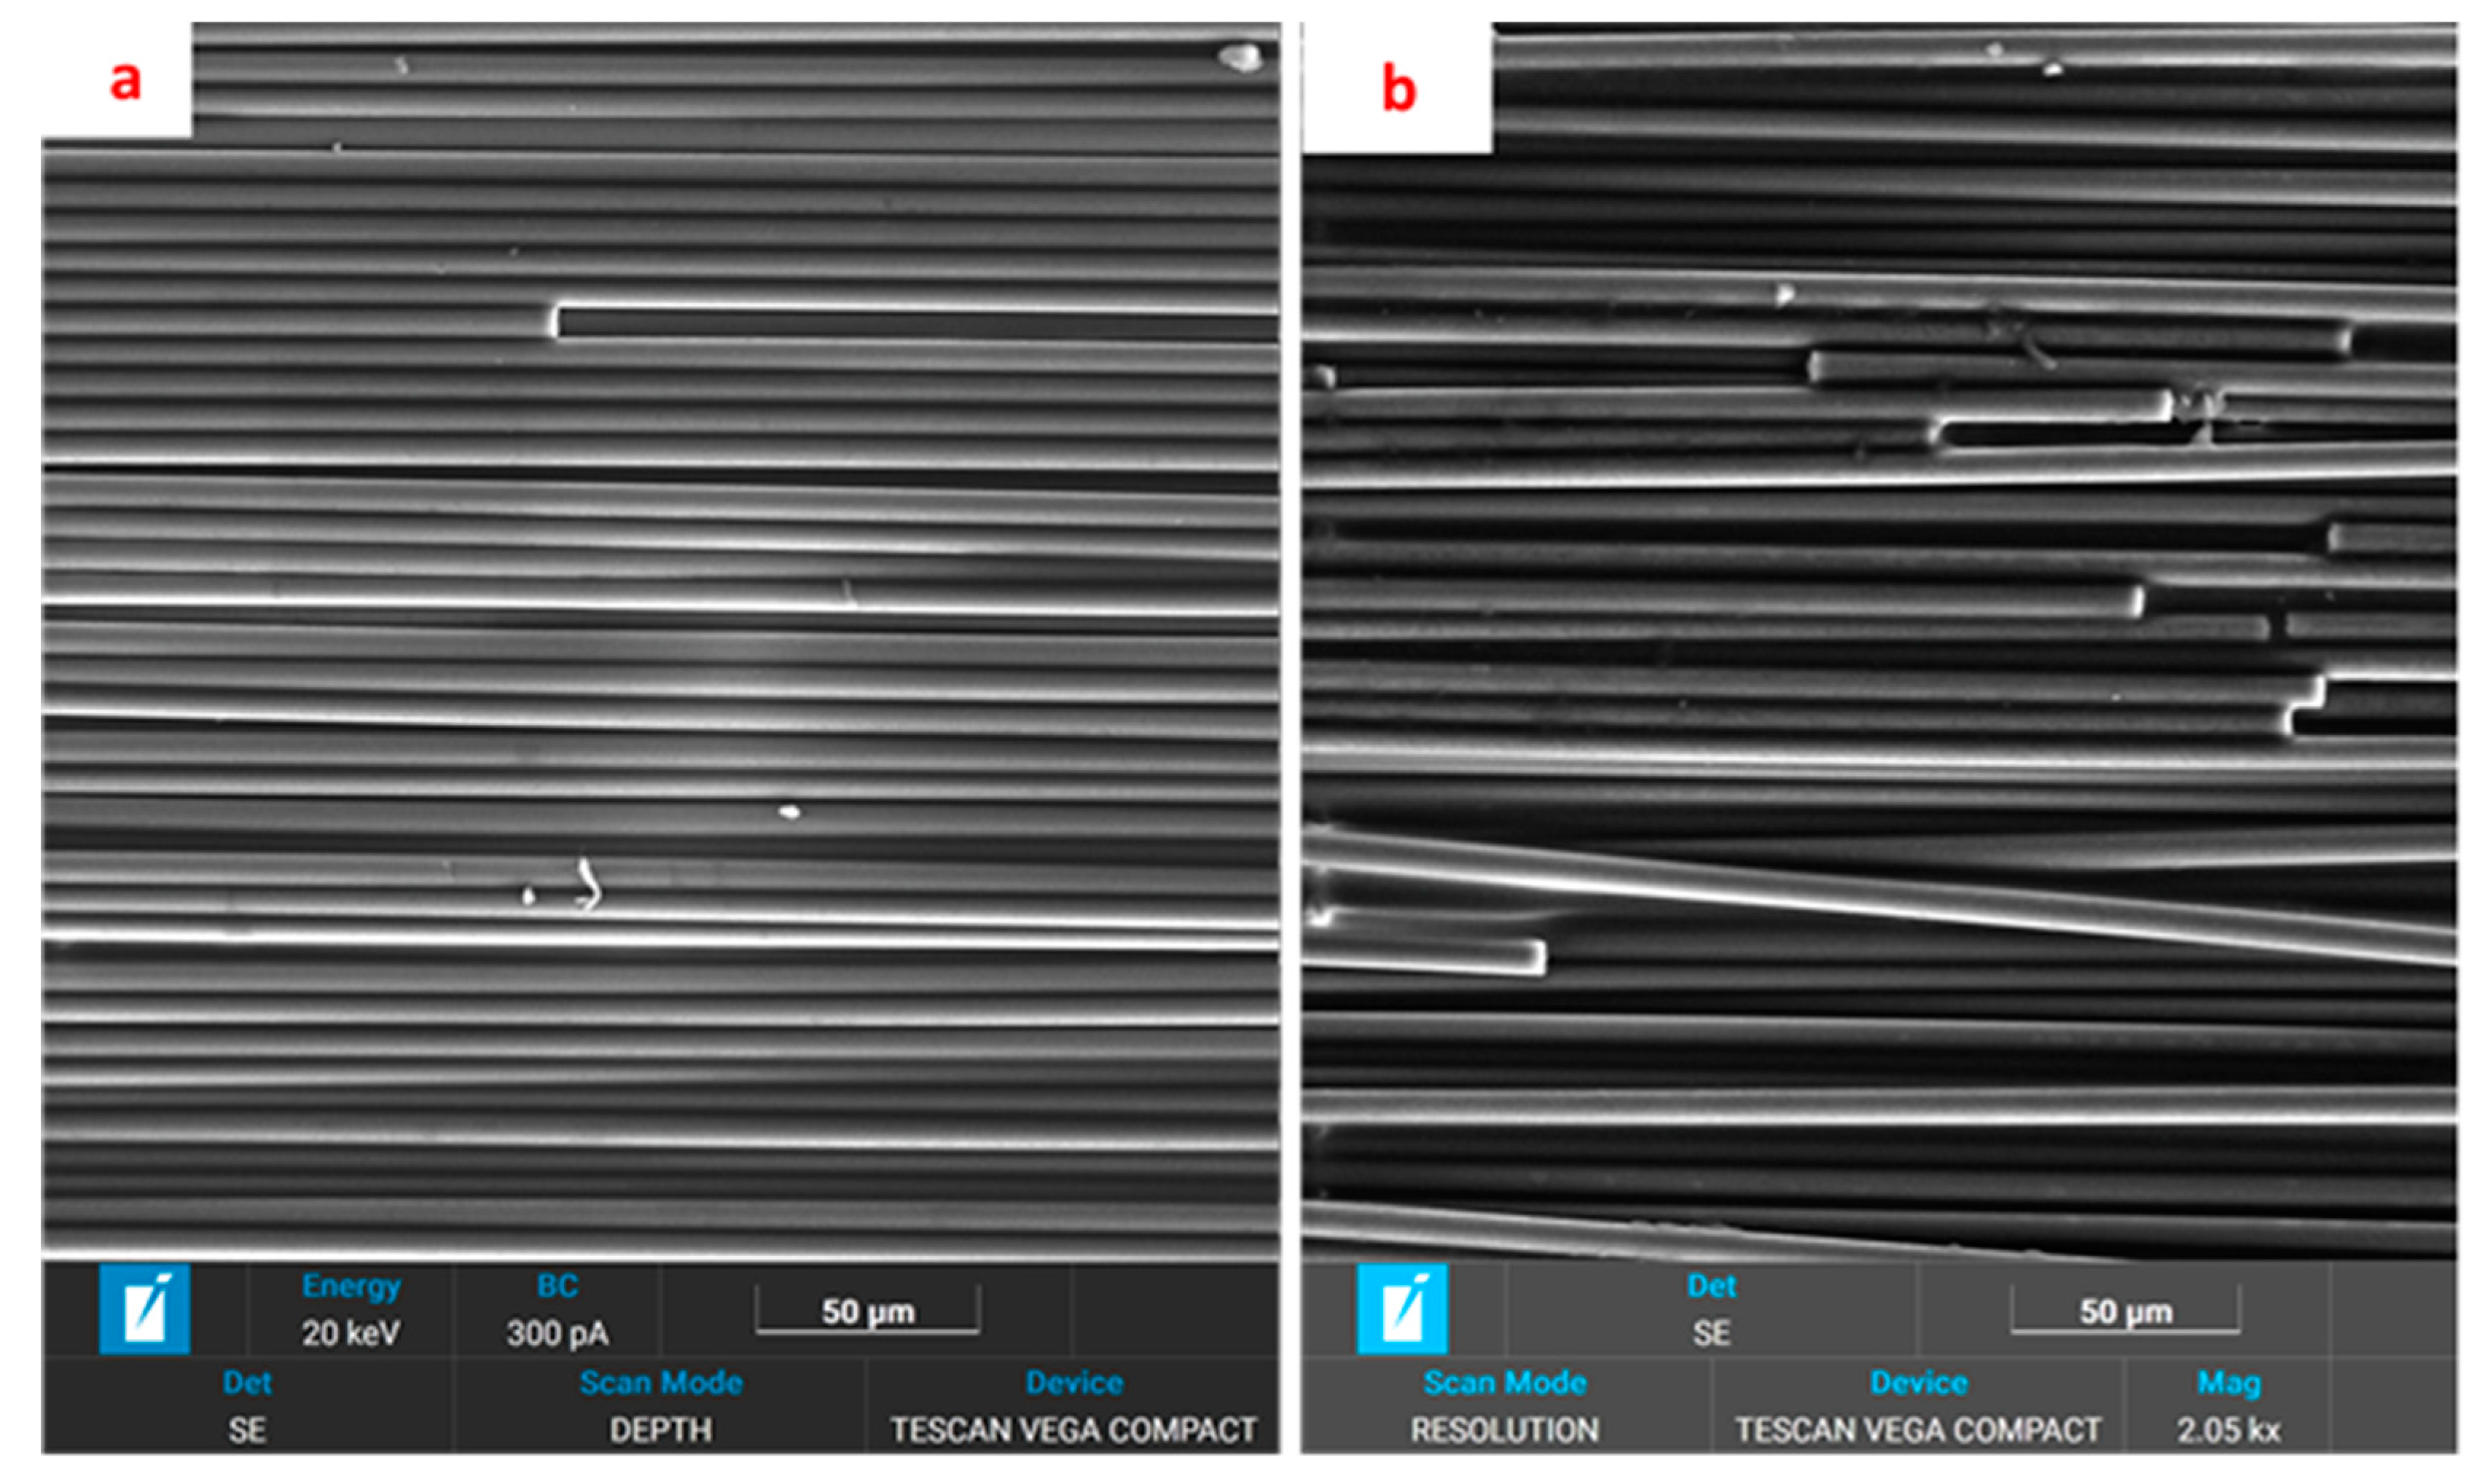
Figure 7.
Creep in composites containing 60 wt. % of high-strength Toray T700-12K fiber.
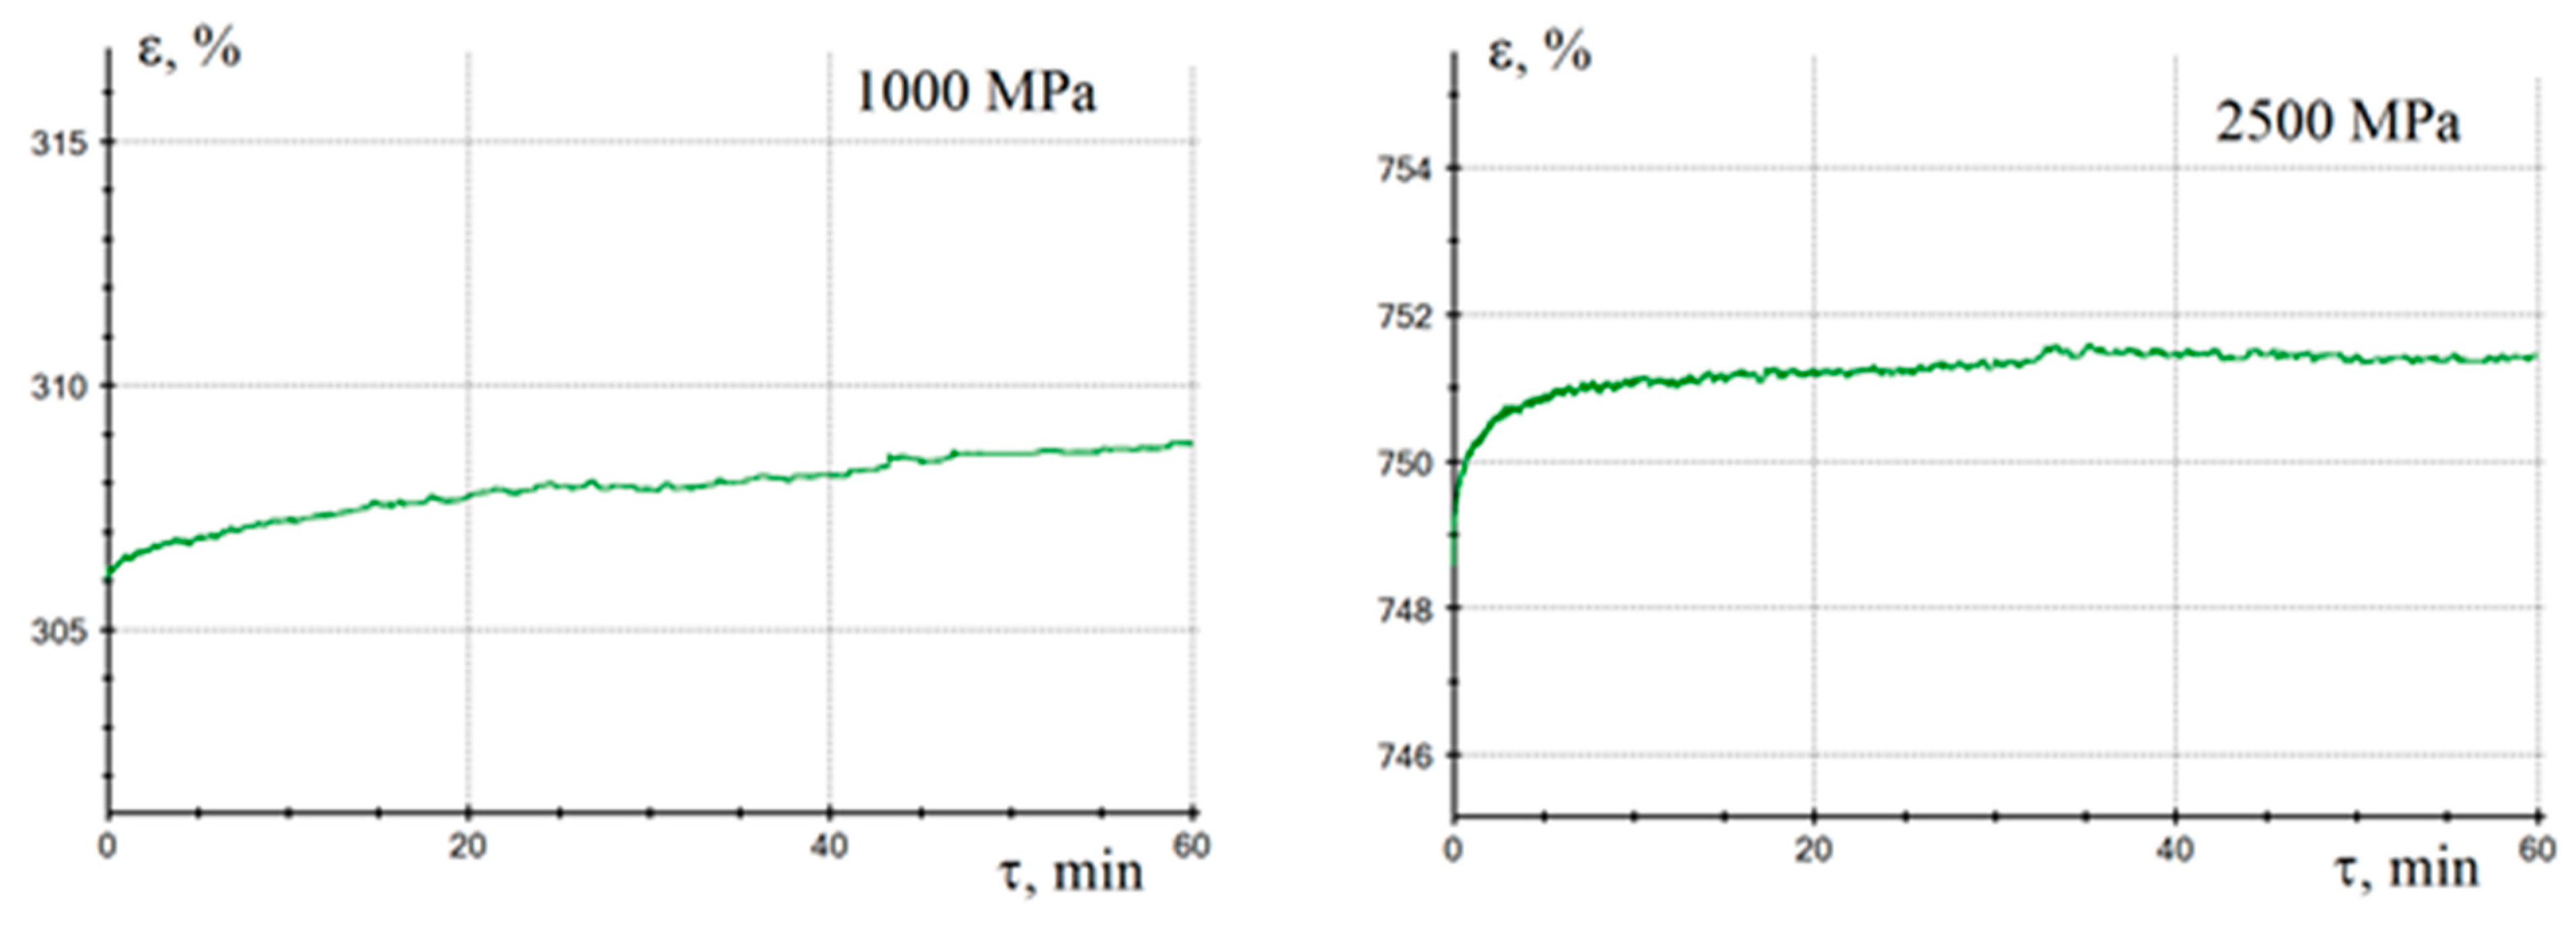
Figure 8.
Stress relaxation in composites containing 60 wt. % of high-strength Toray T700-12K fiber.
Figure 8.
Stress relaxation in composites containing 60 wt. % of high-strength Toray T700-12K fiber.
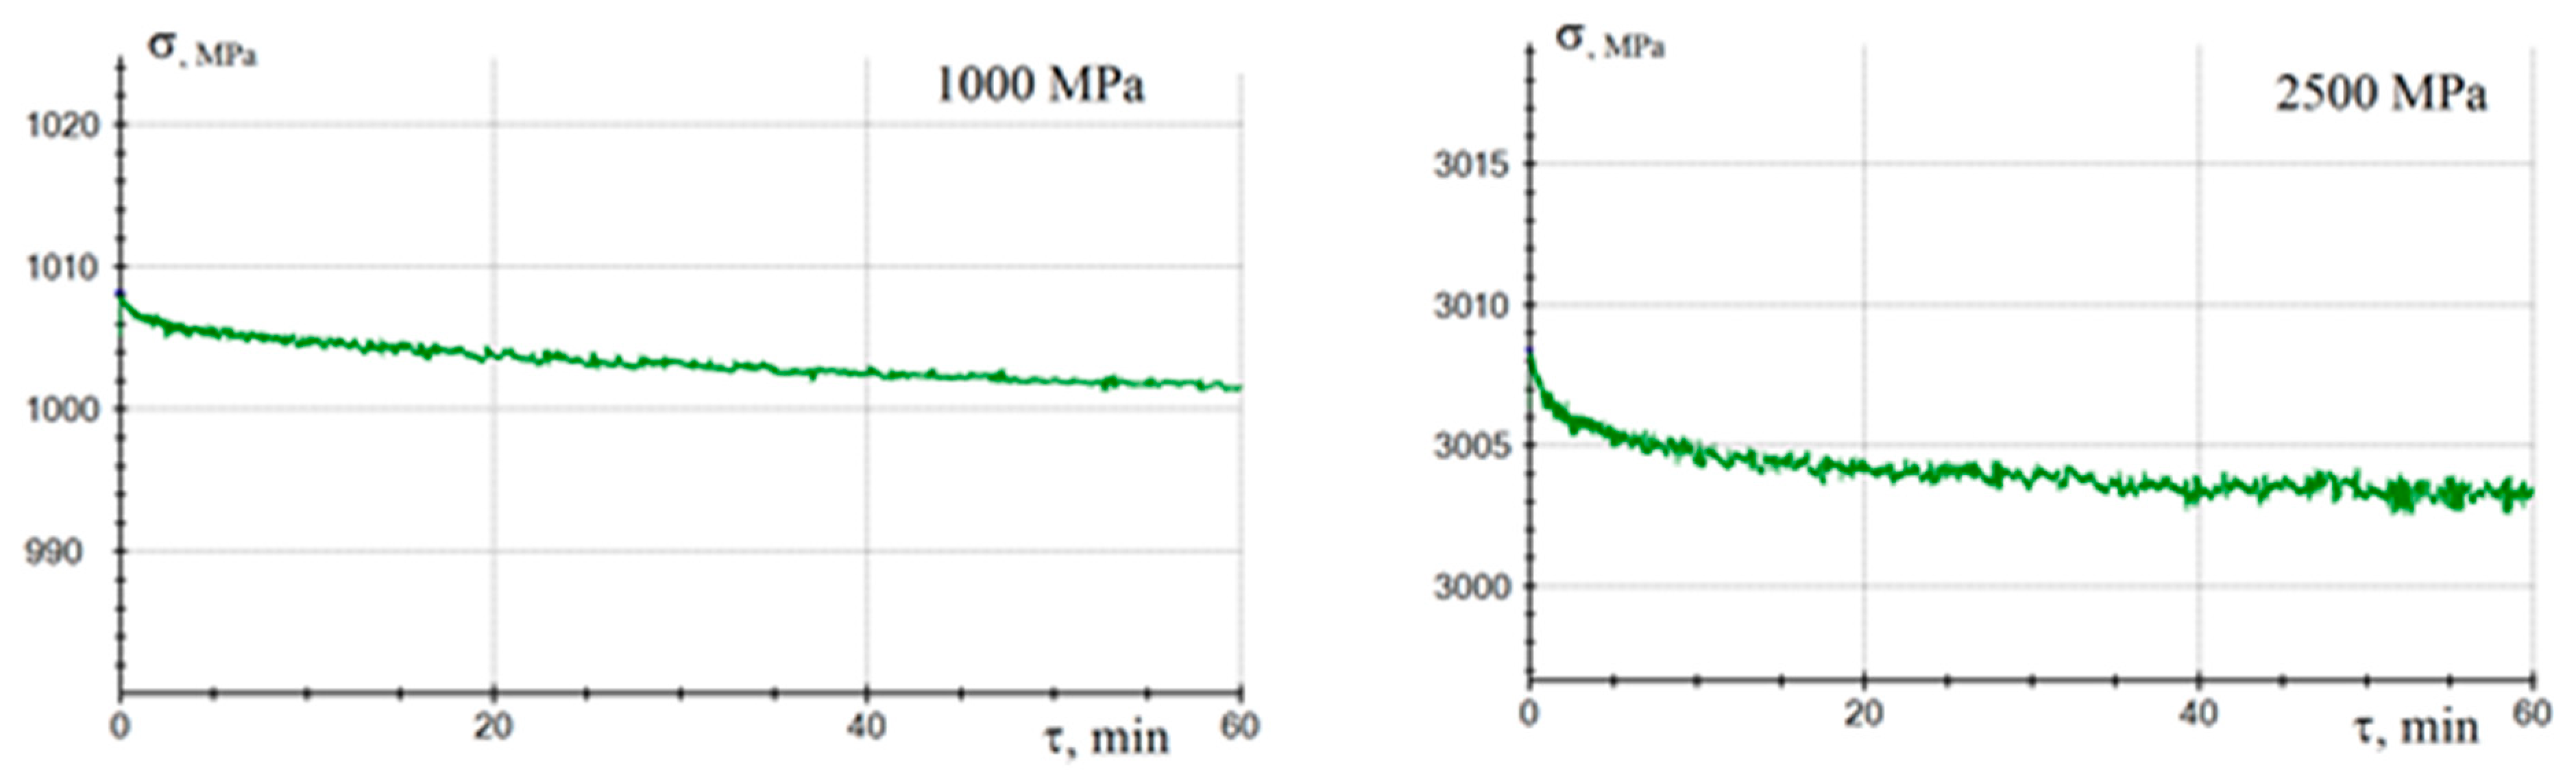
Figure 9.
SEM image of the damage in composites containing 60 wt. % of high-strength Toray T700-12K (a, b) and high-modulus UMT400-12K (b, c) carbon fibers after creep tests at stress of 3000 MPa.
Figure 9.
SEM image of the damage in composites containing 60 wt. % of high-strength Toray T700-12K (a, b) and high-modulus UMT400-12K (b, c) carbon fibers after creep tests at stress of 3000 MPa.
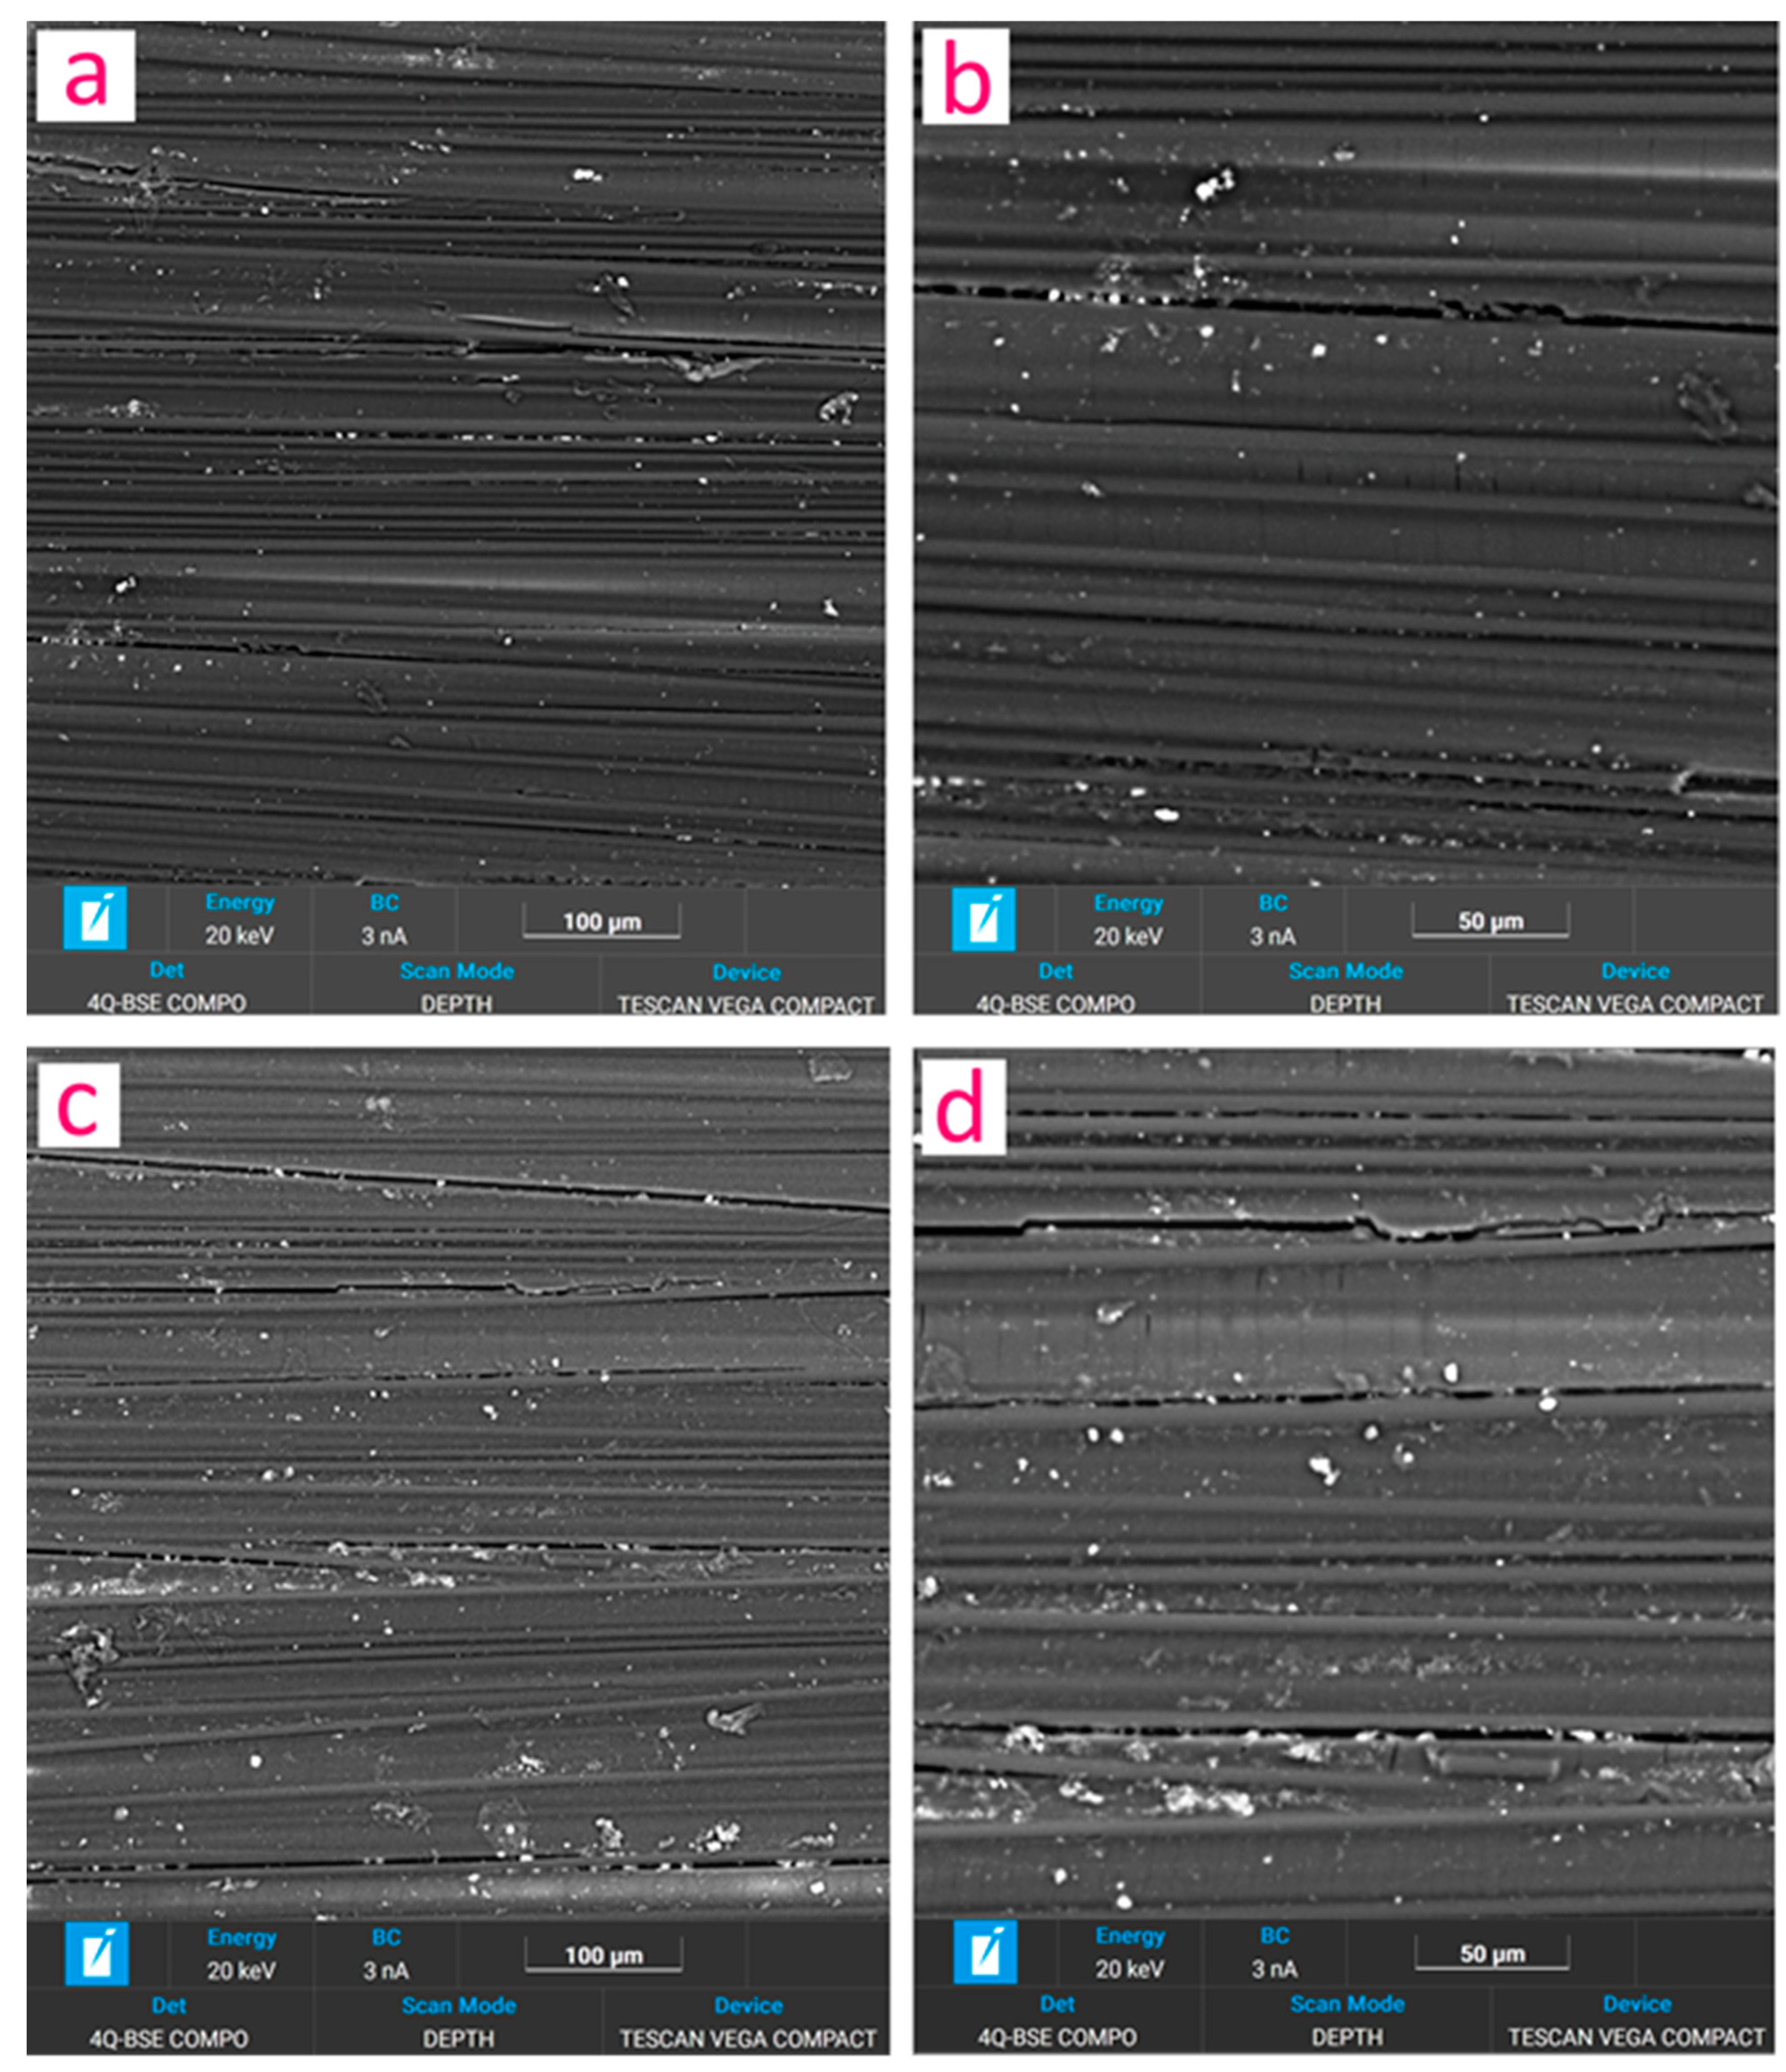
Figure 10.
Initial moment of low-cycle fatigue testing of the composites containing 60 wt. % of high-strength Toray T700-12K fiber, 4th loading cycle. Strain measurement was realized using the Zwick/Roell MultiXtens sensor.
Figure 10.
Initial moment of low-cycle fatigue testing of the composites containing 60 wt. % of high-strength Toray T700-12K fiber, 4th loading cycle. Strain measurement was realized using the Zwick/Roell MultiXtens sensor.
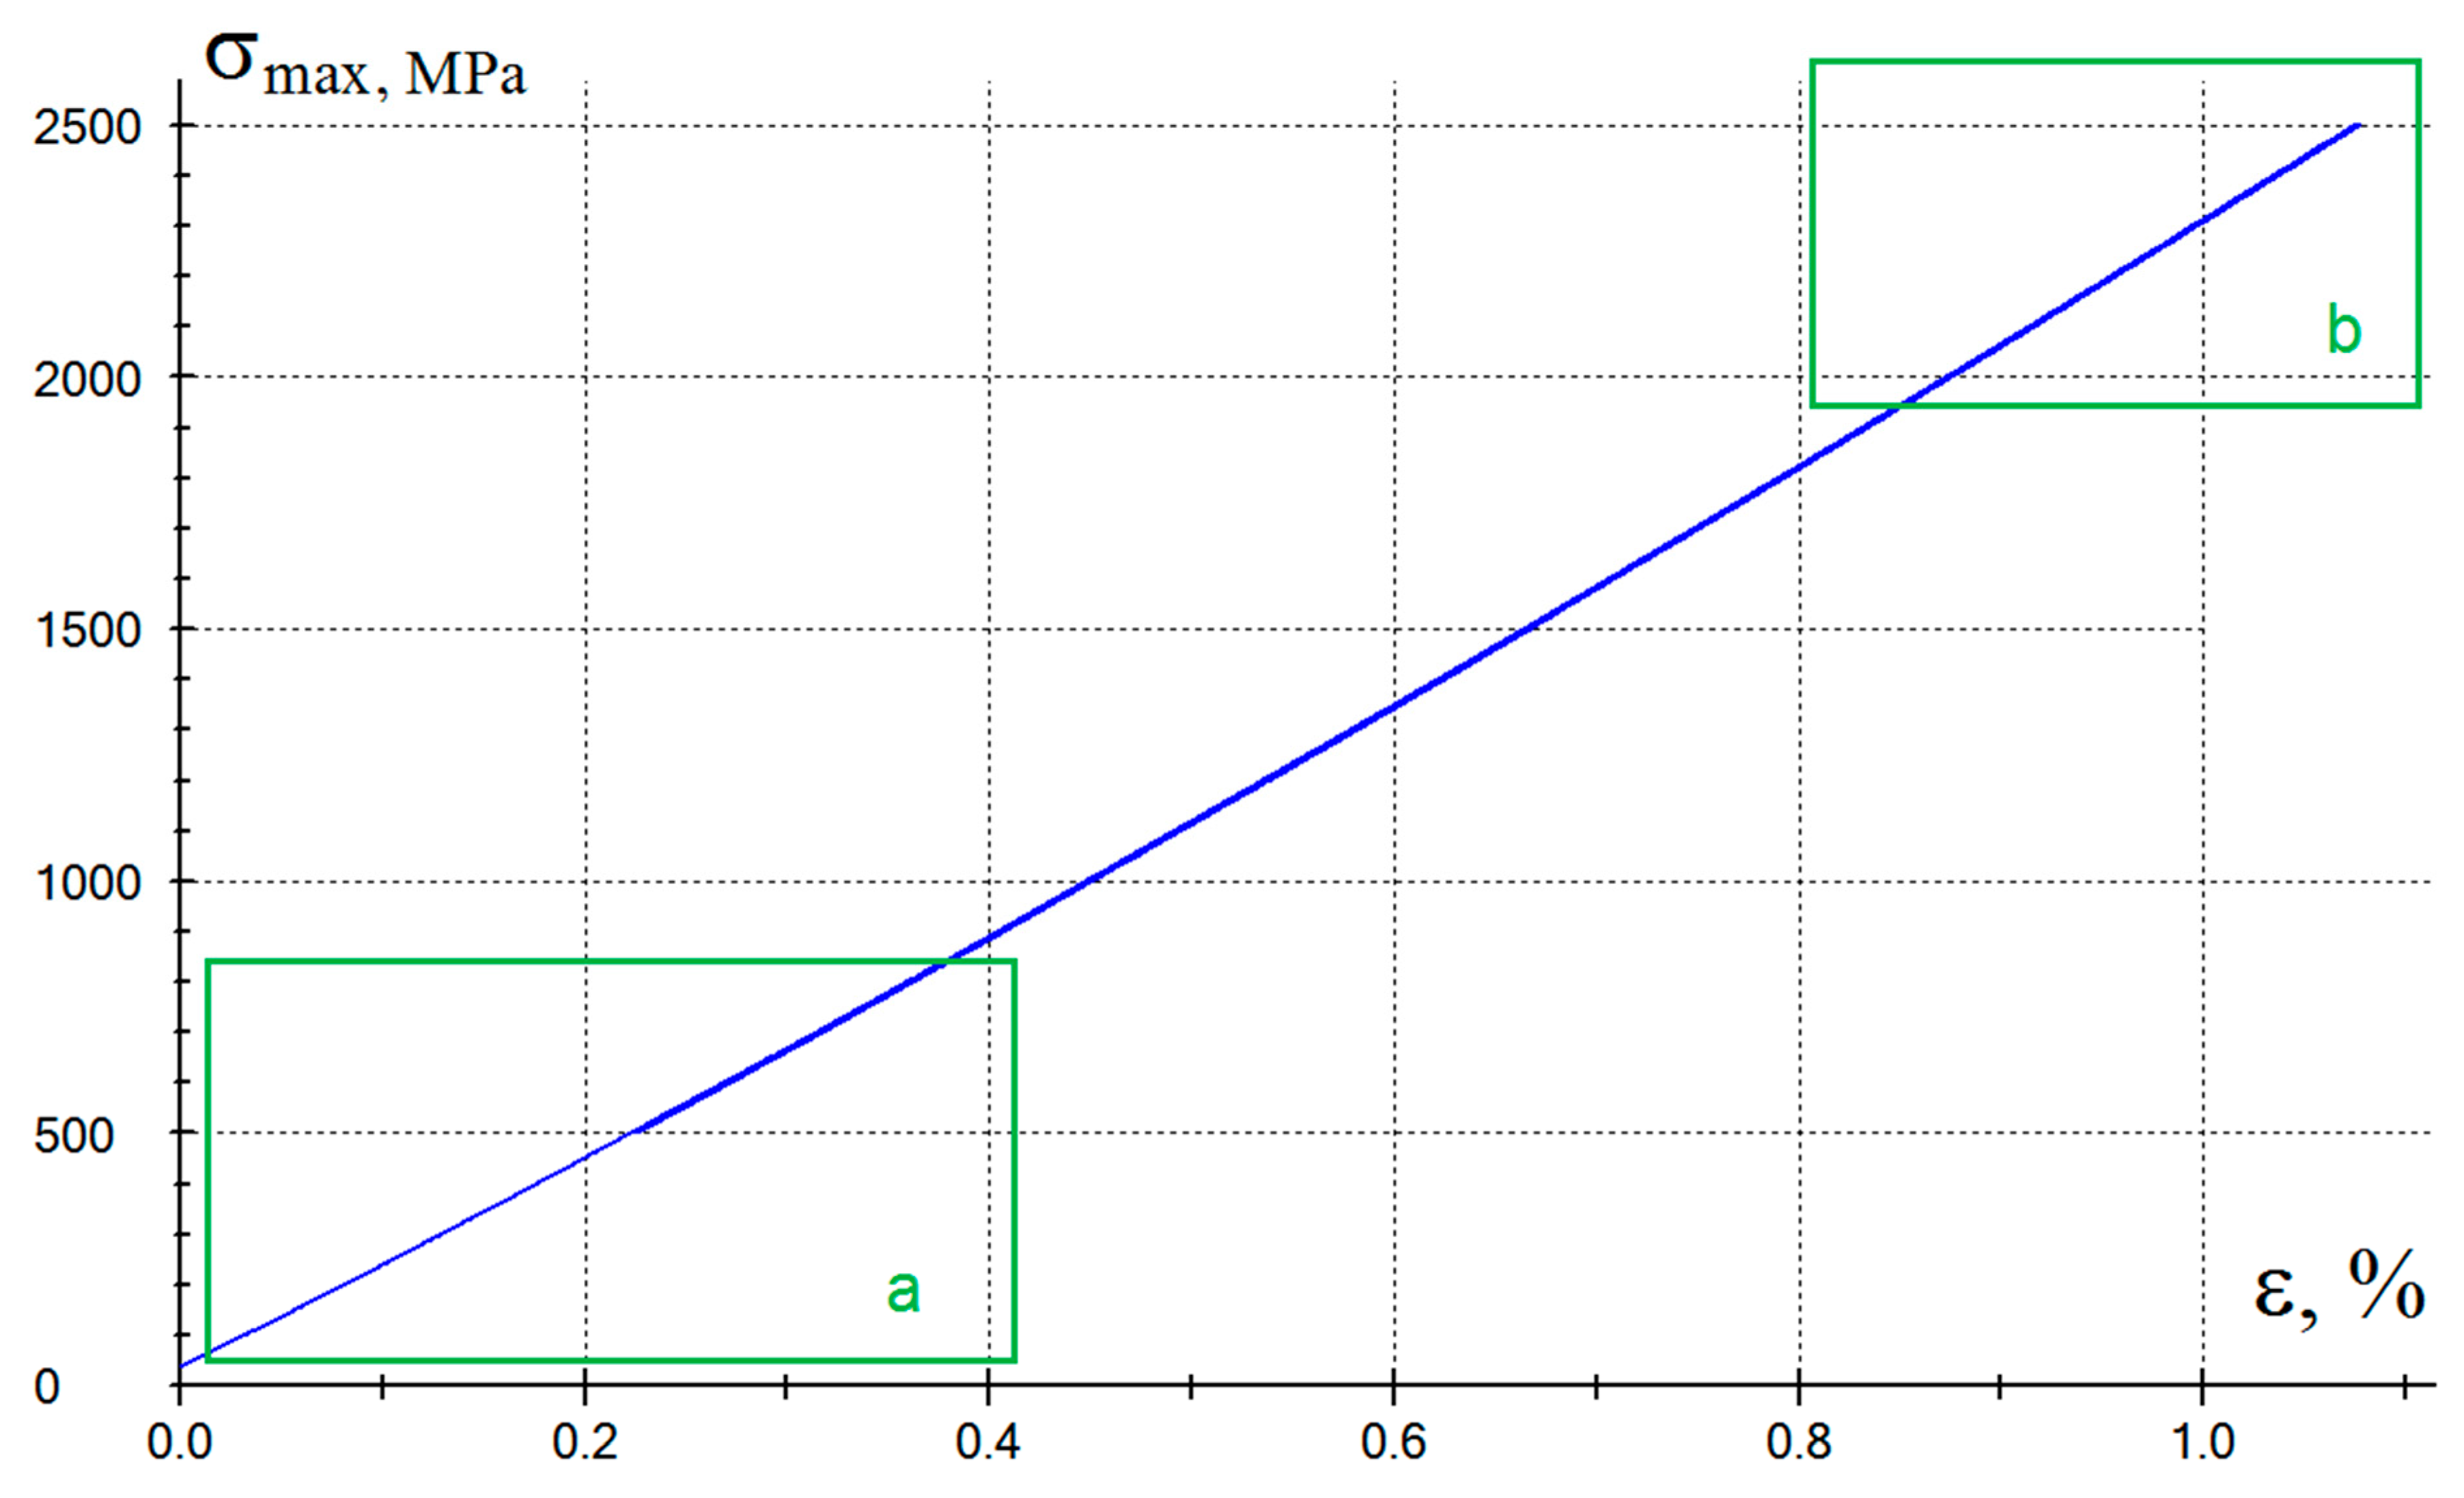
Figure 11.
Development of the fatigue process the composites containing 60 wt. % of high-strength Toray T700-12K fiber. Strain measurement was realized using the Zwick/Roell MultiXtens sensor, figures (a) and (b) relate to corresponding rectangles in Figure 10.
Figure 11.
Development of the fatigue process the composites containing 60 wt. % of high-strength Toray T700-12K fiber. Strain measurement was realized using the Zwick/Roell MultiXtens sensor, figures (a) and (b) relate to corresponding rectangles in Figure 10.
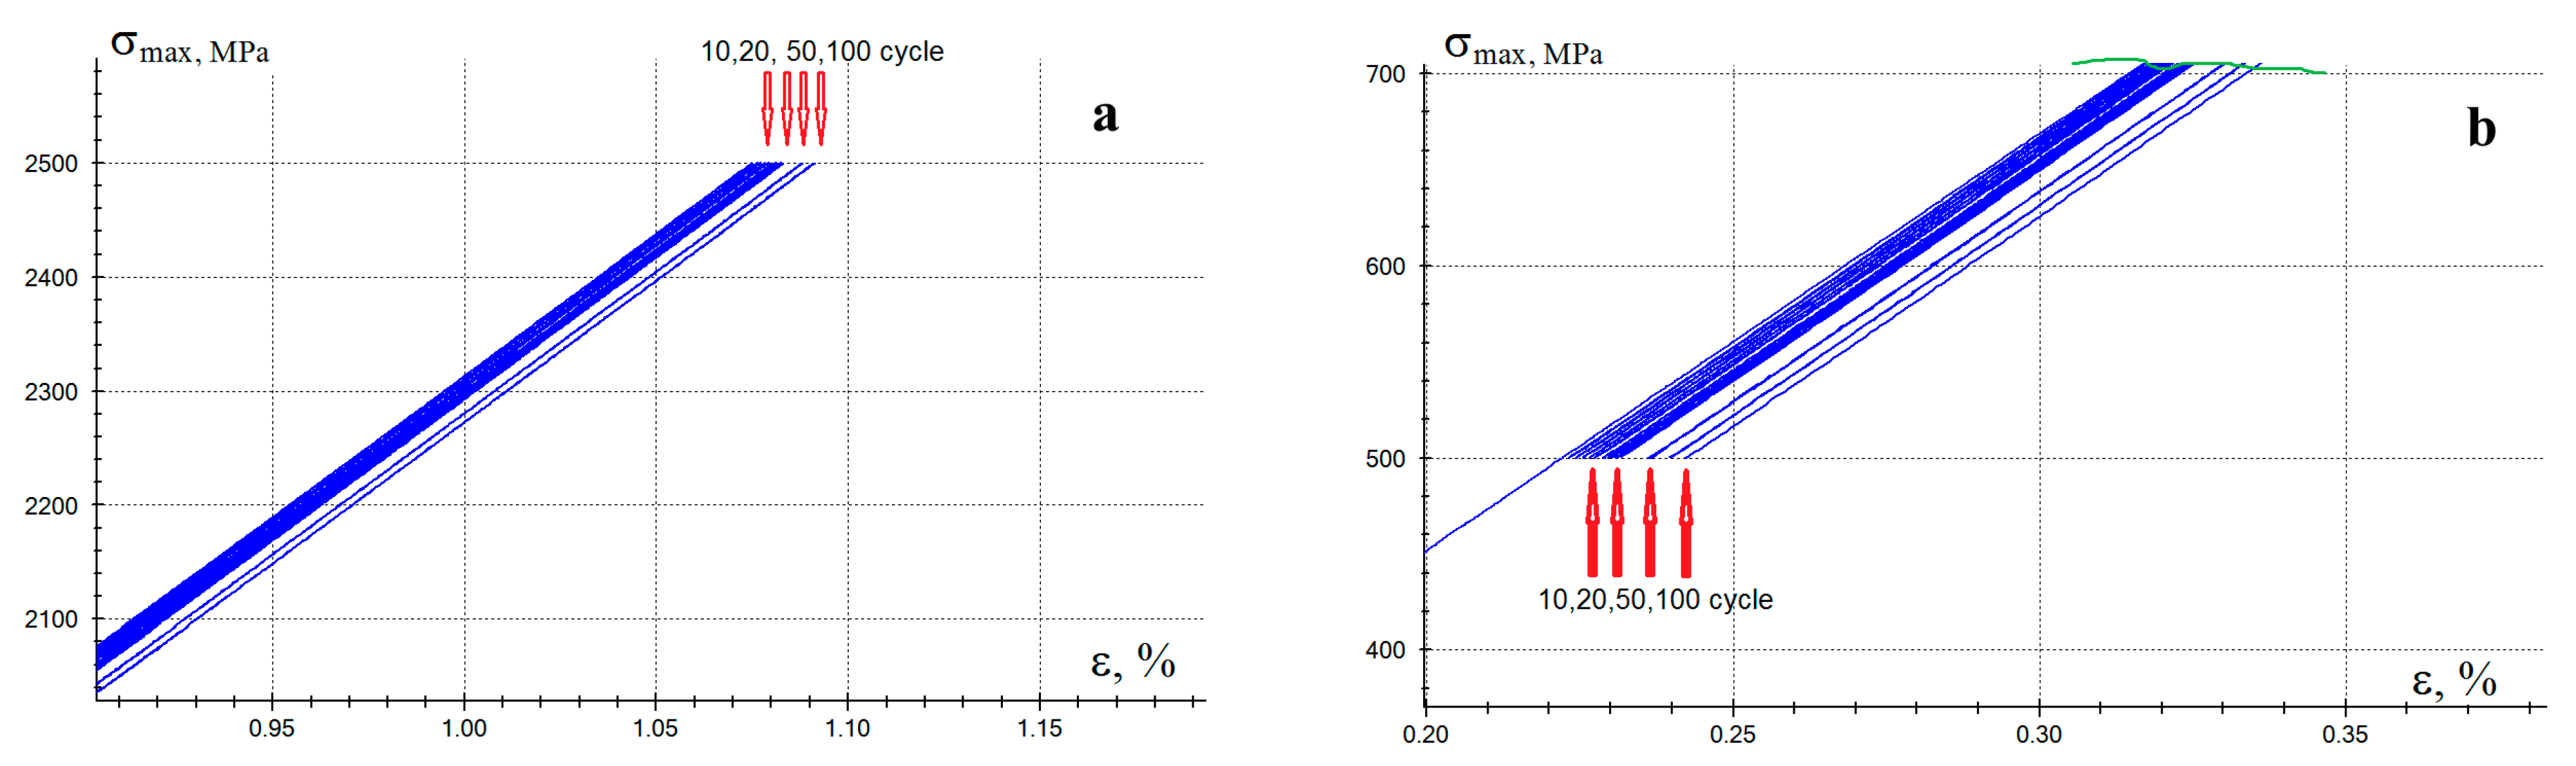
Figure 12.
Initial portion of the strain-stress diagram of pure polysulfone: (a) transverse strain, (b) longitudinal strain.
Figure 12.
Initial portion of the strain-stress diagram of pure polysulfone: (a) transverse strain, (b) longitudinal strain.
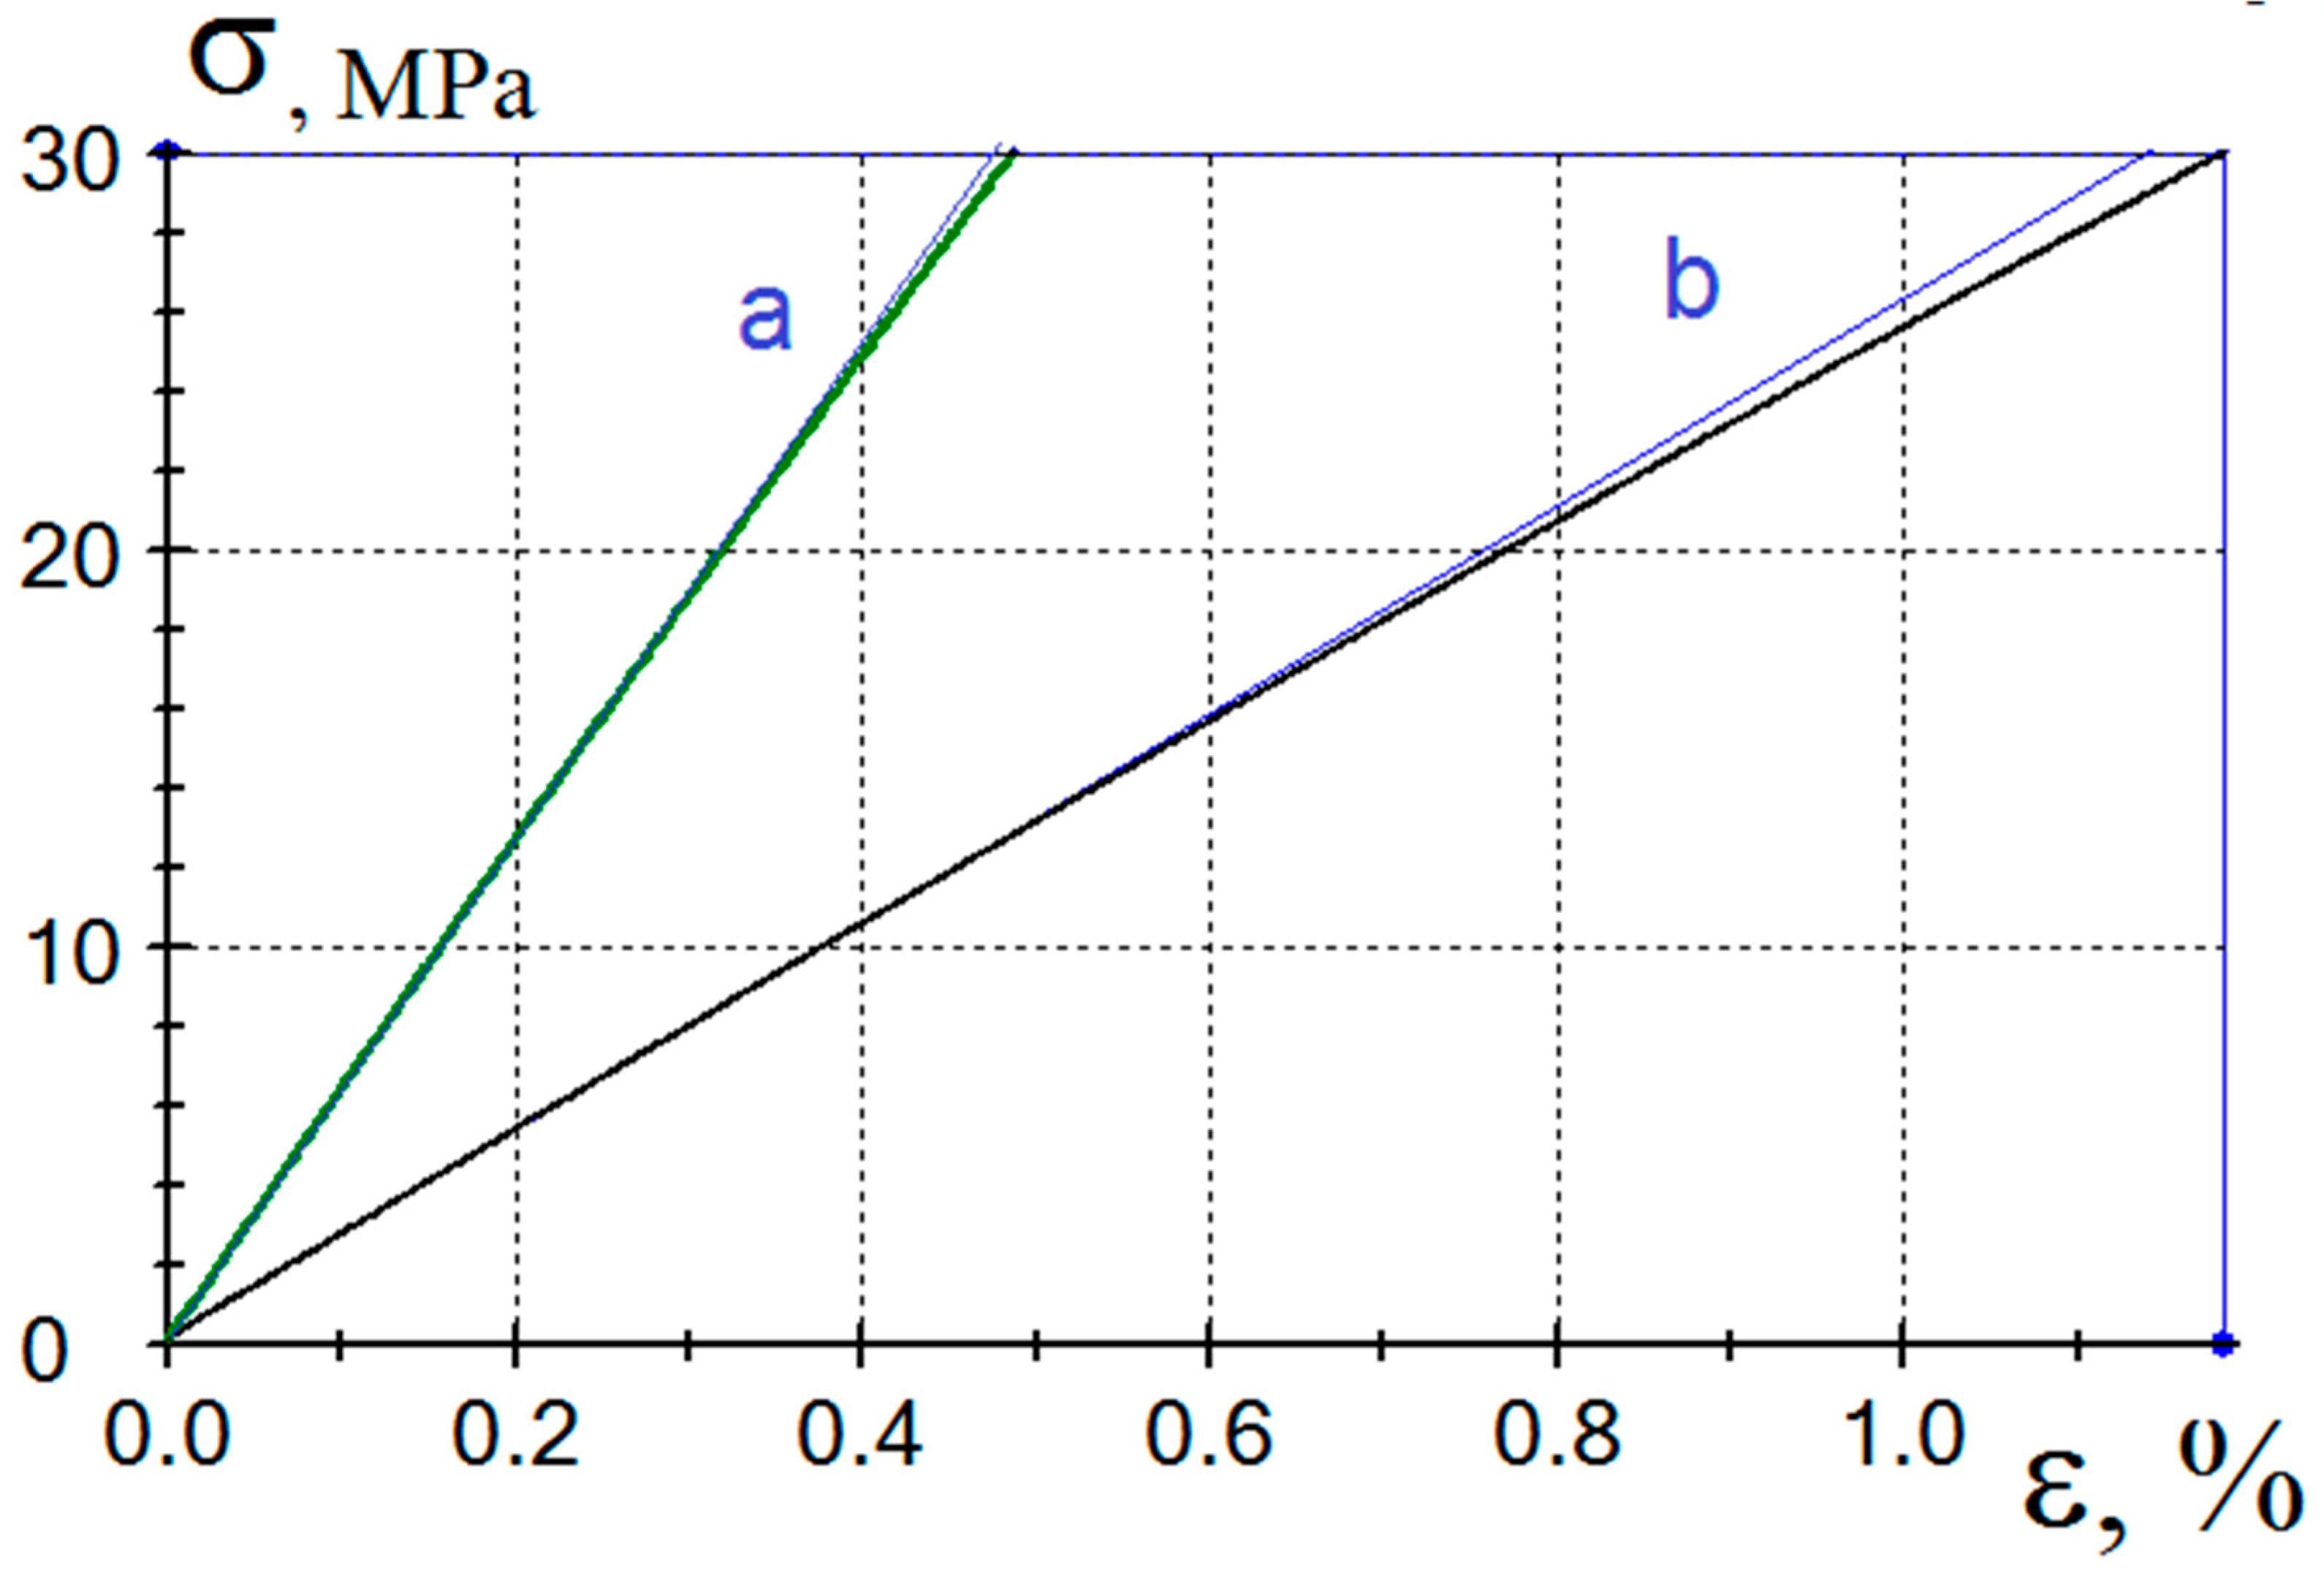

Table 1.
Characteristics of carbon fibers used in this study. (Manufacturer's technical data).
| Fiber grade | Number of filaments | Filament diameter, µm |
Density, g/cm3 | Linear density, tex | Strength, GPa | Elastic modulus, GPa |
Elongation at break, % |
|---|---|---|---|---|---|---|---|
| T700SC | 12000 | 7.0 | 1.80 | 800 | 4.9 | 230 | 2.1 |
| UMT400 | 12000 | 6.5– 6.9 | 1.80 | 800 | 4.2 | 400 | 1.1 |
Table 2.
Number of polysulfone based samples containing 60 wt. % of carbon fibers destroyed during fatigue tests depending on the maximum value of cycle stress.
Table 2.
Number of polysulfone based samples containing 60 wt. % of carbon fibers destroyed during fatigue tests depending on the maximum value of cycle stress.
| σmax, MPa | Samples reinforced with high-strength Toray T700-12K fibers | Samples reinforced high-modulus UMT400 fibers | ||
| Tested | Destroyed | Tested | Destroyed | |
| 2000 | 15 | 0 | 15 | 0 |
| 2500 | 15 | 0 | 15 | 6 |
| 3000 | 15 | 8 | 15 | 11 |
| 3500 | 15 | 11 | 15 | 15 |
Disclaimer/Publisher’s Note: The statements, opinions and data contained in all publications are solely those of the individual author(s) and contributor(s) and not of MDPI and/or the editor(s). MDPI and/or the editor(s) disclaim responsibility for any injury to people or property resulting from any ideas, methods, instructions or products referred to in the content. |
© 2024 by the authors. Licensee MDPI, Basel, Switzerland. This article is an open access article distributed under the terms and conditions of the Creative Commons Attribution (CC BY) license (http://creativecommons.org/licenses/by/4.0/).
Copyright: This open access article is published under a Creative Commons CC BY 4.0 license, which permit the free download, distribution, and reuse, provided that the author and preprint are cited in any reuse.


