1. Introduction
Cereal crops are an integral part of the human diet and livestock feed to fulfil dietary needs. Some of the important cereal crops belonging to the Graminaceae family includes wheat (Triticum spp.), rye (Secale cereale), barley (Hordeum vulgare L.), oat (Avena sativa L.), rice (Oryza sativa L.), millet (Pennisetum glaucum (L.) R.Br.), corn (Zea mays L.), sorghum (Sorghum Moench) and triticale (a hybrid of wheat and rye) (Panday et al., 2020). Rice, maize and wheat are the staple food crops and are widely consumed worldwide, thus food security is linked to the quality and production levels of these cereal crops (Guo et al., 2018; Abedi and Mojiri, 2020). The wheat grains are mostly transformed into flour and then processed to make multiple culinary products. It has a good calorific value and high content of proteins, lipids, mineral salts and vitamins. Almost 60% of the wheat produced worldwide is consumed as human food, and global wheat demand is expected to rise in the next decades as the human population is continuously increasing (Sobolewska et al., 2020; Vitale et al., 2020). The accumulation of Arsenic (As) in cereal food crops is a serious threat to human safety. Therefore, the organisations like European Food Safety Authority (EFSA), World Health Organisation (WHO) and U.S Food and Drug Administration (FDA) have established specific regulations to control the contamination of food crops by setting safety levels. According to WHO (2011) the weekly tolerable intake of inorganic Arsenic is 5 µg kg-1 body weight. Therefore, there is immediate need for developing a sustainable cultivation system for cereal crops including wheat.
The wheat varieties of current agro-economic interest are durum wheat (T. turgidum durum L.) mainly used in the pasta industry, and winter wheat (T. aestivum L.) used in bread and pastry-making. Under Mediterranean cropping systems, the commonly agronomical practices are based on the adoption of intensive soil tillage for the seedbed preparation and the application of high amounts of mineral fertilizers, mainly Nitrogen to support intensive cropping system yields. The excessive use of these agronomical practices commonly adopted by Mediterranean farmers results in accumulation of soil of Arsenic, which may represent a serious threat to food safety. Therefore, the presence of Arsenic in agroecosystems is challenging to produce wheat and require the adoption of adequate agronomical practices to mitigate its risks for human consumption. Indeed, Arsenic is naturally present in soil and underground water at variable concentrations, due to the presence of geothermal processes and rock - aquifer interactions. Some studies have highlighted that the assimilation of Arsenic is linked to phosphorus-based nutrition, therefore the application of fertilisers increases its availability in the soil and absorption by the plant (Khalid et al., 2017; Chandrakar et al., 2016). Studies show that both organic and inorganic As groups have been used as pesticides on cereal crops (Upadhyay et al., 2019). Moreover, the uptake of Arsenic by wheat plants may result in the presence of Arsenic in wheat grains and it is a serious risk for human health as it is highly carcinogenic and can also cause cardiovascular diseases, diabetes and anaemia (Saeed et al., 2021). Therefore, the production and consumption of contaminated foods obtained by wheat is a threat to food security and human health as around 85% of world population consumes wheat-derived foods for basic calories that makes this grain cereal an important and major source of energy. Recently, Suman et al. (2020) studies showed that the consumption of food crops with traces of As is the second potential source of human exposure to arsenic. Therefore, the identification of the most sustainable production practice to obtain high quality wheat with As content below the accepted threshold for human consumption represent an important challenge in Mediterranean environments (Jasrotia et al., 2018). Reduced tillage practices can effectively produce high quality crop without compromising the soil health and quality. Also, the use of organic fertilizer can be a breakthrough to overcome the daunting threat of As contamination in soil and wheat crop. As the toxicokinetics of Arsenic in plants from soil is dependent on soil organic matter content, soil pH, soil texture, and redox reactions. The continuous use of organic fertilizer can reduce As concentration and consequently uptake of As by plants (Ning et al., 2017). Therefore, the present study was designed with an objective to evaluate and identify the best suitable agronomic practice for alleviating the Arsenic uptake level in Mediterranean area for durum wheat. The adaptation of conservation tillage practices and organic fertilization method in place of traditional agronomic practices could be a way forward to overcome the present and future challenges related to heavy metal uptake by cereal crops.
2. Materials and Methods
2.1. Study Site and Soil Characteristics
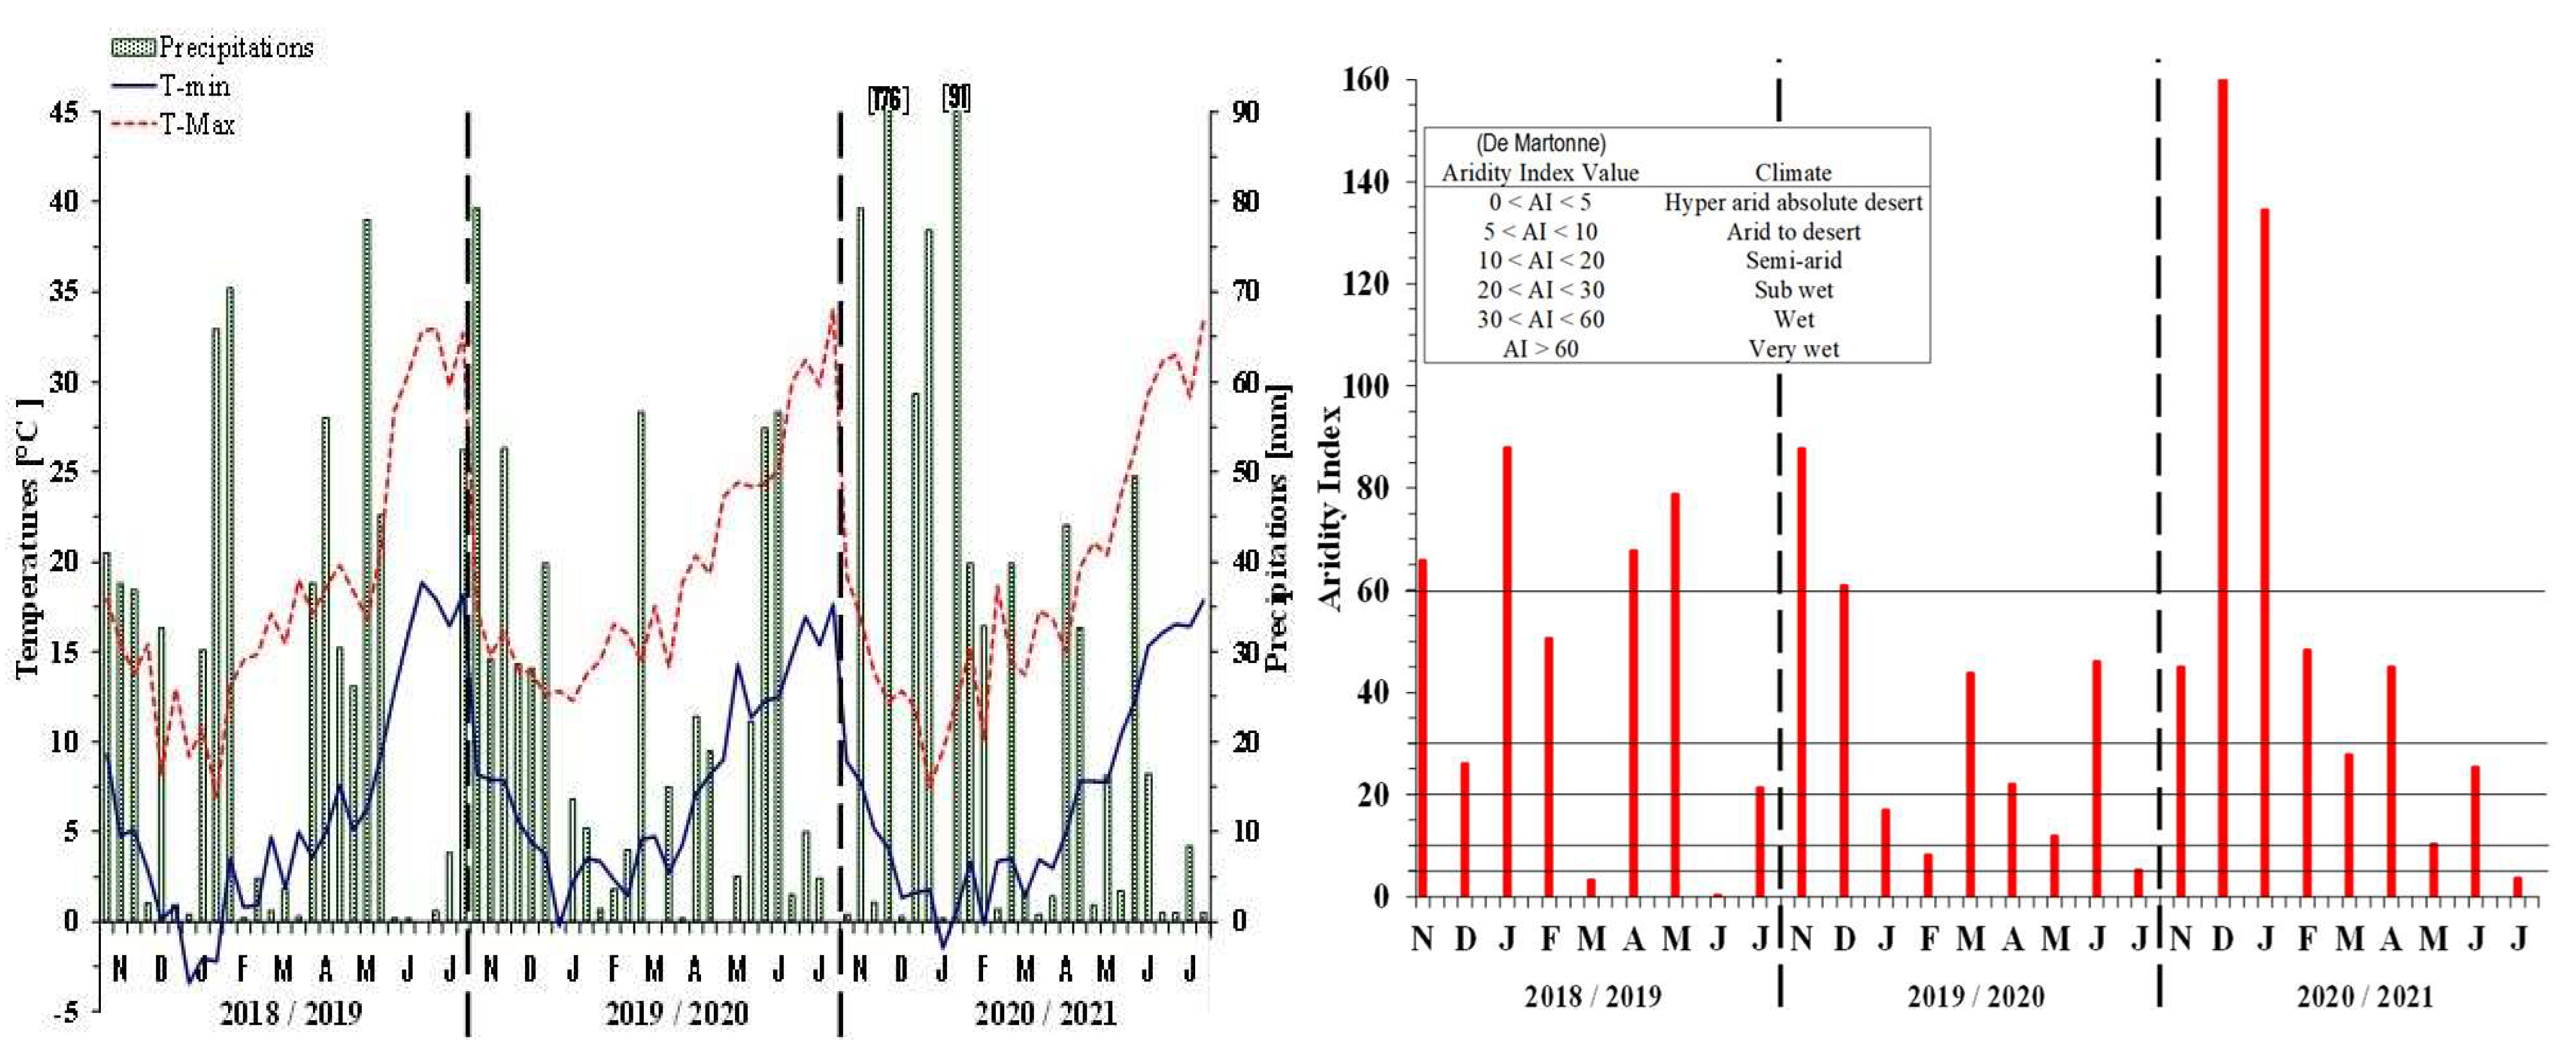
This study was carried out at the experimental farm “Nello Lupori” of University of Tuscia (45°25′N and 12°6′E, 310 m a.s.l), for three consecutive growing seasons (2018/2019, 2019/2020 and 2020/2021). The experiment is continuation of the field study started in 2013. The experimental area is representative of wheat cultivation in Mediterranean climate with average air temperature of 14.5 °C and average total annual rainfall of 752 mm. Meteorological conditions observed during the experimental periods are reported in
Figure 1. The soil of the experimental site is classified as
Typic Xerofluvent, and the surface horizon of 0-30 cm soil depth contained 760 g kg
-1 sand, 130 g kg
-1 silt, and 110 g kg
-1 clay (loamy sand), with a pH of 6.9. The soil had 0.97 % and 0.12 % of total organic C and N, respectively.
2.2. Experimental Site and Design
The experimental site was established in 2013 to compare soil tillage practices and fertilizer sources in a cropping system with a 2-year crop rotation durum wheat (Triticum durum Desf.) – potato (Solanum tuberosum L.). The adopted treatments were: (a) three tillage systems [conventional tillage based on ploughing (Plo), reduced tillage based on subsoiling (Sub), and reduced tillage based on spading(Spa)]; (b) two fertilizer sources [mineral fertilization (Min) as performed in conventional farming and organic fertilization (Org) by means of municipal organic waste]. The treatments were replicated three times according to a randomized complete block design. Both crops in rotation were simultaneously growth each year in experimental plots 60 m2 (6 x 10 m).
2.3. Field Setup and Crop Management
The durum wheat seedbed was prepared in September according to the soil tillage treatments. All tillage were done up to 30 cm of soil layer and then followed by a disk harrowing up to 10 cm of soil depth. In mineral fertilizer source were performed according to the local practices. The total amount of 80 kg of P2O5 ha-1 as a triple superphosphate were applied before the last disk harrowing for seedbed preparation. The total 100 kg of N ha-1 were divided in two rates: the first N application (50 kg of N ha-1 as a calcium nitrate) was carried out at the beginning of tillering stage in February; the second N application (50 kg of N ha-1 as urea) was applied at the beginning of stem elongation in March. In organic fertilizer, municipal organic waste was applied at the rate of 10,000 kg ha-1 in order to apply the same amount of nitrogen applied in the mineral fertilizer treatments. The characteristics of the MOW fertilizer were: moisture 50%, pH 7.3, organic carbon 25.7% of dry matter (d.m.), Organic nitrogen 2,4 % of d.m., C/N ratio 10.7 and salinity 3.8 dS m-1, respectively. The MOW fertilizer was applied before the last disk harrowing for the seedbed preparation. Durum wheat, cv. ‘Antalis’, was sown in the same day in all treatments on November by means of experimental planter (Wintersteiger, Ried inn Innkreis, Austria) at the seed density of 450 seeds m-2 with row distance of 12.5 cm and about 3 cm of depth. Weeds were managed by means of herbicide (Mesosulfuron-Metile 3% + Iodosulfuron. Metil-Sodium 3% + Mefenpir-Dietile 9%) applied at the end of wheat tillering in all treatments, as commonly applied by the farmers of the area. In all growing seasons, durum wheat was harvested at physiological maturity of kernels at the end of June.
2.4. Samples Preparation and Arsenic Analysis
The wheat and soil sample analysis were carried out in the Laboratory of Commodities and Territorial Analysis, of the University of Cassino and Southern Lazio. Arsenic determination in wheat separately was performed in kernels, stems, leaves and roots collected at crop harvesting. Soil analysis were carried out using 0.2 - 0.3 grams of samples mineralized through a wet digestion process, in presence of a mixture of 3 ml of nitric acid (HNO3 65% RS) and 0.5 ml of a solution of hydrogen peroxide (H2O2 40% m/V in purely stabilized water) supplied by Carlo Erba Reagents. After the acid digestion, ultrapure distilled water HIGH PURITY 18 MΩ cm-1 25 °C was used for the recovery of the samples, the mixture was brought to a final volume of 10 ml. The presence of arsenic was determined by Atomic Absorption Spectrophotometer AA-600 with hydride generation system FIAS-100 (Perkin Elmer, USA), with the instrument detection limit on the GFAA of 1 ppb. The calibration was made using appropriate dilutions of stock solution of As at 1.000±0.002 g l-1 in 2% HNO3 (CPAchem), and to ensure the reproducibility and the accuracy of the method, the same analyses were conducted on standard reference material, NIST 1570a (Trace element in spinach leaves, Sigma Aldrich) with a mean recovery of about 95±1%. In the graphite furnace 20 μl of sample was introduced and subsequently the sample was atomized according to a specific temperature program. The As concentration was expressed in milligrams per kilo of dry weight (mg kg-1 dw).
2.5. Bioaccumulation Factors (BAF)
The As Bioaccumulation Factors (BAF) for each sample were calculated to evaluate the ability of the plant to accumulate As. Accordingly, as indicated by Dessalew et al. (2018), BAF was calculated using the following formulas:
BAFrs = Croot/Csoil;
BAFss = Cstem/Csoil;
BAFls = Clea f/Csoil;
BAFgs = Cgrain/Csoil;
where Croot, Cstem, Cleaf, and Cgrain were the As concentrations in the roots, stems, leaves, and grains, respectively.
2.6. Statistical Analysis
Statistical analyses were performed using JMP statistical software package version 4.0 (Littel et al., 1996). The analysis of variance (ANOVA) was carried out using the ANOVA model with the treatments as fixed factor, the three blocks were included as a random factor and the growing season was considered as random effect to account for the repeated measure across time (Anderson et al., 2006). Fisher’s protected least significant differences (LSD) at the 0.05 probability level (P < 0.05) were used for comparing the main effects. Linear regressions were performed for selected variables.
3. Results
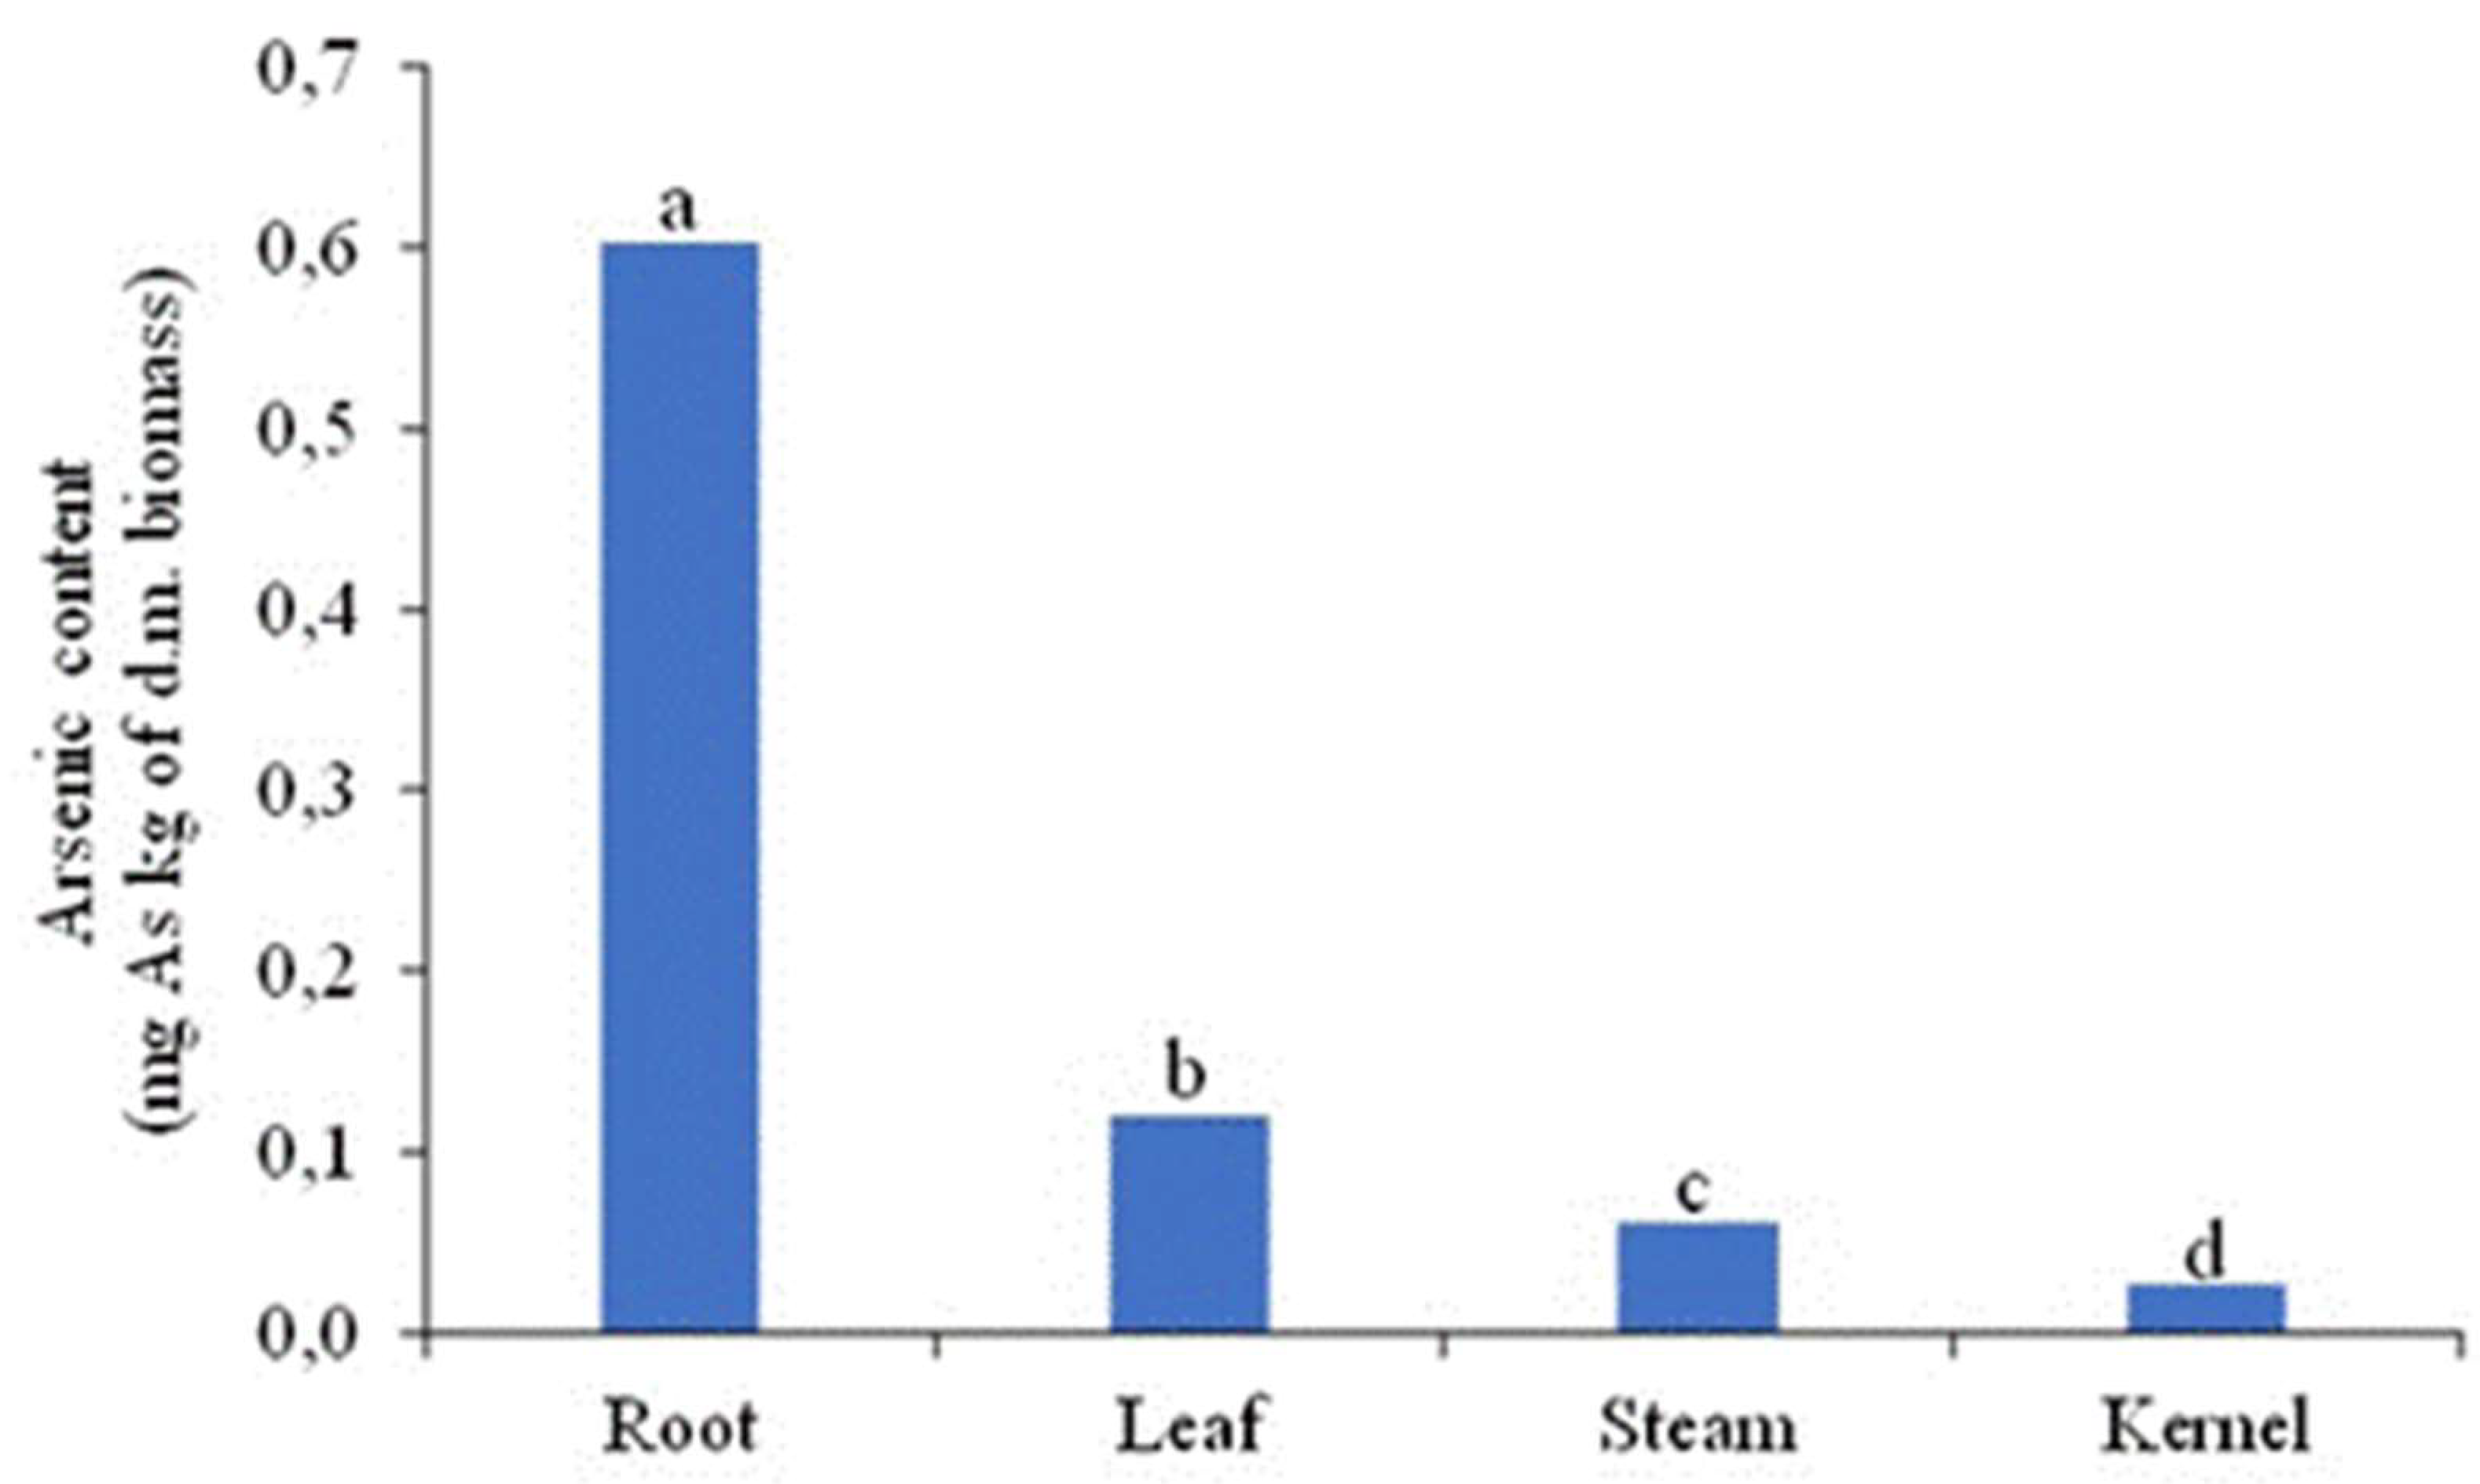
3.1. Arsenic Translocation in Different Parts of Wheat Plant
According to the
Figure 2 As content in plant section was significantly different from each. Roots had the maximum content of arsenic, whereas kernel had the minimum As content. The results shown in
Table 1 suggests that significant difference was observed between different growing season × tillage for As in soil. The maximum level of soil As content was observed in 2020/2021_Plo followed by 2020/2021_Spa and 2020/2021_Sub (0.552, 0.391 and 0.213 mg As kg
-1, respectively). Whereas minimum level of As was observed in 2018/2019_Plo (0.096 mg As kg
-1). There was significant difference observed between 2020/2021_Plo and all the other treatments. However, 2020/2021_Spa and 2020/2021×Sub had no significant difference between each other, but they were different and significant from other treatments. Results also show interaction between growing seasons and fertilization was also significantly different from each other. The maximum soil As level was observed in 2020/2021_Min followed by 2019/2020_Min (0.491 and 0.295 mg As kg
-1, respectively). These treatments were significantly different from each other and organic fertilization. The minimum level of soil As for fertilization was observed in 2018/2019_Org (0.113 mg As kg
-1) and it showed no significant difference from organic treatments of 2019/2020 and 2020/2021 growing seasons. Moreover, there was a significant interaction between soil tillage × fertilization source. Results showed maximum level of soil As in Spa_Min and minimum level in Spa_Org (0.491and 0.138 mg As kg
-1, respectively). However, there was no significant difference observed among other interactions (p>0.05).
The results showed that the concentration of As in kernel decreased in the order 2020/2021_Spa > 2018/2019_Sub (0.076 and 0.037 mg As kg
-1 d.m., respectively). Whereas the minimum value was observed in 2020/2021_Sub (0.008 mg As kg
-1 d.m.) and 2019/2020_Spa (0.008 mg As kg
-1 of d.m.) without any significant difference between them, but were different from other interactions. The results reported in
Table 2 show that the growing season × fertilization source interaction was significantly higher in 2020/2021_Min followed by 2018/2019×Min (0.061 and 0.030mg As kg
-1 d.m, respectively). The minimum concentration of As in kernel was observed in 2020/2021_Org (0.012 mg As kg
-1 d.m). According to the results, 2020/2021_Min showed significant difference from other treatments, whereas there was no significant difference observed among the remaining treatments. The interaction between soil tillage × fertilization source is also shown in the
Table 2. The maximum As concentration was shown by Spa_Min (0.63 mg As kg
-1 d.m) and it was also significantly different from other interactions. Whereas minimum As concentration in kernel was observed in Spa_Org (0.013 mg As kg
-1 d.m).
The concentration of As in wheat stems is shown in
Table 3. The interaction between 2019/2020_Spa (0.148 mg As kg
-1 d.m) had the maximum As content in plant stem followed by 2019/2020_Plo (0.099 mg As kg
-1 d.m) and 2019/2020_Sub (0.086 mg As kg
-1 d.m), respectively. The 2019/2020_Spa showed significant difference from other tillage practices within the same growing season. Minimum As concentration in stems was found in 2020/2021_Plo (0.051 mg As kg
-1 d.m). Furthermore, the growing season × fertilization source interaction had maximum value for 2019/2020_Org followed by 2019/2020_Min and 2020/2021_Org (0.139, 0.083, 0.049 mg As kg
-1 d.m, respectively). The 2018/2019_Min had the minimum concentration (0.051 mg As kg
-1 d.m) of As in wheat stem. The lettering suggests that 2019/2020_Org and 2019/2020_Min interactions were significantly different from others. The most significant interaction with highest value was observed in Spa_Org (0.139 mg As kg
-1 d.m). The interaction between Sub_Min had the minimum As concentration level in plant stem (0.047 mg As kg
-1 d.m).
The As content in leaf suggest that only plowing and spading for 2019/2020 growing season showed significant difference from other treatments but not between each other. However, maximum concentration of As in wheat leaf was shown by 2019/2020_Plo (0.295 mg As kg
-1 d.m.) and minimum by 2018/2019_Sub (0.040 mg As kg
-1 d.m.). The concentration of As in wheat leaf for growing season × fertilization showed no significant differences except for 2019/2020 (
Table 4). The highest value was observed in 2019/2020_Org followed by 2019/2020_Mineral (0.217 and 0.203 mg As kg
-1 d.m., respectively). The third interaction between tillage × fertilization showed maximum As content in Plo_Org followed by Spa_Min and Plo_Min (0.223, 0.189 and 0.138 mg As kg
-1 d.m., respectively). The Subsoiling and spading tillage interaction with both fertilizations had no significant differences (
Table 4).
The Arsenic content in wheat roots is shown in
Table 5. According to the results for growing season × soil tillage, the 2019/2020_Plo followed by 2019/2020_Spa and 2019/2020_Sub (1.855, 1.446 and 0.766 mg As kg
-1 d.m) showed significantly higher and different values than all the other interactions. Whereas rest of the interactions had no significant differences. The As content for growing season × fertilization showed significant results for 2019/2020_Min and 2019/2020×Org (1.522 and 1.190 mg As kg
-1 d.m., respectively). Soil tillage × fertilization interaction was significantly higher and different in Plo_Org and Spa_Min interactions. Moreover, the minimum As values of in wheat root was observed by Spa_Org (0.171 mg As kg
-1 d.m.), even if no significant difference from other treatments expect for the highest value interactions.
3.2. Accumulation of as in Wheat Plant and Soil
Grain yield/Grain As ratio shown in
Table 6 showed no significant differences among all treatments for growing season × soil tillage except for 2019/2020×Spa (56896) and 2020/2021_Sub (39034). The spading tillage in 2019/2020 had the highest value of As in grains and minimum value was shown by plowing tillage in 2020/2021. Also, As content ratio in grains for growing season × fertilization was calculated with less significant differences among treatments. However, 2019/2020_Min (39579) had the highest grain yield/grain As ratio as compared to other treatments and 2018/2019_Org (9471) had the minimum As ratio in grains. The results also showed no significant differences in As ratio for soil tillage × fertilization interactions except for Spa_Org (36865).
The
Table 7 shows that the aboveground biomass for growing season and fertilization was significant and different, whereas soil tillage had no significant difference among treatments. The maximum aboveground biomass was observed in 2019/2020 (906.6 g m
-2), Min (821.4 g m
-2) and Sub (791.1 g m
-2). The concentration of up taken As by grain was not significantly different for different growing seasons. Spading tillage (0.0095 g m
-2) showed significantly high and different value as compared to other plowing and subsoiling. Moreover, Min (821.4 g m
-2) had highest and significantly different amount of uptake As by grain as compared to Org (0.0047 g m
-2). The results for soil TOC for growing season and fertilization treatment were significant and different, respectively. However, for tillage treatments only spading had the significantly different value as compared to plowing and subsoiling. The maximum soil TOC was showed by 2019/2020 (1.185 %) followed by 2018/2019 and 2020/2021, respectively. The percentage of soil TOC was high in Org (0.988 %) as compared to Min. However, Sub (0.988 %) and Spa (1.008 %) had no significant difference between each other for soil TOC and plowing (0.906 %) showed the minimum percentage of soil TOC. Moreover, the results shown for soil TON were only significantly different for 2018/2019 (0.103 %).
The BAFrs for growing season × soil tillage interaction was significantly high in 2019/2020_Plo (12.996) according to
Table 8. Whereas growing season × fertilization interaction for BAFrs had no significant difference among all treatments. The significantly different results for soil tillage×fertilization interactions were observed in Plo_Org (9.867) and Sub_Min (6.611). BAFss had the significantly high value in 2019/2020_Sub (0.539) as compared to other interactions. The results for growing season × fertilizer suggests that 2018/2019 × organic (0.271) had the maximum and 2020/2021_Min (0.089) showed minimum amount of BAFss. The interaction between soil tillage × fertilization was significantly higher in Spa_Org (0.816) and lowest in Spa_Min (0.102). For BAFIs plowing tillage in 2019/2020 (2.188) and 2018/2019 (2.122) had higher values as compared to other interactions, but they showed no significance difference between each other. The interaction between growing season × fertilizer showed maximum value for BAFIs in 2019/2020_Org (1.618). Plo_Org (1.848) interaction also showed the maximum value for BAFIs and was significantly different from other interactions, except Plo_Min (1.185). BAFgs had the highest value in 2018/2019_Spa (0.191) as compared to other interactions and it also showed significant difference from other interactions. Whereas Min (0.320) and Org (0.241) fertilizer in growing season 2018/2019 had no difference between each other but showed significantly high and different results for BAFgs. The soil tillage and fertilization interaction had no significant effect on the BAFgs. However maximum value was observed in Sub_Min (0.260). The
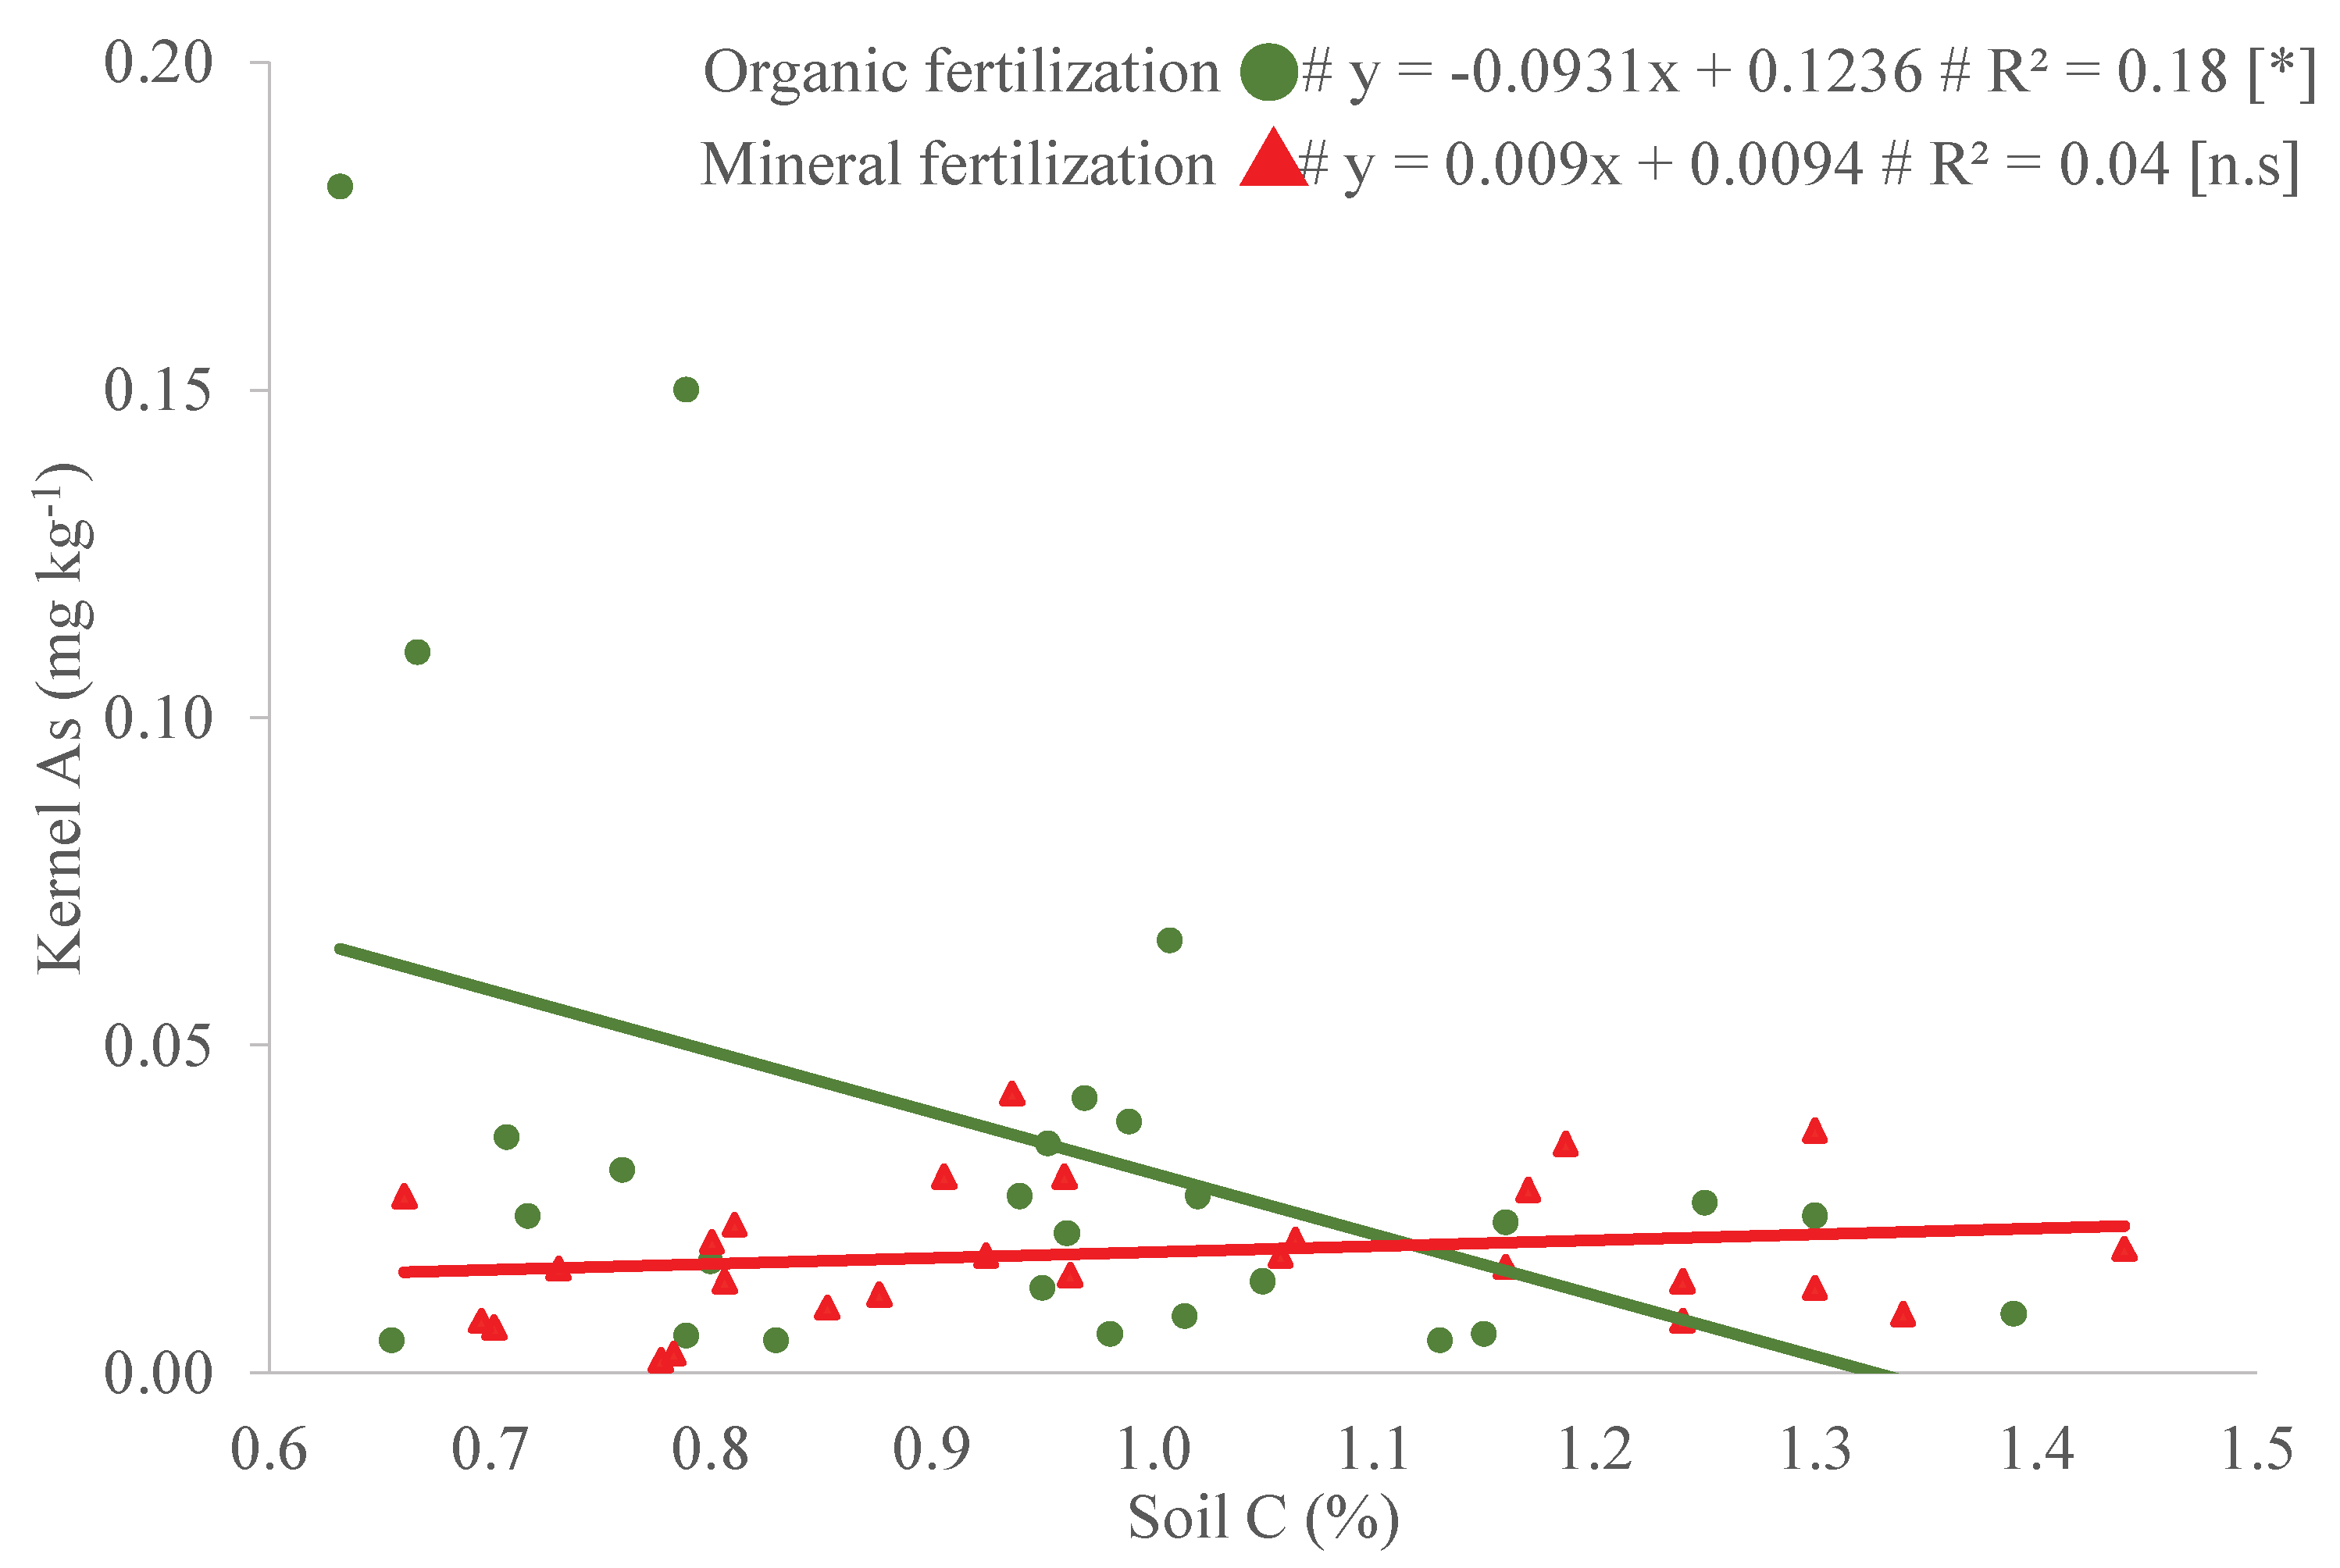
Figure 3 showing comparative results for soil Carbon % and As content in kernel as affected by fertilization shows that with an increase in soil C % the As content in kernels of wheat plant significantly decreased in organic fertilization. Whereas the As content in kernel didn’t show any significant change with the increase in soil Carbon %.
4. Discussion
The results of the present study showed as the differences in As bioaccumulation varied among the different wheat plant parts, in facts, it emerges that it is different and significant. The results indicated that the concentrations of As decreased in the order of root>leaf>stem>grain, indicating that the roots act as a barrier for metal translocation and protect the edible parts from As contamination confirming the findings of similar studies (Wang et al. 2016; Liu et al. 2009). The concentrations of As in grains and stems were significantly lower than those in other tissues (p<0.05), but no significant differences were found between As concentrations in grains and stems (p>0.05). Many studies investigated the regularity of migration and accumulation of heavy metals between soil and crops. Feng et al. (2021) has identified an inter- and intraspecific variation in Cd accumulation in cereal crops and concluded that Cd was more readily accumulated to higher levels than As and Pb in wheat. From results the average As content in soil ranges from 0.07 to 1.1 mg kg-1. The assimilation of Arsenic in wheat could be favoured by factors such as the cultivated species and the cultivation method. In reference to agronomic practices, soil compaction and irrigation were evaluated from previous studies. In compacted soil, the porosity and the air space between the particles is reduced, with an increase in the diffusion coefficient of the ions, and a greater root-soil contact which facilitates the absorption of nutrients. Many authors agree that the transfer of metals from soil to the grains involves several steps, including uptake by the roots, vacuolar sequestration in the roots, translocation from the roots to the shoots, and distribution to the grains (Feng et al., 2021). All these steps are based on various transport mechanisms and by metal chelating agents, by xylem and phloem flows (Sobolewska et al., 2020). The results suggest that plowing tillage and chemical fertilization in the 2020/2021 had the maximum As content in soil. Previous studies show that the high level of soil disturbance could have led to increased exposure of the already existing soil As in soil minerals or organic matter and also increasing its mobility and availability in soil (Wei et al., 2020). Tilling methods significantly alter physical and chemical soil properties and may result in a decrease of the quantity of organic matter, pH, alteration of the composition of the organism communities present in the soil, and a reduction of biodiversity of soil species, as observed by Kraut-Cohen et al. (2020). The intensive tillage increases the soil aeration, because of which oxidation of arsenic bearing minerals increases (Wang et al., 2023). The maximum level of As content in soil was found in the results by interaction of spading tillage×mineral fertilization. Begum et al., (2024) observed similar results in rice and stated that the application of chemical fertilizers can alter the soil chemistry. Studies show that the application of phosphate fertilizers also alter the soil pH, redox potential, enhanced mobility and solubility of As in soil, which makes it more bioavailable to plants and also increases its concentration in soil (Golui et al., 2023). The mineral fertilizers also contain arsenic as a contaminant, thus increasing the soil As content (Pahalvi et al., 2021). Similarly, the combination of spading and plowing soil tillage with mineral fertilization also showed high As content in soil. The high soil As content increased the uptake of arsenic by wheat plant and resulted in increased amount of As content in kernel for spading tillage and mineral fertilization in the year 2020/2021. The repeated application of same tillage and fertilization practice for 3 years aggravated the effect of soil tillage on arsenic availability (Suman et al., 2020). Whereas the minimum level of As was shown by subsoiling tillage and organic fertilization in year 2020/2021 and the interaction of spading×organic also had the same effect. Sun et al. (2017) studied that subsoiling tillage helps in improving soil health by reducing runoff, increasing aeration, enhancing porosity and decreasing bulk density. As a result, the water infiltration helps in the removal of arsenic content from root zone and healthy microbial activity helps in transforming arsenic into less bioavailable form for the plants uptake (Zhang et al., 2021). Moreover, the application of organic fertilizer also improves soil microbial activity and organic matter along with maintain a neutral pH (Liu et al., 2023). All these factors reduce the availability of Arsenic. The nutrient competition between phosphate present in organic fertilizer and arsenic in soil also reduces the plant uptake of Arsenic, hence decreasing the amount of As in wheat Kernel (Shu et al., 2023).
The accumulation of arsenic in wheat stems and leaf showed the opposite trend as compared to kernel. The maximum values were observed in the year 2019/2020 for spading tillage and organic fertilization. Moreover, their combination also had an increasing effect on As content in stems. Previous studies suggest that the availability of high organic matter in the soil can also improve the solubility of arsenic by making soluble organic arsenic complexes. This phenomenon can facilitate the uptake of nutrients by vascular system and then accumulate them in stems and leaves (Yang et al., 2020). Zhang et al., (2024) studied that the improved root system and increased biomass can also increase As translocation in stems through better transpiration and water uptake. Furthermore, the As in roots was significantly higher in year 2020 in plowing tillage and chemical fertilization. As roots are the key plant part responsible for uptake of nutrients from soil and presence of high levels of As in soil for plowing tillage and mineral fertilization resulted in more As content in roots (Bianucci et al., 2020).
The interaction between spading×organic had higher grain yield/grain As ratio, possibly because of better decomposition and availability of organic matter due to favourable environmental conditions. The results shown in
Table 7 also suggest that soil TOC and TON were also found to be relatively high in the 2019/2020, spading tillage and organic fertilization, because of this reason the ratio of grain yield/grain As was also high in respective year. Moreover, the results of the experiment also showed the effect of organic and chemical fertilization on the accumulation of As in soil. According to the results, the effect of organic fertilizer on As accumulation was significant as compared to mineral fertilization. The level of As decreased in soil with the application of organic fertilizer. The reduction in As content is due to increased organic matter that binds As and makes it less bioactive. Wang et al., (2018) and Gao et al., (2020) observed the similar results through the application of organic fertilizers and suggested that change of chemical properties of soil as a result of increased microbial activity and production of arsenic reducing bacteria along with changes in pH affect the availability of As in soil.
5. Conclusions
The results prove that the application of sustainable agronomic practices can effectively improve the quality of wheat grains by minimizing the As accumulation in kernels. The best suitable practices to alleviate As content level in grains are organic fertilization and subsoiling tillage. It is therefore necessary to remodulate agri-food systems according to agroecological approaches, through cultivation techniques that enhance and protect natural resources and biodiversity. Therefore, it can be concluded that the adaptation of sustainable agronomic practices is imperative to the production of wheat in Mediterranean environment to ensure food safety and high-quality wheat production for human consumption.
Author Contributions
Conceptualization MR and PP; methodology, IB, IC, MA; software, MR; validation, IC, IB, MA; investigation, IB, MA; resources, MR and PP; data curation, MA and IB; writing—original draft preparation, MA and IB; writing—review and editing, IC; IB, MA; visualization, MR, PP, IB, MA; supervision, M.R.; project administration, M.R.; funding acquisition, PP and RM; All authors have read and agreed to the published version of the manuscript.
Funding
No funding to declare.
Data Availability Statement
The data presented in this study are available on request from the first corresponding author.
Conflicts of Interest
The authors declare no conflicts of interest.
References
- Abedi:, T. , & Mojiri, A. Cadmium uptake by wheat (Triticum aestivum L.): An overview. Plants 2020, 9, 500. [Google Scholar]
- Begum, M.; Li, L.; Young, E.; Carey, M.; Li, G.; Zhu, Y.G.; Banwart, S.; Meharg, A.A.; Meharg, C. Fertilization enhances grain inorganic arsenic assimilation in rice. Exposure and Health 2024, 16, 417–430. [Google Scholar] [CrossRef]
- Bianucci, E.; Peralta, J.M.; Furlan, A.; Hernández, L.E.; Castro, S. Arsenic in wheat, maize, and other crops. In Arsenic in Drinking Water and Food (pp. 279-306).
- Chandrakar 2020, V. , Naithani, S. C., & Keshavkant, S. Arsenic-induced metabolic disturbances and their mitigation mechanisms in crop plants: A review. Biologia 2016, 71, 367–377. [Google Scholar]
- Dessalew, G. , Beyene, A. , Nebiyu, A., Astatkie, T.,. Effect of brewery spent diatomite sludge on trace metal availability in soil and uptake by wheat crop, and trace metal risk on human health through the consumption of wheat grain. Heliyon 2018, 4, e00783. [Google Scholar] [CrossRef] [PubMed]
- EFSA CONTAM Panel. "Scientific Opinion on Arsenic in Food." EFSA Journal 2014, 12, 3597.
- FDA (2016). "Arsenic in Rice and Rice Products." FDA Guidance for Industry.
- Feng, J.; Shen, R.F.; Shao, J.F. Transport of cadmium from soil to grain in cereal crops: A review. Pedosphere 2021, 31, 3–10. [Google Scholar]
- Gao, J.; Sun, K.; Jin, J.; Wang, Z.; Xu, Y. Effect of compost amendment on the transformation of arsenic and microbial community structure in contaminated soil. Journal of Hazardous Materials 2020, 388, 121796. [Google Scholar]
- Golui, D.; Raza, M.B.; Roy, A.; Mandal, J.; Sahu, A.K.; Ray, P.; Datta, S.P.; Rahman, M.M.; Bezbaruah, A. Arsenic in the soil-plant-human continuum in regions of Asia: Exposure and risk assessment. Current Pollution Reports 2023, 9, 760–783. [Google Scholar] [CrossRef]
- Guo, G.; Lei, M.; Wang, Y.; Song, B.; Yang, J. Accumulation of As, Cd, and Pb in sixteen wheat cultivars grown in contaminated soils and associated health risk assessment. International Journal of Environmental Research and Public Health 2018, 15, 2601. [Google Scholar] [CrossRef] [PubMed]
- Jasrotia, P.; Kashyap, P.L.; Bhardwaj, A.K.; Kumar, S.; Singh, G.P. Scope and applications of nanotechnology for wheat production: A review of recent advances. Wheat Barley Research 2018, 10, 1–14. [Google Scholar]
- Khalid, S.; Shahid, M.; Niazi, N.K.; Rafiq, M.; Bakhat, H.F.; Imran, M.; Abbas, T.; Bibi, I.; Dumat, C. Arsenic behaviour in soil-plant system: Biogeochemical reactions and chemical speciation influences. Enhancing Cleanup of Environmental Pollutants: Volume 2: Non-Biological Approaches 2017, 97-140.
- Kraut-Cohen, J.; Zolti, A.; Shaltiel-Harpaz, L.; Argaman, E.; Rabinovich, R.; Green, S.J.; Minz, D. Effects of tillage practices on soil microbiome and agricultural parameters. Science of the Total Environment 2020, 705, 135791. [Google Scholar] [CrossRef] [PubMed]
- Littell, R.C.; Milliken, G.A.; Stroup, W.W.; Wolfinger, R.D. SAS system for mixed models; 1996; ISBN 1555447791.
- Liu, W.X.; Liu, J.W.; Wu, M.Z.; Li, Y.; Zhao, Y.; Li, S.R. Accumulation and translocation of toxic heavy metals in winter wheat (Triticum aestivum L.) growing in agricultural soil of Zhengzhou, China. Bulletin of Environmental Contamination and Toxicology 2009, 82, 343–347. [Google Scholar] [CrossRef] [PubMed]
- Liu, W.; Yang, Z.; Ye, Q.; Peng, Z.; Zhu, S.; Chen, H.; Liu, D.; Li, Y.; Deng, L.; Shu, X.; Huang, H. Positive effects of organic amendments on soil microbes and their functionality in agro-ecosystems. Plants 2023, 12, 3790. [Google Scholar] [CrossRef]
- Ning, C.C.; Gao, P.D.; Wang, B.Q.; Lin, W.P.; Jiang, N.H.; Cai, K.Z. Impacts of chemical fertilizer reduction and organic amendments supplementation on soil nutrient, enzyme activity and heavy metal content. Journal of Integrative Agriculture 2017, 16, 1819–1831. [Google Scholar] [CrossRef]
- Pahalvi, H. N. Rafiya, L., Rashid, S., Nisar, B., & Kamili, A. N. (2021). Chemical fertilizers and their impact on soil health. In Microbiota and Biofertilizers, Vol. 2: Ecofriendly Tools for Reclamation of Degraded Soil Environs (pp. 1-20).
- Panday, U.S.; Pratihast, A.K.; Aryal, J.; Kayastha, R.B. A review on drone-based data solutions for cereal crops. Drones 2020, 4, 41. [Google Scholar] [CrossRef]
- Saeed, M.; Quraishi, U.M.; Malik, R.N. Arsenic uptake and toxicity in wheat (Triticum aestivum L.): A review of multi-omics approaches to identify tolerance mechanisms. Food Chemistry 2021, 355, 129607. [Google Scholar] [CrossRef]
- Shu, X.; Liu, W.; Huang, H.; Ye, Q.; Zhu, S.; Peng, Z.; Li, Y.; Deng, L.; Yang, Z.; Chen, H.; Liu, D. Meta-analysis of organic fertilization effects on soil bacterial diversity and community composition in agroecosystems. Plants 2023, 12, 3801. [Google Scholar] [CrossRef]
- Sobolewska, M.; Wenda-Piesik, A.; Jaroszewska, A.; Stankowski, S. Effect of habitat and foliar fertilization with K, Zn, and Mn on winter wheat grain and baking qualities. Agronomy 2020, 10, 276. [Google Scholar] [CrossRef]
- Suman, S.; Sharma, P.K.; Siddique, A.B.; Rahman, M.A.; Kumar, R.; Rahman, M.M.; Bose, N.; Singh, S.K.; Ghosh, A.K.; Matthews, H.; Mondal, D. Wheat is an emerging exposure route for arsenic in Bihar, India. Science of the Total Environment 2020, 703, 134774. [Google Scholar] [CrossRef]
- Sun, X.; Ding, Z.; Wang, X.; Hou, H.; Zhou, B.; Yue, Y.; Ma, W.; Ge, J.; Wang, Z.; Zhao, M. Subsoiling practices change root distribution and increase post-anthesis dry matter accumulation and yield in summer maize. PLOS ONE 2017, 12, e0174952. [Google Scholar] [CrossRef] [PubMed]
- Upadhyay, M.K.; Shukla, A.; Yadav, P.; Srivastava, S. A review of arsenic in crops, vegetables, animals and food products. Food Chemistry 2019, 276, 608–618. [Google Scholar] [CrossRef] [PubMed]
- Vitale, J.; Adam, B.; Vitale, P. Economics of wheat breeding strategies: Focusing on Oklahoma hard red winter wheat. Agronomy 2020, 10, 238. [Google Scholar] [CrossRef]
- Wang, A.; Wang, M.; Liao, Q.; He, X. Characterization of Cd translocation and accumulation in 19 maize cultivars grown on Cd-contaminated soil: Implication of maize cultivar selection for minimal risk to human health and for phytoremediation. Environmental Science and Pollution Research 2016, 23, 5410–5419. [Google Scholar] [CrossRef]
- Wang, S.; Wang, T.; Wang, X.; Sun, Q.; Pei, Z. Effects of biochar amendment on the bioavailability of arsenic in paddy soil. Environmental Science and Pollution Research 2018, 25, 11433–11440. [Google Scholar]
- Wang, Y.; Yang, S.; Sun, J.; Liu, Z.; He, X.; Qiao, J. Effects of tillage and sowing methods on soil physical properties and corn plant characters. Agriculture 2023, 13, 600. [Google Scholar] [CrossRef]
- Wei, L.; Pu, H.; Wang, Z.; Yuan, Z.; Yan, X.; Cao, L. Estimation of soil arsenic content with hyperspectral remote sensing. Sensors 2020, 20, 4056. [Google Scholar] [CrossRef] [PubMed]
- WHO (2011). "Safety Evaluation of Certain Contaminants in Food: Arsenic.
- Yang, Q.; Zheng, F.; Jia, X.; Liu, P.; Dong, S.; Zhang, J.; Zhao, B. The combined application of organic and inorganic fertilizers increases soil organic matter and improves soil microenvironment in wheat-maize field. Journal of Soils and Sediments 2020, 20, 2395–2404. [Google Scholar] [CrossRef]
- Zhang, H.; Gao, Z.; Xue, J.; Lin, W.; Sun, M. Subsoiling during summer fallow in rainfed winter-wheat fields enhances soil organic carbon sequestration on the Loess Plateau in China. PLOS ONE 2021, 16, e0245484. [Google Scholar] [CrossRef] [PubMed]
- Zhang, J.; Li, S.; Jiang, P.; Wang, R.; Guo, J.; Xiao, H.; Wu, J.; Shaaban, M.; Li, Y.; Huang, M. Organic fertilizer substituting 20% chemical N increases wheat productivity and soil fertility but reduces soil nitrate-N residue in drought-prone regions. Frontiers in Plant Science 2024, 15, 1379485. [Google Scholar] [CrossRef] [PubMed]
Figure 1.
Decadal minimum [—] and maximum [- - -] temperatures (°C), and rainfall [█] (mm) at the experimental site, and aridity index (red horizontal columns) throughout the periods of study in 2018 to 2021.
Figure 1.
Decadal minimum [—] and maximum [- - -] temperatures (°C), and rainfall [█] (mm) at the experimental site, and aridity index (red horizontal columns) throughout the periods of study in 2018 to 2021.
Figure 2.
Arsenic content in each part of plant. Values with different letters are statistically different according to LSD (0.05).
Figure 2.
Arsenic content in each part of plant. Values with different letters are statistically different according to LSD (0.05).
Figure 3.
Soil carbon content plotted against Arsenic content in the kernel as affected by fertilization.
Figure 3.
Soil carbon content plotted against Arsenic content in the kernel as affected by fertilization.
Table 1.
- Arsenic content in the soil, interactions growing season × Soil tillage, growing season × Fertilization source, soil tillage × fertilization source. Values with different letters in each group are statistically different according to LSD (0.05).
Table 1.
- Arsenic content in the soil, interactions growing season × Soil tillage, growing season × Fertilization source, soil tillage × fertilization source. Values with different letters in each group are statistically different according to LSD (0.05).
| |
|
Soil As(mg As kg-1 of soil) |
|
| Year |
Soil tillage |
|
|
| 2018/2019 |
Plowing |
0.096 |
d |
| 2018/2019 |
Subsoiling |
0.106 |
d |
| 2018/2019 |
Spading |
0.202 |
c |
| 2019/2020 |
Plowing |
0.166 |
c-d |
| 2019/2020 |
Subsoiling |
0.207 |
c |
| 2019/2020 |
Spading |
0.350 |
b |
| 2020/2021 |
Plowing |
0.552 |
a |
| 2020/2021 |
Subsoiling |
0.213 |
c |
| 2020/2021 |
Spading |
0.391 |
b |
| |
|
|
|
| Year |
Fertilization |
|
|
| 2018/2019 |
Mineral |
0.157 |
c-d |
| 2018/2019 |
Organic |
0.113 |
d |
| 2019/2020 |
Mineral |
0.295 |
b |
| 2019/2020 |
Organic |
0.187 |
c |
| 2020/2021 |
Mineral |
0.595 |
a |
| 2020/2021 |
Organic |
0.176 |
c-d |
| |
|
|
|
| Soil tillage |
Fertilization |
|
|
| Plowing |
Mineral |
0.395 |
b |
| Plowing |
Organic |
0.147 |
c |
| Subsoiling |
Mineral |
0.160 |
c |
| Subsoiling |
Organic |
0.191 |
c |
| Spading |
Mineral |
0.491 |
a |
| Spading |
Organic |
0.138 |
c |
Table 2.
- Arsenic content in the kernel of wheat plant, interactions growing season × soil tillage, growing season × Fertilization source, soil tillage × fertilization source. Values with different letters in each group are statistically different according to LSD (0.05).
Table 2.
- Arsenic content in the kernel of wheat plant, interactions growing season × soil tillage, growing season × Fertilization source, soil tillage × fertilization source. Values with different letters in each group are statistically different according to LSD (0.05).
| |
|
Kernel As(mg As kg-1 d.m.) |
|
| Year |
Soil tillage |
|
|
| 2018/2019 |
Plowing |
0.014 |
d-e |
| 2018/2019 |
Subsoiling |
0.037 |
b |
| 2018/2019 |
Spading |
0.030 |
b-c |
| 2019/2020 |
Plowing |
0.023 |
c-d |
| 2019/2020 |
Subsoiling |
0.020 |
c-e |
| 2019/2020 |
Spading |
0.008 |
e |
| 2020/2021 |
Plowing |
0.026 |
b-d |
| 2020/2021 |
Subsoiling |
0.008 |
e |
| 2020/2021 |
Spading |
0.076 |
a |
| |
|
|
|
| Year |
Fertilization |
|
|
| 2018/2019 |
Mineral |
0.030 |
b |
| 2018/2019 |
Organic |
0.024 |
b-c |
| 2019/2020 |
Mineral |
0.015 |
c-d |
| 2019/2020 |
Organic |
0.019 |
b-d |
| 2020/2021 |
Mineral |
0.061 |
a |
| 2020/2021 |
Organic |
0.012 |
d |
| |
|
|
|
| Soil tillage |
Fertilization |
|
|
| Plowing |
Mineral |
0.020 |
b |
| Plowing |
Organic |
0.023 |
b |
| Subsoiling |
Mineral |
0.024 |
b |
| Subsoiling |
Organic |
0.020 |
b |
| Spading |
Mineral |
0.063 |
a |
| Spading |
Organic |
0.013 |
b |
Table 3.
- Arsenic content in the stem of wheat plant, interactions growing season × soil tillage, growing season × Fertilization source, soil tillage × fertilization source. Values with different letters in each group are statistically different according to LSD (0.05).
Table 3.
- Arsenic content in the stem of wheat plant, interactions growing season × soil tillage, growing season × Fertilization source, soil tillage × fertilization source. Values with different letters in each group are statistically different according to LSD (0.05).
| |
|
Stem As(mg As kg-1 d.m.) |
|
| Year |
Soil tillage |
|
|
| 2018/2019 |
Plowing |
0.023 |
d |
| 2018/2019 |
Subsoiling |
0.031 |
d |
| 2018/2019 |
Spading |
0.022 |
d |
| 2019/2020 |
Plowing |
0.099 |
b |
| 2019/2020 |
Subsoiling |
0.086 |
b |
| 2019/2020 |
Spading |
0.148 |
a |
| 2020/2021 |
Plowing |
0.051 |
c |
| 2020/2021 |
Subsoiling |
0.035 |
c-d |
| 2020/2021 |
Spading |
0.052 |
c |
| |
|
|
|
| Year |
Fertilization |
|
|
| 2018/2019 |
Mineral |
0.021 |
e |
| 2018/2019 |
Organic |
0.029 |
d-e |
| 2019/2020 |
Mineral |
0.083 |
b |
| 2019/2020 |
Organic |
0.139 |
a |
| 2020/2021 |
Mineral |
0.043 |
c-d |
| 2020/2021 |
Organic |
0.049 |
c |
| |
|
|
|
| Year |
Fertilization |
|
|
| Plowing |
Mineral |
0.048 |
c |
| Plowing |
Organic |
0.068 |
b |
| Subsoiling |
Mineral |
0.047 |
c |
| Subsoiling |
Organic |
0.055 |
bc |
| Spading |
Mineral |
0.053 |
b-c |
| Spading |
Organic |
0.095 |
a |
Table 4.
- Arsenic content in the leaf of wheat plant, interactions growing season × soil tillage, growing season × Fertilization source, soil tillage × fertilization source. Values with different letters in each group are statistically different according to LSD (0.05).
Table 4.
- Arsenic content in the leaf of wheat plant, interactions growing season × soil tillage, growing season × Fertilization source, soil tillage × fertilization source. Values with different letters in each group are statistically different according to LSD (0.05).
| |
|
Leaf As(mg As kg-1 d.m.) |
|
| Year |
Soil tillage |
|
|
| 2018/2019 |
Plowing |
0.123 |
b |
| 2018/2019 |
Subsoiling |
0.040 |
b |
| 2018/2019 |
Spading |
0.044 |
b |
| 2019/2020 |
Plowing |
0.295 |
a |
| 2019/2020 |
Subsoiling |
0.064 |
b |
| 2019/2020 |
Spading |
0.270 |
a |
| 2020/2021 |
Plowing |
0.123 |
b |
| 2020/2021 |
Subsoiling |
0.064 |
b |
| 2020/2021 |
Spading |
0.061 |
b |
| |
|
|
|
| Year |
Fertilization |
|
|
| 2018/2019 |
Mineral |
0.075 |
b |
| 2018/2019 |
Organic |
0.063 |
b |
| 2019/2020 |
Mineral |
0.203 |
a |
| 2019/2020 |
Organic |
0.217 |
a |
| 2020/2021 |
Mineral |
0.109 |
b |
| 2020/2021 |
Organic |
0.056 |
b |
| |
|
|
|
| Soil tillage |
Fertilization |
|
|
| Plowing |
Mineral |
0.138 |
b |
| Plowing |
Organic |
0.223 |
a |
| Subsoiling |
Mineral |
0.060 |
c |
| Subsoiling |
Organic |
0.052 |
c |
| Spading |
Mineral |
0.189 |
a |
| Spading |
Organic |
0.061 |
c |
Table 5.
- Arsenic content in the root of wheat plant, interactions growing season × soil tillage, growing season × Fertilization source, soil tillage × fertilization source. Values with different letters in each group are statistically different according to LSD (0.05).
Table 5.
- Arsenic content in the root of wheat plant, interactions growing season × soil tillage, growing season × Fertilization source, soil tillage × fertilization source. Values with different letters in each group are statistically different according to LSD (0.05).
| |
|
Root As(mg As kg-1 d.m.) |
|
| Year |
Soil tillage |
|
|
| 2018/2019 |
Plowing |
0.452 |
d |
| 2018/2019 |
Subsoiling |
0.354 |
d |
| 2018/2019 |
Spading |
0.216 |
d-e |
| 2019/2020 |
Plowing |
1.855 |
a |
| 2019/2020 |
Subsoiling |
0.766 |
c |
| 2019/2020 |
Spading |
1.446 |
b |
| 2020/2021 |
Plowing |
0.217 |
d-e |
| 2020/2021 |
Subsoiling |
0.063 |
e |
| 2020/2021 |
Spading |
0.058 |
e |
| |
|
|
|
| Year |
Fertilization |
|
|
| 2018/2019 |
Mineral |
0.337 |
c |
| 2018/2019 |
Organic |
0.344 |
c |
| 2019/2020 |
Mineral |
1.522 |
a |
| 2019/2020 |
Organic |
1.190 |
b |
| 2020/2021 |
Mineral |
0.061 |
d |
| 2020/2021 |
Organic |
0.164 |
c-d |
| |
|
|
|
| Soil tillage |
Fertilization |
|
|
| Plowing |
Mineral |
0.412 |
c-d |
| Plowing |
Organic |
1.271 |
a |
| Subsoiling |
Mineral |
0.532 |
c-d |
| Subsoiling |
Organic |
0.257 |
d-e |
| Spading |
Mineral |
0.975 |
b |
| Spading |
Organic |
0.171 |
e |
| |
|
|
|
Table 6.
- Arsenic content in the Grain yield / grain As of wheat plant, interactions growing season × soil tillage, growing season × Fertilization source, soil tillage × fertilization source. Values with different letters in each group are statistically different according to LSD (0.05).
Table 6.
- Arsenic content in the Grain yield / grain As of wheat plant, interactions growing season × soil tillage, growing season × Fertilization source, soil tillage × fertilization source. Values with different letters in each group are statistically different according to LSD (0.05).
| |
|
Grain yield / Grain As ratio |
|
| Year |
Soil tillage |
|
|
| 2018/2019 |
Plowing |
18809 |
d |
| 2018/2019 |
Subsoiling |
9685 |
d |
| 2018/2019 |
Spading |
9238 |
d |
| 2019/2020 |
Plowing |
19323 |
c-d |
| 2019/2020 |
Subsoiling |
20299 |
c-d |
| 2019/2020 |
Spading |
56896 |
a |
| 2020/2021 |
Plowing |
8520 |
d |
| 2020/2021 |
Subsoiling |
39034 |
b |
| 2020/2021 |
Spading |
31105 |
b-c |
| |
|
|
|
| Year |
Fertilization |
|
|
| 2018/2019 |
Mineral |
15684 |
c-d |
| 2018/2019 |
Organic |
9471 |
d |
| 2019/2020 |
Mineral |
39579 |
a |
| 2019/2020 |
Organic |
24766 |
b-c |
| 2020/2021 |
Mineral |
22616 |
b-c |
| 2020/2021 |
Organic |
29824 |
a-b |
| |
|
|
|
| Soil tillage |
Fertilization |
|
|
| Plowing |
Mineral |
21564 |
b-c |
| Plowing |
Organic |
9538 |
d |
| Subsoiling |
Mineral |
28353 |
b |
| Subsoiling |
Organic |
17659 |
c-d |
| Spading |
Mineral |
27962 |
b |
| Spading |
Organic |
36865 |
a |
Table 7.
- Aboveground biomass of wheat crop, uptake Ar by the wheat grain, soil total organic carbon, soil total organic nitrogen, as affected by the growing season, soil tillage and fertilization source. Values with different letters in each group and in each parameter are statistically different according to LSD (0.05).
| |
Aboveground biomass (g m-2) |
|
Up taken As by grain (mg m-2) |
|
Soil TOC (%) |
|
Soil TON (%) |
|
| Year |
|
|
|
|
|
|
|
|
| 2018/2019 |
596.3 |
c |
0.0073 |
a-b |
0.963 |
b |
0.103 |
b |
| 2019/2020 |
906.6 |
a |
0.0066 |
b |
1.185 |
a |
0.139 |
a |
| 2020/2021 |
727.1 |
b |
0.0083 |
a |
0.754 |
c |
0.149 |
a |
| |
|
|
|
|
|
|
|
|
| Soil tillage |
|
|
|
|
|
|
|
|
| Plowing |
680.8 |
b |
0.0055 |
b |
0.906 |
b |
0.121 |
a |
| Subsoiling |
791.1 |
a |
0.0071 |
b |
0.988 |
a |
0.129 |
a |
| Spading |
758.0 |
a-b |
0.0095 |
a |
1.008 |
a |
0.142 |
a |
| |
|
|
|
|
|
|
|
|
| Fertilization |
|
|
|
|
|
|
|
|
| Mineral |
821.4 |
a |
0.0100 |
a |
0.947 |
b |
0.133° |
a |
| Organic |
665.3 |
b |
0.0047 |
b |
0.988 |
a |
0.128 |
a |
Table 8.
- Arsenic Bioaccumulation Factors (BAF), interactions growing season × soil tillage, growing season × Fertilization source, soil tillage × fertilization source. Values with different letters in each group and in each parameter are statistically different according to LSD (0.05).
Table 8.
- Arsenic Bioaccumulation Factors (BAF), interactions growing season × soil tillage, growing season × Fertilization source, soil tillage × fertilization source. Values with different letters in each group and in each parameter are statistically different according to LSD (0.05).
| |
|
BAFrs |
|
BAFss |
|
BAFls |
|
BAFgs |
|
| Year |
Soil tillage |
|
|
|
|
|
|
|
|
| 2019 |
Plowing |
6.724 |
b |
0.340 |
c |
2.122 |
a |
0.225 |
b |
| 2019 |
Subsoiling |
5.640 |
cd |
0.317 |
e |
0.524 |
b |
0.425 |
bc |
| 2019 |
Spading |
1.806 |
bc |
0.144 |
cd |
0.312 |
b |
0.191 |
a |
| 2020 |
Plowing |
12.996 |
a |
0.658 |
b |
2.188 |
a |
0.156 |
bd |
| 2020 |
Subsoiling |
6.650 |
bd |
0.539 |
a |
0.459 |
b |
0.152 |
d |
| 2020 |
Spading |
3.099 |
b |
0.999 |
b |
0.720 |
b |
0.051 |
bd |
| 2021 |
Plowing |
0.906 |
d |
0.164 |
de |
0.240 |
b |
0.067 |
cd |
| 2021 |
Subsoiling |
0.373 |
d |
0.181 |
ce |
0.322 |
b |
0.048 |
bd |
| 2021 |
Spading |
0.223 |
d |
0.235 |
ce |
0.237 |
b |
0.131 |
d |
| |
|
|
|
|
|
|
|
|
|
| Year |
Fertilization |
|
|
|
|
|
|
|
|
| 2019 |
Mineral |
5.524 |
ab |
0.262 |
b |
1.267 |
ab |
0.320 |
a |
| 2019 |
Organic |
3.922 |
bc |
0.271 |
a |
0.706 |
bc |
0.241 |
a |
| 2020 |
Mineral |
6.736 |
ab |
0.445 |
c |
0.626 |
bc |
0.113 |
b |
| 2020 |
Organic |
8.427 |
ab |
1.019 |
c |
1.618 |
a |
0.127 |
b |
| 2021 |
Mineral |
0.121 |
d |
0.089 |
d |
0.193 |
c |
0.098 |
b |
| 2021 |
Organic |
0.880 |
cd |
0.297 |
c |
0.339 |
c |
0.066 |
b |
| |
|
|
|
|
|
|
|
|
|
| Soil tillage |
Fertilization |
|
|
|
|
|
|
|
|
| Plowing |
Mineral |
3.882 |
c |
0.277 |
c |
1.185 |
ab |
0.124 |
b |
| Plowing |
Organic |
9.867 |
a |
0.498 |
b |
1.848 |
a |
0.174 |
ab |
| Subsoiling |
Mineral |
6.611 |
b |
0.417 |
bc |
0.537 |
bc |
0.260 |
a |
| Subsoiling |
Organic |
1.831 |
c |
0.274 |
c |
0.333 |
c |
0.157 |
ab |
| Spading |
Mineral |
1.888 |
c |
0.102 |
d |
0.363 |
c |
0.147 |
ab |
| Spading |
Organic |
1.531 |
c |
0.816 |
a |
0.482 |
c |
0.102 |
b |
|
Disclaimer/Publisher’s Note: The statements, opinions and data contained in all publications are solely those of the individual author(s) and contributor(s) and not of MDPI and/or the editor(s). MDPI and/or the editor(s) disclaim responsibility for any injury to people or property resulting from any ideas, methods, instructions or products referred to in the content. |
© 2024 by the authors. Licensee MDPI, Basel, Switzerland. This article is an open access article distributed under the terms and conditions of the Creative Commons Attribution (CC BY) license (http://creativecommons.org/licenses/by/4.0/).